Article

The Dynamic Compressive Properties and Energy Dissipation Law of Sandstone Subjected to Freeze–Thaw Damage

School of Resources and Civil Engineering, Northeastern University, Shenyang 110819, China
*
Authors to whom correspondence should be addressed.
Water 2022, 14(22), 3632; https://doi.org/10.3390/w14223632
Submission received: 5 October 2022 / Revised: 3 November 2022 / Accepted: 9 November 2022 / Published: 11 November 2022
(This article belongs to the Special Issue Research on Rock Mechanics under Freeze-Thaw Action)

Abstract

:
To investigate the dynamic compressive properties and the law of energy dissipation of freeze–thaw-damaged sandstone, static and dynamic compressive experiments were conducted. The influences of the number of freeze–thaw cycles and strain rate on strength characteristics, energy dissipation rate and the fractal dimension characteristics of sandstone were evaluated. Based on the peak energy dissipation rate, a freeze–thaw damage variable was established. The results show that peak strength increases exponentially with strain rate, and there exists a strain rate threshold. When strain rate is below this threshold, the increasing rate of the DIF slows down with the increase in the number of freeze–thaw cycles; when strain rate is higher than this threshold, the increasing rate of the DIF increases with the increase in the number of freeze–thaw cycles. In addition, the fractal dimension increases with the number of freeze–thaw cycles as well as the strain rate. Based on the freeze–thaw damage variable established, the damage degree of sandstone under freeze–thaw cycling can be characterized.

1. Introduction

Cold areas account for 75% of the total area of China [1]. The volume of freezing pore water within the rock in cold areas is enlarged by 9% [2]. This leads to frost heaving-induced pressure (FHIP) generating inside the rock, squeezing the pore walls and gradually disappearing when the frozen water thaws. The FHIP generated in the repeated cycles of freezing and thawing triggers irreversible fatigue damage to rock [3]. In such circumstances, instability failure is likely to occur to rock under the blasting disturbance of impact loading. Hence, sufficiently exploring the dynamic mechanical properties and laws of energy dissipation for freeze–thawed rock is of significance to the design and construction of rock engineering projects in cold areas.
In the study of freeze–thaw damage, Jia et al. [4] investigated the effects of freezing rate, fracture water content and fracture depth on freezing–heaving pressure and local freezing–heaving deformation using tuff specimen containing a single fracture; Huang et al. [5] characterized the pore structure of freeze–thawed sandstone by the fractal dimension, and established the relationship between the variations in fractal dimension and strength loss; Lan et al. [6] established the porosity variation in water-saturated freeze–thawed red sandstone as a function of uniaxial compressive strength; Huang et al. [7] used a multiple linear regression method to develop a prediction model for the uniaxial compressive strength loss of freeze–thawed sandstone by considering the effect of water content saturation. Generally, as the number of freeze–thaw cycles increases, the peak strength and elastic modulus of rock under static compression decrease, while peak strain increases [8,9,10]. However, results concerning the failure strength, deformation characteristics and static compressive experiments of rock under dynamic impact loading are quite controversial [11]. Some scholars investigated mechanical properties of rock under high strain rate. Wang et al. [12] investigated the dynamic mechanical properties of coal samples under water–gas-temperature coupling, and concluded that both peak strength and breaking strain increased linearly with the increase in strain rate. Zhou et al. [13] analyzed the dynamic stress–strain curve of freeze–thawed rock, finding the compaction stage of the dynamic stress–strain curve unobvious compared to that of the static stress–strain curve. Zhao et al. [14] explored the influences of lithology, number of freeze–thaw cycles, temperature difference, strain rate and porosity on the dynamic compressive strength of freeze–thawed sandstone. The results showed that there are correlations among different parameters, among which the number of freeze–thaw cycles, strain rate and temperature difference exerted the largest influences on dynamic compressive strengths. The water environment where a rock is located is also an important factor affecting the mechanical properties of rock subjected to freeze–thaw cycling [15,16]. Weng et al. [17] studied the dynamic compressive strength of three types of freeze–thawed granite (Type 1 granite was sealed in water using preservative films, Type 2 granite was semi-immersed in water and Type 3 granite was fully immersed in water). The results indicate that the peak strength loss of granite that was semi-immersed in water is serious.
Previous research shows that the deformation process of rock is ascribed to result from the evolution of energy dissipation inside the rock [18,19,20,21,22]. This energy analysis method provides an important insight for elucidating the damage evolution of the deformation process of rock to further reveal failure mechanisms [23,24]. It is generally believed that the larger the dissipated energy or the larger the dissipated energy density, the smaller the size of the fractured rock and the more serious the damage to the rock [25,26]. Liu et al. [27] quantitatively characterized the dynamic fragmentation of freeze–thawed red sandstone by fractal dimension, and established the relationship between fractal dimension and the number of freeze–thaw cycles and impact strength. Wang et al. [28] found that water pressure can increase the energy utilization rate of coal rock subjected to coupled water static–dynamic loads. Feng et al. [29] proposed the concept of energy dissipation rate and quantitatively analyzed the energy dissipation of coal rocks in the deformation process at any arbitrary time. As freeze–thaw cycling is able to change the physical properties of rock including porosity, P-wave velocity, mass and microscopic structure, it causes the deterioration of the mechanical properties of the rock [30,31,32,33,34]. At present, there is little research on the laws of energy dissipation for freeze–thawed rock under impact loading. Therefore, this research conducted dynamic compressive experiments on rock subjected to different numbers of freeze–thaw cycles at different strain rates. The aim of this research is to reveal the influences of the number of freeze–thaw cycles and different strain rates on the dynamic mechanical properties of saturated sandstone from the perspective of energy dissipation and the fractal dimension. Furthermore, based on peak energy dissipation rate, the damage degree of freeze–thaw cycling to rock was analyzed to understand the dynamic mechanical properties of freeze–thawed sandstone.

2. Material Preparation and Testing Method

2.1. Sandstone Specimens

Gray sandstone with an even texture and unobvious defects was used for specimen preparation in the experiment. The mineral composition of the rock included quartz (51.3%), feldspar (38.7%), kaolinite (7.6%) and chlorite (2.4%). Table 1 shows the basic physical and mechanical parameters of the sandstone specimens in the experiment. Specimens were prepared according to the standard of the International Society for Rock Mechanics and Rock Engineering (ISRM). The parallelization of end faces was controlled within the range of ±0.05 mm, while surface smoothness was set within ±0.02 mm. As shown in Figure 1, the height to diameter (h/d) ratio of the specimens under static loading was 2:1 (the height was 100 mm). The diameter of the Hopkinson rod (SHPB) used in the experiment was 100 mm, so specimens with a diameter of 100 mm and a height of 50 mm were adopted for cross-comparison.

2.2. Testing Schemes of Freeze–Thaw Cycling

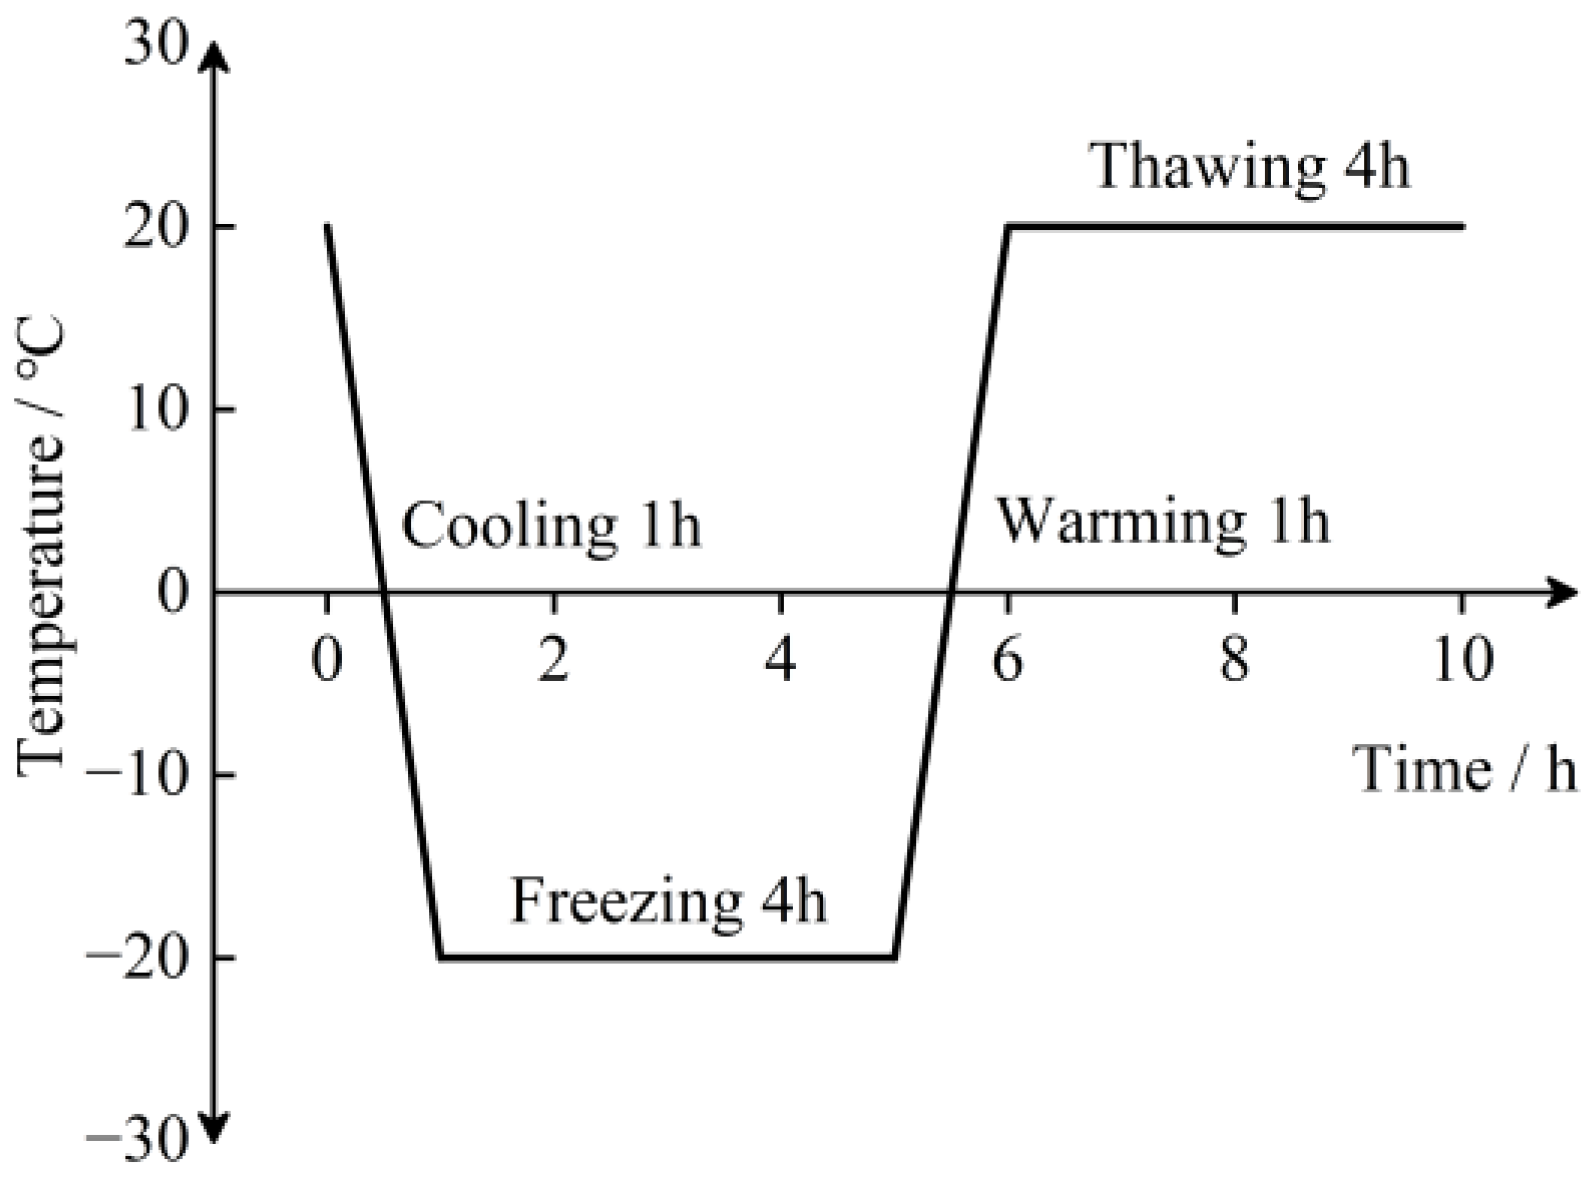
The water-saturated specimens were put into an HDD automatic cryogenic freeze–thaw tester manufactured by the Tianjin Gangyuan Test Instrument Factory for freeze–thaw cycling tests. The parameters of freeze–thaw cycling were selected referring to the Standard for Test Methods of Engineering Rock Mass (GB/T50266-2013) [35]. In addition, the numbers of freeze–thaw cycles were set to 0, 25 or 50; according to paper [36], the temperature ranges for freeze–thaw cycles of −20~20 °C and −10~10 °C have less influence on the mechanical properties of sandstone. Based on the above two factors, the freeze–thaw temperatures were set as shown in Figure 2. The freeze–thaw cycling involved cooling down from 20 °C within one hour to −20 °C, then keeping the temperature constant for 4 h, heating to 20 °C within one hour, and then keeping the temperature constant for 4 h.

2.3. Static Loading and Impact Loading Testing Schemes

The sandstone specimens that underwent freeze–thaw cycling were used in static and dynamic uniaxial compressive experiments, respectively. The static uniaxial compressive experiment was carried out on a YAG–3000KN microcomputer-controlled electro-hydraulic servo pressure testing machine. The displacement loading mode was adopted at a loading rate of 0.001 mm/s and a corresponding static strain rate of 10−5 s−1.
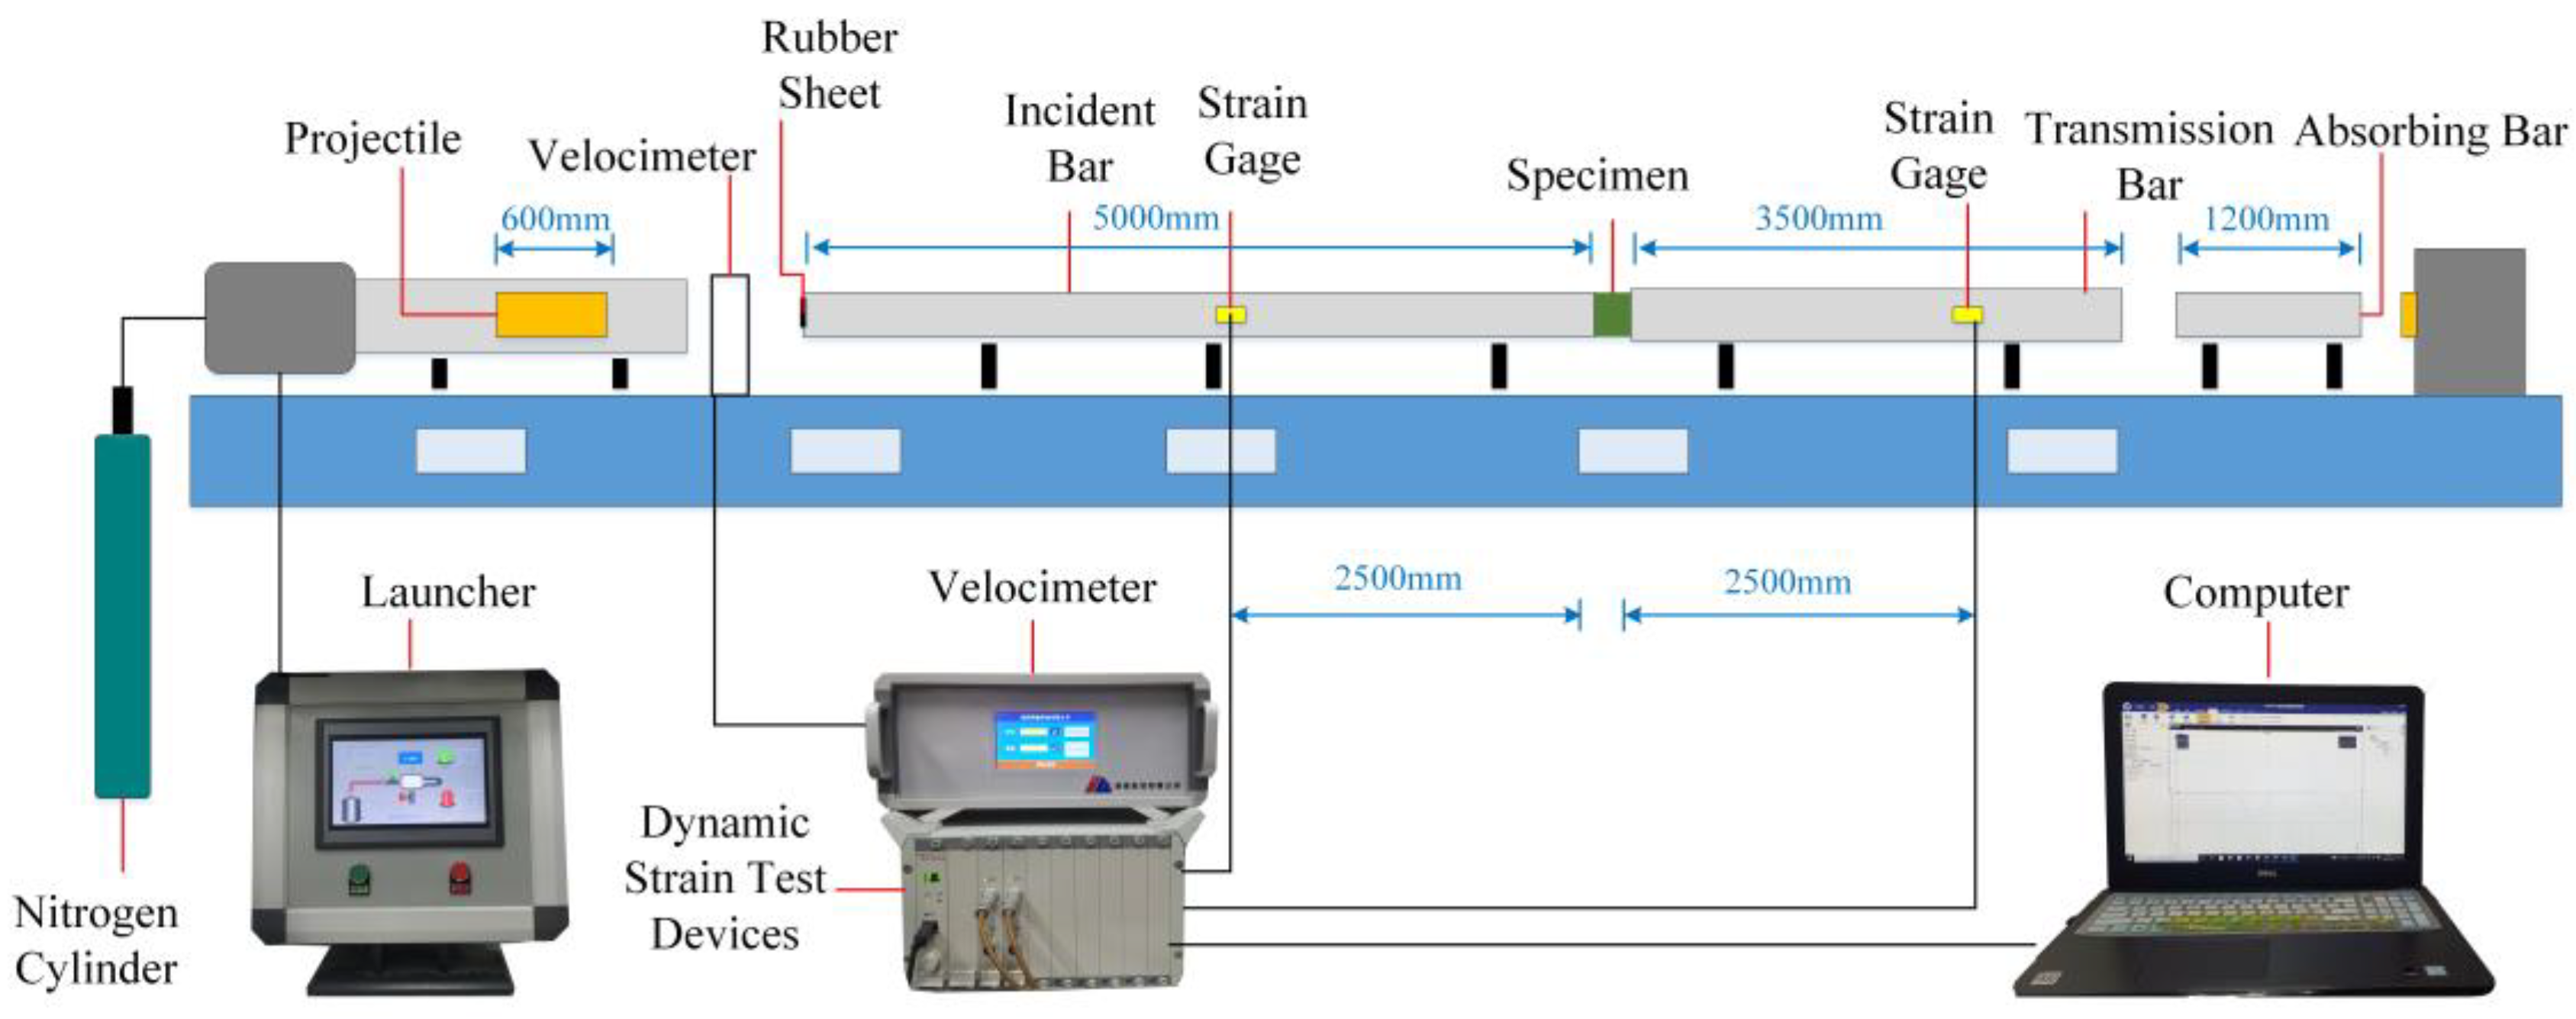
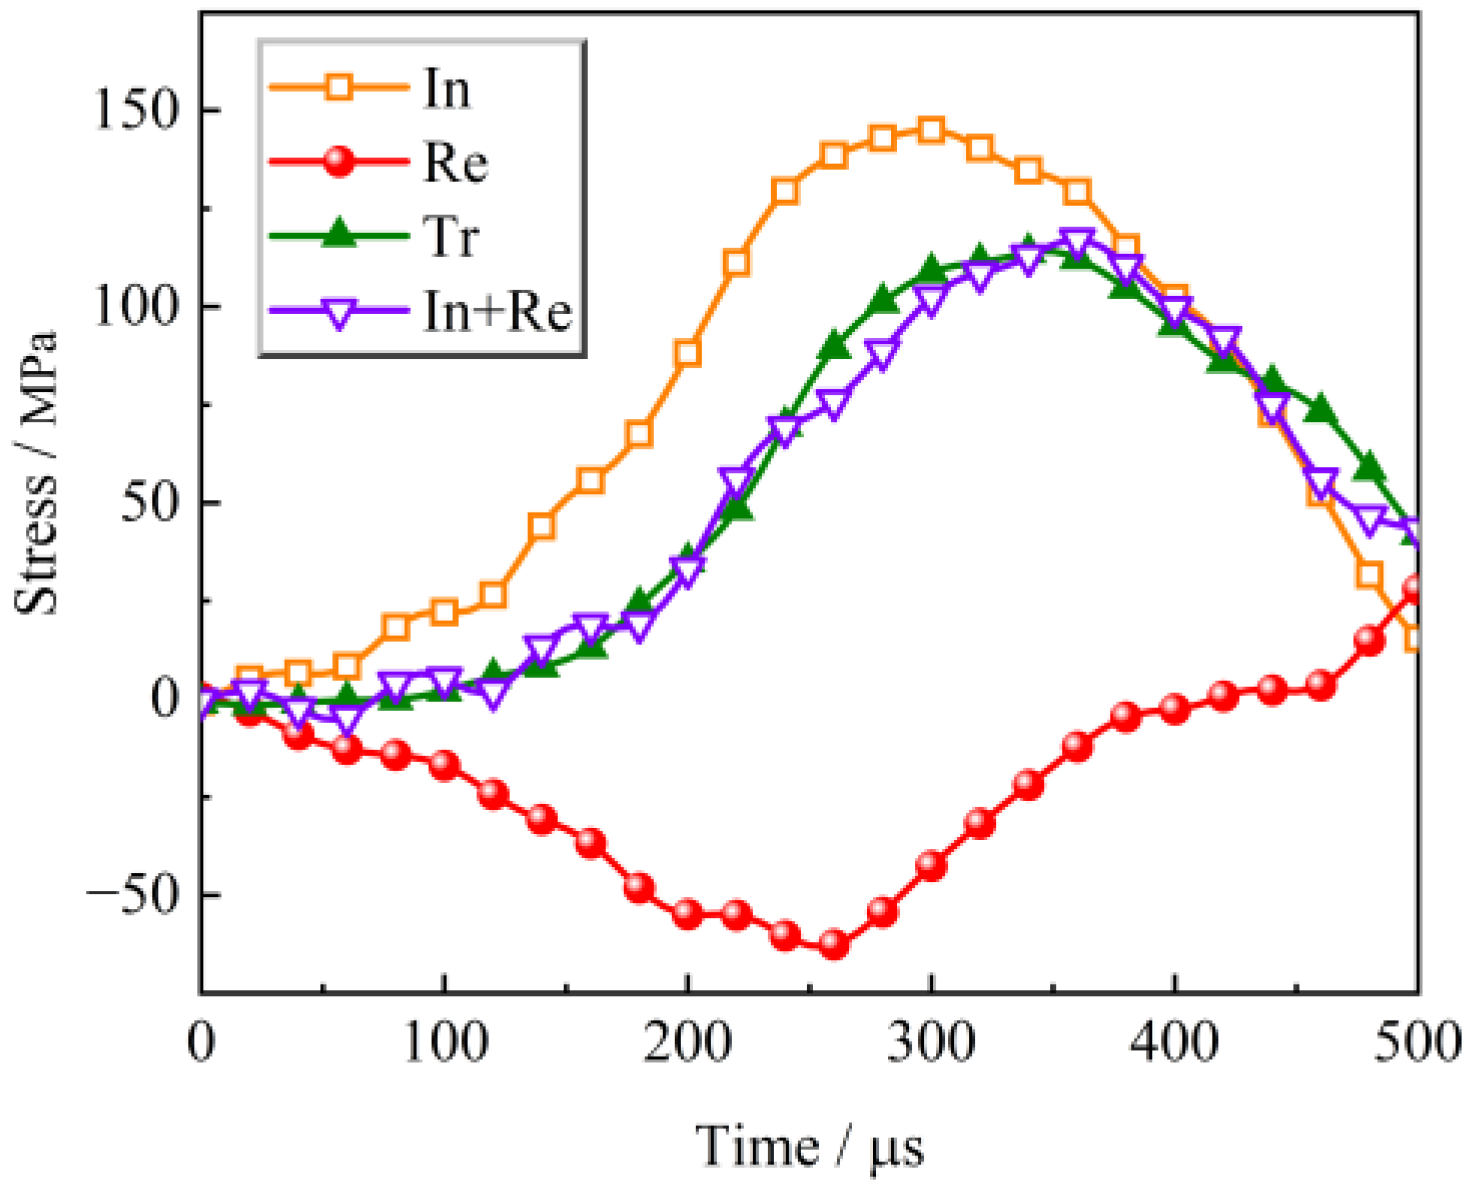
A split Hopkinson pressure bar (SHPB) with a diameter of 100 mm (see Figure 3) was employed to perform dynamic uniaxial compressive experiments on three groups of rocks, which were subjected to 0, 25 or 50 freeze–thaw cycles at four different strain rates. The average strain rates of the four groups were 54.3 s−1, 92.7 s−1, 117.3 s−1 and 152.0 s−1. There were 12 working conditions, and 3 parallel specimens were assigned in each working condition. To ensure the accuracy of the testing data, waveform pulse-shaping technology was adopted. The rubber sheets of 35 mm in diameter and 2 mm in thickness were pasted on the impacting surface of an incident rod. Figure 4 displays the typical waveforms of specimens. There is a good correspondence of transmitted wave and incident wave plus reflected wave, satisfying the dynamic stress equilibrium state of specimens in the loading process.
Based on the one-dimensional elastic stress wave theory and a stress heterogeneity assumption, the stress, strain and strain rate of specimens could be deduced using the equation of the three-wave method.

3. Results

3.1. Strength and Fracturing Characteristics of Freeze–Thawed Sandstone

3.1.1. Strength Characteristics of Freeze–Thawed Sandstone

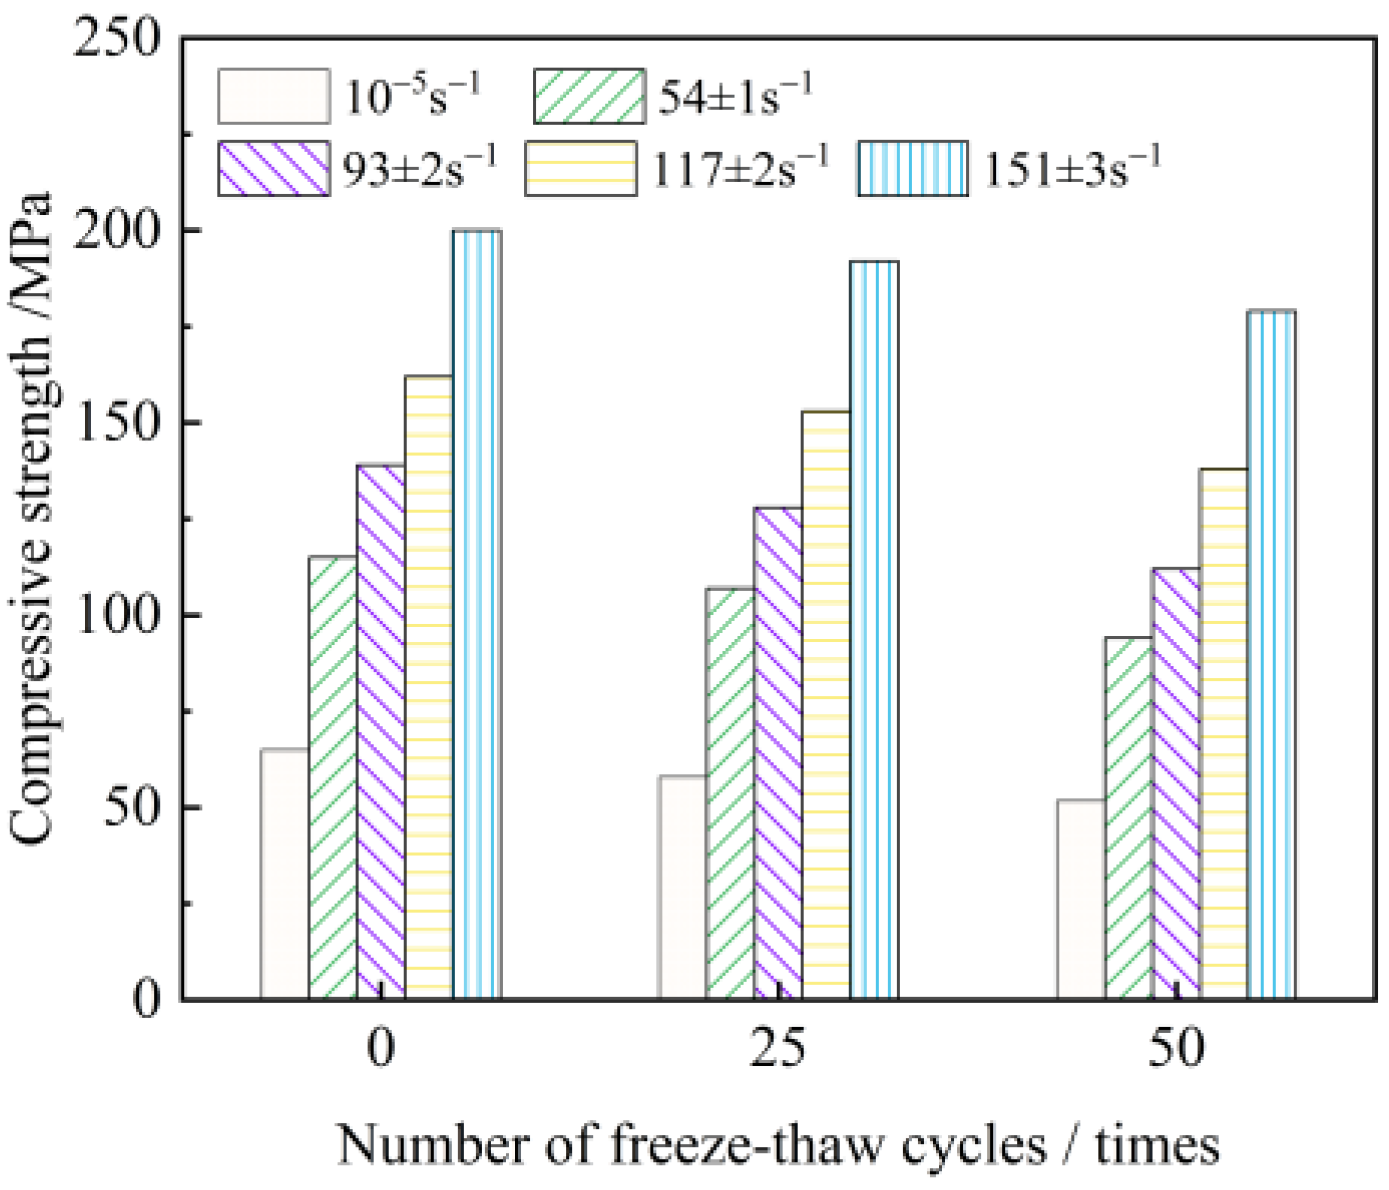
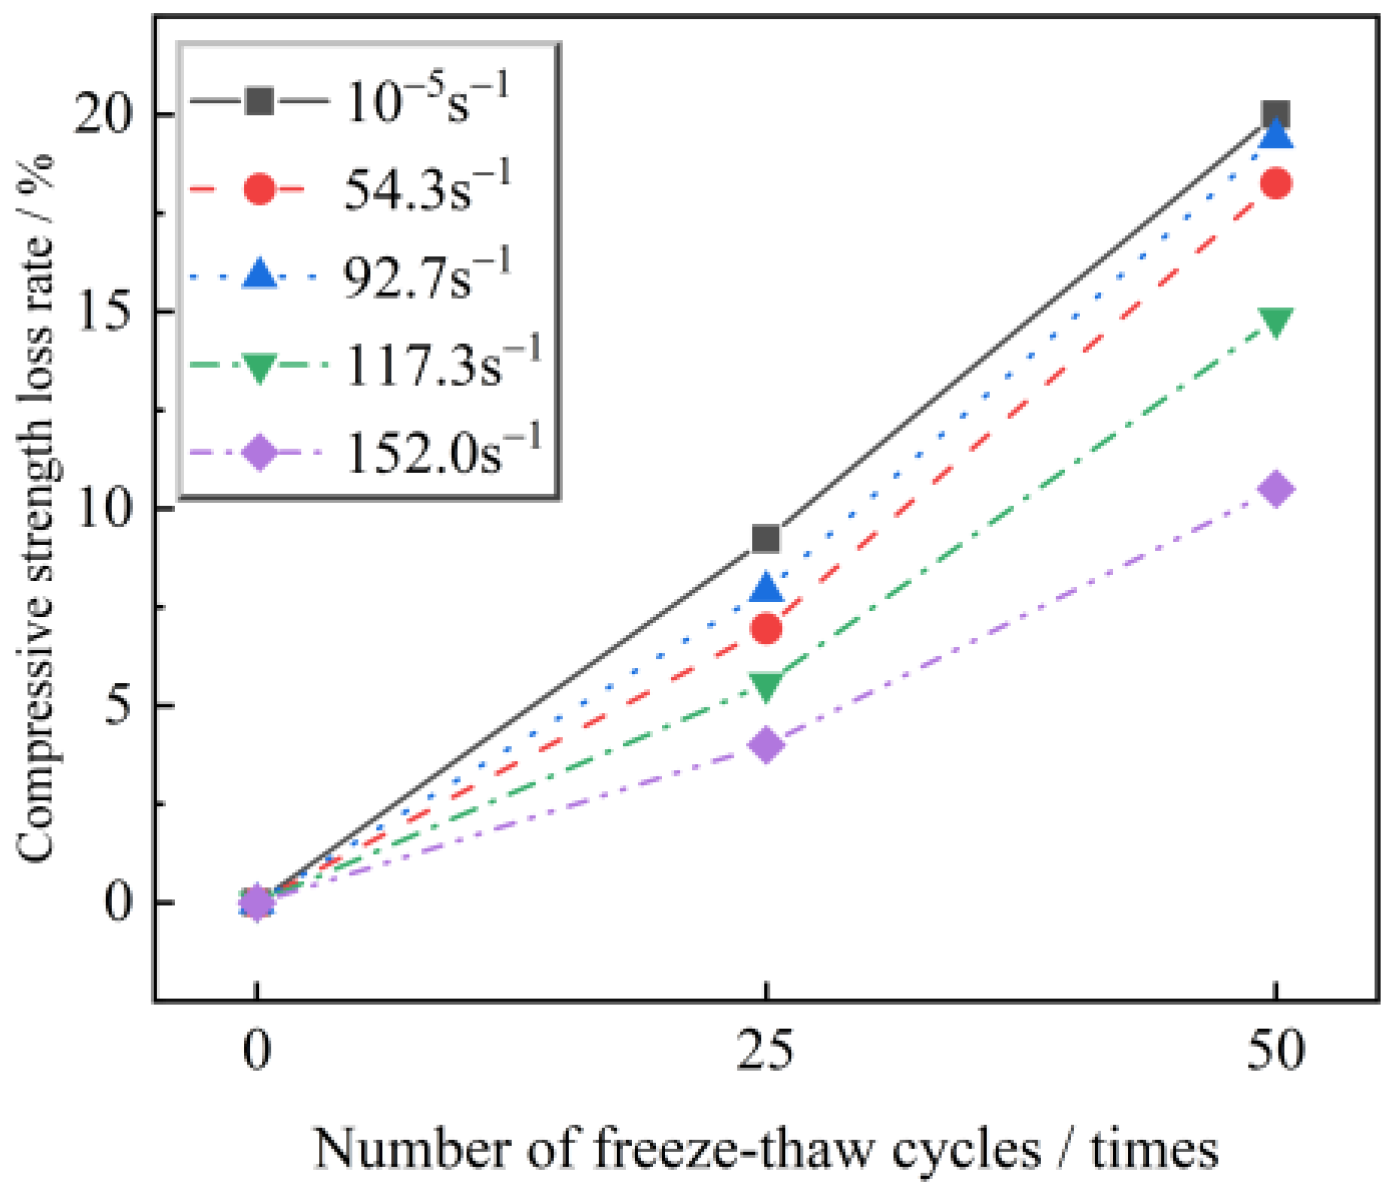
To determine the influences of the number of freeze–thaw cycles and strain rate on peak strength and peak strength loss rate, the three-wave method was used to calculate the peak dynamic strength and strain rate of freeze–thawed sandstone, as shown in Figure 5 and Figure 6. The peak strength of the sandstone is reduced gradually with an increase in the number of freeze–thaw cycles, showing varying degrees of reduction for peak strength at different strain rates. After 50 freeze–thaw cycles, the peak strength of the sandstone specimens under static loading is decreased from 65.54 MPa to 52.24 MPa, indicating a decrease of 20.29%; at strain rates of 54.3 s−1, 92.7 s−1, 117.3 s−1 and 152.0 s−1, the peak strengths of the sandstones are decreased by 18.26%, 19.42%, 14.81% and 10.50%, respectively, which are smaller than the degrees of decrease for the specimens under static loading. This finding indicates that the increase in the number of freeze–thaw cycles leads to a reduction in the peak strength of the sandstone; however, the peak strength of the freeze–thawed sandstone increases with increasing strain rate.
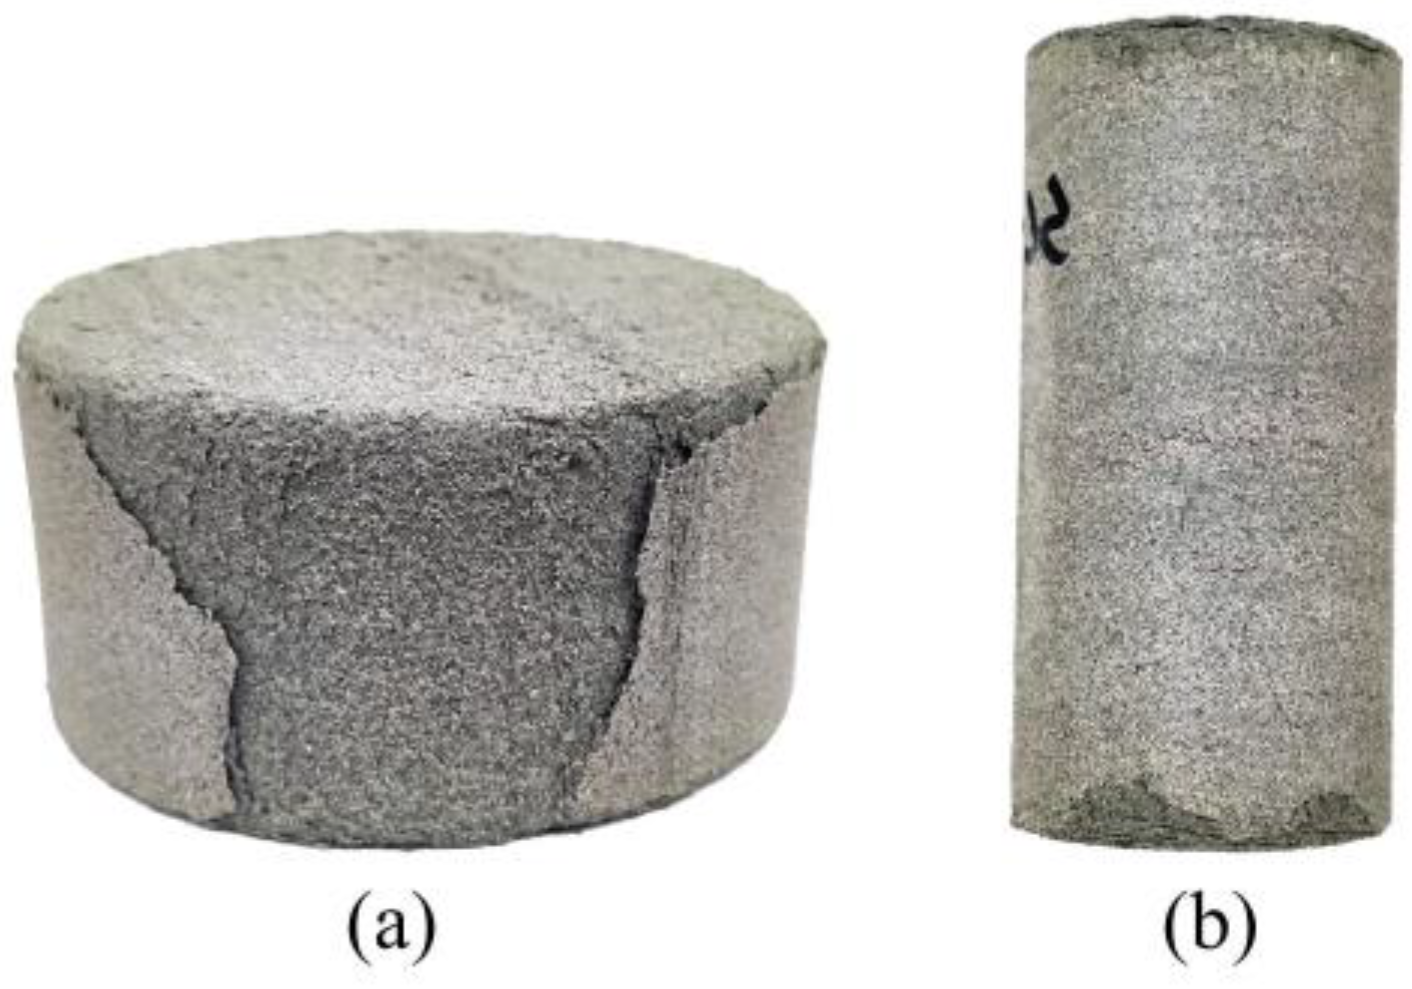
According to the surface morphology of the sandstone subjected to 50 freeze–thaw cycles, as shown in Figure 7, the sandstone in freeze–thaw cycling underwent repeated frost heaving-induced pressures, the grain-to-grain cementation capability weakened, the sandstone delaminated, a serious loss in mineral materials occurred and the roughness of the delaminated zones increased, which affected the mechanical properties of the sandstone.
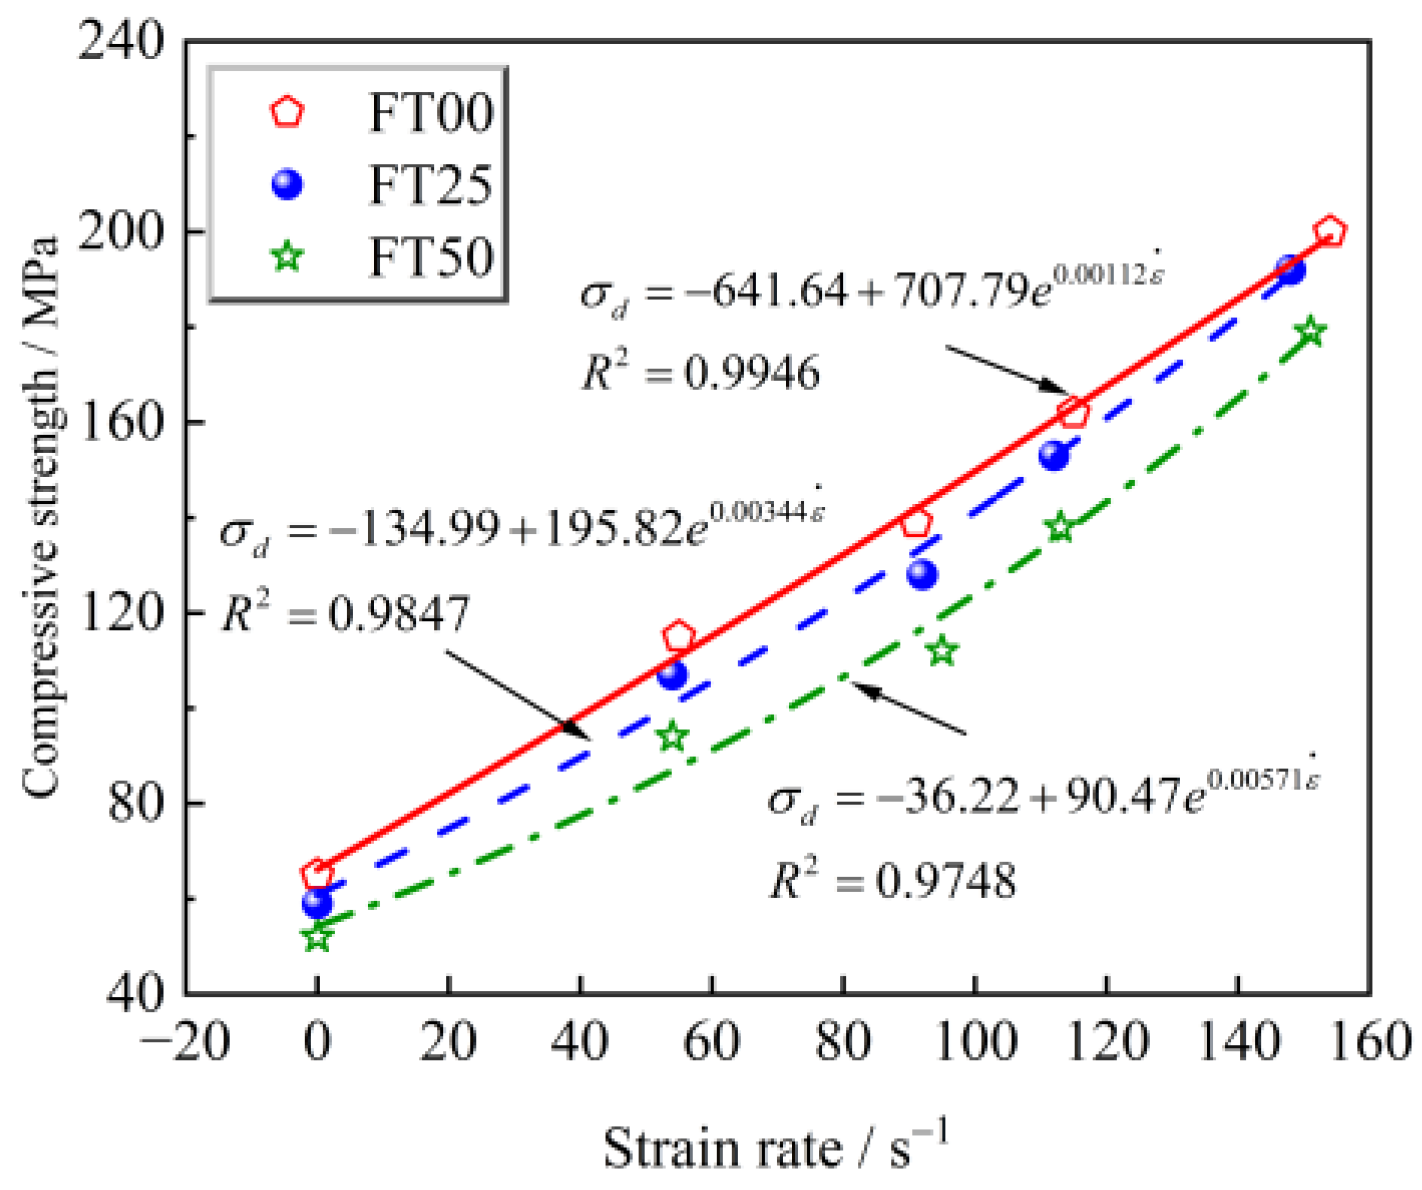
Figure 8 presents the relationship of strain rate and peak strength of freeze–thawed saturated sandstone. The peak strengths of the sandstone that underwent varying numbers of freeze–thaw cycles increased with growing strain rate; moreover, peak dynamic strength exhibited an exponential growth with the change in strain rate, suggesting an obvious strain rate effect on the peak dynamic strength. Based on the test results, the peak strength increases with the loading rate for specimens freeze–thawed in the cycle number range of the tests. This may be explained from the perspective of energy; as the loading rate increases, sufficient energy for crack initiation and propagation is hard to accumulate in the extremely short loading period, and thus the peak strength is enhanced as a result.
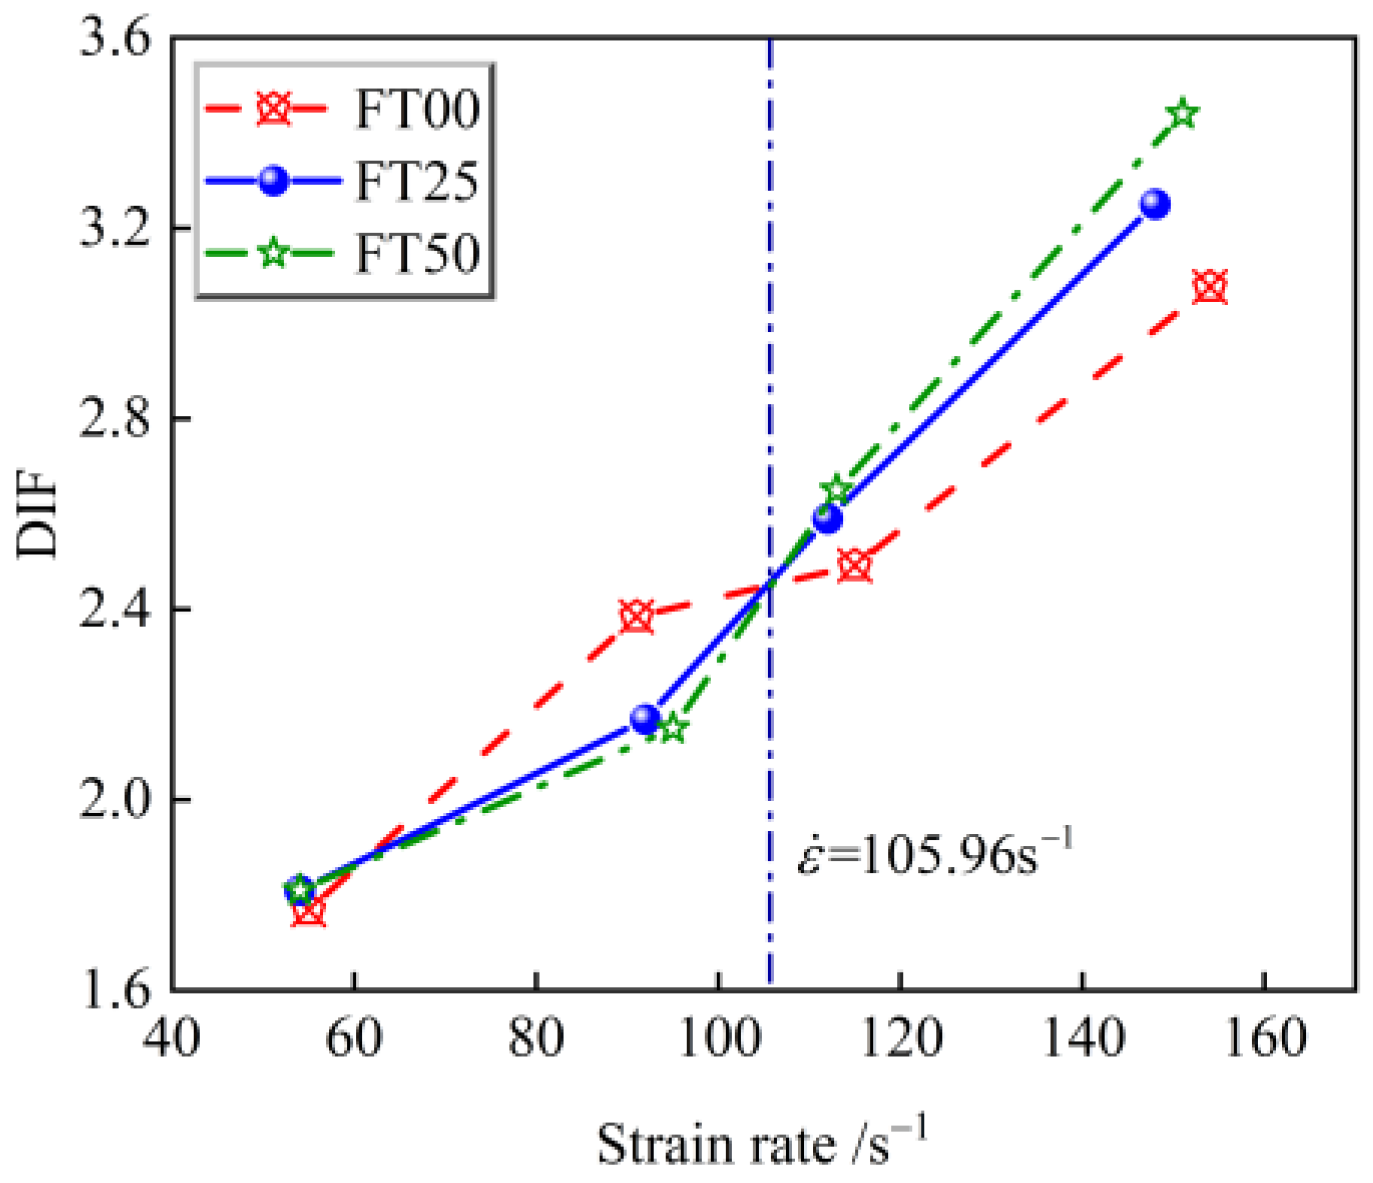
To better investigate the influences of the number of freeze–thaw cycles and strain rate on the strength characteristics of the saturated sandstone, the dynamic increase factor (DIF) is defined as the ratio of the dynamic compressive strength to static compressive strength in the case of the same number of freeze–thaw cycles. The relationship between the DIF and strain rate for the sandstone experiencing different numbers of freeze–thaw cycles is plotted in Figure 9. As illustrated, the DIF increases with rising strain rate, indicating an obvious strain rate effect on the DIF. However, the amplitude of its increase is affected by the number of freeze–thaw cycles. There is a threshold of strain rate for the increase in the DIF. In the experimental conditions of our research, when strain rate is smaller than 105.96 s−1, the increase in the DIF slows down with an increasing number of freeze–thaw cycles; when strain rate is higher than 105.96 s−1, the increase in the DIF is accelerated with an increase in the number of freeze–thaw cycles. This result shows that after reaching a certain strain rate, the strength of the sandstone subjected to multiple freeze–thaw cycles responds to strain rate more sensitively, which is similar to the experimental results in paper [37]. The variation in the DIF is influenced by both the strain rate and the number of freeze–thaw cycles.

3.1.2. The Fractal Dimension Characteristics of Fractured Freeze–Thawed Sandstone under Impact Loading

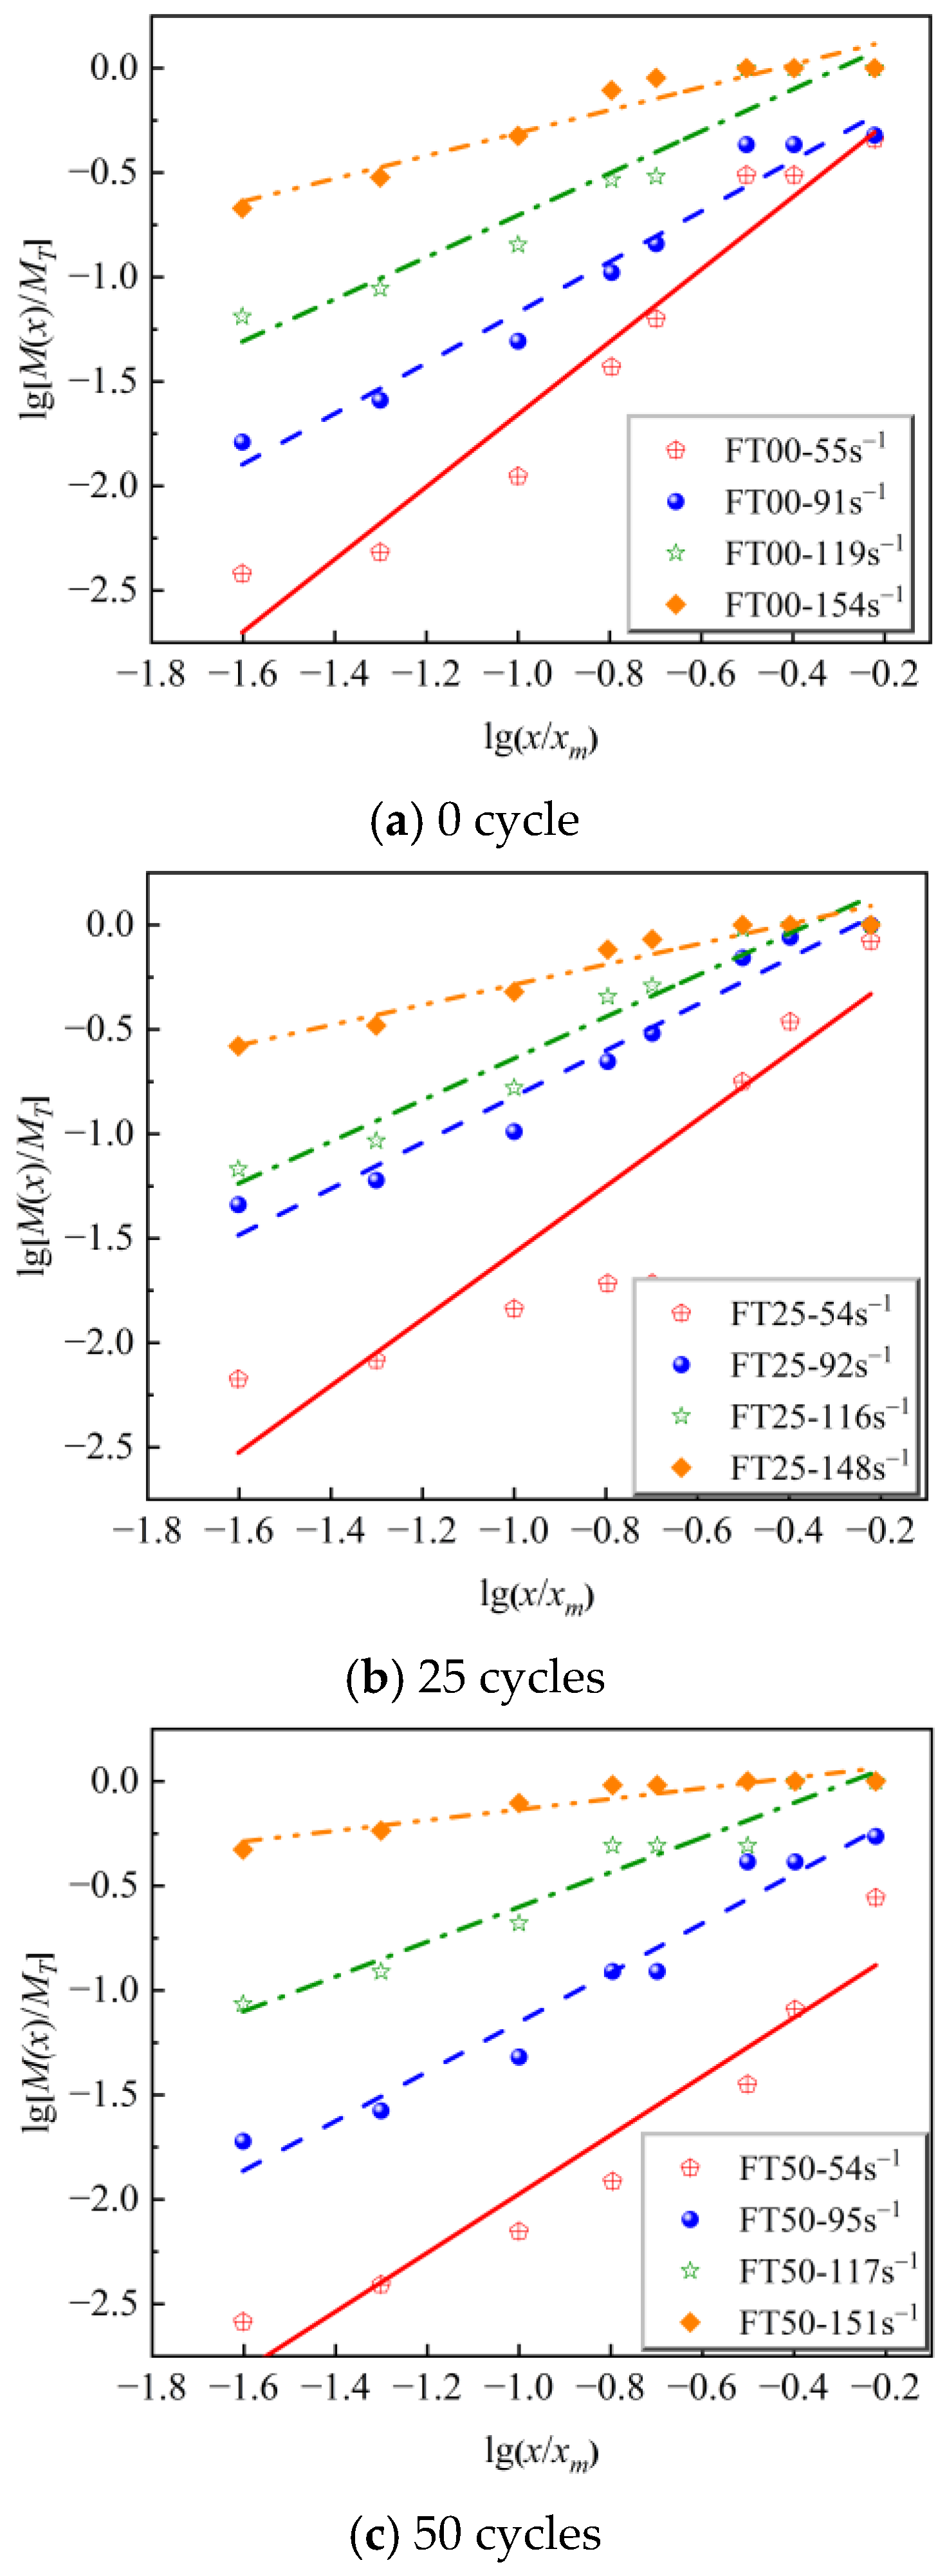
Existing research indicates that the larger the dissipated energy at failure, the larger the fractal dimension of the fractured rock [25]. To quantitively analyze the fracturing characteristics of freeze–thawed saturated sandstone under impact loading, fractured sandstone fragments were dried at 105 °C for 24 h. Then, the obtained fragments were sieved based on the standards for pore sizes of 50 mm, 40 mm, 31.5 mm, 20 mm, 16 mm, 10 mm, 5 mm and 2.5 mm. Afterwards, the fragments were measured based on the relationship between mass and frequency [38]. The sizes of fractured fragments can be obtained by using Equation (1).
Y = M ( x ) M T = ( x x m ) 3 D
where M(x) refers to the cumulative mass of the fragments with sizes below x, MT represents the total mass of all fragments, x denotes grain size, xm is the maximum size of fractured fragments and D is fractal dimension.
Taking the logarithms on both sides of Equation (1), Equation (2) can be obtained. Afterwards, the lg[M(x)/MT]-lg[x/xm] coordinate is established, and the slope, K, can be determined through linear fitting. The fractal dimension is derived according to Equation (3).
lg Y = lg [ M ( x ) M T ] = ( 3 D ) lg ( x x m ) = K lg ( x x m )
D = 3 K
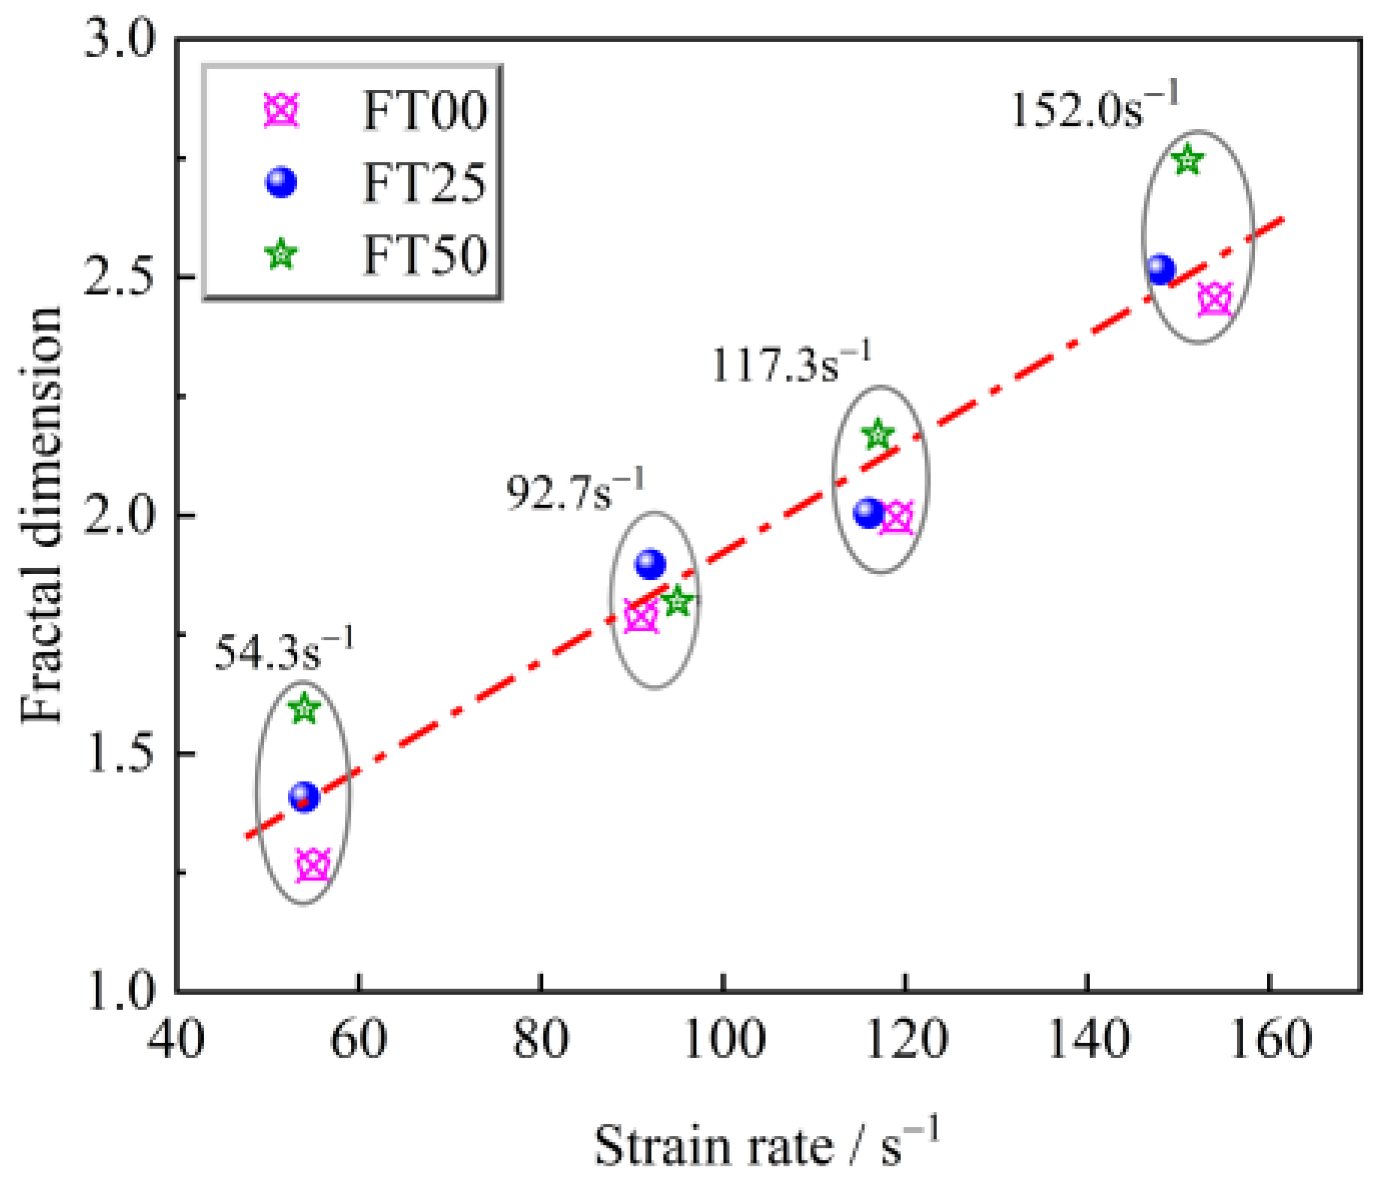
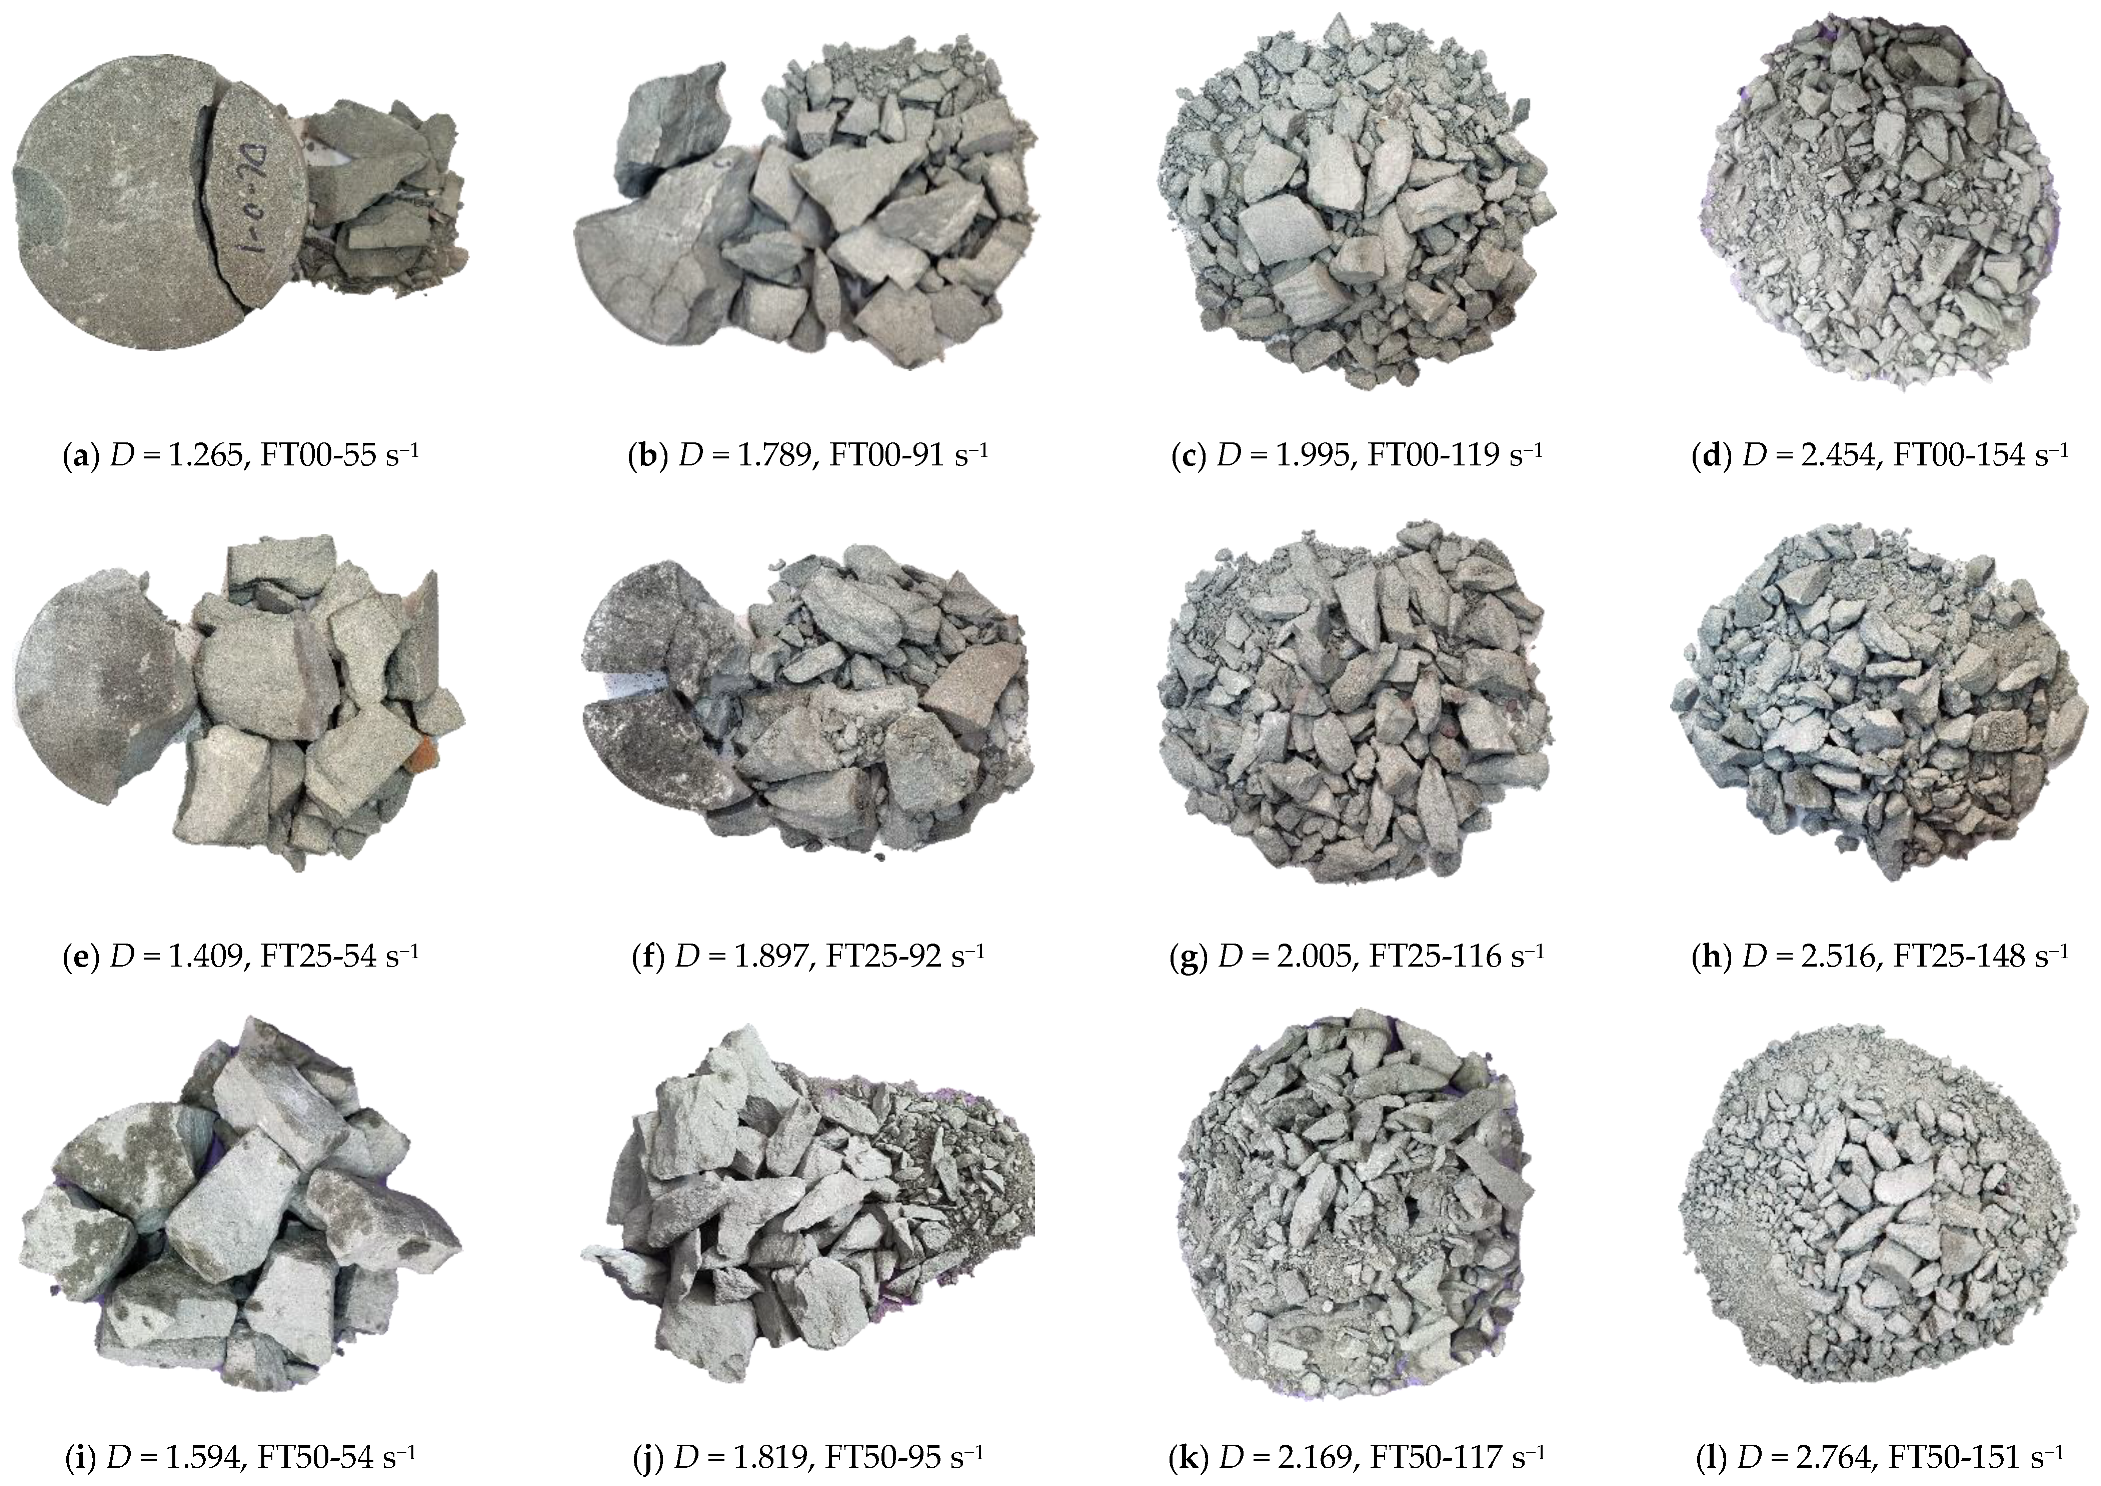
Figure 10a–c displays double logarithmic curves of the sandstone specimens at different strain rates. The data obtained present a good linear distribution relationship between lg[M(x)/MT] and lg(x/xm). In the case of different strain rates, the fracturing of the sandstone specimens subjected to different freeze–thaw cycles shows similar fractal dimension characteristics, while the fractal dimension of fractured sandstone changes with freeze–thaw cycles and strain rate. As illustrated in Figure 11, fractal dimension increases with growing strain rate, which agrees with the experimental results in paper [39]. Moreover, the fractal dimension rises with an increasing number of freeze–thaw cycles, which is further illustrated in Figure 12.
Figure 12 demonstrates failure modes of the freeze–thawed saturated sandstone under different strain rates. These modes include axial tensile failure that mainly occurs in large-sized fragments, and crushing failure that is primarily seen in granular forms. When the impact rate is low, axial tensile failure occurs. However, when the impact rate increases to a certain value, crushing failure will dominate in sandstone specimens. As strain rate increases, the number of fragments of different fractured sandstone specimens subjected to same number of freeze–thaw cycles increases; as strain rate grows beyond 95 s−1, the fractal dimensions of the sandstone specimens subjected to different numbers of freeze–thaw cycles are all increased significantly. When the strain rate is less than 95 s−1, the impact load is relatively small, so the size of the crushed blocks is larger than that under a larger strain rate. The fractal dimension under an impact strain rate of 95 s−1 is between 1.265 and 1.897; while the fractal dimension over an impact strain rate of 95 s−1 is significantly increased to between 1.955 and 2.764.

3.2. Law of Energy Dissipation of Freeze–Thawed Sandstone under Impact Loading

The dissipated energy of rock specimens under dynamic compression can be obtained using Equation (4) [40]:
W i ( t ) = E A C 0 t ε i 2 ( τ ) d τ W r ( t ) = E A C 0 t ε r 2 ( τ ) d τ W t ( t ) = E A C 0 t ε t 2 ( τ ) d τ W s ( t ) = W i ( t ) W r ( t ) W t ( t )
where W i ( t ) denotes the incident energy (J) of specimens, W r ( t ) is the reflection energy of specimens (J), W t ( t ) refers to the transmitted energy of specimens (J), W s ( t ) stands for the dissipated energy of specimens (J), E is the elastic modulus (GPa) of bar-shaped specimens, A is the sectional area of bars (mm2), C is the P-wave velocity (m/s) of the bars, and ε i ( t ) , ε r ( t ) and ε t ( t ) refer to strain signals of the incident wave, reflected wave and transmitted wave, respectively.
Because energy dissipation rate is able to explain rock instantaneous energy consumed at any arbitrary time in the loading process, and is closely related to local failure, strength degradation and damage degree of rock, here, we quantitatively describe the change law of the dissipated energy of rock in the deformation process in the case of varying numbers of freeze–thaw cycles and different strain rates according to the energy dissipation rate proposed by previous research [29]. The energy dissipation rate can be expressed by Equation (5):
η d = W s ( t ) ε ( t ) = [ W i ( t ) W r ( t ) W t ( t ) ] ε ( t )
where η d is the energy dissipation rate under dynamic loading (MJ/m3).

3.2.1. Change Law of Energy Dissipation Rate of Freeze–Thawed Sandstone under Different Strain Rates

Using the three-wave method, the stress–strain curve of the sandstone specimens under different strain rates and varying numbers of freeze–thaw cycles can be determined. The strain–energy dissipation rate relationship at different strain rates can be obtained by Equations (4) and (5). The aforementioned curves are plotted in Figure 13.
The results show that when the number of freeze–thaw cycles is smaller than 50 and strain rate is below 91 s−1, the stress–strain curve is shown to be a closed curve, indicating the damage degree in the rock is low. However, when the number of freeze–thaw cycles is greater than 50 and strain rate is higher than 91 s−1, more irreversible damage occurs to the rock and the stress–strain curve is found to be an open-ended curve.
It is noteworthy that when the number of freeze–thaw cycles is smaller than 50 and strain rate is below 91 s−1, the energy dissipation rate curve is also presented as a closed curve; as the number of freeze–thaw cycles and strain rate increase, the energy dissipation rate curve becomes an open-ended curve, which is consistent with changes in the stress–strain curve and the energy dissipation rate curve. The energy dissipation rate near the peak stress point reaches its maximum value. After that, stress and energy dissipation rate are largely reduced due to crack propagation and the occurrence of slipping on the crack surface [29].

3.2.2. Relationship between Peak Strength and Peak Energy Dissipation Rate for Freeze–Thawed Sandstone

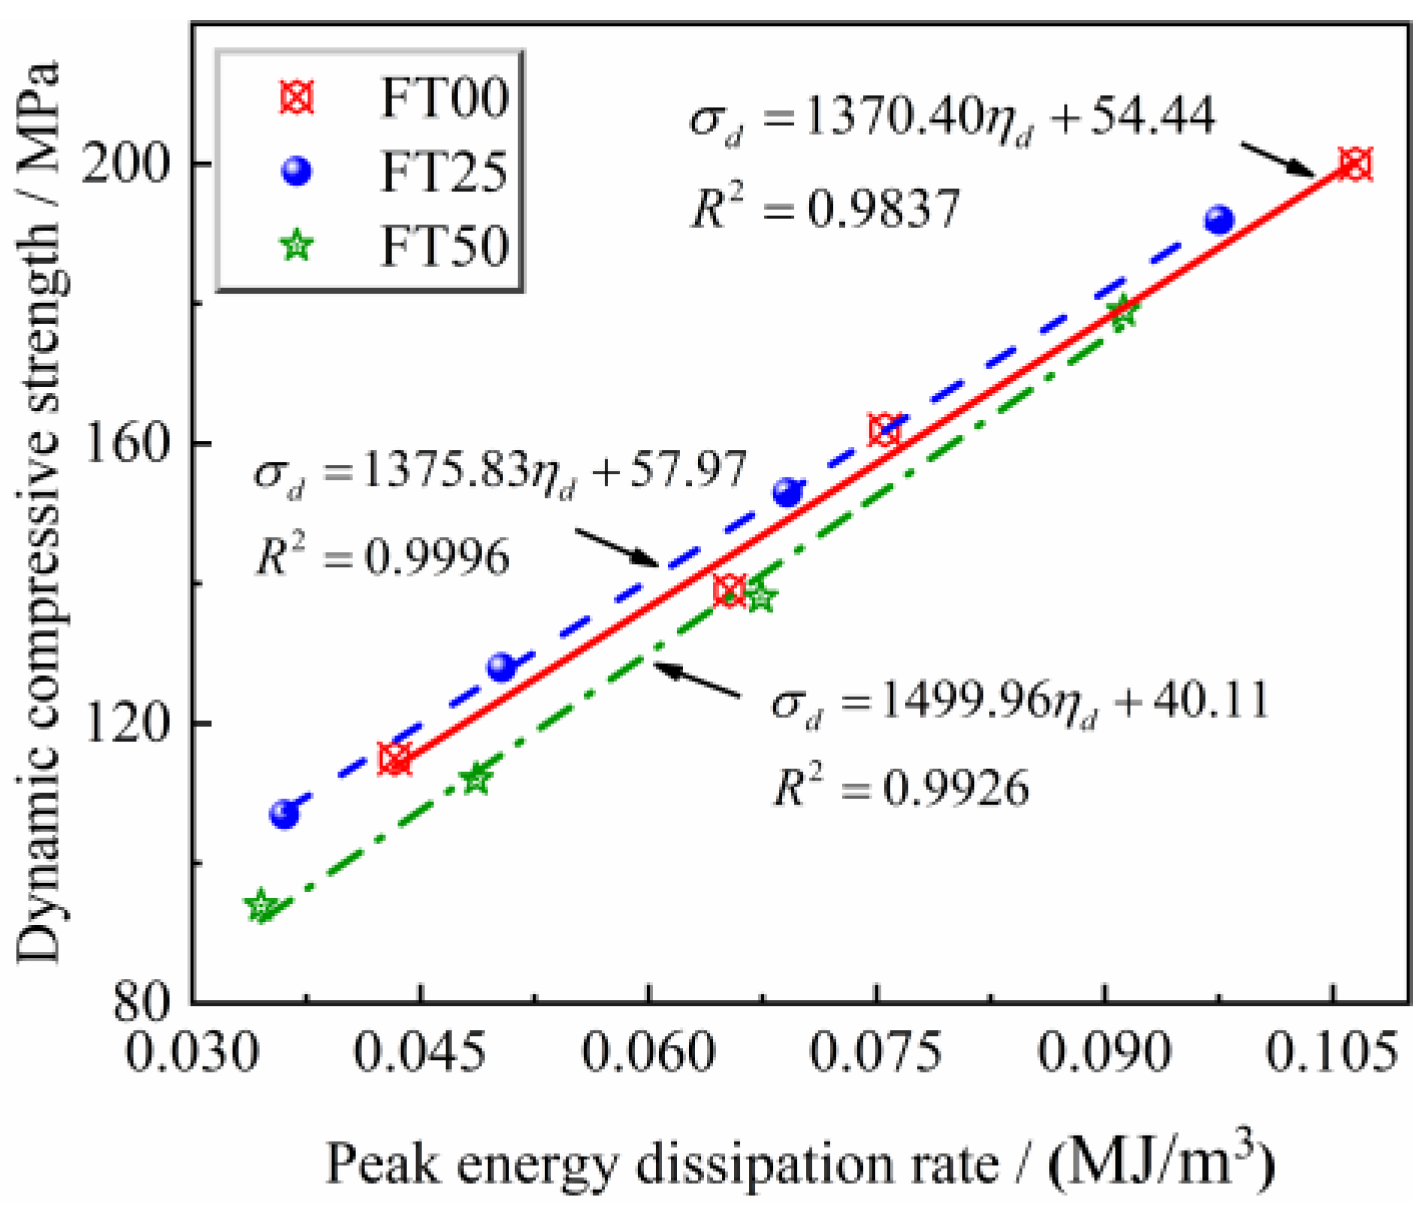
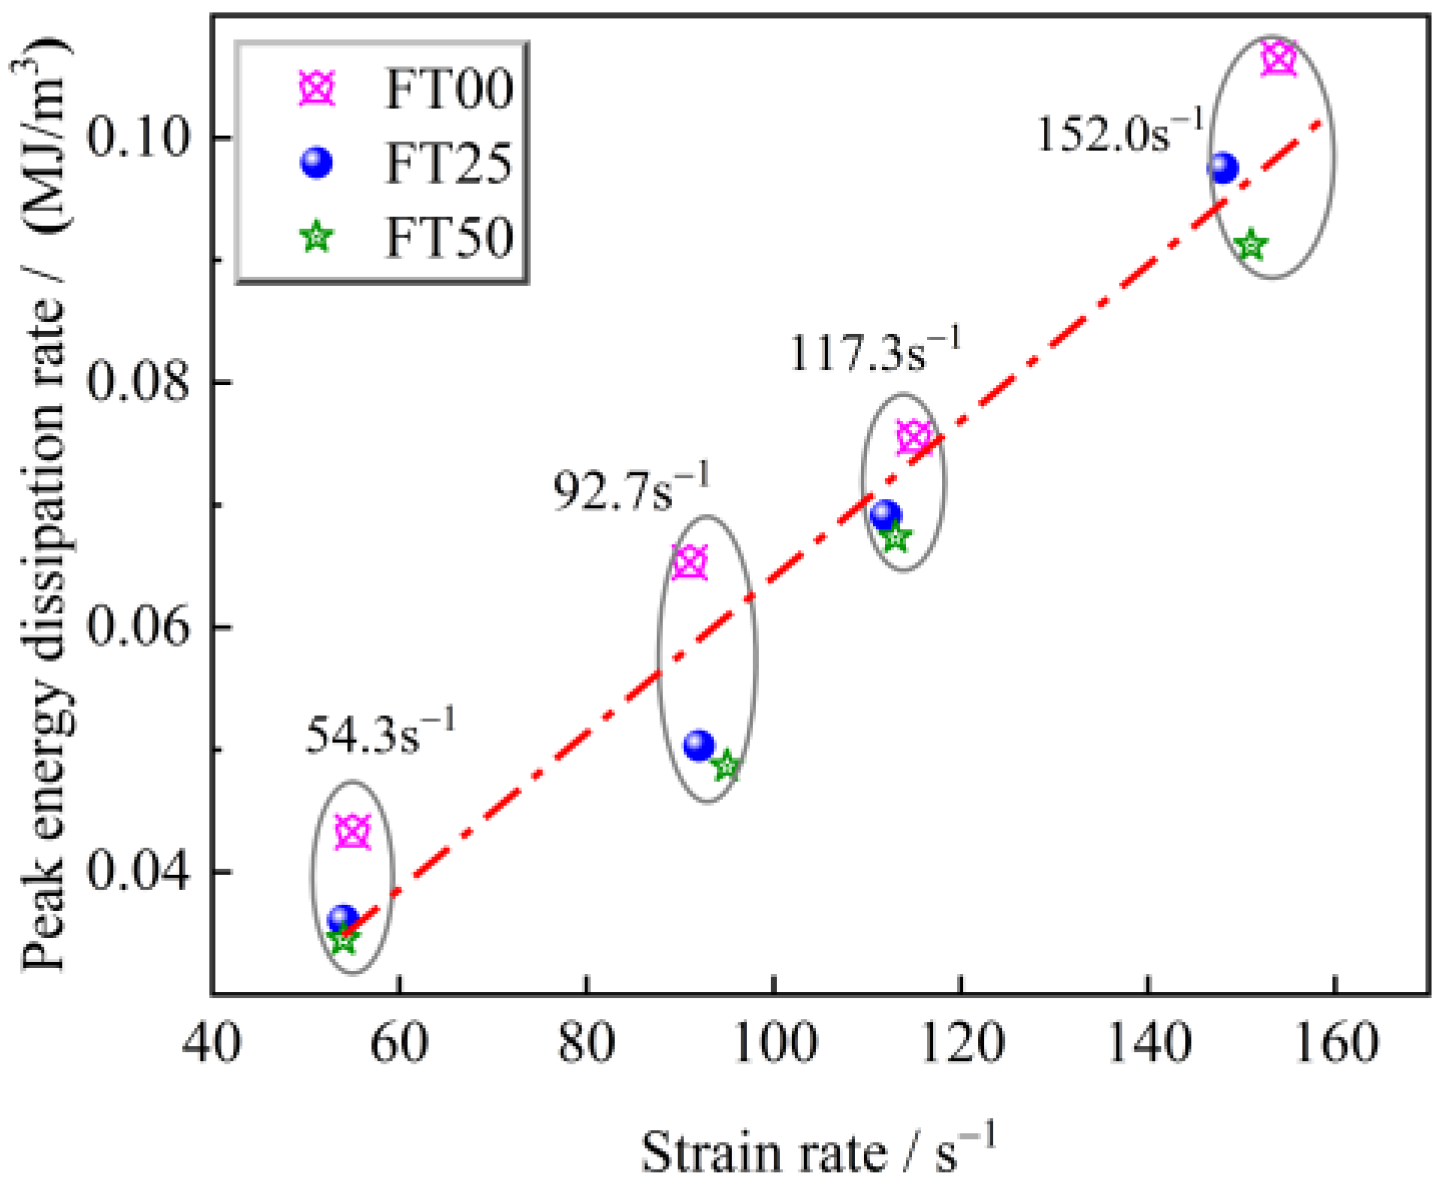
Figure 14 shows the increasing linear relationship between peak energy dissipation rate and peak strength for freeze–thawed saturated sandstone at different strain rates. This suggests that the peak energy dissipation rate can be used to reflect the peak strength of specimens. Figure 15 displays the relationship between peak strain rate and the peak energy dissipation rate of freeze–thawed saturated sandstones at different strain rates. It can be found that changes in peak energy dissipation rate are jointly influenced by strain rate and the number of freeze–thaw cycles. However, at the same strain rate, peak energy dissipation rate is negatively correlated with the number of freeze–thaw cycles.

3.2.3. Relationship between Peak Energy Dissipation Rate and Fractal Dimension for Freeze–Thawed Sandstone

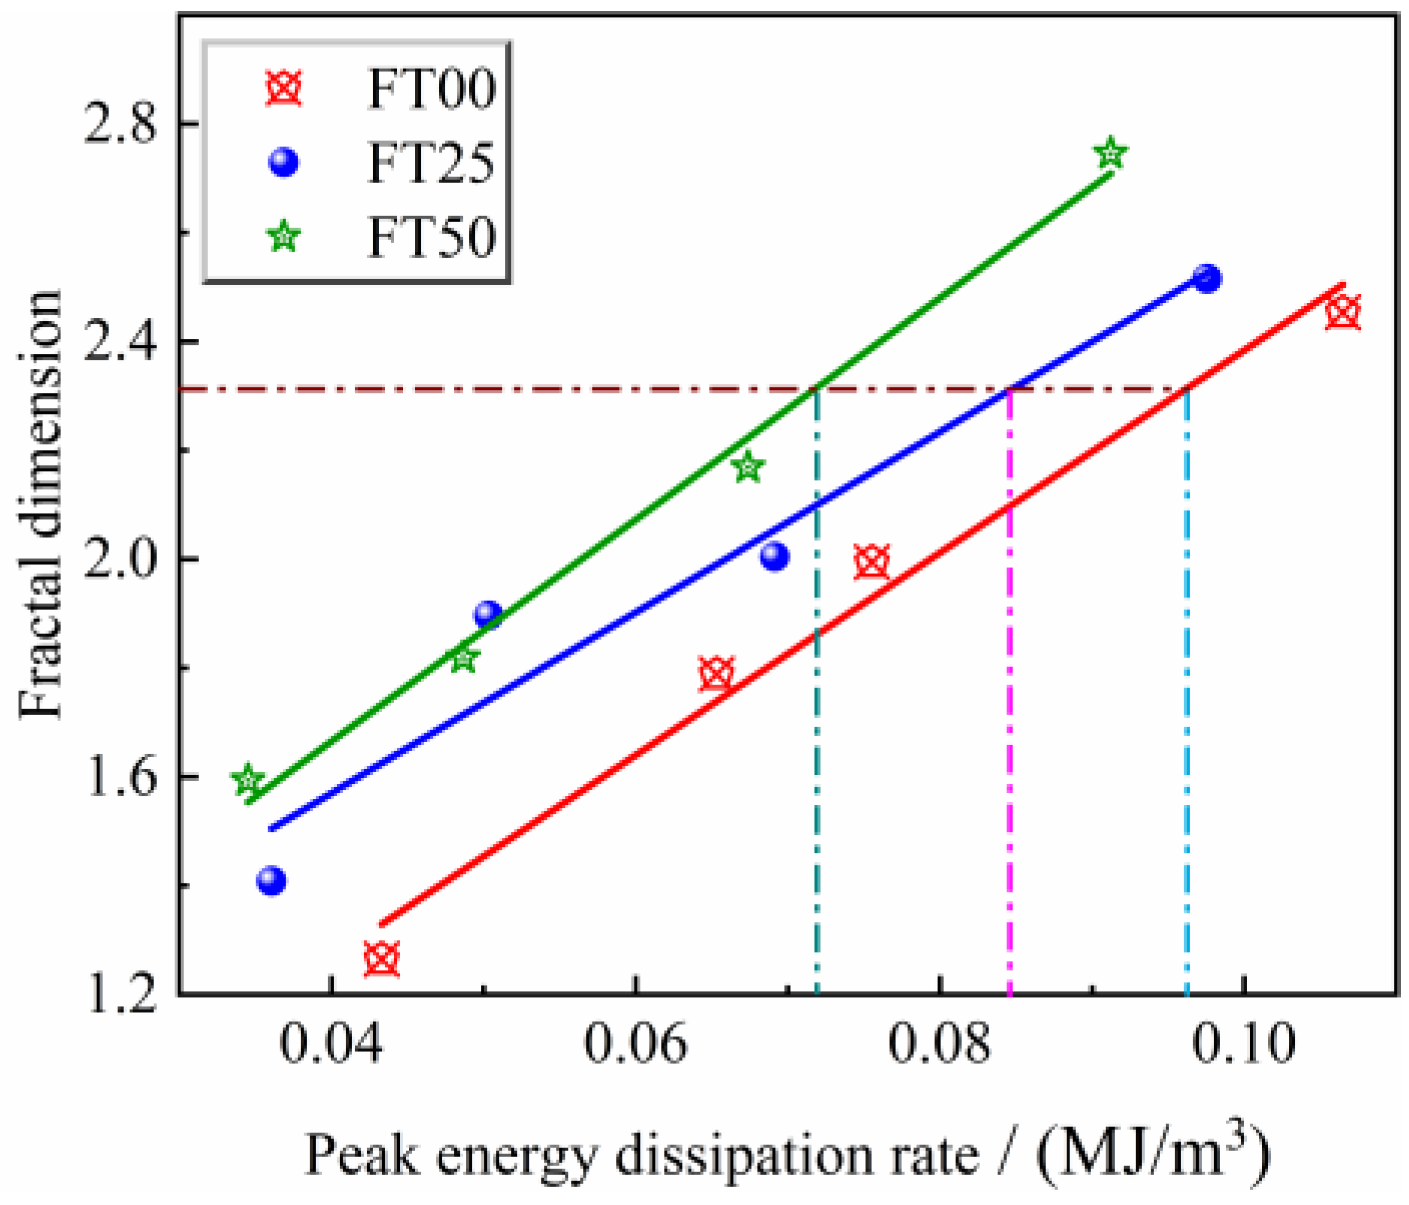
Figure 16 presents the relationship between peak energy dissipation rate and peak fractal dimension for freeze–thawed sandstone at different strain rates. The fractal dimension is linearly correlated with peak energy dissipation rate; hence, peak energy dissipation rate can also be used to reflect the final damage degree of freeze–thawed sandstone. Increases in the fractal dimension and peak energy dissipation rate are influenced by the number of freeze–thaw cycles; in the case of the same fractal dimension, when the fracturing degrees of sandstone specimens are the same, the specimens that underwent more freeze–thaw cycles have the lowest energy dissipation rates. Assuming that the dissipated energy of the rock acts on crack propagation, the higher the number of freeze–thaw cycles, the more serious the freeze–thaw damage to the rock, and the lower the dissipated energy for crack propagation and coalescence.

3.2.4. Analysis of Freeze–Thaw Damage to Sandstone Based on Peak Energy Dissipation Rate

As shown in Figure 15, at the same strain rate, peak energy dissipation rate is reduced with the increase in the number of freeze–thaw cycles. Peak energy dissipation rate is used to establish the freeze–thaw damage variable to quantitively describe the degree of damage to sandstone:
D n = 1 η d n η d 0
where Dn is the freeze–thaw damage variable, η d n denotes the peak energy dissipation rate of sandstone subjected to the Nth freeze–thaw cycling and η d 0 represents the peak energy dissipation rate of sandstone without freeze–thaw cycling treatment.
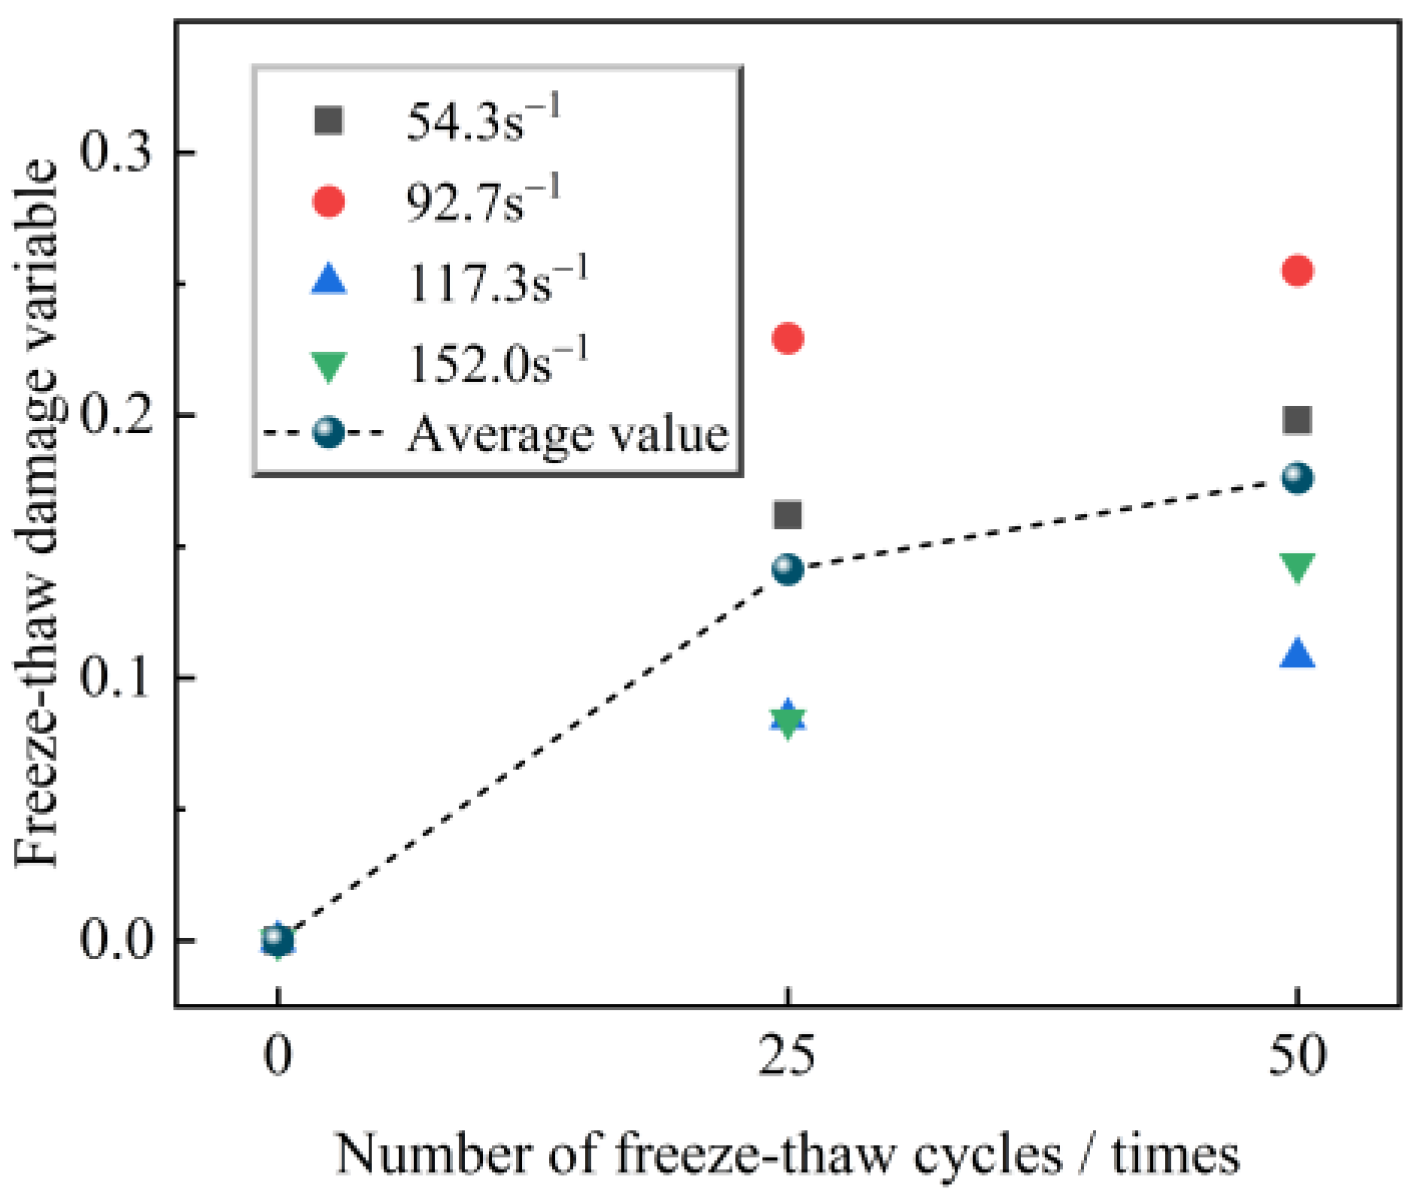
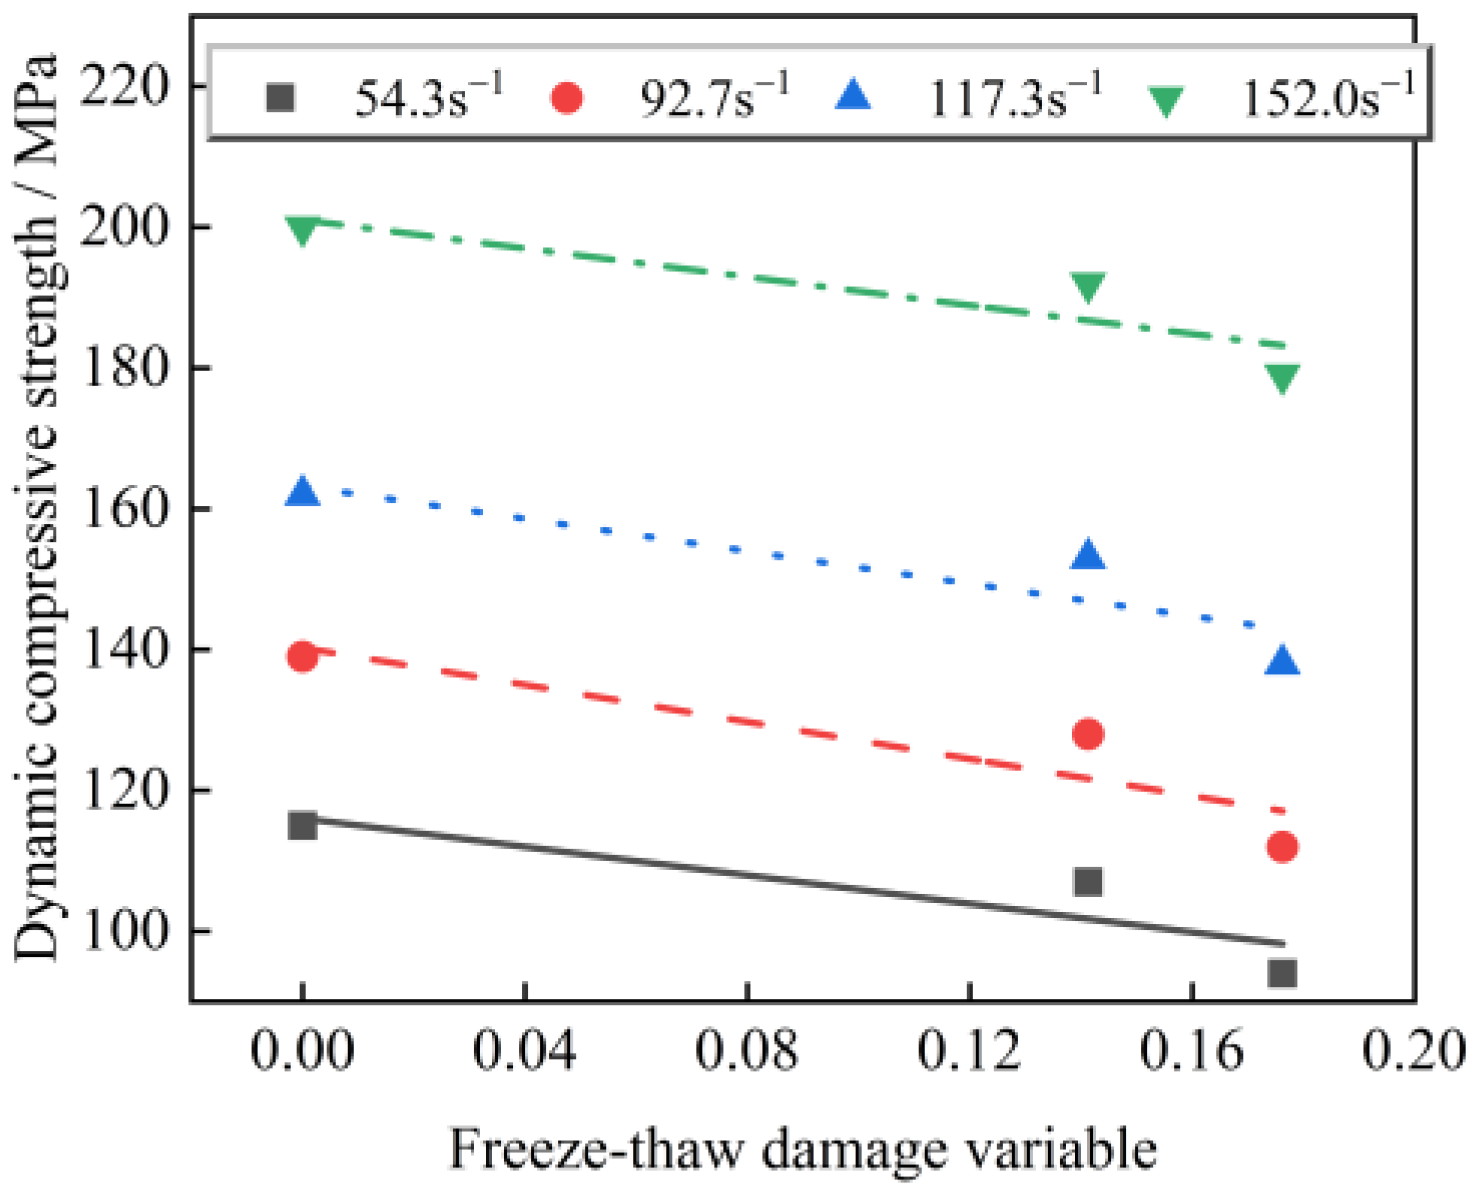
The freeze–thaw damage variable of sandstone under different numbers of freeze–thaw cycles and different strain rates is illustrated in Figure 17. The damage variable is shown to increase with the increase in the number of freeze–thaw cycles. This indicates a law similar to that of the peak strength loss rate of sandstone, as shown in Figure 6. This finding implies that the freeze–thaw damage of sandstone is not a simply uniform accumulation process. To quantitatively explain the degree of damage to saturated sandstone under different numbers of freeze–thaw cycles and different strain rates, the relationship between the average freeze–thaw damage variable and peak dynamic compressive strength is plotted in Figure 18. It can be found that peak strength of freeze–thaw-damaged sandstone at different strain rates is weakened with the increase in the freeze–thaw damage variable. According to the relationship between the peak strength of the sandstone and the damage variable, it can be found that the freeze–thaw damage variable (Dn), defined based on energy dissipation rate, is able to favorably elucidate the influence of freeze–thaw cycling on the strength of sandstone.

4. Conclusions

In this research, static and dynamic compressive experiments at different strain rates were performed on sandstone subjected to different degrees of freeze–thaw cycling damage. The influences of the number of freeze–thaw cycles and strain rate on strength characteristics, energy dissipation rate and fractal dimension characteristics of sandstone were analyzed. A freeze–thaw damage variable used for assessing the degree of damage to freeze–thawed sandstone was established based on peak energy dissipation rate. The main conclusions are drawn as follows:
(1)
The peak strength of sandstone subjected to different numbers of freeze–thaw cycles increases exponentially with growing strain rate, indicating a distinct strain rate effect.
(2)
The DIF of the freeze–thawed sandstone increases with the increase in strain rate. There is a strain rate threshold: when strain rate is smaller than 105.96 s−1, the increasing rate of the DIF slows down with the increase in the number of freeze–thaw cycles; when strain rate is higher than 105.96 s−1, the increasing rate of the DIF grows with the increase in the number of freeze–thaw cycles.
(3)
In the case of the same strain rate, the fractal dimension of fractured sandstone increases with the increase in the number of freeze–thaw cycles; in the case of the same number of freeze–thaw cycles, the fractal dimension of fractured sandstone gradually increases with increasing strain rate.
(4)
The freeze–thaw damage variable established based on peak energy dissipation rate can be used to elucidate the damage degree of sandstone under freeze–thaw cycling, and the peak dynamic compressive strength of freeze–thawed sandstone at different strain rates is reduced with the increase in the freeze–thaw damage variable.

Author Contributions

P.J. provided the concept and edited the draft of manuscript. S.M. conducted the literature review and wrote the first draft of the manuscript. Y.Q., Q.W. and J.L. carried out experiments. All authors have read and agreed to the published version of the manuscript.

Funding

This work was supported by the National Key R&D Program of China (2022YFC2903903) and the National Natural Science Foundation of China (52174071, U1903216, 52004052).

Data Availability Statement

Not applicable.

Conflicts of Interest

The authors declare that they have no conflict of interest.

References

  1. Xu, G.M.; Liu, Q.S. Analysis of mechanism of rock failure due to freeze-thaw cycling and mechanical testing study on frozen-thawed rocks. Chin. J. Rock Mech. Eng. 2005, 24, 3076–3082. (In Chinese) [Google Scholar]
  2. Hori, M.; Morihiro, H. Micromechanical analysis on deterioration due to freezing and thawing in porous brittle materials. Int. J. Eng. Sci. 1998, 36, 511–522. [Google Scholar] [CrossRef]
  3. Yang, G.; Shen, Y.; Jia, H.; Wei, R.; Zhang, H.; Liu, H. Research progress and tendency in characteristics of multi-scale damage mechanics of rock under freezing-thawing. Chin. J. Rock Mech. Eng. 2018, 37, 545–563. (In Chinese) [Google Scholar] [CrossRef]
  4. Jia, H.-L.; Zhao, S.-Q.; Ding, S.; Wang, T.; Dong, Y.-H.; Tan, X.-J. Study on the evolution and influencing factors of frost heaving force of water bearing cracks during freezing-thawing process. Chin. J. Rock Mech. Eng. 2022, 41, 1832–1845. (In Chinese) [Google Scholar] [CrossRef]
  5. Huang, S.; Yu, S.; Ye, Y.; Ye, Z.; Cheng, A. Pore structure change and physico-mechanical properties deterioration of sandstone suffering freeze-thaw actions. Constr. Build. Mater. 2022, 330, 127200. [Google Scholar] [CrossRef]
  6. Lan, Y.; Gao, H.; Zhao, Y. Pore Structure Characteristics and Strength Variation of Red Sandstone under Freeze–Thaw Cycles. Materials 2022, 15, 3856. [Google Scholar] [CrossRef]
  7. Huang, S.; Yu, S. Effect of water saturation on the strength of sandstones: Experimental investigation and statistical analysis. Bull. Eng. Geol. Environ. 2022, 81, 323. [Google Scholar] [CrossRef]
  8. Wang, P.; Xu, J.-Y.; Fang, X.-Y.; Wang, P.-X.; Liu, S.-H.; Wang, H.-Y. Water softening and freeze-thaw cycling induced decay of red-sandstone. Rock Soil Mech. 2018, 39, 2065–2072. (In Chinese) [Google Scholar] [CrossRef]
  9. Tan, X.; Chen, W.; Yang, J.; Cao, J. Laboratory investigations on the mechanical properties degradation of granite under freeze-thaw cycles. Cold Reg. Sci. Technol. 2011, 68, 130–138. [Google Scholar] [CrossRef]
  10. Shi, L.; Liu, Y.; Meng, X.; Zhang, H. Study on mechanical properties and damage characteristics of red sandstone under freeze-thaw and load. Adv. Civ. Eng. 2021, 2021, 8867489. [Google Scholar] [CrossRef]
  11. Zhou, Y.X.; Xia, K.; Li, X.B.; Li, H.B.; Ma, G.W.; Zhao, J.; Zhou, Z.; Dai, F. Suggested methods for determining the dynamic strength parameters and mode-I fracture toughness of rock materials. Int. J. Rock Mech. Min. Sci. 2012, 49, 105–112. [Google Scholar] [CrossRef]
  12. Wang, K.; Feng, G.; Bai, J.; Guo, J.; Yang, X.; Cui, B.; Shi, X.; Song, C. Experimental study on dynamic mechanical characteristics and fracture behaviors of coal under water–gas-temperature coupling conditions. Theor. Appl. Fract. Mech. 2022, 122, 103609. [Google Scholar] [CrossRef]
  13. Zhou, K.-P.; Li, B.; Li, J.; Deng, H.-W.; BIN, F. Microscopic damage and dynamic mechanical properties of rock under freeze-thaw environment. Trans. Nonferrous Met. Soc. China 2015, 25, 1254–1261. [Google Scholar] [CrossRef]
  14. Zhao, R.; Zhai, Y.; Meng, F.; Li, Y.; Li, Y. Research on interactions among parameters affecting dynamic mechanical properties of sandstone after freeze-thaw cycles. Eng. Geol. 2021, 293, 106332. [Google Scholar] [CrossRef]
  15. Takarli, M.; Prince, W.; Siddique, R. Damage in granite under heating/cooling cycles and water freeze–thaw condition. Int. J. Rock Mech. Min. Sci. 2008, 45, 1164–1175. [Google Scholar] [CrossRef]
  16. Chen, T.; Yeung, M.; Mori, N. Effect of water saturation on deterioration of welded tuff due to freeze-thaw action. Cold Reg. Sci. Technol. 2004, 38, 127–136. [Google Scholar] [CrossRef]
  17. Weng, L.; Wu, Z.; Taheri, A.; Liu, Q.; Lu, H. Deterioration of dynamic mechanical properties of granite due to freeze-thaw weathering: Considering the effects of moisture conditions. Cold Reg. Sci. Technol. 2020, 176, 103092. [Google Scholar] [CrossRef]
  18. Chen, C.; Zheng, Y.; Sun, C. Experimental study on dynamic tensile properties and energy evolution of sandstone after freeze-thaw cycles. Chin. J. Rock Mech. Eng. 2021, 40, 2445–2453. (In Chinese) [Google Scholar] [CrossRef]
  19. Liu, X.-H.; Xue, Y.; Zheng, Y.; Gui, X. Research on energy release in coal rock fragmentation process under impact load. Chin. J. Rock Mech. Eng. 2021, 40, 3201–3211. (In Chinese) [Google Scholar] [CrossRef]
  20. Weng, L.; Wu, Z.; Liu, Q.; Wang, Z. Energy dissipation and dynamic fragmentation of dry and water-saturated siltstones under sub-zero temperatures. Eng. Fract. Mech. 2019, 220, 106659. [Google Scholar] [CrossRef]
  21. Han, Z.; Li, D.; Zhou, T.; Zhu, Q.; Ranjith, P. Experimental study of stress wave propagation and energy characteristics across rock specimens containing cemented mortar joint with various thicknesses. Int. J. Rock Mech. Min. Sci. 2020, 131, 104352. [Google Scholar] [CrossRef]
  22. Feng, J.; Wang, E.; Shen, R.; Chen, L.; Li, X.; Xu, Z. Investigation on energy dissipation and its mechanism of coal under dynamic loads. Geomech. Eng. 2016, 11, 657–670. [Google Scholar] [CrossRef]
  23. Wang, P.; Xu, J.; Fang, X.; Wang, P. Energy dissipation and damage evolution analyses for the dynamic compression failure process of red-sandstone after freeze-thaw cycles. Eng. Geol. 2017, 221, 104–113. [Google Scholar] [CrossRef]
  24. Gao, F.; Cao, S.; Zhou, K.; Lin, Y.; Zhu, L. Damage characteristics and energy-dissipation mechanism of frozen-thawed sandstone subjected to loading. Cold Reg. Sci. Technol. 2020, 169, 102920. [Google Scholar] [CrossRef]
  25. Ping, Q.; Luo, X.; Ma, Q.-Y.; Yuan, P. Broken energy dissipation characteristics of sandstone specimens under impact loads. Chin. J. Rock Mech. Eng. 2015, 34, 4197–4203. (In Chinese) [Google Scholar] [CrossRef]
  26. Hong, L.; Zhou, Z.L.; Yin, T.B.; Liao, G.Y.; Ye, Z.Y. Energy consumption in rock fragmentation at intermediate strain rate. J. Cent. South Univ. Technol. 2009, 16, 677–682. [Google Scholar] [CrossRef]
  27. Liu, S.; Xu, J.; Liu, S.; Wang, P. Fractal study on the dynamic fracture of red sandstone after F-T cycles. Environ. Earth Sci. 2022, 81, 152. [Google Scholar] [CrossRef]
  28. Wang, K.; Feng, G.; Bai, J.; Guo, J.; Shi, X.; Cui, B.; Song, C. Dynamic behaviour and failure mechanism of coal subjected to coupled water-static-dynamic loads. Soil Dyn. Earthq. Eng. 2022, 153, 107084. [Google Scholar] [CrossRef]
  29. Feng, J.; Wang, E.; Chen, X.; Ding, H. Energy dissipation rate: An indicator of coal deformation and failure under static and dynamic compressive loads. Int. J. Min. Sci. Technol. 2018, 28, 397–406. [Google Scholar] [CrossRef]
  30. Jia, H.; Ding, S.; Zi, F.; Dong, Y.; Shen, Y. Evolution in sandstone pore structures with freeze-thaw cycling and interpretation of damage mechanisms in saturated porous rocks. Catena 2020, 195, 104915. [Google Scholar] [CrossRef]
  31. Liping, W.; Ning, L.; Jilin, Q.; Yanzhe, T.; Shuanhai, X. A study on the physical index change and triaxial compression test of intact hard rock subjected to freeze-thaw cycles. Cold Reg. Sci. Technol. 2019, 160, 39–47. [Google Scholar] [CrossRef]
  32. Liu, J.; Zhang, H.; Wang, R.-H.; Wang, F.; He, Z.-W. Investigation of progressive damage and deterioration of sandstone under freezing-thawing cycle. Rock Soil Mech. 2021, 42, 1381–1394. (In Chinese) [Google Scholar] [CrossRef]
  33. Mousavi, S.Z.S.; Tavakoli, H.; Moarefvand, P.; Rezaei, M. Micro-structural, petro-graphical and mechanical studies of schist rocks under the freezing-thawing cycles. Cold Reg. Sci. Technol. 2020, 174, 103039. [Google Scholar] [CrossRef]
  34. Gao, F.; Xiong, X.; Zhou, K.-P.; Li, J.-L.; Shi, W.-C. Strength deterioration model of saturated sandstone under freeze-thaw cycles. Rock Soil Mech. 2019, 40, 926–932. (In Chinese) [Google Scholar] [CrossRef]
  35. GB/T 50266—2013; Standard for Tests Method of Engineering Rock Masses. China Planning Press: Beijing, China, 2013. (In Chinese)
  36. Shen, Y.J.; Yang, G.S.; Rong, T.L.; Liu, H.; Lv, W.Y. Proposed scheme for freeze-thaw cycle tests on rock. Chin. J. Geotech. Eng. 2016, 38, 1775–1782. (In Chinese) [Google Scholar] [CrossRef]
  37. Wang, P.; Xu, J.; Liu, S.; Wang, H. Dynamic mechanical properties and deterioration of red-sandstone subjected to repeated thermal shocks. Eng. Geol. 2016, 212, 44–52. [Google Scholar] [CrossRef]
  38. Xie, H.-P. Fractal geometry and its application to rock and soil materials. Chin. J. Geotech. Eng. 1992, 14, 14–24. (In Chinese) [Google Scholar]
  39. Xu, J.-Y.; Liu, S. Research on fractal characteristics of marble fragments subjected to impact loading. Rock Soil Mech. 2012, 33, 3225–3229. (In Chinese) [Google Scholar] [CrossRef]
  40. Zhang, Z.; Kou, S.; Jiang, L.; Lindqvist, P.-A. Effects of loading rate on rock fracture: Fracture characteristics and energy partitioning. Int. J. Rock Mech. Min. Sci. 2000, 37, 745–762. [Google Scholar] [CrossRef]
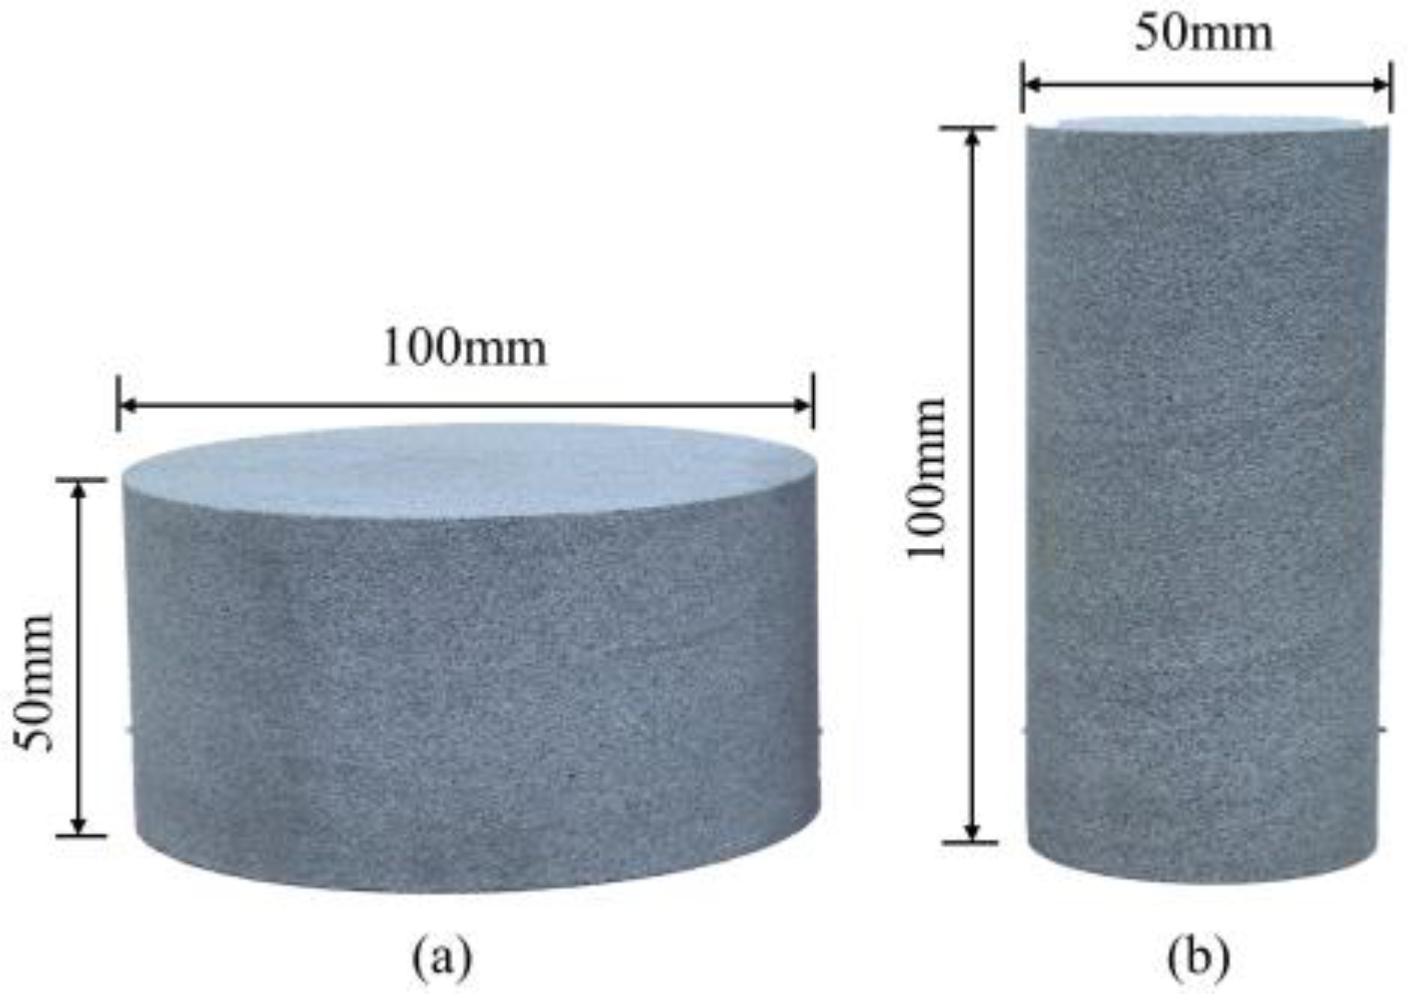
Figure 1. Sandstone specimens. (a) The sandstone specimen under dynamic loading; (b) the sandstone specimen under static loading.
Water 14 03632 g001
Figure 2. The temperature curve of one freeze–thaw cycle.
Water 14 03632 g002
Figure 3. The schematic diagram of the SHPB device.
Water 14 03632 g003
Figure 4. Dynamic stress balance.
Water 14 03632 g004
Figure 5. Influences of the number of freeze–thaw cycles and strain rate on peak strength of sandstone.
Water 14 03632 g005
Figure 6. Influences of the number of freeze–thaw cycles and strain rate on peak strength loss rate of sandstone.
Water 14 03632 g006
Figure 7. Surface morphology of the sandstone subjected to 50 freeze–thaw cycles. (a) The sandstone specimen under dynamic loading; (b) the sandstone specimen under static loading.
Water 14 03632 g007
Figure 8. The curve for the relationship between strain rate and peak strength of freeze–thawed sandstone. Note: FT*-# refers to the rule of specimen numbering, “FT” represents freeze–thaw cycling, “*” denotes the number of freeze–thaw cycles and “#”is strain rate. These definitions are applicable to the rest of the figures hereinafter.
Water 14 03632 g008
Figure 9. The relationship between the dynamic increase factor (DIF) and strain rate.
Water 14 03632 g009
Figure 10. The lg[M(x)/MT]-lg(x/xm) curve.
Water 14 03632 g010
Figure 11. Relationship between strain rate and fractal dimension for freeze–thawed sandstone.
Water 14 03632 g011
Figure 12. The failure modes of freeze–thawed sandstone under different strain rates (specimen diameter 100 mm, height 50 mm).
Water 14 03632 g012
Figure 13. The curves for the strain–stress relationship of freeze–thawed sandstone at different strain rates and energy dissipation rates.
Water 14 03632 g013
Figure 14. Relationship between peak energy dissipation rate and peak strength of freeze–thawed sandstone at different strain rates. Note: η d and σ d denote peak energy dissipation rate and dynamic compressive strength; the units are MJ/m3 and MPa, respectively.
Water 14 03632 g014
Figure 15. Relationship between strain rate and peak energy dissipation rate of freeze–thawed sandstone.
Water 14 03632 g015
Figure 16. Relationship between peak energy dissipation rate and fractal dimension of freeze–thawed sandstone at different strain rates.
Water 14 03632 g016
Figure 17. Changes in freeze–thaw damage to sandstone under different numbers of freeze–thaw cycles and different strain rates.
Water 14 03632 g017
Figure 18. Relationship between average freeze–thaw damage variable and peak dynamic compressive strength.
Water 14 03632 g018
Table 1. Basic physical and mechanical parameters of sandstone.
Dry Density
(g/cm3)
P-Wave Velocity
(m/s)
Porosity
(%)
Uniaxial Compressive Strength
(MPa)
Young’s Modulus
(GPa)
2.372900 ± 509.7465.549.08
Publisher’s Note: MDPI stays neutral with regard to jurisdictional claims in published maps and institutional affiliations.