Article

Determination of Pore and Surface Diffusivities from Single Decay Curve in CSBR Based on Parallel Diffusion Model

1
Natural Science Laboratory, Toyo University, Bunkyo-ku, Tokyo 112-8606, Japan
2
TechnoMediaLab, Inc., Minato-ku, Tokyo 108-0075, Japan
3
Department of Civil, Architectural and Environmental Engineering, Illinois Institute of Technology, Chicago, IL 60616, USA
4
Department of Applied Chemistry, Meiji University, Kawasaki 214-8571, Japan
*
Authors to whom correspondence should be addressed.
Water 2022, 14(22), 3629; https://doi.org/10.3390/w14223629
Submission received: 9 October 2022 / Revised: 5 November 2022 / Accepted: 7 November 2022 / Published: 11 November 2022

Abstract

:
A novel, simple numerical method to determine the pore and surface diffusivities in adsorbents from a single experimental concentration decay curve obtained using the batch adsorption technique was investigated in this study. The pore and surface diffusion coefficients were determined based on the conventional parallel diffusion model in its dimensionless form using a theoretical model correlation. The model assumed that the film mass transfer resistance was negligible, i.e., the condition with a large Biot number, from the single concentration decay curve. The procedure for determining the kinetic parameters was investigated, and the effectiveness of the proposed simple method was validated by comparing the parameters with those reported previously. The single decay curve of p-nitrophenol, obtained by the batch adsorption system using granular activated carbon as an adsorbent, was used for validation. The diffusivities determined by the simple method corresponded fairly well with the diffusivities reported previously.

Graphical Abstract

1. Introduction

Equilibrium and kinetic properties are essential for the design of adsorptive separation and purification apparatus. In liquid-phase adsorption systems, the adsorption isotherms are usually determined using the batch bottle technique. The Freundlich- or Langmuir-type equations are frequently used to correlate equilibrium adsorption data that have been obtained experimentally. Kinetic parameters such as the film resistance coefficient and diffusion coefficient of adsorbents are obtained from the adsorption data, such as breakthrough curves (BTC) in fixed-bed adsorbers, adsorption uptake curves in the shallow-bed technique, and concentration decay curves in a completely mixed batch reactor (CMBR) [1]. During the design of adsorptive separation reactors, a methodological study to determine the kinetic parameters is essential. The adsorption model is generally estimated by fitting the model prediction with the experimentally obtained adsorption data, along with the determination of the kinetic parameters. For example, when a Bangham plot of experimentally collected adsorption data shows a linear correlation that obeys the Bangham equation, the adsorption process is pore diffusion control. If not, fitting of the adsorption data by other adsorption models, such as the surface diffusion model, homogeneous intraparticle diffusion model, and multiple diffusion models, will be performed one-by-one to determine the adsorption mechanism and the kinetic parameters. Many studies determining the adsorption model through the procedure mentioned above have been reported [2,3,4,5,6,7]. From an economic and temporal point of view, it would be desirable to determine the reliable kinetic parameters using a simple method with a small number of experiments. The engineering needs for simple, rapid, and cost-effective determination methods are always high because of the complexity of determining multiple kinetic parameters and cost issues, especially in systems with multiple transfer modes. When the fixed-bed adsorption technique is used for the determination of the kinetic parameters, axial diffusion, channeling, and particle boundary film diffusion may occur. To eliminate these effects, a shallow-bed method can be used. However, its demerit is the use of a large amount of test fluid for each run (approximately 200 L, for instance), which causes environmental pollution when discharged. In contrast, the advantage of the CMBR method is its simplicity of data acquisition, with a smaller amount of test fluid for each run. Automation of the experimental equipment and data acquisition is possible. However, the disadvantage of using the CMBR method is predicting the reliable mass transfer resistance within the film accurately. Mass transfer in the adsorption phase of the adsorbents is taken into consideration for the mass transfer of adsorbates from fluid to granular activated carbon particles. This is because surface diffusion, which occurs in the transfer on the solid phase of the adsorbents, becomes dominant in the adsorption process of the adsorbents with an increase in adsorption amount and mass transfer in the pore phase [8]. Several experimental results must be analyzed separately based on quasi-linear equilibrium assumptions to determine the pore and surface diffusivities in this type of adsorbent with binary mode mass transfer.
The surface diffusion of adsorbents has been observed in many adsorbent systems [9,10,11,12]. Medved et al. reviewed the surface diffusion models of various adsorbents [13]. In a continuous flow column separation system following an ideal single adsorption diffusion model, the BTC of the system shows a symmetrical S-shaped sigmoidal curve. The tailing of BTCs is often observed in adsorbents with large adsorption capacities and multiple diffusion mechanisms. However, the conventional pore diffusion model, the primary single adsorption diffusion model, is unable to predict BTCs with tailing [14]. Hence, a parallel diffusion model is a representative candidate for the successful prediction of BTCs in this case. The parallel diffusion model deals with intraparticle pore diffusion and surface diffusion processes in adsorbents. The tailing of the BTCs in the packed-bed reactors and the decay curves in the CMBR system can be predicted using the model. Although the determination of the multiple kinetic parameters in the model is time-consuming and requires much adsorption data in practice, the tailing of the adsorption curves can be predicted well using the model with binary mode transfer mechanisms.
Several methods have been developed to determine the kinetic parameters of adsorption models using multiple transfer modes. One of the methods is the independent determination of the kinetic parameters using correlation equations available in the literature and theoretical models, independent of the adsorption experiment. Another method is the model-fitting approach, in which the kinetic parameters are determined by fitting the decay curves or BTCs calculated using diffusion models to the experimentally obtained curves. The former approach is useful for confirming the trends of the adsorption data simply and rapidly. However, the calculated kinetic parameters deviate significantly from the experimental adsorption data; thus, further adjustment of the kinetic parameters is required. The latter method requires cumbersome numerical calculations and trial-and-error data fitting to determine the kinetic parameters. It is also necessary to collect multiple experimental data under various conditions, such as the initial adsorbate concentration and agitation/flow rates, to determine multiple parameters [15,16,17].
Souza et al. [18,19] and Valderrama et al. [20] reported a method for determining the kinetic parameters in a parallel diffusion model in a continuous stirred tank reactor (CSTR). First, the boundary film resistance coefficient (kf) was determined from the initial slope of the decay curves in the CSTR, since the intraparticle diffusion influence is minimal at this stage. The pore diffusion coefficient (Dp) was independently calculated from the molecular diffusion coefficient obtained from Wilke and Chang’s equation [21] and the tortuosity factor of the adsorbent. Subsequently, they determined the surface diffusion coefficient (Ds) by curve fitting of the decay curve simulated using the determined kf and Dp values.
Liu et al. studied a parallel diffusion model for a column separation system of levulinic acid [22,23]. They determined the kf using the Wilson–Geankoplis correlation equation. The Ds and Dp, were determined from batch adsorption experiments. The concentration decay curves obtained by the batch adsorption experiments were fitted and compared with the model predictions using the single pore diffusion, single surface diffusion, and parallel diffusion models. The influence of the diffusion coefficient towards the concentration decay curves in the models was observed. The parallel diffusion model simulated the column separation of levulinic acid efficiently using the kinetic parameters determined from batch adsorption experiments.
Yao et al. studied a simple method to determine the kf and Ds without calculating the diffusion equations in a batch adsorption system [24]. The kf was determined by fitting the early-stage concentration decay curve obtained from a batch adsorption experiment with an early-stage kinetic equation. The Ds was then determined by fitting the late-stage decay curve with an approximate equation for the analytical solution of the diffusion equation. The obtained kinetic parameters were applied to other adsorption systems to validate the accuracy of the method.
Chung et al. examined a method for determining the kinetic parameters in a parallel diffusion model in a column adsorption system using frontal analysis [25]. The Dp was first determined using frontal analysis. BTC prediction was performed using the parallel diffusion model with Dp obtained from frontal analysis. The Ds was calculated using the best fitting obtained from the model predictions to the experimental BTC data.
Danica et al. applied the high-order frequency response function obtained by nonlinear frequency response analysis to pore diffusion analysis [26]. They successfully applied the pioneering research of the frequency response analysis performed by Petkovska et al. [27] to separately estimate the pore and surface diffusion coefficients.
When a shallow bed or CMBR is used, experimental conditions with negligible film mass transfer resistance are available, as mentioned above. It is easy to obtain the pore diffusion and surface diffusion coefficients simultaneously from the concentration decay curves under film-resistance-free conditions. In this study, we focused on the parallel diffusion model and a simple determination method for the multiple kinetic parameters of the model using the CMBR method. The simple method to determine the pore and surface diffusivities of adsorbents under negligible film resistance conditions was investigated based on a theoretical model analysis of a non-dimensional parallel diffusion model using a theoretical model correlation. The time ratio of the concentration decay curves (T0.2/T0.8 = T (C/C0 = 0.2)/T (C/C0 = 0.8)) and the diffusivity ratio between pore and surface diffusion (RD) were successfully correlated based on the parallel diffusion model. The time ratio characterizes the decay curve as a single parameter. This correlation was used to determine the diffusivities from the single concentration decay curve. The effectiveness of the method was confirmed using the adsorption data of a p-nitrophenol/activated carbon system obtained by the CMBR method. The adsorbate/adsorbent system is known to be surface-diffusion-dominant, with large Freundlich n values [28,29].

2. Parallel Diffusion Model in Dimensionless Form

This study assumes the diffusive adsorption of organic adsorbates in highly affinitive spherical porous adsorbents. The adsorption model assumes that mass transfer in the adsorbent is the rate-limiting step of the adsorption rate. Adsorbents with Freundlich-type adsorption isotherms were considered in this study because the Freundlich type is often observed in adsorbents with surface diffusion transfer. However, the simple method developed in this study is applicable to different types of adsorption isotherms. In a liquid-phase adsorption separation system, the mass transfer process in the film at the fluid-to-solid interface and inside the adsorbents controls the adsorption rate, rather than the adsorption equilibrium at the adsorption sites in the adsorbents. The intraparticle transport of adsorbates via pore and surface diffusion in the adsorbents is considered in the ordinary parallel diffusion model. In a system with surface diffusion, the adsorbates are distributed in the adsorption phase rather than in the pore phase. This assumption corresponds to the Freundlich-type adsorption isotherm, q = kc1/n, with high k and n values. Assuming that the porosity and packed density of the adsorbents are ε and ρs, respectively, the amount of adsorbate in the pores and the solid in a certain volume of the adsorbent V are denoted by εVc and skc1/n, respectively. The ratio of the amounts of adsorbates in the solid to the pores is expressed by ρskc1/n−1/ε. Figure 1 shows the ratio as a function of n and c. The value of ρsk/ε is not small but more than ten in general; thus, the ratio is very large in the adsorbents with n values greater than unity, indicating the small contribution of pore diffusion transfer.
For the CMBR method, the fundamental single-mode mass transfer system equations in the dimensional form are as follows.
Intraparticle diffusion: here, qm and Ds are the amount of adsorption at radius r in the adsorbent and the surface diffusion coefficient, respectively.
( q m t ) = ( D s r 2 ) r ( r 2 q m r )
Fluid-to-solid film transport:
ρ s ( q t t ) = k f a p ( c t c s )
where kf, ap, ct and cs are the film mass transfer coefficient, surface area, concentration in the vessel and fluid concentration at r = rp, respectively.
Interface transport:
( q t t ) = a p D s ( q m r ) r = r p
Mass balance within vessel:
( q t t ) = ( V m ) ( c t t )
at t = 0, qt = 0 and ct = c0.
Average amount adsorbed:
q t = 0 r p 4 π q m r 2 d r ( 4 3 ) π r p 3
qt is the amount of adsorbate in the adsorbent.
Adsorption equilibrium:
q s = k c t 1 n
In the case of the parallel diffusion model, which is free from film diffusion resistance, the fundamental equations are as follows.
Intraparticle diffusion:
ρ s ( q m t ) = ρ s ( D s r 2 ) r ( r 2 q m r ) + ( D p r 2 ) r ( r 2 c m r )
with initial and boundary conditions qm = 0 at t = 0 and qm = f(ct) at r = rp.
The accumulation term on the left-hand side of Equation (7) considers only the adsorption phase because of the small distribution of adsorbates in the pores. The first and second terms on the right-hand side of the equation are the fluxes due to surface diffusion and pore diffusion, respectively. The average amount adsorbed and the equilibrium relationship are the same as in Equations (5) and (6).
As the equations contain many constants and variables, they were converted to dimensionless variables using dimensionless variables, as shown below.
Dimensionless variables:
T = ( D s r p 2 ) t ,     R = ( R r p ) ,     C t = ( c t c 0 ) ,   C s = ( c s c 0 ) , Q t = ( q t q 0 ) ,   Q m = ( q m q 0 )
For the CMBR method, the dimensionless equations are shown as follows.
Intraparticle diffusion:
( Q m T ) = ( 1 R 2 ) R ( R 2 Q m R )
( Q m R ) R = 1 = B i ( C t C s )
where B i = k f r p D s β ρ s
( Q T ) = 1 R 2 R ( R 2 Q m R ) + R D ( 1 R 2 ) R ( R 2 C m R )
where R D = D p D s β ρ s , and the initial and boundary conditions are Qm = 0 at T = 0.
RD denotes the ratio of diffusion resistance owing to surface diffusion and pore diffusion, and V/ is the dimensionless fluid-to-solid ratio.
Mass balance within the vessel:
( Q t T ) = ( V m β ) ( C t T )
Average amount adsorbed:
Q t = 3 0 1 Q m R 2 d R
Equilibrium relationship:
Q s = C t 1 n
The series of equations in non-dimensional form was solved numerically using the finite difference method. The details of the numerical calculations are reported by Fujiki et al. [30].

3. Results and Discussion

3.1. RD Dependence of Adsorption Profiles and Decay Curves

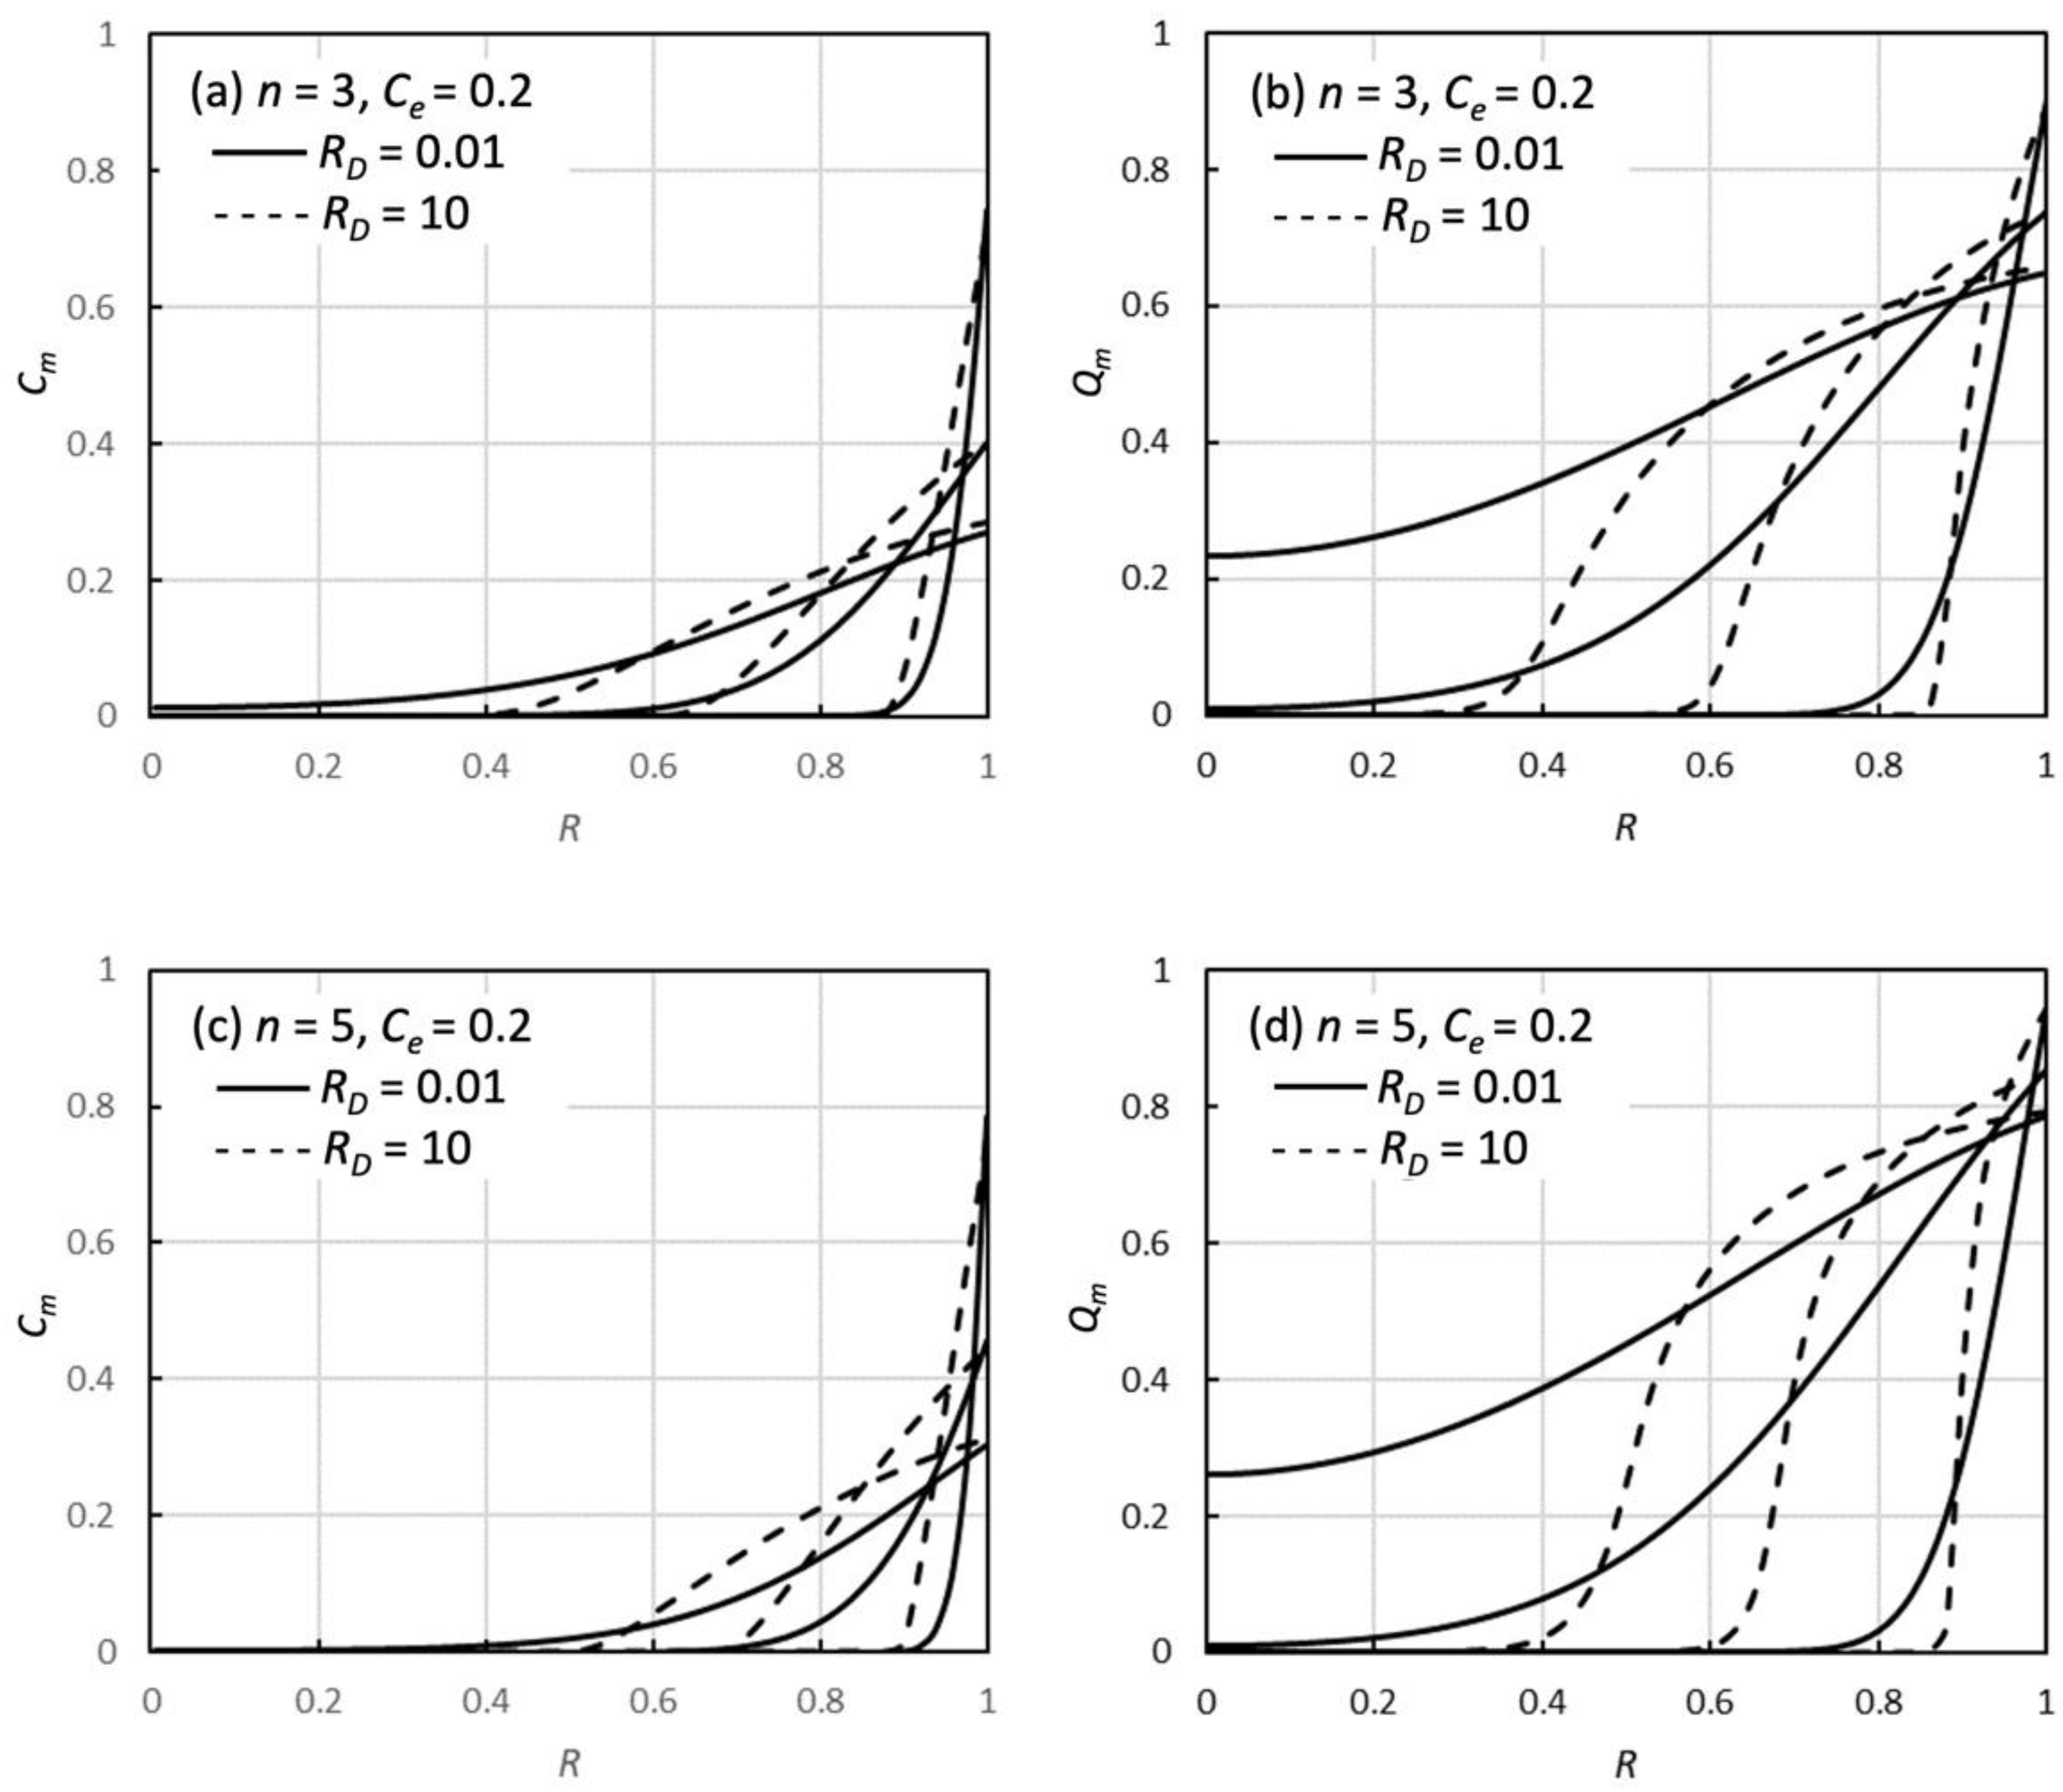
The model simulation of the parallel diffusion model has been reported in the literature, but no study has been reported on the mass distribution in the adsorbents in relation to the contribution of the diffusion mode, despite the importance of using separation properties to understand the adsorbents. The distributions in the spherical adsorbent are shown in Figure 2a–d for some specific cases with different diffusion modes. The intraparticle distributions of the adsorbate in the pore (Cm) and the solid (Qm) differ significantly depending on the RD value. As seen in these figures, the adsorption profiles changed significantly from a gentle to a sharp distribution with a steep adsorption front depending on the RD value. This is attributed to the difference in transfer resistance between the pores and the adsorbent surface. In the large RD system, adsorption profiles with a steep adsorption front appear because of the large surface diffusion resistance, as shown in Figure 2b,d. In contrast, the small RD system results in an adsorption profile penetrating deep inside the adsorbent because of the faster surface diffusion.
Figure 3 shows some examples of the concentration decay curves in the CMBR in the cases of RD = 0.01 (n = 3, 5) and 10 (n = 3, 5). Faster transport through pore diffusion in the case of a large RD results in a rapid concentration decay. A smaller RD system results in a slow concentration decay with long tailing. The total adsorbate flux in the adsorbent decreases with an increase in the n value due to the increase in adsorption and slow surface diffusion, and thus the decay becomes slow with the increase in the n value.

3.2. Determination of the Time Ratio T0.2/T0.8 from Concentration Decay Curves

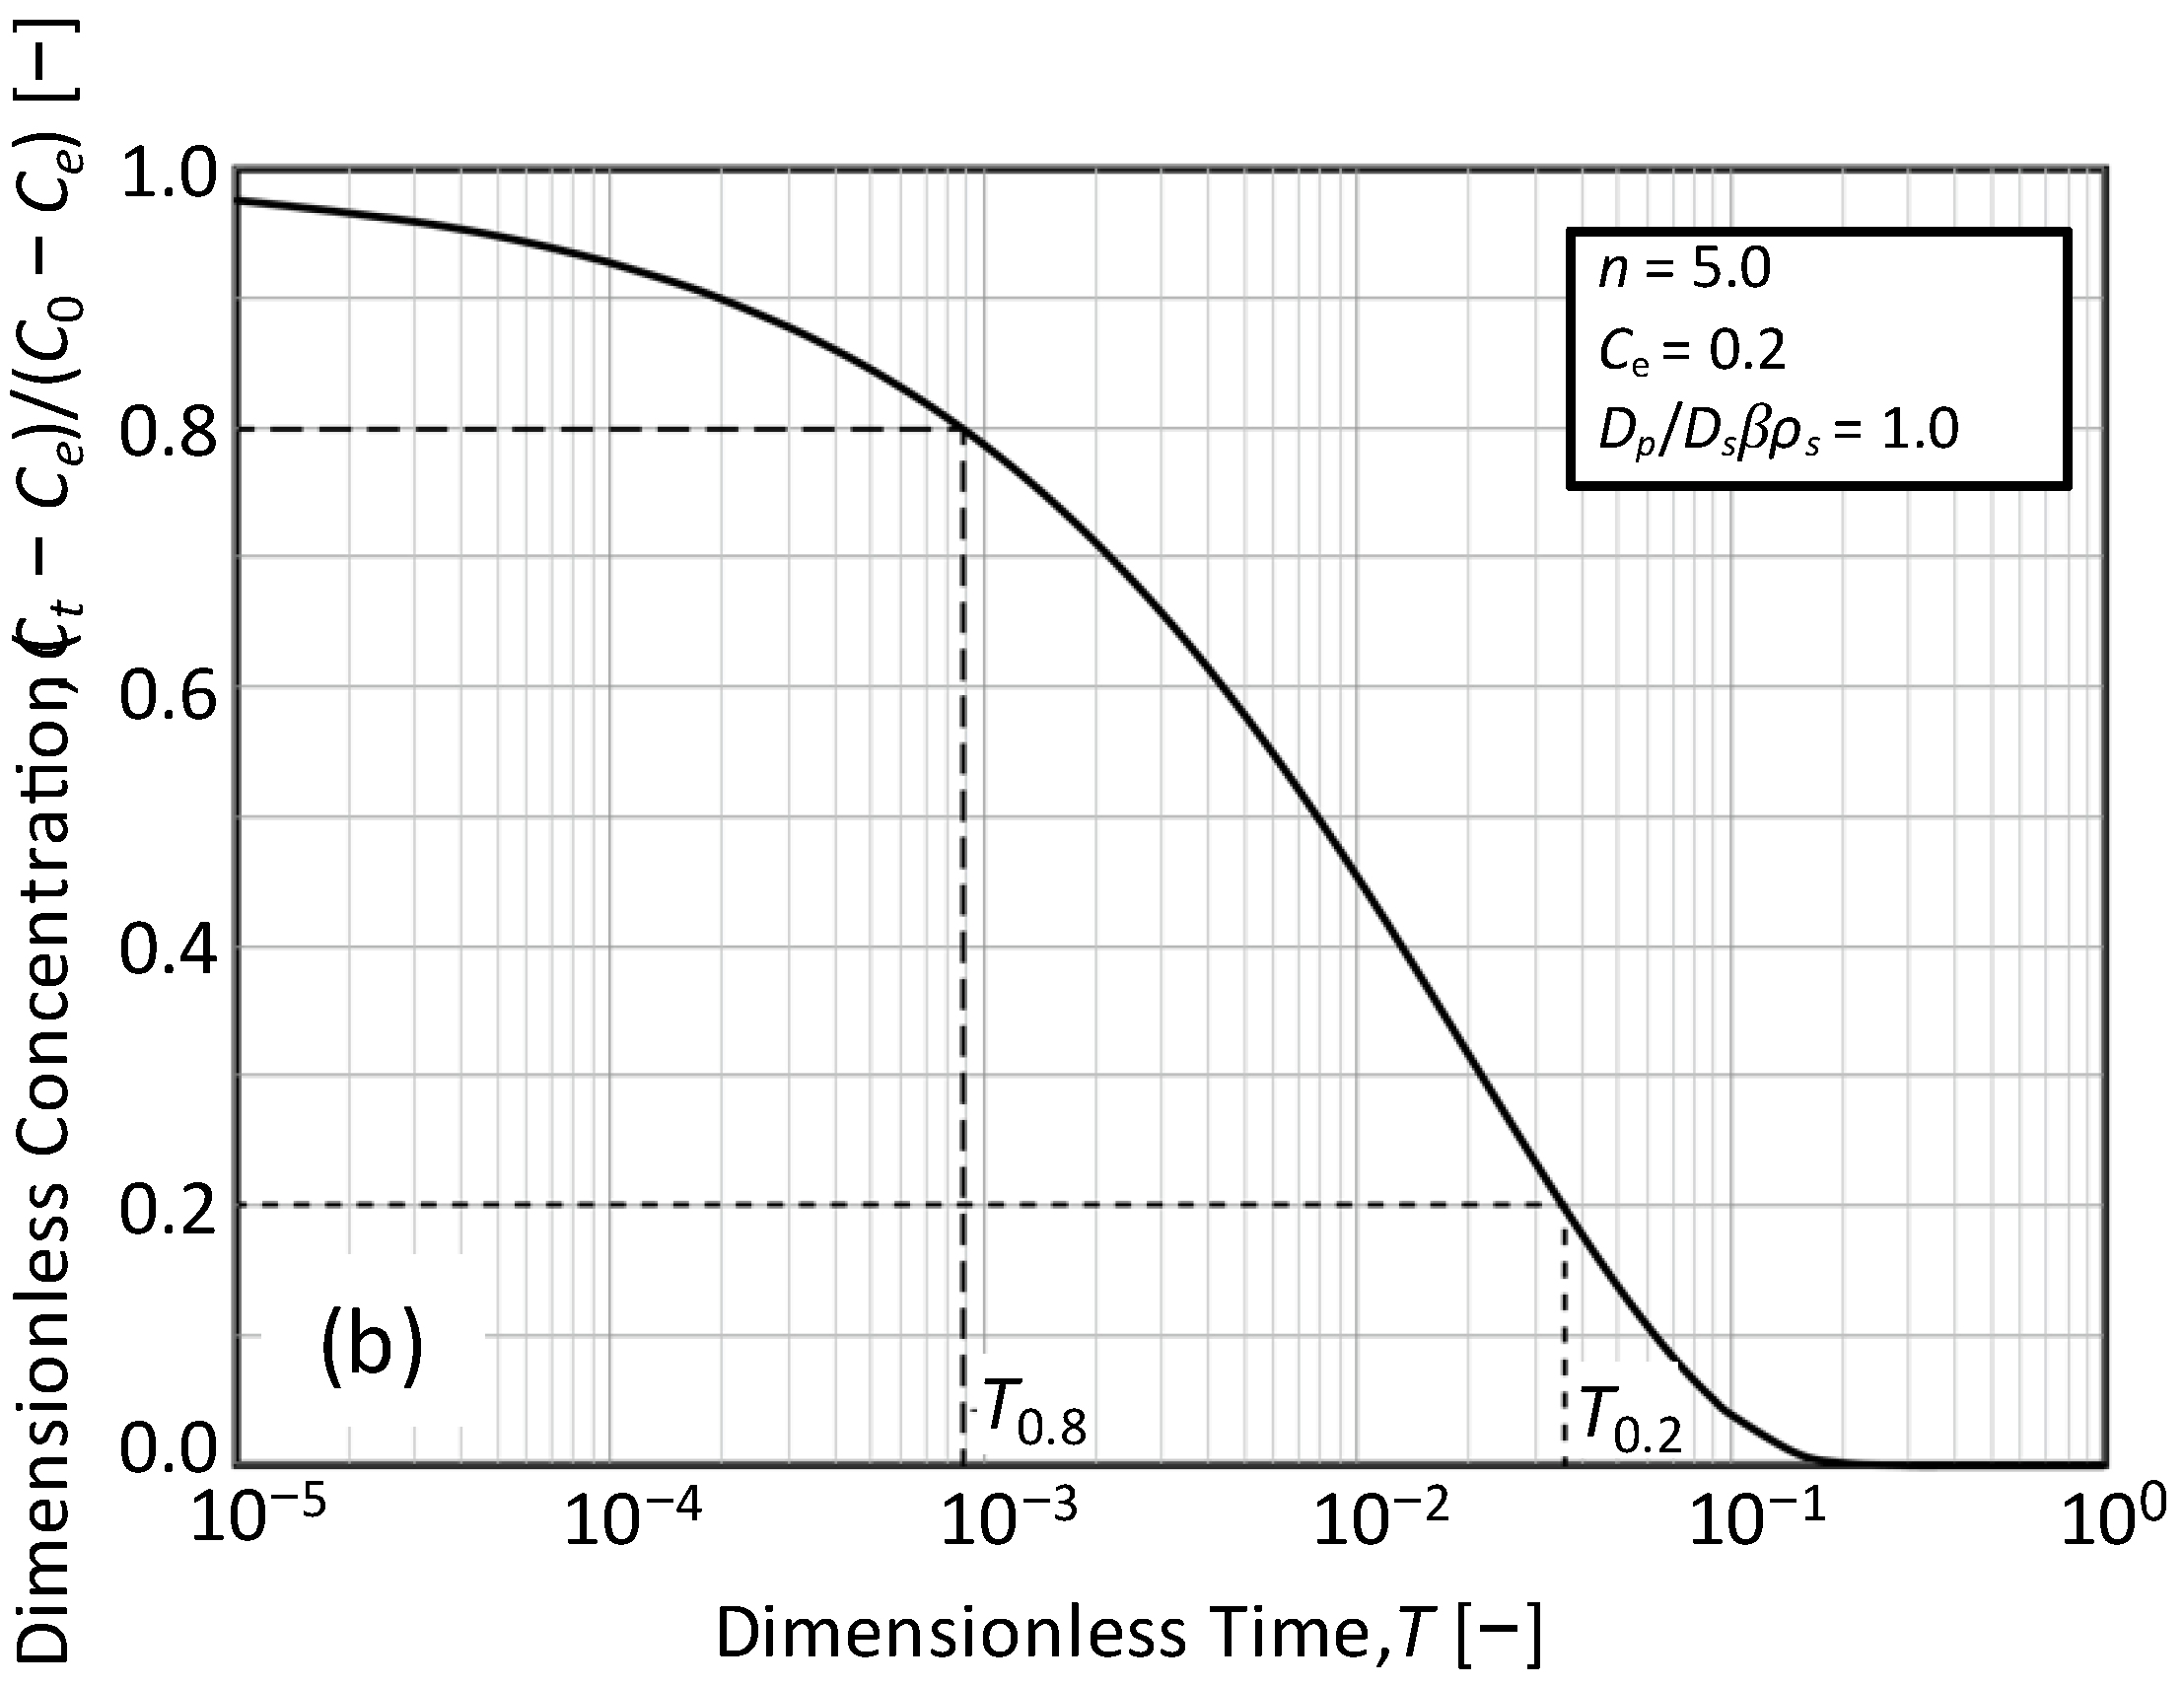
The pore and surface diffusivities in the parallel diffusion model were determined from a single concentration decay curve using the following procedure, in principle, with the simultaneous determination of the intraparticle diffusivity and fluid-to-solid mass transfer coefficient. First, dimensionless concentration decay curves were obtained from the model simulation. The concentration decay curve Ct vs. T graph was plotted, as shown in Figure 4a. Then, the vertical axis of the concentration decay curve was transformed into a new normalized variable, (CtCe)/(C0Ce). Irrespective of the experimental conditions, the values of the numerical concentration decay curve (NCDC) can be expressed between zero and unity by transforming the data (Figure 4b). The values of T0.8 and T0.2 are defined by reading the decay curve at (CtCe)/(C0Ce) = 0.8 and 0.2, respectively, as shown in Figure 4b.

3.3. Relationship between T0.2/T0.8 and RD

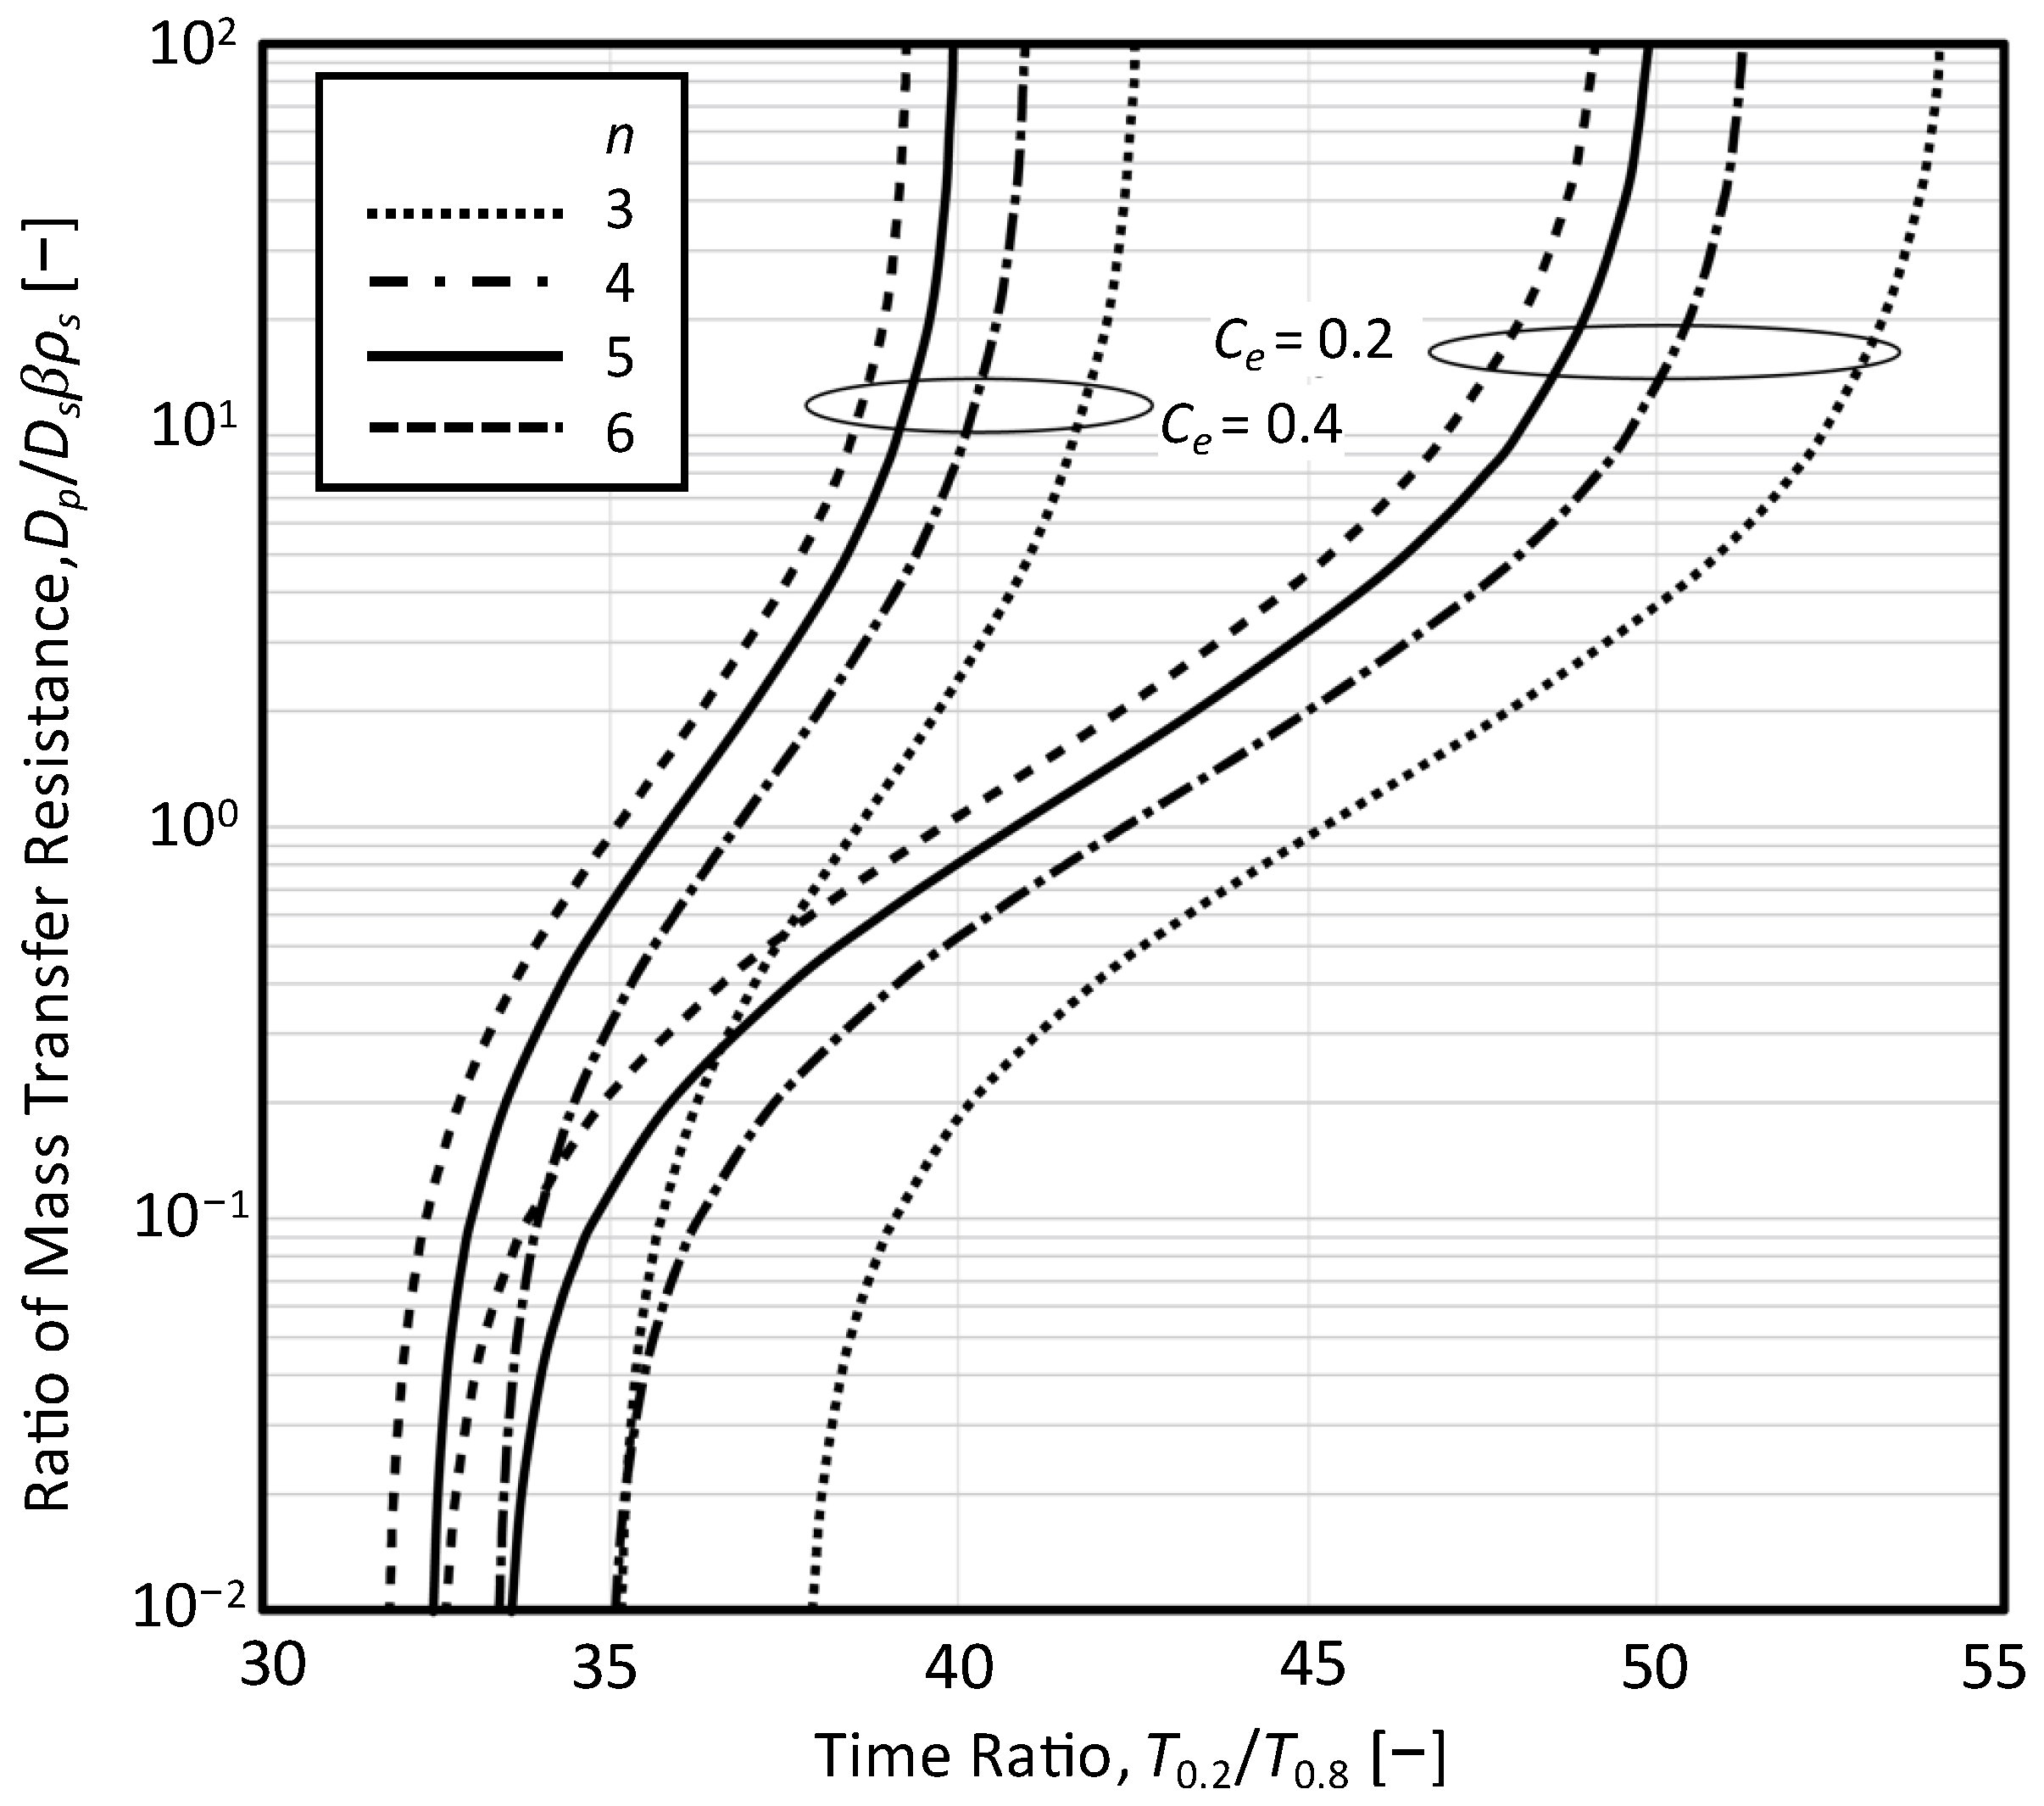
From the values of T0.8 and T0.2, which were used as an index of the concentration variation range of the NCDC, the T0.2/T0.8 value was determined. Thus, concentration decay curves were characterized using the dimensionless time ratio T0.2/T0.8. The NCDCs under various RD values were calculated for the series of n and c0, and the relationship curve between T0.2/T0.8 and RD values was obtained (Figure 5). The RD value was obtained using the relationship shown in Figure 5 by comparing the numerical calculation results with the T0.2/T0.8 value determined experimentally by the CMBR method. This relationship also means that the value of T0.2/T0.8 depends on the diffusion coefficient in the phase with a larger adsorbate distribution. It can be seen from Figure 5 that the smaller the value of Ce, the more accurate the diffusion coefficient. For a more accurate determination of the pore and surface diffusivities, the RD = Dp/Dsβρs values should be between 0.1 and 10. The procedure for using the experimental values is described as follows.

3.4. Determination Procedure with Experimental Data

Step 1. Determination of T0.2/T0.8
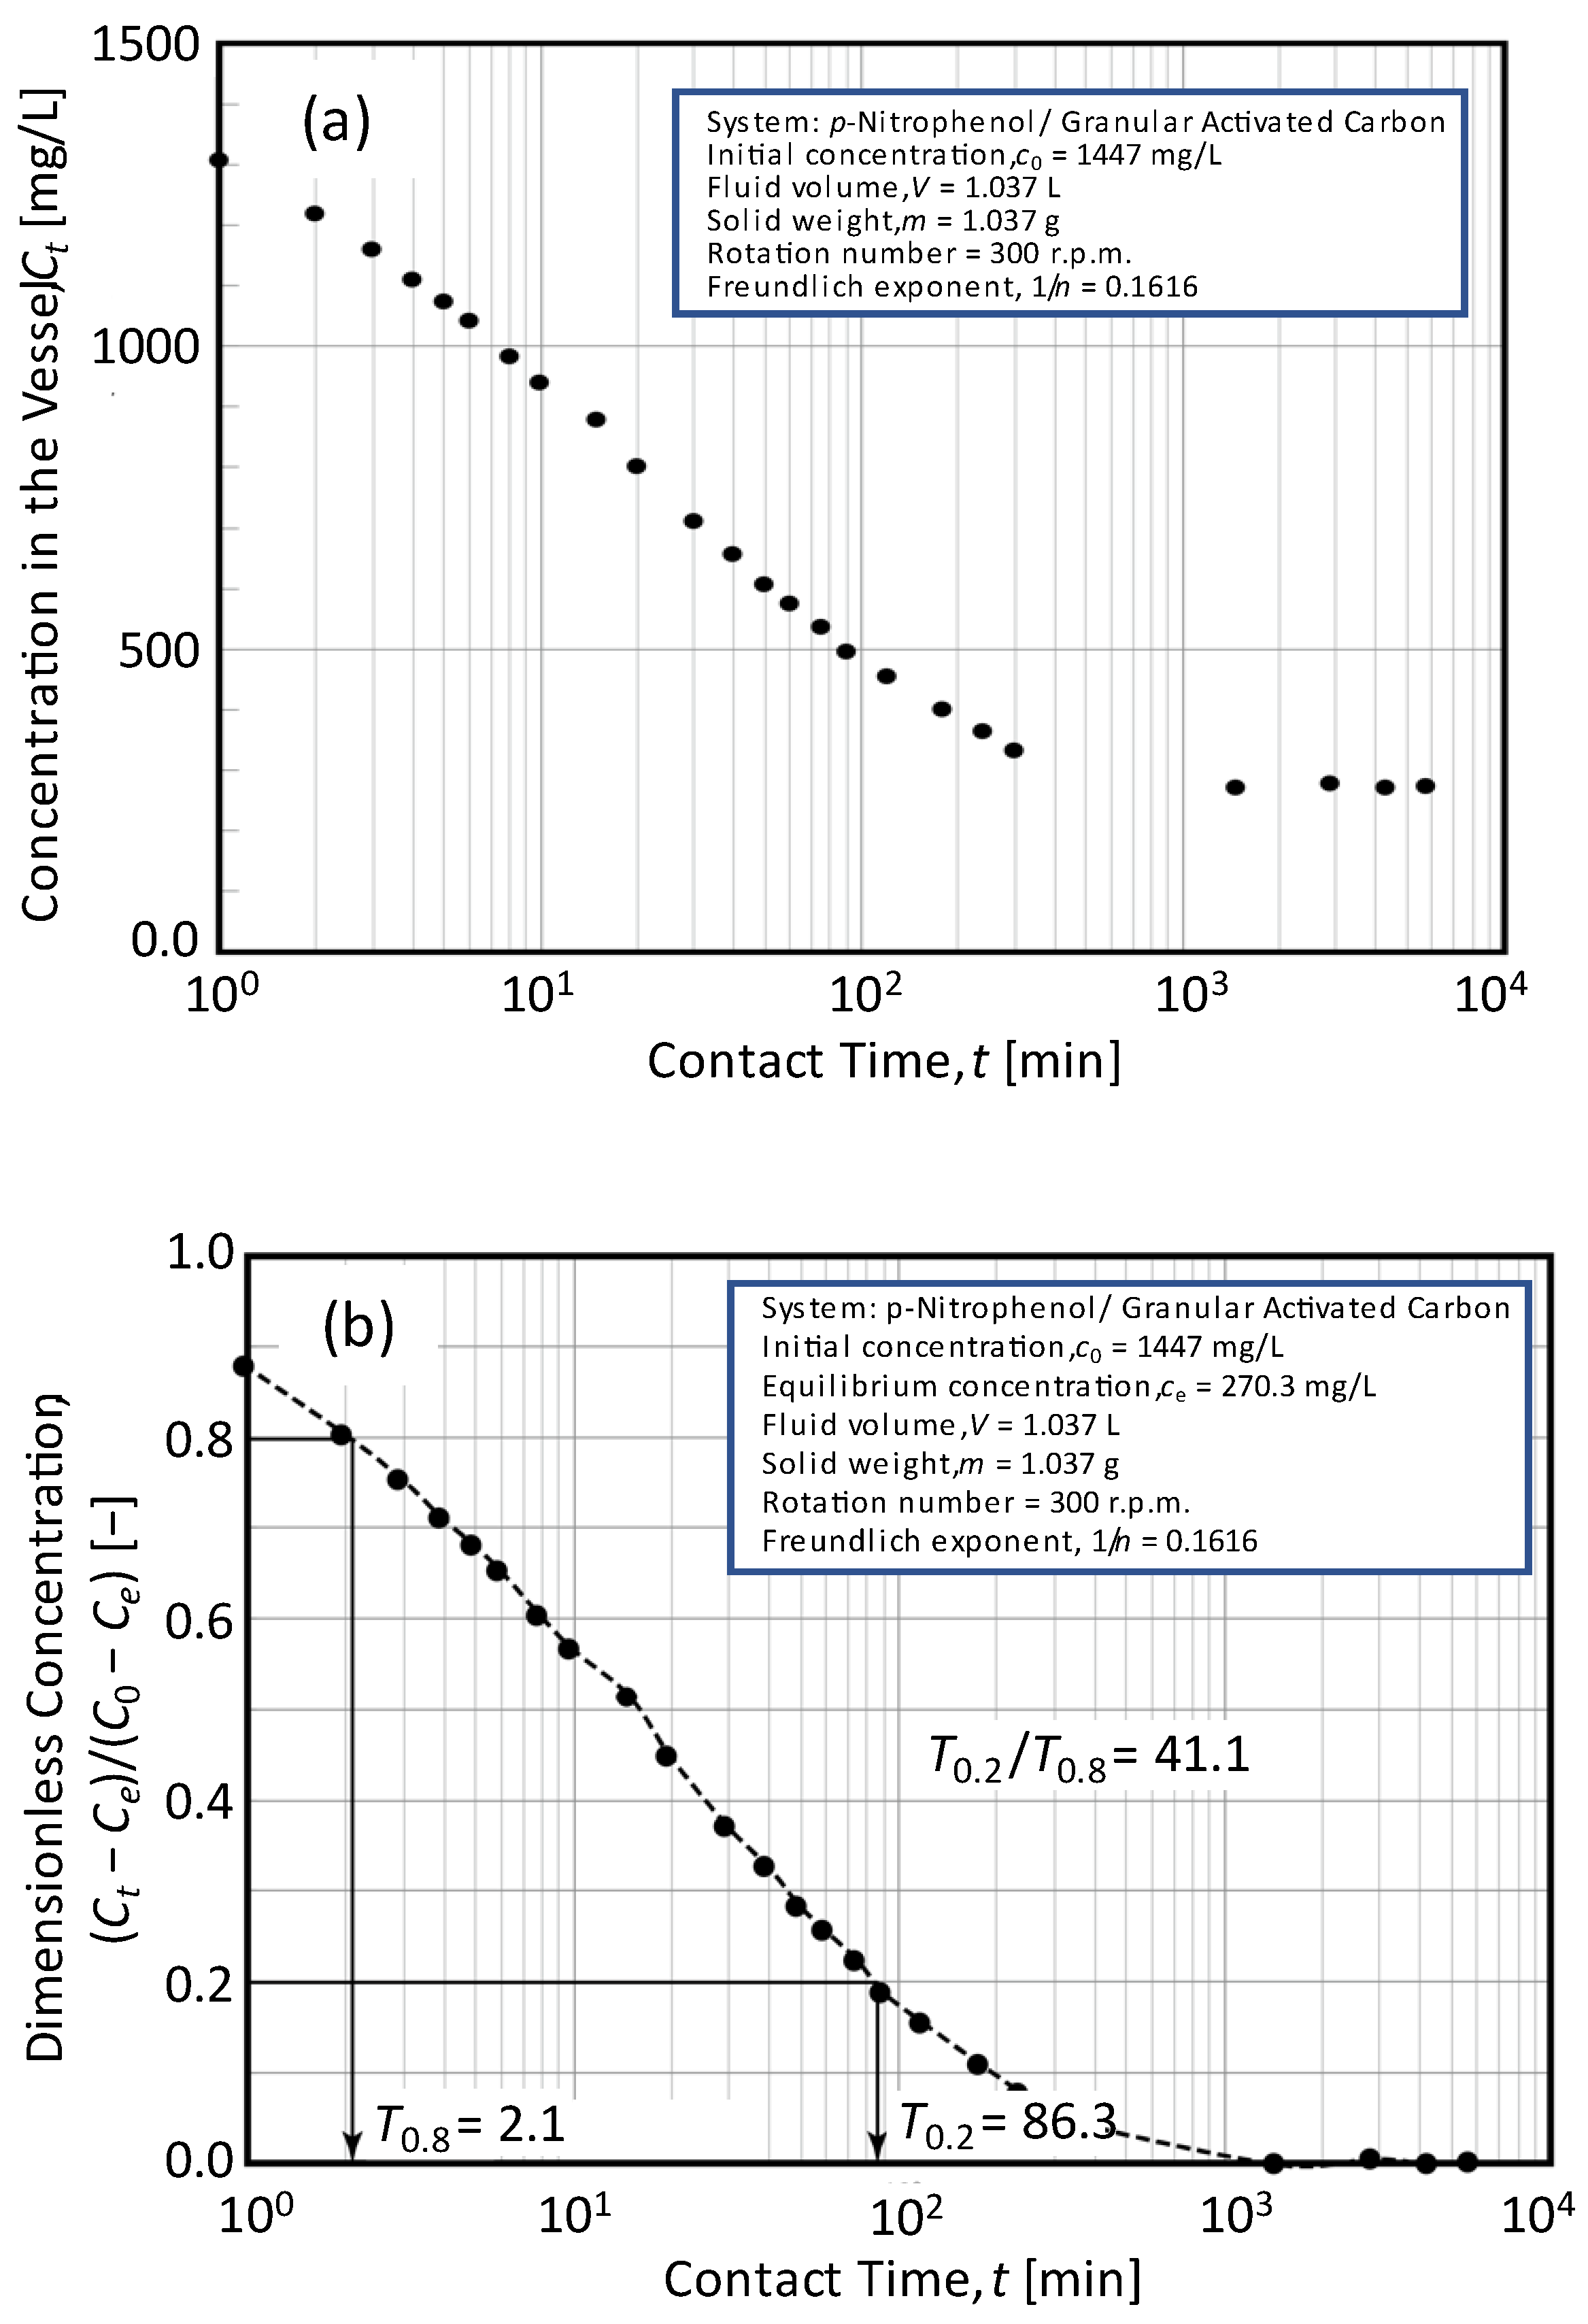
The experimental CMBR data obtained using p-nitrophenol as the adsorbate and granular activated carbon as the adsorbent were examined with a simple approach to determining the kinetic parameters in the parallel diffusion model from a single concentration decay curve. Experimental method details for the CMBR method are provided elsewhere [8]. Some details of the experimental conditions of the CMBR method are shown inside the squares in Figure 6 and Figure 7. The concentration decay data of the adsorption system (c0 = 1447 mg/L, n = 6.2, V = 1 L, m = 1 g, /V = 1.0) under negligible film mass transfer resistance conditions, which are reproducible and reliable from an experimental point of view, were used in this study. The experimentally obtained concentration decay curve is shown in Figure 6a, and the dimensional equilibrium concentration ce was determined from the decay curve. The dimensionless equilibrium concentration in the CMBR vessel was obtained as ce/c0 = 0.188 for the system under study. Figure 6b shows a plot of (CtCe)/(C0Ce) as the vertical axis. The values of T0.8 and T0.2 are given in Figure 6b, and it was found to be 41.1.
Step 2. Confirmation of intraparticle diffusion-limited adsorption
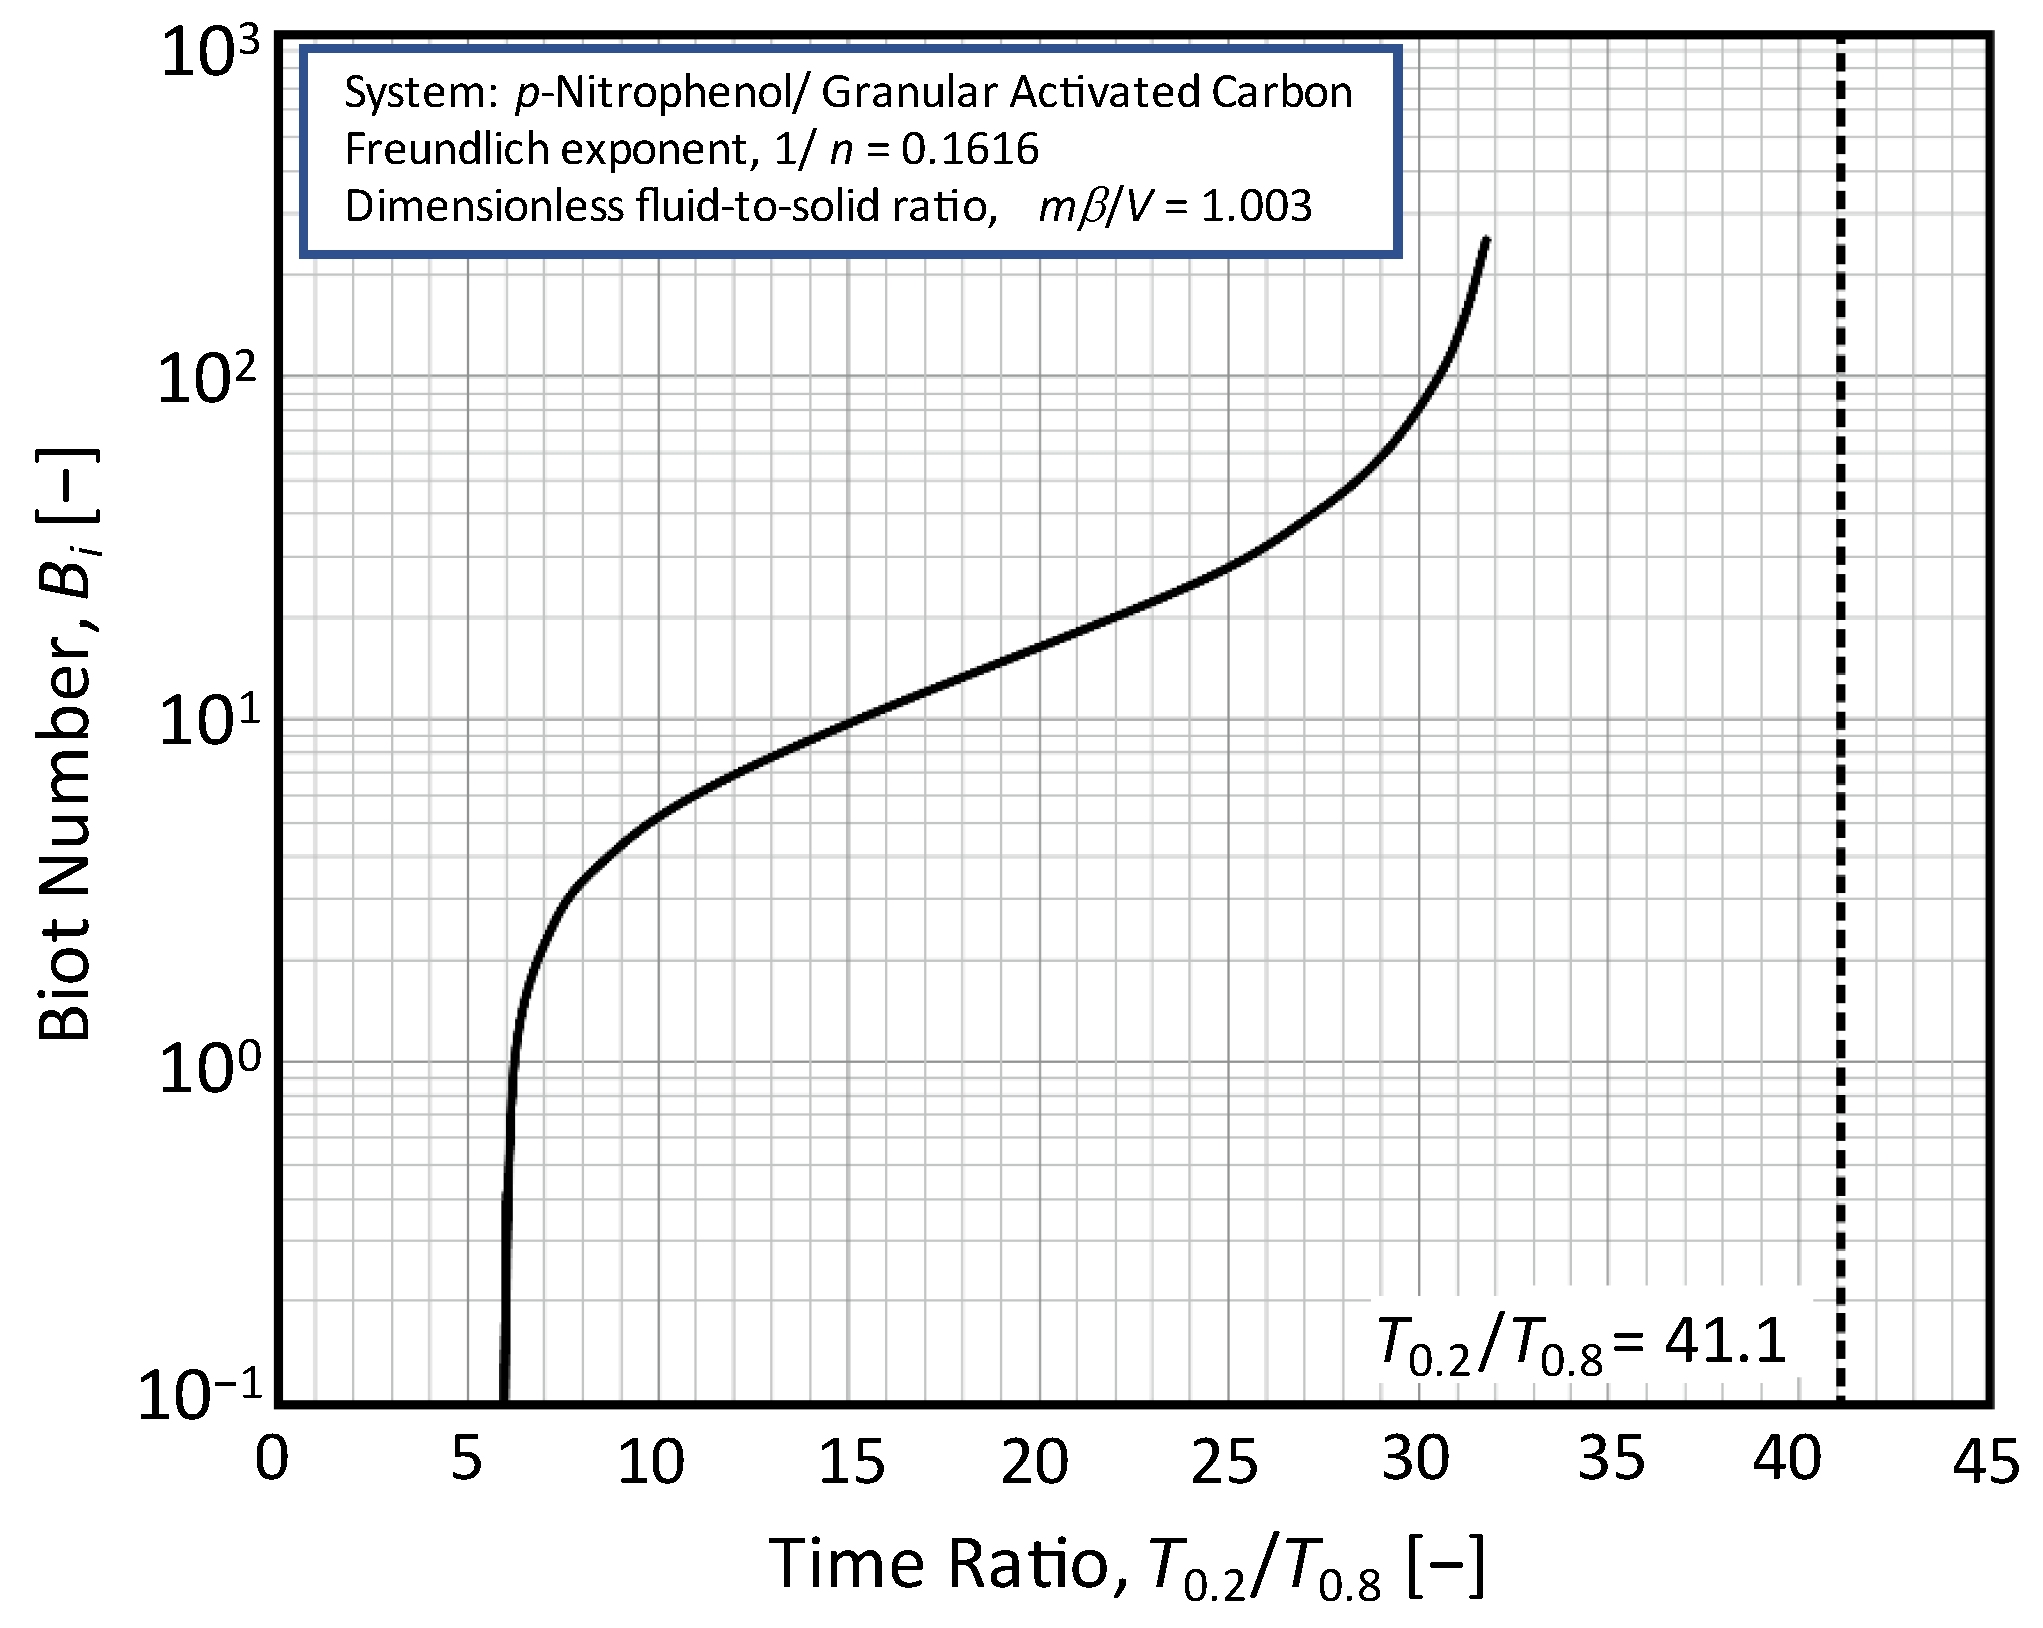
The Freundlich exponent, 1/n, and dimensionless fluid-to-solid ratio, V/, can be calculated from the experimental conditions and the relationship of the adsorption equilibrium. The concentration decay curves (NCDCs) in the CMBR were estimated by numerical calculations based on the model with fluid film and intraparticle diffusion transfer resistances. For obtaining a series of Biot numbers, the experimental values of 1/n and V/ were used. Figure 7 shows an illustration of the relationship between Biot numbers and T0.2/T0.8 values based on the NCDCs. The rate-limiting process in the system under consideration can be calculated from the T0.2/T0.8 value (=41.1) obtained from the experimental NCDC (dotted line in Figure 7). As seen in Figure 7, the mass transfer resistance in the fluid-to-solid film is negligible because of the very large Biot number condition of the adsorption experiment at T0.2/T0.8 = 41.1. This step can be skipped when the film transfer is not obviously rate-limiting in the adsorption process. Nonetheless, this step is effective to ensure that the decay curve (adsorption data) is obtained under appropriate conditions for estimating the intraparticle diffusion coefficient, and the estimated diffusion coefficient is reliable.
Step 3. Determination of RD
The NCDCs are calculated numerically using the experimentally obtained values of 1/n and V/ for a series of RD (=Dp/Dsβρs) using the parallel diffusion model. The T0.2/T0.8 value was determined for each NCDC to obtain the relationship between RD and T0.2/T0.8. The relationship between RD and T0.2/T0.8 is shown in Figure 8, along with the T0.2/T0.8 value determined from the experiment. The value of RD in the experimental system was found to be 1.75.
Step 4. Determination of Ds and Dp
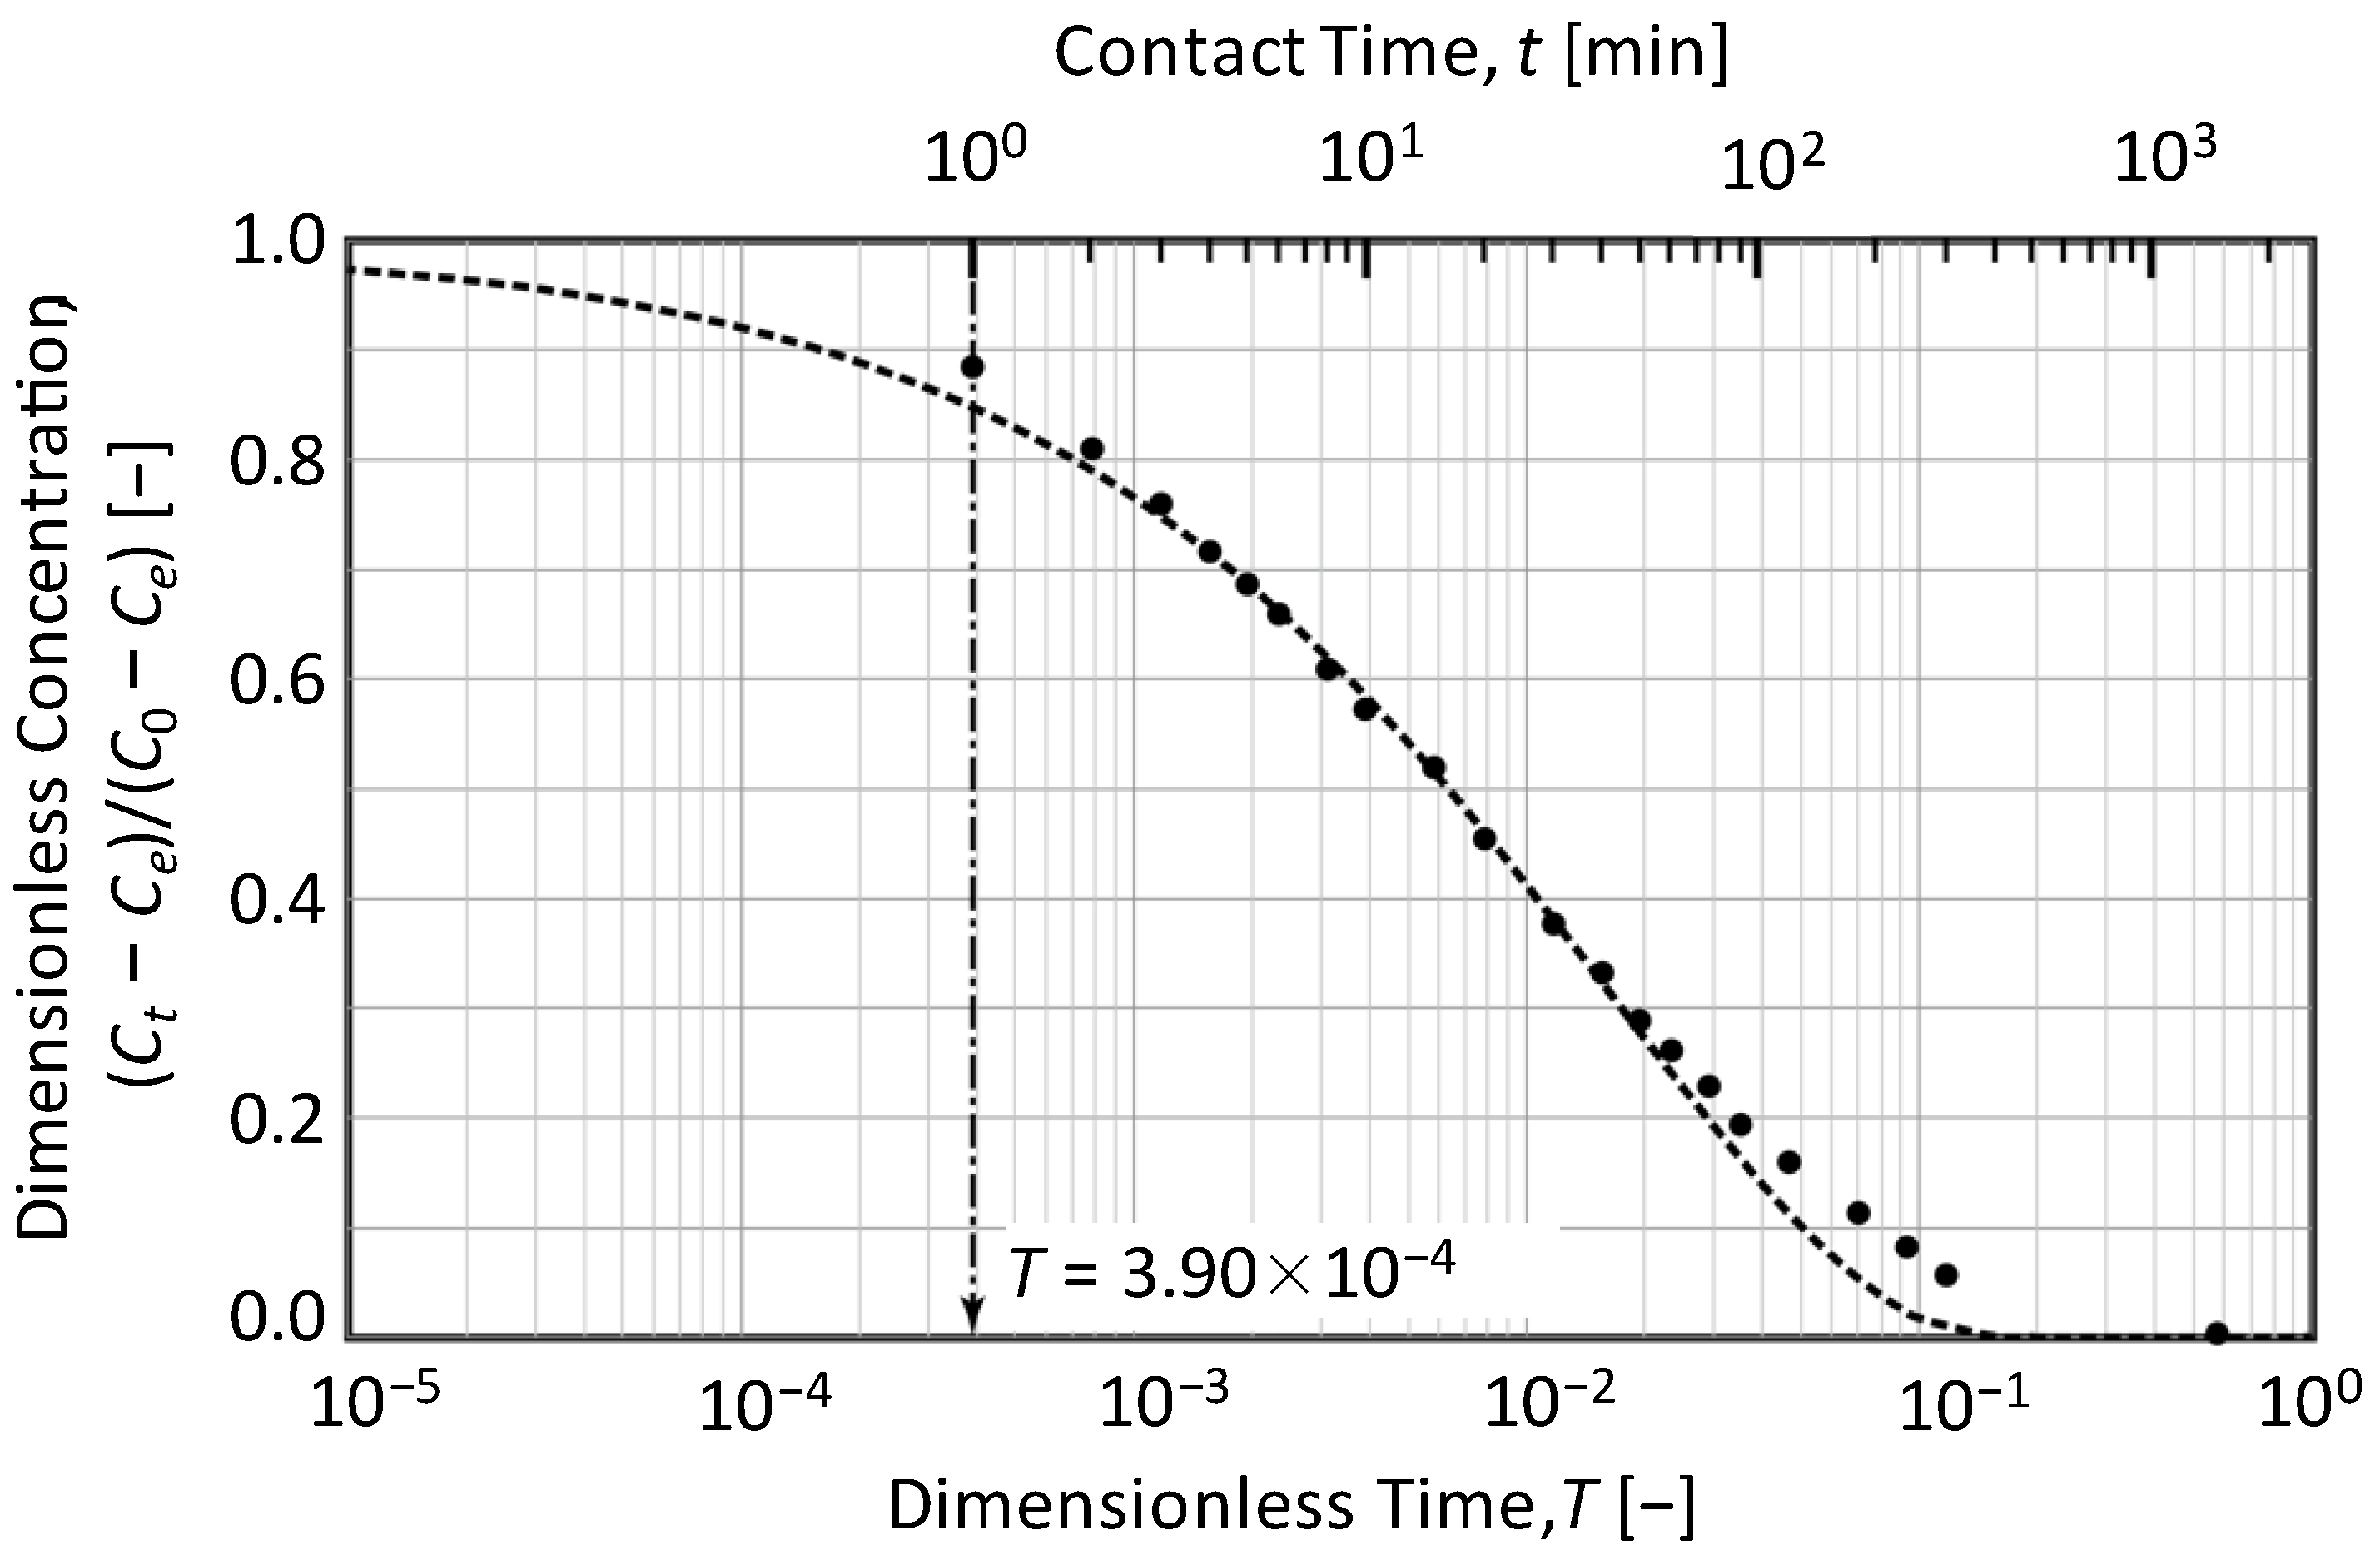
The NCDC was recalculated using the parallel diffusion model with the known and determined parameters of 1/n = 0.1616, V/ = 1.003, and RD = Dp/Dsβρs = 1.75. The obtained NCDC values were compared with the experimental data, as shown in Figure 9. Then, the time ratio (T/t) of 3.9 × 10⁻⁴ min−1 was obtained (Figure 9). The value of Ds was estimated using Equation (14), based on the definition of the dimensionless variable T. Constant 60 is included in the equation for the conversion of time units from minutes to seconds.
D s = 60 ( T t ) r p 2 = 60 ( 3.9 × 10 4 ) ( 0.03575 ) 2 = 8.31 × 10 9   cm 2 / s
The value of Dp can be obtained from the RD and Ds values, as shown in Equation (15).
D p = R D D s β ρ s = ( 3.9 × 10 4 ) ( 8.31 × 10 9 ) ( 0.3474 ) ( 484 ) = 1.40 × 10 6 cm 2 / s
where β = q0/c0 = kc01/n/c0 [L/g], and ρs [g/L] denotes the apparent solid density.
The ratio of pore diffusivity (Dp) to molecular diffusivity (DAB) is independent of the adsorption system and depends on the adsorbate used [1]. Wilke and Chan’s equation [31] was used to estimate the molecular diffusivity. For p-nitrophenol at 293.2 K, the value was 6.85 × 10⁻⁶, and the value of Dp/DAB was calculated to be 0.204. This value is similar to that of 0.22 reported by Furuya [8]. The efficiency of this method for determining the kinetic parameters in the parallel diffusion model was validated.

3.5. Summary of the Determination Procedure

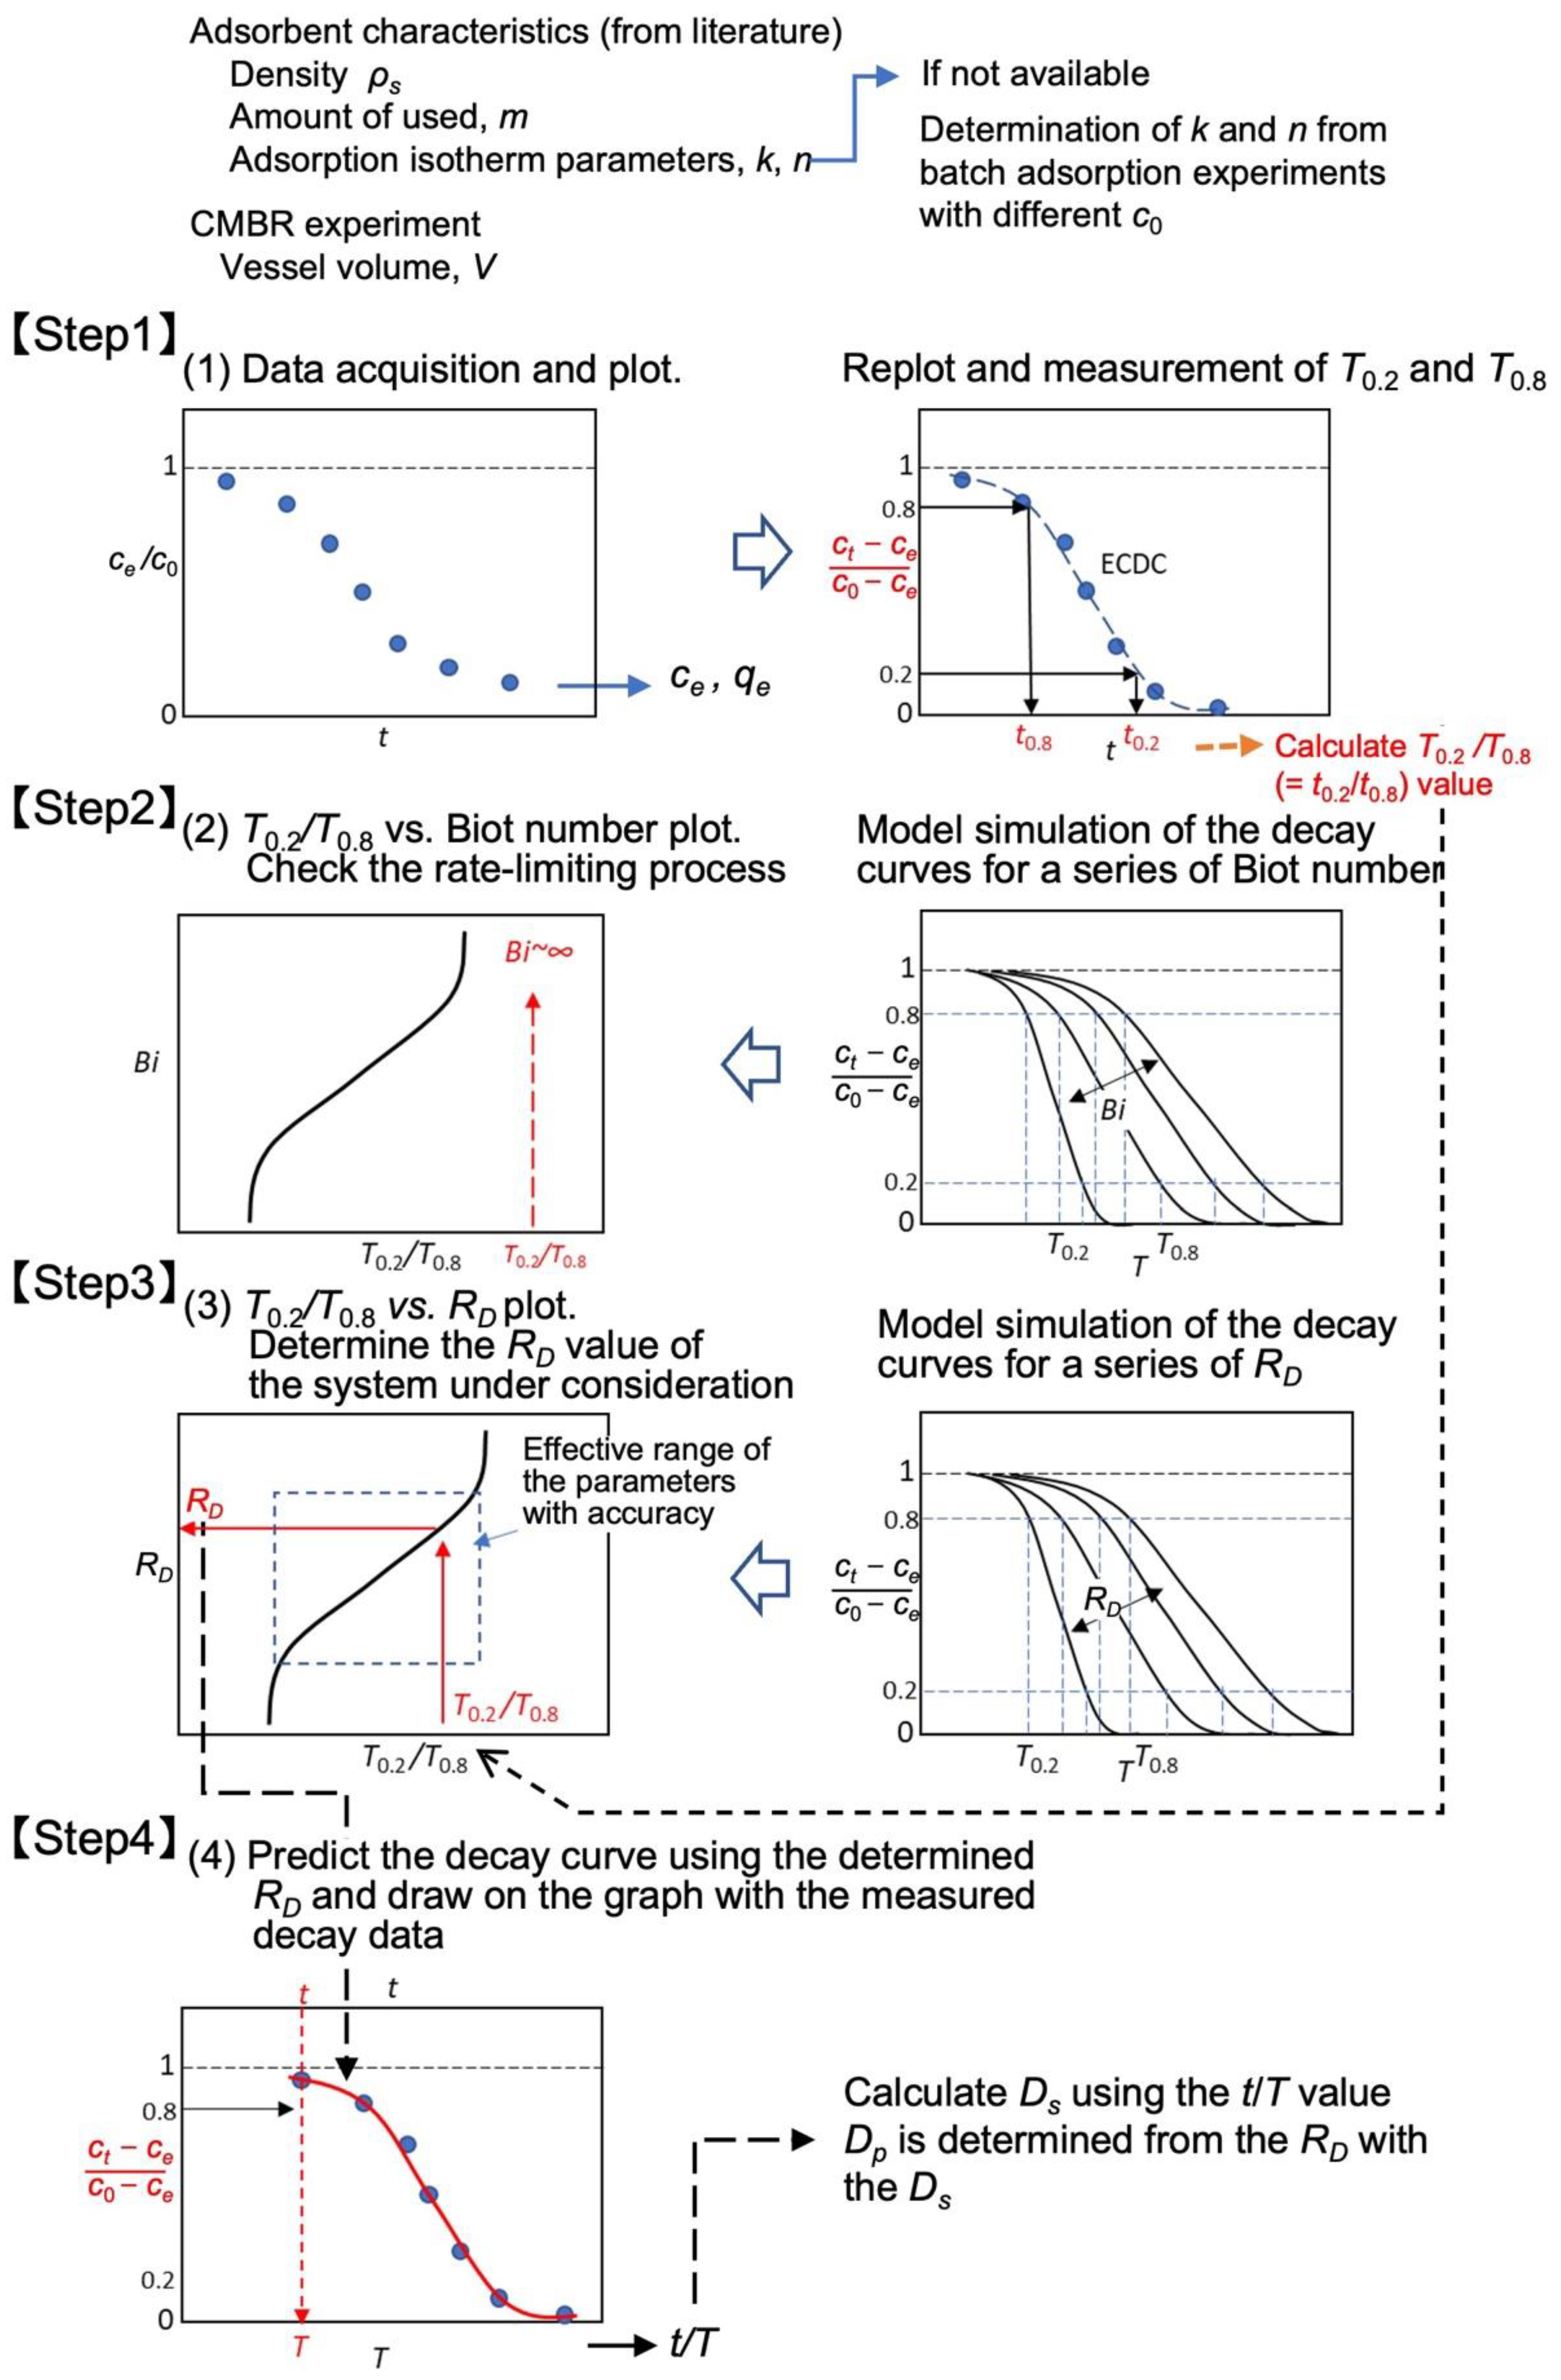
The overall procedure for determining the kinetic parameters in the parallel diffusion model is shown in Figure 10. The graphs of RD vs. T0.2/T0.8 and Biot number vs. T0.2/T0.8, as shown in Figure 5 and Figure 7, respectively, can be prepared in advance for the conditions used in practice. The kinetic parameters examined in this study can be determined simply using graphs with a few batch adsorption experiments.

4. Conclusions

In liquid-phase adsorption, the mass transfer within porous solids is dominated by pore and surface diffusion. Because these diffusions occur in parallel, the mechanism with low diffusion resistance is more dominant. In this study, the parallel diffusion model, a simple method for obtaining pore and surface diffusivity from one experimental concentration decay curve, was examined using the CMBR technique. It was confirmed that both diffusion coefficients can be obtained from one concentration decay curve when the reactor’s concentration change is sufficiently large and the fluid-to-solid mass transfer resistance is negligible.
Using the proposed method, real sample data were analyzed, and the validity of the calculated diffusivities was discussed. The ratio of pore diffusivity to effective molecular diffusivity was estimated using Chan’s equation. The obtained value of 0.204 was comparable to the previously obtained results by other scholars.
Because the parallel diffusion model was used in this study, the diffusion mechanism with a smaller mass transfer resistance dominated the overall intraparticle diffusion. Therefore, the surface diffusion controlling model must be used when the RD value is less than 0.1, and the pore diffusion controlling model should be applied when the RD value is greater than 10.

Author Contributions

Conceptualization, E.F. and Y.S.; methodology, E.F. and Y.S.; software, E.F.; validation, Y.S., N.S. and K.E.N.; formal analysis, Y.S. and E.F.; investigation, Y.S. and E.F.; resources, E.F.; data curation, E.F. and Y.S.; writing—original draft preparation, Y.S.; writing—review and editing, Y.S.; visualization, E.F. and Y.S.; supervision, Y.S. and E.F.; project administration, E.F.; funding acquisition, E.F. All authors have read and agreed to the published version of the manuscript.

Funding

This work was supported by JSPS KAKENHI Grant Number 22K12416.

Data Availability Statement

Experimentally obtained data are presented in this study.

Conflicts of Interest

The authors declare no conflict of interest.

Nomenclature

ap:Surface area based on solid particle[cm2/cm3]
Bi:Biot number = kfrp/(Dsβρs)[-]
ce:Equilibrium concentration at time = infinity[mg/L]
cs:Fluid concentration at r = rp[mg/L]
ct:Concentration within the vessel at time t[mg/L]
c0:Concentration within the vessel at time = 0[mg/L]
Cm:Dimensionless concentration[-]
Dp:Pore diffusivity[cm2/s]
Ds:Surface diffusivity[cm2/s]
kf:Fluid film mass transfer coefficient[cm/s]
m:Weight of adsorbent[g]
1/n:Freundlich exponent[-]
qe:Amount adsorbed in equilibrium with ce[mg/g]
qt:Average amount adsorbed within the adsorbent at time t[mg/g]
q0:Amount adsorbed at equilibrium with fluid concentration c0[mg/g]
Qm:Dimensionless amount of adsorption[-]
r:Internal radial length (length from the solid center)[cm]
rp:Particle radius[cm]
RD:Ratio of diffusion resistance = Dp/(Dsβρs)[-]
t:Time[min]
V:Volume of the vessel[L]
β:q0/c0[L/g]
ε:Porosity[-]

References

  1. Takeuchi, Y. Chemical Engineers Handbook, 5th ed.; Maruzen: Tokyo, Japan, 1988; pp. 595–598. [Google Scholar]
  2. Bhatnagar, A.; Jain, A.K. A comparative adsorption study with different industrial wastes as adsorbents for the removal of cationic dyes from water. J. Colloid Interf. Sci. 2005, 281, 49–55. [Google Scholar] [CrossRef]
  3. Ip, A.W.; Barford, J.P.; McKay, G. A comparative study on the kinetics and mechanisms of removal of reactive black 5 by adsorption onto activated carbons and bone char. Chem. Eng. J. 2010, 157, 434–442. [Google Scholar] [CrossRef]
  4. Derylo-Marczewska, A.; Blachnio, M.; Marczewski, A.W.; Seczkowska, M.; Tarasiuk, B. Phenoxyacid pesticide adsorption on activated carbon—Equilibrium and kinetics. Chemosphere 2019, 214, 349–360. [Google Scholar] [CrossRef]
  5. Bosacka, A.; Zienkiewicz-Strzałka, M.; Wasilewska, M.; Deryło-Marczewska, A.; Podkościelna, B. Physicochemical and adsorption characteristics of divinylbenzene-co-triethoxyvinylsilane microspheres as materials for the removal of organic compounds. Molecules 2021, 26, 2396. [Google Scholar] [CrossRef]
  6. Wasilewska, M.; Marczewski, A.W.; Deryło-Marczewska, A.; Sternik, D. Nitrophenols removal from aqueous solutions by activated carbon—Temperature effect of adsorption kinetics and equilibrium. J. Environ. Chem. Eng. 2021, 9, 105459. [Google Scholar] [CrossRef]
  7. Wasilewska, M.; Deryło-Marczewska, A. Adsorption of non-steroidal anti-inflammatory drugs on alginate-carbon composites— equilibrium and kinetics. Materials 2022, 15, 6049. [Google Scholar] [CrossRef]
  8. Furuya, E.G.; Chang, H.T.; Miura, Y.; Yokomura, H.; Tajima, S.; Yamashita, S.; Noll, K.E. Intraparticle mass transport mechanism in activated carbon adsorption of phenols. J. Environ. Eng. 1996, 122, 909–916. [Google Scholar] [CrossRef]
  9. Kannan, P.; Pal, P.; Banat, F. Design of adsorption column for reclamation of methyldiethanolamine using homogeneous surface diffusion model. Oil Gas Sci. Technol. Rev. IFP Energ. Nouv. 2020, 75, 1–12. [Google Scholar] [CrossRef]
  10. Eder, S.; Müller, K.; Azzari, P.; Arcifa, A.; Peydayesh, M.; Nyström, L. Mass transfer mechanism and equilibrium modelling of hydroxytyrosol Adsorption on Olive Pit–Derived Activated Carbon. Chem. Eng. J. 2021, 404, 126519. [Google Scholar] [CrossRef]
  11. Kavand, M.; Fakoor, E.; Mahzoon, S.; Soleimani, M. An improved film–pore–surface diffusion model in the fixed-bed column adsorption for heavy metal ions: Single and multi-component systems. Process Saf. Environ. Prot. 2018, 113, 330–342. [Google Scholar] [CrossRef]
  12. Ocampo-Pérez, R.; Leyva-Ramos, R.; Padilla-Ortega, E. Equilibrium and kinetic adsorption of organic compounds onto organo bentonite: Application of a surface diffusion model. Adsorpt. Sci. Technol. 2011, 29, 1007–1024. [Google Scholar] [CrossRef]
  13. Medveď, I.; Černý, R. Surface diffusion in porous media: A critical review. Micropor. Mesopor. Mater. 2011, 142, 405–422. [Google Scholar] [CrossRef]
  14. Ma, Z.; Whitley, R.D.; Wang, N.-H.L. Pore and surface diffusion in multicomponent adsorption and liquid chromatography systems. AIChE J. 1996, 42, 1244–1262. [Google Scholar] [CrossRef]
  15. Rosen, J.B. Kinetics of a fixed bed system for solid diffusion into spherical particles. J. Chem. Phys. 1952, 20, 387–394. [Google Scholar] [CrossRef]
  16. Kavand, M.; Asasian, N.; Soleimani, M.; Kaghazchi, T.; Bardestani, R. Film-pore-[concentration-dependent] surface diffusion model for heavy metal ions adsorption: Single and multi-component systems. Process Saf. Environ. Prot. 2017, 107, 486–497. [Google Scholar] [CrossRef]
  17. Ma, A.; Abushaikha, A.; Allen, S.J.; McKay, G. Ion exchange homogeneous surface diffusion modelling by binary site resin for the removal of nickel ions from wastewater in fixed beds. Chem. Eng. J. 2019, 358, 1–10. [Google Scholar] [CrossRef]
  18. Souza, P.R.; Dotto, G.L.; Salau, N.P.G. Detailed numerical solution of pore volume and surface diffusion model in adsorption systems. Chem. Eng. Res. Des. 2017, 122, 298–307. [Google Scholar] [CrossRef]
  19. Souza, P.R.; Dotto, G.L.; Salau, N.P.G. Statistical evaluation of pore volume and surface diffusion model in adsorption systems. J. Environ. Chem. Eng. 2017, 5, 5293–5297. [Google Scholar] [CrossRef]
  20. Valderrama, C.; Gamisans, X.; de las Heras, X.; Farrán, A.; Cortina, J.L. Sorption kinetics of polycyclic aromatic hydrocarbons removal using granular activated carbon: Intraparticle diffusion coefficients. J. Hazard. Mater. 2008, 157, 386–396. [Google Scholar] [CrossRef]
  21. Saripall, K.P.; Serne, R.J.; Meyer, P.D.; McGrail, B.P. Prediction of diffusion coefficients in porous media using tortuosity factors based on interfacial areas. Ground Water. 2002, 40, 346–352. [Google Scholar] [CrossRef]
  22. Liu, B.J.; Yang, Y.W.; Ren, Q.L. Parallel pore and surface diffusion of levulinic acid in basic polymeric adsorbents. J. Chromatogr. A 2006, 1132, 190–200. [Google Scholar] [CrossRef] [PubMed]
  23. Liu, B.; Zeng, L.; Mao, J.; Ren, Q. Simulation of levulinic acid adsorption in packed beds using parallel pore/surface diffusion model. Chem. Eng. Technol. 2010, 33, 1146–1152. [Google Scholar] [CrossRef]
  24. Yao, C.; Chen, T. A new simplified method for estimating film mass transfer and surface diffusion coefficients from batch adsorption kinetic data. Chem. Eng. J. 2015, 265, 93–99. [Google Scholar] [CrossRef]
  25. Chung, P.-L.; Bugayong, J.G.; Chin, C.Y.; Wang, N.H. A parallel pore and surface diffusion model for predicting the adsorption and elution profiles of lispro insulin and two impurities in gradient-elution reversed phase chromatography. J. Chromatogr. A 2010, 1217, 8103–8120. [Google Scholar] [CrossRef] [PubMed]
  26. Brzić, D.V.; Petkovska, M.T. Nonlinear frequency response analysis as a tool for identification of adsorption kinetics: Case study—Pore-surface diffusion control. Hindawi. Math. Probl. Eng. 2019, 2019, 7932967. [Google Scholar] [CrossRef] [Green Version]
  27. Petkovska, M.; Do, D.D. Nonlinear frequency response of adsorption systems. Chem. Eng. Sci. 1998, 53, 3081–3097. [Google Scholar] [CrossRef]
  28. Costa, E.; Calleja, G.; Marijuan, L. Adsorption of Phenol and p-Nitrophenol on Activated Carbon: Determination of Effective Diffusion Coefficients. Ads. Sci. Tech. 1987, 4, 59–77. [Google Scholar] [CrossRef]
  29. Shao, Y.; Chen, H. Adsorption kinetics of p-nitrophenol (PNP) on coal-based activated carbon: Experimental and simulation. Desalin. Water Treat. 2016, 57, 14496–14505. [Google Scholar] [CrossRef]
  30. Fujiki, J.; Sonetaka, N.; Ko, K.-P.; Furuya, E. Experimental determination of intraparticle diffusivity and fluid film mass transfer coefficient using batch contactors. Chem. Eng. J. 2010, 160, 683–690. [Google Scholar] [CrossRef]
  31. Wilke, C.R.; Chang, P. Correlation of diffusion coefficients in dilute solutions. AIChE J. 1955, 1, 264–270. [Google Scholar] [CrossRef]
Figure 1. Distribution ratio of adsorbate.
Water 14 03629 g001
Figure 2. Distribution of adsorbate in the adsorbent particles. (a) Cm, n = 3, (b) Qm, n = 3, (c) Cm, n = 5, (d) Qm, n = 5. The bold lines indicate the distribution in the case of RD = 0.01 at T = 4 × 10⁻³, 4 × 10⁻² and 1 × 10⁻¹, respectively. The dotted lines indicate the distribution in the case of RD = 10 at T = 4 × 10⁻⁴, 4 × 10⁻³ and 1 × 10⁻².
Water 14 03629 g002
Figure 3. The concentration decay curves simulated by the model under study.
Water 14 03629 g003
Figure 4. Typical numerical concentration decay curve. (a) Dimensionless concentration decay curve simulated based on parallel diffusion model, (b) reduced dimensionless concentration decay curve.
Water 14 03629 g004aWater 14 03629 g004b
Figure 5. Dependency of mass transfer resistance ratio on the time ratio, T0.2/T0.8.
Water 14 03629 g005
Figure 6. Experimental concentration decay curve. (a) Dimensional decay curve, (b) dimensionless decay curve.
Water 14 03629 g006
Figure 7. Determination of experimental Biot number.
Water 14 03629 g007
Figure 8. Relationship between RD and T0.2/T0.8 values.
Water 14 03629 g008
Figure 9. Comparison of the concentration decay curves obtained by the experiment and the numerical calculation of the theoretical model.
Water 14 03629 g009
Figure 10. Determination procedure for the kinetic parameters.
Water 14 03629 g010
Publisher’s Note: MDPI stays neutral with regard to jurisdictional claims in published maps and institutional affiliations.