Article

The Key Parameters Involved in a Rainfall-Triggered Landslide

by
Elisangela do Prado Oliveira
1,2,*,
Andrés Miguel González Acevedo
2,
Virnei Silva Moreira
1,
Vitor Pereira Faro
2,3 and
Alessander Christopher Morales Kormann
2
1
Center for Marine Studies, Pontal do Paraná Campus, Federal University of Paraná, Av. Beira-Mar s/n, Pontal do Paraná 83255-976, Brazil
2
Graduate Program in Civil Engineering PPGEC, Federal University of Paraná, Curitiba 81531-980, Brazil
3
Solution IPD, Curitiba 80610-010, Brazil
*
Author to whom correspondence should be addressed.
Water 2022, 14(21), 3561; https://doi.org/10.3390/w14213561
Submission received: 29 September 2022 / Revised: 27 October 2022 / Accepted: 1 November 2022 / Published: 5 November 2022
(This article belongs to the Special Issue Landslides Induced by Surface and Groundwater)

Abstract

:
In addition to the intensity of precipitation, the different hydraulic and mechanical properties of a soil hill can also be responsible for landslides. More specifically, the same rainfall amount can trigger or not trigger a mass movement depending on its characteristics. This issue represents a great geotechnical hazard in mountainous regions such as Brazil, Italy, South Africa, Japan and Hong Kong. The understanding of each of the key factors involved in a rainfall-triggered landslide can be deepened and also quantified. Thus, this research defines, through a numerical model, which parameters are the key factors involved in slope stability. A homogeneous and unsaturated hill was studied. Its different hydraulic and mechanical properties were varied. Geometry and mechanical parameters were shown to exert the greatest influence on stability. Hydraulic parameters, for the same amount of rain, showed a lower influence. The fitting parameters of the soil–water characteristic curve of the materials had a low impact on stability when compared to other parameters assessed. Our conclusions can help future laboratory and field studies to focus more on the accuracy and confidentiality of the key parameters. The results are also important as they give direction to studies related to precipitation threshold definition.

1. Introduction

Landslides triggered by rainfall represent great geotechnical hazards, and are common in mountainous regions such as Brazil, Italy, South Africa, Japan and Hong Kong [1,2,3]. The infiltration of rainwater into unsaturated soils causes an increase in the piezometric head and, therefore, an increase in positive pore water pressure, decreasing its shear resistance and reducing slope stability, triggering sliding [4,5,6,7,8]. Most models assume the water level increase is the trigger for mass movement; however, some of them still include the advancement of the wetting front as a possible trigger [9,10].
Some authors have implemented models to estimate the critical rainfall conditions for the occurrence of a mass movement in a given region [11,12,13,14,15]. Critical rainfall conditions are defined as boundary conditions from which instability may occur. Thus, rainfall thresholds represent rainfall, soil moisture and suction conditions that, when reached, cause mass movement [16]. The most frequently used methodologies in its elaboration are those of the empirical statistical approach, based on the knowledge of the historical series of landslide records and rainfall events associated with them, and on the statistical treatment of these data [3].
A triggered landslide is predisposed by the lithological, hydrological, morphological, and soil characteristics of a site. Therefore, the development of a physical threshold involves complete information on all these characteristics [16,17].
To formulate a physical threshold, the impact of rainfall on the instability of a slope is established from physical models integrated with hydrological models [18,19,20,21,22,23,24]. Lately, several approaches for developing landslide prediction thresholds have been proposed. These approaches link the precipitation pattern to soil properties and conditions, and hydrological factors [11,14,25,26,27].
Reference [28] have recommended that rainfall thresholds be set using methodologies that have a more hydrological approach, i.e., those that include the slope water balance and information regarding hydrological processes such as evaporation and runoff. Reference [29] proposed an approach to predict rainfall-triggered landslides based on a hydrological model that requires only daily rain and evapotranspiration as model input data.
Several numerical models are recognized as good alternatives in predicting the occurrence of landslides. However, these models frequently require a large amount of input data and numerous calibration processes, which is an obstacle regarding their incorporation in warning systems based on rainfall thresholds [28,29].
From a deterministic point of view, the stability of a slope can be assessed by calculating the factor of safety (F.S.) associated with it in a given time. The calculation of this factor, which can be achieved with various methods, takes into account the characteristics of the soil slope, as well as its geometry [30,31]. Some properties associated with the soil can be considered stationary, i.e., they do not vary with time, such as its fines content, index of voids or state of compaction, specific weight of grains, etc. However, others will be modified over time as a function of the external influence of the environment. Rain events, for example, modify the degree of soil saturation, as they affect the moisture content by also altering the levels of pore pressure and suction along the depth of a slope. The same happens with infiltration, since, due the absorption of water, the soil’s permeability coefficient increases, as the water’s percolation path quickens the passage of the liquid.
The influence of each of the parameters associated with slope sliding can be evaluated independently. Thus, it is possible to observe those that have the greatest influence on the factor of safety associated with a given slope.
Many parametric analyses have already been performed to understand how the parameters involved in a rainfall-triggered landslide affect the stability results [30,32,33,34]. Reference [35], for example, evaluated the effect on slope failure of different hydraulic properties. Furthermore, parametric analyses have also studied the effect on slope stability of soil moisture in unsaturated soil conditions [36], and precipitation intensity and the ground water table position [10,37].However, to date, the present authors are not aware of any published parametric study that quantifies the influence of each of the hydraulic and mechanical parameters on the slope stability of a hillside.
Thus, in this study, the influence of hydromechanical properties on stability was investigated with parametric analysis, using the SoilVision model [38], a commercial finite element method (FEM) solver package. The analyses were performed on a generic slope representing a mountainous region of unsaturated soil. Thus, the objective of this work was to demonstrate and quantify the sensitivity of the hydraulic and mechanical parameters regarding slope stability. A numerical slope stability model was calibrated to perform the parametric study of different soil conditions.
The paper is organized into four sections. Section 2 describes the method used to define the range of each parameter, as well as the ways in which the parametric analysis and the sensitivity quantification were carried out. Section 3 presents the results obtained from the analysis. Finally, Section 4 discusses the main findings, concludes the paper and summarizes the lessons learnt.

2. Materials and Methods

A methodology to evaluate the influence of each of the input hydromechanical parameters in the numerical slope stability model was developed. The SoilVision software [38] was used. The safety factors obtained from the stability analysis and their spread according to parameter variation were determined through multiple FEM simulations.
The model was studied by analyzing the variation in the factor of safety after a rainfall episode with different hydraulic conditions and mechanical soil parameters. Figure 1 shows the methodology flowchart of this paper.
This work used characteristics and mean parameters related to real soil slopes. Its validation was achieved via its application to values obtained from the instrumentation of a road slope in the southern region of Brazil [39].

Numerical Model

Understanding the unsaturated flow mechanisms and equations is mandatory to fully comprehend the numerical model used in this research. The water flow through unsaturated soils is governed by Darcy’s law, and the equation governing the flow of water through a two-dimensional element of unsaturated soil is as follows:
x ( k x h x ) +   y ( k y h y   ) + Q = ( θ w t )
where h is the total head, kx and ky are the hydraulic conductivities in directions x and y, respectively, and θw is the volumetric moisture content. Both the permeability coefficient and volumetric water content versus suction are important entry parameters when infiltration is modeled. Q is the precipitation intensity applied.
The amount of water stored in a soil element depends on the pore pressure and the characteristic curve of the soil, which indicates the amount of water that the soil absorbs or expels as the water pressure varies. Moreover, in unsaturated flows, the hydraulic conductivity is strongly dependent on the moisture content of the soil as a function of the heterogeneous distribution of pore pressure. The water flow is then assumed to occur in a network of interconnected channels. As the moisture content increases, the size and number of waterways also increase, which causes the soil’s capacity to conduct water to increase. The hydraulic conductivity of the soil is maximal when the soil is fully saturated. On the other hand, as the moisture content decreases, the soil’s capacity to conduct water through its voids slowly vanishes. There is a relationship between water moisture content and pressure. So, hydraulic conductivity is also a function of pore pressure. For an unsaturated soil element, a change in volumetric moisture content is related to a change in suction [5] by the following equation:
θ w = m w u w
where uw is the suction and mw can be considered constant for a given time during a transient process. Substituting Equation 2 into Equation 1 gives the differential equation governing the flow of water in unsaturated media:
x ( k x h x ) +   y ( k y h y   ) + Q = m w ( u w t )
where mw is the slope of the soil retention curve, which can be determined experimentally [6].
The relationship between volumetric water content and suction, also called the soil–water characteristic curve (SWCC) or retention curve, as well as the relationship between hydraulic conductivity and suction, can be modeled through different equations. In this work, the models adopted were those of [40] and [41], representing the unsaturated soil behavior in terms of water retention and hydraulic conductivity, respectively.
Reference [40] model is the most frequently used when numerical models of soil infiltration are required [3,14,35,37,42]. Moreover, [40] equation has been found to fit the soil–water characteristic data for essentially all types of soil and over all suction ranges [43,44]. The choice of [41] equation took into account that this model uses the same previously presented parameters [40], which could minimize the amount of analysis required in the current parametric study.
The model representing the unsaturated soil behavior in terms of water retention is depicted by the following equation [40]:
θ w = θ s [ 1 ln ( 1 + Ψ h r ) ln ( 1 + 10 6 h r ) ] [ 1 [ ln [ exp ( 1 ) + ( Ψ a f ) n f ] ] m f ]
Thus, additional to the soil suction value (Ψ) and the volumetric water content (θ; θs for saturated), four shape variables are needed for correct modeling: af, nf, mf and hr. Each one is responsible for a different shape, which also affects the air entry value (AEV) of the curve. The AEV indicates the maximum suction value at which the soil is still saturated. The four parameters are detailed as follows:
af = parameter related to the air entry value of the soil;
nf = parameter function of the rate of water extraction from the soil once the AEV has been exceeded;
mf = parameter function of the residual water content;
hr = suction value at residual water content (kPa).
In turn, the equation suggested by [41] for modeling hydraulic conductivity as a suction function is given by:
k r ( Ψ ) = ln ( Ψ ) b θ ( e y ) θ ( Ψ ) e y θ ( e y ) dy ln ( Ψ aev ) b θ ( e y ) θ ( Ψ aev ) e y θ ( e y ) dy
where b is a constant, y represents the logarithm of suction and aev subscription refers to air entry value of the soil under consideration.
Additional to the hydraulic material properties, such as the saturated volumetric water content, saturated hydraulic conductivity and the Fredlund and Xing (F&X) fitting parameters for soil–water characteristic curves (af, mf, nf and hr), other mandatory entry parameters are needed to feed the numerical model. These parameters include slope geometry (declivity) and mechanical material properties, such as friction angle, unsaturated friction angle, cohesion and specific weight. The initial pore water pressure condition is also required, as well as boundary conditions related to the soil–air interface (precipitation) and related to lateral model limits.
The slope angle of a mountain hill is directly associated with its rainfall behavior in terms of surface infiltration and runoff. Some authors have already stated [45,46] that a minimum declivity angle of a soil slope is necessary to trigger the occurrence of landslides. The minimum angle usually mentioned in the literature for landslides varies from 20 to 30 degrees [30,47,48,49].
The geometrical model used in the simulations has consistent dimensions with many real cases already addressed in the literature [10]. The generic hill is 20 m high and its inclination ranges from 30 to 50 degrees. The inclinations assessed in this study were 30, 40 and 50 degrees. Figure 2 represents a section of the generic slope.
The virtual model adopted for the parameter study exhibited a very simple slope with homogeneous material and a simple geometry. This simplified model can be quite different from a natural slope, where the slope failure can easily be dominated by geological conditions. However, variation in the stratigraphy of the problem would make it impossible to vary the other parameters, and is not, therefore, the objective of this study. The existence of reliquary features or preferential sliding surfaces that could trigger the sliding was not considered, which implies a limitation of this study.
Finally, the constitutive model of [50] was adopted to represent the strength behavior of the soil, whose input parameters are the effective cohesion (c′), the effective angle of friction (ϕ′), the natural specific weight (γ) and also the angle of friction in the unsaturated condition (ϕb), as the matric suction in unsaturated soil affects the shear strength.
Negative pore water pressure increases the shear strength of unsaturated soil. The increase has been shown to be nonlinear in form when negative pore water pressure is varied over a considerable range. However, a linear approximation of the unsaturated shear strength is frequently used. The linear approximation of the unsaturated soil shear strength equation is written as follows:
τ = c + ( σ n u a ) tan + ( u a u w ) tan b
where c′ represents the effective cohesion, ua and uw represent pore air and pore water pressure, respectively, ϕ′ is the effective frictional angle and ϕb is the angle that defines the increase in shear strength due to negative pore water pressure. The angle ϕb is a material property, and was also assessed in the parametric/sensitivity study. It can range from zero to ϕ′ depending on the material type. A commonly used value for ϕb is ϕ′/2 [51].
In addition to the hydraulic parameters, the slope geometry, mechanical properties and the initial pore water pressure are contributing factors regarding the behavior of a hill during a rainfall event. Depending on the precipitation history, the unsaturated part of the hill can indicate greater or smaller values of suction. After a long dry period, suction values above water level can lead to maximum capillarity heights, which means that, sometimes, suction values up to 60 or 70 kPa are obtained (depending on the water level depth and type of soil). In this case, more intense or long-term precipitation would be necessary to reduce the suction values to levels that could result in slope failure. On the other hand, during rainy seasons, suction values at the zone above the water table are already low. This means that a small amount of water infiltration due to rainfall can be sufficient to provoke a landslide.
Based on real instrumentation data [39,52], the initial suction profiles were modeled as being able to reach a maximum, over which suction returns to zero.
Since most of the presented parameters are independent of each other, it was concluded that varying any of these parameters can generate a new stability response. Therefore, the task was to determine which parameter will most affect the change in stability or the factor of safety.
After defining and listing all the input parameters involved, each one was assigned a reference value based on the available literature [39,53]. The hydraulic soil properties were derived from the silty sand SM average results of experimental SWCC presented by [53]. The mechanical properties of the soil were derived from the silty sand SM average results of the geotechnical properties of the slope soil in [39]. Two additional realistic values, one higher and one lower than the referential value, were primarily tested in order to have at least one of each: slope stability and instability. The Table 1 shows the 12 reference parameters and the reference literature.
When modeling a slope stability situation subject to a rainfall event, a careful choice of parameters representative of the materials is needed to feed the numerical model.
Initially, a reference test (Basic Run), with the values in Table 1, was performed as a reference for the parametric study. Then, a series of 24 tests were performed for the parametric study with higher and lower values of each parameter, one with an initial maximum value and another with an initial minimum value. Table 2 presents the parametric analysis matrix.
The software used to perform the simulations is composed of several modules, among which are SVFlux and SVSlope [38]
The models were subjected to rain, and an infiltration profile was drawn in each case. A runoff correction was applied so that when the amount of water supplied as a weather boundary condition exceeds the amount of water that the soil can physically receive, this excess amount is considered as the runoff portion. This occurs when the volume reaches the saturated hydraulic conductivity value. The rainfall input was in constant form. Although it is known that, in real scenarios, the accumulations considered would be the result of an inconstant distribution, for the feasibility of the analyses, the option of constant rainfall inputs was adopted.
For the analysis of the water infiltration process’ impact on the slopes, transient flow modeling was performed in partially saturated soils. Through FEM, the two-dimensional numerical simulations of flow and infiltration front advance were performed under the different soil conditions. The software discretizes the slope into a series of elements of different shapes and sizes, thus forming a mesh that is able to represent the slope geometry. The model time was fixed in days. The infiltration model had a 2-day (real time) duration in total, determined by the summation of two stages, with a 1-day duration for each stage.
The transient formulation used was the conventional formulation based on the total head. The formulation applies to the right-hand side of the governing transient seepage partial differential equation (PDE). The seepage PDE based on total head is the most commonly implemented form. Its formulation is presented in Equation (2). Flow equations were then solved to determine the flow from node to node of the mesh by providing final solutions weighted according to the influence of each of the elements. Since the numerical model is the representation of a part of an infinite system, its limits must have continuity. Such continuity is represented in the model by the boundary conditions. Boundary conditions related to soil–air interaction were applied along all soil–atmosphere interfaces in the numerical model. Regarding the lateral model limits, in order to indicate the continuity of the model, constant total head was applied, indicating the positioning of the groundwater in the initial condition, except in the soil layer, where the total head was expected to vary due to rainfall infiltration.
The finite element mesh construction for the numerical model is of extreme importance, since the results obtained are strongly influenced by it. In this work, a triangular element mesh was used, which performs linear interpolation with three integration points per element. The mesh refinement algorithm is sensitive to high pore pressure and hydraulic conductivity gradients. The hydrological simulations were performed on models with a maximum triangle mesh area of 0.5 m², a minimum interior angle of 30 degrees and a maximum edge length for region boundaries of 2366 m. The specific gravity of soil particles was assumed as 2.65. Figure 2 shows an example of the generic model and its boundary conditions used in the numerical flow simulations, and the figure also illustrates a finite element mesh generated by the flow analysis software. In order to calibrate the model and monitor the infiltration evolution, four pore water control sections were created in the model. The sections are able to measure the pore water pressure distribution in the unsaturated zone and are named AA, BB, CC and DD. Their positions are also indicated in the figure below.
After the end of each infiltration analysis, the result of this final time analysis (t2) was used as the initial situation of the stability analysis in order to assess the factor of safety associated with the slope after the rain event. The slope geometry was repeated and new input parameters were assigned to the soil, such as the natural specific weight, cohesion, angle of friction and unsaturated angle of friction. The determination of the factor of safety is purely deterministic and calculates the value associated with the critical wedge, i.e., the wedge along which the ratio between the acting and the resistant forces is the lowest. The slope stability analysis method chosen in this study was the [56] model. According to [57], because the [56] method satisfies force and moment equilibrium conditions, it is one of the most rigorous limit equilibrium methods among the most popular. Thus, it is the most frequently used method for assessing landslides worldwide.
After conducting the three analyses related to each parameter, the resulting factors of safety were plotted against the corresponding parameter in order to quantify the influence of the parameter on the stability and also determine whether any of the parameters did not have any direct effect on the factor of safety value.
With this preliminary analysis, it was possible to distinguish the most sensitive parameters, i.e., those in which any change will drastically affect the F.S. value.

3. Results

3.1. Parametric Analysis

The relative importance of the slope geometry, initial pore water pressure distribution and hydraulic and mechanical soil properties in inducing the instability of a homogenous soil slope under a rainfall event was investigated through a series of parametric studies. After the 25 analyses presented in Table 2 had been realized, the resulting factors of safety were plotted against the corresponding parameter in order to either quantify the influence of the parameter on the stability or realize the lack of influence on the factor of safety value. It was expected that all parameters studied would yield results both higher and lower than one. Therefore, if the factors of safety did not cross the stability line (F.S.=1), other values were tested until it was reached.

3.1.1. Slope Geometry

The effect of slope geometry was assessed in terms of slope angle. The slope height was fixed at approximately 20 m.
The influence of the slope angle on the stability of a homogenous soil slope was evaluated through three different declivity slope angles: 30, 40 and 50 degrees. The slope angle of 40 degrees was the inclination used in the Basic Run analysis. Figure 3 shows the clear relationship between the slope and its factor of safety.
Other researchers have already discussed this relationship [30,58,59]. For some authors [58,59], the slope angle had the greatest impact on the variation in the factor of safety, i.e., they found in their parametric studies that the slope angle was the most influential among all parameters. In another parametric study, slope geometry only played a secondary role, ranked behind soil properties and rainfall intensity among the factors controlling the instability of slopes due to rainfall [30].
It is important to mention that some authors [30] have already suggested that, under a short duration of rainfall for a soil slope with a small inclination, two requirements must be satisfied for failure: the saturated hydraulic conductivity of the soil should be high, and the precipitation intensity applied to the soil slope should be extremely high. As this study did not assess different rainfall events, for the event considered, the flattest slope was stable.
For the adopted parameters, a slope angle of 45 degrees was the limit above which the slope was stable for the considered rainfall event. In the observed analyses, there was a strong linear relationship (R² = 0.9848) between the increase in slope angle and the drop in the factor of safety. The higher the slope angle, the lower the factor of safety, in accordance with previous research.

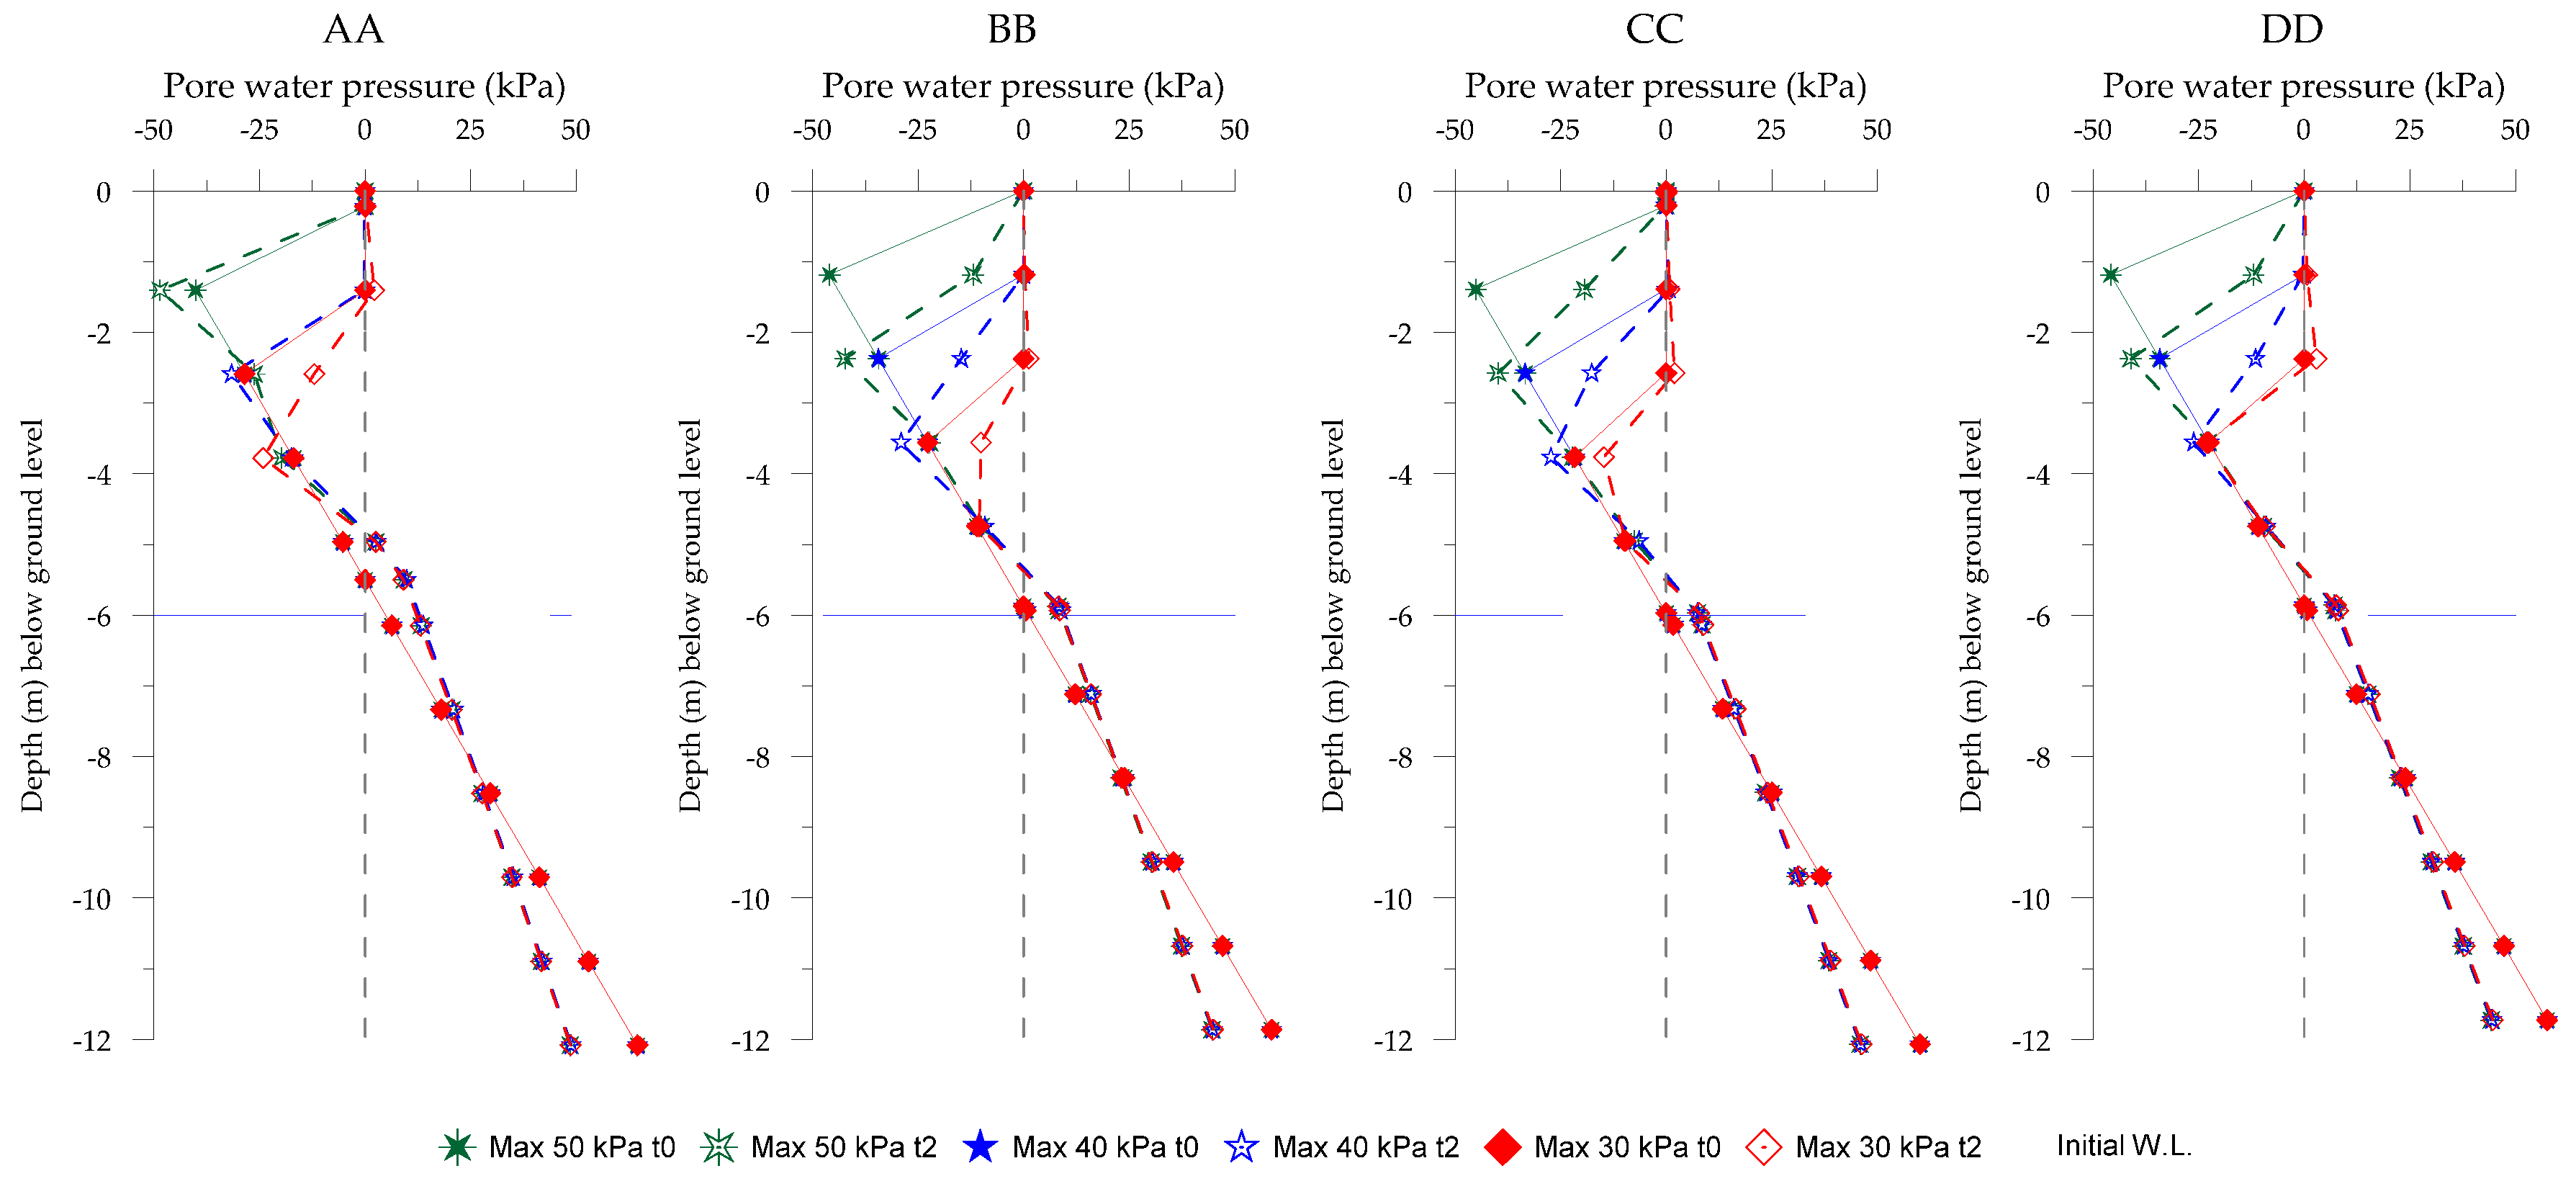
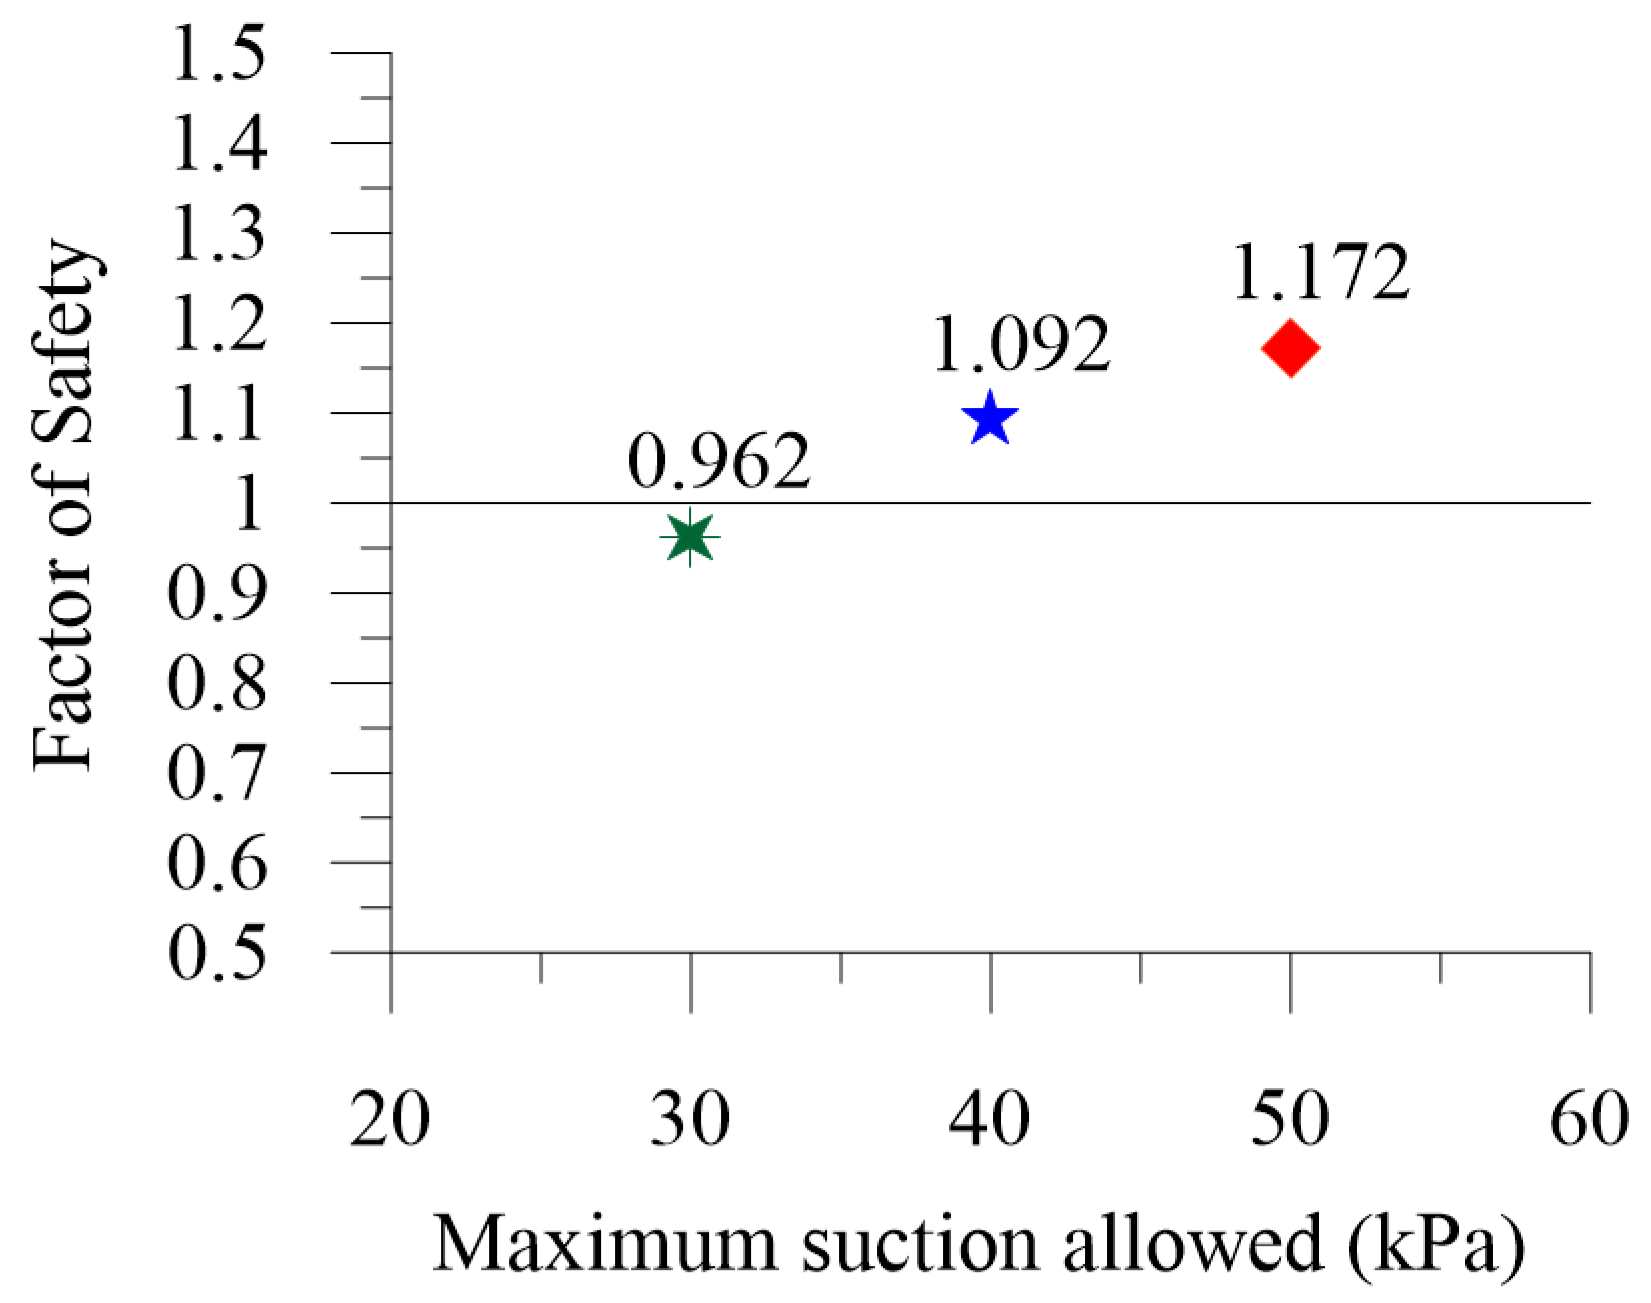
3.1.2. Initial Pore Water Pressure Distribution

The pore water pressure distribution at the beginning of a rainfall trigger is fundamental to define the failure time. The initial water table was located 6 m below ground level. This means that a steady state analysis would show maximum suction values due to capillarity up to 60 kPa at the ground surface (6 m multiplied by the specific weight of water 10 kN/m3). However, for the reference analysis, it was considered that the suction values could reach up to 40 kPa above the water table level and then return to zero. This behavior is shown in the figure below with the “Maximum 40 kPa—Basic Run” series. The behavior is comparable to that observed in the literature for partially saturated slopes [52,54].
For the other analyses, the maximum permitted suctions values were 30 and 50 kPa, considering a rainy period and a dry period, respectively. The three initial scenarios considered (t0) were subjected to rainfall intensity equal to 6156 mm/h over 2 days (48 h). Rainfall intensity was chosen to be intense but not higher than the saturated permeability coefficient in any analysis.
Reference [35] presented the factor of safety versus rainfall intensity for different saturated coefficients of permeability for good- and poor-drainage soils. According to these authors, if the rainfall intensity is lower than the threshold rainfall intensity of two soil slopes with the same characteristic curve but different saturated permeability coefficients, the stability of both soil slopes will be the same. Thus, rainfall intensity is very important in evaluating the stability of slopes with different saturated coefficients of permeability.
After 2 days, the suction profiles presented the t2 forms indicated in Figure 4. The four pore water control session (AA, BB, CC and DD) responses were recorded and presented.
According to [60] and [58], changes in pore pressures are directly linked to the stability of unsaturated soil slopes. The authors state that the triggering mechanisms are complex and include a reduction in capillary pressure due to increased saturation, and the initial pore water pressures prior to a significant rainfall event, along with the magnitude of the rainfall event, play a crucial role in the development of an unfavorable pore water pressure condition in a soil slope.
In Singapore, [30] stated that the initial water table position only played a secondary role, behind soil properties and rainfall intensity, in their parametric study. Reference [37] also conducted parametric studies to evaluate the effect of soil properties, the groundwater table position and precipitation rates in affecting slope stability. Three different groundwater table positions corresponding to the wettest, typical and driest periods were used in their numerical analyses. The authors found that the changes in the factor of safety during rainfall were not affected meaningfully by the groundwater table position.
Figure 5 shows the safety factors associated with the three initial conditions. Under the maximum 40 kPa condition (Basic Run), the imposed rainfall reduced the suction values by up to 10 kPa in sections BB and DD at approximately 2 m BGL. Nonetheless, the reduction was not sufficient to cause slope failure. It was thus expected that initial suction values lower than this, under the same rainfall condition, would lead to failure. This was observed with the profile whose initial maximum suction was 30 kPa (profile associated with the rainy season). On the other hand, initial suction values up to 50 kPa (profile associated with dry season) maintain high suction values after the occurrence of the imposed standard rainfall, thus the slope is even more stable. It should be noted that the existing ratio is almost linear for the suction range considered.

3.1.3. Saturated Volumetric Water Content

The hydraulic parameters used in the Basic Run were adapted from the soil–water characteristic curve (SWCC) presented in [53]. Figure 6 shows the retention curve associated with the Basic Run, as well as others associated with different saturated volumetric water content values.
Table 2 presents the [40] fitting parameters associated with the Basic Run curve. The residual volumetric water content assumed was 0.0365, which corresponds to a residual percentage of 10.14% of the saturated volume water content of 0.36, and an AEV of 0.86 kPa. The saturation suction and fit volume water content were assumed as 0.1 kPa and 0.3379, respectively, for all analyses.
For the permeability fitting method [41], a k minimum value of 8.64 × 10⁻⁶ m/day was applied. The permeability function is not affected by the variation in the volumetric water content. Three values of saturated volumetric water content (θsat) were studied. Higher values of θsat represent greater slope stability. However, their variation is slightly perceptible, which causes us to assume that its variation does not significantly influence the slope stability.

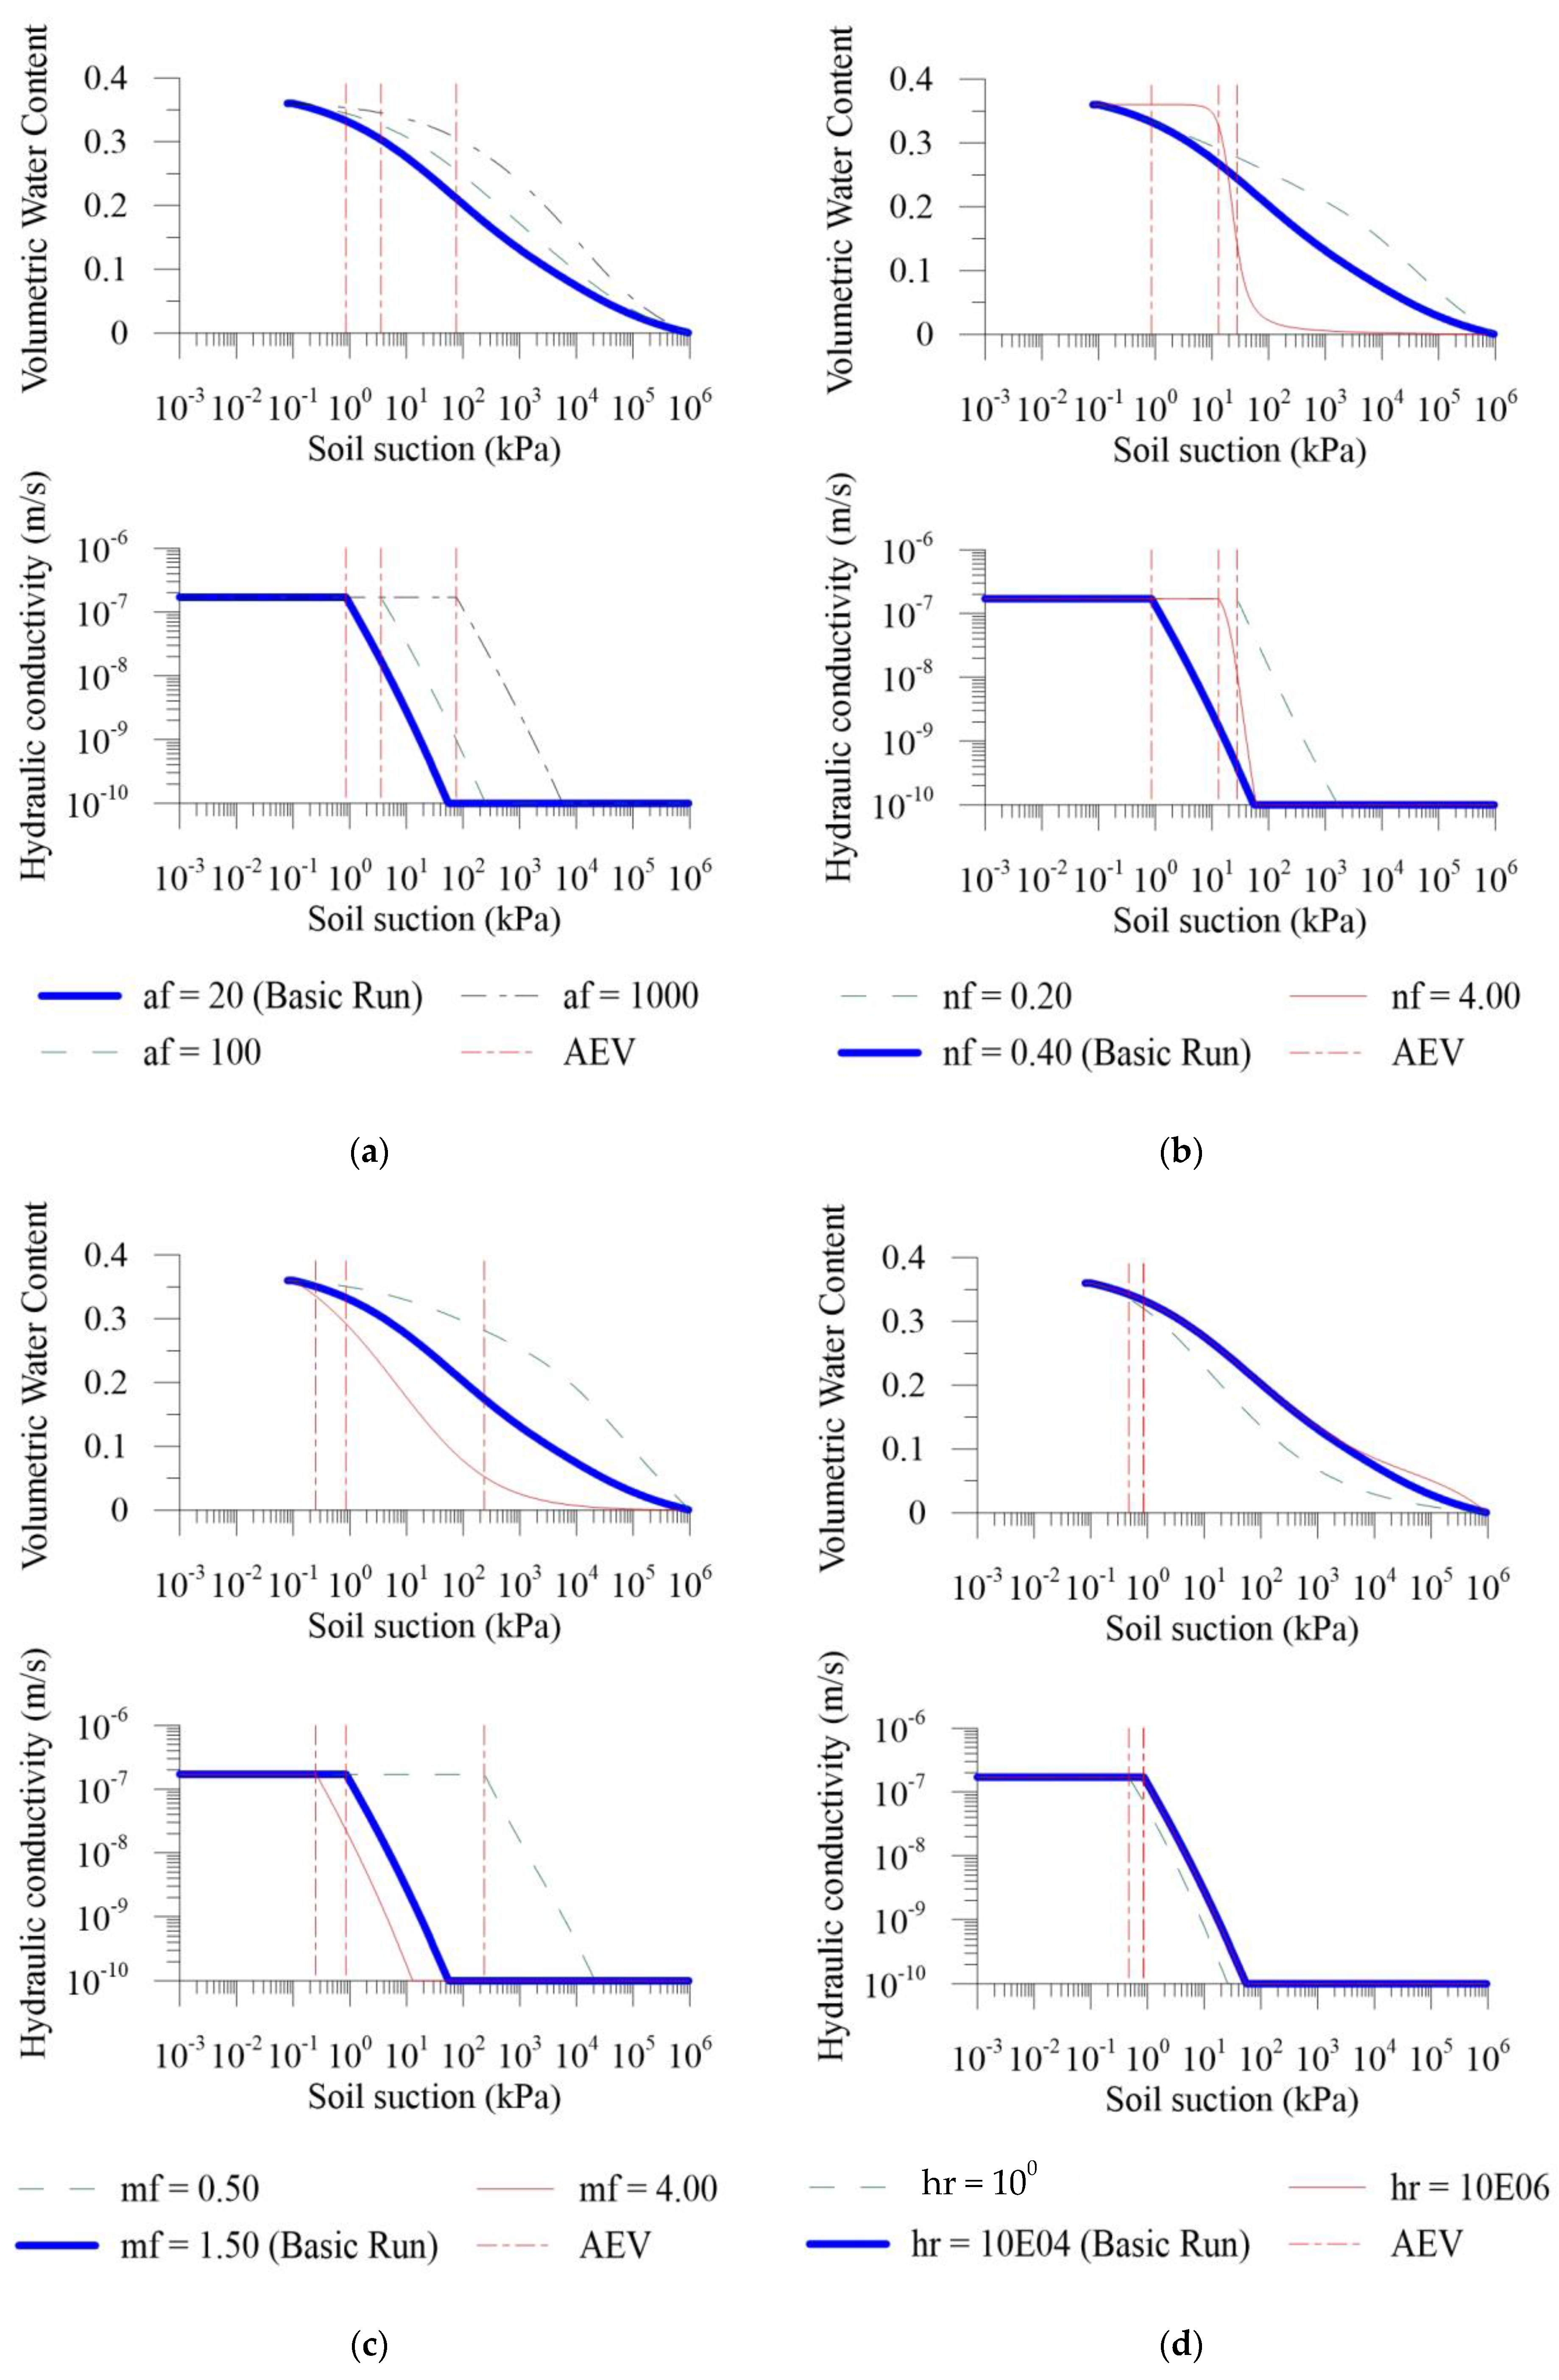
3.1.4. Hydraulic Fitting Fredlund and Xing Parameters

Figure 7 shows the SWCC curves and permeability functions adopted. It is clear that both shapes are influenced by the fitting parameters adopted [40].
For the af [40] parameter, values equal to 20, 100 and 1000 were adopted (Figure 7a). In Figure 8a, the relationship between the af value and F.S. shows that there is a downward trend as the value of af increases. However, the variation is too small to confirm that any important correlation exists. As in all other situations, the analyses were performed under the condition that all other parameters associated with the curve remain constant. The AEV is a function of the af value of the curve and, therefore, it also changes in each analysis. As per definition, it is the suction value above which the air begins to enter the larger voids in the soil. The AEV is directly proportional to af, so that its increase also causes a drop in the factor of safety. Analyses performed with different af values and other soil properties as well as those adopted in this paper have already demonstrated different behavior from that observed here. This emphasizes the importance of evaluating a wider range of possibilities with respect to the variation in this parameter, whose nature is logarithmic, i.e., its variation can be observed only in a magnitude order oscillation.
As per the reference, the AEV values associated with each scenario are shown in the figures (Figure 7a,b). They are also summarized in Table 3 below, where it is possible to see their variation related to each parameter’s variation. AEV values are presented in ascending order so that their large variation due to af, nf, mf and hr variation can be easily seen.
Figure 7b shows the SWCC curves and permeability functions adopted for different nf values. Moreover, as expected in this case, both shapes are influenced by the nf value [40]. Again, three values of nf were evaluated: 0.4 (Basic Run), 0.2 and 4.0. Figure 8b shows that despite the small change, an increase in nf represents a larger F.S. The F.S. = 1 line was not crossed, even when other trials were performed. According to [44], an increase in the value of nf indicates a more uniform ground. This means that, for the studied soil slope, the more uniform the soil, the more stable it tends to be.
Values of mf equal to 1.5 (Basic Run), 0.5 and 4.0 were adopted (Figure 7c). The increase in this factor, associated with the greater verticalization of the curve and a lower residual volumetric water content [44], also indicates an increase in the factor of safety (Figure 8c). The residual volumetric water content is the moisture content from which a large variation in suction is required to remove more water from the soil; this denotes the moisture value above which increases in suction do not produce significant variations in moisture content. Again, the variation observed is minor, but clearly demonstrates the positive relationship between the two variables. In this case, the point where the soil slope crosses the stability line (mf ~ 0.75) can be seen.
Finally, values of hr equal to 10,000 (Basic Run), 1 and 1,000,000 were adopted (Figure 7d). Figure 8d shows that, even considering a log-scale variation for the hr parameter, the F.S. was not affected. No influence was exerted by this parameter for the situation studied.
Another parametric study [30,35] also investigated the effects of the hydraulic properties of soil on rainfall-induced slope failure. According to these authors, the hydraulic properties of soil, as defined by the soil–water characteristic curve, saturated coefficient of permeability and unsaturated permeability function, along with rainfall intensity, play a controlling role in the instability of slopes due to rainfall.
The stability of well-drained soil slopes is not sensitive to the variation in the soil–water characteristic curve fitting parameters [35]. This statement agrees with the data presented above. More studies can be conducted with soils in different drainage conditions so that a more sensitive variation could be obtained.
In China, [61] studied reservoir slope failures as a consequence of water fluctuation. This oscillation was found to be the main triggering factor of this type of failure. Their studies also showed that the fitting parameters in the SWCC, i.e., af, nf and mf for the Fredlund and Xing model, have significant effects on the risk of landslides for the reservoir water’s drawdown. The saturated permeability coefficient of the soil and the velocity of water-level fluctuation also were key potential properties controlling stability. Their response can also be linked to the drainage conditions of the soils composing the reservoir area.

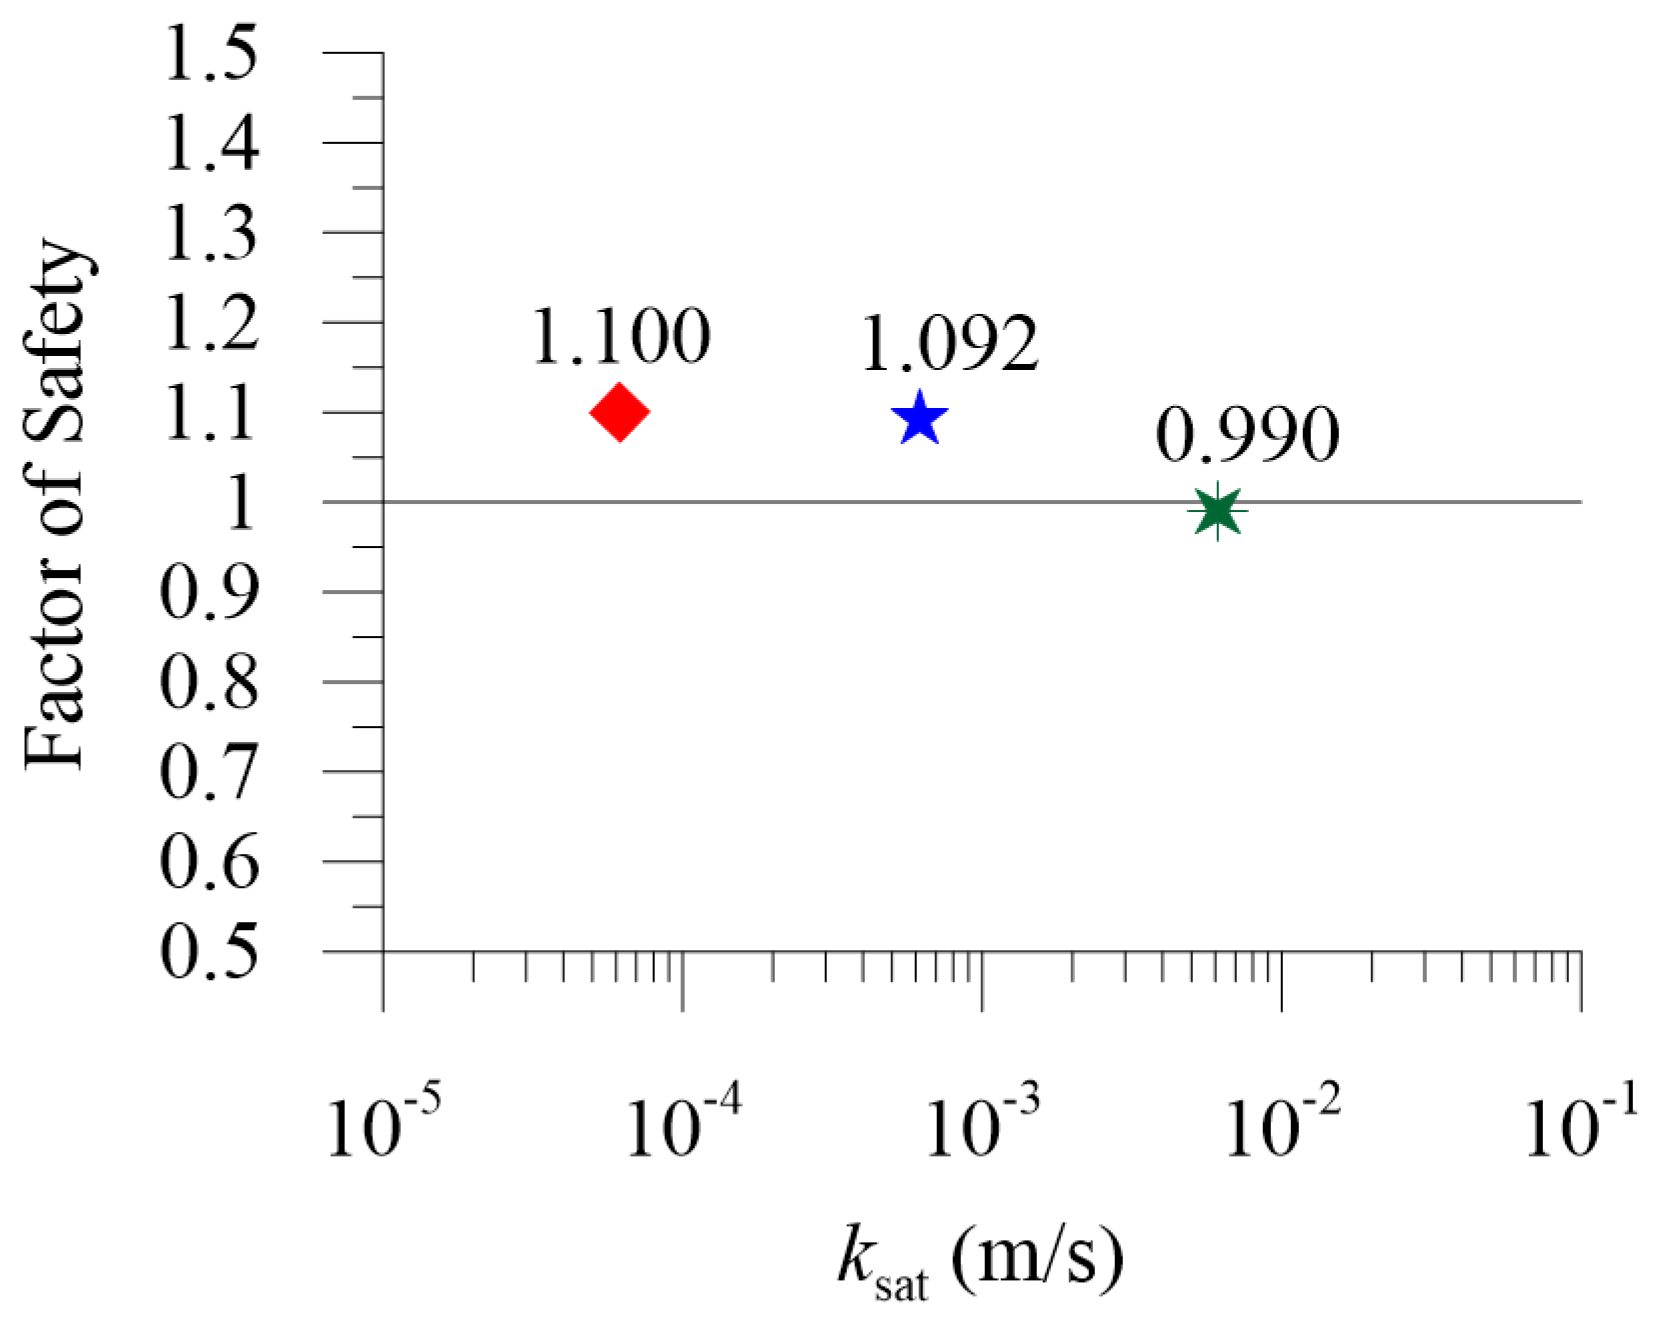
3.1.5. Saturated Permeability Coefficient

Figure 9 shows the three ksat values assessed in the parametric study, plotted against the associated factor of safety. It is evident that the higher the saturated permeability coefficient of the soil, the lower the factor of safety. This occurs because, with the same standard rain condition considered, higher ksat values allow more water to be absorbed by the soil and, therefore, a more positive pore pressure is generated, leading the slope towards a more unstable condition and, then, failure.
Figure 10 shows the difference in the wetting front as a consequence of the different ksat adopted. A higher ksat value (Figure 10a) led to positive pore water pressures (blue line) at higher depths, as well as caused the initial water level to rise. This suction condition at the second day of rainfall is responsible for the failure. On the other hand, the smallest ksat value (Figure 10c) insignificantly changes the initial water level and absorbs water only in the first meter of the soil slope. The situation is not sufficient to lead to failure when considering the critical slip surface into the soil layer.
Researchers [60] stated that the pore water pressure variation due to rainfall was found to take place over a wider range in soils with higher coefficient of permeability as compared to soils with lower coefficient of permeability. As per [35], the saturated coefficient of permeability, ksat, of soil has a unique consequence on the stability of both good and poorly drained soil slopes. Their observation agrees with the findings presented above.

3.1.6. Cohesion

As expected, according to the factor of safety in Equation (6), the cohesion is an independent parameter, i.e., it either depends on or is not affected by other parameters in the equation. Its relationship is directly proportional to the increase or decrease in the factor of safety. Larger cohesion values represent higher slope stability (Figure 11).
In their study, [59] listed cohesion as the second most important parameter influencing the factor of safety. In this case, extra cohesion added by vegetation cover was assessed. According to these authors, slope angle and cohesion considerably affect the stability of a soil slope, unrelatedly to the soil type composing the slope.
Studying unsaturated soils, other authors [62] realized stability analyses to show the effects of soil suction on the factors of safety. The increase in soil strength due to suction was, in their case, included in terms of increased cohesion. The factor of safety response also follows the cohesion increase. All these previous analyses support the results presented above.

3.1.7. Friction Angle

Similarly, higher friction angle values of the material, both saturated and partially saturated, represent higher slope stability (Figure 12).
The ϕb parameter in Equation (6) is used to quantify the rate of increase in shear strength relative to suction. According to [51], when the ϕb value is unknown, a ϕb equal to 15° can be used in the slope stability study to evaluate the influence of matric suction on the F.S. A ϕb value of zero can also be used, signifying that the effect of matric suction is neglected. The author affirms that if the air entry value (AEV) of the soil is smaller than 1 kPa, the effect of matric suction on soil slope stability is trivial and the ϕb value can assumed to be zero. In this study, the Basic Run value of AEV is equal to 0.86 kPa. Thus, the unsaturated friction angle (Figure 12b) could be decreased to zero in order to show the variation in the factor of safety, generating the slope failure. Nonetheless, according to [51], if the air entry value (AEV) of the soil is between 20 and 200 kPa, an assumed ϕb value of 15° provides a reasonable estimation of the effects of unsaturated shear strength in most cases, and for soils with an AEV greater than 200 kPa, ϕb can generally be assumed to be equal to the effective angle of internal friction, ϕ′. Table 3 shows the ϕb values adopted based on these considerations.

3.1.8. Specific Weight

The specific weight of the soil, as well as its mechanical strength parameters, directly impacts its stability condition. This property is related directly to the type of soil, the geological lithotype associated with it and the densities of the mineral particles present in the substrate, which indicates that the higher the density, the lower the factor of safety (Figure 13).

3.2. Sensitivity Analysis

The influence of each parameter on the stability was quantified. Following [63], the model’s sensitivity against each parameter was tested individually. For each parameter, central, minimum and maximum values were defined based on the respective literature (Table 1). The percentage variation in the factor of safety (ΔF.S.) was compared with the percentage variation in the parameter (Δparameter). Their ratio was found, and the higher the value found, the greater the sensitivity to the parameter attributed to slope stability. Table 4 below shows a summary of these analyses. The resulting F.S.i found for each analysis i studied in the proposed range is related to the respective central F.S.central, to calculate the percentage variation in the factor of safety (ΔF.S.):
Δ F . S . = F . S . i F . S . central F . S . central
An analogue approach was used to calculate the percentage variation in the parameter (Δparameter).
Other researchers [64] have already presented the impact of material parameters on the deformation and stability responses of a slope and its failure mechanism. However, variation was not quantified. Although the relative deviation (ΔF.S.) reflects the model’s sensitivity against each parameter, interactions between parameters were not considered in this paper.
Now, it is possible to choose the parameters in which any change will drastically affect the slope stability, which are, in order, soil slope inclination, friction angle, initial pore water condition profile, soil specific weight, cohesion, mf fitting parameter of F&X, saturated volumetric water content, unsaturated friction angle, nf fitting parameter of F&X, saturated hydraulic conductivity, hr and af F&X fitting parameter.

4. Discussion and Conclusions

The hydraulic and mechanical properties of the soil slope, among other factors, present predisposing factors for landslides. Although the influence of several factors on slope stability has already been investigated, the understanding of each of the key factors involved in a rainfall-triggered landslide can be deepened, especially regarding the fitting parameters used to build the SWCC curve of the soil.
In order to identify the key parameters involved, the assessment of changes in slope stability associated with hydraulic and mechanical parameter variation was the main purpose of this work. A numerical slope stability model was calibrated for a homogeneous and unsaturated hill to perform the parametric study of different soil conditions. Its different hydraulic and mechanical parameters were varied. The pore pressures recorded during transient infiltration analysis were used as the initial groundwater conditions for the subsequent deterministic equilibrium limit analysis. For comparison reasons, the same rainfall intensity and total amount were assumed in every analysis, in order to better analyze the soil response in its different conditions.
This work defined, among the parameters used for the analysis of stability due to rainfall infiltration in a numerical model, those exerting the greatest influence on stability, i.e., the key parameters to which more attention should be given when virtually modeling rainfall-induced landslides.
The slope angle had the greatest impact on slope safety, as already presented in other papers and discussed previously. It played a secondary role only when different rainfall intensities were tested, which was not an objective in this study.
The slope declivity was followed by the friction angle. Higher friction angle values of the material, both saturated and partially saturated, represent higher slope stability. While friction angle ϕ variation could exert an effect of up to 93% on stability, unsaturated friction angle ϕb had an effect of only 7%.
This means that a 100% variation in ϕ, either upward or downward, can lead to a factor of safety 93% higher or lower, and a 100% variation in ϕb can lead to a factor of safety that is only 7% affected.
The friction angle is directly linked to the shear resistance of the material, which justifies the great influence exerted. However, unsaturated ϕb is related to the effect of matric suction, which, even contributing to the shear strength in unsaturated soils, plays a secondary role if compared to the friction angle itself.
Among all the parameters, mechanical parameters showed greater relevance to stability, in general, when compared to the hydraulic parameters. It should be taken into account that the whole study considered the same intensity and amount of rainfall in all analyses, which can explain the lower influence of hydraulic parameter variation on slope stability.
Additional to the slope angle and friction angle, which evidently had a relevant influence on the stability, the initial pore water pressure showed the greatest influence on slope stability. Its influence was not as great as that of the friction angle (which was almost 1 by 1) but indicates a variation in safety of around 38%. The scenarios studied considered a maximum suction value in the unsaturated zone. Above this maximal value allowed in the virtual model, suction values returned to zero (Z.A.M.—zero above maximum). All of these values represent different levels of antecedent rainfall that lead to a specific profile’s initial condition. The antecedent rainfall levels that caused the profiles were not discussed as they have no relevance. More than one period of historical rainfall can lead to the same initial pore water pressure profile. The higher the maximum suction value accepted, the thicker the capillary zone and the higher the suction values to be overcome by the rainfall infiltration. This means that, for the same rainfall amount, stability will be preserved for a longer period of time. The opposite was also verified.
The soil specific weight and cohesion, also mechanical parameters, followed the initial suction profile. The soil specific weight, which depends on the geological characteristics of the material, had a significant influence in the sensitivity analysis reaching 22%. In turn, cohesion, also an important mechanical parameter that contributes directly to the slope stability in cohesive soils, had an influence of 13%.
The saturated volumetric water content variation implies a different soil/water relationship when the hill is saturated. However, it did not affect the shear strength mechanisms involved in a possible failure. This is probably the reason that the safety related to different values was not perceptible. Although the sensitivity variation showed a 7% influence, the parameter itself can be varied only within a small range (±30%), which means that safety measurements will not be significantly affected.
The saturated permeability coefficient showed a 1% influence on slope stability. This indicates that the ksat variation exerts a low influence on slope stability. However, the idea of magnitude order for the saturated permeability coefficient should be taken into account. If we do so, one magnitude order of variation can represent an even greater influence on stability than the other mechanical parameters discussed previously. The soil’s infiltration capacity was reached in all analyses, for a better comparison.
Among the fitting Fredlund and Xing parameters, no significant trend was observed. However, their influence on stability showed the following order: mf, nf and af. While mf had 7% influence and nf 2%, af had only 0.2%. The small effect observed is probably due to the parameter’s nature. The values here studied varied based on a log scale. This means that when analyzing the parameter percentage variation against the F.S. percentage variation, the ratio found was necessarily small. This issue could be bypassed if a different methodology, taking the AEV value into consideration, was adopted.
It was found that the safety of the soil slope numerical model studied in this paper was most affected by the soil slope inclination, friction angle and initial pore water condition profile, among the parameters observed. With this information, it will be possible to evaluate, in a future work, how each of these parameters affects the position and the limits of a rainfall threshold. Moreover, different initial pore water condition profiles and different rainfall scenarios should be assessed in order to better quantify the influence of the other hydraulic parameters.
Although the constitutive models adopted have proven satisfactory in representing the hydraulic and mechanical behavior of unsaturated soils, the presented results must be considered with caution due to the previously mentioned idealization in the numerical model used in this study. Furthermore, although the analyses were based on a single SWCC model, and therefore, the parametric study is restricted to the performance of this model, it is understood that the results and conclusions obtained are of broad scientific interest, since this is one of the most comprehensive models portrayed in the literature.
Finally, the factor of safety is not the only means of quantifying the margin of safety of a slope, because nominally, identical slopes can have different probabilities of failure due to variability in soil properties. Thus, a probabilistic analysis of this type of parametric study is highly recommended to complement the interpretation of the results.

Author Contributions

Conceptualization, E.d.P.O., V.P.F. and A.C.M.K.; Data curation, E.d.P.O. and A.M.G.A.; Formal analysis, E.d.P.O.; Methodology, E.d.P.O.; Project management, E.d.P.O.; Supervision, E.d.P.O., V.P.F. and A.C.M.K.; Validation, E.d.P.O. and A.M.G.A.; Visualization, E.d.P.O., A.M.G.A., V.S.M. and A.C.M.K.; Writing—original draft, E.d.P.O.; Writing—review and editing, E.d.P.O., A.M.G.A., V.S.M., V.P.F. and A.C.M.K. All authors have read and agreed to the published version of the manuscript.

Funding

This research received no external funding.

Institutional Review Board Statement

Not Applicable.

Informed Consent Statement

Not Applicable.

Data Availability Statement

Not applicable.

Acknowledgments

The authors would like to thank UFPR and especially the Graduate Program in Civil Engineering at UFPR (PPGEC/UFPR) for the support given to this research. The first author would also like to thank UFPR—Federal University of Paraná (CPP–CEM/UFPR, Brazil) for promoting her research during her time away.

Conflicts of Interest

The authors declare no conflict of interest.

References

  1. Brand, E.W.; Premchitt, J.; Phillipson, H.B. Relationship between rainfall and landslides in Hong Kong. In Proceedings of the 4th International Symposium on Landslides, Toronto, ON, Canada, 16–21 September 1984. [Google Scholar]
  2. Ng, C.W.W.; Shi, Q. A numerical investigation of the stability of unsaturated soil slopes subjected to transient seepage. Comput. Geotech. 1998, 22, 1–28. [Google Scholar] [CrossRef]
  3. Marin, R.J.; Velásquez, M.F. Influence of hydraulic properties on physically modelling slope stability and the definition of rainfall thresholds for shallow landslides. Geomorphology 2020, 351, 106976. [Google Scholar] [CrossRef]
  4. Leach, B.; Herbert, R. The genesis of a numerical model for the study of the hydrogeology of a steep hillside in Hong Kong. Q. J. Eng. Geol. Hydrogeol. 1982, 15, 243–259. [Google Scholar] [CrossRef]
  5. Lam, L.; Fredlund, D.G.; Barbour, S.L. Transient seepage model for saturated–unsaturated soil systems: A geotechnical engineering approach. Can. Geotech. J. 1987, 24, 565–580. [Google Scholar] [CrossRef] [Green Version]
  6. Fredlund, D.G.; Rahardjo, H. Soil Mechanics for Unsaturated Soils; John Wiley & Sons: New York, NY, USA, 1993. [Google Scholar] [CrossRef]
  7. Hungr, O.; Leroueil, S.; Picarelli, L. The Varnes classification of landslide types, an update. Landslides 2014, 11, 167–194. [Google Scholar] [CrossRef]
  8. Alessio, P. Spatial variability of saturated hydraulic conductivity and measurement-based intensity-duration thresholds for slope stability, Santa Ynez Valley, CA. Geomorphology 2019, 342, 103–116. [Google Scholar] [CrossRef]
  9. Lumb, P. Slope failures in Hong Kong. Q. J. Eng. Geol. Hydrogeol. 1975, 8, 31–65. [Google Scholar] [CrossRef]
  10. Ng, C.W.W.; Shi, Q. Influence of rainfall intensity and duration on slope stability in unsaturated soils. Q. J. Eng. Geol. 1998, 31, 105–114. [Google Scholar] [CrossRef]
  11. Salciarini, D.; Tamagnini, C.; Conversini, P.; Rapinesi, S. Spatially distributed rainfall thresholds for the initiation of shallow landslides. Nat. Hazards 2012, 61, 229–245. [Google Scholar] [CrossRef]
  12. Papa, M.N.; Medina, V.; Ciervo, F.; Bateman, A. Derivation of critical rainfall thresholds for shallow landslides as a tool for debris flow early warning systems. Hydrol. Earth Syst. Sci. 2013, 17, 4095–4107. [Google Scholar] [CrossRef] [Green Version]
  13. Alvioli, M.; Guzzetti, F.; Rossi, M. Scaling properties of rainfall induced landslides predicted by a physically based model. Geomorphology 2014, 213, 38–47. [Google Scholar] [CrossRef] [Green Version]
  14. Wu, Y.-M.; Lan, H.-X.; Gao, X.; Li, L.-P.; Yang, Z.-H. A simplified physically based coupled rainfall threshold model for triggering landslides. Eng. Geol. 2015, 195, 63–69. [Google Scholar] [CrossRef]
  15. Alvioli, M.; Melillo, M.; Guzzetti, F.; Rossi, M.; Palazzi, E.; von Hardenberg, J.; Brunetti, M.T.; Peruccacci, S. Implications of climate change on landslide hazard in Central Italy. Sci. Total Environ. 2018, 630, 1528–1543. [Google Scholar] [CrossRef] [PubMed]
  16. Guzzetti, F.; Peruccacci, S.; Rossi, M.; Stark, C.P. Rainfall thresholds for the initiation of landslides in central and southern Europe. Meteorol. Atmos. Phys. 2007, 98, 239–267. [Google Scholar] [CrossRef]
  17. Segoni, S.; Piciullo, L.; Gariano, S.L. A review of the recent literature on rainfall thresholds for landslide occurrence. Landslides 2018, 15, 1483–1501. [Google Scholar] [CrossRef]
  18. Montgomery, D.R.; Dietrich, W.E. A physically based model for the topographic control on shallow landsliding. Water Resour. Res. 1994, 30, 1153–1171. [Google Scholar] [CrossRef]
  19. van Westen, C.J.; Terlien, M.T.J. An approach towards deterministic landslide hazard analysis in GIS. A case study from Manizales (Colombia). Earth Surf. Processes Landf. 1996, 21, 853–868. [Google Scholar] [CrossRef]
  20. Crosta, G. Regionalization of rainfall thresholds: An aid to landslide hazard evaluation. Environ. Earth Sci. 1998, 35, 131–145. [Google Scholar] [CrossRef]
  21. Iverson, R.M. Landslide triggering by rain infiltration. Water Resour. Res. 2000, 36, 1897–1910. [Google Scholar] [CrossRef]
  22. Jakob, M.; Weatherly, H. A hydroclimatic threshold for landslide initiation on the North Shore Mountains of Vancouver, British Columbia. Geomorphology 2003, 54, 137–156. [Google Scholar] [CrossRef]
  23. Godt, J.W.; Baum, R.L.; Savage, W.Z.; Salciarini, D.; Schulz, W.H.; Harp, E.L. Transient deterministic shallow landslide modeling: Requirements for susceptibility and hazard assessments in a GIS framework. Eng. Geol. 2008, 102, 214–226. [Google Scholar] [CrossRef]
  24. Baum, R.L.; Godt, J.W. Early warning of rainfall-induced shallow landslides and debris flows in the USA. Landslides 2010, 7, 259–272. [Google Scholar] [CrossRef]
  25. Arnone, E.; Dialynas, Y.G.; Noto, L.V.; Bras, R.L. Accounting for soil parameter uncertainty in a physically based and distributed approach for rainfall-triggered landslides. Hydrol. Process. 2016, 30, 927–944. [Google Scholar] [CrossRef]
  26. Hsu, Y.-C.; Chang, Y.-L.; Chang, C.-H.; Yang, J.-C.; Tung, Y.-K. Physical-based rainfall-triggered shallow landslide forecasting. Smart Water 2018, 3, 3. [Google Scholar] [CrossRef]
  27. Reder, A.; Rianna, G.; Pagano, L. Physically based approaches incorporating evaporation for early warning predictions of rainfall-induced landslides. Nat. Hazards Earth Syst. Sci. 2018, 18, 613–631. [Google Scholar] [CrossRef] [Green Version]
  28. Bogaard, T.; Greco, R. Invited perspectives: Hydrological perspectives on precipitation intensity-duration thresholds for landslide initiation: Proposing hydro-meteorological thresholds. Nat. Hazards Earth Syst. Sci. 2018, 18, 31–39. [Google Scholar] [CrossRef] [Green Version]
  29. Bezak, N.; Auflič, M.J.; Mikoš, M. Application of hydrological modelling for temporal prediction of rainfall-induced shallow landslides. Landslides 2019, 16, 1273–1283. [Google Scholar] [CrossRef] [Green Version]
  30. Rahardjo, H.; Ong, T.H.; Rezaur, R.B.; Leong, E.C. Factors Controlling Instability of Homogeneous Soil Slopes under Rainfall. J. Geotech. Geoenviron. Eng. 2007, 133, 1532–1543. [Google Scholar] [CrossRef]
  31. Khan, M.; Wang, S. Slope Stability Analysis to Correlate Shear Strength with Slope Angle and Shear Stress by Considering Saturated and Unsaturated Seismic Conditions. Appl. Sci. 2021, 11, 4568. [Google Scholar] [CrossRef]
  32. Salciarini, D.; Godt, J.W.; Savage, W.Z.; Conversini, P.; Baum, R.L.; Michael, J.A. Modeling regional initiation of rainfall-induced shallow landslides in the eastern Umbria Region of central Italy. Landslides 2006, 3, 181–194. [Google Scholar] [CrossRef]
  33. Arnone, E.; Noto, L.; Lepore, C.; Bras, R. Physically-based and distributed approach to analyze rainfall-triggered landslides at watershed scale. Geomorphology 2011, 133, 121–131. [Google Scholar] [CrossRef] [Green Version]
  34. Beyabanaki, S.A.R.; Bagtzoglou, A.C.; Anagnostou, E.N. Effects of groundwater table position, soil strength properties and rainfall on instability of earthquake-triggered landslides. Environ. Earth Sci. 2016, 75, 358. [Google Scholar] [CrossRef]
  35. Rahimi, A.; Rahardjo, H.; Leong, E.-C. Effect of hydraulic properties of soil on rainfall-induced slope failure. Eng. Geol. 2010, 114, 135–143. [Google Scholar] [CrossRef]
  36. Ray, R.L.; Jacobs, J.M.; de Alba, P. Impacts of Unsaturated Zone Soil Moisture and Groundwater Table on Slope Instability. J. Geotech. Geoenviron. Eng. 2010, 136, 1448–1458. [Google Scholar] [CrossRef] [Green Version]
  37. Rahardjo, H.; Nio, A.S.; Leong, E.C.; Song, N.Y. Effects of Groundwater Table Position and Soil Properties on Stability of Slope during Rainfall. J. Geotech. Geoenviron. Eng. 2010, 136, 1555–1564. [Google Scholar] [CrossRef]
  38. SoilVision Systems Ltd. Team. SOILVISION Manager CONNECT (v10.03.00.92.); SOILVISION: Saskatoon, SK, Canada, 2018. [Google Scholar]
  39. González Acevedo, A.M.; Passini, L.D.B.; Kormann, A.C.M. Rainfall Effects on Pore Pressure Changes in a Coastal Slope of the Serra do Mar in Santa Catarina. Soils Rocks 2017, 40, 263–278. [Google Scholar] [CrossRef]
  40. Fredlund, D.G.; Xing, A. Erratum: Equations for the soil-water characteristic curve. Can. Geotech. J. 1994, 31, 1026. [Google Scholar] [CrossRef]
  41. Fredlund, D.; Xing, A.; Huang, S. Predicting the permeability function for unsaturated soils using the soil-water characteristic curve. Can. Geotech. J. 1994, 31, 533–546. [Google Scholar] [CrossRef] [Green Version]
  42. Montrasio, L.; Valentino, R. A model for triggering mechanisms of shallow landslides. Nat. Hazards Earth Syst. Sci. 2008, 8, 1149–1159. [Google Scholar] [CrossRef]
  43. Benson, C.H.; Gunter, J.A.; Boutwell, G.P.; Trautwein, S.J.; Berzanskis, P.H. Comparison of Four Methods to Assess Hydraulic Conductivity. J. Geotech. Geoenviron. Eng. 1997, 123, 929–937. [Google Scholar] [CrossRef]
  44. Leong, E.C.; Rahardjo, H. Permeability Functions for Unsaturated Soils. J. Geotech. Geoenviron. Eng. 1997, 123, 1118–1126. [Google Scholar] [CrossRef] [Green Version]
  45. Kanji, M.A.; Cruz, P.T.; Massad, F.; Araujo, F.H.A. Basic and Common Characteristics of Debris Flows. In Proceedings of the Second Panamerican Symposium on Landslides, Rio de Janeiro, Brazil, 10–14 November 1997; pp. 232–240. [Google Scholar]
  46. Cogan, J.; Gratchev, I. A study on the effect of rainfall and slope characteristics on landslide initiation by means of flume tests. Landslides 2019, 16, 2369–2379. [Google Scholar] [CrossRef]
  47. Cheng, Y.M.; Lansivaara, T.; Wei, W.B. Two-dimensional slope stability analysis by limit equilibrium and strength reduction methods. Comput. Geotech. 2007, 34, 137–150. [Google Scholar] [CrossRef]
  48. Meisina, C.; Scarabelli, S. A comparative analysis of terrain stability models for predicting shallow landslides in colluvial soils. Geomorphology 2007, 87, 207–223. [Google Scholar] [CrossRef]
  49. Liu, W.; Ouyang, G.; Luo, X.; Luo, J.; Hu, L.; Fu, M. Moisture content, pore-water pressure and wetting front in granite residual soil during collapsing erosion with varying slope angle. Geomorphology 2020, 362, 107210. [Google Scholar] [CrossRef]
  50. Fredlund, D.G.; Morgenstern, N.R.; Widger, R.A. The shear strength of unsaturated soils. Can. Geotech. J. 1978, 15, 313–321. [Google Scholar] [CrossRef]
  51. Zhang, L.L.; Fredlund, D.G.; Fredlund, M.; Wilson, G.W. Modeling the unsaturated soil zone in slope stability analysis. Can. Geotech. J. 2014, 51, 1384–1398. [Google Scholar] [CrossRef]
  52. Smethurst, J.A.; Clarke, D.; Powrie, W. Factors controlling the seasonal variation in soil water content and pore water pressures within a lightly vegetated clay slope. Geotechnique 2012, 62, 429–446. [Google Scholar] [CrossRef]
  53. Pretto, J.H.F.; Sestrem, L.P.; Kormann, A.C.M.; Marinho, F.A.M. Caracterização das Camadas Não Saturadas de Uma Encosta Litorânea: Determinação da Curva de Retenção de Água. In Proceedings of the VI COBRAE, Angra dos Reis, Brazil, 4–6 October 2013; pp. 242–248. [Google Scholar]
  54. Smethurst, J.A.; Clarke, D.; Powrie, W. Seasonal changes in pore water pressure in a grass-covered cut slope in London Clay. In Stiff Sedimentary Clays: Genesis and Engineering Behaviour—Geotechnique Symposium in Print 2007; Thomas Telford Ltd.: London, UK, 2011; pp. 337–351. [Google Scholar] [CrossRef]
  55. Oliveira, E.P. O impacto das mudanças climáticas nos deslizamentos de terra em regiões de clima tropical e subtropical. Federal University of Paraná, Curitiba, Brazil, May. Ph.D thesis, Federal University of Paraná, Curitiba, Brazil, May 2021. [Google Scholar]
  56. Morgenstern, N.R.; Price, V.E. The analysis of the stability of general slip surfaces. Géotechnique 1965, 15, 79–93. [Google Scholar] [CrossRef]
  57. Furuya, T. Review and comparison of limit equilibrium methods of slices for slope stability analysis. Bull. Natl. Inst. Rural. Eng. 2004, 43, 1–22. [Google Scholar]
  58. Borja, R.I.; White, J.A.; Liu, X.; Wu, W. Factor of safety in a partially saturated slope inferred from hydro-mechanical continuum modeling. Int. J. Numer. Anal. Methods Geomech. 2012, 36, 236–248. [Google Scholar] [CrossRef] [Green Version]
  59. Kokutse, N.K.; Temgoua, A.G.T.; Kavazović, Z. Slope stability and vegetation: Conceptual and numerical investigation of mechanical effects. Ecol. Eng. 2016, 86, 146–153. [Google Scholar] [CrossRef]
  60. Rahardjo, H.; Leong, E.C.; Rezaur, R.B. Effect of antecedent rainfall on pore-water pressure distribution characteristics in residual soil slopes under tropical rainfall. Hydrol Process. 2008, 22, 506–523. [Google Scholar] [CrossRef]
  61. Song, K.; Yan, E.; Zhang, G.; Lu, S.; Yi, Q. Effect of hydraulic properties of soil and fluctuation velocity of reservoir water on landslide stability. Environ. Earth Sci. 2015, 74, 5319–5329. [Google Scholar] [CrossRef]
  62. Ching, R.K.H.; Sweeney, D.J.; Fredlund, D.G. Increase in factor of safety due to soil suction for two Hong Kong slopes. In Proceedings of the 4th International Symposium on Landslides, Toronto, ON, Canada, 16–21 September 1984. [Google Scholar]
  63. Hammond, C.; Hall, D.; Miller, S.; Swetik, P. Level I Stability Analysis (LISA) Documentation for Version 2.0; Intermountain Research Station: Ogden, UT, USA, 1992. [Google Scholar]
  64. Borja, R.I.; White, J.A. Continuum deformation and stability analyses of a steep hillside slope under rainfall infiltration. Acta Geotech. 2010, 5, 1–14. [Google Scholar] [CrossRef]
Figure 1. Methodology flowchart.
Water 14 03561 g001
Figure 2. Model geometry, boundary conditions for infiltration process, finite element mesh and pore water control section locations (AA, BB, CC and DD).
Water 14 03561 g002
Figure 3. Factor of safety variation with slope declivity.
Water 14 03561 g003
Figure 4. Initial pore pressure profiles.
Water 14 03561 g004
Figure 5. Factor of safety variation with pore pressure initial conditions.
Water 14 03561 g005
Figure 6. SWCC used for different θsat values.
Water 14 03561 g006
Figure 7. SWCC curves and permeability functions for different Fredlund and Xing parameter values: (a) af; (b) nf; (c) mf; (d) hr.
Water 14 03561 g007
Figure 8. Factor of Safety variation versus Fredlund and Xing parameters (a) af; (b) nf; (c) mf; (d) hr.
Water 14 03561 g008
Figure 9. Factor of safety variation versus permeability coefficient ksat.
Water 14 03561 g009
Figure 10. Factor of safety variation for different permeability coefficients. (a) ksat = 1.71 × 10⁻⁶ m/s, (b) ksat = 1.71 × 10⁻⁷ m/s (Basic Run), (c) ksat = 1.71 × 10⁻⁸ m/s.
Water 14 03561 g010
Figure 11. Factor of safety variation versus apparent soil cohesion.
Water 14 03561 g011
Figure 12. Factor of safety variation versus saturated friction angle (a) and unsaturated friction angle (b).
Water 14 03561 g012
Figure 13. Factor of safety variation versus natural specific weight.
Water 14 03561 g013
Table 1. Reference parameters and literature.
ParameterReference ValueReference
Slope declivity (degrees)40[30,47]
Maximum suction on unsaturated zone—ZAM a (kPa)40[52,54]
θsat (porosity)0.36[53] b
Fredlund and Xing fitting parametersaf (kPa)20[53] b
nf0.4[53] b
mf1.5[53] b
hr (kPa)10,000[53] b
ksat (m/s)1.71 × 10−7[39]
c′ (kPa)2[39]
ϕ′ (degrees)34[39]
ϕb (ϕ′/2)17[51]
γ natural wet specific weight (kN/m3)16.20[39]
a Refers to Zero Above a Maximum predetermined value; the values refer to the maximum allowed. b Field data were adjusted to [40] model in order to estimate the fitting parameters.
Table 2. Parametric analysis matrix (Adapted from [55]).
TestDeclivity
(o)
Maximum Suction Allowed (kPa)SWCC (Fredlund and Xing
Fitting Parameters)
ksat
(m/s)
c′
(kPa)
ϕ′
(o)
ϕb (o)γ (kN/m3)
θsatafnfmfhr (kPa)
Basic Run40ZAM *400.36200.401.510,0001.71 × 10−72341716.2
S_0130ZAM400.36200.401.510,0001.71 × 10−72341716.2
S_0250ZAM400.36200.401.510,0001.71 × 10−72341716.2
S_0340ZAM300.36200.401.510,0001.71 × 10−72341716.2
S_0440ZAM500.36200.401.510,0001.71 × 10−72341716.2
S_0540ZAM400.25200.401.510,0001.71 × 10−72341716.2
S_0640ZAM400.45200.401.510,0001.71 × 10−72341716.2
S_0740ZAM400.361000.401.510,0001.71 × 10−72341716.2
S_0840ZAM400.3610000.401.510,0001.71 × 10−72341716.2
S_0940ZAM400.36200.201.510,0001.71 × 10−72341716.2
S_1040ZAM400.36204.001.510,0001.71 × 10−72341716.2
S_1140ZAM400.36200.400.510,0001.71 × 10−72341716.2
S_1240ZAM400.36200.404.010,0001.71 × 10−72341716.2
S_1340ZAM400.36200.401.511.71 × 10−72341716.2
S_1440ZAM400.36200.401.51 × 1061.71 × 10−72341716.2
S_1540ZAM400.36200.401.510,0001.71 × 10−62341716.2
S_1640ZAM400.36200.401.510,0001.71 × 10−82341716.2
S_1740ZAM400.36200.401.510,0001.71 × 10−71341716.2
S_1840ZAM400.36200.401.510,0001.71 × 10−710341716.2
S_1940ZAM400.36200.401.510,0001.71 × 10−72301716.2
S_2040ZAM400.36200.401.510,0001.71 × 10−72361716.2
S_2140ZAM400.36200.401.510,0001.71 × 10−7234016.2
S_2240ZAM400.36200.401.510,0001.71 × 10−72341816.2
S_2340ZAM400.36200.401.510,0001.71 × 10−72341715
S_2440ZAM400.36200.401.510,0001.71 × 10−72341724
* ZAM refers to zero above maximum.
Table 3. Air entry values for different Fredlund and Xing fitting parameter combinations.
afnfmfhrAEVϕ′b
200.44.010,0000.250
200.41.510.470
200.41.51,000,0000.840
200.41.510,0000.860
10000.41.510,0003.550
204.01.510,00013.0615
200.21.510,00027.5815
1000.41.510,00076.2815
200.40.510,000237.19ϕ′
Table 4. Sensitivity analysis.
ParameterΔF.S./Δparameter (%) a
Slope inclination146
Initial suction condition38
θsat7
af0.2
nf2
mf8
hr0.7
ksat0.9
Cohesion13
Friction angle93
Unsaturated friction angle7
Specific weight22
a Average of the absolute value.
Publisher’s Note: MDPI stays neutral with regard to jurisdictional claims in published maps and institutional affiliations.

