
Identification of Suitable Sites Using GIS for Rainwater Harvesting Structures to Meet Irrigation Demand


Abstract
1. Introduction
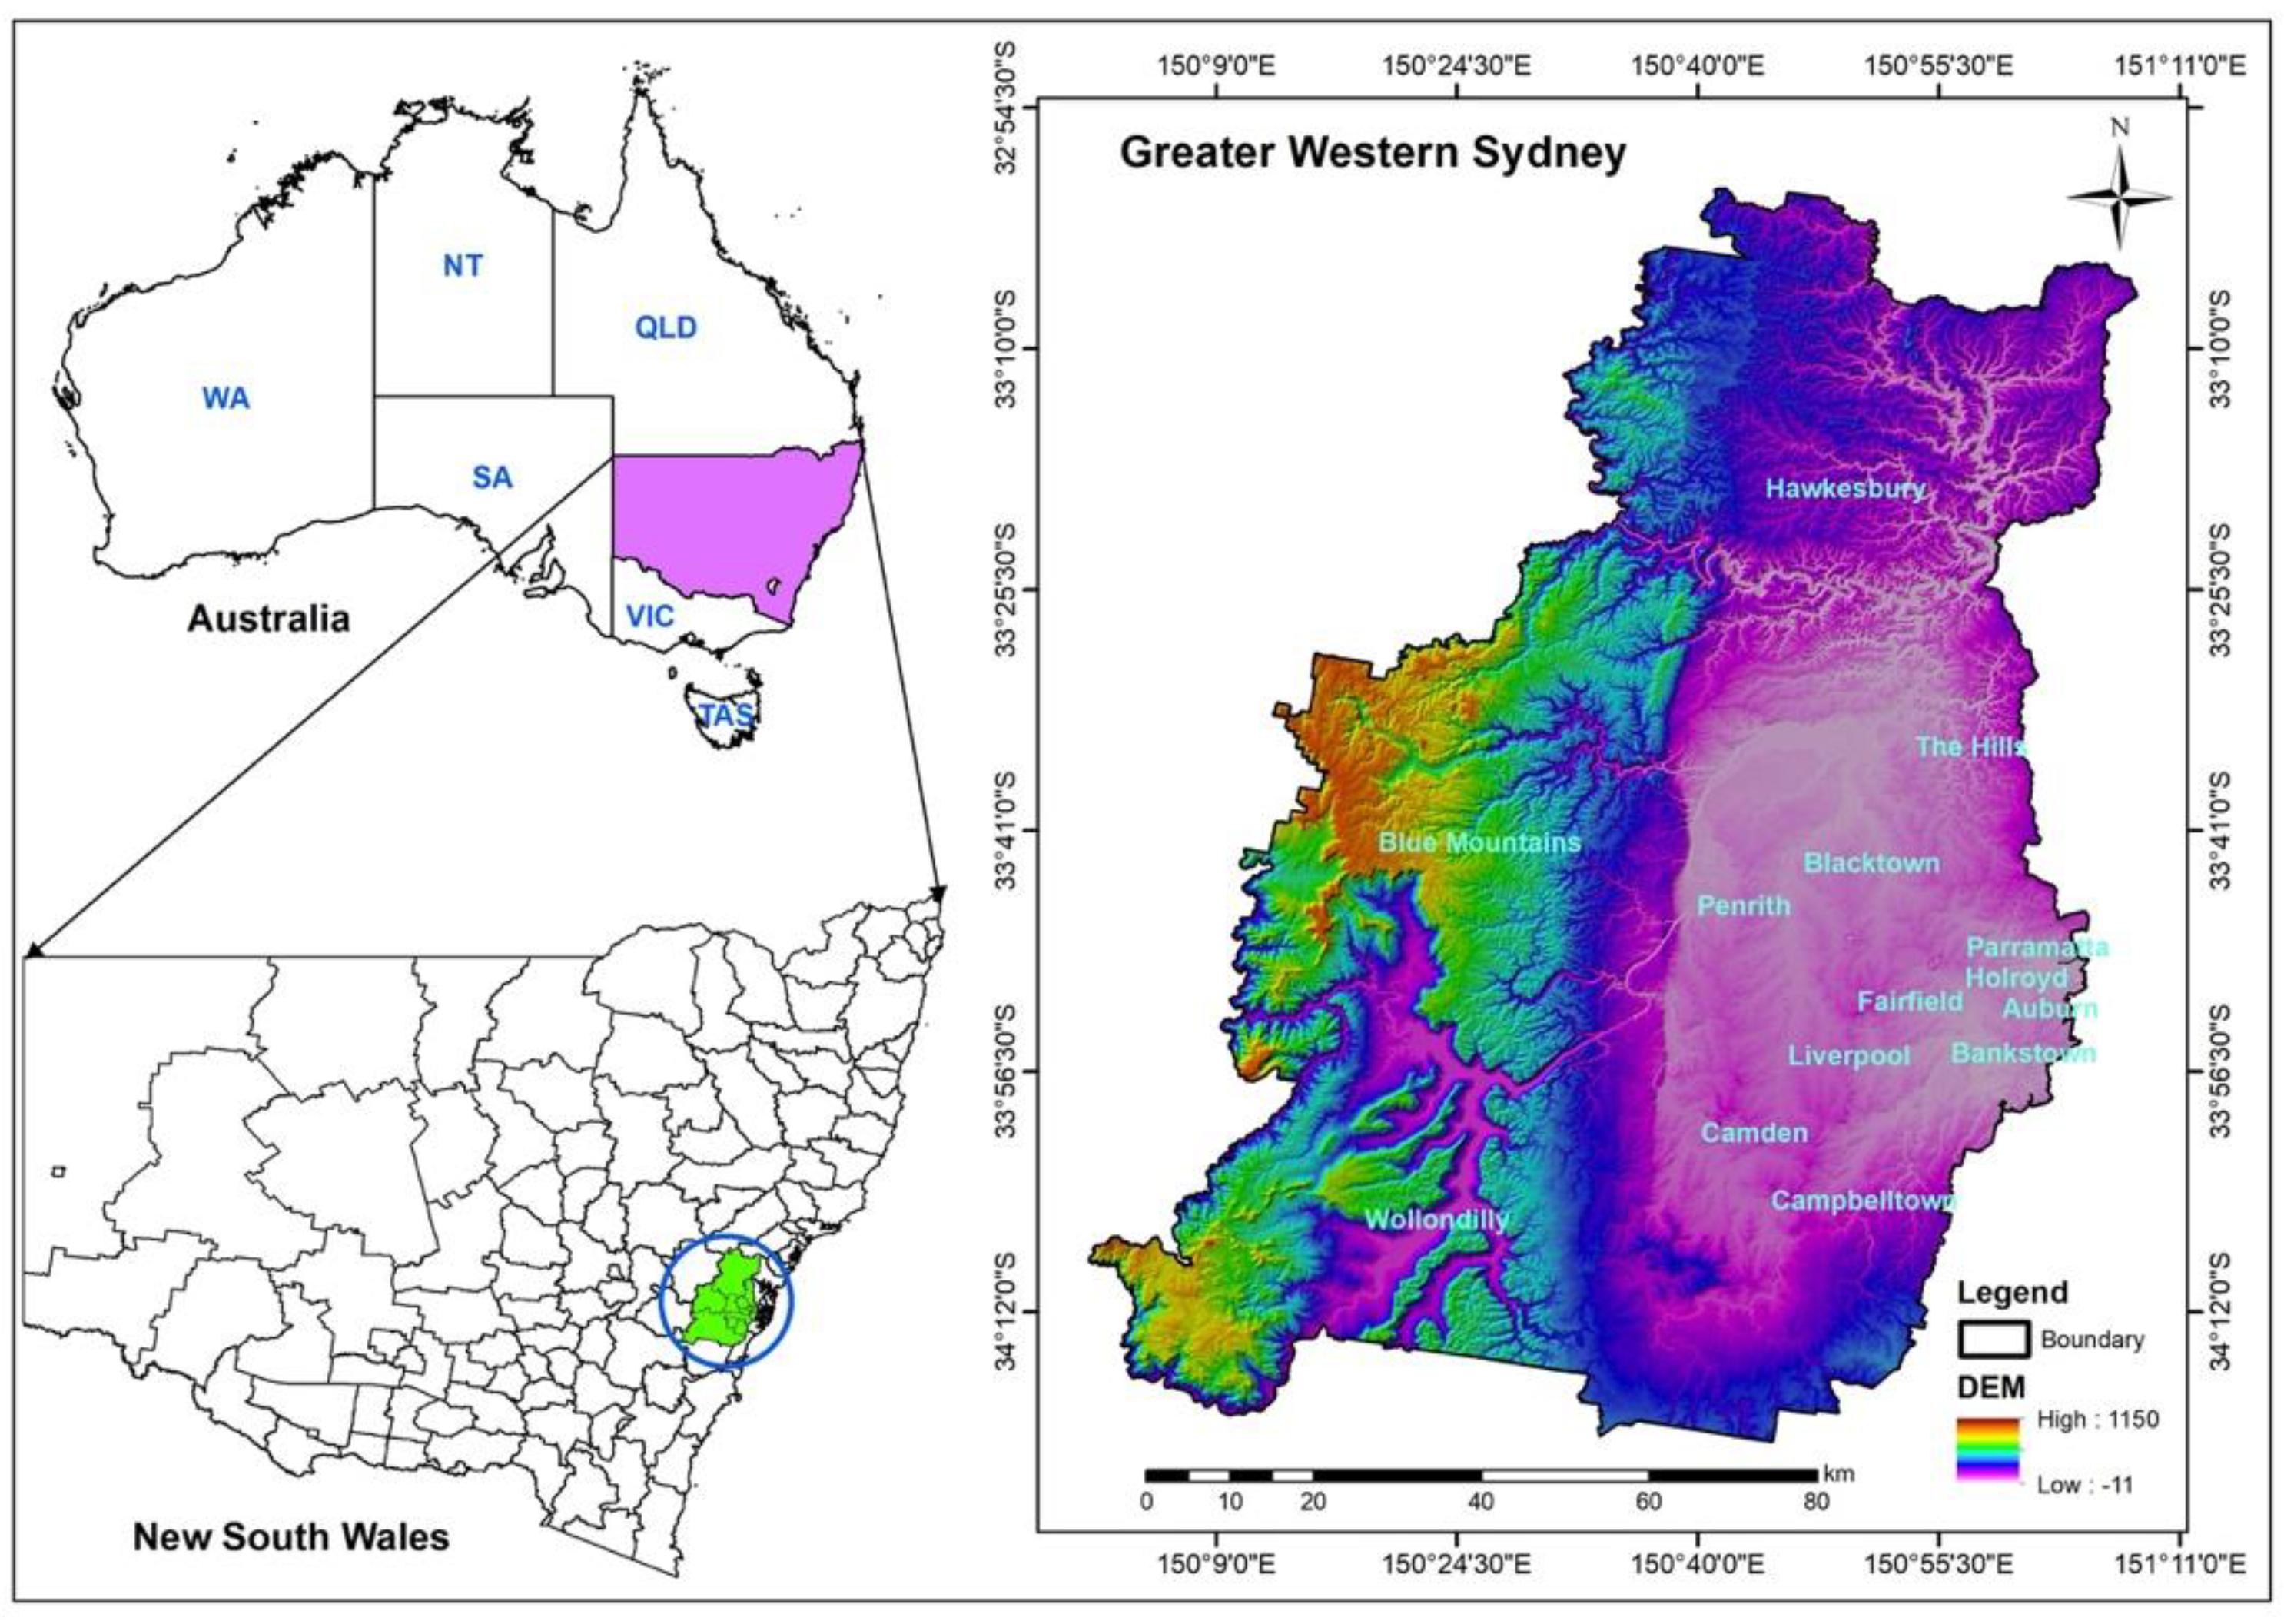
2. Study Area and Data
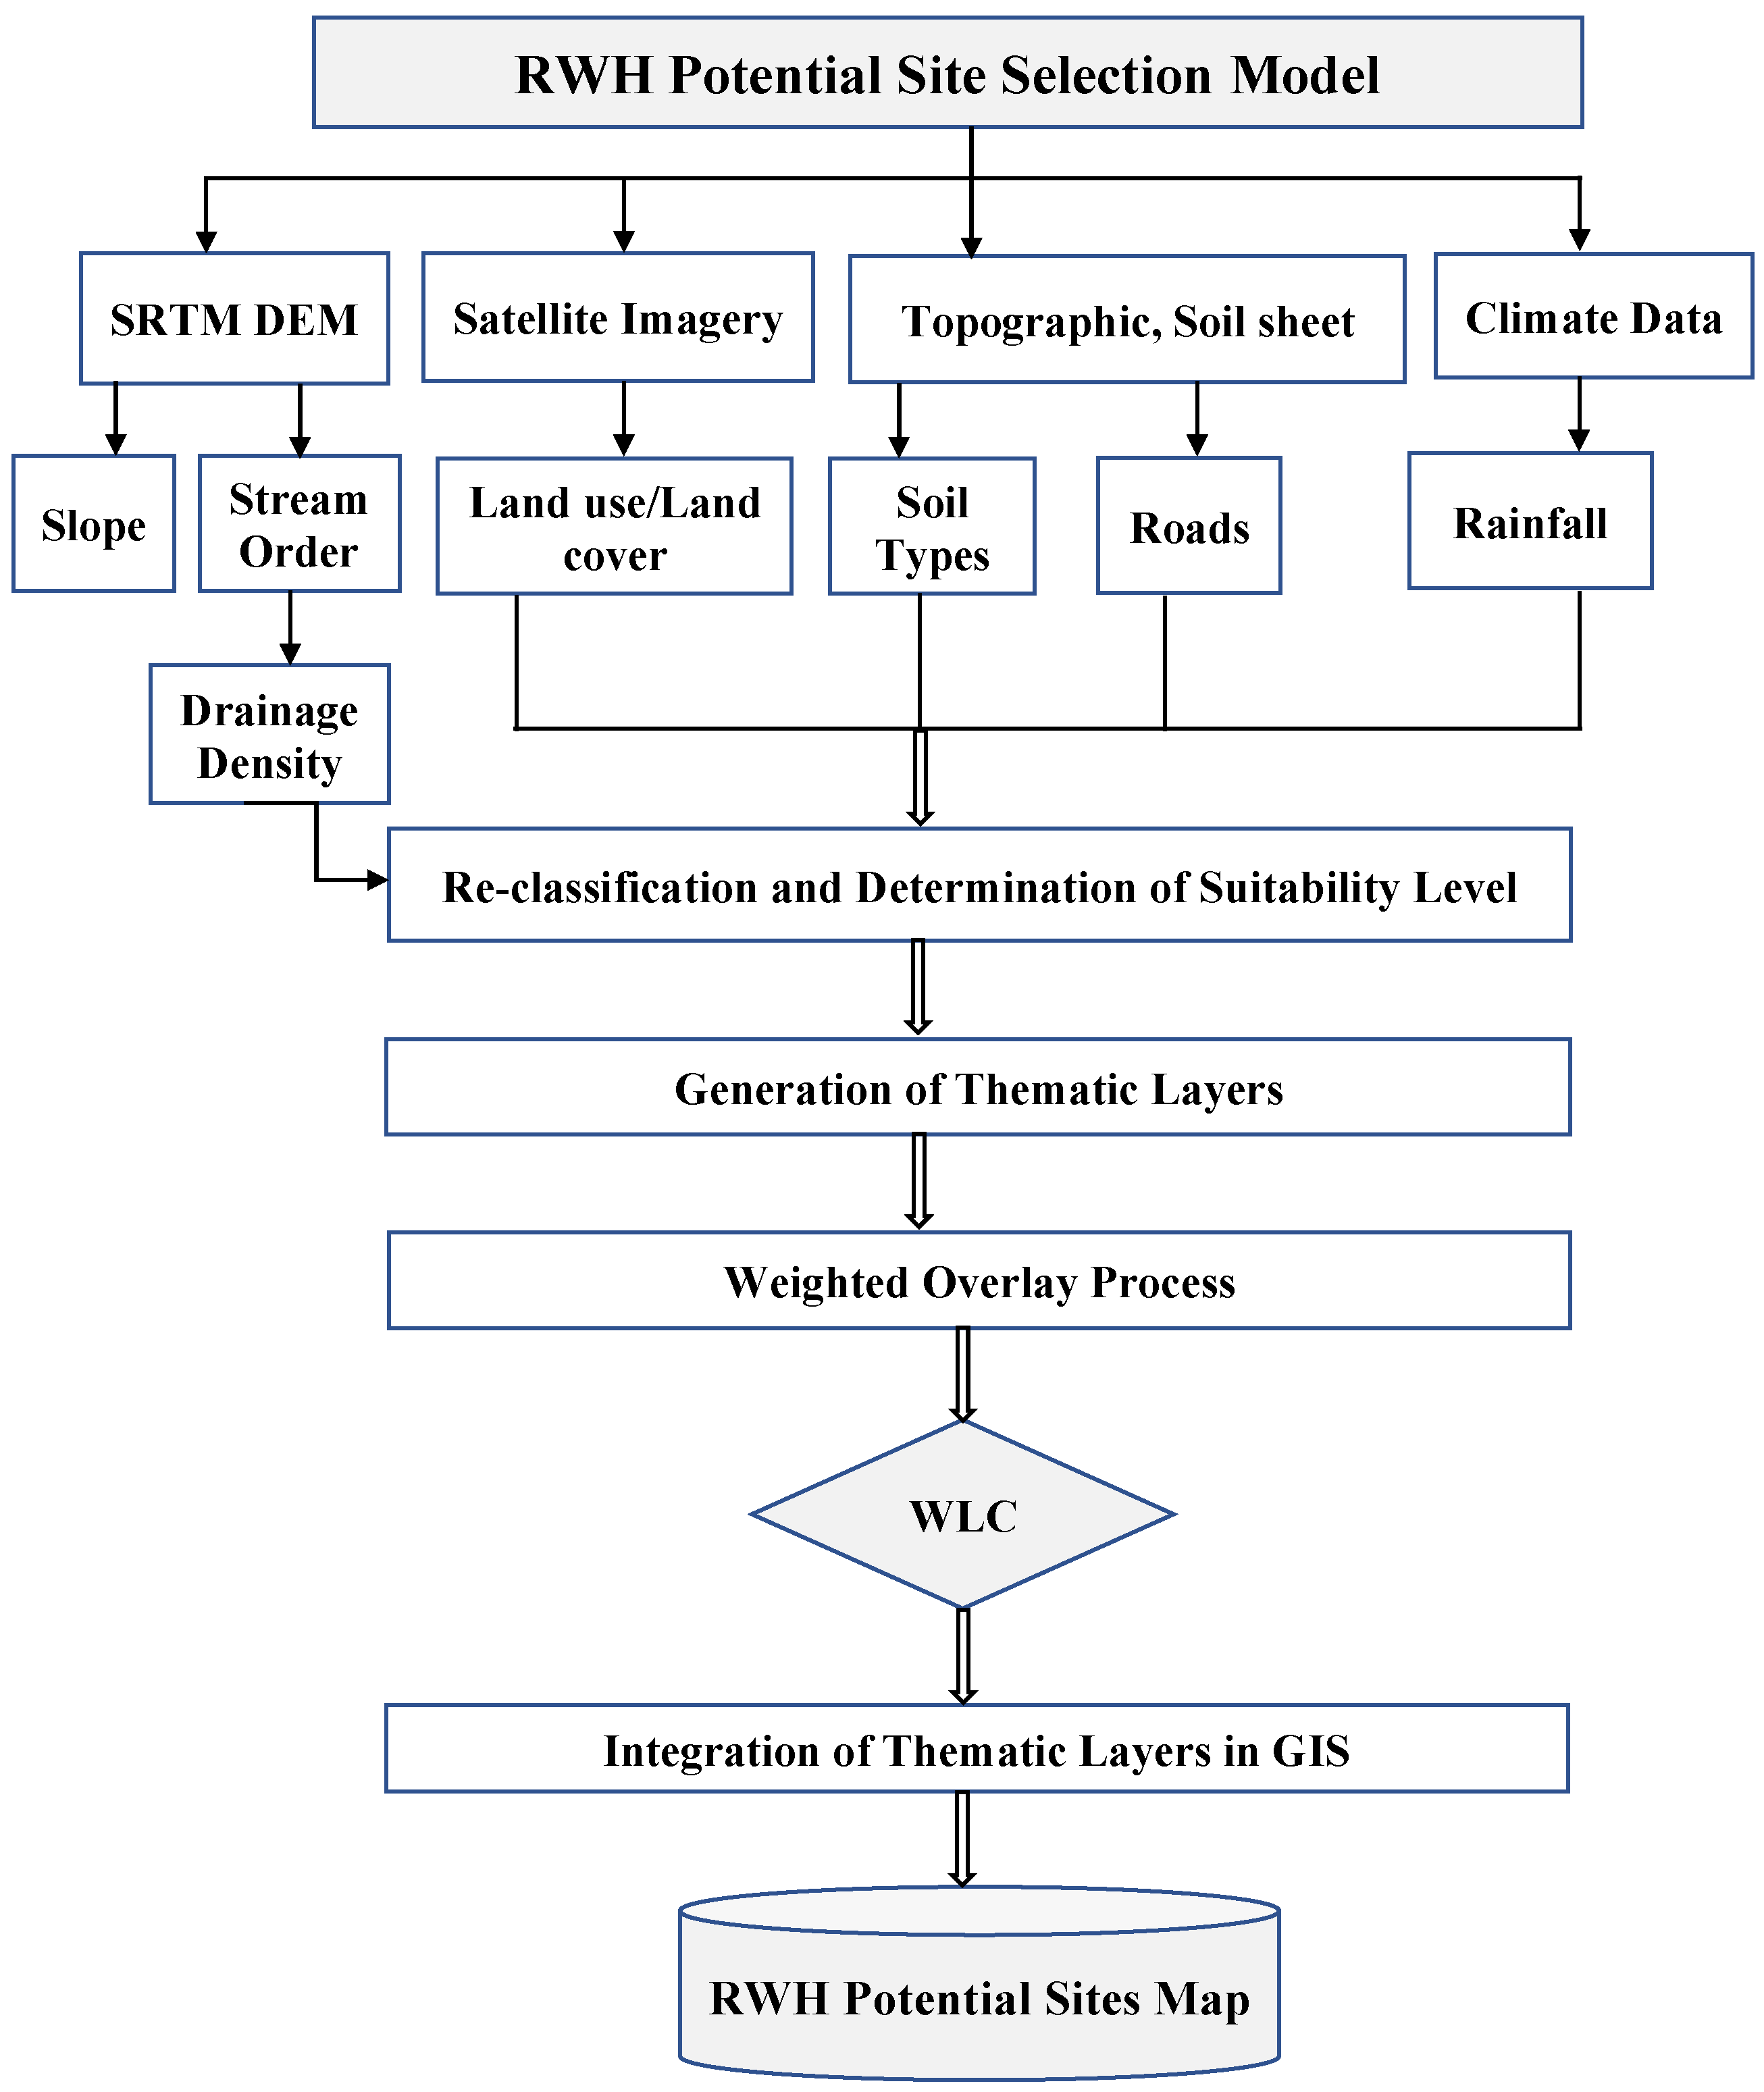
3. Methodology
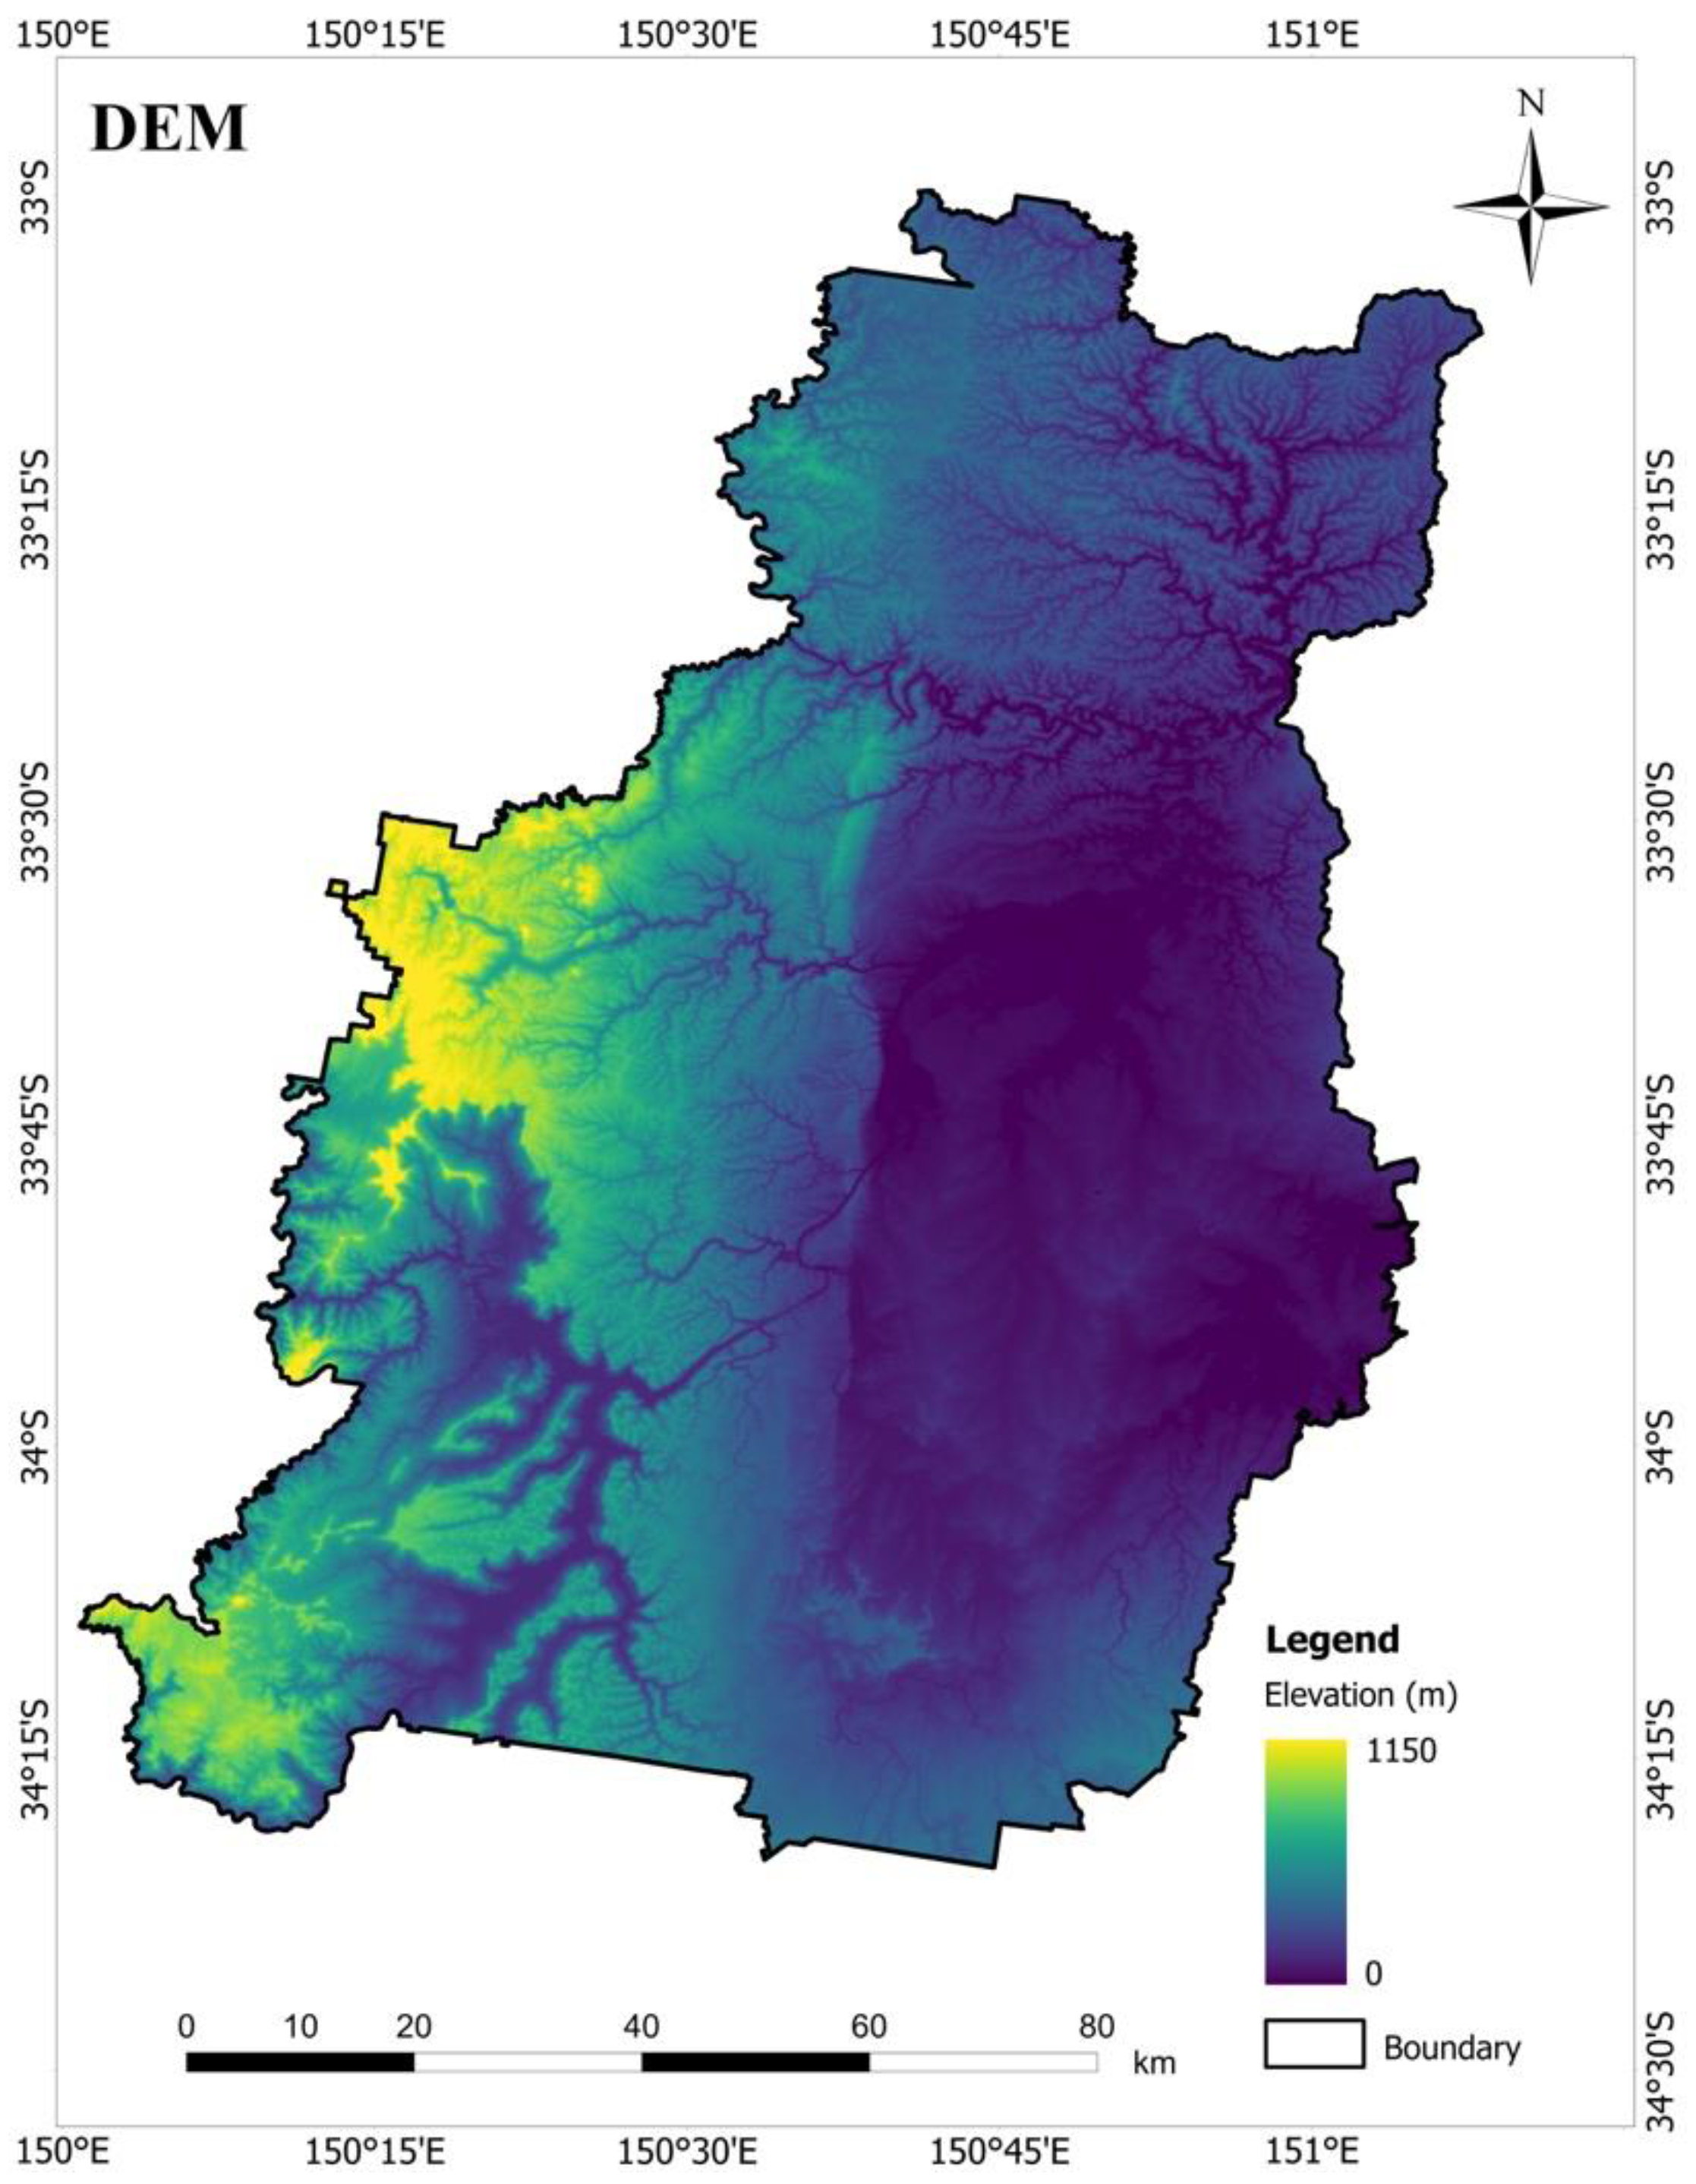
3.1. Digital Elevation Model (DEM)
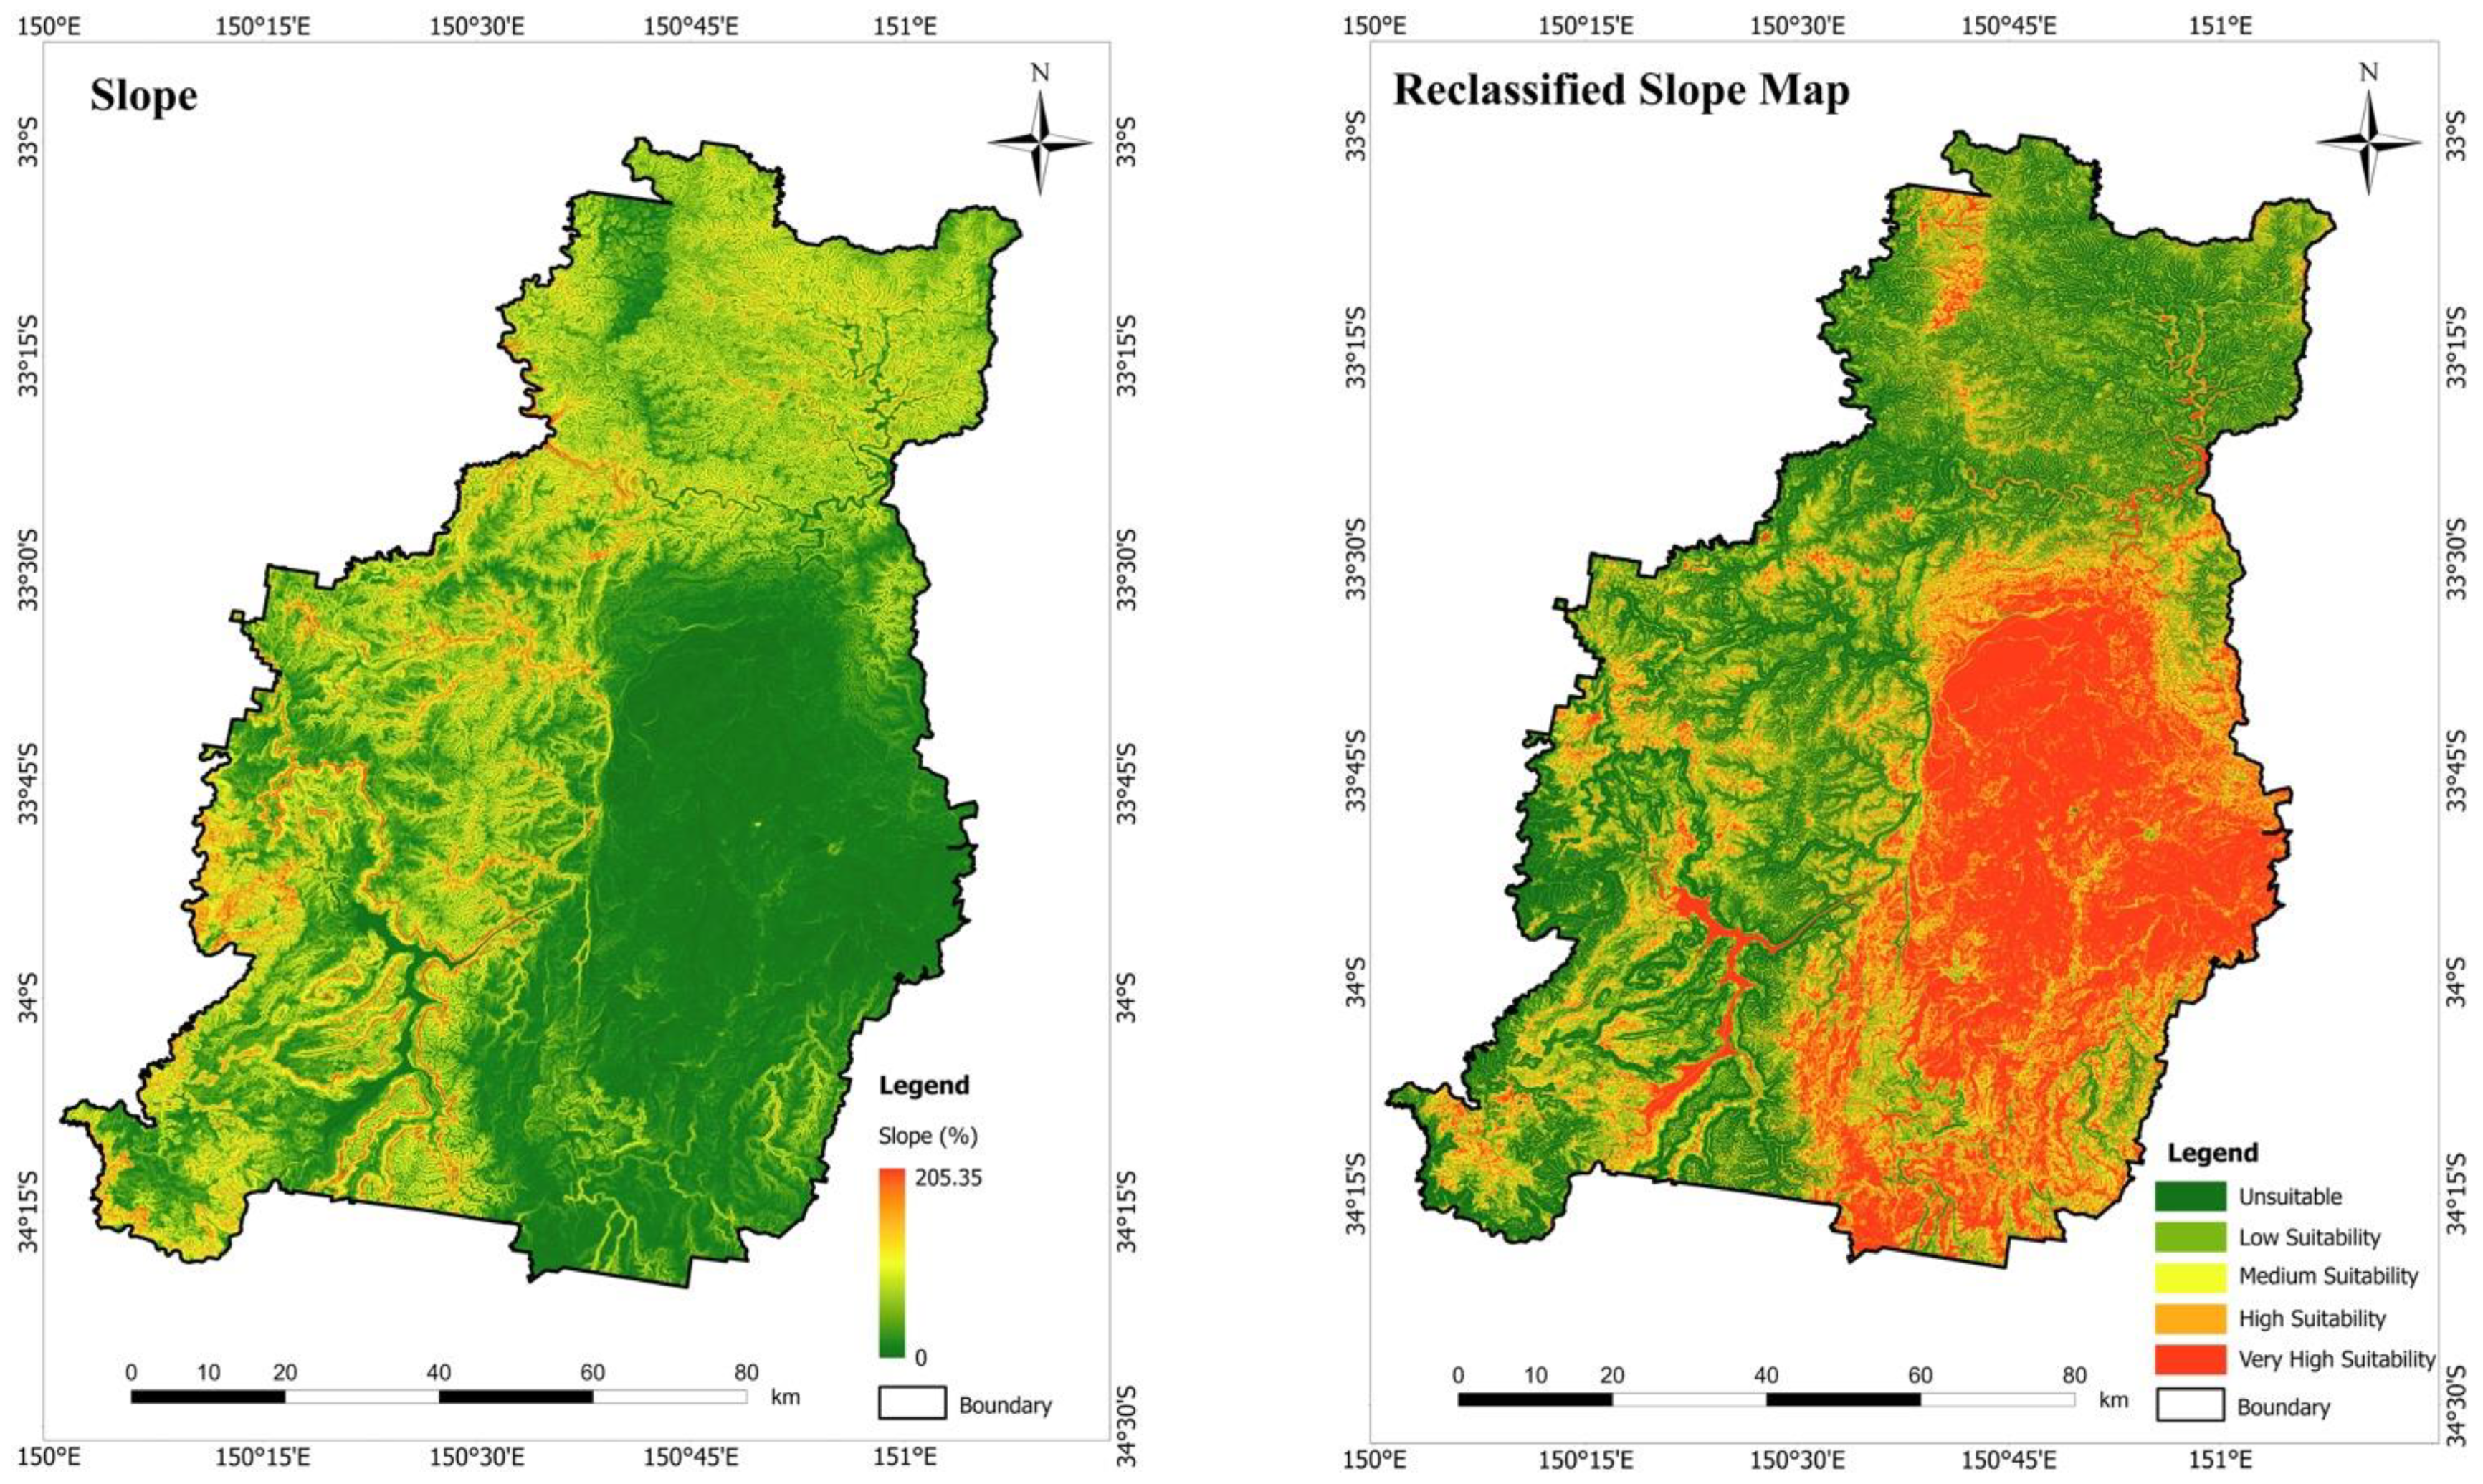
3.2. Slope
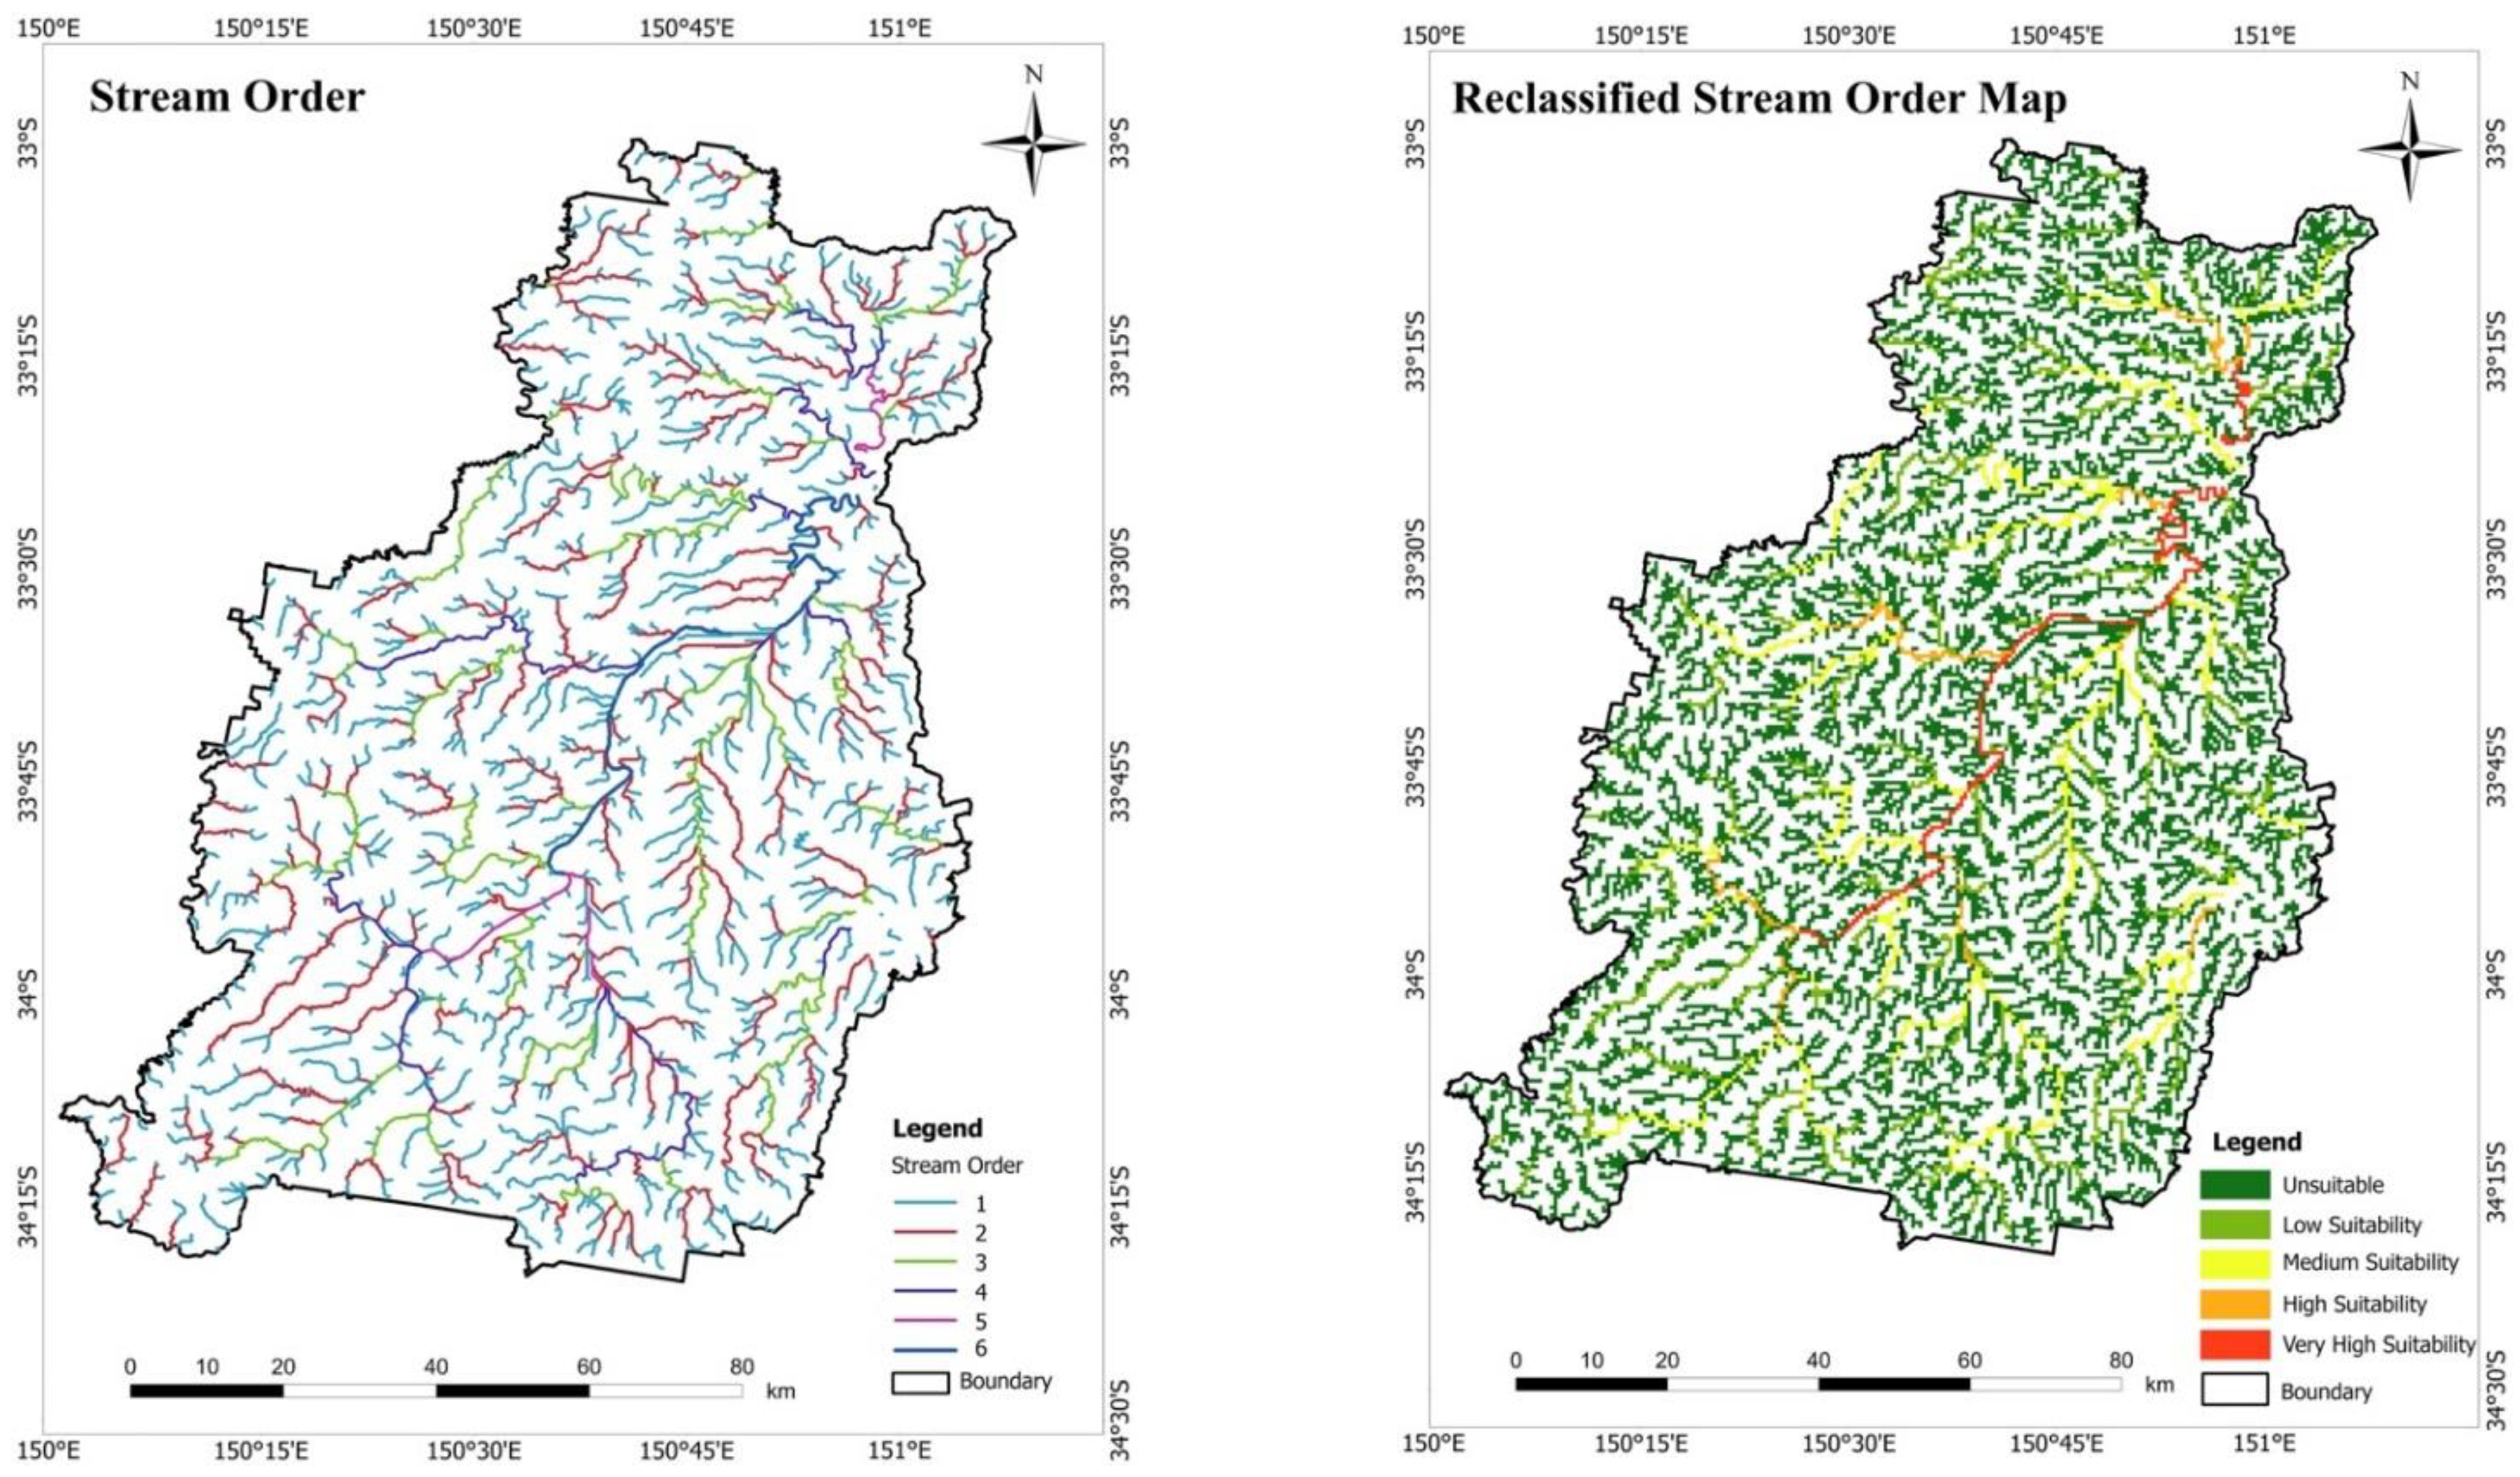
3.3. Stream Order
3.4. Drainage Density
3.5. Land Use/Land Cover (LULC)
3.6. Soil
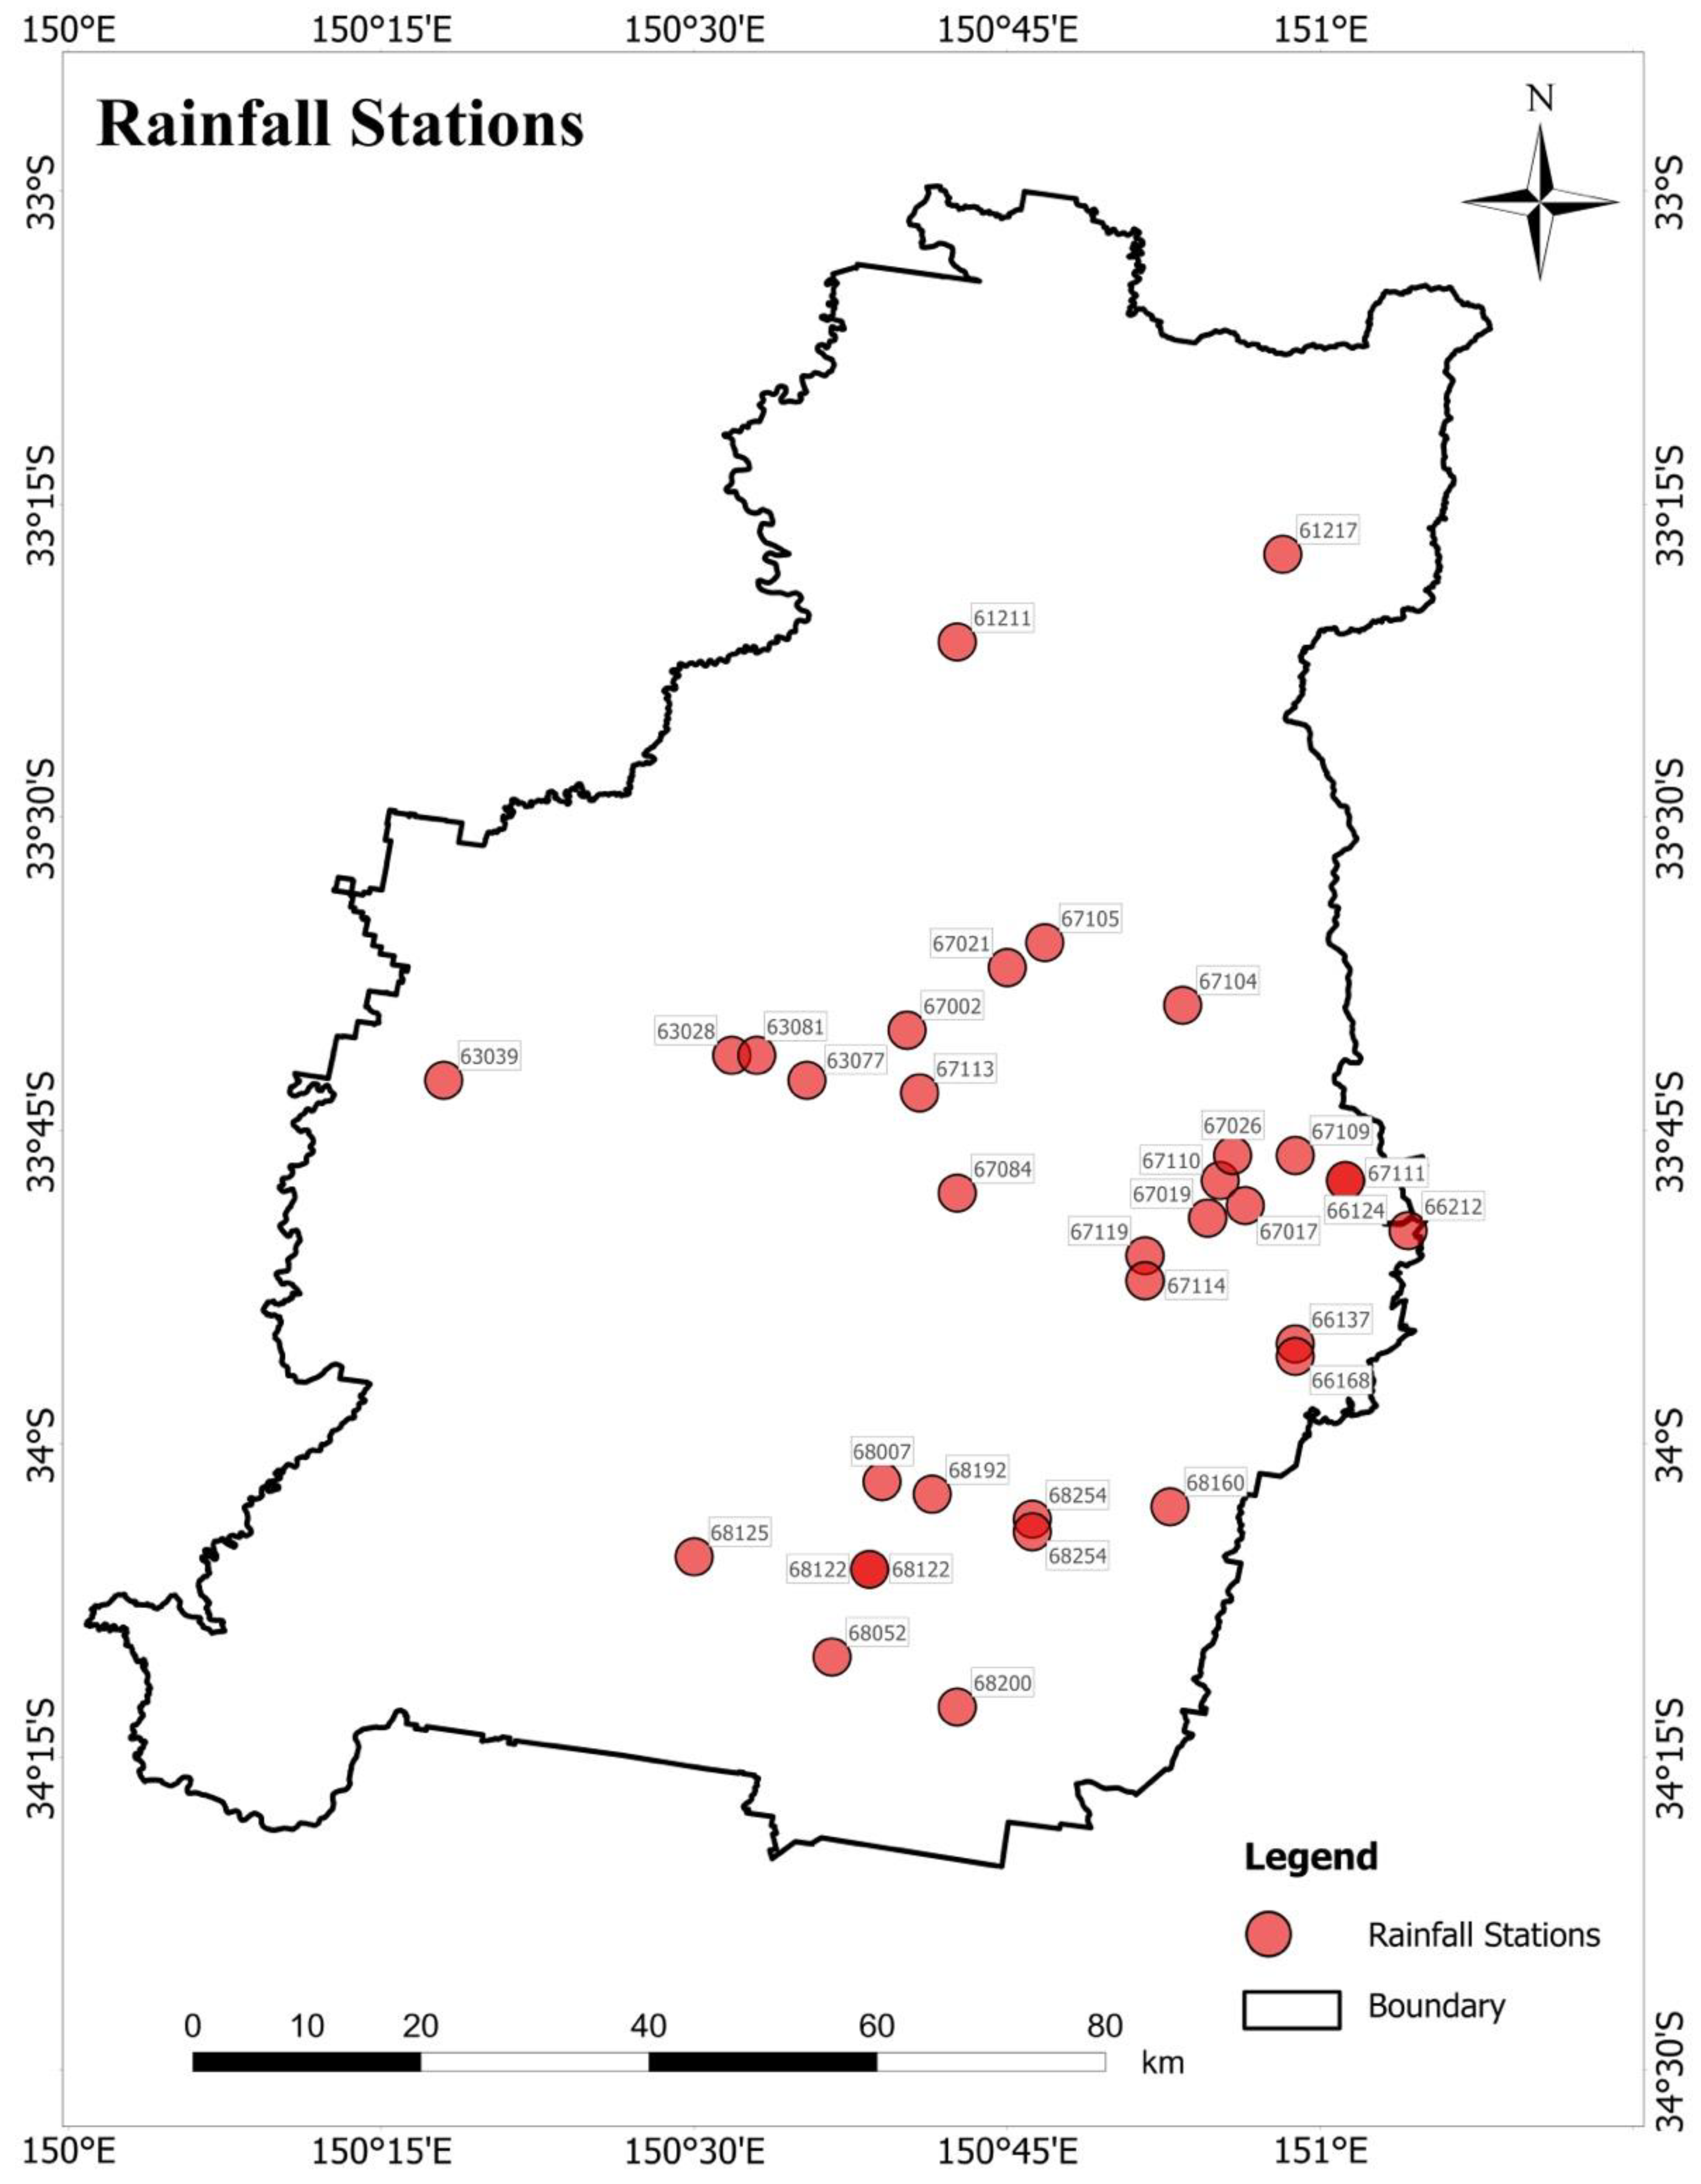
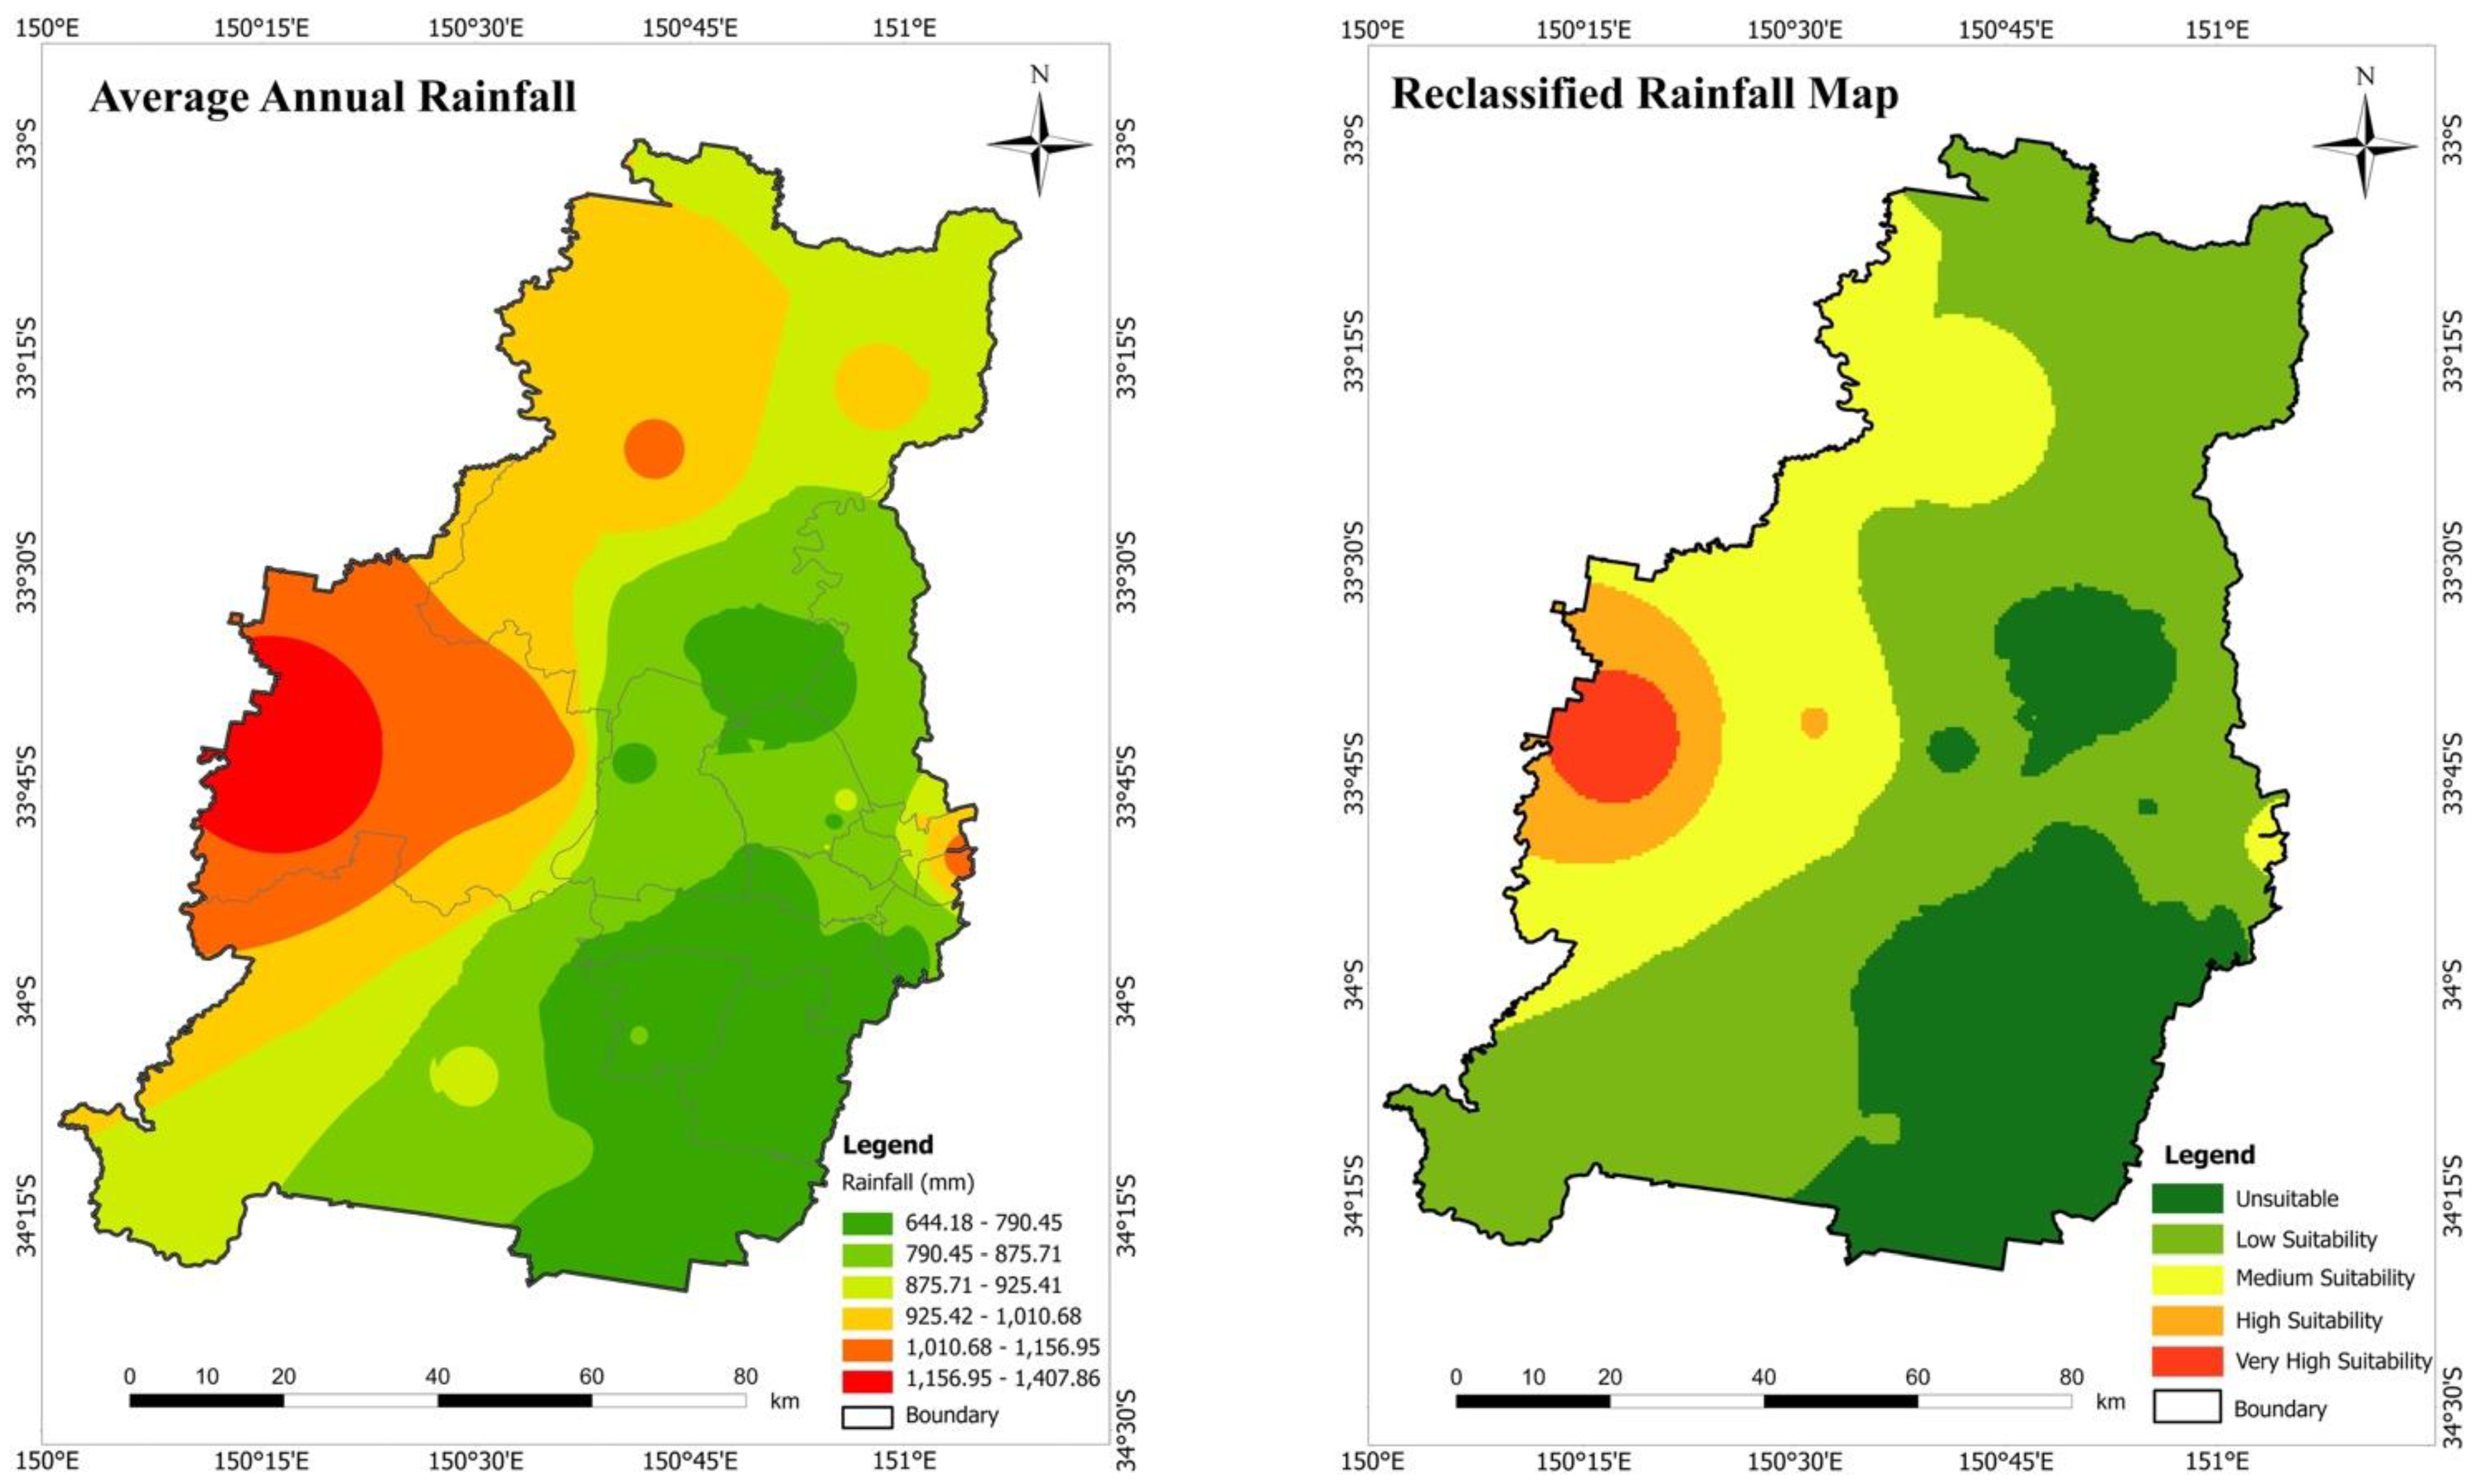
3.7. Rainfall
3.8. Roads
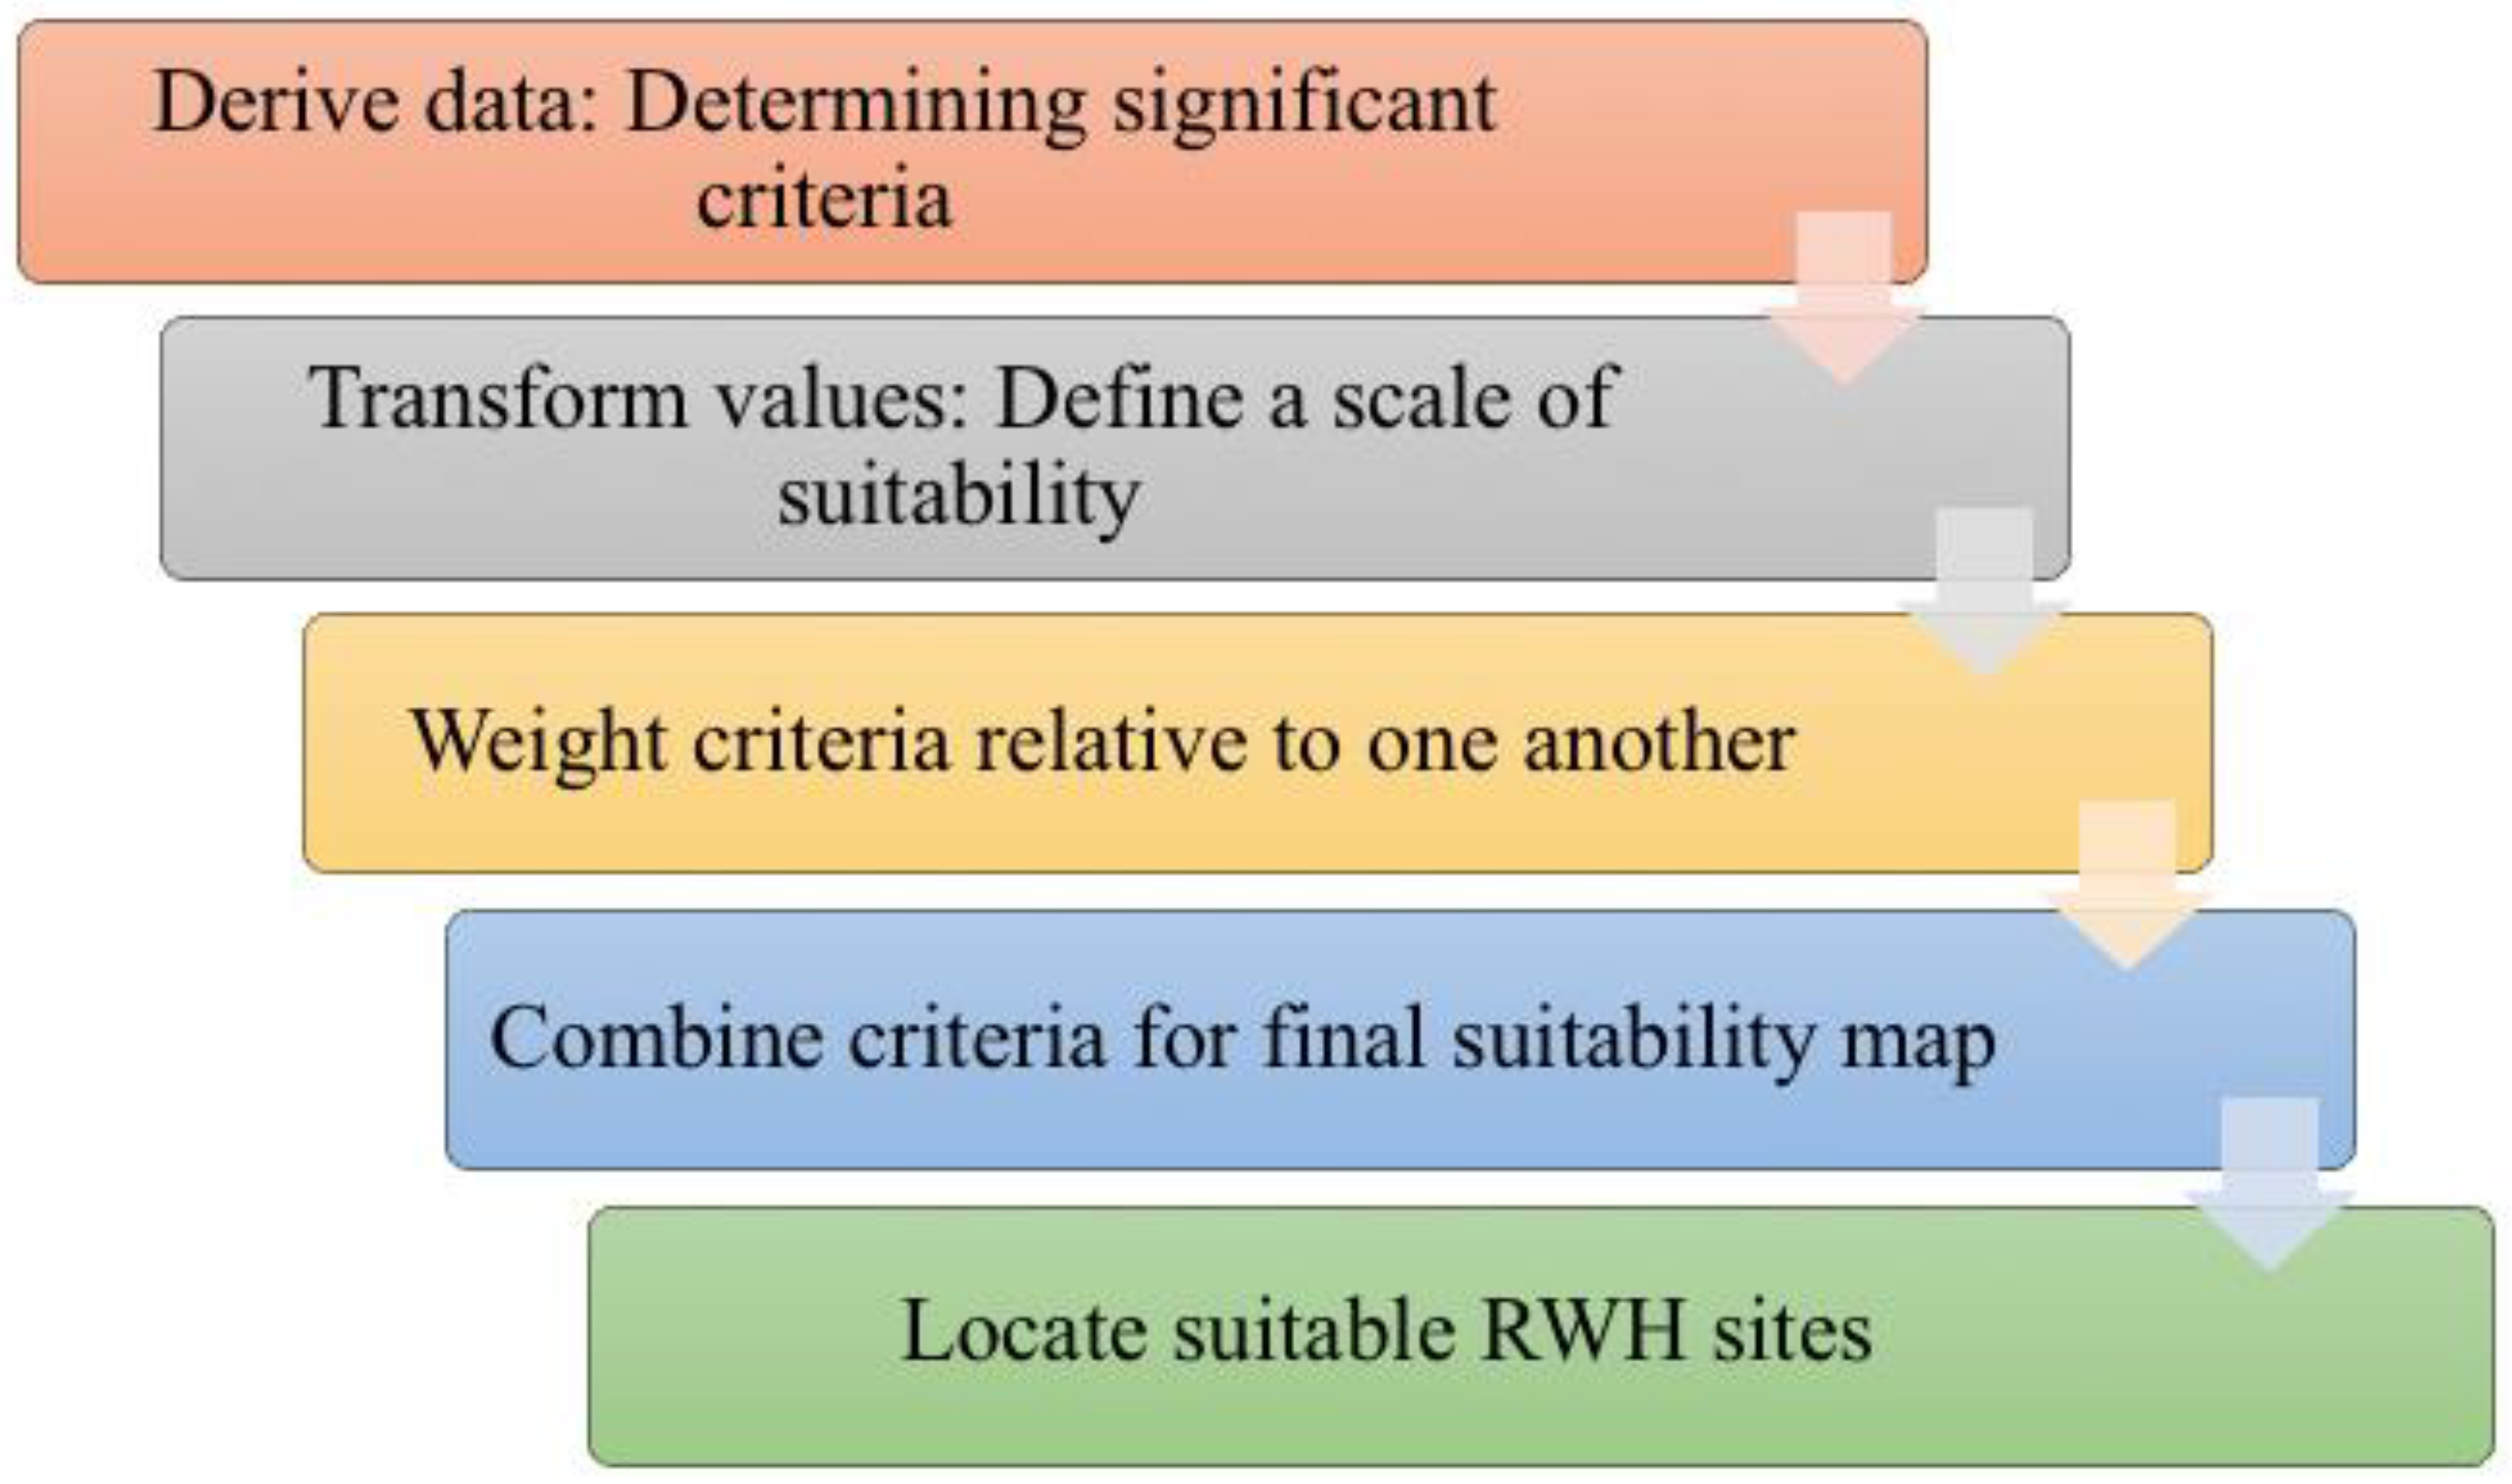
3.9. RWH Potential Map Using Weighted Linear Combination (WLC)
4. Results and Discussion
4.1. Rainfall
4.2. Slope
4.3. Stream Order
4.4. Drainage Density
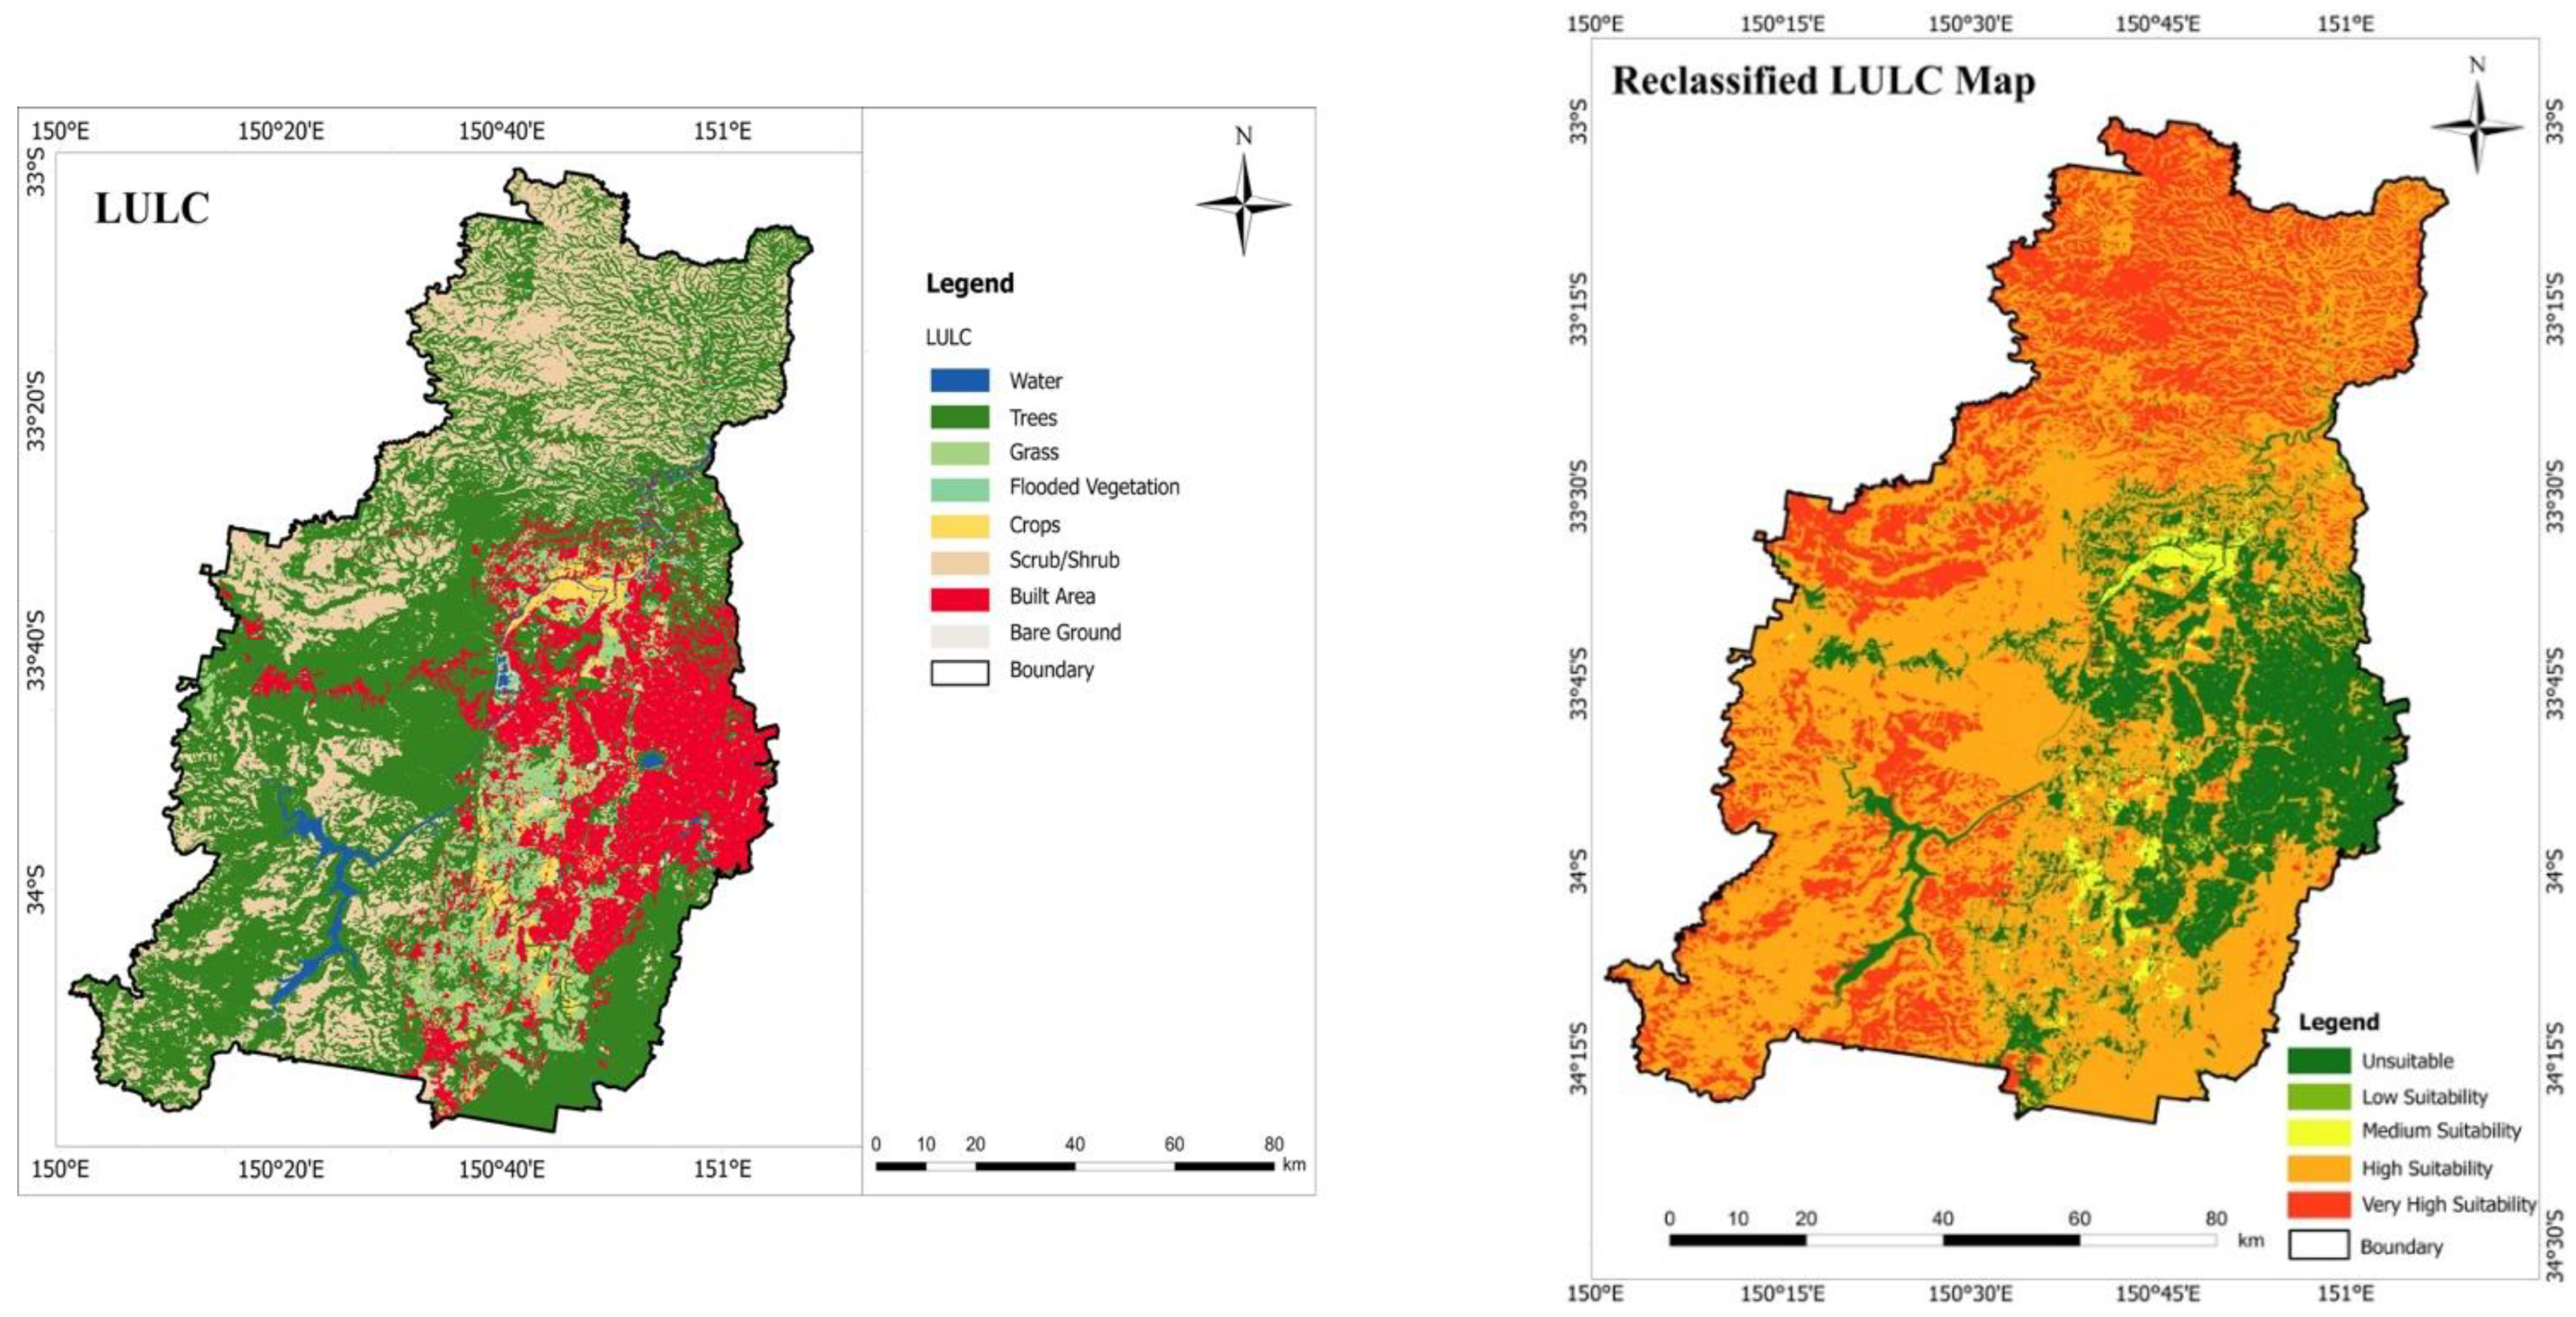
4.5. LULC
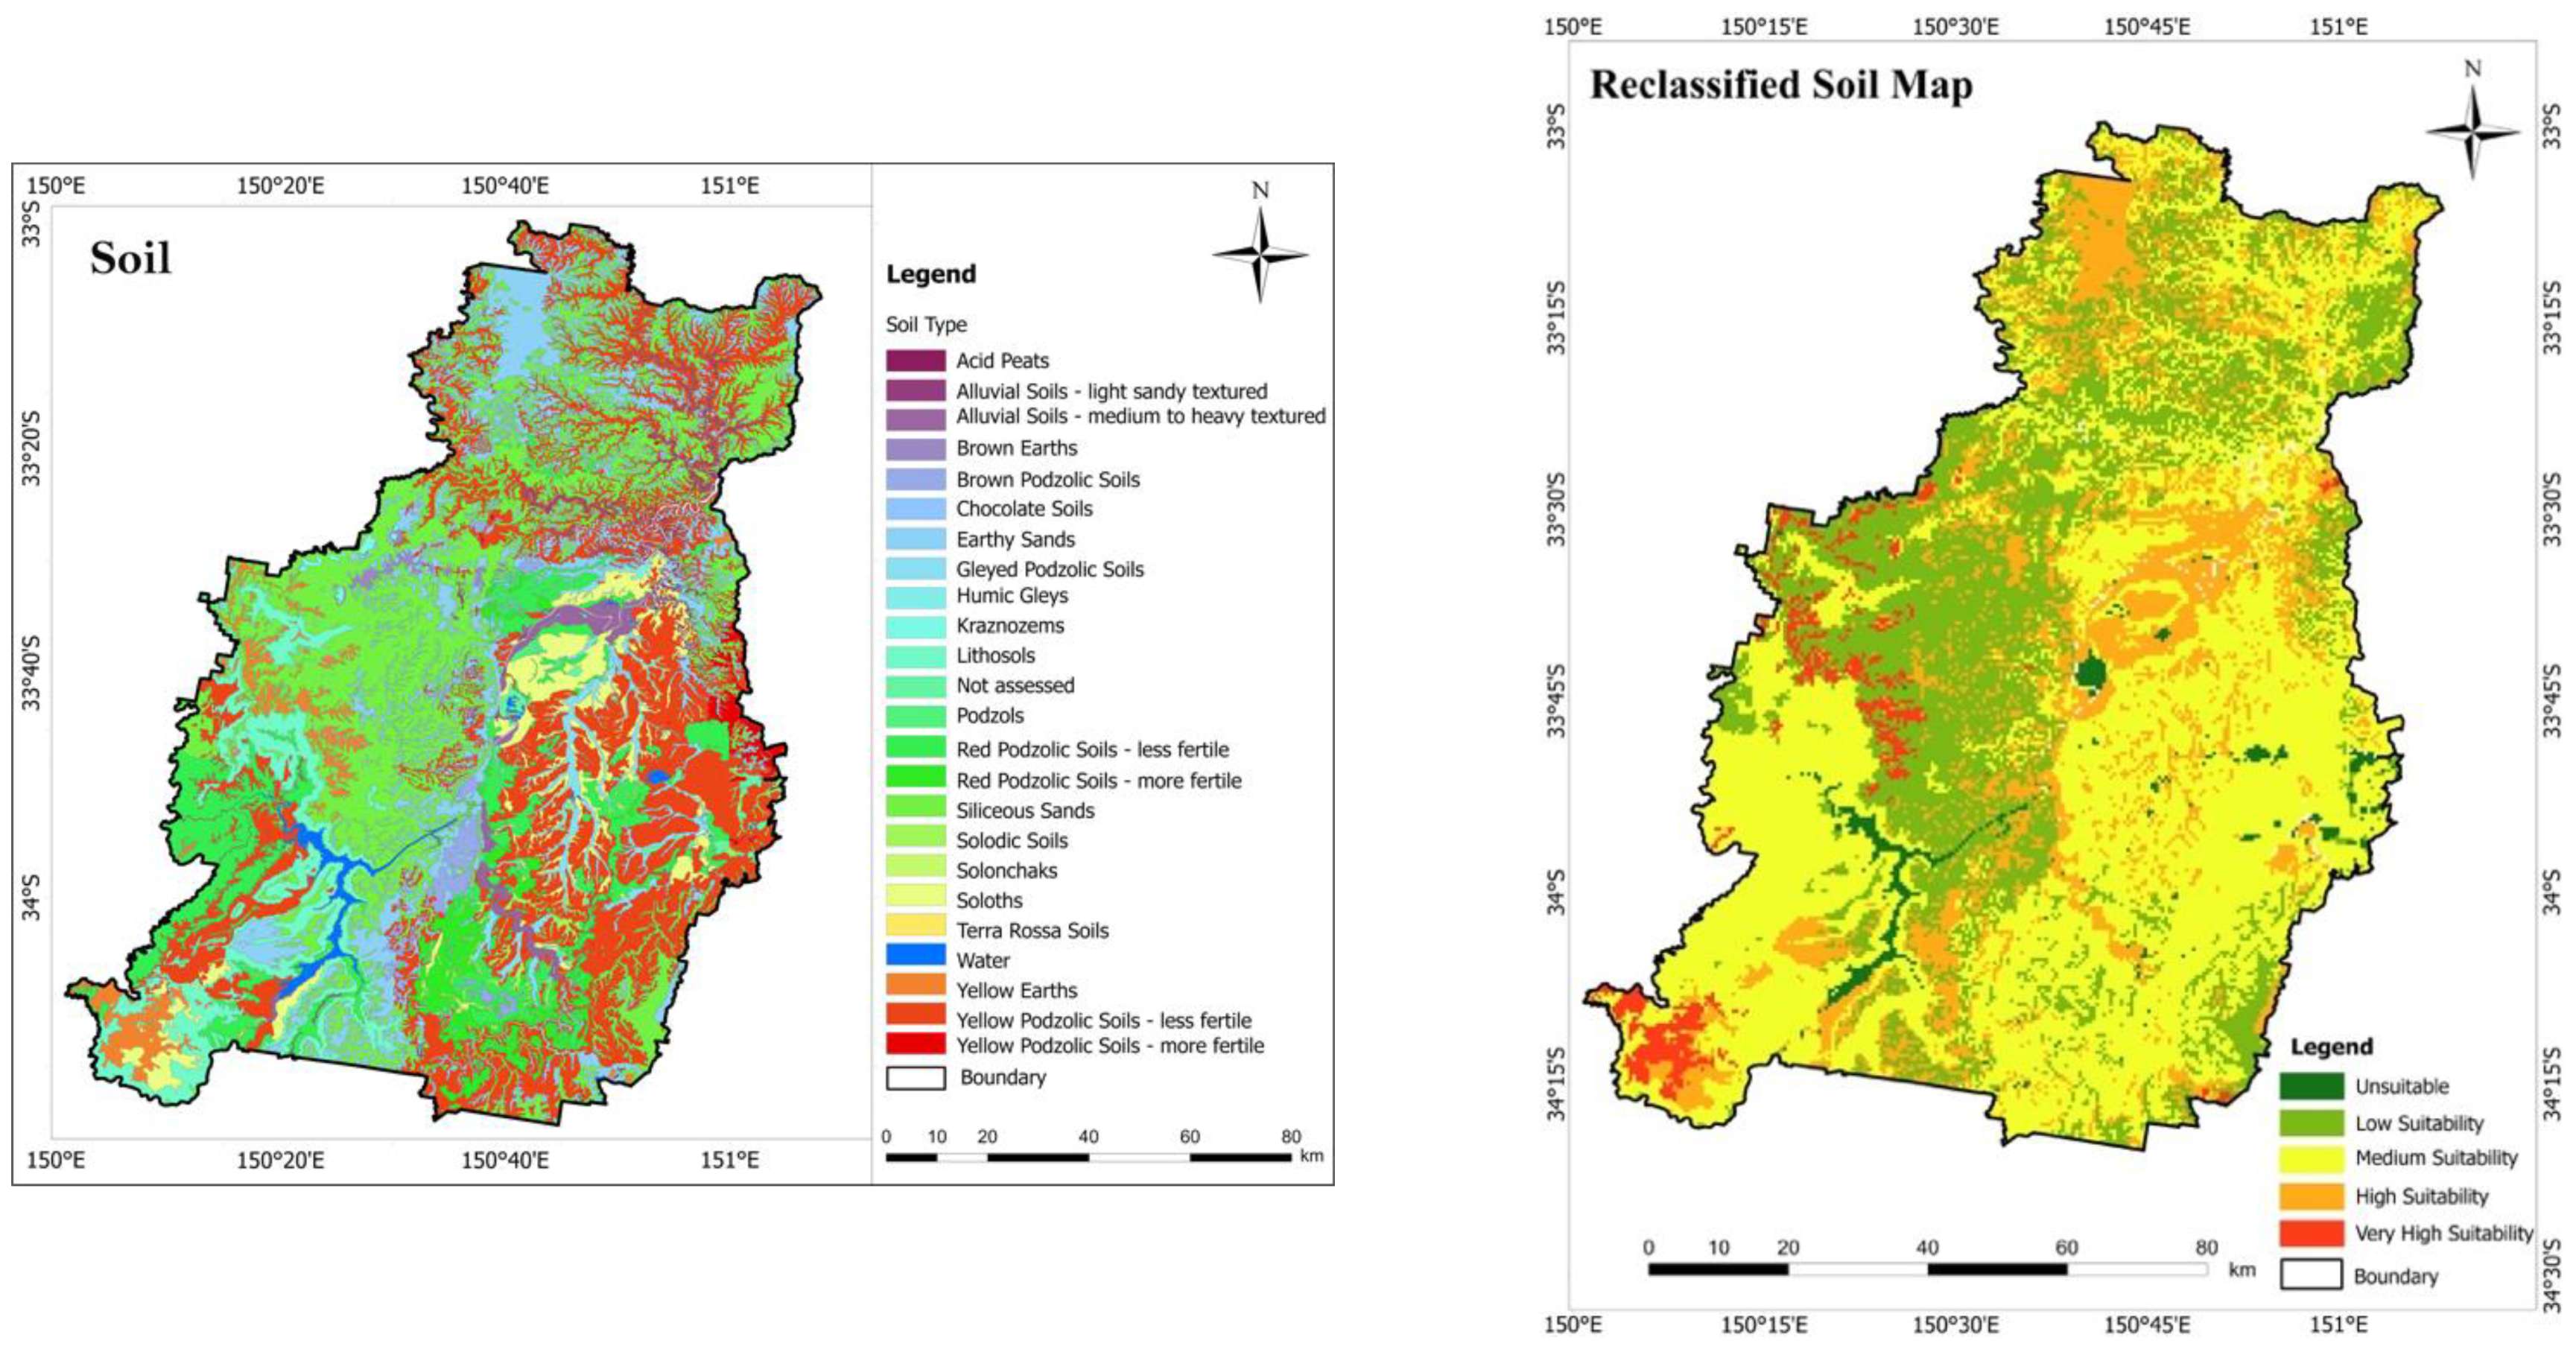
4.6. Soil
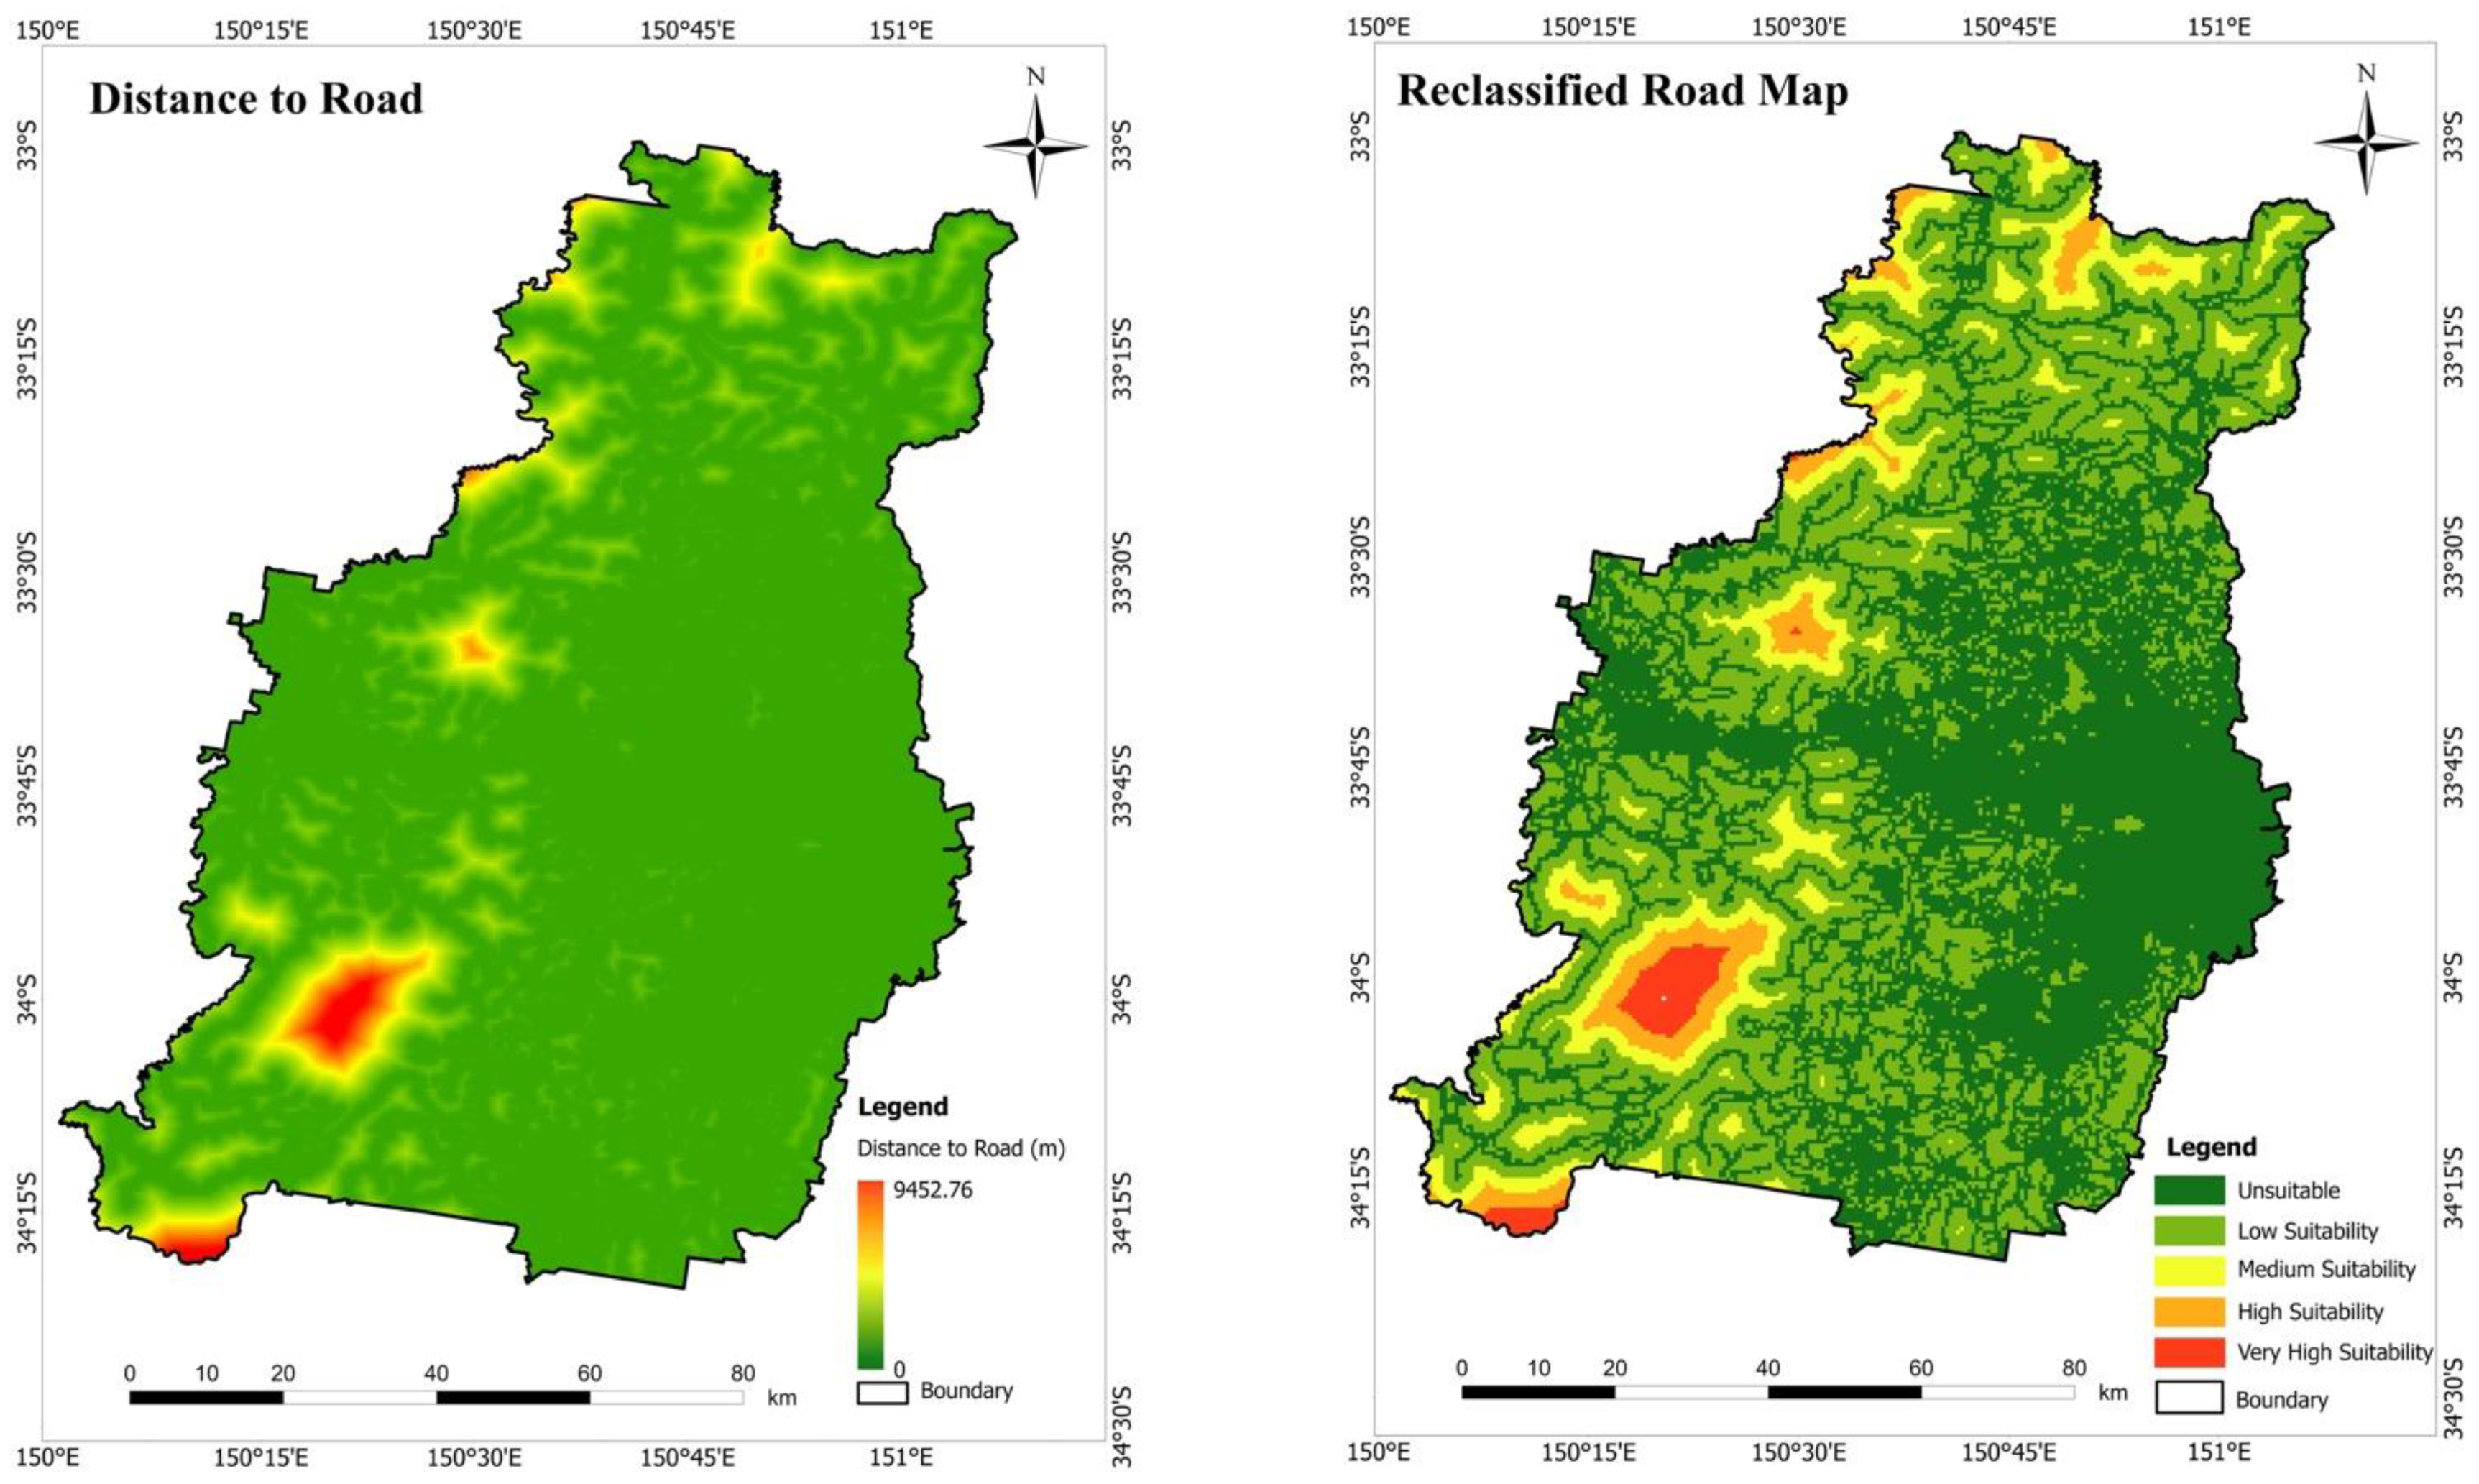
4.7. Distance to Roads
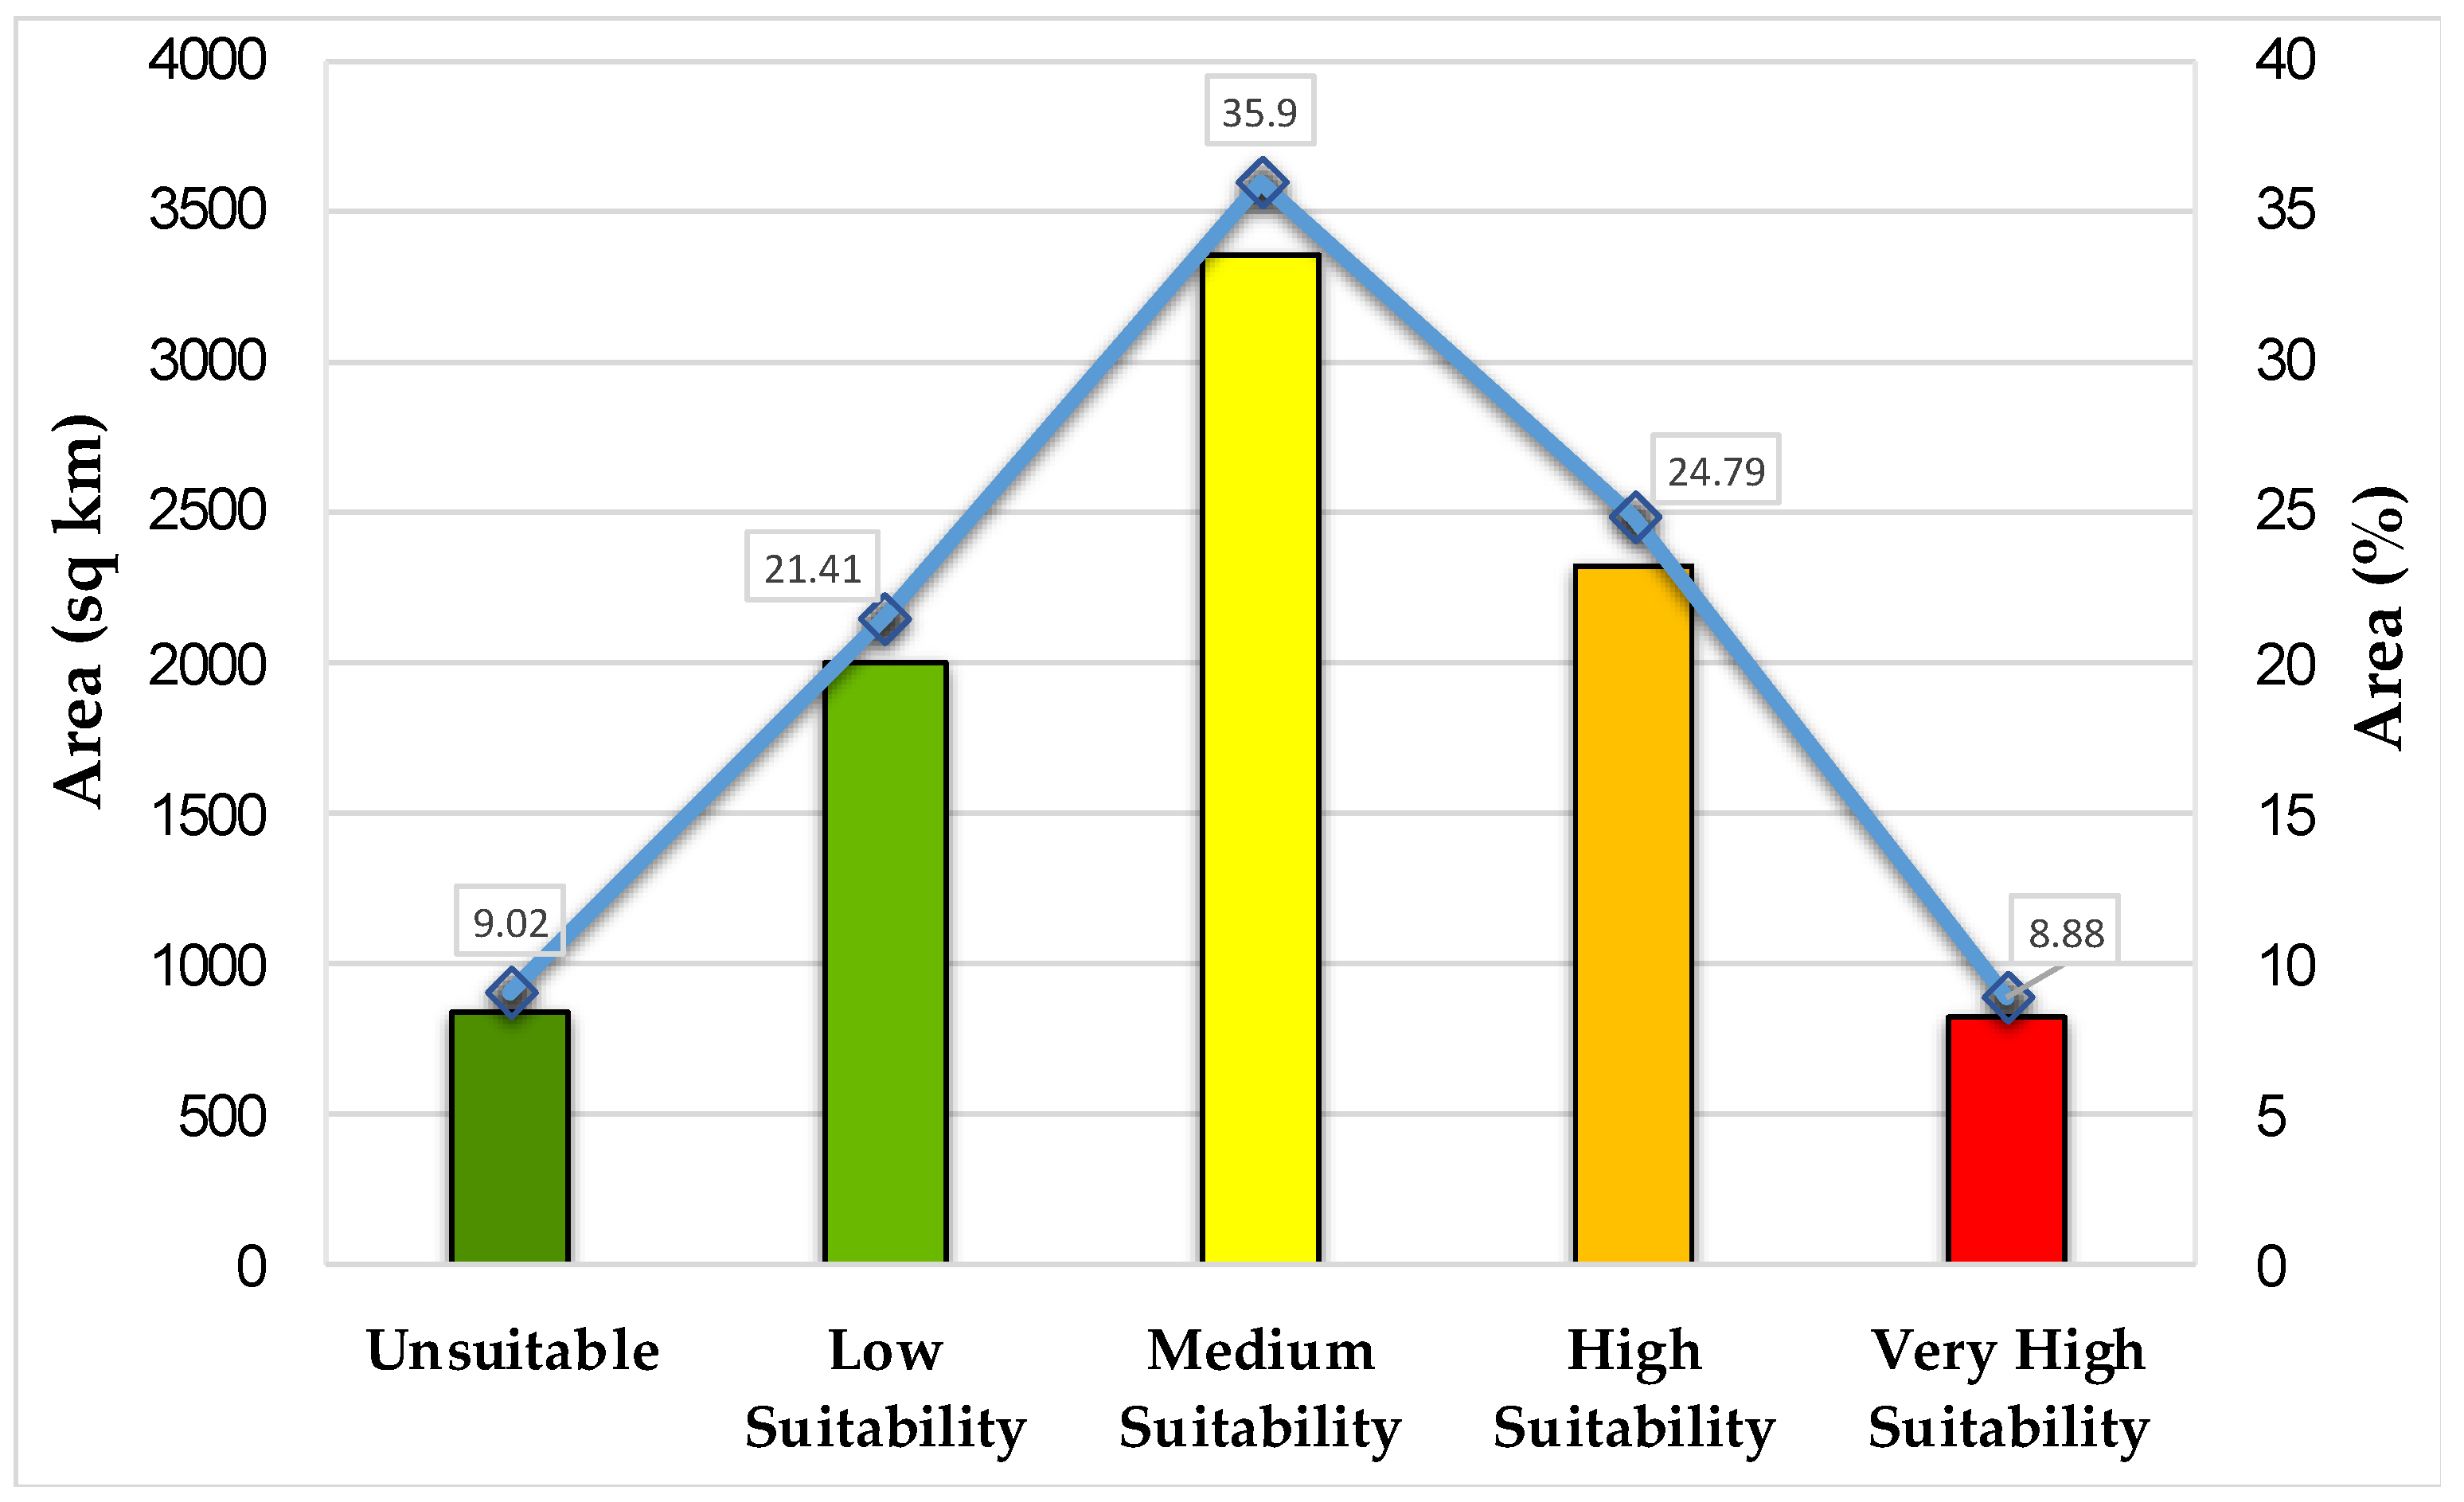
4.8. Final Suitability Map
5. Conclusions
Author Contributions
Funding
Data Availability Statement
Acknowledgments
Conflicts of Interest
References
- Haile, G.; Suryabhagavan, K.V. GIS-based approach for identification of potential rainwater harvesting sites in Arsi Zone, Central Ethiopia. Model. Earth Syst. Environ. 2019, 5, 353–367. [Google Scholar] [CrossRef]
- Mahmood, K.; Qaiser, A.; Farooq, S. RS-and GIS-based modeling for optimum site selection in rain water harvesting system: An SCS-CN approach. Acta Geophys. 2020, 68, 1175–1185. [Google Scholar] [CrossRef]
- Ejegu, M.A.; Yegizaw, E.S. Potential rainwater harvesting suitable land selection and management by using GIS with MCDA in Ebenat District, Northwestern Ethiopia. J. Degrad. Min. Lands Manag. 2020, 8, 2537. [Google Scholar]
- Shadeed, S.M.; Judeh, T.G.; Almasri, M.N. Developing GIS-based water poverty and rainwater harvesting suitability maps for domestic use in the Dead Sea region (West Bank, Palestine). Hydrol. Earth Syst. Sci. 2019, 23, 1581–1592. [Google Scholar] [CrossRef]
- Adham, A.; Wesseling, J.G.; Abed, R.; Riksen, M.; Ouessar, M.; Ritsema, C.J. Assessing the impact of climate change on rainwater harvesting in the Oum Zessar watershed in Southeastern Tunisia. Agric. Water Manag. 2019, 221, 131–140. [Google Scholar] [CrossRef]
- Tiwari, K.; Goyal, R.; Sarkar, A. GIS-based methodology for identification of suitable locations for rainwater harvesting structures. Water Resour. Manag. 2018, 32, 1811–1825. [Google Scholar] [CrossRef]
- Rahman, A. Recent advances in modelling and implementation of rainwater harvesting systems towards sustainable development. Water 2017, 9, 959. [Google Scholar] [CrossRef]
- Al-Abadi, A.M.; Al-Shamma’a, A.M.; Aljabbari, M.H. A GIS-based DRASTIC model for assessing intrinsic groundwater vulnerability in northeastern Missan governorate, southern Iraq. Appl. Water Sci. 2017, 7, 89–101. [Google Scholar] [CrossRef]
- Campisano, A.; Butler, D.; Ward, S.; Burns, M.J.; Friedler, E.; DeBusk, K.; Han, M. Urban rainwater harvesting systems: Research, implementation and future perspectives. Water Res. 2017, 115, 195–209. [Google Scholar] [CrossRef]
- Naseef, T.A.U.; Thomas, R. Identification of suitable sites for water harvesting structures in Kecheri River basin. Procedia Technol. 2016, 24, 7–14. [Google Scholar] [CrossRef]
- Adham, A.; Riksen, M.; Ouessar, M.; Ritsema, C.J. A methodology to assess and evaluate rainwater harvesting techniques in (semi-) arid regions. Water 2016, 8, 198. [Google Scholar] [CrossRef]
- Hassani, A.N.; Farhadian, H.; Katibeh, H. A comparative study on evaluation of steady-state groundwater inflow into a circular shallow tunnel. Tunn. Undergr. Space Technol. 2018, 73, 15–25. [Google Scholar] [CrossRef]
- Adham, A.; Sayl, K.N.; Abed, R.; Abdeladhim, M.A.; Wesseling, J.G.; Riksen, M.; Ritsema, C.J. A GIS-based approach for identifying potential sites for harvesting rainwater in the Western Desert of Iraq. Int. Soil Water Conserv. Res. 2018, 6, 297–304. [Google Scholar] [CrossRef]
- Forzieri, G.; Gardenti, M.; Caparrini, F.; Castelli, F. A methodology for the pre-selection of suitable sites for surface and underground small dams in arid areas: A case study in the region of Kidal, Mali. Phys. Chem. Earth Parts A/B/C 2008, 33, 74–85. [Google Scholar] [CrossRef]
- Musayev, S.; Burgess, E.; Mellor, J. A global performance assessment of rainwater harvesting under climate change. Resour. Conserv. Recycl. 2018, 132, 62–70. [Google Scholar] [CrossRef]
- Ziadat, F.; Bruggeman, A.; Oweis, T.; Haddad, N.; Mazahreh, S.; Sartawi, W.; Syuof, M. A participatory GIS approach for assessing land suitability for rainwater harvesting in an arid rangeland environment. Arid. Land Res. Manag. 2012, 26, 297–311. [Google Scholar] [CrossRef]
- Sayl, K.; Adham, A.; Ritsema, C.J. A GIS-based multicriteria analysis in modeling optimum sites for rainwater harvesting. Hydrology 2020, 7, 51. [Google Scholar] [CrossRef]
- Singh, J.P.; Singh, D.; Litoria, P.K. Selection of suitable sites for water harvesting structures in Soankhad watershed, Punjab using remote sensing and geographical information system (RS&GIS) approach—A case study. J. Indian Soc. Remote Sens. 2009, 37, 21–35. [Google Scholar]
- Jamali, I.A.; Mörtberg, U.; Olofsson, B.; Shafique, M. A spatial multi-criteria analysis approach for locating suitable sites for construction of subsurface dams in Northern Pakistan. Water Resour. Manag. 2014, 28, 5157–5174. [Google Scholar] [CrossRef]
- Malczewski, J. GIS-based land-use suitability analysis: A critical overview. Prog. Plan. 2004, 62, 3–65. [Google Scholar] [CrossRef]
- Jasrotia, A.S.; Majhi, A.; Singh, S. Water balance approach for rainwater harvesting using remote sensing and GIS techniques, Jammu Himalaya, India. Water Resour. Manag. 2009, 23, 3035–3055. [Google Scholar] [CrossRef]
- Krois, J.; Schulte, A. GIS-based multi-criteria evaluation to identify potential sites for soil and water conservation techniques in the Ronquillo watershed, northern Peru. Appl. Geogr. 2014, 51, 131–142. [Google Scholar] [CrossRef]
- Sayl, K.N.; Muhammad, N.S.; Yaseen, Z.M.; El-Shafie, A. Estimation the physical variables of rainwater harvesting system using integrated GIS-based remote sensing approach. Water Resour. Manag. 2016, 30, 3299–3313. [Google Scholar] [CrossRef]
- Sayl, K.N.; Muhammad, N.S.; El-Shafie, A. Robust approach for optimal positioning and ranking potential rainwater harvesting structure (RWH): A case study of Iraq. Arab. J. Geosci. 2017, 10, 413. [Google Scholar] [CrossRef]
- Ammar, A.; Riksen, M.; Ouessar, M.; Ritsema, C. Identification of suitable sites for rainwater harvesting structures in arid and semi-arid regions: A review. Int. Soil Water Conserv. Res. 2016, 4, 108–120. [Google Scholar] [CrossRef]
- Chowdhury, M.; Paul, P.K. Identification of suitable sites for rainwater harvesting using fuzzy AHP and fuzzy gamma operator: A case study. Arab. J. Geosci. 2021, 14, 585. [Google Scholar] [CrossRef]
- Ezzeldin, M.; Konstantinovich, S.E.; Igorevich, G.I. Determining the suitability of rainwater harvesting for the achievement of sustainable development goals in Wadi Watir, Egypt using GIS techniques. J. Environ. Manag. 2022, 313, 114990. [Google Scholar] [CrossRef]
- Jha, M.K.; Chowdary, V.M.; Kulkarni, Y.; Mal, B.C. Rainwater harvesting planning using geospatial techniques and multicriteria decision analysis. Resour. Conserv. Recycl. 2014, 83, 96–111. [Google Scholar] [CrossRef]
- Singh, L.K.; Jha, M.K.; Chowdary, V.M. Multi-criteria analysis and GIS modeling for identifying prospective water harvesting and artificial recharge sites for sustainable water supply. J. Clean. Prod. 2017, 142, 1436–1456. [Google Scholar] [CrossRef]
- Wu, R.S.; Molina, G.L.L.; Hussain, F. Optimal sites identification for rainwater harvesting in northeastern Guatemala by analytical hierarchy process. Water Resour. Manag. 2018, 32, 4139–4153. [Google Scholar] [CrossRef]
- Saaty, T.L. How to make a decision: The analytic hierarchy process. Interfaces 1994, 24, 19–43. [Google Scholar] [CrossRef]
- Saaty, T.L. Decision making with the analytic hierarchy process. Int. J. Serv. Sci. 2008, 1, 83–98. [Google Scholar] [CrossRef]
- Mbilinyi, B.P.; Tumbo, S.D.; Mahoo, H.F.; Senkondo, E.M.; Hatibu, N. Indigenous knowledge as decision support tool in rainwater harvesting. Phys. Chem. Earth Parts A/B/C 2005, 30, 792–798. [Google Scholar] [CrossRef]
- Mekonnen, M.; Melesse, A.M.; Keesstra, S.D. Spatial runoff estimation and mapping of potential water harvesting sites: A GIS and remote sensing perspective, Northwest Ethiopia. In Landscape Dynamics, Soils and Hydrological Processes in Varied Climates; Springer: Cham, Switzerland, 2016; pp. 565–584. [Google Scholar]
- Gavit, B.K.; Purohit, R.C.; Singh, P.K.; Kothari, M.; Jain, H.K. Rainwater harvesting structure site suitability using remote sensing and GIS. In Hydrologic Modeling; Springer: Singapore, 2018; pp. 331–341. [Google Scholar]
- Guide, S.U. The Shuttle Radar Topography Mission (SRTM) Collection User Guide. 2015. Available online: https://lpdaac.usgs.gov/documents/179/SRTM_User_Guide_V3.pdf (accessed on 25 June 2022).
- Alwan, I.A.; Aziz, N.A.; Hamoodi, M.N. Potential water harvesting sites identification using spatial multi-criteria evaluation in Maysan Province, Iraq. ISPRS Int. J. Geo-Inf. 2020, 9, 235. [Google Scholar] [CrossRef]
- Critchley, W.; Siegert, K.; Chapman, C. Water Harvesting, a Manual Guide for the Design and Construction of Water Harvesting Schemes for Plant Production; FAO: Rome, Italy, 1991; Available online: https://www.samsamwater.com/library/Water_harvesting_-_Critchley.pdf (accessed on 25 June 2022).
- Sayl, K.N.; Muhammad, N.S.; El-Shafie, A. Identification of potential sites for runoff water harvesting. Proc. Inst. Civ. Eng. Water Manag. 2019, 172, 135–148. [Google Scholar] [CrossRef]
- Al-Ardeeni, M.A. Selecting Potential Water Harvest Sites Using GIS and Remote Sensing in Al-Tharthar Valley, West Nineveh, Iraq. Tikrit J. Pure Sci. 2018, 20, 142–150. [Google Scholar]
- Al-Ghobari, H.; Dewidar, A.Z. Integrating GIS-based MCDA techniques and the SCS-CN method for identifying potential zones for rainwater harvesting in a semi-arid area. Water 2021, 13, 704. [Google Scholar] [CrossRef]
- Yegizaw, E.S.; Ejegu, M.A.; Tolossa, A.T.; Teka, A.H.; Andualem, T.G.; Tegegne, M.A.; Dirar, T.M. Geospatial and AHP Approach Rainwater Harvesting Site Identification in Drought-Prone Areas, South Gonder Zone, Northwest Ethiopia. J. Indian Soc. Remote Sens. 2022, 50, 1321–1331. [Google Scholar] [CrossRef]
- Rana, V.K.; Suryanarayana, T.M.V. GIS-based multi criteria decision making method to identify potential runoff storage zones within watershed. Ann. GIS 2022, 26, 149–168. [Google Scholar] [CrossRef]
- Al-Adamat, R. GIS as a decision support system for siting water harvesting ponds in the Basalt Aquifer/NE Jordan. J. Environ. Assess. Policy Manag. 2008, 10, 189–206. [Google Scholar] [CrossRef]
- Aklan, M.; Al-Komaim, M.; de Fraiture, C. Site suitability analysis of indigenous rainwater harvesting systems in arid and data-poor environments: A case study of Sana’a Basin, Yemen. Environ. Dev. Sustain. 2022, 1–24. [Google Scholar] [CrossRef]
- Al-shabeeb, A.R. The use of AHP within GIS in selecting potential sites for water harvesting sites in the Azraq Basin—Jordan. J. Geogr. Inf. Syst. 2016, 8, 73–88. [Google Scholar] [CrossRef]
- Ibrahim GR, F.; Rasul, A.; Ali Hamid, A.; Ali, Z.F.; Dewana, A.A. Suitable site selection for rainwater harvesting and storage case study using Dohuk Governorate. Water 2019, 11, 864. [Google Scholar] [CrossRef]
- Matomela, N.; Li, T.; Ikhumhen, H.O. Siting of rainwater harvesting potential sites in arid or semi-arid watersheds using GIS-based techniques. Environ. Process. 2020, 7, 631–652. [Google Scholar] [CrossRef]


| Station Name | Station No. | Lat | Long | Duration | AAR (mm) |
|---|---|---|---|---|---|
| Bankstown Airport AWS | 66,137 | 33.92 | 150.98 | 1969–2021 | 868 |
| Milperra Bridge (Georges River) | 66,168 | 33.93 | 150.98 | 2001–2019 | 638 |
| Seven Hills (Radio FM 103.2) | 67,110 | 33.79 | 150.92 | 2001–2020 | 744 |
| Greystanes (Bathurst Street) | 67,017 | 33.81 | 150.94 | 2002–2021 | 863 |
| Prospect Reservoir | 67,019 | 33.82 | 150.91 | 1887–2021 | 879 |
| Seven Hills (Collin St) | 67,026 | 33.77 | 150.93 | 1950–2020 | 913 |
| Katoomba (Farnells Rd) | 63,039 | 33.71 | 150.3 | 1910–2021 | 1408 |
| Springwood (Valley Heights) | 63,077 | 33.71 | 150.59 | 1883–2020 | 1082 |
| Faulconbridge (St Georges Crescent) | 63,028 | 33.69 | 150.53 | 1937–2021 | 1136 |
| Faulconbridge (Great Western Hwy) | 63,081 | 33.69 | 150.55 | 2002–2021 | 1059 |
| Camden Airport AWS | 68,192 | 34.04 | 150.69 | 1972–2021 | 796 |
| Camden (Brownlow Hill) | 68,007 | 34.03 | 150.65 | 1883–2021 | 744 |
| Cawdor (Woodburn) | 68,122 | 34.1 | 150.64 | 1963–2021 | 770 |
| Mount Annan | 68,254 | 34.06 | 150.77 | 2007–2021 | 720 |
| Campbelltown (Kentlyn (Georges River Roa | 68,160 | 34.05 | 150.88 | 1967–2021 | 765 |
| Mount Annan (Australian Botanic Garden) | 68,254 | 34.07 | 150.77 | 2002–2021 | 747 |
| Horsley Park Equestrian Centre | 67,119 | 33.85 | 150.86 | 1998–2021 | 780 |
| Abbotsbury (Fairfield (City Farm)) | 67,114 | 33.87 | 150.86 | 2001–2021 | 719 |
| Richmond RAAF | 67,105 | 33.6 | 150.78 | 1995–2021 | 741 |
| Richmond—UWS | 67,021 | 33.62 | 150.75 | 1881–2021 | 798 |
| Castlereagh (Castlereagh Road) | 67,002 | 33.67 | 150.67 | 1940–2021 | 840 |
| Sydney Olympic Park AWS (Archery Centre) | 66,212 | 33.83 | 151.07 | 2012–2021 | 1090 |
| North Parramatta (Burnside Homes) | 67,111 | 33.79 | 151.02 | 2001–2021 | 930 |
| Parramatta North | 66,124 | 33.79 | 151.02 | 1966–2021 | 968 |
| Orchard Hills Treatment Works | 67,084 | 33.8 | 150.71 | 1971–2021 | 828 |
| Penrith Lakes AWS | 67,113 | 33.72 | 150.68 | 1996–2021 | 740 |
| Box Hill (Mccall Gardens) | 67,104 | 33.65 | 150.89 | 1991–2021 | 727 |
| Baulkham Hills Eucalyptus Ct | 67,109 | 33.77 | 150.98 | 2001–2021 | 843 |
| Picton Council Depot | 68,052 | 34.17 | 150.61 | 1880–2018 | 801 |
| Cawdor (Woodburn) | 68,122 | 34.1 | 150.64 | 1963–2021 | 769 |
| Douglas Park (St. Marys Towers) | 68,200 | 34.21 | 150.71 | 1975–2021 | 742 |
| Colo Heights (Mountain Pines) | 61,211 | 33.36 | 150.71 | 1963–2021 | 1028 |
| St Albans (Espie St) | 61,217 | 33.29 | 150.97 | 1963–2021 | 937 |
| Oakdale (Cooyong Park) | 68,125 | 34.09 | 150.5 | 1964–2021 | 898 |
| Data Type | Source | Year | Description |
|---|---|---|---|
| Sentinel-2 | Esri | 2020 | Land use/Land cover |
| Shuttle Radar Topographic Mission (SRTM 30 m) | Geoscience Australia | 2000 | Digital elevation model (DEM) generated from SRTM, UTM—WGS84, Zone 56 S |
| Climate Data | Bureau of Meteorology, Australia | 1880–2019 | Monthly and daily climate data |
| Factor | Interval | Rate | Suitability | Coverage (km2) | Coverage (%) |
|---|---|---|---|---|---|
| Slope (%) | >30 | 1 | Unsuitable | 2402.9 | 25.63 |
| 15–30 | 2 | Low Suitability | 2113.12 | 22.54 | |
| 10–15 | 3 | Medium Suitability | 929.61 | 9.91 | |
| 5–10 | 4 | High Suitability | 1516.69 | 16.18 | |
| <5 | 5 | Very High Suitability | 2413.82 | 25.74 |
| Factor | Interval | Rate | Suitability | Coverage (km2) | Coverage (%) |
|---|---|---|---|---|---|
| Drainage Density (km2) | <30 | 1 | Unsuitable | 2.61 | 0.03 |
| 30–40 | 2 | Low Suitability | 275.39 | 2.93 | |
| 40–50 | 3 | Medium Suitability | 1448.65 | 15.41 | |
| 50–60 | 4 | High Suitability | 7589.08 | 80.74 | |
| 60–87.35 | 5 | Very High Suitability | 83.9 | 0.89 |
| Factor | Type | Rate | Suitability | Coverage (km2) | Coverage (%) |
|---|---|---|---|---|---|
| Land use/Land cover | Water Body/Built Area | 1 | Unsuitable | 1689.58 | 17.98 |
| Flooded Vegetation | 2 | Low Suitability | 5.68 | 0.06 | |
| Bare Ground | 3 | Medium Suitability | 201.09 | 2.14 | |
| Grass/Trees | 4 | High Suitability | 5319.63 | 56.61 | |
| Scrub/Shrub | 5 | Very High Suitability | 2181.83 | 23.22 |
| Factor | Type | Rate | Suitability | Coverage (km2) | Coverage (%) |
|---|---|---|---|---|---|
| Soil Type | Others | 1 | Unsuitable | 149.54 | 1.6 |
| Sandy Loam | 2 | Low Suitability | 2571.06 | 27.45 | |
| Sandy Clay | 3 | Medium Suitability | 4582.66 | 48.92 | |
| Silty Clay | 4 | High Suitability | 1822.72 | 19.46 | |
| Clay | 5 | Very High Suitability | 241.26 | 2.58 |
Publisher’s Note: MDPI stays neutral with regard to jurisdictional claims in published maps and institutional affiliations. |
© 2022 by the authors. Licensee MDPI, Basel, Switzerland. This article is an open access article distributed under the terms and conditions of the Creative Commons Attribution (CC BY) license (https://creativecommons.org/licenses/by/4.0/).
Share and Cite
Preeti, P.; Shendryk, Y.; Rahman, A. Identification of Suitable Sites Using GIS for Rainwater Harvesting Structures to Meet Irrigation Demand. Water 2022, 14, 3480. https://doi.org/10.3390/w14213480
Preeti P, Shendryk Y, Rahman A. Identification of Suitable Sites Using GIS for Rainwater Harvesting Structures to Meet Irrigation Demand. Water. 2022; 14(21):3480. https://doi.org/10.3390/w14213480
Chicago/Turabian StylePreeti, Preeti, Yuri Shendryk, and Ataur Rahman. 2022. "Identification of Suitable Sites Using GIS for Rainwater Harvesting Structures to Meet Irrigation Demand" Water 14, no. 21: 3480. https://doi.org/10.3390/w14213480
APA StylePreeti, P., Shendryk, Y., & Rahman, A. (2022). Identification of Suitable Sites Using GIS for Rainwater Harvesting Structures to Meet Irrigation Demand. Water, 14(21), 3480. https://doi.org/10.3390/w14213480