Article

Influence of Sediment Dredging on the Distribution of Chlorinated Paraffin

1
East China Sea Environment Monitoring Center, State Oceanic Administration, Shanghai 201206, China
2
Key Laboratory of Marine Ecological Monitoring and Restoration Technologies, MNR, Shanghai 201206, China
3
Agilent Technologies, Inc., 1350 North Sichuan Road, Shanghai 200080, China
*
Author to whom correspondence should be addressed.
Water 2022, 14(21), 3461; https://doi.org/10.3390/w14213461
Submission received: 29 August 2022 / Revised: 22 October 2022 / Accepted: 27 October 2022 / Published: 29 October 2022

Abstract

:
To study the influence of dredged sediment transportation on the distribution of short-chain chlorinated paraffins (SCCPs, C10-13), medium-chain chlorinated paraffins (MCCPs, C13-17), and long-chain chlorinated paraffins (LCCPs, C18-28), 62 surficial sediment samples were collected from the Huangpu River and the Shanghai offshore areas, East China. A high-performance liquid chromatograph coupled with a quadrupole time-of-flight mass spectrometry system (HPLC-QTOF MS) was employed to measure CPs. The concentrations of CPs in sediment samples ranged from 8.76 to 1270.7 ng g−1 for SCCPs, from 22.03 to 1730.78 ng g−1 for MCCPs, and from undetected (ND) to 236.86 ng g−1 for LCCPs. The concentrations were lower than those that can be toxic to organisms. Furthermore, the influence of sediment dredging activity on the distribution of CPs was also investigated. The concentrations of CPs in sediment discarding areas were significantly higher than those in the surrounding areas, but this result is consistent with the concentrations in the Huangpu River sediments where CPs originated. Also, the SCCP congener group in the discarding area was similar to that in the Huangpu River. These findings indicated that CPs exhibited lower migration in the discarding area and had limited environmental impacts.

1. Introduction

Chlorinated n-alkane derivatives, also known as chlorinated paraffins (CPs, CnH2n+2-xClx; n = 10–30) [1], are composed of short-chain chlorinated paraffins (SCCPs, C10–13), medium-chain chlorinated paraffins (MCCPs, C14–17), and long-chain chlorinated paraffins (LCCPs, C≥18) [2]. CPs are used as plasticizers and flame retardants in plastics, sealants, lubricants, and leather production processes. Additionally, they can be used as cutting fluids [3,4,5,6]. However, CPs are inevitably discharged to the environment because of their high production and wide usage [1]. Thus, CPs have been detected in freshwater, seawater, superficial sediments, soil, air, and organisms at various concentrations [2]. CPs are currently attracting increasing attention. Among all CP groups, SCCPs exhibited the most toxic potential and have attracted the highest level of attention [7]. In 2006, SCCPs were first suggested to be classified as POPs, their use was restricted in some countries, and they were included in the catalog of toxic and harmful chemicals by the Water Framework Directive of the European Union [8]. Thus, MCCPs and LCCPs were used as alternatives to SCCPs and produced with similar or even higher production volumes every year. Thus, the environmental levels of MCCPs and LCCPs are also increasing [9]. Although individuals realized the environmental risk of SCCPs in the early 21st century, it took a decade to regulate SCCPs [8]. This was because of the uncertain methods and arguments over insufficiently reliable data. This argument is also relevant for the future regulation of MCCPs and LCCPs [10]. The limited data indicate that MCCPs are widely used and that LCCPs have even been detected in the Arctic [11]. However, the potential environmental risks of MCCPs and LCCPs are still inconclusive [10]. It was suggested that the carbon chains in longer-chain CPs may cleave into restricted SCCPs during the incineration of CPs. MCCPs and LCCPs with less than 20 carbon numbers may also have a potential effect of bioaccumulation, which indicates that MCCPs may be harmful to breastfed children and that LCCPs detected in the Arctic area may adversely affect biota in this remote region. A necessary method to identify/quantify CPs and assess the fate of all CP groups is needed due to their wide use, high production volumes, and extensive presence in the environment.
China is the largest global producer, user, and consumer of CPs [8]. CPs can be detected in various environmental matrices in China, as reported by previous papers since 2010, including lake sediments (SCCPs with 28 to 370 ng g−1, MCCPs with 25 to 2700 ng g−1, LCCPs with 36 to 650 ng g−1) [12,13], soils (SCCPs with 64.5 to 171.5 ng g−1) [14], leaves (SCCPs with 218.7 to 2196.6 ng g−1, MCCPs with 337.8 to 4388.4 ng g−1) [15], sediments from the sea (SCCPs with 5 to 2400 ng g−1) [16], human blood (SCCPs with 37–35000 ng g−1, MCPPs with 130 to 3200 ng g−1 and LCCPs with 22 to 530 ng g−1) [17]. As the most developed region in China, Shanghai is highly urbanized and industrialized. Electronics manufacturing, electricity facilities, petrochemicals, printing, and so on can involve CPs [18]. Thus, the assessment of the spatial distribution and influence of CPs in Shanghai and the Shanghai offshore areas is urgently needed. In recent years, the concentrations of SCCPs in the East China Sea that were detected ranged from 5.8 to 64.8 ng g−1 (dry weight, d.w.), and their source and migration have been reported [1,16,19,20,21], but there is no related report on MCCPs and LCCPs. The Huangpu River, also named the Mother River of Shanghai, is used for producing drinking water, transportation, drainage, fishery, and the tourist industry [22]. A total of 110 million square meters of sediments are transported over one year to maintain the navigation channels. The dredged sediments are dumped at the designated place, usually near the East Sea Coastal. Before dredging, the environmental risks of sediments are evaluated by considering the concentrations of heavy metals (copper, lead, zinc, chromium, cadmium, mercury, arsenic), oils, pesticide residues (666, DDT, PCBs), sulfides, organic carbon, pH, and the related physical index. However, CPs, instead of POPs, have not been considered. As a group of hydrophobic compounds (log Kow range from 5.52 to 7.53) [12,23], CPs are prone to accumulate in sediment. Thus, sediment dredging can be a potential CP source.
In the present study, surface sediments collected from the dredging area (Huangpu River), the dredged sediment discarding area, and its surrounding areas (Yangtze Estuary, East Sea Coastal, and Hangzhou Bay) were collected. The levels and congener profiles of SCCPs, MCCPs, and LCCPs in sediment samples were determined by using the ammonium chloride-enhanced thermal-assisted- electrospray ion source coupled with liquid chromatography-tandem high-resolution mass spectrometry (ESI LC-HRMS) method. Furthermore, the impact of sediment dredging on the distribution of CPs was also evaluated.

2. Materials and Methods

Chemical Materials: Three different chloride contents of SCCP technical standard mixtures (51.5%, 55.5%, and 63%), three MCCPs (42.0%, 52.0%, and 57.0%), and two LCCPs (36.0% and 49.0%) that were provided by Dr. Ehrenstorfer GmbH (Augsburg, Germany) were prepared at 100 mg L−1 in cyclohexane. 13C10-anti-Dechlorane Plus (C813C10H12Cl12, 100 mg L−1 in nonane), which came from Cambridge Isotope Laboratories (Andover, America), was used as an internal standard. UPLC-grade methanol and liquid chromatography-mass spectrometry-grade water were purchased from J&K Chemical. Methanol of mass spectrometry grade was purchased from J.T. Baker (Center Valley, PA, USA). Ammonium chloride (NH4Cl) and dichloromethane were supplied by Sigma-Aldrich (St. Louis, MO, USA) and Fisher Chemicals (Bridgewater, NJ, USA), respectively. Ammonium chloride was dissolved in methanol to obtain 10 mM NH4Cl stock solvent and then filtered through a 0.22 µm membrane of organic phase. All technical standard CP mixtures and internal standards were redissolved in methanol at 1 mg L−1 as samples, and LC-MS was used for analysis.
Sample collection and clean-up: Sixty-two sediment samples were collected by a grab funnel with an area of 0.1 m2 from the Huangpu River, Yangtze Estuary, East Sea Coastal, and Hangzhou Bay in 2018. The collected depth was 10 cm, and the sample distribution is shown in Figure 1. In Figure 1, the sediment dumping points were significantly marked.
These samples were taken to the laboratory and lyophilized to powder. The extraction procedure was based on a previous study [24,25]. Approximately 5 g powder sample of sediments (±0.5 g, dry weight) was mixed with 10 g anhydrous copper sulfate powder and spiked with 0.15 mg L−1 13C10-anti-Dechlorane Plus (C813C10H12Cl12) as an internal standard. Fifteen milliliters of n-hexane/dichloromethane (1:1, v:v) was used to extract CPs as an extraction agent by accelerated solvent extraction (ASE) from the samples. The process was repeated three times, and the supernatants were collected. A steel tube consisting of only 0.15 mg L−1 13C10-anti-Dechlorane Plus (C813C10H12Cl12) was used as a blank to remove the influence of the agent. Anhydrous copper sulfate powder was used to reduce the effect of water or vapor. Then, the extract solvents were further cleaned and fractionated on a multilayer silica-Florisil composite column, which consisted of 2 g Florisil, 2 g activated silica gel, 6 g acid silica gel, and 4 g anhydrous sodium sulfate. The column was pre-cleaned with 100 mL n-hexane. Then, the extract solvents were put into the column to concentrate the CPs. Finally, 50 mL n-hexane was employed to swash CPs. The flush fluid was blow-dried under nitrogen, redissolved in methanol (1 mL), and kept in a 4 °C refrigerator until analysis.
Chemical Analysis and Quality Control: The prepared samples and CP standard mixtures were analyzed by an Agilent 1290 Infinity II high-performance LC coupled with a 6540 QTOF MS system. The injection volume was 5 μL, and samples were separated by a chromatographic column (1.8 μm, 2.1 × 50 mm, Agilent Eclipse Plus) at 40 °C. The mobile phases were water and methanol, both with 0.05 mM ammonium chloride added, with a mobile flow rate of 0.3 mL min−1. QTOF was used in negative mode, and the scan range was set as 50 to 1500 Da. The MS parameters were optimized as follows: Fragmentor, 135 V; capillary voltage, 3500 V; nebulizer gas, 40 psi. Agilent Mass-Hunter qualitative software version B.07.01 was employed to analyze the data. The chromatogram peaks of CPs were extracted according to m/z values with a 5 ppm mass error of their precursors ([M + Cl]), and each CP congener group was identified by the characteristic [M + Cl] and accurate isotopic pattern with a ratio > 0.9. Technical CP mixtures (0.3, 0.5, 1.0, 3.0, 5.0 mg L−1) were analyzed to ensure the assurance of a linear relation between the chromatographic area and concentrations of CPs. Then, standard CP mixtures and sediment samples spiked with 0.15 mg L−1 13C10-anti-Dechlorane Plus (C813C10H12Cl12) were analyzed three times to obtain the recoveries of SCCPs, MCCPs, and LCCPs in the extraction procedure. The recoveries of SCCPs, MCCPs, and LCCPs in the samples were 79.0% ± 5.4%, 76.5% ± 9.2% and 94.5% ± 5.0%, respectively, which were less than 96.7% ± 3% in standard CP mixtures. The total carbon (TOC) of sediment samples collected was measured by a TOC analyzer (Sievers M9 portable TOC analyzer).
Concentration Calculation: The concentrations of CPs in samples were calculated by the following equations [26]. The total response factor can be obtained by Equation (1).
Total   response   factor   ( standard   CP   mixtures ) = I A r e a   ( C o n g e n e r   g r o p , i ) A r e a   ( S u r r o g a t e ) A m o u n t   C P   ( s t d )
13C10-anti-Dechlorane Plus was used as the surrogate in this study. “i” means the CP congener group. In addition, the chloride content is calculated by Equation (2).
Calculated   chlorine   content   ( CP   mixtures ) = I   T o t a l   m o l a r   m a s s   o f   c h l o r i n e   M o l e c u l a r   m a s s   ( i )   R e l a t i v e   a r e a ( i ) R e l a t i v e   t a t a l   C P   a r e a
Then, 8 standard CP mixtures with different chloride contents (51.5–63.0% for SCCPs, 42.0–57.0% for MCCPs, and 36.0–49.0% for LCCPs) were calculated to obtain calibration curves (as shown in Equation (3)) between the total response factor and chlorine content for SCCPs, MCCPs, and LCCPs.
Total   response   factor   ( CP   mixtures ) = a x ( C a l c u l a t e d   c h l o r i d e   c o n t e n t ) + b
The chloride of environmental sediment samples was calculated using Equation (2) and then substituted into Equation (3) to obtain the total response factor. The standard curves between the total response factor and chloride content of standard CPs are shown in Figure 2. Finally, Equation (4) was used to calculate the actual concentrations of CPs in environmental sediment samples [17].
Amount   of   CPs   ( samples ) = R e l a t i v e   t o t a l   a r e a   ( s a m p l e ) T o t a l   r e s p o n s e   f a c t o r   ( C a l c u l a t e d   f o r   t h e   s a m p l e )

3. Results and Discussion

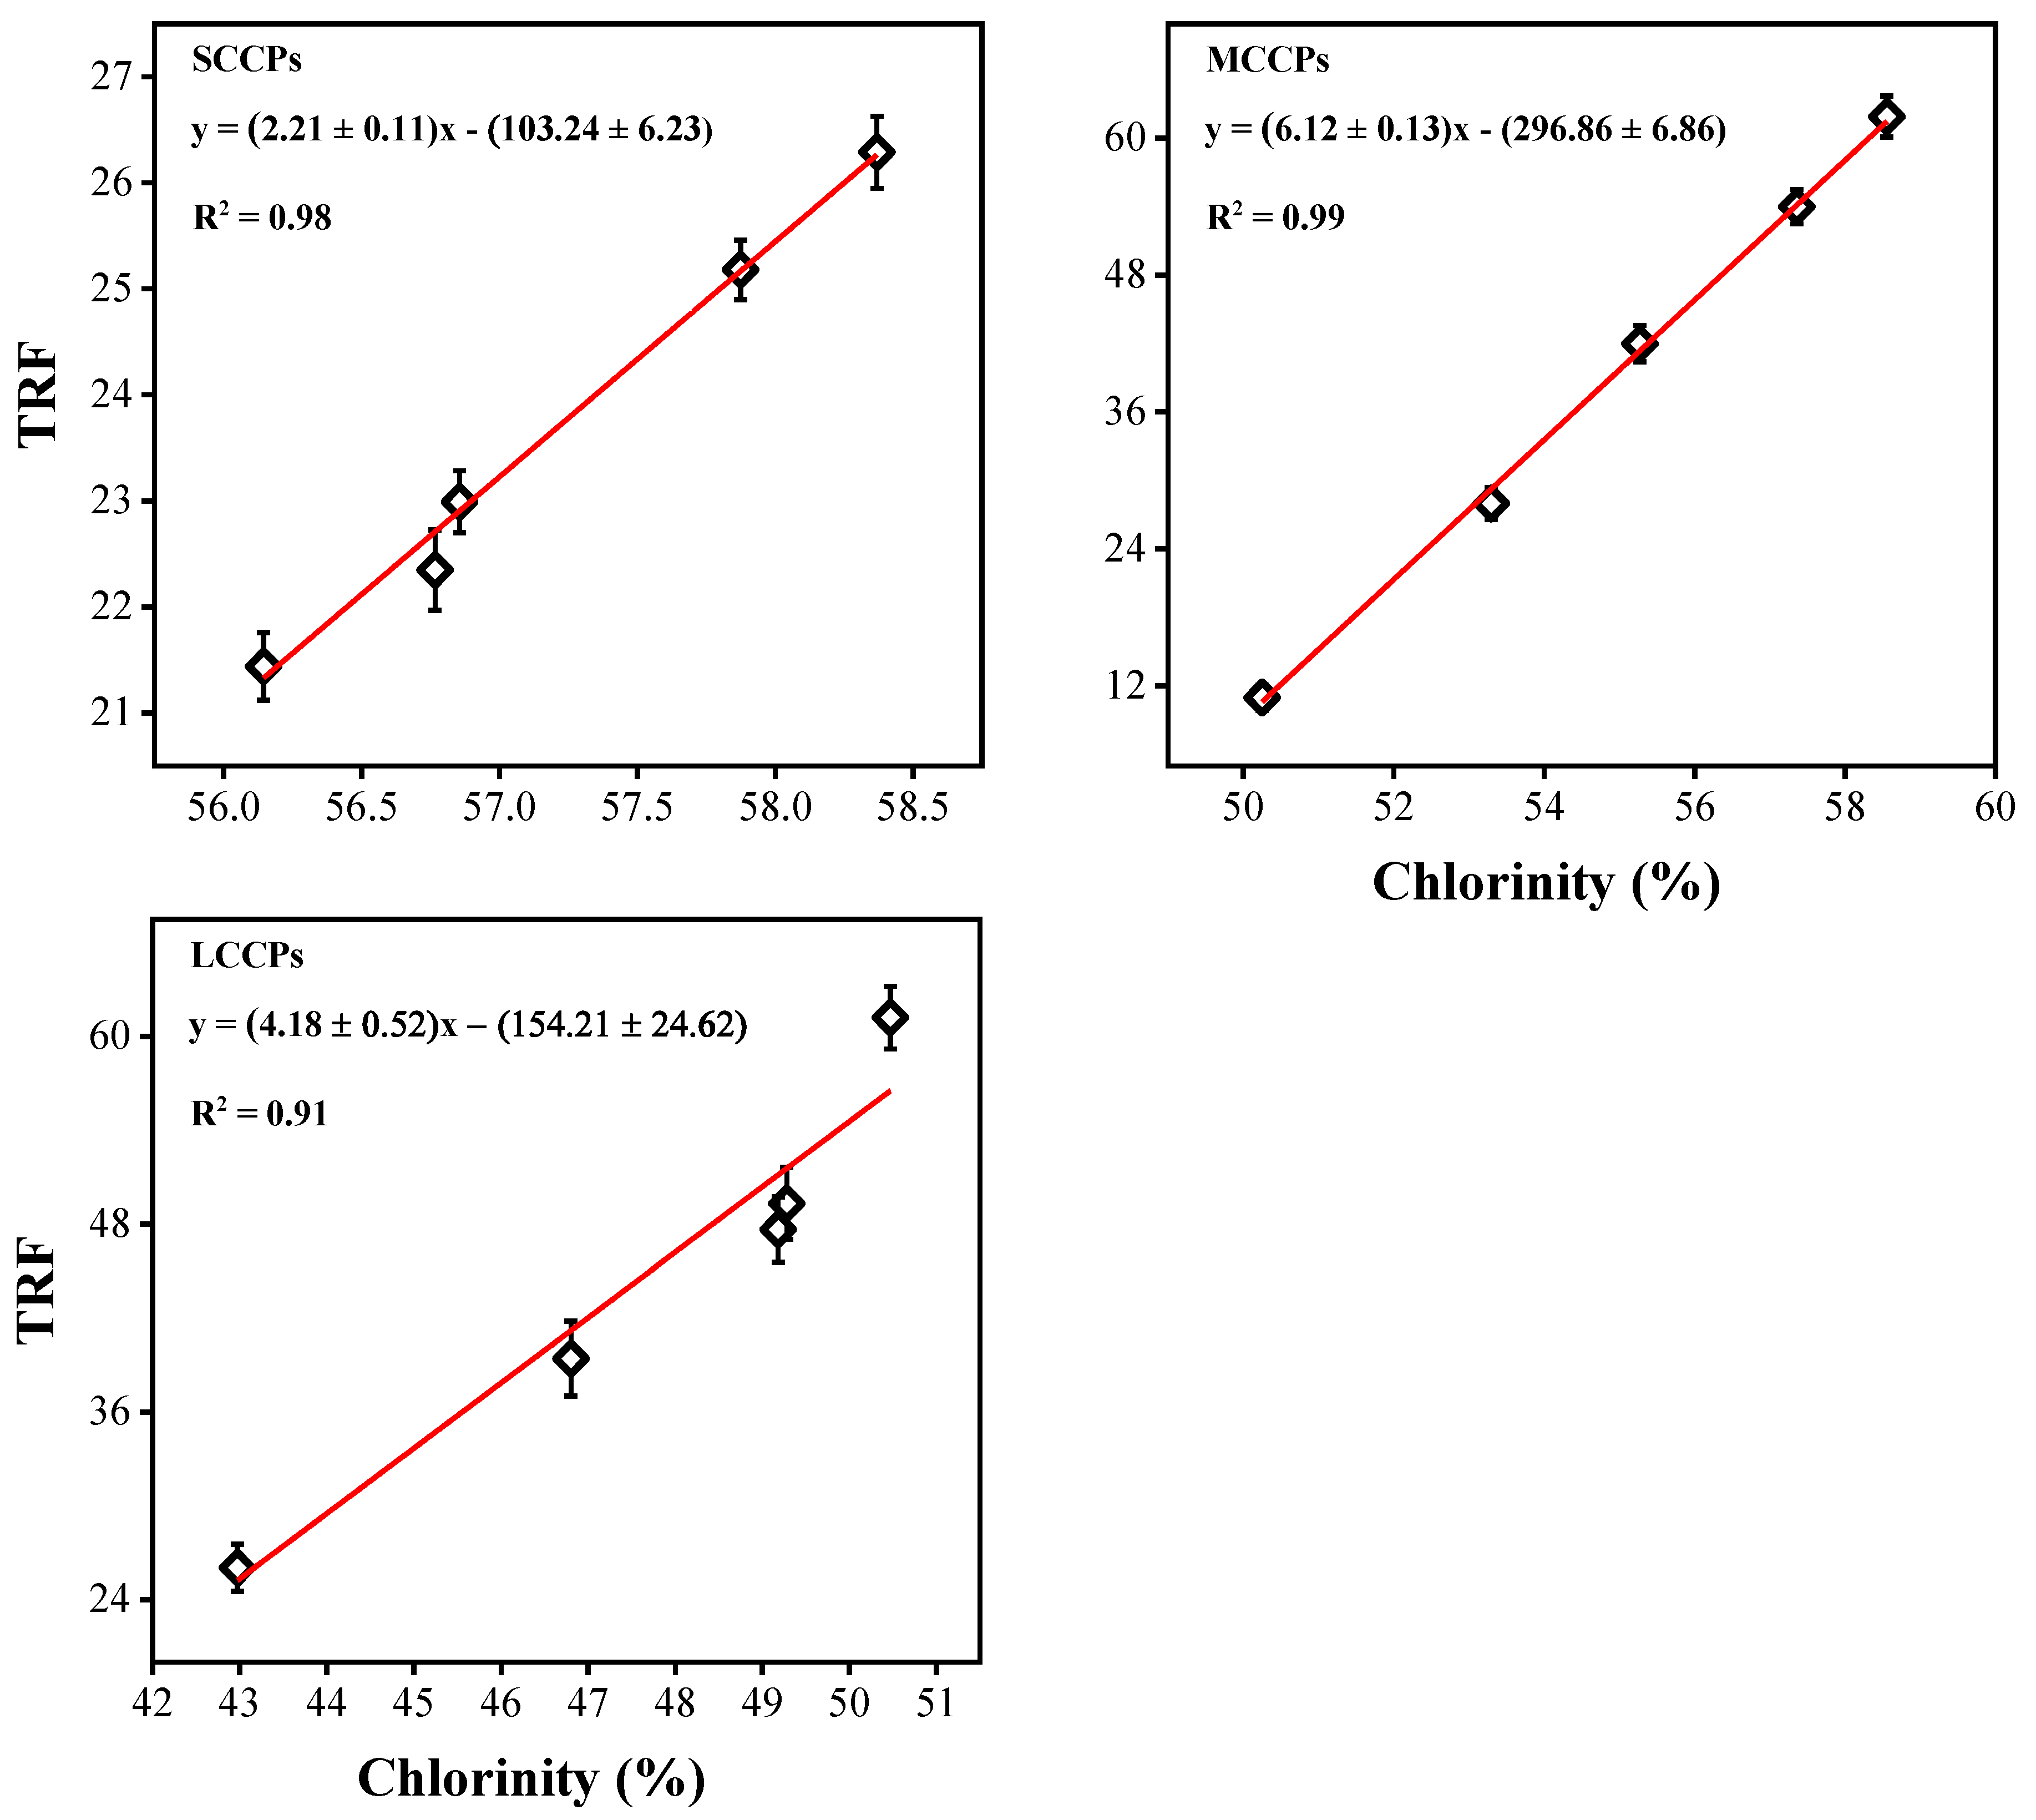
3.1. Selecting the Determined Method

It is necessary and challenging to identify and quantify SCCPs, MCCPs, and LCCPs in different environments because of their toxic effects and sustainability. Thus, a series of determination methods have been developed since the 1970s. To date, three main measurement techniques have been employed to measure natural sediment samples [27]. Thin layer chromatography (TLC) with an argentation method was the first method to detect CPs [28]. Although SCCPs, MCCPs, and LCCPs can be detected, they are lengthy and tedious and have poor sensitivity and reproducibility. The other two methods were gas and liquid chromatography (GC and LC) with various detectors, especially mass spectrometry, which has been the most commonly used method in recent decades. For GC, electron capture detectors (ECDs) [29] were used to analyze SCCPs and MCCPs because of their relatively low loss and high sensitivity. However, this method can be influenced by complex matrices, and an efficient clean-up sample should be utilized for samples to remove the matrices. Although GC coupled with electron capture negative ion mass spectrometry (GC-ECNI MS) [30,31] and negative ion chemical ionization-mass spectrometry (GC-NICI-MS) [32] have been widely employed to quantify SCCPs and MCCPs, LCCPs cannot be detected, and quantification was influenced by sample injection. The greatest drawback of GC is that it cannot detect LCCPs that do not volatilize easily [33]. In recent years, LC with metastable atom bombardment (MAB), atmospheric pressure chemical ionization (APCI), electron ionization (EI), and electrospray ionization (ESI) mass spectrometry was developed to detect LCCPs [17,34,35,36]. CH2Cl2 and NH4Cl as additives in the mobile phase were used to heighten [M + Cl] ion formation in the ion source [37]. The two procedures were more efficient in detecting CPs than GC and could especially identify and quantify LCCPs. CH2Cl2 was not commonly used in aqueous reversed-phase LC systems; thus, HPLC-APCI-, EI-, and ESI-MS systems with NH4Cl used as an additive were developed. The general ionization effect in the ESI source was evidently higher than that in APCI and EI, with the same concentration of Cl supplied by NH4Cl. In addition, the LOD of the detection method in NH4Cl-enhanced LC-coupled ESI-MS was 10 to 20 μg L−1, which was lower than the method in GC and can identify and quantify LCCPs. Finally, NH4Cl-LC-ESI-MS was employed for use in our study. The LOD of all methods is shown in Table 1.

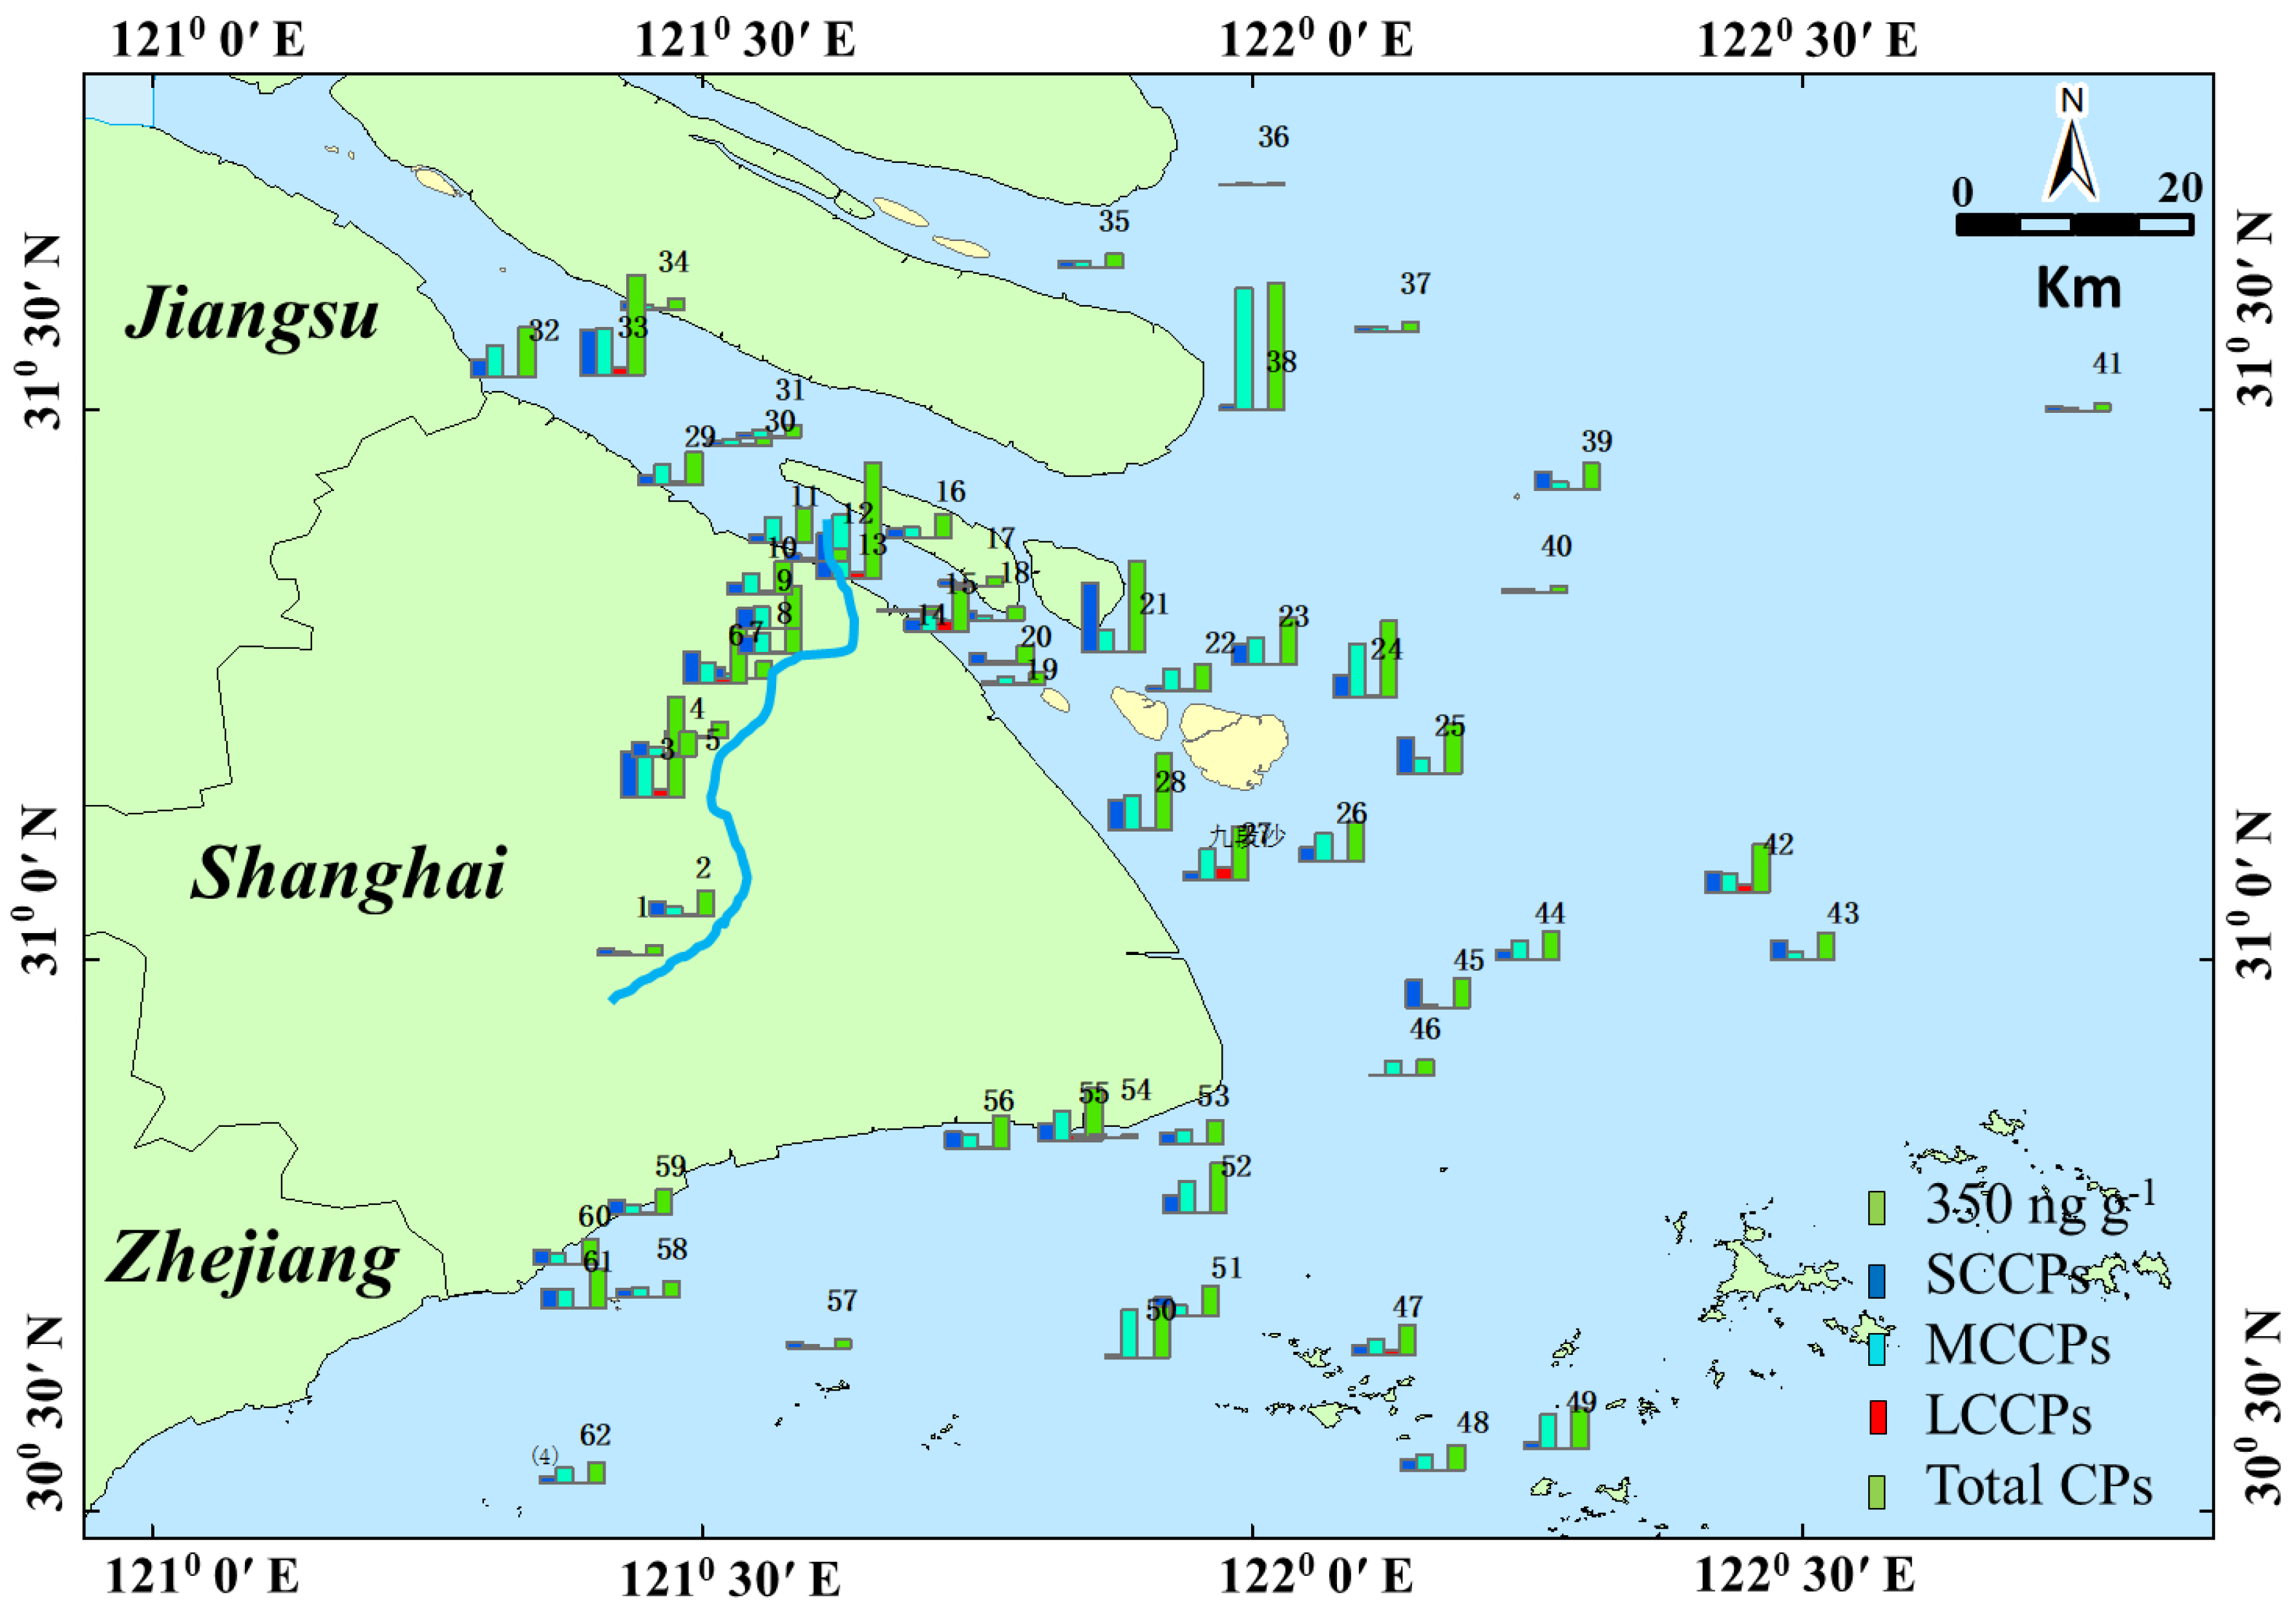
3.2. Concentrations of CPs in Sediments

Figure 3 shows the detected concentrations of SCCPs, MCCPs, and LCCPs in the four areas. The highest concentrations of total CPs were found in the Huang River (166.08 to 2145.18 ng g−1, mean of 797.98 ng g−1). Most samples in the Yangtze Estuary (38.12 to 1820.32 ng g−1, mean of 580.78 ng g−1), East Sea Coastal (124.75 to 890.42 ng g−1, mean of 483.63 ng g−1), and Hangzhou Bay (54.88 to 964.44 ng g−1, mean of 532.77 ng g−1) areas exhibited low concentrations, while the detected CP values for samples 22–29, 56, and 59 were abnormally high. These unusual areas are all discarding areas for sediment dredging. Obviously, sediment dredging activities were the main reason for the high CP levels exhibited in the Yangtze Estuary and Hangzhou Bay area. The mean concentrations of SCCPs, MCCPs, and LCCPs were 252.43, 340.52, and 41.18 ng g−1, respectively. The concentrations of SCCPs are 6.7–27.7 times higher than those measured along the East China Sea coast19. This result is reasonable since a previous study found that SCCPs spread seaward and southward from the Yangtze Estuary and north of the inner shelf.
The concentrations of total SCCPs in surface sediments collected from the Huangpu River ranged from 101.09 to 841.49 ng g−1, with an average value of 356.25 ng g−1, which was 1.5–1.7 orders of magnitude higher than those in sediments from others. In addition, it is higher than that in the Liaohe River Basin [14] but lower than that in the Pearl River Delta1. Sample 1 exhibited the lowest SCCP concentrations in the Huangpu River. The relatively low concentrations of SCCPs in sediments are similar to environmental background values and may be generated by the low anthropogenic emissions of CPs upstream. As the Huangpu River flowed through the urban area, the concentrations of SCCPs in the river sediments obviously increased. Sampling points 1–13 are places where dredging is often carried out, and the sediments from these places are transported to the vicinity of sampling points 22–29, 56, and 59 for dumping.
The values of SCCPs detected in the Yangtze Estuary, Hangzhou Bay, and East Sea Coastal were 16.09 to 1270.7 ng g−1 with a mean of 233.16 ng g−1, 8.76 to 361.35 ng g−1 with a mean of 213.80 ng g−1, and 17.54 to 495.88 ng g−1 with a mean of 219.19 ng g−1, respectively. These values are lower than that of the Huangpu River but higher than that of the area far away from the land. These results are consistent with the results reported by Zeng et al., in which the SCCP concentrations exhibited a decreasing trend with increasing distance from the coast [19,20]. In addition to the samples of the Huangpu River, higher concentrations of SCCPs were found in the samples collected from the sediment discarding area (68.00 to 659.26 ng g−1, mean of 316.27 ng g−1). This result indicated that CPs exhibited low mobility, which is also consistent with the results obtained by Zeng et al. They found that most SCCPs in Changjiang River Delta sediments are from the Changjiang River input [19]. Among those SCCPs, a minor fraction will be transported offshore by the inner shelf.
The measured concentrations of MCCPs in all sediments ranged from 22.03 to 1730.78 ng g−1. The MCCP concentrations were generally higher than those of the SCCPs but were in the same range as the concentrations of Yangtze Estuary sediments collected in 2017 [37]. Similar results were also found in suburban soils in Shanghai, in Pearl River sediments, in nine lake sediment cores in China, and in sediments from lake Thun in Switzerland [1,4,13,38]. Although the production of SCCPs has stopped worldwide, M/LCCPs are still used as alternatives. Thus, the concentrations of MCCPs and the ratio of MCCPs/SCCPs were higher due to higher MCCP production than SCCPs. The distribution of MCCPs is similar to that of SCCPs, where the Huangpu River (52.93 to 1191.54 ng g−1, mean of 392.81 ng g−1) and the sediment discarding area (170.11 to 768.12 ng g−1, mean of 417.60 ng g−1) exhibited the highest concentrations. Except for the Huangpu River and the sediment discarding area samples, the mean values of MCCPs detected in the Yangtze Estuary, Hangzhou Bay, and East Sea Coastal samples were 315.10 ng g−1, 307.23 ng g−1, and 241.10 ng g−1, respectively.
For LCCPs, only 74.1% of samples were detected. The concentrations ranged from 0.64 to 236.86 ng g−1. Most LCCPs were found in the Huangpu River and discarding area sediments. LCCPs have been used in place of SCCPs in recent years. Thus, the cumulative concentration in the sediment is lower than that of SCCPs and MCCPs. It is interesting that sample 47 exhibited higher values of MCCPs and LCCPs and lower values of SCCPs. Sample 47 is Yangshan Port, the world’s largest smart container terminal. Thus, the MCCPs and LCCPs detected in sediment sample 47 may be from ship oil spills. Our result is in the same range of the concentrations of LCCPs in nine Chinese lake sediments, which were measured in the range of 36–650 ng g−1 [13]. The details about the concentrations of CPs in all samples are shown in Table S1.
Exposure to environmental CPs is toxicant to organisms and is attributed to lethality, hepatotoxicity, developmental toxicity, carcinogenicity, endocrine- and metabolism-disrupting effects, and immunomodulatory effects [39]. Environmental risks of SCCPs and MCCPs in the atmosphere, soil, water, and marine environment have been reported in previous studies. The no-observed-effect concentrations (NOECs) of SCCPs ranged from 5 × 10³ to 3.9 × 10⁵ ng g−1 for aquatic organisms in freshwater and seawater [40], which was much higher than that in our work. In addition, Lino et al. reported that organisms in sediments were also sensitive to SCCPs [41]. For MCCPs, the predicted no-effect concentration (PNEC) was 1.5 × 10⁴ ng g−1 [42], which was higher than that of the sediments studied in our work. Risk assessments of LCCPs were rare because of the limited data in recent years.

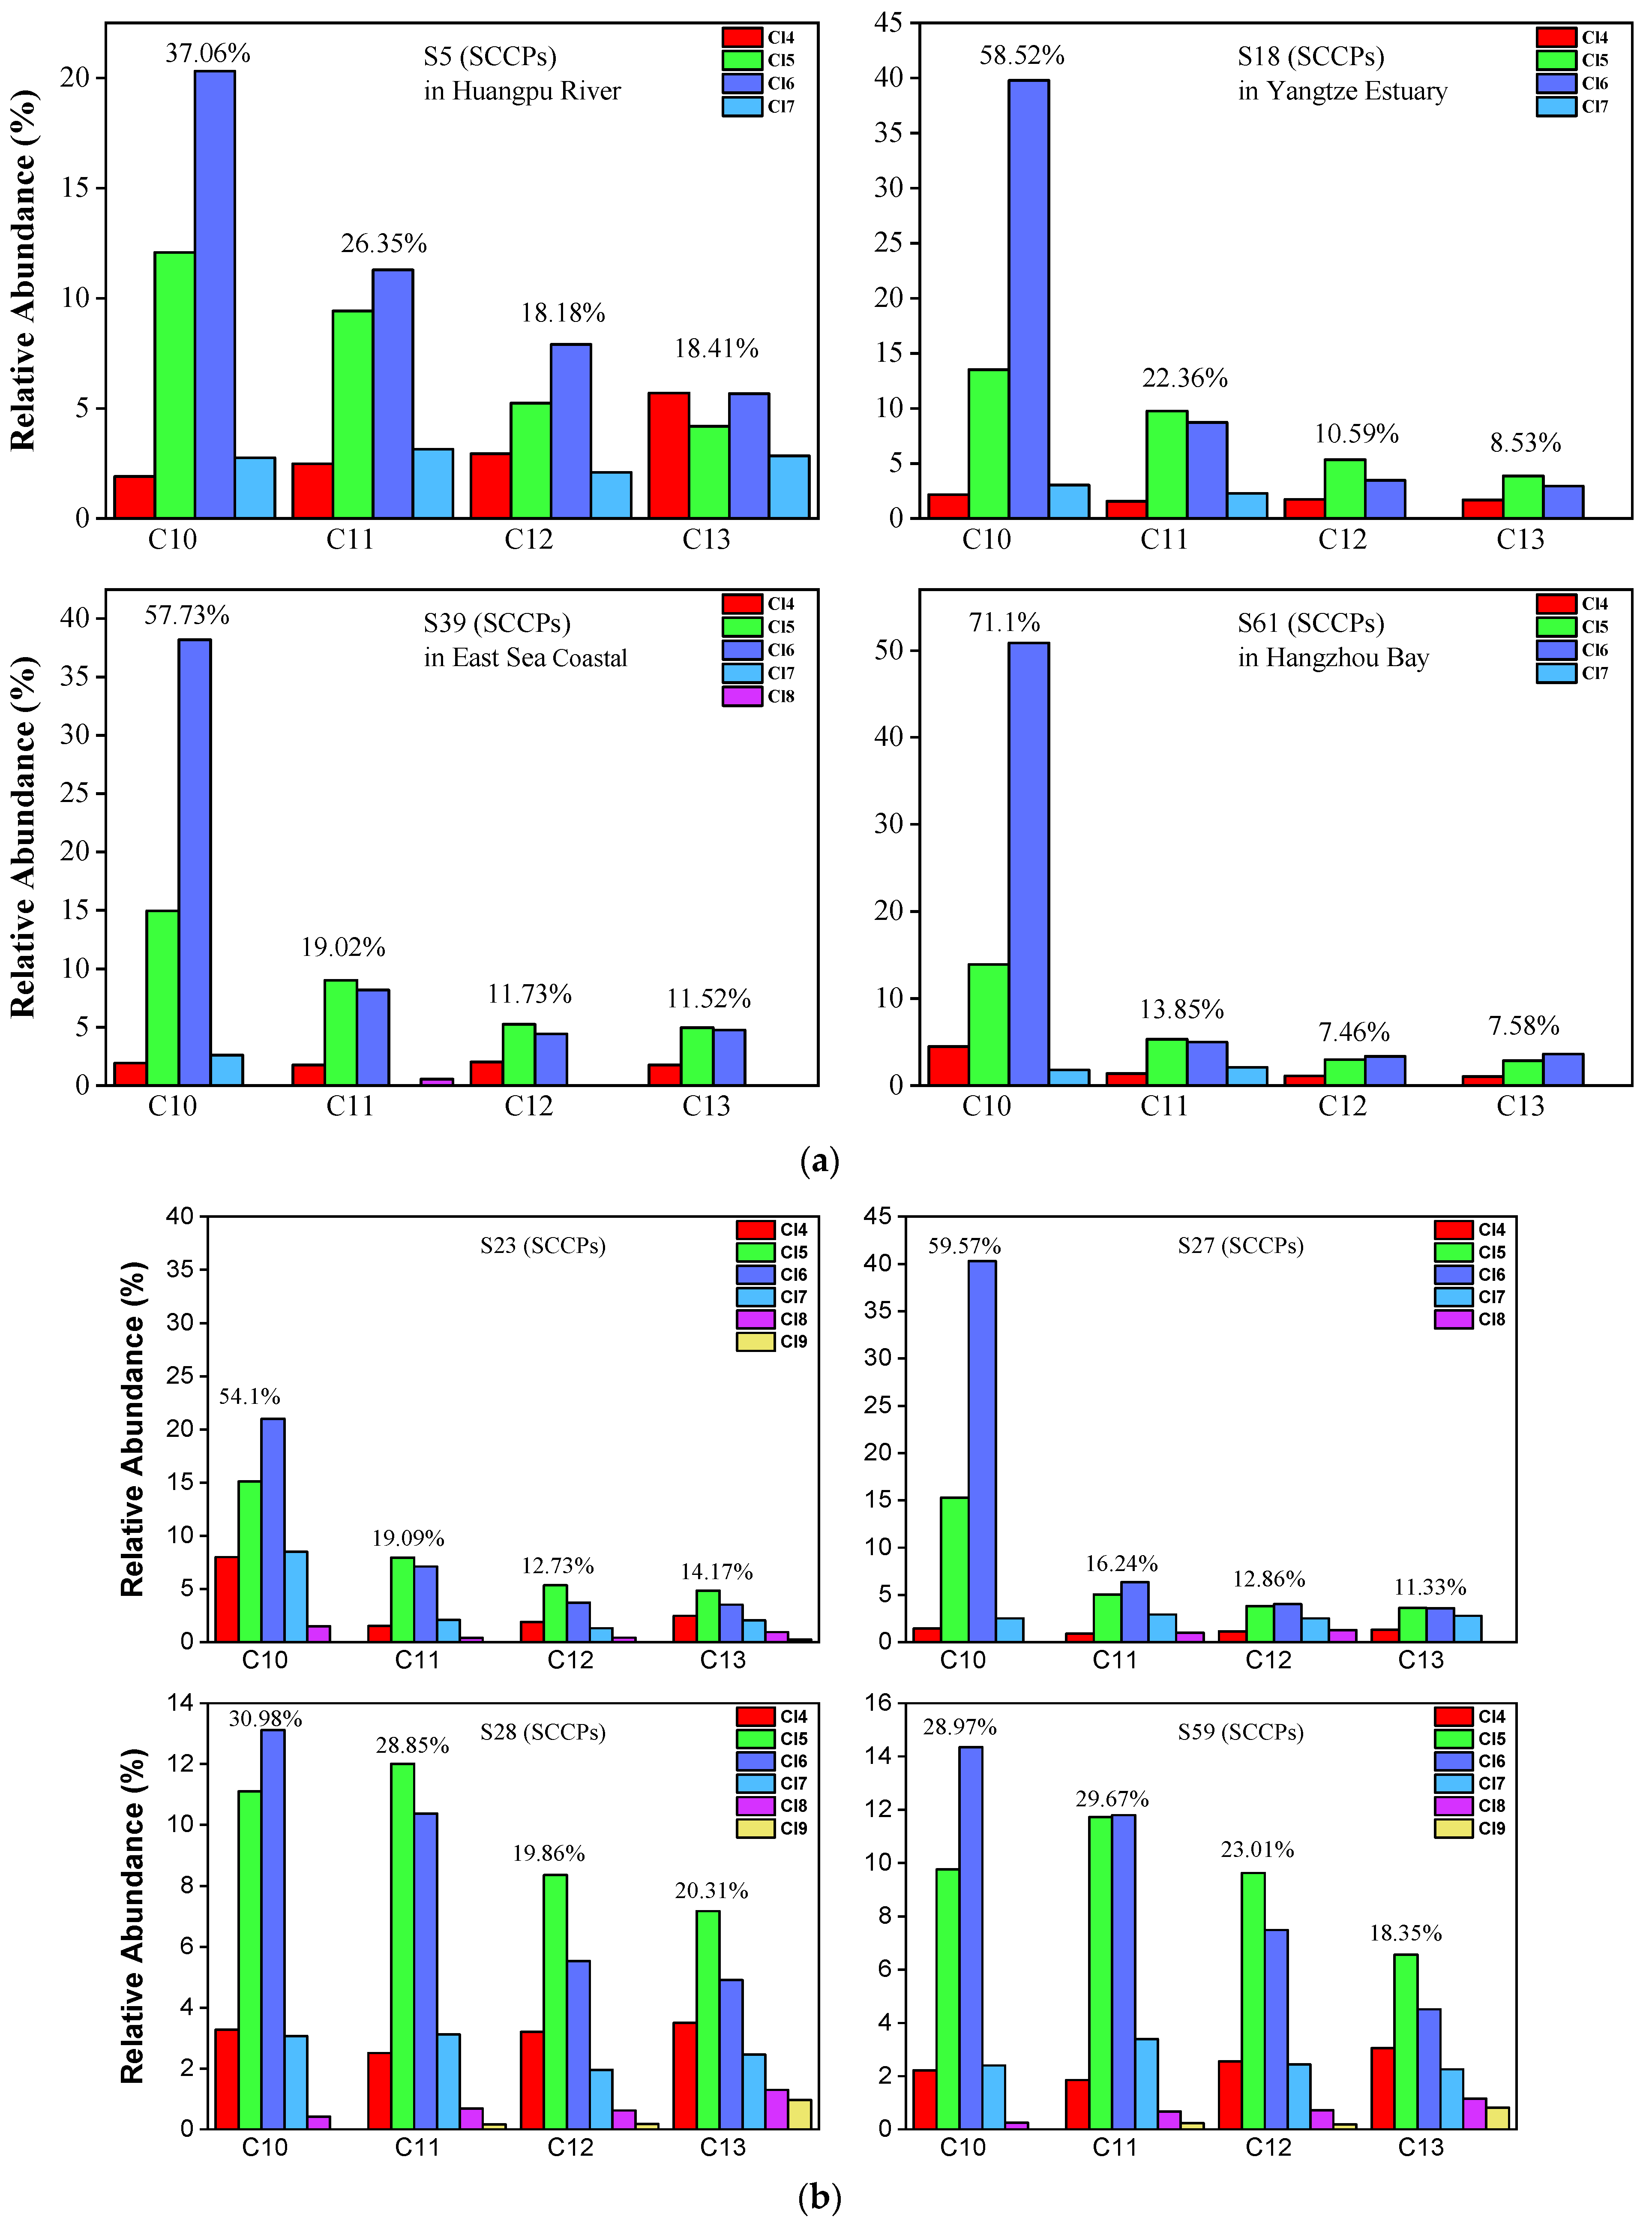
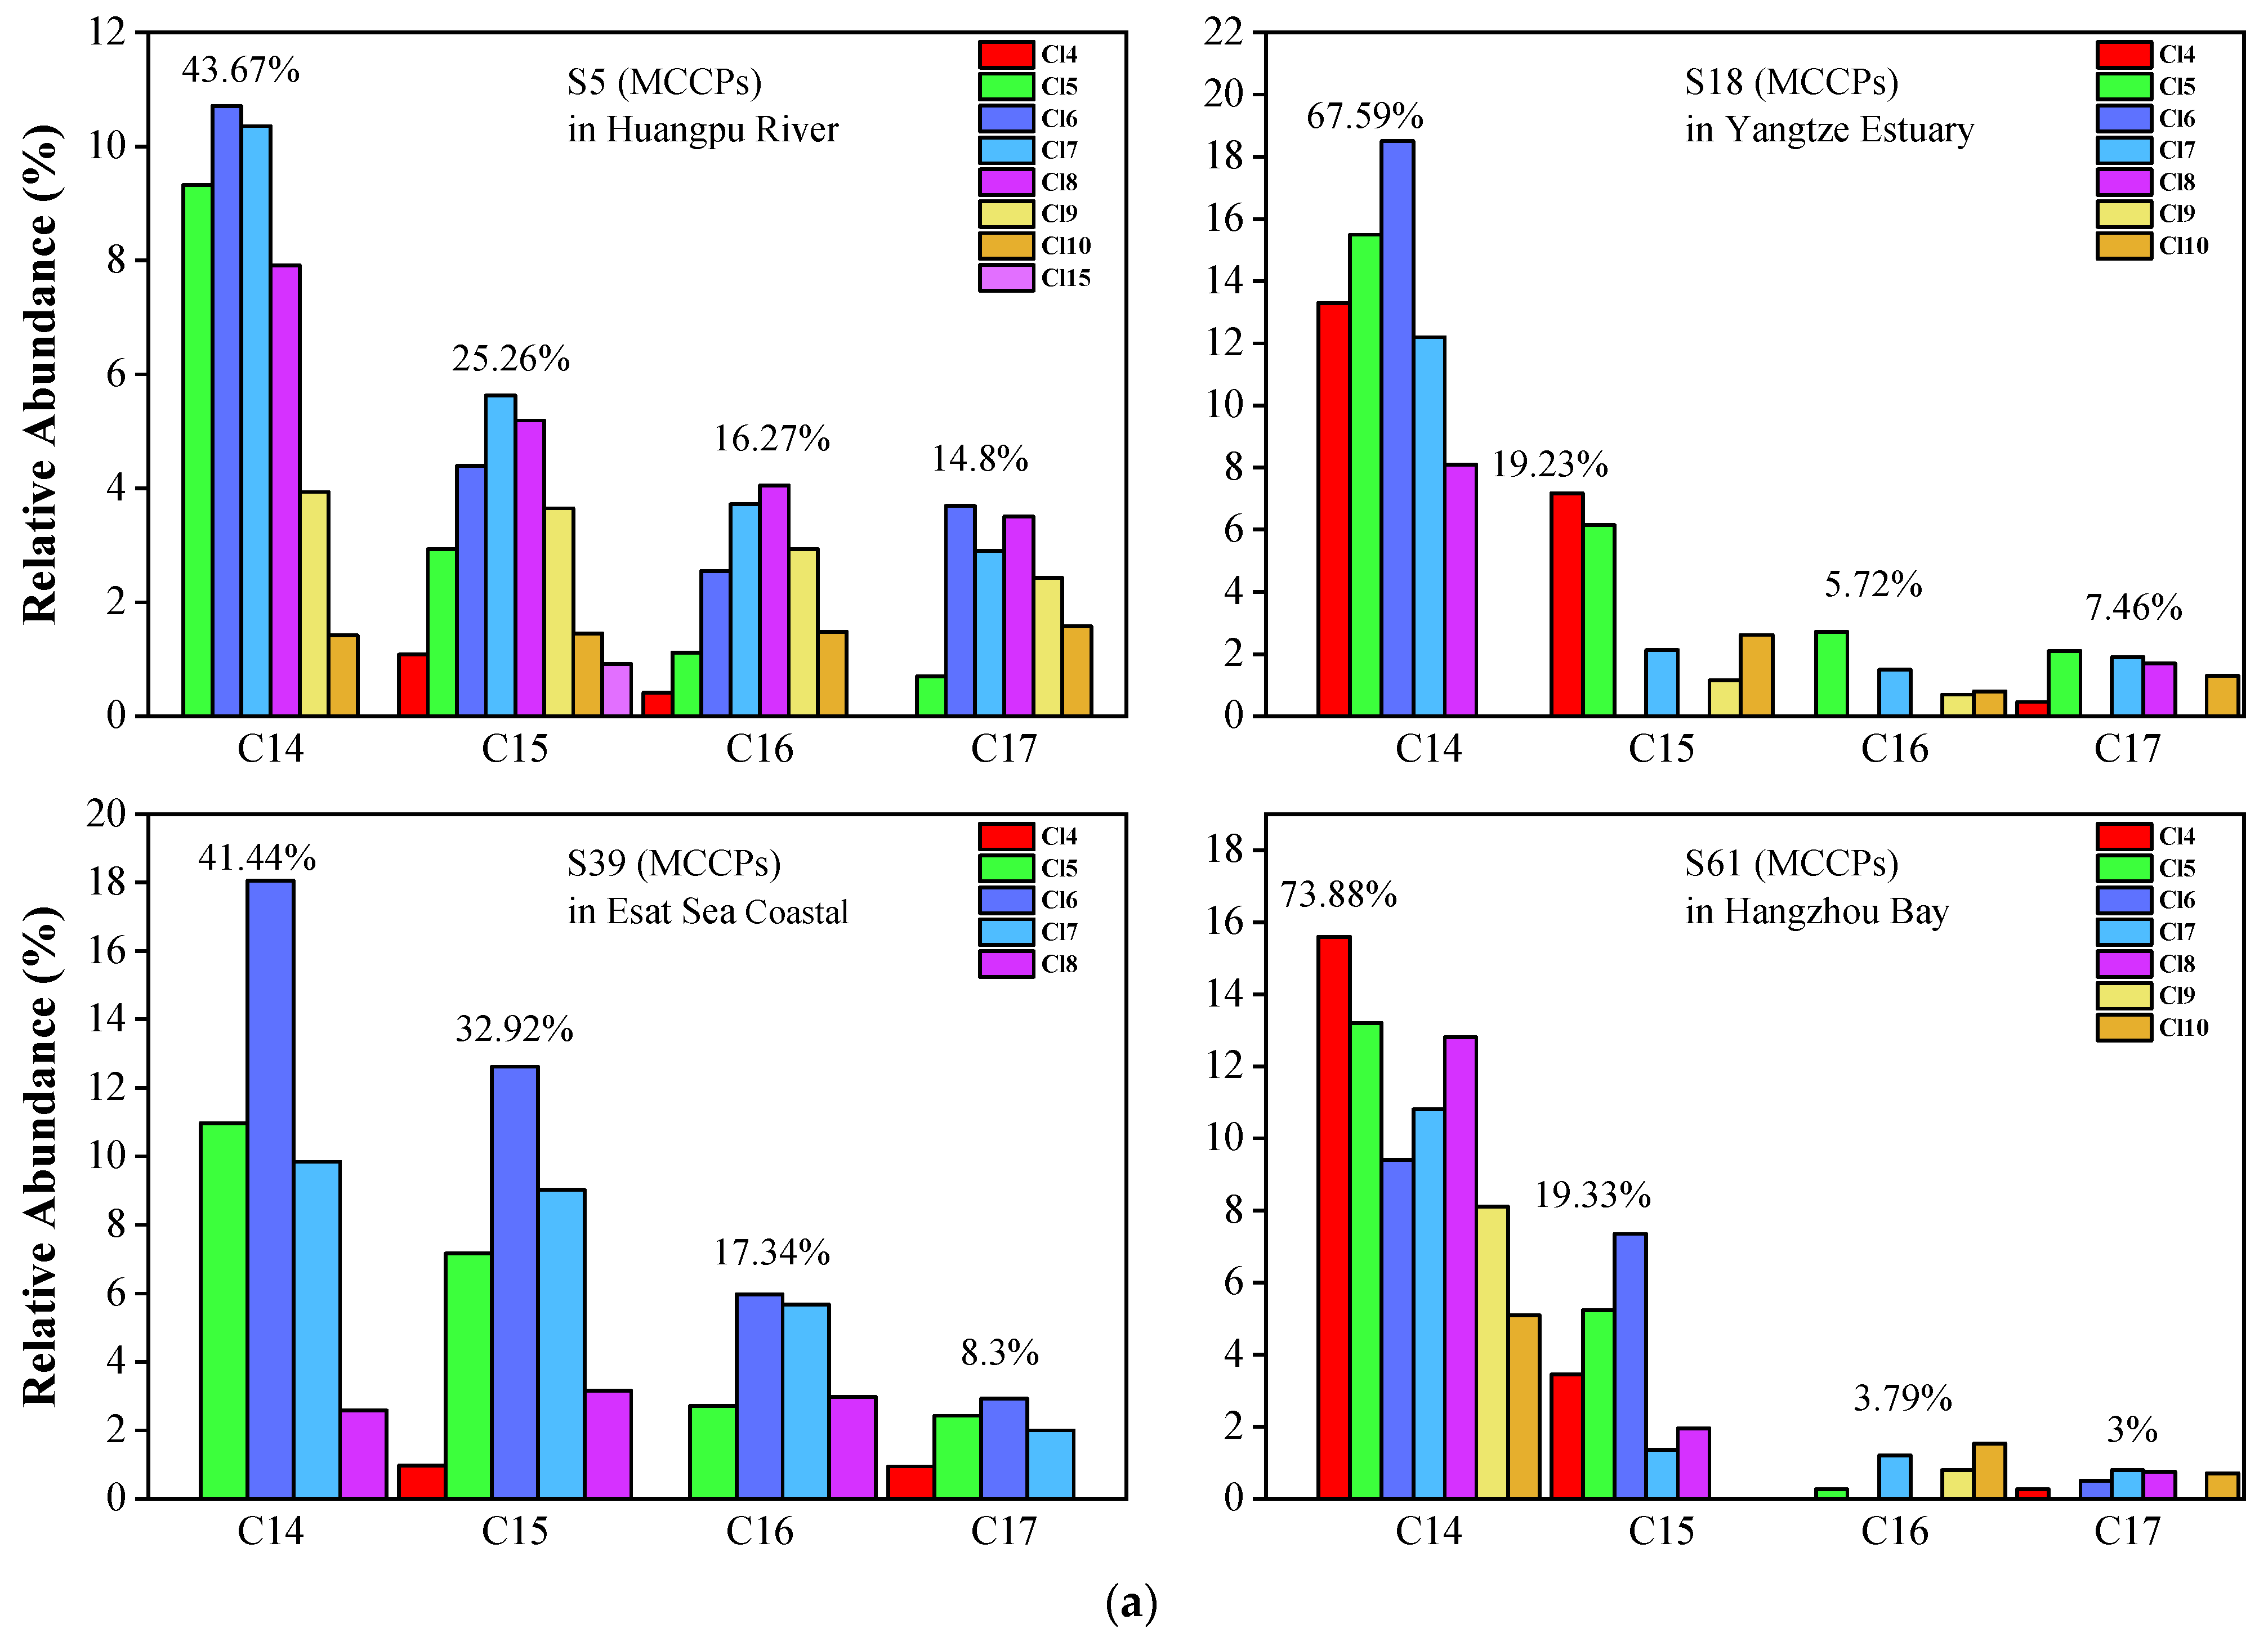
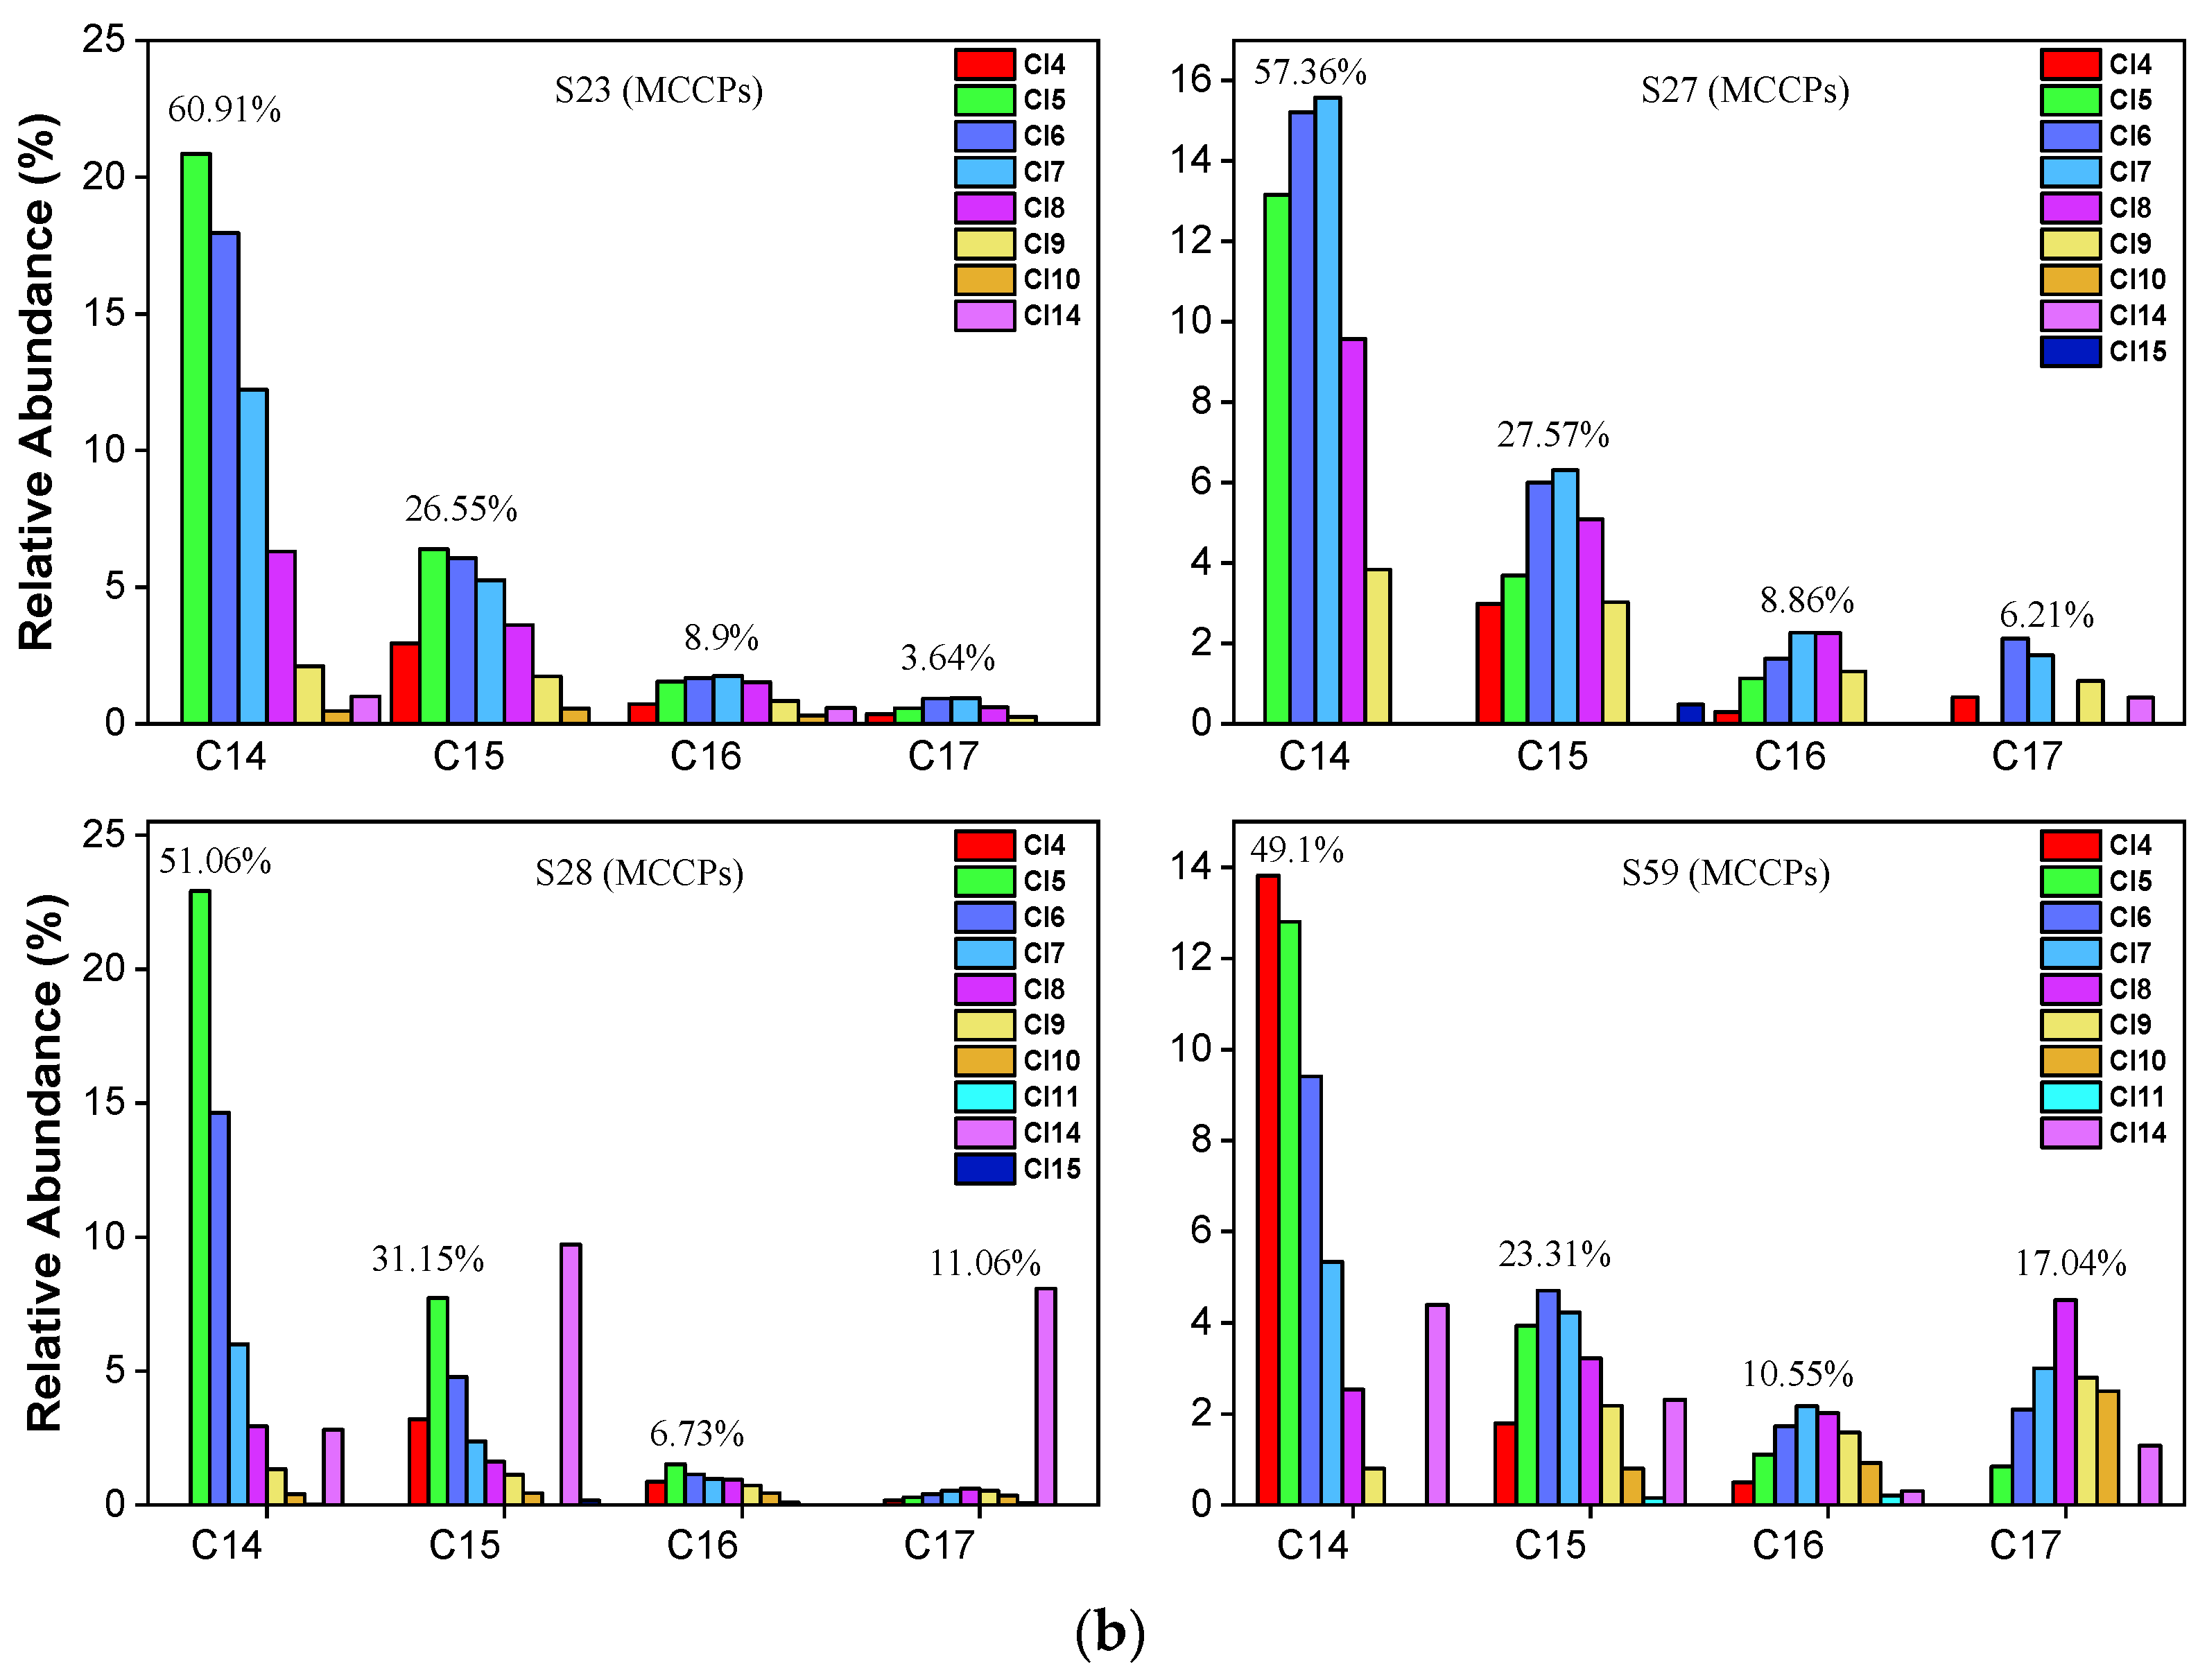
3.3. Congener Group Profile of SCCPs in Sediments

The congener profile of SCCPs showed a prominent variation in not only the different carbon congener groups but also the degree of chlorine. As shown in Figure 4a,b, 37.06% of ∑SCCPs were C10 homologs, which were the most dominant carbon chain groups, followed by C11 homologs (26.35%), C12 homologs (18.18%), and C13 homologs (18.41%) in the Huangpu River. The lower chlorinated congener groups (Cl5 and Cl6), with mean values of 33.44% and 42.80%, respectively, were the predominant congeners from the chlorine groups. This cumulatively accounted for 76.24% of ∑SCCPs in most samples. The abundance of the Cl6 congener groups was higher than that of the Cl5 groups. This is significantly similar to the pattern of Cl congeners in the Yangtze Estuary, especially in the C10 homolog. As shown in Figure 4a,b, in the C10 homolog, the Cl6 congener is the predominant chlorinated group (67.98% in the C10 homolog). The patterns of SCCP congener groups at the dredging points are similar to those of samples found in the Huangpu River. Our results indicate that the SCCPs detected at the dredging points are from the dredged sediments of the Huangpu River. It is similar that Cl6 congener groups are the predominant congeners in the samples from the other three areas, and this pattern is similar to the samples in those reported in previous studies [12,16,19,20,21,38,43]. These results indicate that SCCPs can be transported by the alluvial build-up of rivers.
For MCCPs (Figure 5a,b), the short-chain (C14) homolog group abundance was significantly higher than C15-C17 in all samples. The average value of the C14 homolog accounted for 55.62% of MCCPs. C15, C16, and C17 accounted for 25.67%, 9.78%, and 8.93%, respectively. Cl5-Cl8 are the predominant congers in all samples, which indicates that the sources of MCCPs in the Yangtze Estuary and Huangpu River are similar. The concentrations of LCCPs were lower, and only samples 2, 32, 23, and 59 showed the pattern in Figure S1. In contrast to SCCPs and MCCPs, the long-chain (C24-28) homolog group is significantly higher than the short-chain (C18-C23) group. The composition profiles of SCCP, MCCP, and LCCP congeners in every collected sediment sample are shown in Figures S2–S4.

3.4. Spatial Distribution of TOC and the Relationship with CPs

The inner continental shelf of the East China Sea is an important area of buried terrigenous organic carbon. In aquatic environments, the distribution and accumulation of organic pollutants could be related to TOC, which was substantiated by a previous study [44]. No significantly relevant relation was found between TOC and the concentrations of CPs, as shown in Figure S5. As shown in Figure S6, the TOC values of the sediment samples were measured in the range of 0.06% to 0.94% in this study. The average values of TOC in the Huangpu River, Yangtze Estuary, East Sea Coastal, and Hangzhou Bay were measured as 0.55%, 0.35%, 0.37%, and 0.42%, respectively. The details about the value of TOC in all samples are shown in Table S1. The overall trend of TOC values was higher along the Huangpu River and in discarding areas than in other samples. The East Sea Coastal has no significantly lower value because it is also a necessary sink for pollutants absorbed in sediments from direct riverine inputs and land-originated surface runoff.
Generally, there is a relationship between high concentrations of organic pollutants and high TOC since organic pollutants easily migrate from the water column to sediments due to the high affinity between these materials. A correlation analysis between TOC and CP levels was conducted. However, there were no significant relationships observed between SCCPs/MCCPs/LCCPs and TOC. This is most likely because equilibrium might not have yet been reached in the sediments.

4. Conclusions

There are two main results presented in this study. First, HPLC-QTOF-MS was finally performed to analyze CPs in samples collected from four areas because of the low LOD and LCCP analysis in our present work. Second, the migration of CPs with sediment transportation was revealed. SCCPs and MCCPs were detected in all samples, but LCCPs were present in 74.1% of samples. The measured concentrations in environmental samples were 8.76 to 1270.7 ng g−1 for SCCPs, 22.03 to 1730.78 ng g−1 for MCCPs, and from undetected (ND) to 236.86 ng g−1 for LCCPs. The concentrations of SCCPs and MCCPs were lower than those of NOECs and PNECs reported in other studies. The concentrations of SCCPs were higher than those in the Liaohe River Basin but lower than those in the Pearl River Delta, and the MCCPs were similar to those in most studies. TOC values of all samples were from 0.06% to 0.94%. Although the TOC values of the samples in the Huangpu River and discarding areas were higher than those of the others, there was no linear relation between the TOC values and concentrations of CPs. The concentrations of CPs in the discarding area were significantly higher than those at most sample points. Not only was the congener group profile of SCCPs detected in the discarding area the same as in the Huangpu River, but also the pattern of Cl congeners was similar between them for MCCPs. The results indicate that the CPs detected in the sediment discarding areas are mainly from Huangpu River and provide theoretical support for the potential migration factors of CPs.

Supplementary Materials

The following supporting information can be downloaded at: https://www.mdpi.com/article/10.3390/w14213461/s1. A table shows the detailed concentrations, TOCs, and coordinates of CPs. Figures S1–S4 show the composition profiles of SCCP, MCCP, and LCCP congeners in every collected sediment sample from the Huangpu River, Yangtze Estuary, East Sea Coastal, and Hangzhou Bay. Figure S5 shows the correlation between the CP concentrations and the total organic carbon, and Figure S6 shows the spatial distribution trend of concentrations of TOC (%) detected at the sampling points.

Author Contributions

C.M.: Conceptualization, Supervision, Software. T.Y.: Resources, Investigation and Writing, Writing—Original Draft, Formal analysis. B.D.: Validation. All authors have read and agreed to the published version of the manuscript.

Funding

This project was funded by Youth Marine Science Fund Project of East China Sea Bureau of Ministry of Natural Resources (202202); The Open Research Fund of Key Laboratory of Marine Ecosystem Dynamics (MED202005); The Yangtze Delta Estuarine Wetland Ecosystem Observation and Research Station, Ministry of Education & Shanghai Science and Technology Committee (ECNU-YDEWS-2020).

Informed Consent Statement

Informed consent was obtained from all subjects involved in the study.

Acknowledgments

We appreciate the partial funding support from the Youth Marine Science Fund Project of the East China Sea Bureau of the Ministry of Natural Resources (202202); The Open Research Fund of Key Laboratory of Marine Ecosystem Dynamics (MED202005); The Yangtze Delta Estuarine Wetland Ecosystem Observation and Research Station, Ministry of Education & Shanghai Science and Technology Committee (ECNU-YDEWS-2020).

Conflicts of Interest

The authors declare no conflict of interest.

References

  1. Chen, M.; Luo, X.; Zhang, X.; He, M.; Chen, S.; Mi, B. Chlorinated paraffins in sediments from the Pearl River Delta, South China: Spatial and temporal distributions and implication for processes. Environ. Sci. Technol. 2011, 45, 9936–9943. [Google Scholar] [CrossRef]
  2. Bayen, S.; Obbard, J.P.; Thomas, G.O. Chlorinated paraffins: A review of analysis and environmental occurrence. Environ. Int. 2006, 32, 915–929. [Google Scholar] [CrossRef]
  3. Barber, J.L.; Sweetman, A.J.; Thomas, G.O.; Braekevelt, E.; Stern, G.A.; Jones, K.C. Spatial and temporal variability in air concentrations of short-chain (C10–C13) and medium-chain (C14–C17) chlorinated n-alkanes measured in the UK atmosphere. Environ. Sci. Technol. 2005, 39, 4407–4415. [Google Scholar] [CrossRef]
  4. Iozza, S.; Mueller, C.E.; Schmid, P.; Bogdal, C.; Oehme, M. Historical profiles of chlorinated paraffins and polychlorinated biphenyls in a dated sediment core from Lake Thun (Switzerland). Environ. Sci. Technol. 2008, 42, 1045–1050. [Google Scholar] [CrossRef]
  5. Iino, F.; Takasuga, T.; Senthilkumar, K.; Nakamura, N.; Nakanishi, J. Risk assessment of short-chain chlorinated paraffins in Japan based on the first market basket study and species sensitivity distributions. Environ. Sci. Technol. 2005, 39, 859–866. [Google Scholar] [CrossRef]
  6. Houde, M.; Muir, D.C.G.; Tomy, G.T.; Whittle, D.M.; Teixeira, C.; Moore, S. Bioaccumulation and trophic magnification of short- and medium-chain chlorinated paraffins in food webs from lake ontario and lake michigan. Environ. Sci. Technol. 2008, 42, 3893–3899. [Google Scholar] [CrossRef]
  7. Hussy, I.; Webster, L.; Russell, M.; Moffat, C. Determination of chlorinated paraffins in sediments from the firth of clyde by gas chromatography with electron capture negative ionisation mass spectrometry and carbon skeleton analysis by gas chromatography with flame ionisation detection. Chemosphere 2012, 88, 292–299. [Google Scholar] [CrossRef]
  8. van Mourik, L.M.; Gaus, C.; Leonards, P.E.G.; de Boer, J. Chlorinated paraffins in the environment: A review on their production, fate, levels and trends between 2010 and 2015. Chemosphere 2016, 155, 415–428. [Google Scholar] [CrossRef]
  9. Wang, Y.; Gao, W.; Jiang, G. Strengthening the study on the behavior and transformation of medium-chain chlorinated paraffins in the environment. Environ. Sci. Technol. 2017, 51, 10282–10283. [Google Scholar] [CrossRef]
  10. Feo, M.L.; Eljarrat, E.; Barcelo, D. Occurrence, fate and analysis of polychlorinated n-alkanes in the environment. Trac-Trends Anal. Chem. 2009, 28, 778–791. [Google Scholar] [CrossRef]
  11. Yuan, B.; McLachlan, M.S.; Roos, A.M.; Simon, M.; Strid, A.; de Wit, C.A. Long-chain chlorinated paraffins have reached the arctic. Environ. Sci. Technol. Lett. 2021, 8, 753–759. [Google Scholar] [CrossRef]
  12. Zhou, Y.; Yin, G.; Du, X.; Xu, M.; Qiu, Y.; Ahlqvist, P.; Chen, Q.; Zhao, J. Short-chain chlorinated paraffins (SCCPs) in a freshwater food web from Dianshan Lake: Occurrence level, congener pattern and trophic transfer. Sci. Total Environ. 2018, 615, 1010–1018. [Google Scholar] [CrossRef]
  13. Zhang, C.; Chang, H.; Wang, H.; Zhu, Y.; Zhao, X.; He, Y.; Sun, F.; Wu, F. Spatial and temporal distributions of short-, medium-, and long-chain chlorinated paraffins in sediment cores from nine lakes in China. Environ. Sci. Technol. 2019, 53, 9462–9471. [Google Scholar] [CrossRef]
  14. Gao, Y.; Zhang, H.; Su, F.; Tian, Y.; Chen, J. Environmental occurrence and distribution of short chain chlorinated paraffins in sediments and soils from the Liaohe River Basin, P.R. China. Environ. Sci. Technol. 2012, 46, 3771–3778. [Google Scholar] [CrossRef]
  15. Xu, J.; Gao, Y.; Zhang, H.; Zhan, F.; Chen, J. Dispersion of short- and medium-chain chlorinated paraffins (CPs) from a CP production plant to the surrounding surface soils and coniferous leaves. Environ. Sci. Technol. 2016, 50, 12759–12766. [Google Scholar] [CrossRef]
  16. Da, C.; Wang, R.; Xia, L.; Huang, Q.; Cai, J.; Cai, F.; Gao, C. Sediment records of polybrominated diphenyl ethers (PBDEs) in Yangtze River Delta of Yangtze River in China. Mar. Pollut. Bull. 2020, 160, 111714. [Google Scholar] [CrossRef]
  17. Li, T.; Wan, Y.; Gao, S.; Wang, B.; Hu, J. High-throughput determination and characterization of short-, medium-, and long-chain chlorinated paraffins in human blood. Environ. Sci. Technol. 2017, 51, 3346–3354. [Google Scholar] [CrossRef]
  18. Wu, C.; Wei, Y.D.; Huang, X.; Chen, B. Economic transition, spatial development and urban land use efficiency in the Yangtze River Delta, China. Habitat Int. 2017, 63, 67–78. [Google Scholar] [CrossRef]
  19. Zeng, L.; Zhao, Z.; Li, H.; Thanh, W.; Liu, Q.; Xiao, K.; Du, Y.; Wang, Y.; Jiang, G. Distribution of short chain chlorinated paraffins in marine sediments of the East China Sea: Influencing factors, transport and implications. Environ. Sci. Technol. 2012, 46, 9898–9906. [Google Scholar] [CrossRef]
  20. Zeng, L.; Chen, R.; Zhao, Z.; Wang, T.; Gao, Y.; Li, A.; Wang, Y.; Jiang, G.; Sun, L. Spatial distributions and deposition chronology of short chain chlorinated paraffins in marine sediments across the chinese bohai and Yellow Seas. Environ. Sci. Technol. 2013, 47, 11449–11456. [Google Scholar] [CrossRef]
  21. Zeng, L.; Lam, J.C.W.; Wang, Y.; Jiang, G.; Lam, P.K.S. Temporal trends and pattern changes of short- and medium-chain chlorinated paraffins in marine mammals from the South China Sea over the past decade. Environ. Sci. Technol. 2015, 49, 11348–11355. [Google Scholar] [CrossRef] [PubMed]
  22. Liu, Y.; Chen, L.; Huang, Q.; Li, W.; Tang, Y.; Zhao, J. Source apportionment of polycyclic aromatic hydrocarbons (PAHs) in surface sediments of the Huangpu River, Shanghai, China. Sci. Total Environ. 2009, 407, 2931–2938. [Google Scholar] [CrossRef] [PubMed]
  23. Chibwe, L.; Myers, A.L.; De Silva, A.O.; Reiner, E.J.; Jobst, K.; Muir, D.; Yuan, B. C12-30 alpha-bromo-chloro "Alkenes": Characterization of a poorly identified flame retardant and potential environmental implications. Environ. Sci. Technol. 2019, 53, 10835–10844. [Google Scholar] [CrossRef] [PubMed]
  24. Zhao, Z.; Li, H.; Wang, Y.; Li, G.; Cao, Y.; Zeng, L.; Lan, J.; Wang, T.; Jiang, G. Source and migration of short-chain chlorinated paraffins in the Coastal East China Sea using multiproxies of marine organic geochemistry. Environ. Sci. Technol. 2013, 47, 5013–5022. [Google Scholar] [CrossRef]
  25. Zeng, L.; Wang, T.; Han, W.; Yuan, B.; Liu, Q.; Wang, Y.; Jiang, G. Spatial and vertical distribution of short chain chlorinated paraffins in soils from wastewater irrigated farmlands. Environ. Sci. Technol. 2011, 45, 2100–2106. [Google Scholar]
  26. Reth, M.; Zencak, Z.; Oehme, M. New quantification procedure for the analysis of chlorinated paraffins using electron capture negative ionization mass spectrometry. J. Chromatogr. A 2005, 1081, 225–231. [Google Scholar]
  27. Hollies, J.I.; Pinnington, D.F.; Handley, A.J.; Baldwin, M.K.; Bennett, D. The determination of chlorinated long-chain paraffins in water, sediment and biological samples. Anal. Chim. Acta 1979, 111, 201–213. [Google Scholar] [CrossRef]
  28. Campbell, I.; Mcconnell, G. Chlorinated paraffins and the environment.1. environmental occurrence. Environ. Sci. Technol. 1980, 14, 1209–1214. [Google Scholar] [CrossRef]
  29. Randegger-Vollrath, A. Determination of chlorinated paraffins in cutting fluids and iubricants. Fresenius J. Anal. Chem. 1998, 360, 62–68. [Google Scholar] [CrossRef]
  30. Coelhan, M. Determination of short chain polychlorinated paraffins in fish samples by short column GC/ECNI-MS. Anal. Chem. 1999, 71, 4498–4505. [Google Scholar]
  31. Korytar, P.; Parera, J.; Leonards, P.E.G.; Santos, F.J.; de Boer, J.; Brinkman, U.A.T. Characterization of polychlorinated n-alkanes using comprehensive two-dimensional gas chromatography-electron-capture negative. Ionisation time-of-flight mass spectrometry. J. Chromatogr. A 2005, 1086, 71–82. [Google Scholar] [CrossRef] [PubMed]
  32. Zencak, Z.; Borgen, A.; Reth, M.; Oehme, M. Evaluation of four mass spectrometric methods for the gas chromatographic analysis of polychlorinated n-alkanes. J. Chromatogr. A 2005, 1067, 295–301. [Google Scholar] [CrossRef] [PubMed]
  33. Tomy, G.T.; Fisk, A.T.; Westmore, J.B.; Muir, D.C. Environmental chemistry and toxicology of polychlorinated n-alkanes. Rev. Environ. Contam. Toxicol. 1998, 158, 53–128. [Google Scholar] [PubMed]
  34. Moore, S.; Vromet, L.; Rondeau, B. Comparison of metastable atom bombardment and electron capture negative ionization for the analysis of polychloroalkanes. Chemosphere 2004, 54, 453–459. [Google Scholar] [CrossRef]
  35. Van Mourik, L.M.; Leonards, P.E.G.; Gaus, C.; de Boer, J. Recent developments in capabilities for analysing chlorinated paraffins in environmental matrices: A review. Chemosphere 2015, 136, 259–272. [Google Scholar] [CrossRef]
  36. Schinkel, L.; Lehner, S.; Heeb, N.V.; Lienemann, P.; McNeill, K.; Bogdal, C. Deconvolution of mass spectral interferences of chlorinated alkanes and their thermal degradation products: Chlorinated alkenes. Anal. Chem. 2017, 89, 5923–5931. [Google Scholar] [CrossRef]
  37. Zheng, L.; Lian, L.; Nie, J.; Song, Y.; Yan, S.; Yin, D.; Song, W. Development of an ammonium chloride-enhanced thermal-assisted-ESI LC-HRMS method for the characterization of chlorinated paraffins. Environ. Pollut. 2019, 255, 113303. [Google Scholar] [CrossRef]
  38. Wang, X.; Xu, S.; Wang, X.; Hu, B.; Jia, H. Occurrence, homologue patterns and source apportionment of short- and medium-chain chlorinated paraffins in suburban soils of Shanghai, China. Chemosphere 2017, 180, 302–311. [Google Scholar] [CrossRef]
  39. Wang, X.; Zhu, J.; Xue, Z.; Jin, X.; Jin, Y.; Fu, Z. The environmental distribution and toxicity of short-chain chlorinated paraffins and underlying mechanisms: Implications for further toxicological investigation. Sci. Total Environ. 2019, 695, 133834. [Google Scholar] [CrossRef]
  40. Zheng, X.; Sun, Q.; Wang, S.; Li, X.; Liu, P.; Yan, Z.; Kong, X.; Fan, J. Advances in studies on toxic effects of short-chain chlorinated paraffins (SCCPs) and characterization of environmental pollution in China. Arch. Environ. Contam. Toxicol. 2020, 78, 501–512. [Google Scholar] [CrossRef]
  41. Fisk, A.T.; Tomy, G.T.; Muir, D.C.G. Toxicity of C10-, C11-, C12-, and C14-polychlorinated alkanes to Japanese medaka (Oryzias latipes) embryos. Environ. Toxicol. Chem. 1999, 18, 2894–2902. [Google Scholar]
  42. Gluege, J.; Schinkel, L.; Hungerbuehler, K.; Cariou, R.; Bogdal, C. Environmental risks of medium-chain chlorinated paraffins (MCCPs): A review. Environ. Sci. Technol. 2018, 52, 6743–6760. [Google Scholar] [CrossRef] [PubMed]
  43. Li, C.; Chen, L.; He, Y.; Liang, Y.; Wang, Y.; Li, F.; Gao, W.; Wang, Y.; Jiang, G. Migration mechanism and risk assessment of chlorinated paraffins in highly polluted Ya’Er lake area, China. Environ. Pollut. 2021, 281, 117015. [Google Scholar] [CrossRef]
  44. Zhu, Z.Y.; Zhang, J.; Wu, Y.; Lin, J. Bulk particulate organic carbon in the East China Sea: Tidal influence and bottom transport. Prog. Oceanogr. 2006, 69, 37–60. [Google Scholar] [CrossRef]
Figure 1. The map shows the sampling points of surficial sediments (▲, ■, ●, ◆ and ) collected from Shanghai offshore areas (▲ was collected from Huangpu River, ■ was collected from the Yangtze Estuary, ● was collected from East Sea Coastal, ◆ was collected from Hangzhou Bay, and was collected from the sediment dropping area. Most of the Sediment was from the Huangpu River).
Water 14 03461 g001
Figure 2. Calculated standard curves between the total response factor (TRF) and chlorinity (%) of CPs using standard CP mixtures.
Water 14 03461 g002
Figure 3. The map shows the spatial distribution trend of concentrations of CPs (ng g−1) in the sampling points in which the blue bar is SCCPs, the light blue bar is MCCPs, the red bar is LCCPs, and the green bar is total CPs.
Water 14 03461 g003
Figure 4. (a) Representative congener group abundance profiles of SCCPs in surficial sediments collected from the Huangpu River, Yangtze Estuary, East Sea Coastal, and Hangzhou Bay. (b) Representative congener group abundance profiles of SCCPs in surficial sediments from the dredging sediment discarding area.
Water 14 03461 g004
Figure 5. (a) Representative congener group abundance profiles of MCCPs in surficial sediments collected from the Huangpu River, Yangtze Estuary, East Sea Coastal, and Hangzhou Bay. (b) Representative congener group abundance profiles of MCCPs in surficial sediments from the dredging sediment discarding area.
Water 14 03461 g005aWater 14 03461 g005b
Table 1. Summary of the CPs detection method.
NumberInstrumental TechniqueCPsLOD
(μg L−1)
Reference
1TLC SCCPs/MCCPs/LCCPs*[27,28]
2GC/ECDSCCPs/MCCPs*[29]
3GC/ECNI-MS SCCPs/MCCPs500[30,31,33]
4GC/NICI-MS SCCPs/MCCPs*[32]
5GC/MABSCCPs*[34]
6CH2Cl2-enhanced HPLC/EI-MS/MS, APCI-MS/MS, or ESI-MS-MS SCCPs/MCCPs/LCCPs10 to 1200[17,35,36]
7NH4Cl-enhanced HPLC/EI-MS/MS, APCI-MS/MS or ESI-MS-MSSCCPs/MCCPs/LCCPs10 to 20[37]
Note(s): * Data of CPs in sediments was not available. TLC: Thin layer chromatography. GC/ECD: Gas chromatography electron capture detectors. GC/ECNI-MS: Gas chromatography coupled with electron capture negative ion mass spectrometry. GC/NICI-MS: Gas chromatography negative ion chemical ionization-mass spectrometry. GC/MAB: Gas chromatography coupled with metastable atom bombardment. HPLC/EI-MS/MS, APCI-MS/MS, or ESI-MS-MS: CH2Cl2-enhanced liquid chromatography coupled with atmospheric pressure chemical ionization, electron ionization, and electrospray ionization mass spectrometry. LOD: The limit of detection of CPs in sediments.
Publisher’s Note: MDPI stays neutral with regard to jurisdictional claims in published maps and institutional affiliations.

