Abstract
Multi-functional rainwater storage space is a practical solution to flood and runoff pollution in high-density built-up areas. This study presents a location decision method to improve the control effect of total runoff volume, runoff peak flow, and runoff pollution. The results show that this method can accurately and quickly screen available locations for multi-functional rainwater storage space and prioritize them as optimum, suitable, less suitable, unsuitable, and not available for construction. In the case of this study, greening the road can achieve a better effect on runoff control.
1. Introduction
The emergence of a series of problems, such as stormwater runoff pollution and frequent flooding in cities [1,2], has drawn extensive international attention to urban stormwater management. In the past decades, stormwater management concepts such as Low Impact Development (LID) in the United States [3] and Water Sensitive Urban Design (WSUD) in Australia [4] have emerged. In recent years, China has also proposed the concept of “Sponge City” for stormwater management and has gradually developed the construction of sponge cities nationwide. However, the traditional urban development model has brought many challenges to Sponge City [5]. The high-density development model focusing on space utilization has squeezed the green space in cities, and the space available for rainwater storage is seriously insufficient. Coordinating space utilization and rainwater storage in high-density built-up areas has become a problem.
So far, many studies and applications of rainwater storage [6,7,8] have been carried out in many countries, resulting in various multi-functional storage measures for urban rainwater [9]. Multi-functional rainwater storage facilities mainly store rainwater while considering more than one function, such as the environment, climate, ecology, energy, and landscape. Due to its ability to achieve multiple effects with limited space resources, multi-functional rainwater storage is the best choice for high-density urban flood control systems. Among the many land use types in cities, green spaces are flexible and changeable, which have good retention and purification effects on the first flush, can control the volume of runoff, reduce the peak flow of runoff, and reduce the pollution of the receiving water [10,11,12]. Green space can also reduce ground temperature while alleviating the urban heat island effect [13]. Converting green space into storage space is an effective method for multi-functional stormwater storage in high-density built-up areas. To maximize the runoff control effect of multi-functional rainwater storage space, selecting a good location is a crucial issue in the construction of Sponge City. Many scholars have achieved LID layout optimization by combining optimization algorithms with hydrological models, such as coupling the Non-Sorting Genetic Algorithm (NSGA-II) [14,15,16,17] or Marginal-Cost-based Greedy Strategy (MCGS) [18] with the Storm Water Management Model (SWMM) for location decision. These studies often use a single or comprehensive, objective function but rarely consider the different problems of each region. At the same time, model-based optimization methods often require a lot of data for region modeling and very time-consuming calculations, which is unsuitable for large-scale studies. Some scholars have proposed index frameworks to support spatial decision-making for LID and determine facility location [19,20,21]. However, these studies did not focus on the characteristics of a specific facility [19,20], nor did they analyze the main problems that may not be the same in different regions [21]. This may make the location decision less targeted, the benefits of the facility not fully exploited, and the status problems not very well solved.
Therefore, this study proposes a method to control runoff in high-density built-up areas. This method can quickly select the location of a multi-functional rainwater storage space in a large-scale area, which can simultaneously control the total runoff volume, peak flow value, and pollutants. In this study, multi-functional rainwater storage spaces refer to small green spaces, sunken green spaces, wetlands, parks, etc. The multi-functionality is reflected in the control of total runoff in many aspects. The method is suitable for an urban scale and allows for quick screening of the locations of multi-functional rainwater storage spaces and comparing their priority. The method uses cluster analysis to analyze the problems in each area so that the location decision is more targeted. The data used in this method are mainly processed in ArcGIS and ENVI (The Environment for Visualizing Images), and the hydrological process is considered in the location decision system. It is hoped that this method will provide a reference for the preliminary work of urban planning and urban rainwater management to facilitate further detailed planning and design proposals.
2. Materials and Methods
2.1. Study Area and Data
The study area is Xicheng, a district of Beijing, China, which has a typically temperate climate with a continental semi-humid and semi-arid monsoon climate, covering an area of 50.7 km2. Rainfall conditions do not differ much in the study area, and geographical conditions are the main reason for the formation of runoff. In recent years, local rainfall has increased, especially frequent extreme rainfall, causing runoff to accumulate on urban roads and low-lying areas, seriously affecting traffic and people’s lives. As a core area of Beijing, it has a high building density with many historical relics, buildings, and streets. It is hard to find dedicated space for rainwater storage. Therefore, it is necessary to maximize the available space.
In order to evaluate the suitability of this area for rainwater storage, the data used here are: ① The boundary data of the administrative districts of Xicheng (Polygon); ② The remote sensing image of Xicheng is used to extract land cover types (Raster images, the resolution is 1 m, Figure 1a); ③ Digital elevation model data (DEM) of Xicheng is used to calculate the elevation, slope, and catchment flow path of the study area (Raster images, the resolution is 30 m, Figure 1b); ④ Road distribution data in Xicheng, which is used to calculate road network density (Polyline, Figure 1c); ⑤ Buildings’ outline data of Xicheng, which is used to remove the areas not available for construction (Polygon, Figure 1d); ⑥ Point of Interest (POI) data of Xicheng, which is used to calculate the density of significant point sources for pollutants (Point, Figure 1e).
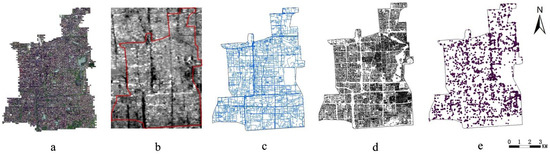
Figure 1.
The five types of data used for the evaluation of the study area. (a) The remote sensing image; (b) Digital elevation model data; (c) Road distribution data; (d) Buildings’ outline data; (e) Point of Interest (POI) data.
2.2. Methods
The overall study method has four parts (Figure 2): First, a classification and evaluation system was established to classify and evaluate plots in the study area. Second, the plots were clustered according to the system, and the major problems of each plot were identified. Third, influencing indicators were selected for the location decision of multi-functional rainwater storage space. Finally, the influencing indicators’ weights were determined, and the priorities of the location decision were calculated. The purpose of the classification and evaluation system for land plots is to identify the main problems present in the plots, so six indicators related to flooding and runoff pollution were selected based on hydrology. The selection of indicators in the location decision evaluation system is based on the goals to be achieved by the multi-functional rainwater storage space, which affect the total runoff volume, peak runoff, and runoff pollution in a plot, and by which the plots are evaluated so that it can be determined in which locations the multi-functional rainwater storage space can be placed to produce more efficient benefits. The indicators in these two systems are discussed in more detail in Section 2.2.1 and Section 2.2.2.
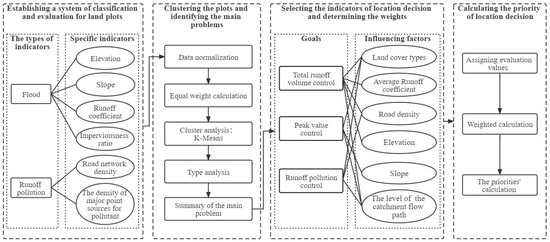
Figure 2.
The overall framework of the technical method of this study.
There are two index systems in this method: the classification and evaluation system for land plots and the location decision evaluation system. The purpose of the plot classification and evaluation system is to classify the plots and distinguish the main problems of each plot. The location decision evaluation system proposes indicators that affect the location decision. The main problems of each plot determine the weights of the location decision indicators. Finally, the priority of the location decision is calculated based on the weight of each indicator and the evaluation value after classification. The relationship among these parts is shown in Figure 3. In this chapter, Part a corresponds to Section 2.2.1, Part b to Section 2.2.2, and Part c to Section 2.2.3.
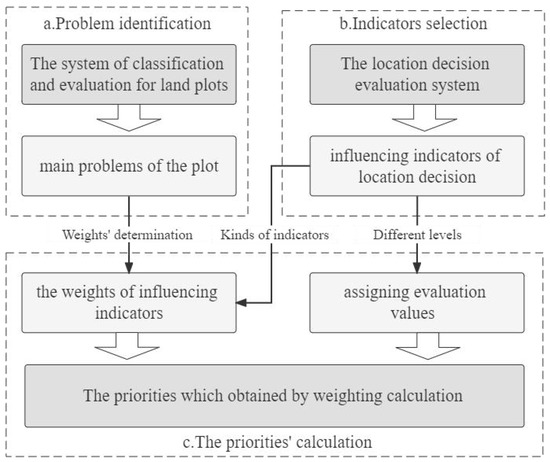
Figure 3.
The relationship between the three parts of the method. (a) Identification of the main problem in the plot. (b) Selection of indicators influencing location decision. (c) Calculation of the priorities of the location decision.
2.2.1. Classification of Plots and Identification of Main Problems
Urban roads have changed the original catchment flow path with road dividers and curb stones that block and divide the runoff. Therefore, this study divided the area into 38 plots based on major urban roads (Figure 4).
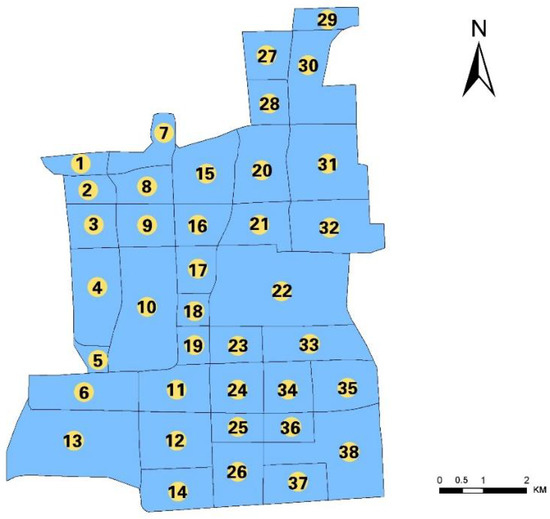
Figure 4.
The division of land plots and their corresponding numbers.
To classify the plots and identify their major problems, it is necessary to construct a system of indicators for classification and evaluation. These indicators are in terms of flood and runoff pollution. The indicators in terms of flooding include four specific indicators: elevation, slope, runoff coefficient, and imperviousness. The indicators in terms of runoff pollution included two specific indicators: road network density and the density of major point sources. No industrial pollution sources exist in this study area, and the major sources of pollutants are the commercial areas and roads. Therefore, road network density and major point source density were selected as the specific indicators of runoff pollution. Supermarkets and restaurants were selected as the major point sources. The system of classification and evaluation of land plots is shown in Table 1.

Table 1.
The system of classification and evaluation of land plots.
When constructing a multi-functional rainwater storage space, the main problems of each plot should be identified first so that the location can be targeted. In this study, the six indicators were selected to categorize the plots, which reflect the main reasons why flood and runoff pollution risks exist in high-density built-up areas. This study classified the plots to identify the main problems in each category of plots. This study used K-means clustering [26] by Statistical Product Service Solutions (SPSS) to classify the plots with equal weights of specific indicators. Based on the cluster analysis results, it was possible to analyze the characteristics and differences between different types of plots so that the main problems could be identified.
The specific indicators need to be processed before clustering. A positive indicator (PI) means that the more important indicator has a larger value, while a negative indicator (NI) does the opposite. In this paper, elevation is a NI, and other indicators are PIs. Due to the differences in the nature, dimension, order of magnitude, and other characteristics of each indicator, it cannot be used directly to analyze the characteristics of each plot. Therefore, this study used the min-max normalization method to deal with the indicators, which scaled the data to the range of [0, 1]. If the indicator is a PI, its equation is defined as:
If the indicator is a NI, its equation is defined as:
In the equation, x represents the original value, xnormalized represents the indicator value after normalization, max(x) represents the maximum value of a set of data, and min(x) represents the minimum value of a set of data.
2.2.2. Establishment of the Location Decision Evaluation System and Data Processing
Establishing a location decision evaluation system requires screening indicators for flooding and runoff pollution. Many influencing indicators in the control of flood and runoff pollution overlap and influence one another. This study selected the representative influencing indicators. Firstly, three goals were selected for controlling flood and runoff pollution: total runoff volume control, peak runoff rate control, and runoff pollution control. Moreover, the respective influencing indicators of the three goals were then determined. Table 2 shows the influencing indicators of the location decision. The data was processed with ArcGIS after selecting the influencing indicators for the location decision.
Table 2.
Influencing indicators and their quantification methods for the location decision of multi-functional rainwater storage space.
- (1)
- Average runoff coefficient calculation
The building density in the study area is relatively high. According to the reference of the “Code for Design of Outdoor Wastewater Engineering” (GB50014-2006) [33], the runoff coefficient of the green areas was 0.15, and the runoff coefficient of impervious surfaces was 0.85 because these areas are mainly composed of buildings and asphalt roads, the runoff coefficient of the water body was 1. Grids were set up with a length and width of 300 m. The proportions of various underlying surfaces were calculated in a grid, respectively, and then the average runoff coefficient was calculated.
- (2)
- Road network density calculation
Road network density is the ratio of the total length of all roads to the total area of this area, and the unit is km/km2. To analyze the density of the road network, it was necessary to create grids in ArcGIS with the appropriate scale according to the size of the study area. In this study, the length and width of the grid were both 100 m, and then intersection analysis of the grids and road data was performed. The road network density was calculated in the attribute table. The calculation equation is:
In the equation, D is the road network density, km/km2, L is the total length of roads in a grid, km, and S is the area of a grid, km2.
- (3)
- The level of the catchment flow path
The value of the accumulation reflects the strength of the raster’s ability to converge water flow [34]. The larger the accumulation value, the easier it is to form surface runoff. When the accumulation reaches a certain threshold, the surface runoff will be generated, and all raster images with values larger than the critical threshold are potential catchment flow paths [35]. The storage facilities for rainwater collect mostly large-scale runoff, so only the main catchment flow path in the study area needed to be extracted. In this study, the spatial analysis module in ArcGIS was used to extract the catchment flow path with the D8 single flow direction algorithm [36]. The accumulation was calculated for each raster image, and a threshold of 50 was set for the accumulation of the catchment to extract the catchment flow paths. Then their levels were differentiated by the Shreve grading method.
2.2.3. The Priority of Location Decision for Multi-Functional Rainwater Storage Space
The weights of the three goals of multi-functional rainwater storage space in the plot were determined based on the main problems of each plot after the classification of the plots. By analyzing the main problems, the priority of achieving the goals was ranked. According to the sorted results, the weights of the three goals were 0.50, 0.30, and 0.20, from high to low. This method screened out the relevant influencing indicators of different plots, but the weight of indicators cannot be determined due to the different characteristics of different plots. For this reason, the weights of the influencing indicators corresponding to each goal were considered equal, and then the total weight of each influencing indicator was calculated (Table 3).
Table 3.
Calculation of the weights of the influencing indicators of location decision.
The six influencing indicators were divided into different levels, and evaluation values (E) were assigned to each level. The land cover types, green space, impervious surface, and water body were assigned evaluation values of 70, 30, and 0. Average runoff coefficient, road network density, priority elevation, the level of the catchment flow path, and slope were divided into five grades according to the method of the Jenks Natural Breaks Classification [37], which were assigned evaluation values in the order of 90, 70, 50, 30, 10 according to the grade from high to low. The calculation of the priority evaluation value (I) was as follows:
In the equation, I is the priority evaluation value, W is the weight of influencing indicator i, E is the evaluation value of influencing indicator i, and n is the number of influencing indicators. I is the weighted calculation of the six influencing indicators, which correspond to three goals (Table 2), so I is the priority evaluation value of the location decision in which the three goals are factored. A high value of indicates that this location is suitable for constructing multi-functional rainwater storage space in urban planning, while a low value of indicates the opposite.
3. Results
3.1. The Distribution of Land Plot Types
Values for the six specific indicators of the classification and evaluation system of the land plots were calculated on the ArcGIS platform. The results are shown in Figure 5.
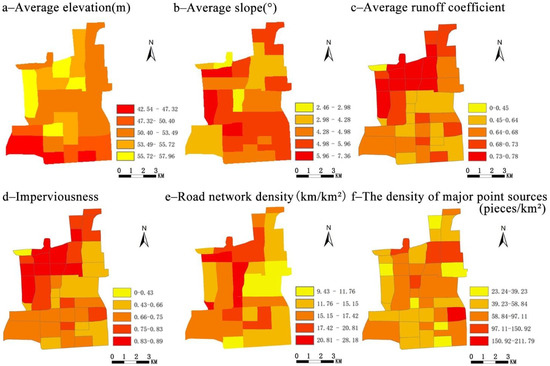
Figure 5.
Calculation results of specific indicators of the classification and evaluation system of the land plots. (a) Average elevation in each plot, (b) average slope in each plot, (c) average runoff coefficient in each plot, (d) imperviousness in each plot, (e) road network density in each plot, (f) the density of major point sources in each plot.
K-means clustering of the six specific indicators was performed using SPSS, and variance analysis was used to analyze the differences between each indicator for the clustering categories. The results are shown in Table 4. The significance of the six indicators was less than 0.05, indicating that the differences between the six groups obtained by cluster analysis were large [38], and the clustering categories showed significance for all study items. In conclusion, each indicator had obvious differences in clustering categories.
Table 4.
Difference comparison results of a cluster category analysis of variance.
The 38 plots were divided into six categories by cluster analysis. Their characteristics and main problems were analyzed according to the classification results.
3.2. The Sorting of Goals for Location Decision
According to the main problems, the ranking of goals in the location decision of multi-functional rainwater storage space was determined. Different categories of plots in the cluster analysis results have their characteristics, and they have different levels of urgency for performing total runoff volume control, peak runoff control, and pollutants in runoff control, which leads to various rankings of urgency for achieving the goals. The cluster analysis results, type characteristics, main problems, and the ranking of desired goals of the plots are shown in Table 5.
Table 5.
K-means cluster analysis results and analysis of plots.
Table 5 shows that the six types of plots can be further divided into four categories based on the ranking of desired goals. The ranking of the desired goals implies that the achievement of the former has a higher priority than the latter. The salient problems of the plot determine the ranking of these goals, and location decisions should focus more on the achievement of the top-ranked goals and prioritize the salient problems in the plots. The classification results of the plots are shown in Figure 6.
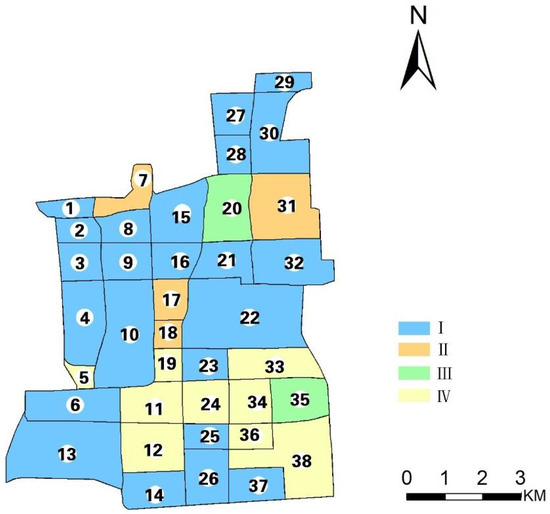
Figure 6.
Distribution of the four categories of plots in the study area.
In Type I plots, the road network density and the major point source density were relatively low. The risk of pollution was low, but the plots had a solid ability to generate runoff, or the average elevation level was low, into which runoff was easy to flow, so the runoff volume should be controlled first.
The Type II plots still had a strong ability to generate runoff, and road network density or major point source density was high, but their average slope was low. So for the Type II plots, controlling runoff pollution was more important than controlling runoff peak flow in this situation.
Type III plots had high road network density and major point source density, so pollutants in runoff should be mainly controlled. At the same time, these plots had strong runoff generation capacity and a relatively gentle average slope, so the priority of controlling total runoff volume was higher than controlling peak runoff.
The average slope of Type IV plots was large, and the runoff velocity was fast, resulting in a large peak flow [30]. The road network and primary point source density were small, so the runoff pollution degree was low.
3.3. Influencing Indicators of Location Decision
The original data were processed in ArcGIS. The results are shown in Figure 7.
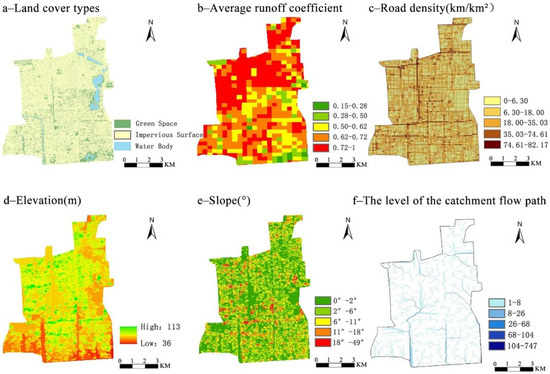
Figure 7.
Calculation results of six influencing indicators of location decision. (a) Land cover types distribution of Xicheng, (b) average runoff coefficient distribution of Xicheng, (c) road density distribution of Xicheng, (d) elevation distribution of Xicheng, (e) slope distribution of Xicheng, (f) the level of the catchment flow path distribution of Xicheng.
Figure 7a,b show a high percentage of impervious surface, and the amount of green space was all scattered. The north has a higher runoff coefficient and generates more runoff than the south.
Figure 7c,d show that the road network density in the study area was quite high, and there was a risk of runoff pollution. The north was at a higher elevation than the south. This implied that the south had a higher risk of flooding than the north.
Figure 7e,f show that the study area was relatively flat, with most areas having a slope of no more than 11°. The areas with larger slopes were mainly located in the west and the south.
Urban construction has changed the natural drainage pattern. The catchment flow path shown in Figure 7f overlaps with roads to some extent. The existence of roads has changed the catchment flow paths in the city. Most of the roads in the study area were asphalt with poor water permeability. When rainfall occurs, a large amount of runoff may be generated, affecting the safety of vehicles and pedestrians. At the same time, the pollutants brought by many vehicles may affect the level of runoff pollutants and cause water pollution.
3.4. The Results of Location Decision Priority of Multi-Functional Rainwater Storage Space
The results were calculated in ArcGIS. The values of the six influencing indicators need to be classified, and the evaluation values (E) need to be assigned to them to facilitate the calculation of the final result. The grading situation and evaluation values (E) of the six influencing indicators are shown in Table 6.
Table 6.
Grading situation and evaluation values of influence indicators in the selection of a multi-functional rainwater storage space site.
The weights of influencing indicators were determined in various land plots according to the land plot classification and evaluation results, and the final result was calculated according to Equation (4). The final calculation results were classified by the method of The Jenks Natural Breaks Classification, and they were divided into four levels: Optimum, Suitable, Less Suitable, and Unsuitable. Buildings and water bodies were then removed because these areas could not be used as the location of multi-functional rainwater storage space. Figure 8 shows the priority of the location decision.
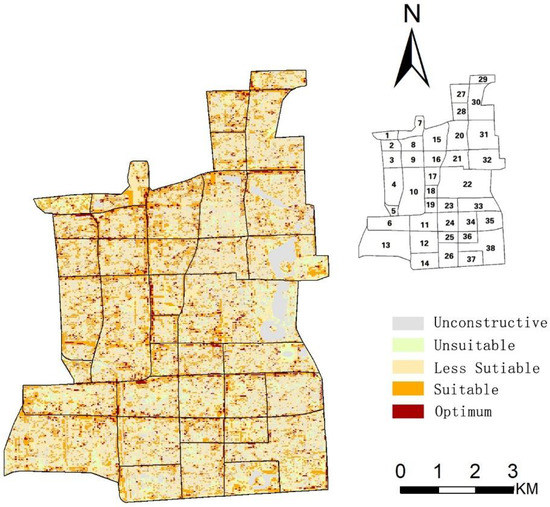
Figure 8.
Spatial distribution of comprehensive evaluation results of the location decision.
By superimposing the evaluation results of location decision priority and the actual satellite photos of the study area, it was found that the areas with higher priority for constructing multi-functional rainwater storage space are mainly on roads. To avoid the hazards caused by flooding and waterlogging, the road dividers and roadside green space should be fully utilized. The slope of the road cross-section and the way of connecting the road to green space should be reasonably set to promote the drainage of the road and the collection of runoff.
Based on the evaluation results of the priority, the layout planning of multi-functional rainwater storage space can be carried out. The existing green areas with high priority in the location decision are converted into multi-functional stormwater storage spaces. From the spatial distribution of the evaluation results (Figure 8) and the actual satellite images, it can be seen that the areas with high priority include green space in parks (Figure 9a), dense residential areas (Figure 9b), and roads (Figure 9c). The current conditions of each area are different. For the existing green space, the renovation should be reasonably arranged according to the priority of the evaluation results; for the areas without green areas in the current situation, those with high priority should be considered for renovation. The large green space can provide much space for regulation and storage (Figure 9a,c), and the dispersed green space can also control the runoff at the source (Figure 9b). The urgency is low for the green spaces that are centrally distributed but have low priority. Where resources are limited, multi-functional rainwater storage green space can be selectively retrofitted.
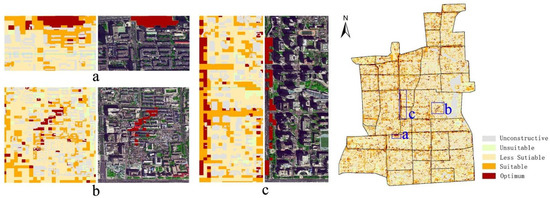
Figure 9.
Correspondence between evaluation results of the location decision and the current situation. (a) A park in front of the office building, (b) a dense residential area, (c) the city ring expressway.
According to the final results of the location decision priority evaluation, the proportion of five evaluation types in the 38 plots was calculated. The results are shown in Table 7.
Table 7.
The area proportion of each priority of multi-functional rainwater storage space in each plot.
As shown in Table 7, except for the Unconstructive area, the priority types of each plot are mainly focused on two grades: Suitable and Less suitable. The optimum and unsuitable areas were relatively few. The horizontal distribution of the priority types of each plot was uneven. The building density of Plot 21 was high, and Plot 22, Plot 31, and Plot 32 had a large body of water, so the proportion of Unconstructive areas in these plots was relatively high. The proportion of the Optimum areas in Plot 2, Plot 8, Plot 17, Plot 18, and Plot 25 was higher than that in other plots, and the proportion of the Suitable areas in Plot 7, Plot 8, Plot 15, Plot 18, and Plot 18 was higher.
4. Discussion
“Priority” is reflected in the urgency of flood risk and runoff pollution risk control and the suitability of building multi-functional green spaces. Urgency affects the runoff control benefits of multi-functional rainwater storage green spaces. The suitability affects the construction costs and the impact on the lives of the citizens. The priority of the location selection of the multi-functional rainwater storage space can be quickly evaluated through this method. Moreover, the final evaluation result can accurately indicate the location of the multi-functional rainwater storage space. At the same time, the plot classification results are used to assign weights to the influencing indicators in the location decision, avoiding the neglect of specific problems and making the location decision for each plot more targeted and better able to solve the problems in the plots. In urban planning and urban stormwater management, the multi-functional rainwater storage green space can be selected first by this method, which can provide a reference for subsequent planning and design, save time and cost, improve the rationality of location selection, and make the urban multi-functional rainwater storage green space more systematic.
In this case, the locations with the highest priority mainly concentrate on roads. The roads have a strong runoff-generating capacity and high risks [39], so the benefits of multi-functional rainwater storage green space are higher here. The current green space area is in good condition to be converted into multi-functional rainwater storage green space, especially a concentrated green space such as a park (Figure 9a). If the green space is sunken, it can provide a large amount of storage space with great benefits. The study area has many early constructed lanes (Figure 9b). The high building density and low construction standards of the drainage network make them prone to flooding. These areas are at high risk but are difficult to retrofit. There are few green spaces, and most of them are tree pools and flower beds. In constructing multi-functional rainwater storage green space, the tree pool should be fully used as the rainwater storage space, and the courtyard space should also be fully used. If necessary, it can be used in combination with rainwater tanks and other facilities. Road reconstruction, such as West 2nd Ring Road in the case (Figure 9c), should fully use green space on and around the road. In this area, the roadside green space should be sunken, and the form of curb stone should be adjusted to channel road runoff into the sunken green space.
In this study, the priority of location decisions was strongly influenced by roads. Better benefits can be obtained from multi-functional rainwater storage spaces arranged along roads. Therefore, the sponge transformation of roads should be emphasized in the next urban renewal. Roads with good greening should be reconstructed by fully using existing green space resources. If there is no space for rainwater storage on the road, grassed swales can be installed on the roadside to receive and transmit runoff from the road, which has a relatively narrow width and can save space. The distribution pattern of location decision priorities will vary between different areas, which is determined by the main problems of the current situation. In this method, the weights of the indicators in the location decision evaluation system are not fixed. The weights take into account the characteristics of the location and change flexibly according to the main problems in the plot, which increases the adaptability of the method to other cities.
5. Conclusions
- (1)
- The location decision method proposed in this study can quickly, simply, and intuitively screen out the areas that can be used for multi-functional rainwater storage space and evaluate their priorities. This method takes into account the control of total runoff volume, peak runoff, and pollutants in runoff simultaneously. The characteristics of the different plots are taken into account in this method, and the location decision results in a better solution to the city’s problems.
- (2)
- The difference in the weight distribution of influencing indicators for the runoff problem in different plots must be considered. In this case, the building density is high, and the area has a lot of underlying impermeable surfaces. There is no huge industrial pollution source. Many plots in the study area focus on controlling total runoff volume. Among the 38 plots in the study area, two plots focus on controlling pollutants in runoff; nine plots that focus on controlling peak runoff are mainly distributed south of the study area; eleven plots focus on controlling total runoff volume. The weights corresponding to the different plots are not the same.
- (3)
- Different plots have different priorities of location decisions for constructing multi-functional rainwater storage space. The priority is determined by the conditions and urgency of constructing multi-functional rainwater storage spaces. Plot 1 has good conditions for constructing multi-functional rainwater storage space and low urgency, so its priority is low. In a comprehensive comparison, Plot 2, Plot 8, Plot 11, and Plot 25 have higher priority than other plots to build multi-functional rainwater storage space.
- (4)
- In the case of this study, laying multi-functional rainwater storage space along the urban road can get the maximum benefit in a high-density built-up area. It is vital to renovate roads. Transforming roadside green space and road isolation belts into multi-functional green spaces can store runoff and control runoff pollution more efficiently.
Author Contributions
Conceptualization, J.J.; Funding acquisition, J.L.; Methodology, J.J. and Z.Z.; Project administration, Z.Z.; Resources, J.L.; Software, J.J.; Validation, Z.Z. and J.L.; Writing—original draft, J.J.; Writing—review and editing, Z.Z. and J.L. All authors have read and agreed to the published version of the manuscript.
Funding
This research was funded by the National Key R&D Program of China (2021YFC3200700).
Data Availability Statement
The boundary data of the administrative districts of Xicheng, the remote sensing image of Xicheng and DEM digital elevation data of Xicheng are available at http://www.gscloud.cn/, accessed on 12 January 2022. Road vector data of Xicheng, Building contour vector data of Xicheng, and Point of Information (POI) data of Xicheng are available on Baidu Map.
Conflicts of Interest
The authors declare no conflict of interest.
References
- Tang, Z.; Engel, B.A.; Pijanowski, B.C.; Lim, K.J. Forecasting land use change and its environmental impact at a watershed scale. J. Environ. Manag. 2005, 76, 35–45. [Google Scholar] [CrossRef] [PubMed]
- Zope, P.E.; Eldho, T.I.; Jothiprakash, V. Impacts of land use–land cover change and urbanization on flooding: A case study of Oshiwara River Basin in Mumbai, India. Catena 2016, 145, 142–154. [Google Scholar] [CrossRef]
- Qin, H.P.; Li, Z.X.; Fu, G. The Effects of Low Impact Development on Urban Flooding Under Different Rainfall Characteristics. J. Environ. Manag. 2013, 129, 577–585. [Google Scholar] [CrossRef] [PubMed]
- Fogarty, J.; Bueren, M.V.; Iftekhar, M.S. Making waves: Creating water sensitive cities in Australia. Water Res. 2021, 202, 117456. [Google Scholar] [CrossRef]
- Zhang, Y.; Li, J.-Q.; Wang, W.L. Analysis of Several Major Puzzles and Countermeasures of Sponge City Construction. China Water Wastewater 2016, 32, 5. [Google Scholar] [CrossRef]
- Coutts, A.M.; Tapper, N.J.; Beringer, J.; Loughnan, M.; Demuzere, M. Watering our cities: The capacity for Water Sensitive Urban Design to support urban cooling and improve human thermal comfort in the Australian context. Prog. Phys. Geogr. 2013, 37, 2–28. [Google Scholar] [CrossRef]
- Ahiablame, L.M.; Engel, B.A.; Chaubey, I. Effectiveness of Low Impact Development Practices: Literature Review and Suggestions for Future Research. Water Air Soil Pollut. 2012, 223, 4253–4273. [Google Scholar] [CrossRef]
- Laura, G.C.; Emily, Z.B.; Louie, R. An integrated approach to place Green Infrastructure strategies in marginalized communities and evaluate stormwater mitigation. J. Hydrol. 2018, 559, 648–660. [Google Scholar] [CrossRef]
- Che, W.; Zhang, Y.; Li, J.Q.; Liu, H.; He, J.P.; Meng, G.H.; Wang, H.L. Multi-functional storage of rainwater in urban area. Water Wastewater Eng. 2005, 31, 25–29. [Google Scholar] [CrossRef]
- Vijayaraghavan, K.; Joshi, U.M. Can green roof act as a sink for contaminants? A methodological study to evaluate runoff quality from green roofs. Environ. Pollut. 2014, 194, 121–129. [Google Scholar] [CrossRef]
- Mutiti, S.; Sadowski, H.; Melvin, C.; Mutiti, C. Effectiveness of Man-Made Wetland Systems in Filtering Contaminants from Urban Runoff in Milledgeville, Georgia. Water Environ. Res. 2015, 87, 358–368. [Google Scholar] [CrossRef] [PubMed]
- Du, S.; Wang, C.; Shen, J.; Wen, J.; Gao, J.; Wu, J.; Lin, W.; Xu, H. Mapping the capacity of concave green land in mitigating urban pluvial floods and its beneficiaries. Sustain. Cities Soc. 2019, 44, 774–782. [Google Scholar] [CrossRef]
- Doick, K.J.; Peace, A.; Hutchings, T.R. The role of one large greenspace in mitigating London’s nocturnal urban heat island. Sci. Total Environ. 2014, 493, 662–671. [Google Scholar] [CrossRef] [PubMed]
- Harrell, L.J.; Ranjithan, S.R. Detention Pond Design and Land Use Planning for Watershed Management. J. Water Resour. Plan. Manag. 2003, 129, 98–106. [Google Scholar] [CrossRef]
- Liaw, C.H.; Tsai, Y.L.; Cheng, M.S. Assessing flood mitigation alternatives in shijr area in metropolitan taipei1. Jawra J. Am. Water Resour. Assoc. 2010, 42, 311–322. [Google Scholar] [CrossRef]
- Zare, S.O.; Saghafian, B.; Shamsai, A. Multi-objective optimization for combined quality–quantity urban runoff control. Hydrol. Earth Syst. Sci. 2012, 16, 4531–4542. [Google Scholar] [CrossRef]
- Xu, T.; Jia, H.; Zheng, W.; Mao, X.; Xu, C. SWMM-based methodology for block-scale LID-BMPs planning based on site-scale multi-objective optimization: A case study in Tianjin. Front. Environ. Sci. Eng. 2017, 11, 1. [Google Scholar] [CrossRef]
- Xu, T.; Engel, B.A.; Shi, X.; Leng, L.; Jia, H.; Yu, S.L.; Liu, Y. Marginal-cost-based greedy strategy (MCGS): Fast and reliable optimization of low impact development (LID) layout. Sci. Total Environ. 2018, 640–641, 570–580. [Google Scholar] [CrossRef]
- Kaykhosravi, S.; Abogadil, K.; Khan, U.T.; Jadidi, M.A. The Low-Impact Development Demand Index: A New Approach to Identifying Locations for LID. Water 2019, 11, 2341. [Google Scholar] [CrossRef]
- Kuller, M.; Bach, P.M.; Roberts, S.; Browne, D.; Deletic, A. A planning-support tool for spatial suitability assessment of green urban stormwater infrastructure. Sci. Total. Environ. 2019, 686, 856–868. [Google Scholar] [CrossRef]
- Tommaso, P.; Simona, C.; Giulio, C.; Elena, B.; Matteo, P.; Tiziana, P.; Enrica, C. Planning Nature Based Solutions against urban pluvial flooding in heritage cities: A spatial multi criteria approach for the city of Florence (Italy). J. Hydrol. 2022, 41, 101081. [Google Scholar] [CrossRef]
- Deletic, A.; Orr, D.W. Pollution Buildup on Road Surfaces. J. Environ. Eng. 2005, 131, 49–59. [Google Scholar] [CrossRef]
- Perdikaki, K.; Mason, C.F. Impact of road runoff on receiving streams in eastern England. Water Res. 1999, 33, 1627–1633. [Google Scholar] [CrossRef]
- Li, J.; Li, H.E.; Dong, W.; Li, Y.; Qin, G. Estimation of non-point source pollution characteristics and loading in Xi’an urban areas. J. Hydroelectr. Eng. 2012, 31, 131–138. [Google Scholar]
- Chang, J.; Liu, M.; Xu, S.Y. Temporal-spatial distribution and first flush effect of urban stormwater runoff pollution in Shanghai City. Geogr. Res. 2006, 25, 9. [Google Scholar] [CrossRef]
- Birant, D.; Kut, A. ST-DBSCAN: An algorithm for clustering spatial–temporal data. Data Knowl. Eng. 2007, 60, 208–221. [Google Scholar] [CrossRef]
- Drapper, D.; Tomlinson, R.; Williams, P. Pollutant concentrations in road runoff: Southeast Queensland case study. J. Environ. Eng. 2000, 126, 313–320. [Google Scholar] [CrossRef]
- Mangani, G.; Berloni, A.; Bellucci, F.; Tatano, F.; Maione, M. Evaluation of the Pollutant Content in Road Runoff First Flush Waters. Water Air Soil Pollut. 2005, 160, 213–228. [Google Scholar] [CrossRef]
- Kang, J.H.; Kayhanian, M.; Stenstrom, M.K. Implications of a kinematic wave model for first flush treatment design. Water Res. 2006, 40, 3820–3830. [Google Scholar] [CrossRef]
- Fan, S.; Han, S. Testing Research on the Effects of Land Surface Slopes Upon Surface Runoff. Bull. Soil Water Conserv. 1991, 11, 5. [Google Scholar] [CrossRef]
- Ashraf, M.S.; Borah, D.K. Modeling pollutant transport in runoff and sediment. Trans. ASAE 1992, 35, 1789–1797. [Google Scholar] [CrossRef]
- Xu, B.; Yang, T.; Zou, S. Scale effect analysis of river network system simulation in arid area based on DEM—A case study of Qaidam basin basin. J. Lanzhou Univ. 2006, 1, 27–32. [Google Scholar] [CrossRef]
- Zhou, H.; Liu, J.; Gao, C.; Ou, S.F. Analysis of Current Situation and Problems of Urban Waterlogging Control in China. J. Catastrophol. 2018, 33, 147–151. [Google Scholar] [CrossRef]
- Lin, J.; Zhang, B.; Hai-Dong, L.I.; Yu-Min, W.U.; Zhuang, J.Y.; Zhang, J.C. The classification of watershed in Chunhua basin based on HEC-GeoHMS and DEM. J. Nanjing For. Univ. 2009, 33, 65–68. [Google Scholar]
- Lin, Q.; Lin, X.S.; Wang, K. Small watershed division in mountainous area based on DEM method: Taking Zhongxian County of Chongqing as an example. J. Chongqing Univ. Educ. 2015, 28, 160–163. [Google Scholar]
- O’Callaghan, J.F.; Mark, D.M. The extraction of drainage networks from digital elevation data. Comput. Vis. Graph. Image Process. 1984, 28, 323–344. [Google Scholar] [CrossRef]
- Jenks, G.F. The Data Model Concept in Statistical Mapping. Int. Yearb. Cartogr. 1967, 7, 186–190. [Google Scholar]
- Zhou, F.; Guo, H.; Liu, Y.; Luo, D. A new approach for water quality assessment based on multivariate statistical analysis and Radial Basis Function Neural Networks. Acta Sci. Circumstantiae 2007, 27, 846–853. [Google Scholar] [CrossRef]
- Kramer, M.; Terheiden, K.; Wieprecht, S. Safety criteria for the trafficability of inundated roads in urban floodings. Int. J. Disaster Risk Reduct. 2016, 17, 77–84. [Google Scholar] [CrossRef]
Publisher’s Note: MDPI stays neutral with regard to jurisdictional claims in published maps and institutional affiliations. |
© 2022 by the authors. Licensee MDPI, Basel, Switzerland. This article is an open access article distributed under the terms and conditions of the Creative Commons Attribution (CC BY) license (https://creativecommons.org/licenses/by/4.0/).