Abstract
In recent years, the frequency of flooding damage has increased owing to torrential rains caused by abnormal weather and rising sea levels, which can be attributed to global warming. In particular, in the case of low-tide rivers, when a high tide and critical rainfall occur simultaneously, the flood damage will increase due to the increased external water level. The establishment of a disaster prevention plan through a simulation of existing inequality streams may be suitable for general rivers; however, it is inadequate for considering the effects of tide changes over time, such as those in a reduced tide stream. Therefore, in this study, an optimal operation plan is formulated based on unsteady flow simulations in regions where a large number of hydraulic facilities are installed, and an optimal river management plan is derived for the flood season. For the Ara Waterway (Ara Stream) and Gulpo Stream managed by the Korea Water Resources Corporation, various hydraulic facilities (weir, inverted syphon, etc.) are operated in conjunction with the West Sea to mitigate the continuous flood damage. In that context, a West Sea drainage gate has been installed. Correspondingly, it is necessary to optimize the flood exclusion capacity by deriving an optimal operation plan because it directly affects the water level in hydraulic facilities such as the Right No. 1, Left No. 1, and flood gates, which are the most important drainage structures for the Gulpo Stream operation. Herein, through a trial-and-error method, an optimal operation plan is derived to reduce the flood frequency in the Ara Waterway and Gulpo Stream.
1. Research Background and Purpose
The aim of this study was to derive an optimal operation plan for rivers intertwined with complex water structures based on unsteady flow simulations of the Gulpo Stream basin. Note that the study target area experiences frequent flooding. In particular, as the flow in this river is directly influenced by the Han River, a tidal stream, considering an unsteady flow simulation is essential. The factors inducing flooding in this area can be outlined as follows.
1.1. Location and General Characteristics of the Han River Basin
Yellow rocks (such as tuff and rhyolite) formed owing to intrinsic activities are distributed in the high mountainous areas surrounding the basin of the Gulpo Stream [1]. Daebo granite is distributed at the foot of the mountain, and gneiss and schist are distributed in the hilly areas. Among these formations, tuff is generally poorly weathered. Moreover, urbanization is actively in progress in the Daebo granite area and is widely implemented at the foot of the mountain in the western part of the basin.
The riverbed slope of the Gulpo Stream is approximately 1/200 to 1/800 in the upstream section, and the middle and downstream sections have extremely gentle slopes at 1/5000 to 1/15,000 [1]. Agricultural land with an elevation (EL) of approximately 5.0 m is lower than the flood level of the main stream in the Han River during flooding. In addition, small rivers such as the Wontong and Cheongcheon Streams originating from Incheon City merge and flow northward in the Jung-dong area of Bucheon City. However, the width of the river suddenly narrows in Moksu, causing the flow from the upstream to slow down and accumulate (Figure 1).
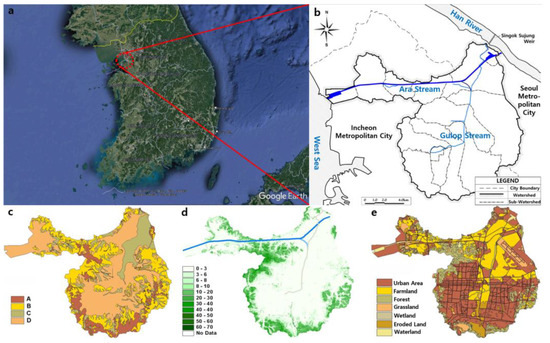
Figure 1.
Gulpo and Ara Stream Location (a,b), Soil Map SCS Classification (c), Slope Distribution (d), Land Use (e).
1.2. Installed Pump Capacity
Six 965 mm pumps were installed at the Singok pumping station in 1925 for the irrigation of the Gimpo plain and forced drainage of domestic water during floods [1]. In March 1973, the existing facilities were demolished, and five 2000 mm pumps were installed for pumping and drainage. The current exclusion capacity is 38 m3/s. The exclusion capacity of the temporary drainage pump station in the Gulpo Stream is 18 m3/s. Considering the planned flood volume (100 years frequency) of up to 1188 m3/s based on the Ara Stream junction after the renovation of the Gulpo Stream, the volume of 1132 m3/s cannot be excluded as the Han River flows through the pump station [2].
1.3. Urbanization of Watersheds
Owing to rapid urbanization in the middle and upper streams of the Gulpo Stream in the Gulpo Stream basin, the paved area of asphalt and concrete has widened significantly; this area can deteriorate the underground penetration capacity. The same is true for the erosion of surrounding agricultural land owing to the coverage of rivers in the middle and upper reaches and expansion of urban areas. As the Ara Stream Basin is geographically adjacent to Seoul City, it is sensitive to the intensity of urbanization, and consequently, the lowlands of rivers in this area where wetlands were formed in the past have now undergone rapid urbanization.
1.4. Influence of External Water Level of the Han River
The Gulpo Stream is directly affected by the water level of the main stream of the Han River because it connects to the left bank downstream of the Han River at a distance of 2.3 km downstream of the Haengju Bridge [1]. Most of the rivers flow in low-lying areas with extremely gentle slopes; therefore, when the water level in the main stream of the Han River rises, the floodgates are closed, and water drainage is only dependent on forced drainage pumps, thereby extending the flooding period [3].
Various studies on urban flood management have been undertaken. In Korea, Lee at el. developed an optimal model which would help to decide an adequate capacity and location according to the numbers of the facilities that need to be installed [4]. For this optimal technique, Harmony Search (HS) is utilized, and the SWMM is constructed accordingly for the better interpretation of the hydraulic and hydrological processes. Additionally, the sensitivity analysis was performed which was considered to determine the optimal positions of storages. The developed optimal model has been simulated, and it has determined the positions according to the different numbers of the facilities which need to be installed. In Shin et al. study, applicable LID techniques are analyzed and implemented using LID modules of the Storm Water Management Model (SWMM), which is the model for urban stormwater-runoff management in the project area [5]. The 1D and 2D hydraulic modeling with HEC-RAS has been done by Brunner et al. [6]. Later, Romali et al. presented the application of HEC-RAS model to the development of floodplain maps for an urban area in Segamat town in Malaysia [7]. Ewelina et al. analyze in-stream restoration structures impact on hydraulic condition and sedimentation in the Flinta river [8]. Effects of implementing LID practices are also assessed and reviewed. Another method for reducing urban flood was performed by Choo et al. [9]. This research models the effects of three flood reduction methods involving Oncheon River, Suyeong River, and the Hoedong Dam, which is situated on the Suyeong. Additionally, study on operating drainage pump stations considering downstream level to reduce urban river flood damage has been done [10].
Other operation plans for flood reducing has been carried out outside the country. Blazkova and Beven applied a continuous simulation approach to the estimation of flood frequency for a dam site in a large catchment (1186 km2) in the Czech Republic [11]. The models used allow for the simulation of both high intensity and low intensity rainfall events, and snowmelt events, over subcatchments in contributing to the flood frequency distribution. The methodology is implemented within a Generalised Likelihood Uncertainty Estimation framework and fuzzy rules method was used for assessing the risk of potential flood peak within a risk-based dam safety assessment. Jang researched on flood area, the duration of flooded and surcharged on the study area [12]. Without rainwater stored tank, the area of flooded and surcharged on reference area is similar to the area of reference region. However, with rainwater stored tank, the area of flooded and surcharged on reference area is much reduced compared to without rainwater stored tank. According to SWMM simulation results, the rainwater stored tank is located closer to site is more effective for the reduction in duration of flood and surcharged and flow rate.
Additionally, Chen et al. introduced a simplified urban stormwater inundation simulation model based on the SWMM and a geographic information system (GIS)-based diffusive overland-flow model [13]. Estimation of urban runoff peak and volume is a fundamental step in determining the transferring capacity of urban drainage systems. Rabori and Ghazavi studied on estimating urban flooding of a semi-arid area (Zanjan city in the northwest of Iran) was to present an application of the SWMM [14]. The performance of an urban drainage system in the study area was also investigated. According to the results, SWMM is an effective tool for urban flood estimation in a semi-arid area.
Studies about flood and overflow causing damage to structures along the rivers or dams due to various flow has been done. Karami et al. investigated the effect of transient flows caused by flood or gates operation on the bearing capacity of water tunnels [15]. Karakouzian et al. studied the impact of unsteady flows on concrete pipes and damages that occurred in pipes joints [16].
1.5. Purpose of the Study
The purpose of this study was to establish management regulations for the left-bank side of the Gulpo Stream facilities, right-bank side of the river, and connection between the drainage gates and the connected river Ara Stream to promote rapid and stable flood treatment at the Gulpo Stream.
2. Methodology
2.1. Selection of the Calculation Method
The unsteady flow analysis model considered in this study was the one-dimensional Hydrologic Engineering Center River Analysis System model, version 5.03. The HEC-RAS model can perform non-uniform and unsteady flow simulations. The method adopted to determine the water-surface curve for irregular water-surface profile was analyzed using an unsteady flow analysis; a total of three frequencies were analyzed. In particular, the planned frequencies of the Gulpo and Ara Streams are 30, 50, and 100 years, respectively. The one-dimensional model HEC-RAS (version 5.03) was used to analyze the unsteady flow, and the outline of the method adopted for calculating the unsteady flow in the HEC-RAS is as follows.
The unsteady flow model HEC-RAS analysis of the flow in the stream was interpreted by using continuous and Saint-Venant equations in the form of partial differential equations of the two physical laws governing the flow in the stream, i.e., the mass conservation law and momentum conservation law. The solutions to the continuous equation and momentum equation were obtained by applying the finite difference method (Preissmann’s weighted four-syllable method).
The continuity equation describes the law of mass conservation for a one-dimensional system, as follows:
In the above, denotes the river area, denotes the flow distance, denotes time, denotes the flow rate, denotes the storage volume, and denotes the side inflow per unit flow distance.
The momentum equation indicates that the rate of change in the momentum is equal to the external force acting on the system.
Here, denotes the depth, denotes the gravitational acceleration, denotes the friction slope, and denotes the water velocity.
Preissmann’s weighted four-point implicit scheme uses grid flow regions at regular intervals to evaluate the time and distance. It is constructed as a differential equation with variables in the current time zone and next time zone, which are then combined. The Newton–Raphson method of nonlinear differential equations differentiates between continuous equations and momentum equations.
2.2. Model Selection
The HEC-RAS model data established by the Gulpo Stream Master Plan [1] and Ara Stream Master Plan [2] were acquired and used to further reflect the specifications and operation plans of major structures such as sluice gates, weirs, and pump stations, which are not reflected in the existing river master plan.
The model provided in the river master plan is an unequal flow model, and the state of the flow does not change over time. When establishing the plan in this research, the water level change over time must be considered by linking the Ara and Gulpo Streams. Thus, a four-part model was obtained from each river master plan to construct a water level change review over time. Figure 2 presents the overall flow of this study.
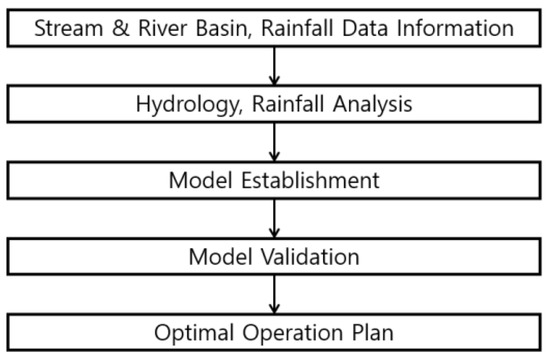
Figure 2.
Research Flowchart.
3. Analysis of the Study Target Area
3.1. Selection of the Research Target Area
The Gulpo Stream basin (including the Ara Stream) is a low-lying area with approximately 70% of the water level below EL 25 m, making natural drainage of water impossible when the water level of the main stream in the Han River rises. Thus, water drainage is primarily dependent on forced drainage by drainage pumps. Urban areas account for 52.2% of the total area of the basin, and forest land and agricultural land account for 12.8% and 21.6%, respectively. The average slope of the basin is 4.5°, indicating a gentle-slope basin, and the average elevation of the basin is EL 27.9 m. Several lowlands below EL 10 m are distributed downstream of the Gulpo Stream.
A total of 67% of the Ara Stream basin is a low-lying area below EL 30 m, and if the water level in the main stream rises, natural water drainage becomes impossible. Thus, water drainage in this area mainly depends on forced drainage by a drainage pump.
Urban areas occupy 49% of the total area of the Ara Stream basin, and forest and agricultural land occupy 23.5% and 14.6%, respectively. The average slope of the basin is 9.6%, and the average altitude of the basin is EL 35.1 m. Additionally, several lowlands below EL 10 m are distributed downstream of the Gulpo Stream.
3.2. Hydrological Analysis
Various types of water data such as precipitation, water level, flow rate, evaporation rate, wind, sediment discharge, and water quality are available; however, in this study, we focused on meteorological stations, rain, and water level stations (Figure 3).
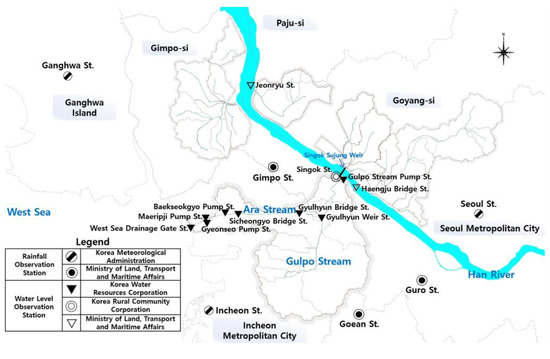
Figure 3.
Hydrological Observatory Locations.
3.2.1. Meteorological Observatory
Our investigations revealed that no meteorological observatory was located within the task basin. Accordingly, data were used from the Incheon and Seoul meteorological observatories located near the task basin.
3.2.2. Rainfall Observatory
Three jurisdictions of the Korea Meteorological Administration, three jurisdictions of the Ministry of Land, Infrastructure, and Transport, and one jurisdiction of the Korea Water Resources Corporation have been established and are operated. Recently, the Ministry of Public Administration and Security established blue-chip observation stations in each city, county, and township office to conduct disaster prevention operations. However, the observation year was short, and only major heavy rain events were investigated.
3.3. Establishment of External Tide Water Level Conditions
The wave velocity is important factor in flow model. To consider wave velocity to the unsteady flow model, the mean high water level of spring tide was applied. This is because the mean high water level of spring tide was used for design condition and operation rule for West Sea Drainage Gate. In this study, to ensure consistency with previous studies, the mean high water level of spring tide was selected as the estuary tide level. In addition, to estimate the tidal curves over time for calculating the unsteady flow, the average tidal change in a 12 h and 25 min period was applied to the cosine curve, i.e., the time interval to the next high rise from the west and south coast of Korea. The unsteady flow simulation was performed by delaying the estimated tidal curves by 1 h (Figure 4).
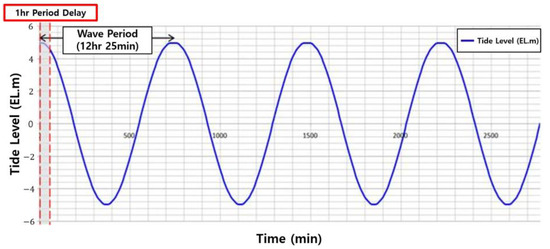
Figure 4.
External Tide Water Level Curve.
Figure 5 and Table 1 shows the sub-area locations and the input data of unsteady flow model. The CP0 is integrated with CP0 and GP1; GP2 is integrated with GP2 and GP3; GP4 is integrated with GP4, GP5, and GP6; GP7 is integrated with GP7, GP8. The West Sea drainage gate is located at AP0. The inverted syphon gate is located at AP4. The AP6 is just before connecting waterway, and GP2 is downstream of connecting waterway.
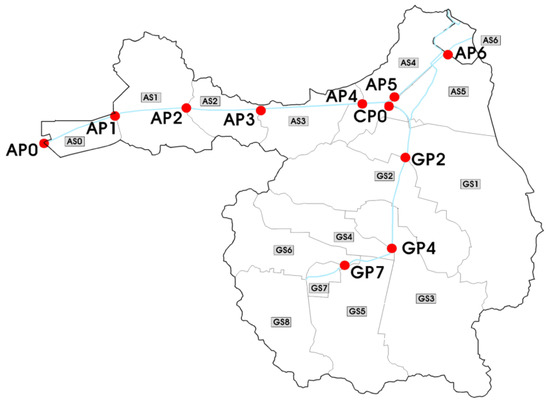
Figure 5.
Sub-watershed of Gulpo and Ara Stream.

Table 1.
Summary of Main Input Data.
4. Model Analysis
To derive an optimal operation plan for river facilities downstream of the Gulpo Stream, the main structures located in the Ara and Gulpo Streams needed to be reflected in the collected rainfall runoff model and simulated in HEC-RAS according to the operation plan of each structure. Therefore, the floodgates and drainage pump stations were reflected in the constructed model and simulated. The specifications and operation plans of the primary structures reflected in the constructed model are presented in Figure 6 and Table 2.
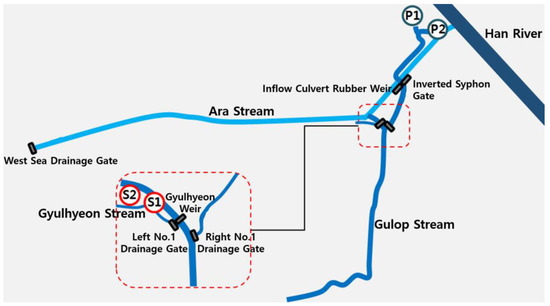
Figure 6.
Locations of Major Structures.
Table 2.
Structural Specifications and Operation Plans.
The specifications and operation plan of major structures such as floodgates, weirs, and pump stations that were not reflected in the river master plan were additionally reflected in this model. Previously, both rivers simulated independently were linked operated in this research. The model provided in the river master plan is a non-uniform flow model that does not change the state of flow over time. When establishing operation plan, it is necessary to consider the change in water level over time and build an unsteady model that can simulate the operation time of the flood control facility. Therefore, an unsteady model that can review the water level change over time for both rivers was constructed. Table 3 shows the summary comparison of original and proposed method.
Table 3.
Summary Comparison of Original and Proposed Method.
4.1. Model Establishment and Verification
The model was validated for both non-uniform flow and unsteady flow applied with actual rainfall event (5 July 2012 and 22 July 2017) which has caused damage to study area. For non-uniform flow, flood elevation data (from river master plan), water level, and flow velocity (from observatory) were checked. Additionally, for unsteady flow, water level, flow velocity was checked. In particular, the flow rate, flow velocity, and discharge at the part of Gyulhyun Weir passing to the connection channel passage were confirmed. The probability rainfall by duration was calculated by adopting the Huff distribution using a report from the Korea National Disaster and Safety Research Institute [17]. The probability rainfall for each duration and frequency is shown in Table 4. After the verification, model establishing and reviewing 1-5 rounds has been processed.
Table 4.
Probability Rainfall for Each Duration and Frequency.
4.1.1. Establishing and Reviewing Models between 1–5 Rounds
Round 1: Key contents of the 1st model review
- -
- The duration of the flood volume based on rivers needs to be same
- -
- The west sea tide level needs to be applied to the tide level curve
- -
- A section must be added to the downstream side of the West Sea drainage gate (model stabilization aspects)
- -
- A West Sea drainage gate must be used according to operation rules
- -
- The opening and closing speed of the floodgates is recommended to be 0.5 m/min
- -
- The volume up to the embankment of the Cheonbyeon Reservoir must be calculated
- ⇛
- Round 1 result: A comparative review between the master plan and unsteady flow flood level is required after supplementing the improvement points.
Round 2: Key contents of the 2nd model review
- -
- Modifying the location and elevation of the inlet
- -
- Reviewing the maximum water level occurrence point in the tide and Ara stream (1 h delay)
- -
- Comparison with the master plan after reviewing the starting point flood level
- -
- Deletion of unnecessary cross-section (model stabilization aspect)
- ⇛
- Round 2 result: The duration of rainfall applied to the flood calculation is 7 h for the Gulpo Stream and 8 h for the Ara Stream.
Round 3: Key contents of the 3rd model review
- -
- Modification of flow divergence at the Gulpo estuary
- -
- Choose as a basic model after supplementing the problem
- ⇛
- Round 3 result: The inflow to the estuary of Gulpo Stream is different from the input value, so the structure operation plan needs to be reviewed after modification.
Round 4: Key contents of the 4th model review
- -
- Comparison of the water level with the master plan of the river
- -
- The Right No. 1 drainage gate must be used as per operation rules.
- -
- Simulations of reservoirs with stage-storage curves based on the elevation of agricultural land in the southern and northern watersheds of the relocating channel
- -
- Review of submersible water gates at EL 4.5, 5.0, and 5.5 m, and right eye drainage gates at EL 4.7, 5.0, and 5.5 m
- ⇛
- Round 4 result: Nine operational plans are designed based on the current model, along with nine operational plans based on the agricultural land storage effect model.
Round 5: 5th model (basic model properties)
- -
- Minimization of errors in the model
- -
- Combined review of the operation plans for the structure(s)
- -
- Development of a study model for the flood level in the Gulpo Stream
4.1.2. Study on the Effect of Storage of Agricultural Land
To examine the operational plans of the major structures in the selected basic model, a model review was conducted while considering the flooding of agricultural land sections in the southern and northern basins.
In addition, the flooding allowance sections of the southern and northern basins were considered equally in the Gulpo Stream Master Plan, and the flooding capacity was calculated in this study as the storage of the same basin.
The stage-storage curve of the flooding allowable section was applied to the model by classifying the numerical elevation model of the basin and agricultural land section for land use, followed by a calculation up to EL 7.0 m equivalent to the embankment of the basin.
Under the above conditions, the farmland storage effect was reflected in the unsteady flow HEC-RAS model, the characteristics of the major flood sections were analyzed, and a final operation plan review model was adopted based on the final model considered to closely resemble the actual conditions during flooding.
4.1.3. Establishment Status of the Final Review Model
To review the operation plan, the characteristics of each major point in the finally selected unsteady flow HEC-RAS model and those of the structure operation plan were summarized through the above-described construction model review.
The particular focus of the model construction was to designate a hydrologic operation type so that each drainage gate and weir could be operated as precisely as possible when constructing the model. A total of two hydrologic operation types were applied in the final model, as follows.
- -
- Elevation-controlled gates: These gates were operated when the water level at a specific point (one point) reached an operating condition level.
- -
- Rule-based gates: These water gates were operated sequentially under specific conditions (specific water level, specific time, etc.).
The actual operation plan of the pump station was applied. The other structures reflected the specifications of the structure in the model without any changes and were constructed to allow the flow of water according to the change in the water level (Figure 7).
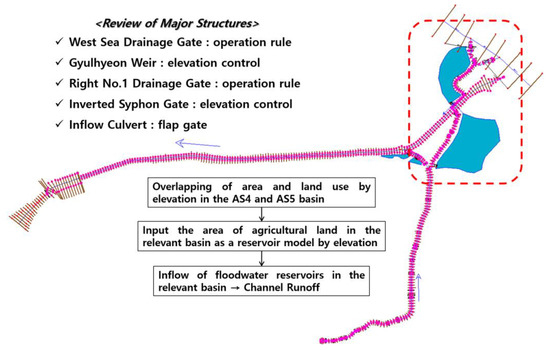
Figure 7.
Final Model Selection.
5. Optimal Operation Plan
An additional plan review was conducted to establish an operation plan for a structure for which an operation plan was not specified and to lower the water level in the case of a flood. Regarding the frequency of the review, a planned frequency of 100 years was reviewed first, along with frequencies of 30 and 50 years.
To select a review case for each facility, nine review cases were adopted within an EL range of 4.5–5.5 m, based on the operation level of the Right No. 1 and submersible gates of the tangerine prefectural opening level at EL 4.70 m. In addition, the prerequisites for the operation of the Right No. 1 drainage gate were considered as the conditions for operation when the water level continued to rise after the opening of the Gyulhyun Weir. The basic direction of the operation plan is summarized in Table 5.
Table 5.
Operation Plan Setting Proposal.
5.1. Operation Plan of the Right No. 1 Drainage Gate and Inverted Syphon Gate
The overall review direction reflected the drainage system of the Gyulhyun Stream during flooding, and the review was conducted while focusing on the Right No. 1 drainage gate and inverted syphon gate, i.e., locations where an operating system was not established. When reviewing the operation plan, nine cases were selected and reviewed based on the above set of basic directions (Figure 8).
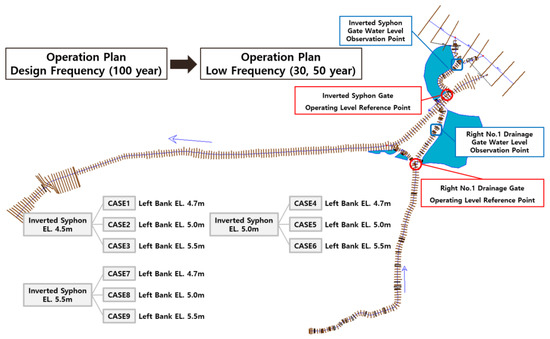
Figure 8.
Review Model Target Level Observation Point.
The water level was reviewed from the upstream (5 + 788) section of the Right No. 1 drainage gate water level impact section to the inverted syphon gate (3 + 293) section, and the water level impact section of the inverted syphon gate was reviewed from the upstream section (0251) of the inverted syphon gate.
After reviewing the level at each condition, the level considered to be the most stable target level in the two gates (Right No. 1 drainage gate and inverted syphon gate) was adopted as the final operation plan. Details regarding the target level are summarized as follows. Figure 9 and Table 6 shows frequencies of 30-, 50-, and 100-year results.
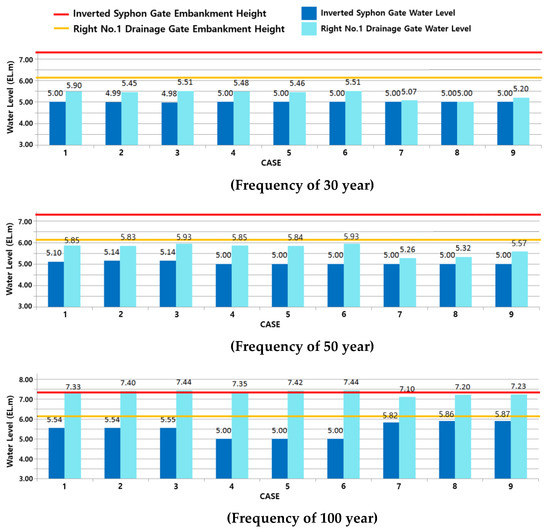
Figure 9.
CASE 1-9 and Water Level Results of 30-, 50-, and 100-Year Frequency.
Table 6.
Summary of Water Level for 30-, 50-, and 100-Year Frequency (EL.m).
As a result of the water level review derived according to the conditions, when CASE 1 to CASE 3 were divided into the A group, CASE 4 to 6 into the B group, and CASE 7 to 9 into the C group, the observed level of the inverted syphon gate was B group < A group < C group, and the observed level of the Right No. 1 drainage gate was similar to that of the C group. Comparing the water level differences between the comparison targets, Group B, with the lowest water level observation group for the inverted syphon gate, was at EL 5.00 m (CASE 4, 5, 6); the highest water level observation group was at EL 5.82 m (CASE 7); and the highest number of observations for the Right No. 1 drainage gate was at 7 m (CASE 7).
According to the above water level review, Group B was considered as the most advantageous group for the inverted syphon gate, and Group C was considered as the most advantageous group for the Right No. 1 drainage gate. Group C was considered as the least stable for inverted syphon gate.
Table 7 shows the review of water level results and adoption of operation plan. As a result, B Group shows the most stable water level in the inverted syphon and right No. 1 water level influencing section. Among B Group, CASE 4, which has the lowest water level at Right No. 1 drainage gate was adopted as the final operation plan. The comparison of original and proposed method is shown in Table 8. The result show that approximately average of 0.3 m flood water level has been reduced compared to the original method. However, some sections such as connecting waterway (CP0) showed flood water level higher.
Table 7.
Review of Water Level and Operation Plan Result.
Table 8.
Flood Water Level Comparison (100 Year Frequency).
5.2. Operation Plan of the Left No. 1 Drainage Gate
Based on our discussion regarding “Round 5,” a quantitative review was not conducted for the Left No. 1 drainage gate. However, the river status was reviewed according to the “Master Plan for 9 Rivers, including the Geomdan Stream” [18].
Subsequently, in connection with the operation plan of the facility located in the Gulpo Stream (Right No. 1 drainage gate, inverted syphon gate) derived through the quantitative analysis, a level that could be operated as smoothly as possible was adopted.
As a result of the quantitative analysis, the operating level of the Right No. 1 drainage gate was adopted as EL 4.70 m, and the operating level of the submersion gate of the subject water observation point in the figure review model was adopted as EL 5.00 m. The scope of the Left No. 1 drainage gate was selected according to “Round 5.” In addition, the same prerequisite considered for the Right No. 1 drainage gate, which stated that the Gyulhyun Weir opening should be preceded, was adopted for the Left No. 1 drainage gate.
In addition, the Gyulhyun Stream was included in the Gulpo Stream basin; therefore, the flow rate of the Gyulhyun Stream was generally excluded; however, it could vary depending on the rainfall pattern. As such, the primary purpose of operating the Left No. 1 drainage gate was to manage the Gulpo Stream without affecting the Gyulhyun Stream. The operation level of the Left No. 1 drainage gate was adopted by conducting the above reviews.
The scope of the Right No. 1 drainage gate is EL 4.00–5.35 m. The final operating water level was adopted from the operation level of the Left No. 1 drainage gate which is the same as or higher than EL 4.70 m, and it must be closed before it reaches Gyulhyun bridge EL 5.35 m. Therefore, EL 5.00 m, the water level that can prevent bridge flooding, was adopted as the final operating water level.
5.3. Optimal Operation of Hydraulic Facilities
For the efficient operation of river facilities located in the Ara and Gulpo Streams in the event of flooding, operation plans were derived for the Right No. 1 drainage gate and inverted syphon gate, which were previously undefined. The operation regulations for three river facilities located in each river were included, as follows (Table 9, Table 10 and Table 11).
Table 9.
Right No. 1 Drainage Gate Operation Rule.
Table 10.
Left No. 1 Drainage Gate Operation Rule.
Table 11.
Inverted Syphon Gate Operation Rule.
<Operation Plan of the Right No. 1 Drainage Gate>
◈ Purpose
The Right No. 1 drainage gate is normally kept open to maintain the Gulpo Stream joining the Han River and to prevent flood damage to the upper region of the Right No. 1 drainage gate (with the inverted syphon closing the flood gate in case of a flood).
◈ Operation Method
After the opening of the Gyulhyun Weir, the drainage gate is closed when the flood volume increases, and the upstream water level of the Gyulhyun Weir rises; the drainage gate is opened in consideration of the inverted syphon and Gyulhyun Weir upstream water levels.
◈ Exceptional Provisions
If the downstream water level of the Right No. 1 drainage gate is higher than the upstream water level of the Gyulhyun Weir during flood control, the drainage gate can be opened to prevent flooding in the lowlands.
<Operation Plan of Left No. 1 Drainage Gate>
◈ Purpose
The Left No. 1 drainage gate is normally kept open to maintain the Gyulhyun Stream joining the Gulpo Stream; however, the gate is closed to prevent flood damage to the Gyulhyun Stream section.
◈ Operation Method
After the Gyulhyun Weir is opened, the drainage gate is closed when the upstream water level of the Gyulhyun Weir increases and reaches a certain level, and the drainage gate is opened when the level of the Left No. 1 drainage gate is higher than the Gyulhyun Weir level.
The Gyulhyun Bridge, located near the Left No. 1 drainage gate, is at EL 5.35 m (below the planned flood level of EL. 6.96 m), but its elevation cannot be improved owing to problems such as the incorporation of farmland; hence, it is specified in the Gyulhyun Stream River Master Plan.
<Operation Plan of the Inverted Syphon Gate>
◈ Purpose
The inverted syphon gate is normally kept open to maintain the Gulpo Stream joining the Han River and to prevent flood damage to the inverted syphon section downstream of the Singok pump station in case of flooding.
◈ Operation method
The gate is normally opened or closed according to the level of the gate operation standard in the case of a flood.
6. Conclusions
To establish regulations on the management of river facilities downstream of the Gulpo Stream, a basic survey and field survey were conducted on the Right No. 1 drainage gate, Left No. 1 drainage gate, and inverted syphon gate, which lack previously established operating standards. Based on the investigated data, a case-by-case scenario unsteady flow model using HEC-RAS was constructed and simulated to formulate a management plan for river facilities during the planned frequency (100-year frequency) of rainfall.
To maintain consistency with the basic river plan when establishing the operation plan, consultations were conducted through workshops with the implementer of the basic river plan. The review conditions were different, but the contents of the river operation did not conflict.
Through a total of five model review meetings, a model was ultimately adopted considering the effect of agricultural land in the southern and northern basins and was judged to reflect the actual reservoir conditions of the basin during floods.
The final operation plan of CASE 4 was adopted and was deemed capable of guiding the operation of the Right No. 1 drainage gate, Left No. 1 drainage gate, and inverted syphon gate according to the actual water level situation.
- -
- The Gyulhyun weir is open at EL 4.70 m.
- -
- If the water level continues to rise after the opening of the Gyulhyun weir, the Right No. 1 drainage gate is closed at EL 4.70 m.
- -
- The inverted syphon gate is closed at EL 5.00 m.
Compared to original method, proposed method showed flood water level about 0.3 m in Ara stream and about 0.2 m in Gulpo stream reduced. This is because original method is based on non-uniform flow. The calculation of flood discharge in original method based on cumulative watershed while proposed method calculates each sub-watershed flood discharge. The connecting waterway however, showed higher flood water level. This is due to the data original method used. It did not consider some parts (starting from inverted syphon, about 300 m) resulting assumption of water level in certain points. This is why this paper suggest to integrated information and treat as one model.
This study is expected to help prioritize structural measures to reduce flood damage, develop guidelines for structural measures, and establish institutional grounds for hydraulic facilities from torrential rains. However, as a limitation of this study, the rainfall distribution effects greatly on the results. Future research will examine various rainfall distribution effects on hydraulic facilities.
Author Contributions
Y.-M.C. and J.-G.K. conceptualized the research. Y.-M.C. and J.-G.K. carried out the investigation. Y.-M.C., W.-S.P. and J.-G.K. wrote the manuscript. Y.-M.C. and J.-G.K. conceived the methodology of the proposed method. All authors have read and agreed to the published version of the manuscript.
Funding
This research was funded by the Brain Korea 21 FOUR Project in the Education & Research Center for Infrastructure of Smart Ocean City (i-SOC Center).
Institutional Review Board Statement
Not applicable.
Informed Consent Statement
Not applicable.
Data Availability Statement
Not applicable.
Acknowledgments
This research was supported by the Brain Korea 21 FOUR Project in the Education & Research Center for Infrastructure of Smart Ocean City (i-SOC Center).
Conflicts of Interest
The authors declare no conflict of interest.
References
- Ministry of Land, Transport and Maritime Affairs. Gulpo Stream Master Plan; Ministry of Land, Transport and Maritime Affairs: Sejong City, Korea, 2018. [Google Scholar]
- Ministry of Land, Transport and Maritime Affairs. Ara Stream Master Plan; Ministry of Land, Transport and Maritime Affairs: Sejong City, Korea, 2011. [Google Scholar]
- CPC Press. Open Channel Hydraulics, River Hydraulic Structures and Fluvial Geomorphology; Radecki-Pawlik, A., Pagliara, S., Hradecky, J., Hendrickson, E., Eds.; CPC Press: Boca Ration, FL, USA, 2017. [Google Scholar] [CrossRef]
- Lee, J.H.; Song, Y.H.; Jo, D.J. Determination of optimal locations of urban subsurface storage considering SWMM parameter sensitivity. J. Korean Soc. Hazard Mitig. 2013, 13, 295–301. [Google Scholar] [CrossRef][Green Version]
- Shin, D.S.; Park, J.B.; Kang, D.K.; Jo, D.J. An analysis of runoff mitigation effect using SWMM-LID model for frequently inundated basin. J. Korean Soc. Hazard Mitig. 2013, 13, 303–309. [Google Scholar] [CrossRef][Green Version]
- Brunner, G.W.; Piper, S.S.; Jensen, M.R.; Chacon, B. Combined 1D and 2D hydraulic modeling within HEC-RAS. In Proceedings of the 2015 World Environmental and Water Resources Congress, Austin, TX, USA, 17–21 May 2015; pp. 1432–1443. [Google Scholar] [CrossRef]
- Romali, N.S.; Yusop, Z.; Ismail, A.Z. Application of HEC-RAS and Arc GIS for floodplain mapping in Segamat town, Malaysia. GEOMATE J. 2018, 15, 7–13. [Google Scholar] [CrossRef]
- Ewelina, S.; Ewelina, S.; Tomasz, D.; Tomasz, K.; Albert, M.; Artur, R.P. Analysis of In-Stream Restoration Structures Impact on Hydraulic Condition and Sedimentation in the Flinta River, Poland. J. Earth Environ. Sci. 2019, 14, 275–286. [Google Scholar] [CrossRef]
- Choo, Y.M.; Sim, S.B.; Choe, Y.W. A study on urban inundation using SWMM in Busan, Korea, using existing dams and artificial underground waterways. Water 2021, 13, 1708. [Google Scholar] [CrossRef]
- Choo, Y.M.; Kim, J.G.; Park, S.H.; Choo, T.H.; Choe, Y.W. Method for operating drainage pump stations considering downstream water level and reduction in urban river flooding. Water 2021, 13, 2741. [Google Scholar] [CrossRef]
- Sarka, B.; Beven, K. Flood frequency estimation by continuous simulation of subcatchment rainfalls and discharges with the aim of improving dam safety assessment in a large basin in the Czech Republic. J. Hydrol. 2004, 292, 153–172. [Google Scholar] [CrossRef]
- Jang, S.J. A study on the proper size of rainwater stored tank in submerged districts using SWMM program. J. Korean Hous. Assoc. 2009, 20, 69–76. Available online: https://koreascience.kr/article/JAKO200925265918954.page (accessed on 1 April 2022).
- Chen, W.; Huang, G.; Zhang, H. Urban stormwater inundation simulation based on SWMM and diffusive overland-flow model. Water Sci. Technol. 2017, 76, 3392–3403. [Google Scholar] [CrossRef] [PubMed]
- Rabori, A.M.; Ghazavi, R. Urban flood estimation and evaluation of the performance of an urban drainage system in a semi-arid urban area using SWMM. Water Environ. Res. 2018, 90, 2075–2082. [Google Scholar] [CrossRef] [PubMed]
- Karami, M.; Kabiri-Samani, A.; Nazari-Sharabian, M.; Karakouzian, M. Investigating the effects of transient flow in concrete-lined pressure tunnels, and developing a new analytical formula for pressure wave velocity. Tunn. Undergr. Space Technol. 2018, 91, 102992. [Google Scholar] [CrossRef]
- Karakouzian, M.; Karami, M.; Nazari-Sharabian, M.; Ahmad, S. Flow-induced stresses and displacements in jointed concrete pipes installed by pipe jacking method. Fluids 2018, 4, 34. [Google Scholar] [CrossRef]
- National Disaster Management Institute. A Study on the Estimation of Probability Rainfall for Improving Regional Disaster Prevention Performance Objectives; National Disaster Management Institute: Ulsan, Korea, 2021. [Google Scholar]
- Incheon Metropolitan City. Master Plan for 9 Rivers, including the Geomdan Stream; Incheon Metropolitan City: Incheon, Korea, 2018. [Google Scholar]


Publisher’s Note: MDPI stays neutral with regard to jurisdictional claims in published maps and institutional affiliations. |
© 2022 by the authors. Licensee MDPI, Basel, Switzerland. This article is an open access article distributed under the terms and conditions of the Creative Commons Attribution (CC BY) license (https://creativecommons.org/licenses/by/4.0/).