Article

Adsorptive Removal of Methylene Blue Dye Using Biodegradable Superabsorbent Hydrogel Polymer Composite Incorporated with Activated Charcoal

by
Syed Sikandar Shah
1,*,
Bruno Ramos
1,2 and
Antonio Carlos Silva Costa Teixeira
1,*
1
Research Group in Advanced Oxidation Processes, Department of Chemical Engineering, Escola Politécnica, University of São Paulo, São Paulo 05508-010, Brazil
2
Department of Metallurgical and Materials Engineering, Escola Politécnica, University of São Paulo, São Paulo 05508-030, Brazil
*
Authors to whom correspondence should be addressed.
Water 2022, 14(20), 3313; https://doi.org/10.3390/w14203313
Submission received: 19 September 2022 / Revised: 11 October 2022 / Accepted: 15 October 2022 / Published: 20 October 2022
(This article belongs to the Special Issue Research on Micropollutants in Urban Water)

Abstract

:
Hydrogels have attracted great attention as good adsorbents due to their extraordinary water retention capacity, unique hydrophilic nature, biocompatibility, and abundance in availability. In this work, a superabsorbent polymer (SAP) hydrogel and its composite were synthesized, with the introduction of activated charcoal (SAP-AC) for deep removal of the ecotoxic organic dye methylene blue (MB). The formation of the hydrogel was confirmed by FTIR analysis, and scanning electron microscopy (SEM) revealed the appearance of a porous microstructure due to the incorporation of AC. A continuous upflow column was set up, and the adsorption parameters were optimized using an experimental Doehlert uniform array design. The residual concentration of MB was analyzed by UV-Vis spectrophotometry at 665 nm (λmax). The experimental data were also discussed in terms of adsorption kinetics and adsorption isotherm models. Accordingly, MB adsorption followed pseudo second-order kinetics and better fits the Freundlich isotherm, suggesting a chemisorption mechanism and a multilayer MB adsorption system. The maximum adsorption capacity was 202.84 mg g−1 (96.96%) using the SAP and 213.2 mg g−1 (99.48%) using the SAP-AC. The present study proved that the synthesized composite hydrogel has good activity and selectivity for deep removal of the MB dye and can be effectively used in wastewater treatment.

1. Introduction

At the present time, the clean and healthy water shortage has turned out to be a global challenge. As a result of extensive industrialization and urbanization, clean water resources are continually endangered. The water crisis is not restricted to available water resources, but, currently, it is more associated with the low quality of water as a result of toxic pollution and human interference in the water cycle and nature. Untreated effluents from mining, crops, food, textile, paper, leather, paint, and dyes industries are polluting water bodies with toxic pollutants such as metals, dyes, surfactants, pesticides, etc. [1,2,3,4,5]. Currently, numerous types of freshwater pollutants exist such as physical, chemical, organic, inorganic, biological, and radiological contaminants [2]. Two of the most toxic and environmentally detrimental pollutants are dyes and trace metals. They can adversely affect humans and animals and should be properly addressed [6,7].
Synthetic dyes are widely used as additives to improve the appearance of countless consumer goods to encourage their consumption, for example, in processed foods [8]. Those dyes are not completely bonded to the materials they modify, so they are released into the environment, causing serious environmental issues [9,10]. The contamination of water bodies is caused by both cationic and anionic dyes, making their removal very challenging. Even at very low concentrations, their presence can contaminate large water bodies, aesthetically disturbing them, as well as reducing sunlight penetration and, consequently, photosynthesis. Methylene blue (MB) is widely used, and, currently, it is considered the most common and hazardous dye [11]. Methylene blue (MB) is a cationic thiazine dye commonly applied in textile industries to color fabrics such as cotton, wool, silk, etc. [12]. Generally, it is a non-biodegradable, stable, high-water-soluble, and carcinogenic dye which is threatening aquatic life and also human health [13,14]. The noxious levels of MB cause a metabolic disturbance in microalgae and decrease water oxygenation caused by the photosynthesis inhibition which can result in instability and eutrophication of the aquatic ecosystem [15]. In humans, such dyes and their degradation products can cause allergy, dermatitis, skin rash, respiratory and eye irritation, sore throat, asthma, cancer, and mutations, etc. [16,17,18,19,20]. Therefore, there is considerable environmental concern regarding the treatment of effluents contaminated with such dyes.
Several techniques such as precipitation, coagulation, photodegradation, membrane filtration, and adsorption, etc., have been applied for the removal of dyes and heavy metals from impacted wastewater and soils, respectively, amongst which adsorption is considered to have significant potential, be more viable, and be advantageous because of ease and simplicity, great efficiency, cost-effectiveness, and probability of materials’ recycling [7,21,22,23,24,25,26,27].
Hydrogels are a kind of cross-linked polymeric network with high water-absorbing and water-retaining capacity. They are considered superabsorbents when their water retaining capability is stretched to several hundreds of their original weight. This property can be determined by their three-dimensional structure and the extent of free hydrophilic polymers. Superabsorbent polymers (SAPs) have three-dimensional networks that can absorb and retain tremendous amounts of water.
Sodium alginate (SA) is a nontoxic biopolymer rich in hydroxyl and carboxyl groups. SA can be polymerized with monomers such as acrylic acid (AA) and acrylamide (AM), which have extraordinary thermal and mechanical properties, and also a higher swelling capacity compared to natural polymers [28]. In this context, the current study aimed to tailor the biodegradable superabsorbent hydrogel polymer with the incorporation of activated charcoal for maximum MB adsorption in a continuous column reactor and subsequently reuse the spent hydrogel for consecutive adsorption cycles.

2. Materials and Methods

2.1. Chemicals and Materials

Sodium alginate (SA) (C6H9NaO7) from brown algae as an alginic acid sodium salt with a molar weight of 216.12 g mol−1 and viscosity of 15–20 cP was purchased from Sigma Aldrich. The acrylic acid (AA, 99%) monomer (Sigma Aldrich, St. Louis, MO, USA) was used without further purification. Free radical initiator potassium persulfate (KPS), 99% from Merck, the crosslinker −N, N-methylenebisacrylamide (MBA), 99% purity, powdered activated charcoal (AC), and cationic dye methylene blue (MB) were purchased from Sigma Aldrich and were used without further purification. All dye solutions were obtained using pure water (18.2 MΩ cm) from a Milli-Q Direct-Q system (Merck Millipore, Darmstadt, HE, Germany).

2.2. Acrylic Acid Neutralization

To achieve a 70% neutralized acrylic acid (AA) monomer, pure AA monomer (50 mL) was poured into a 200 mL beaker immersed in an ice-water bath. About 35 mL of 20% NaOH solution were added dropwise under constant stirring. The reaction is exothermic, and AA neutralization was performed under a low temperature to avoid self-polymerization [29].

2.3. Adsorbent Preparation

For the SAP preparation, SA (3 g) was gradually dissolved in 120 mL of deionized water under constant stirring. After complete dissolution, it was poured into a jacketed four-necked flask equipped with a mechanical stirrer, a thermometer, a reflux condenser, and N2 line. The mixture was churned for 30 min, and the temperature was slowly raised to 60 °C. After being purged with N2 flushing to remove dissolved oxygen, 1.5 wt% of the initiator KPS dissolved in water (10 mL) was introduced into the sticky solution to generate alginate free radicals, and the mixture was stirred for another 30 min. In a 250 mL beaker, about 45 mL of AA (70% neutralized) were dissolved in 100 mL of water and slowly added to the flask under N2 flushing. After 5 min, the cross-linker MBA (0.5 wt%), previously dissolved in 20 mL deionized water, was charged dropwise to the flask. The temperature was raised to 70 °C and kept at this condition for 3 h to complete the polymerization reaction. The resulting product was cooled, washed with deionized water to remove unreacted species, and poured into a Petri dish for complete dryness in an oven at 70 °C. The dried SAP material was cut into small pieces to be further used for the swelling and adsorption experiments.
For the preparation of the SAP-AC, two different synthesis routes were adopted, i.e., solution mixing and infiltration of the polymer [30]. In solution mixing, the AC powder (2 wt%) in 10 mL DI water was sonicated for half an hour and was dispersed into the alginate monomer followed by the polymerization process as mentioned above. For the infiltration of the polymer, the sonicated AC mixture was poured into the flask right after the addition of the cross-linker MBA.

2.4. Water Retention Capacity

A known amount of the dried composite hydrogel was immersed in a beaker containing 300 mL of pure water at 21 ± 2 °C. The weight of the swollen hydrogel was observed at definite time intervals until it attained a constant value. The swollen hydrogel was removed through filtration using a plastic strainer, and the excess water on the hydrogel surface was wiped with a paper towel. Subsequently, the hydrogel was weighed (W) using a digital balance, and the swelling capacity (Sg/g) was calculated using the following relation:
S g / g = W d     W s W d
where Wd is the weight of the dry composite, and Ws is the weight of hydrogel in the swollen state after being dipped in water for 24 h.

2.5. Column Adsorption Studies

The experiments were performed using 70 mg of the SAP or SAP-AC contained in an upflow column (6 cm diameter and 30 cm height). The column was connected to a reservoir, and a peristaltic pump was used to recirculate 300 mL of the MB solution (initial concentration of 50 ppm) at a flow rate of 28 mL min−1 for recirculating the batch mode operation. The column and the reservoir were covered with aluminum foil to prevent exposure to light. Adsorption parameters were optimized by an experimental Doehlert uniform array design for k  =  2 variables (temperature, pH), using the response surface methodology (RSM), aiming for the maximum removal of the contaminants [31]. Table 1 shows the Doehlert design for two factors with the coded values and their responses. The analysis of the designs was carried out using a statistical software package (Statistica 14.0.1, Tibco Software Inc., Palo Alto, CA, USA).
To find the real experimental values using the coded values, the following equation was used:
V i = A i × ( X i + M i )
where Vi is the experimental value; Ai is the average sum value, i.e., [(max + min)/2]; Xi is the coded value; and Mi is the average subtraction value, i.e., [max − min)/2], respectively.
A small aliquot of the liquid (5 mL) was drawn at specific times and was analyzed for the residual MB concentration using a UV-Visible spectrophotometer at 665 nm. After reaching equilibrium (24 h), the reaction was stopped, and the polymer hydrogel was drawn from the column and weighed to determine its swelling efficiency under specific experimental conditions. The concentration of the adsorbed MB per unit mass of the adsorbent at equilibrium (qe, mg g−1) and percent adsorption removal (R%) were calculated using Equations (3) and (4), respectively:
q e = ( C o C e ) V w  
R % = ( C o C e ) C e × 100
where Co and Ce are the initial and equilibrium concentrations of the adsorbate (mg L−1); V is the volume of the solution (L); and w is the weight of the adsorbent (g) [32].

3. Results and Discussion

3.1. Swelling Capacity

The freshly prepared dried SAP hydrogel and the swollen hydrogel are depicted in Figure 1. The SAP showed a water retention capacity of 573.8 g g−1 after 24 h at room temperature.
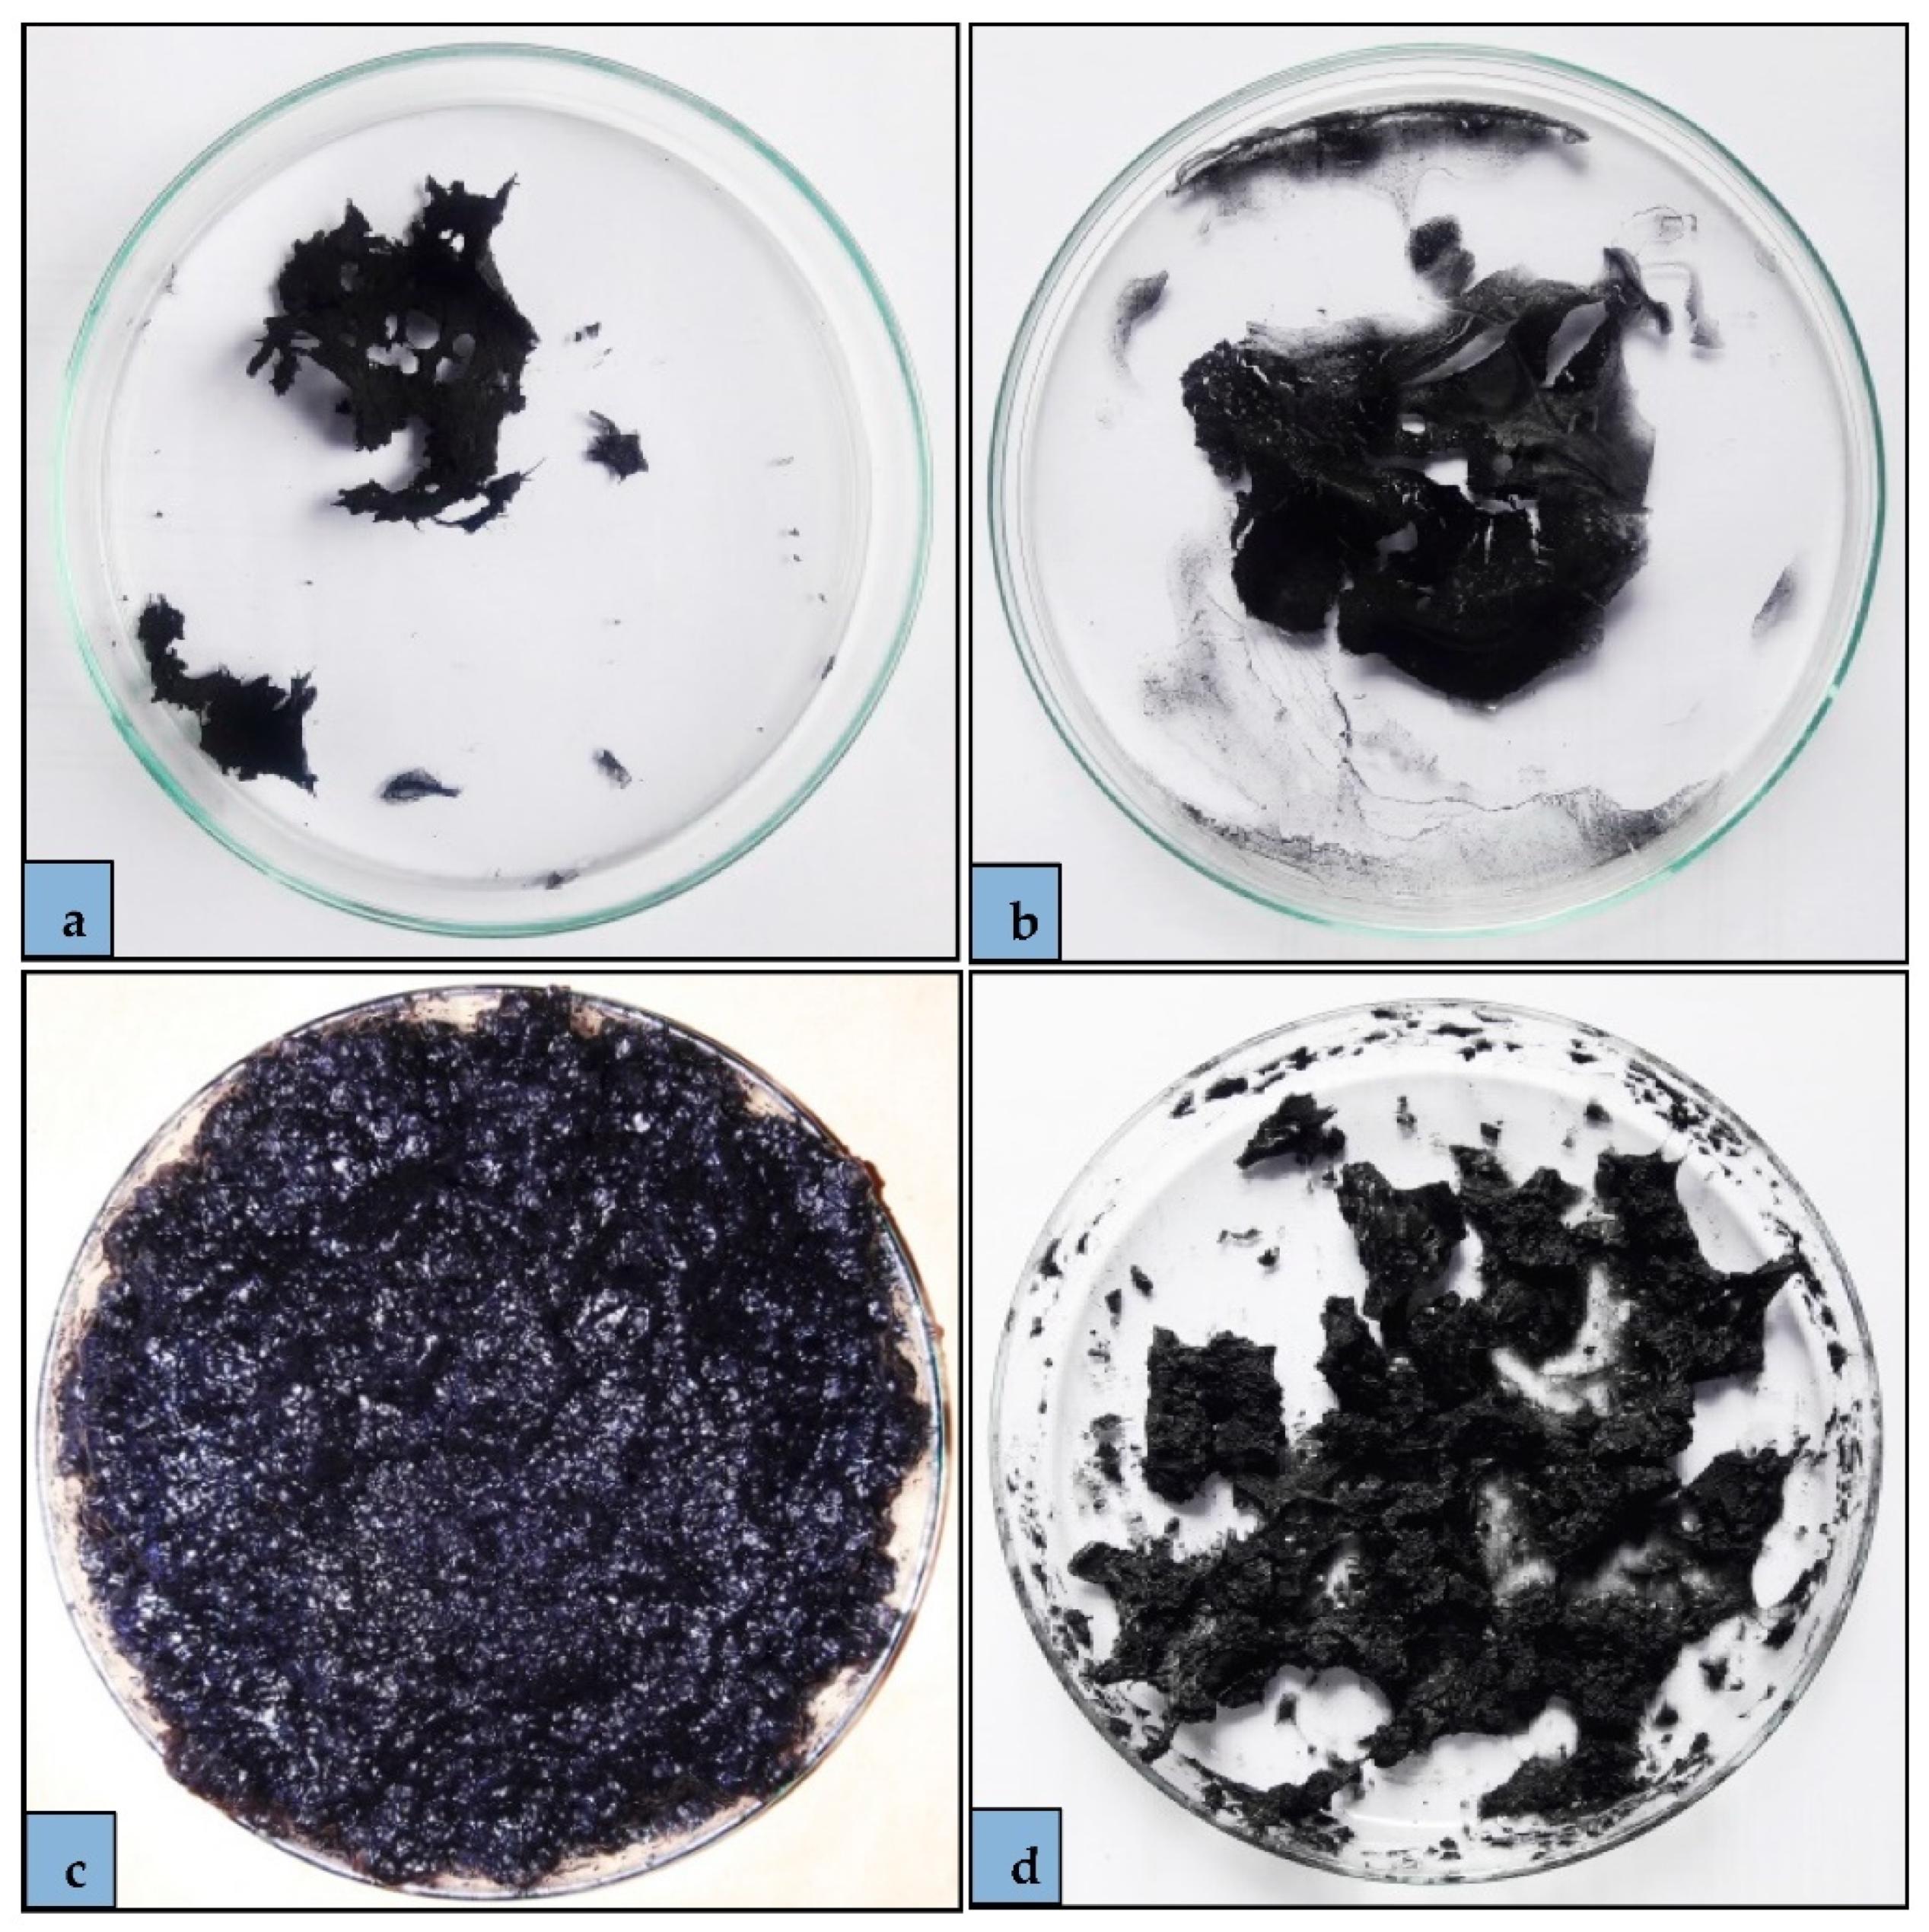
The AC loading capacity varied between 2 and 5 wt%, and, when AC was dispersed into the alginate monomer (solution mixing route), the desired polymerization did not occur, and no hydrogel formation was observed as shown in Figure 2a,b. Thus, in this study, the infiltration route was adopted for the preparation of the AC composite hydrogel. Moreover, increasing the loading percentage (˃2 wt%) also hindered the polymerization process, and the swelling capacity of the prepared hydrogel composite was diminished drastically. Thus, the loading percentage of AC was only limited to 2 wt%. Figure 2c,d show the synthesized composite SAPs with 2 wt% loading through the infiltration route.
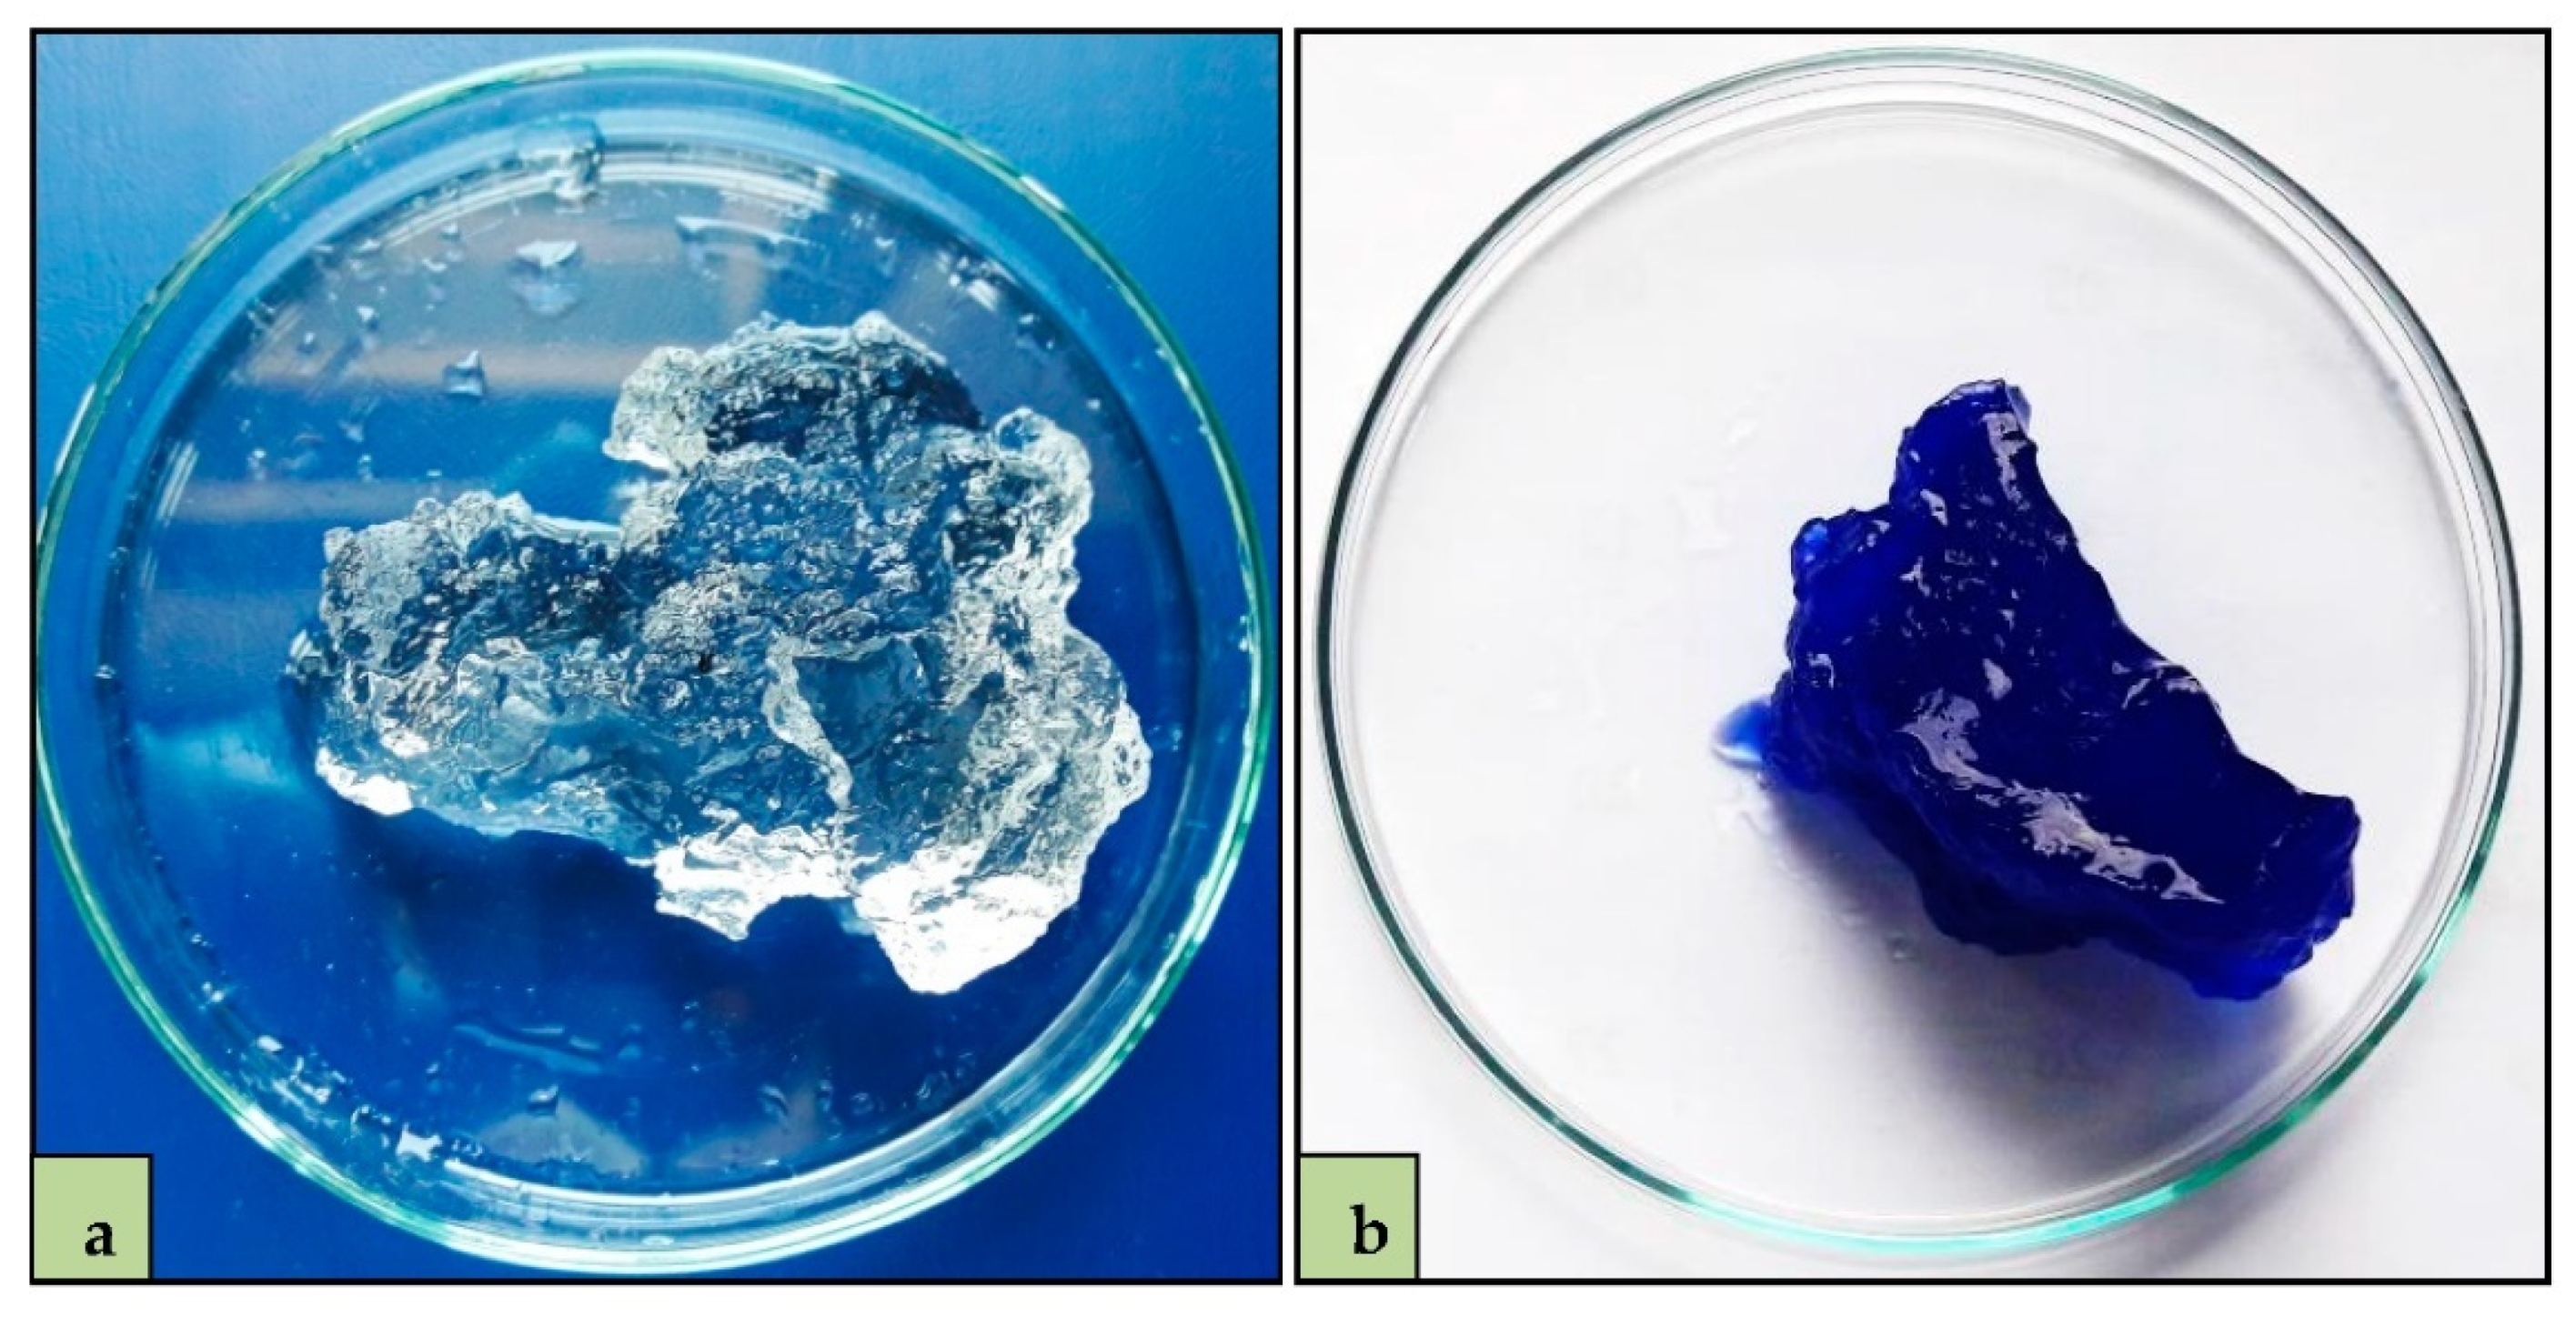
The composite hydrogels were further applied to evaluate their water retention capacity. Figure 3a,b display the swollen SAP-AC hydrogels after being dipped in distilled water and 50 ppm MB solution at room temperature, respectively. It is visibly evident that the swollen SAP-AC composite hydrogel structure turned out to be fully amorphous and transparent (Figure 3a). These phenomena point out the imbibition of water molecules into the SAP-AC hydrogel which gives additional proof for the enhanced swelling capacity related to the alginate hydrogel. Such behavior is caused by the presence of water molecules inside the micro- and macro-pores of the composite hydrogel and the disorder caused by the absorbed water [33].

3.2. MB Adsorption Experiments

3.2.1. Effect of pH on MB Adsorption at Constant Temperature

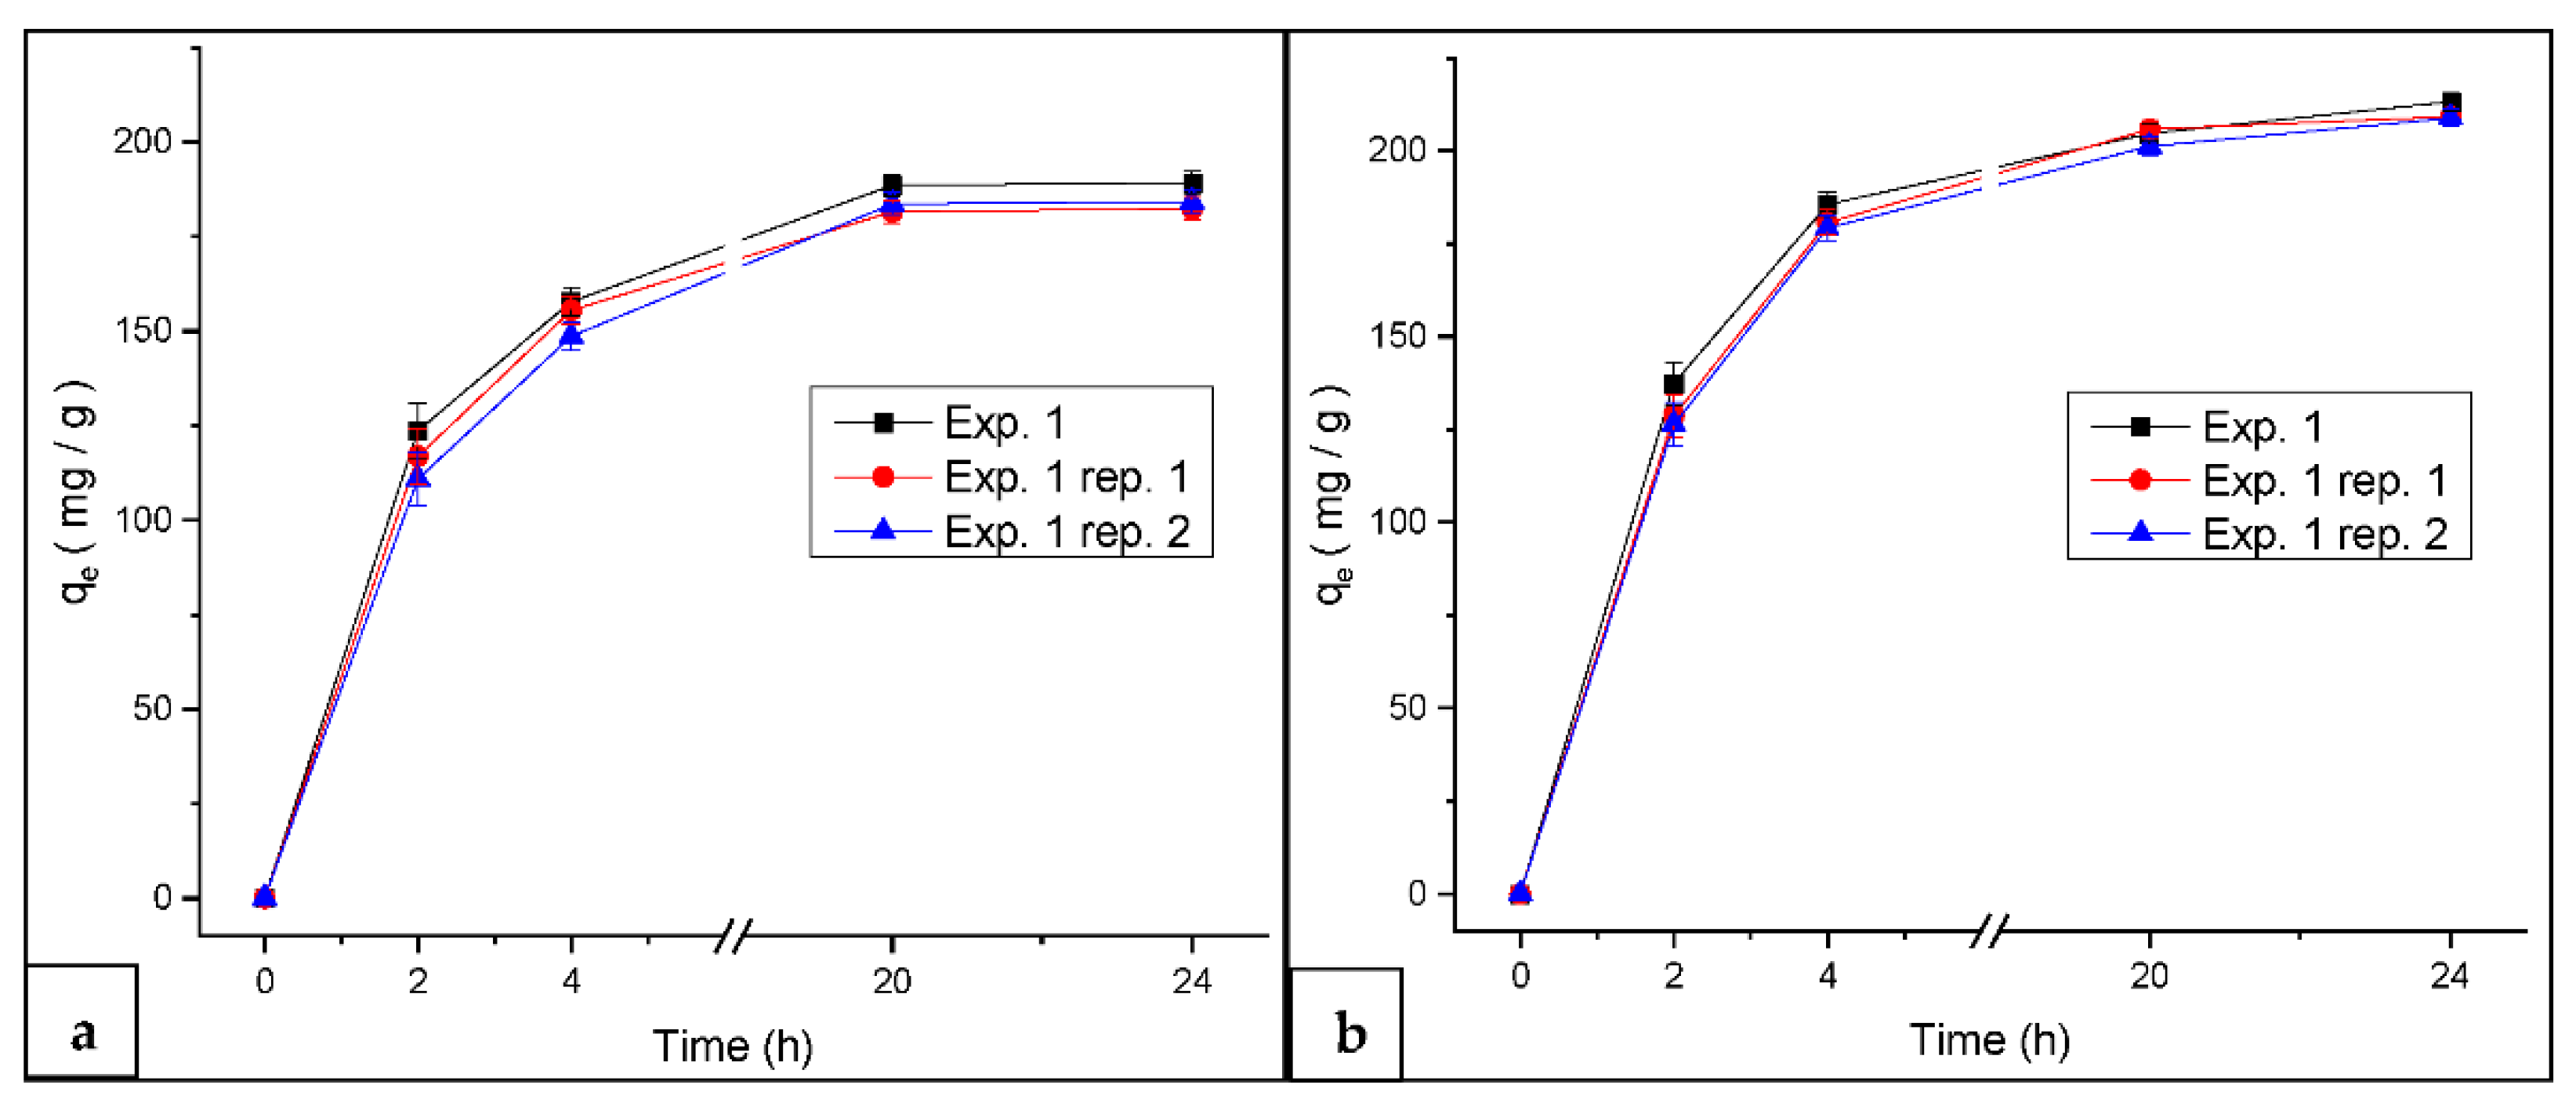
In the adsorption process, pH plays a significant role in the aqueous system. The pH of the solution can directly affect the charge distribution on the adsorbent surface, and, consequently, it can bring a change in the interactions between the adsorbent and the adsorbate molecules. The effect of pH as a function of time was studied between pH 2 and 10, respectively. Beyond pH 10, the precipitation of MB can take place, which can lead to a misinterpretation of its adsorption [34]. First, experiment 1 (pH 6.0 at 37 °C) was performed along with its repetitions to find the experimental error as displayed in Figure 4a,b.
As the swelling capacity of hydrogels is influenced by the ionic strength, therefore, no buffer solution was applied to retain the pH of the solution. Figure 5a,b display the influence of pH on MB adsorption at a 37.5 °C temperature. In both cases, the adsorption of MB was favored at alkaline pH conditions. Using the SAP as an adsorbent, the highest MB adsorption equilibrium reached 202.84 mg g−1 at pH 10.0, followed by 185.25 mg g−1 at pH 6.0, and the lowest MB adsorption (34.09 mg g−1) at pH 2.0 as demonstrated in Figure 5a. On the other hand, an increased MB adsorption equilibrium of 213.17 mg g−1 was achieved at pH 6.0 followed by 208.73 mg g−1 using the SAP-AC as the adsorbent as shown in Figure 5b. At pH 2.0, in both cases, the lowest MB adsorption capacities of 34.09 mg g−1 using the SAP and 94.01 mg g−1 using the SAP-AC were achieved, respectively. The reason for achieving higher MB adsorption equilibrium in comparison with acidic conditions may be because, at alkaline conditions, the ionization of carboxylic functional groups present on the SAP surface occurs, and the electrostatic attraction force is increased between the MB and the adsorbent surface since MB is a cationic dye. In addition, at acidic conditions (pH 2), lower MB adsorption occurred because of the existence of H+ ions in excess, which destabilizes the MB molecules and also competes with MB ions for the active adsorption sites [34]. Likewise, at low pH conditions, the protonation of COO groups minimizes the main anion–anion (COO-COO) repulsive forces, and, therefore, that is the main reason why a lower MB adsorption was noticed as demonstrated in Figure 5a,b [33].
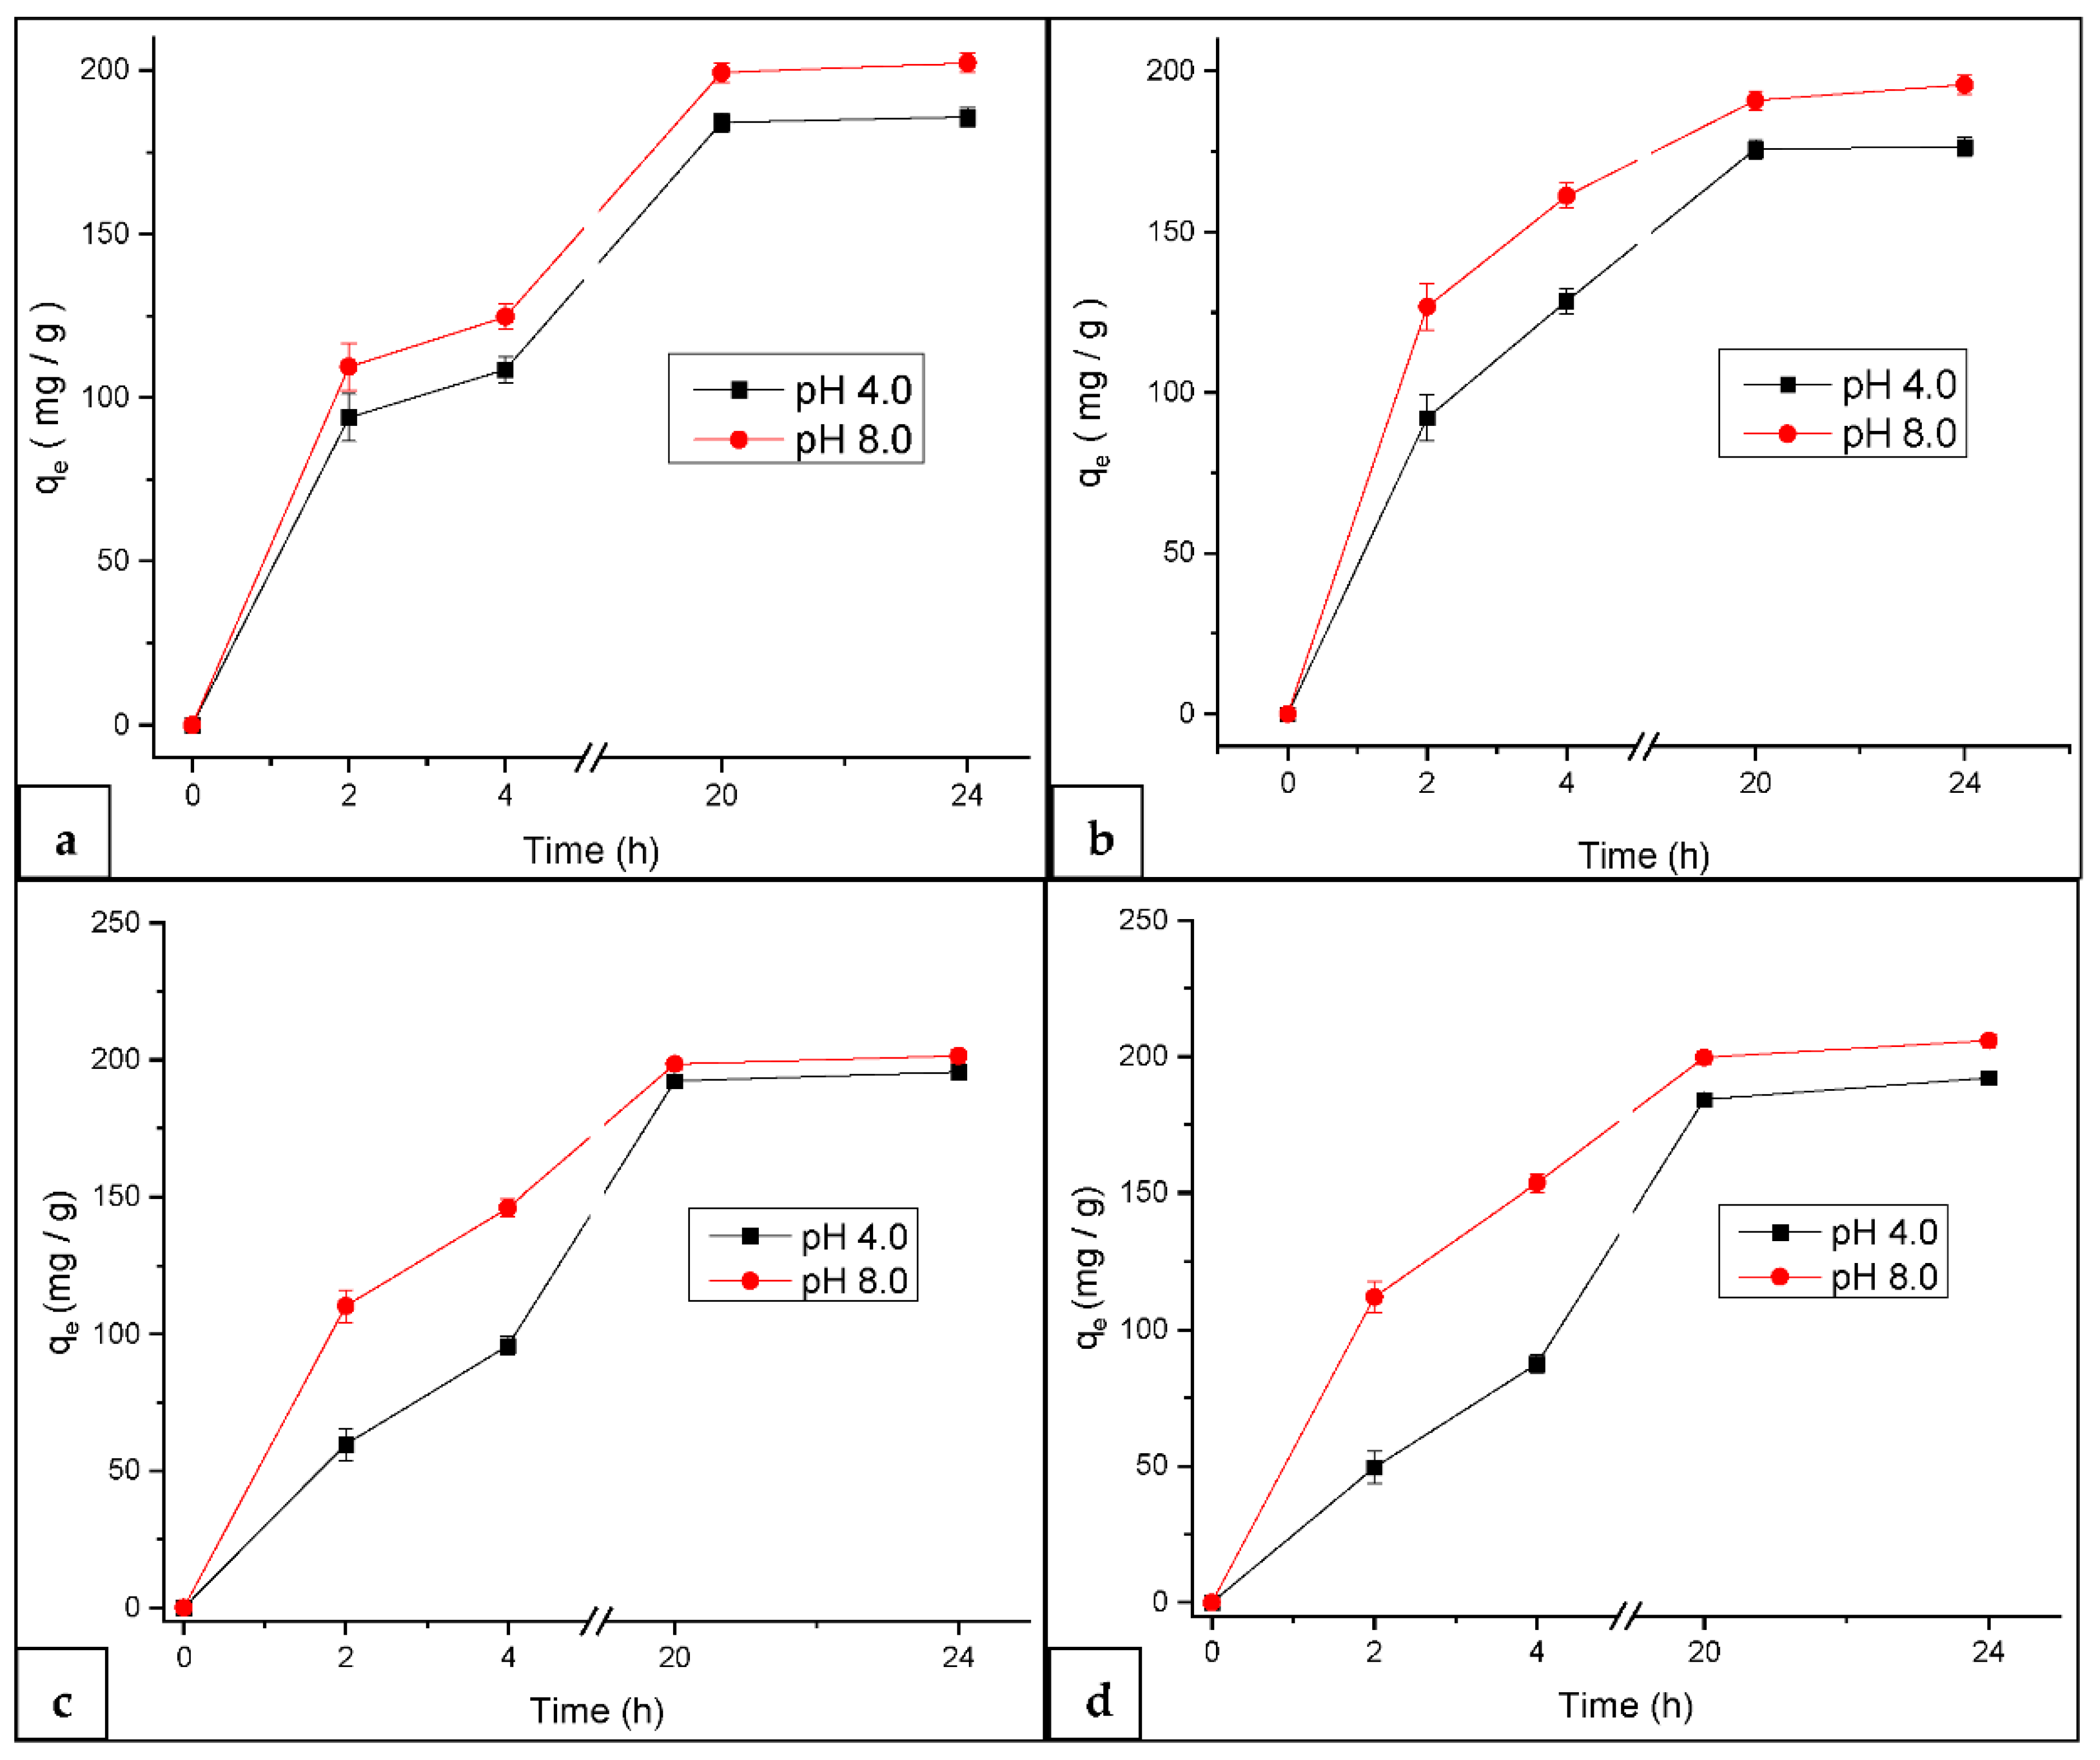
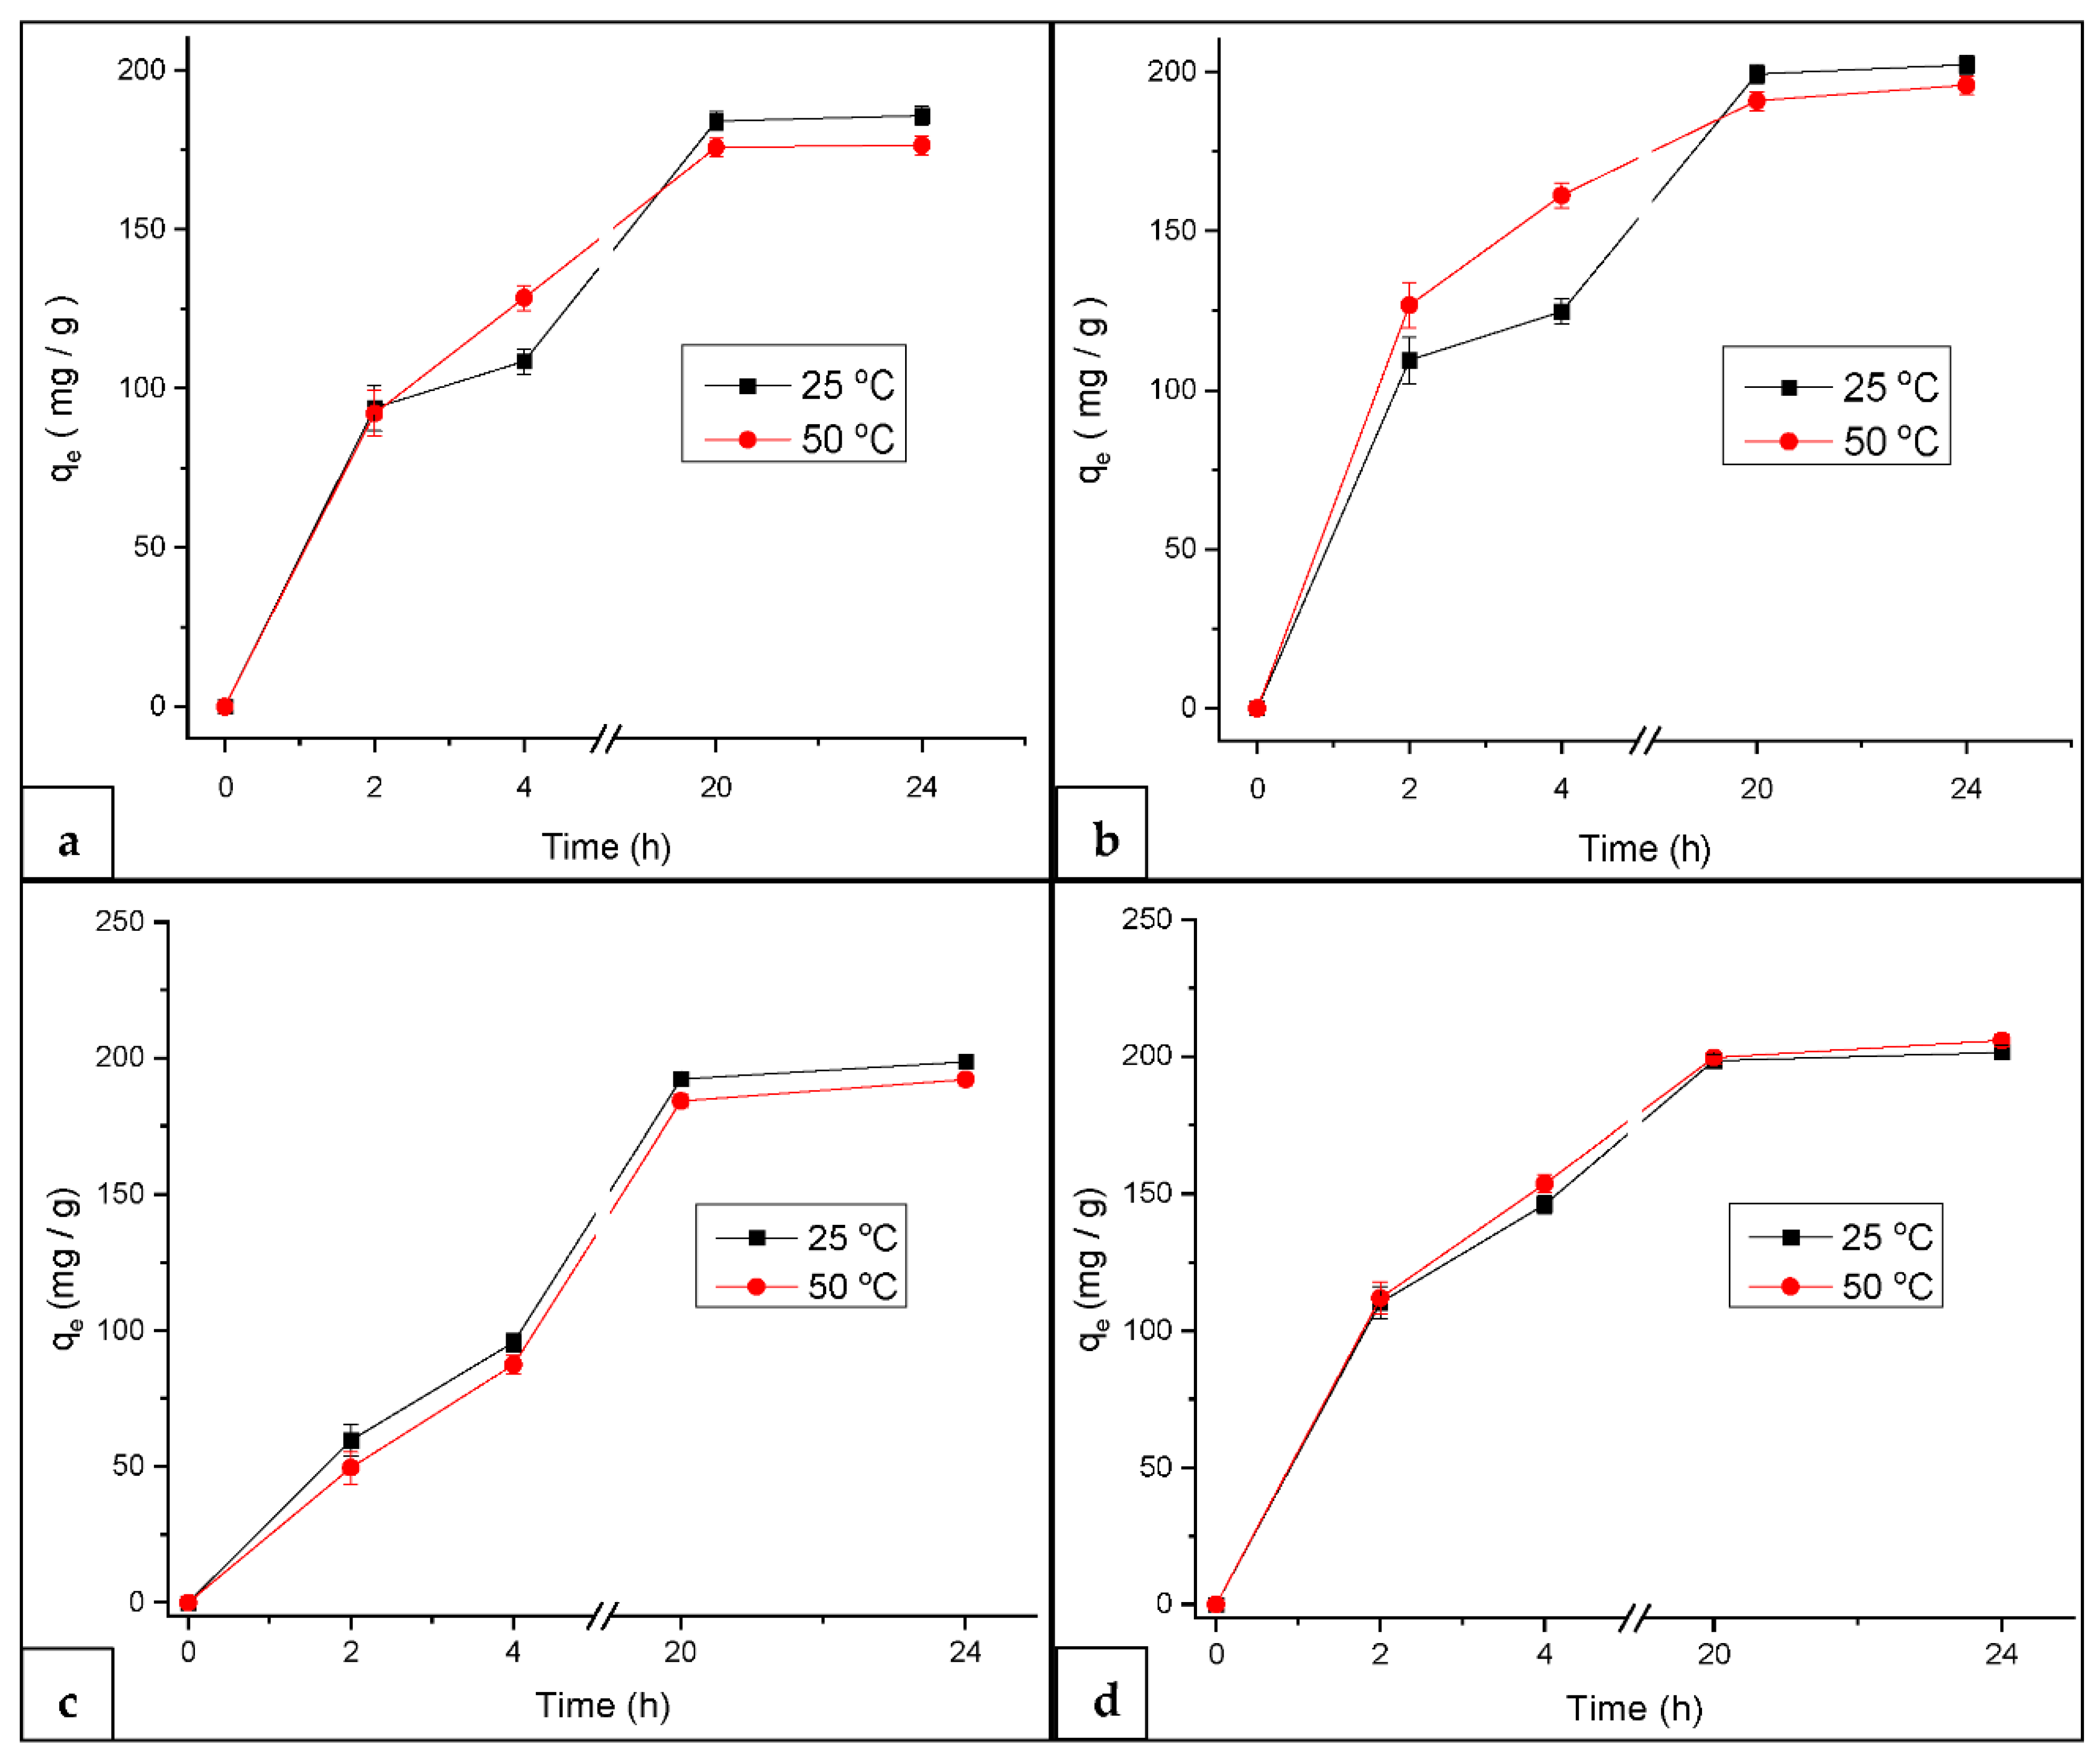
Further experiments were performed to examine the effect of temperature and pH conditions on MB adsorption using the SAP and SAP-AC as adsorbents. Temperature is also an essential parameter that plays an important role in dye adsorption and desorption. Figure 6a,b depict MB adsorption capacities at two different temperature conditions as a function of time at pH 4.0 and 8.0 using the SAP as an adsorbent. Based on obtained data, the alkaline conditions (pH 8) demonstrated superiority over acidic conditions for a higher adsorption capability of MB dye. The adsorption capacity of MB dye increased when the solution pH was increased. At pH 8 and at 25 °C, the adsorption capacity was found to be higher (202.24 mg g−1), and at 50 °C it was 185.74 mg g−1. The same phenomenon was observed at pH 4.0, i.e., the MB adsorption was higher (195.73 mg g−1) at 25 °C than at 50 °C (176.44 mg g−1). The reason may be due to the desorption of MB dye at an elevated temperature [35].
A similar phenomenon was observed when the MB adsorption experiments were performed at pH 4 and 8 using the SAP-AC, respectively. As it is clear from Figure 6c,d, at pH 8, the MB adsorption capacities are higher than that observed at pH 4.
The adsorption curves are steep as a result of a more rapid adsorption rate in the initial stage. Similarly, during the later phase of the adsorption process, the adsorption curves are comparatively flat because the MB adsorption volume gradually accumulates during the prolongation of adsorption time. The adsorption equilibrium is achieved as soon as the active adsorption sites on the hydrogel surface are fully saturated. In comparison, the SAP-AC had a higher MB adsorption capacity than the SAP because of the incorporation of AC, which also has the capability to adsorb MB [36].
In both cases, the alkaline conditions (pH 8.0) show superiority over acidic conditions for the enhanced adsorption capability of MB dye using the SAP-AC as an adsorbent. The maximal MB adsorption capacity achieved at 25 °C was 195.4 mg g−1 and 201.40 mg g−1 at pH 4.0 and 8.0, respectively, as demonstrated in Figure 6c. In comparison, a marginally higher MB adsorption capacity (205.80 mg g−1) was achieved at pH 8.0 and an elevated temperature (50 °C) as depicted in Figure 6d. The adsorption capacity of MB dye improved when the pH of the medium was increased from pH 2 to 6. Thereafter, the pH caused no considerable effect in a broad pH range from 6 to 10, and the adsorption capacity was insignificant in such a pH range. Such findings can lead to a significant benefit in wastewater applications as the pH range of real wastewater is generally basic/neutral [37].

3.2.2. Effect of Temperature on MB Adsorption at Constant pH

In the temperature study, the MB adsorption capacity by the SAP as an adsorbent was compared at two different levels (25 and 50 °C) keeping the pH constant. Figure 7a,b illustrate the MB adsorption capacity as a function of time at pH 4.0 and 8.0 correspondingly. Comparatively, it is clear from the graphs that MB adsorption by the SAP is favored at lower temperatures (25 °C) and alkaline pH (8.0) conditions.
At pH 4.0, the observed MB adsorption capacity was 185.74 mg g−1 at 25 °C and 176.44 mg g−1 at 50 °C, respectively. In comparison, at pH 8.0, a higher MB adsorption capacity was observed, i.e., 202.24 mg g−1 at 25 °C and 195.73 mg g−1 at 50 °C. A higher MB adsorption at alkaline conditions corresponds to an intensification in the negative surface charge of the SAP due to the de-protonation of carboxylic acid groups; consequently, the number of available adsorption sites was increased. Moreover, at elevated temperatures, the bonds between the adsorbed MB molecules and the adsorbent are weakened which leads to a reduction in the removal of adsorbed MB [38].
Temperature is also an important variable that can affect the adsorption process. There are two possibilities, i.e., the adsorption capacity decreases as the temperature rises, demonstrating the adsorption as an exothermic process. Moreover, by raising the temperature, the probability of collision between the adsorbent and adsorbate will increase, which could possibly aid the adsorption process in a positive way. The effects caused by temperature variation on the MB adsorption capacity using the SAP-AC were studied at three different temperature ranges (25, 37.5, and 50 °C) keeping the pH constant. According to the literature, it can be suggested that the hydrogen bonding between the hydrogel and MB molecules is weakened with an increase in temperature (˃50 °C) which can lead to a decrease in MB removal [39]. Among all experiments, the highest MB adsorption capacity was found at 37.5 °C and pH 6 using the SAP-AC as an adsorbent.
Fast MB adsorption during the initial few hours and relatively sluggish adsorption after 20 h until 24 h were observed as depicted in Figure 7c,d. These may possibly be a consequence of the occupied active adsorption sites and penetration of the MB molecules into the microporous open-framework structure of the synthesized composite hydrogels, respectively. Comparatively, at an elevated temperature (50 °C), a higher and more rapid MB adsorption equilibrium was observed at alkaline conditions (pH 8.0), as compared to acidic conditions (pH 4.0) using the SAP-AC.

3.3. MB Adsorption Percentage and Swelling Ratio

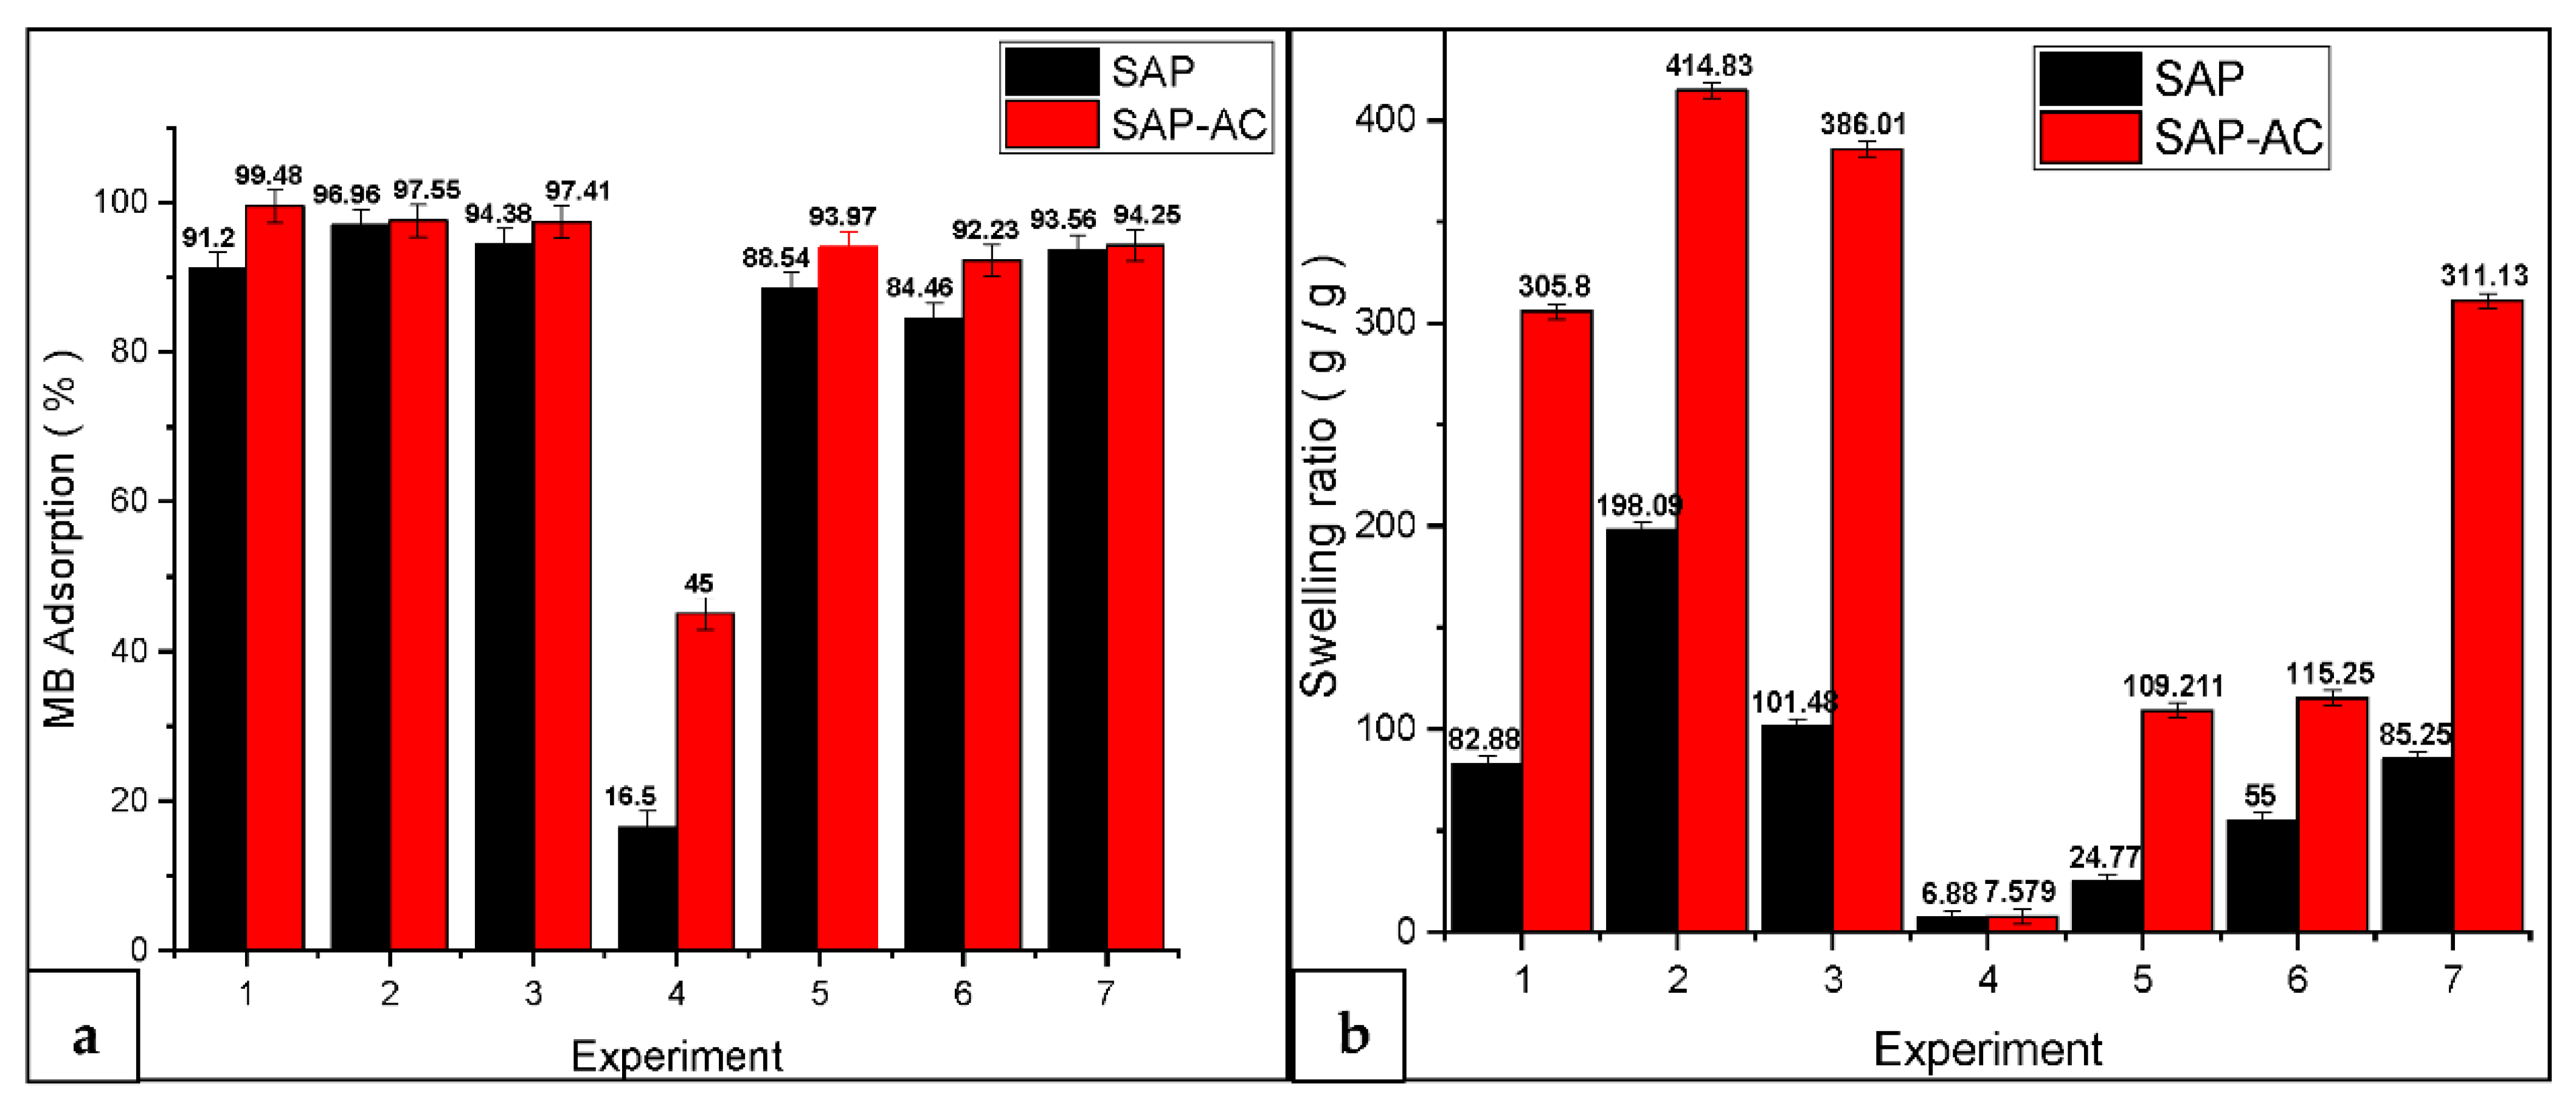
The MB adsorption percentage and swelling ratio during various experimental conditions applied by using Doehlert’s design are demonstrated in Figure 8a,b. Maximum MB adsorption was observed at optimized conditions (pH 10.0 and 37. 5 °C) for the SAP, and, for the SAP-AC, the optimized conditions were pH 6.0 and a 37.5 °C temperature, respectively. At equilibrium, the highest concentrations of adsorbed MB per gram of the adsorbent were 202.84 mg g−1 (96.96%) using the SAP and 213.2 mg g−1 (99.48%) using the SAP-AC, respectively. The time required to achieve MB adsorption equilibrium was ≥20 h. Such an extended adsorption time can be managed in practical applications, firstly, because of the achieved deep MB dye removal (99.48%) and, secondly, because of the lower frequency of required adsorbent regeneration cycles. Due to the incorporation of AC in the polymer matrix, the adsorption of MB was essentially improved as a consequence of the electrostatic attraction forces between the cationic dye and the anionic polymer. Such findings can provide an important advantage to use the composite hydrogel for wastewater applications as the pH range of real water typically can be found in basic/neutral pH conditions. At such a pH range, de-protonation of carboxylic groups leads to a rise in the negative surface charge of the composite hydrogel. As a consequence, the available adsorption sites on the composite hydrogel were increased. MB adsorption capacity was enhanced through the electrostatic interaction among the carboxylic groups (negatively charged) of the hydrogel and the MB ions (positively charged). On the other hand, the reduction in the MB adsorption capacity at acidic conditions can be explained by the electrostatic repulsion between the MB molecules and the adsorbent caused by the presence of more hydrogen ions in the medium. Hence, the interaction between MB and the more positive adsorbent is reduced [39].
The pH of the medium can have a substantial influence on the swelling ratio and structural stability of the hydrogels. In the current study, a positive correlation was observed between the volume of the absorbed water and the pH of the solution, i.e., as the pH increases, the swelling capacity of the hydrogel also increases, which is in accordance with prior studies [40,41]. The reduction in the swelling ratio of the SAP under acidic conditions (pH 2.0) can be due to the protonation of the carboxylate anions; anion-anion repulsive forces are reduced, and, hence, the swelling ratio is decreased [42]. Furthermore, as a result of protonation, the strengthening of H-bonds occurs in –COOH; this enhances the physical crosslinking degree in the skeleton network of the SAP molecule. Conversely, at an alkaline pH, the ionization of –COOH groups occurs, and the H-bonds are gradually weakened [33]. Consequently, electrostatic repulsion gives rise to the additional volume being accessible in the hydrogel to retain extra water, and thus the swelling capacity is enhanced evidently.

3.4. Adsorption Capacity

The experimental design shown in Table 1 was used to understand the effects of pH (X1) and temperature (X2) on the adsorption capacity of both the SAP and SAP-AC. To analyze the effects, the percent adsorption removal (R%) calculated after 24 h was used as response variable. Figure 9 summarizes the results obtained with the SAP. The regression retrieved a quadratic model (R2 = 0.859), given by Equation (5):
R(%, 24 h) = 91.1267 + 29.31X1 − 34.3967X12 − 0.9411X2 + 10.2773X22 + 2.8291X1X2
Figure 9a shows the contour plot of this surface, a saddle-like surface with a zone of maximum close to X1 = 0.5 (pH = 8.0). The Pareto chart shown in Figure 9b highlights the statistical significance of the terms of the model. At a p-value < 0.05, almost all terms of the model are deemed significant, except for the linear term of the temperature (X2) and the interaction of both variables (X1X2). Moreover, the negative signal of the term X12 indicates that the experimental space contains an inflection point, i.e., a local maximum. Finally, Figure 9c shows the correlation plot of predicted vs. observed values of R(%). It can be seen that the model overestimates R(%) at boundary points (R(%) > 96%), probably caused by the high curvature of the quadratic model.
The response surface of the SAP-AC has a similar geometry, as indicated in Figure 10. However, as the contour lines (Figure 10a) and the Pareto chart (Figure 10b) suggest, the effect of temperature is more subtle in this case, whereas the term of interaction (X1X2) is considered statistically significant. The quadratic R(%) model for the SAP-AC is given by Equation (6) (R2 = 0.846):
R(%, 24 h) = 98.9433 + 18.4267X1 − 27.6683X12 + 0.4099X2 + 3.2519X22 + 2.8291X1X2
The residual plot in Figure 10c, similar to the results observed for the SAP in Figure 9c, shows a deviation from the expected value for R(%)~96%, probably due to an overestimation of the model curvature. This is reflected in the slightly low value of the model’s R2. Nevertheless, the model was able to capture the curvature of the response R(%) with respect to the pH, whose coefficient is strongly negative (−27.67) and indicates the occurrence of an inflection point within the experimental space.
According to the model, the optimum operating points determined for each material are (X1 = 0.425, X2 = −0.013) for the SAP and (X1 = 0.332; X2 = −0.203) for the SAP-AC. These points correspond to pH = 7.70 and T = 37.31 °C for the SAP, and pH = 7.31 and T = 34.60 °C for the SAP-AC.

3.5. MB Adsorption at Higher Initial Concentration

In order to find the effect of the initial MB concentration, the adsorption of MB was investigated at optimized reaction conditions using higher concentrations in the range of 100 and 200 mg L−1, respectively. All the experiments were performed in triplicates, and the standard deviation was calculated for each point. For comparison purposes, a set of blank experiments was also performed to find any MB adsorption within the experimental apparatus (tubing, column, stirring reservoir, or peristaltic pump, etc.). Figure 11a,b displays the MB adsorption capacity and adsorption percentage as a function of time using the SAP and SAP-AC as adsorbents at a 100 ppm MB initial concentration. In comparison with a lower MB concentration, it is noticeable that, as the charge of MB molecules increases, the MB adsorption capacity also increases.
In the case of the SAP, the MB adsorption capacity reached 367.09 mg g−1 with 88.93% removal efficiency and a swelling ratio of 24.03 g g−1; for the SAP-AC, it attained 399.03 mg g−1 with 95.89% removal efficiency and a swelling ratio of 265.40 g g−1. However, a slight reduction in the swelling ratio and MB adsorption percentage was observed when the initial MB concentration was increased from 50 mg L−1 to 100 and 200 mg L−1, respectively. This phenomenon can be described by the fact that numerous active adsorption sites are available at low MB concentrations. However, by increasing the MB concentration, such circumstances varied due to the tough competition for the adsorption sites; hence, more adsorbate molecules are occupied per unit mass of the adsorbent. However, the removal percentage demonstrates a declining trend [43]. The highest MB adsorption efficiency was achieved using the SAP-AC due to the combined adsorptive nature of both AC and the SAP, providing more active and selective adsorption sites for the MB molecules to be adsorbed.
Figure 11c,d depict the MB adsorption capacity and percent MB adsorption as a function of time by the SAP and SAP-AC as adsorbents using a 200 mg L−1 initial MB concentration. According to the results obtained, an increase in the MB adsorption capacity was achieved with a gradual reduction in the percent MB adsorption and swelling ratio as compared to lower MB initial concentrations.
Comparatively, using the SAP-AC as an adsorbent, a higher (736.75 mg g−1) MB adsorption capacity was obtained with 92.26% removal efficiency, and the swelling ratio reached the value of 104.00 g g−1, respectively. On the other hand, using the SAP as an adsorbent, the MB adsorption capacity reached the value of 686.54 mg g−1 with 88.33% of the MB adsorption percentage, and the swelling ratio was 33.98 g g−1 correspondingly.
Initially, in the first few hours, rapid adsorption of MB can be noticed using the SAP-AC which may possibly correspond to the availability of more adsorption sites because of the proven adsorptive nature of the SAP and AC individually. On the other hand, a slower MB adsorption rate was detected for the first few hours using the SAP due to the availability of adsorption sites provided by the SAP only. Therefore, a higher MB adsorption capacity was observed using the SAP-AC as an adsorbent. Table 2 shows the comparison between the adsorption capacity of MB in the present study and previous studies reported in the literature. It is clearly seen that the MB adsorption capacities observed in the present study were much higher for different initial MB concentrations. Furthermore, the adsorption of MB reached maximum values of 99.48%, 95.89%, and 92.26% using the SAP-AC as the adsorbent at initial MB concentrations of 50, 100, and 200 ppm, respectively.

3.6. Kinetics Study

To find the time taken for reaching the adsorption equilibrium and to understand the MB adsorption mechanism better, the data were fitted with pseudo-first-order and pseudo-second-order models, which are represented by Equations (7) and (8), respectively, where qe and qt are the amounts of MB adsorbed at equilibrium (mg g−1); t is the adsorption time; and k1 (min−1) and k2 (g mg−1 min−1) are the rate constants for pseudo-first-order and pseudo-second-order kinetics, respectively [48,49].
l n   ( q e q t ) = l n   q e k 1 t
t q t = 1 k 2   q e 2 + t q e
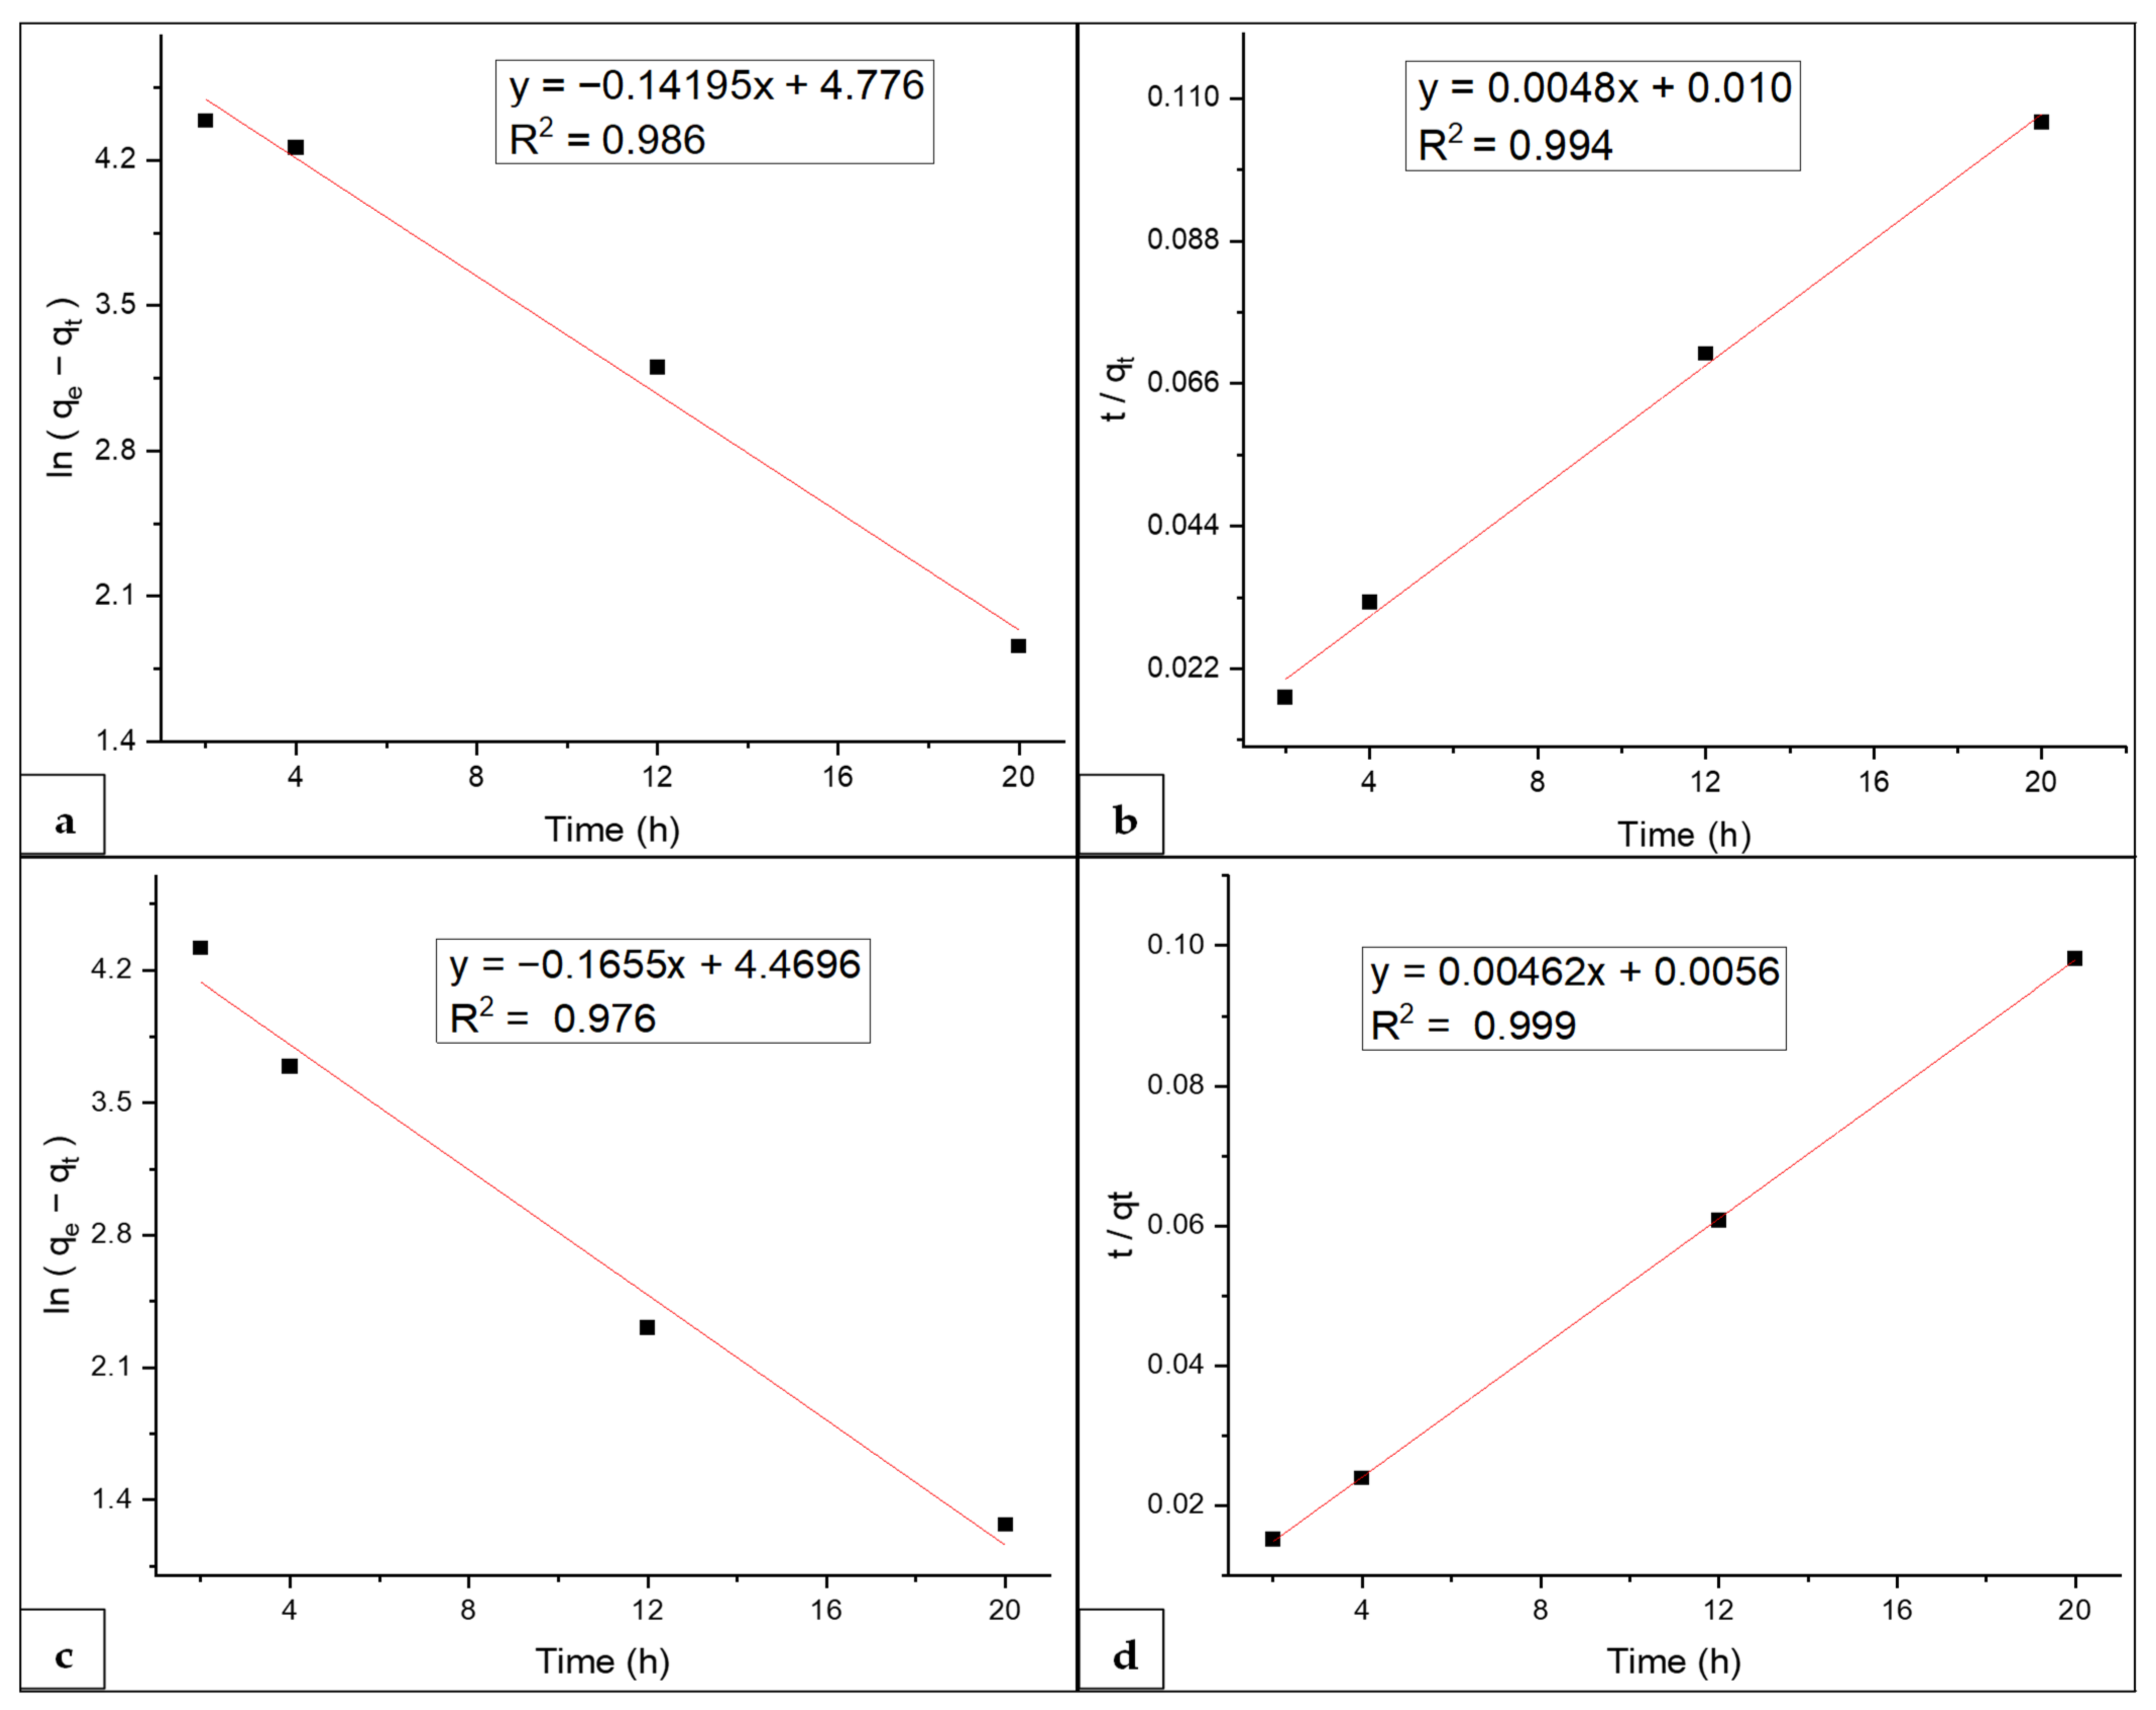
The adsorption kinetics of MB dye on the hydrogel were plotted to verify the rate-controlling route and the adsorption mechanism which are critical activities for practical use. For the determination of kinetic parameters for MB adsorption on the SAP, the adsorption study was accompanied by four different contact time intervals. By plotting ln(qeqt) versus time for the pseudo-first-order and plotting t/qt against time for pseudo-second-order equation, this gave straight lines with the slope and intercept as depicted in Figure 12a,b, respectively.
From the given straight-line equations, the values for qe, K1, and K2 were calculated which are presented in Table 3. Comparatively, the pseudo-second-order kinetic model showed a better fitting degree due to the higher correlation coefficient (R2). The calculated value for the amount of MB adsorption at equilibrium (qe) compared to the experimental value is almost the same.
Figure 12c,d illustrate MB adsorption kinetics using the SAP-AC as an adsorbent. A higher correlation coefficient (R2) value and a nearly equal MB adsorption equilibrium (qe), as shown in Table 3, suggest that the current data best fit the pseudo-second-order model.
It is suggested that the MB adsorption mechanism can be better represented by the pseudo-second-order model using the SAP-AC as an adsorbent. Subsequently, this indicates that the determination of the MB adsorption rate is governed by the chemical adsorption process via electron transfer, exchange, or sharing between the SAP-AC and MB molecules.

3.7. Adsorption Isotherms

For the adsorption isotherm, two well-known isotherm models were applied, namely, Langmuir and Freundlich isotherms [32]. The Langmuir isotherm model proposes monolayer adsorption on homogenous surface sites, which can be expressed in its linear form by Equation (9).
C e q e = 1 K L q m + C e q m
The Freundlich isotherm model is established on the presumption of multilayer adsorption on heterogeneous surface sites with diverse adsorption energies, expressed by Equation (10) as:
l n   q e = l n   K F + 1 n   ln C e
where Ce is the equilibrium concentration (mg L−1) of the adsorbate in the solution; qe is the amount of adsorbate adsorbed at equilibrium (mg g−1); qm is the maximum amount of adsorbate required for complete monolayer coverage (mg g−1); n is the adsorption intensity; and KL and KF are the Langmuir and Freundlich constants, respectively.
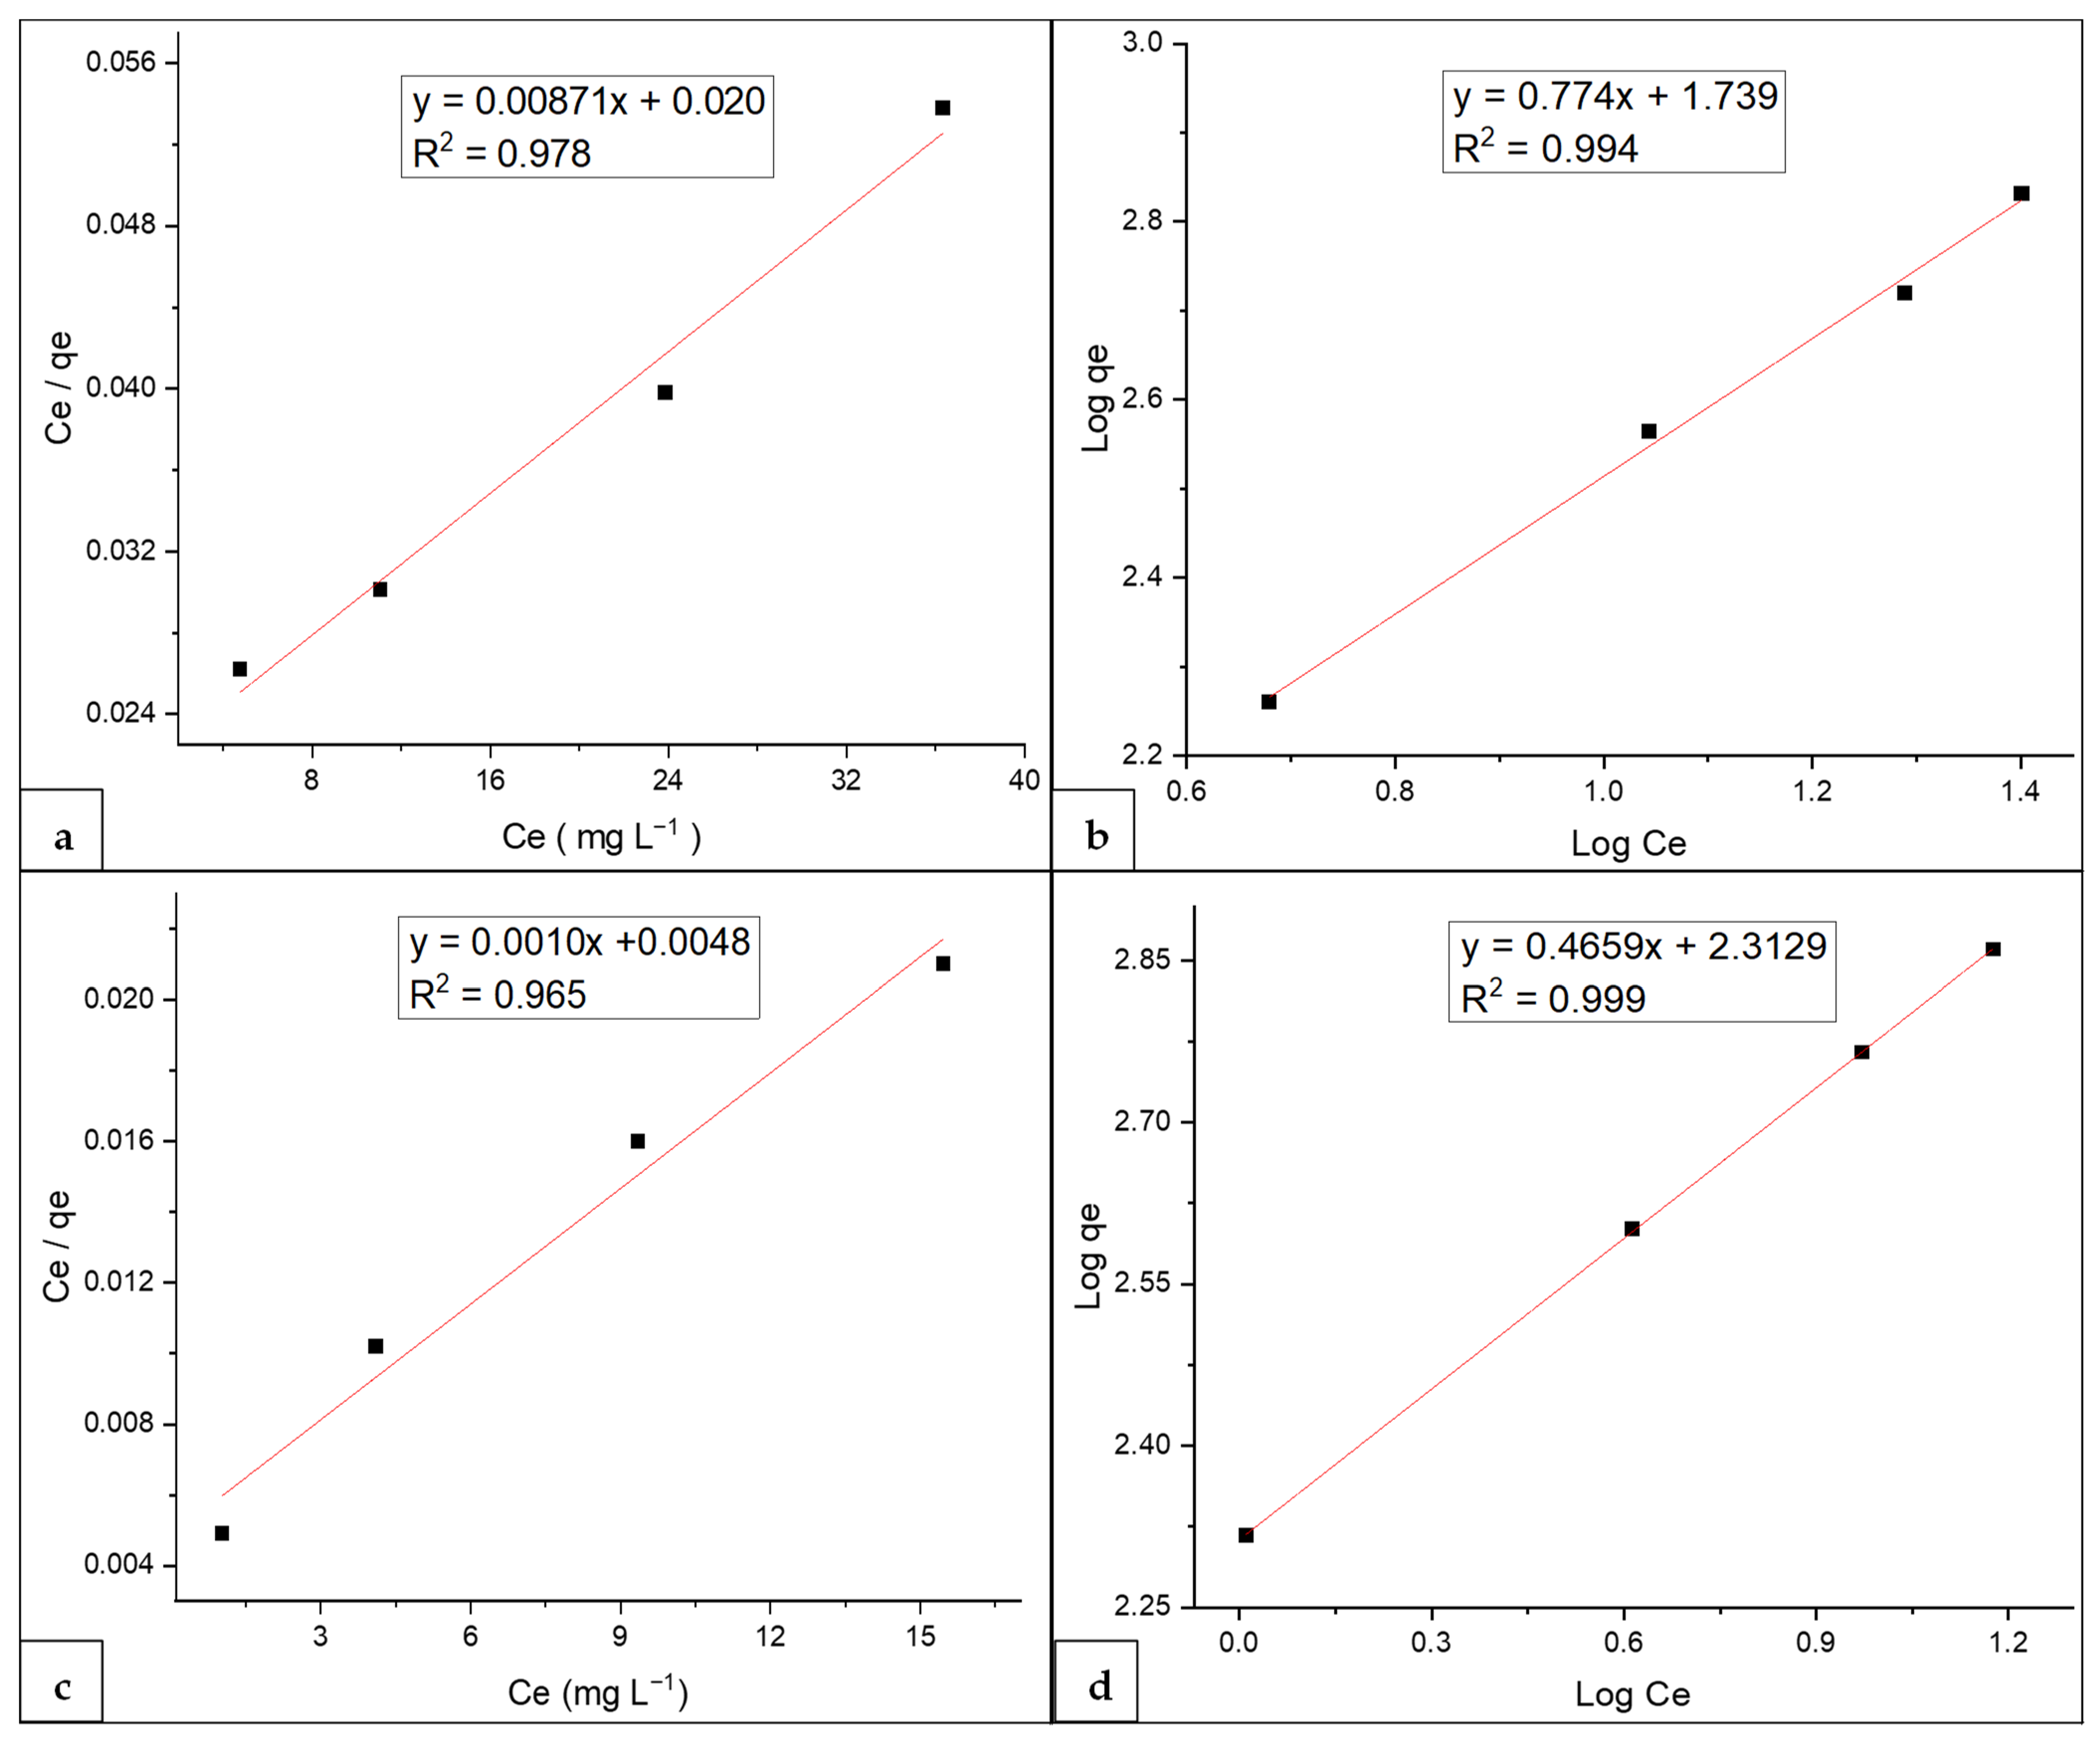
Figure 13a,b show Langmuir and Freundlich adsorption isotherms for MB adsorption on the SAP as the adsorbent. From the regression constant (R2) values, it can be deduced that the Freundlich adsorption isotherm best fits to the current data as compared to the Langmuir isotherm model.
The Langmuir isotherm is well fitted if the plot of Ce/qe vs. Ce is linear. The determination coefficient calculated, R2 = 0.978, shows that the Langmuir model does not apply to the conditions studied. Furthermore, the calculated value for the maximum MB adsorption (qm) is lower as compared to experimental data reinforcing that the model is not well fitted. From the straight-line equations, the constants were determined from the plots. Table 4 shows the calculated parameters for Langmuir and Freundlich models and their constants for each model. In contrast, the Freundlich adsorption isotherm provides an expression about the heterogeneous surface having an exponential distribution of active sites and their energies. According to the calculated parameters shown in Table 4, the value n is greater than 1, proposing a promising adsorption activity at higher MB concentrations.
The experimental data were further applied to the Langmuir and Freundlich isotherms to deduce MB adsorption activity using the SAP-AC as depicted in Figure 13c,d. Comparatively, the Freundlich isotherm revealed a higher R2 (Table 4), propounding that the experimental data fitted better to such a model, and, as a result, a multilayer MB adsorption on the hydrogel can be achieved.
Furthermore, the calculated value of n was 2.146 (1 < n < 10), which suggested that the interaction mechanism was favorable to adsorption between the MB dye molecules and SAP-AC hydrogel surface [50].

3.8. Physicochemical Characterization of SAP Adsorbents

3.8.1. SEM Analysis

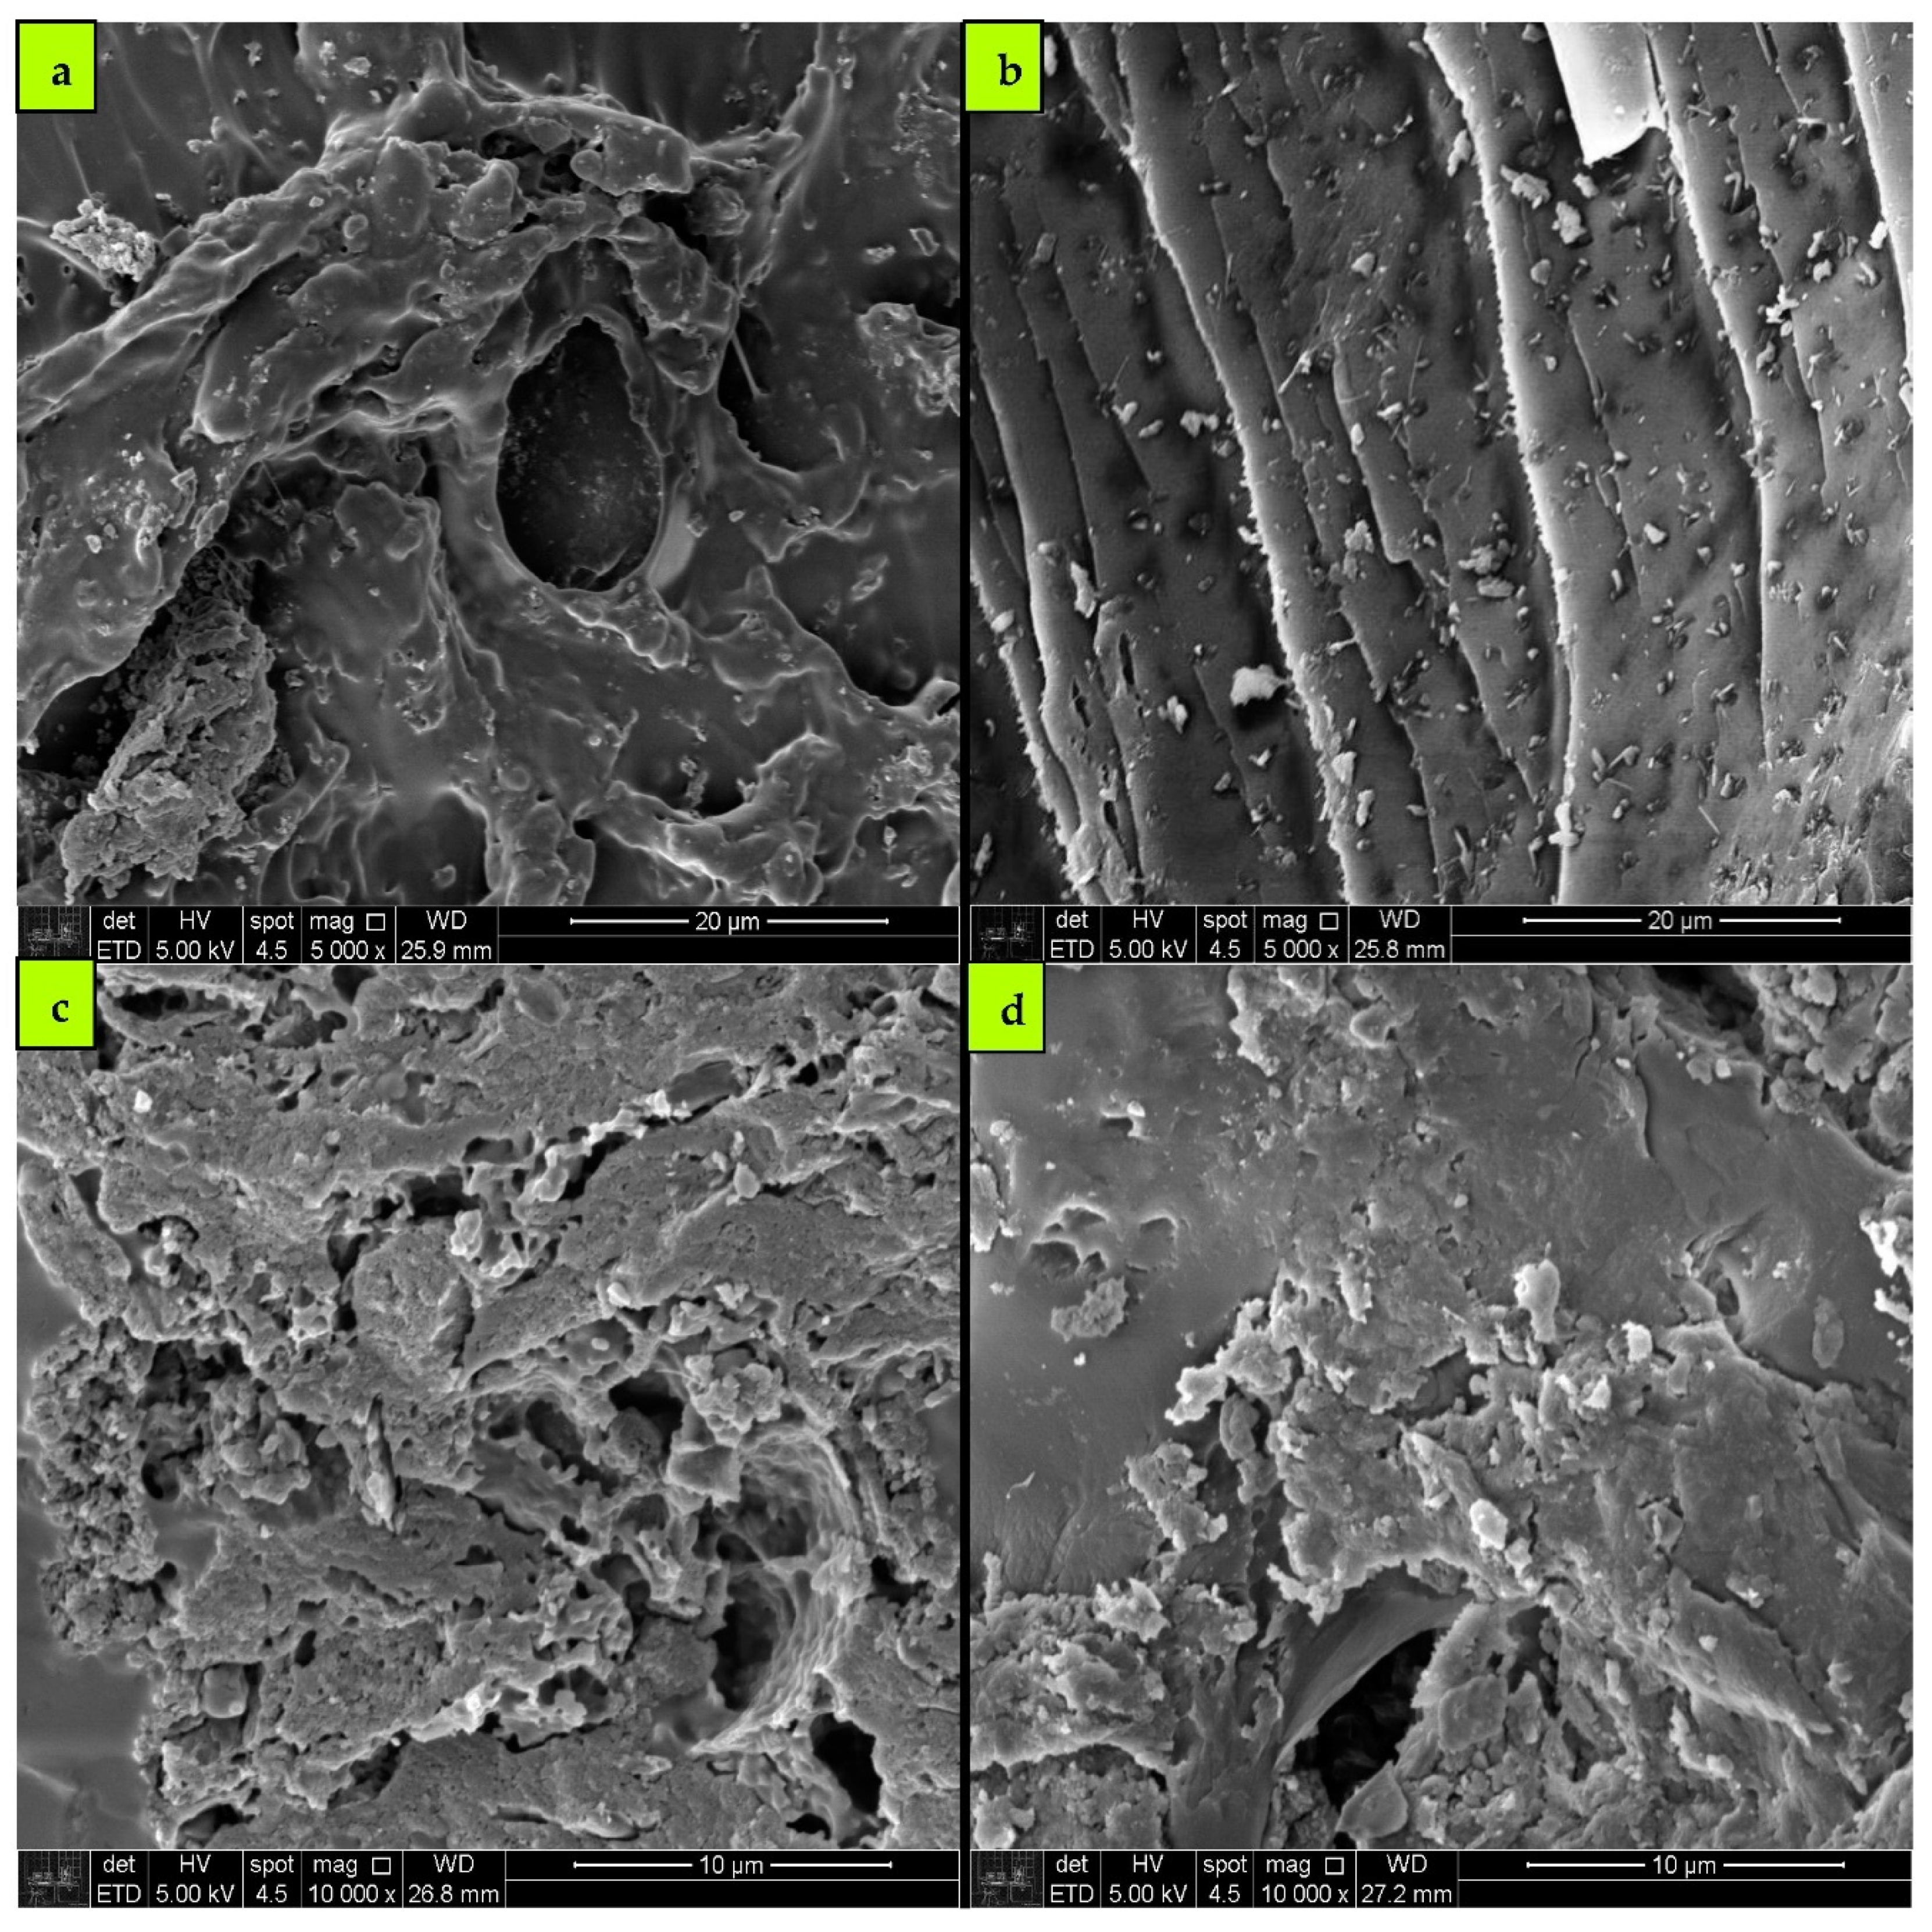
Scanning Electron Microscopy (SEM) was performed to study and compare the surface textural and morphological changes that occurred during the adsorption process. It is evident from the micrographs that, before MB adsorption, the SAP (Figure 14a) showed a wrinkled morphology with a porous texture. This wrinkled texture can increase the specific surface area of the SAP, which is favorable for the improvement in water absorbing and the MB adsorption capacity. It can be noted that upon the addition of AC to the SAP, the porosity of the SAP material was enhanced drastically as shown in Figure 14c. On the other hand, after MB adsorption, the SAP texture was plainer, and almost all the pores were completely blind due to the MB adsorption as depicted in Figure 14b,d, respectively. The SEM morphology revealed that the SAP-AC composite has a microporous open-framework structure, allowing an easy entrance of MB molecules to adsorb on the internal active sites in the hydrogel [51].

3.8.2. XRD Analysis

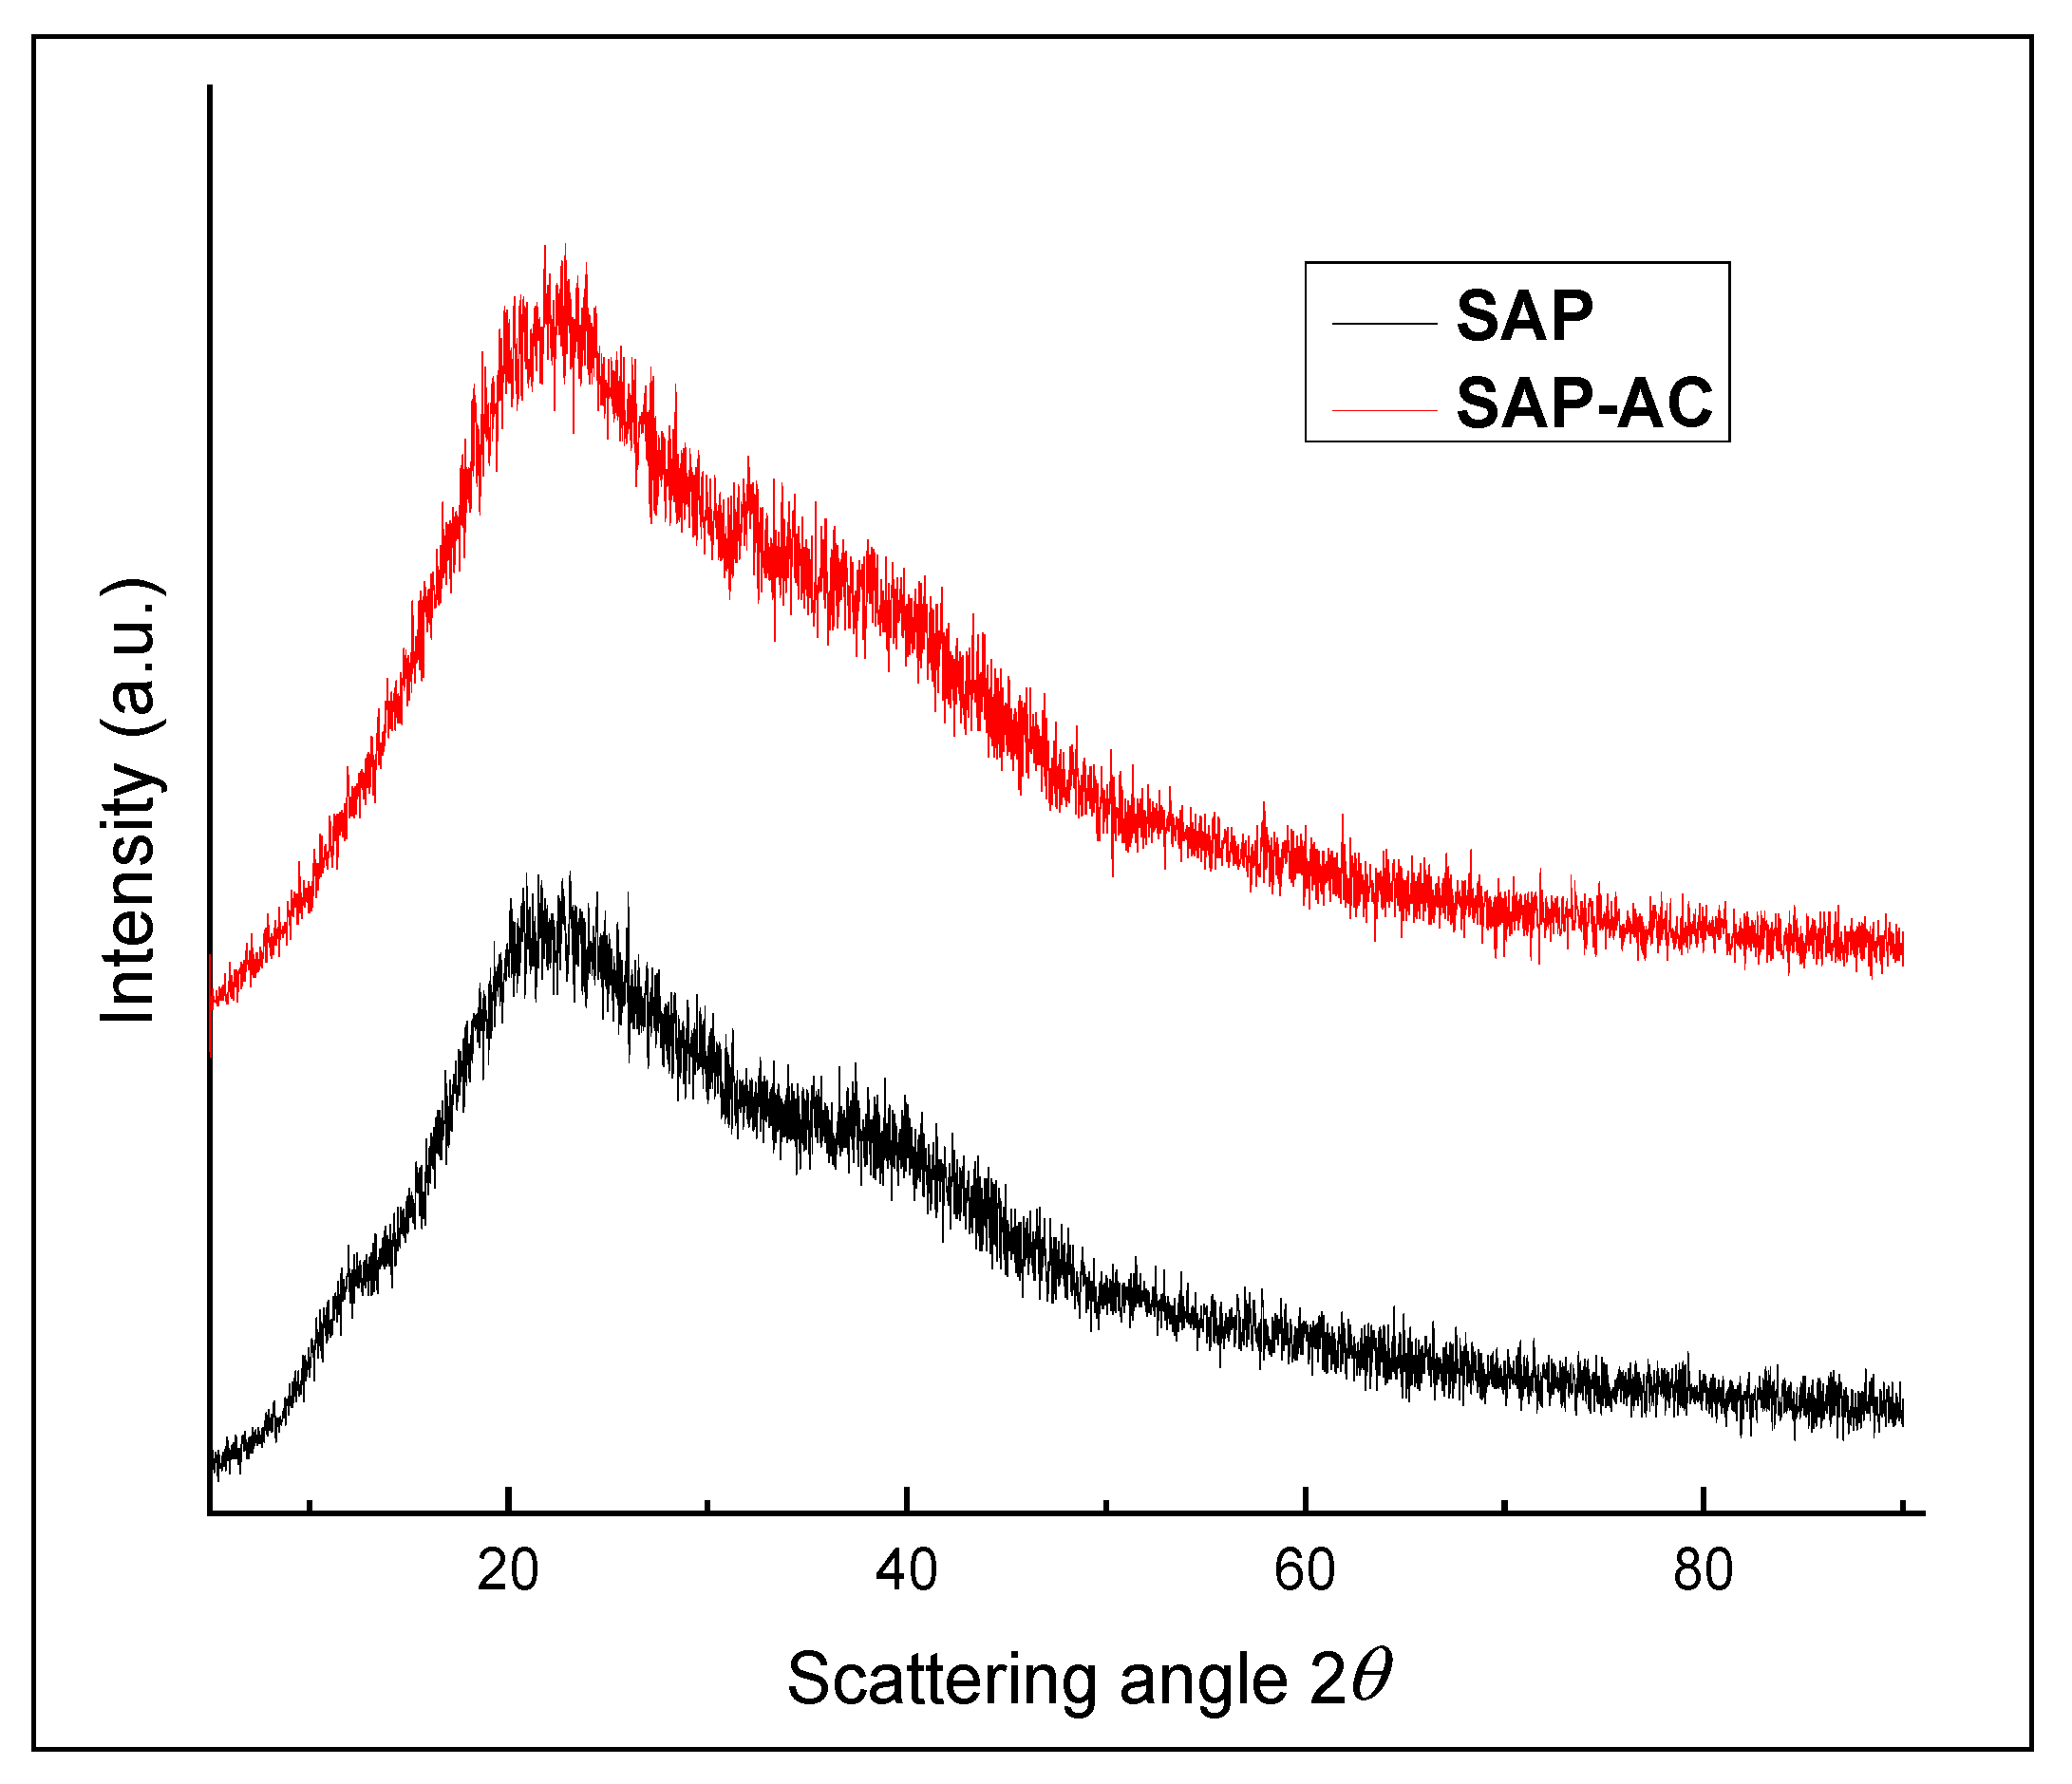
X-ray diffraction (XRD) was used to determine and identify the composition and crystallographic nature of the hybrid adsorbent. Figure 15 depicts the comparison of the XRD profiles of the raw samples before MB adsorption. In the XRD profile of the SAP and SAP-AC, no significant peak was observed, which confirms that the SAP and SAP-AC were amorphous. Moreover, due to the incorporation of activated charcoal, no significant changes in the XRD pattern were observed.

3.8.3. FTIR Analysis

Fourier transform infrared (FTIR) absorption spectra of powdered SAP and SAP-AC samples were recorded using attenuated total reflection (ATR). The spectra were recorded between 4000 and 400 cm−1. Figure 16 illustrates the spectra of the synthesized samples.
To investigate the formation of the hydrogel, FTIR analyses were performed which are presented in Figure 16. The peaks around 806.36 cm−1 and 1240.70 cm−1 were due to C−H stretching; the peaks at 1038.20 cm−1 correspond to the C=O stretching vibration; the peaks at 1172.27 cm−1 are related to the stretching vibrations of the carboxylate groups; the peaks around 1409.68 cm−1 correspond to symmetrical stretching vibrations of the carbonyl groups; the peaks at 1547.95 cm−1 are due to the overlapped stretching vibration of the carbonyl groups of the acrylic acid unit (–C=O in –COOH); the peaks at 1708.55 cm−1 correspond to C=O of the β-carboxylic acid; the peaks at 2940.18 cm−1 are related to methylene, and the peaks around 3444.86 cm−1 correspond to hydroxyl stretching influenced by hydrogen bonding. The observed FTIR spectra of the synthesized samples did not show any drastic changes, and the peaks obtained were typical for the hydrogel, as previously reported in the literature [33,51,52,53]. The appearance of the band at 1708 cm−1 corresponds to the C=O stretching band associated with the carboxylic group of the SA-cl-PAA hydrogel, which confirmed the grafting reaction of AA to SA.

4. Conclusions

A biodegradable superabsorbent polymer hydrogel incorporated with activated charcoal was successfully used as an adsorbent for the deep removal of MB. Temperature and pH had a pronounced effect on the MB adsorption and hydrogel swelling ratio. The highest MB adsorption was observed at pH 6.0 and a 37.5 °C temperature, and the lowest MB adsorption and the swelling ratio were observed at pH 2.0 and a 25 °C temperature. The SAP-AC showed good adsorption capacity even at higher MB concentrations. MB adsorption kinetics obey a pseudo-second-order design, and the data were best fitted to the Freundlich adsorption isotherm. SEM images revealed the porous nature of the SAP-AC adsorbent before MB adsorption. The current study can be helpful in the removal of cationic dyes from wastewater, and the hydrogel can be successfully used for multifold adsorption and desorption cycles.

Author Contributions

Conceptualization, A.C.S.C.T. and S.S.S.; methodology, A.C.S.C.T. and S.S.S.; software, B.R.; validation, A.C.S.C.T., B.R. and S.S.S.; investigation, A.C.S.C.T. and S.S.S.; resources, A.C.S.C.T. and S.S.S.; data curation, A.C.S.C.T., S.S.S. and B.R.; writing—original draft preparation, A.C.S.C.T. and S.S.S.; writing—review and editing, A.C.S.C.T., S.S.S. and B.R.; visualization, A.C.S.C.T., S.S.S. and B.R.; supervision, A.C.S.C.T.; project administration, A.C.S.C.T. and S.S.S.; funding acquisition, A.C.S.C.T. and S.S.S. All authors have read and agreed to the published version of the manuscript.

Funding

This research was funded by the Coordenação de Aperfeiçoamento de Pessoal de Nível Superior (CAPES) [001], grant number (88887.370179/2019-00).

Data Availability Statement

Not applicable.

Conflicts of Interest

The authors declare no conflict of interest.

References

  1. Vilela, D.; Parmar, J.; Zeng, Y.; Zhao, Y.; Sánchez, S. Graphene-Based Microbots for Toxic Heavy Metal Removal and Recovery from Water. Nano Lett. 2016, 16, 2860–2866. [Google Scholar] [CrossRef] [PubMed] [Green Version]
  2. Sharma, S.; Bhattacharya, A. Drinking Water Contamination and Treatment Techniques. Appl. Water Sci. 2016, 7, 1043–1067. [Google Scholar] [CrossRef] [Green Version]
  3. Wilkinson, J.; Hooda, P.S.; Barker, J.; Barton, S.; Swinden, J. Occurrence, Fate and Transformation of Emerging Contaminants in Water: An Overarching Review of the Field. Environ. Pollut. 2017, 231, 954–970. [Google Scholar] [CrossRef] [PubMed] [Green Version]
  4. Ma, L.; Liu, Y.; Yang, Q.; Jiang, L.; Li, G. Occurrence and Distribution of Pharmaceuticals and Personal Care Products (PPCPs) in Wastewater Related Riverbank Groundwater. Sci. Total Environ. 2022, 821, 153372. [Google Scholar] [CrossRef] [PubMed]
  5. Ofrydopoulou, A.; Nannou, C.; Evgenidou, E.; Christodoulou, A.; Lambropoulou, D. Assessment of a Wide Array of Organic Micropollutants of Emerging Concern in Wastewater Treatment Plants in Greece: Occurrence, Removals, Mass Loading and Potential Risks. Sci. Total Environ. 2022, 802, 149860. [Google Scholar] [CrossRef] [PubMed]
  6. Ma, L.; Wang, Q.; Islam, S.M.; Liu, Y.; Ma, S.; Kanatzidis, M.G. Highly Selective and Efficient Removal of Heavy Metals by Layered Double Hydroxide Intercalated with the MoS42− Ion. J. Am. Chem. Soc. 2016, 138, 2858–2866. [Google Scholar] [CrossRef]
  7. Ma, L.; Islam, S.M.; Liu, H.; Zhao, J.; Sun, G.; Li, H.; Ma, S.; Kanatzidis, M.G. Selective and Efficient Removal of Toxic Oxoanions of As(III), As(V), and Cr(VI) by Layered Double Hydroxide Intercalated with MoS42−. Chem. Mater. 2017, 29, 3274–3284. [Google Scholar] [CrossRef]
  8. Dotto, G.L.; Moura, J.M.; Cadaval, T.R.S.; Pinto, L.A.A. Application of Chitosan Films for the Removal of Food Dyes from Aqueous Solutions by Adsorption. Chem. Eng. J. 2013, 214, 8–16. [Google Scholar] [CrossRef]
  9. Dotto, G.L.; Lima, E.C.; Pinto, L.A.A. Biosorption of Food Dyes onto Spirulina Platensis Nanoparticles: Equilibrium Isotherm and Thermodynamic Analysis. Bioresour. Technol. 2012, 103, 123–130. [Google Scholar] [CrossRef] [PubMed] [Green Version]
  10. Zhou, Z.; Lin, S.; Yue, T.; Lee, T.-C. Adsorption of Food Dyes from Aqueous Solution by Glutaraldehyde Cross-Linked Magnetic Chitosan Nanoparticles. J. Food Eng. 2014, 126, 133–141. [Google Scholar] [CrossRef]
  11. Muniyandi, M.; Govindaraj, P.; Bharath Balji, G. Potential Removal of Methylene Blue Dye from Synthetic Textile Effluent Using Activated Carbon Derived from Palmyra (Palm) Shell. Mater. Today Proc. 2021, 47, 299–311. [Google Scholar] [CrossRef]
  12. Kasinathan, M.; Thiripuranthagan, S.; Sivakumar, A. Fabrication of Sphere-like Bi2MoO6/ZnO Composite Catalyst with Strong Photocatalytic Behavior for the Detoxification of Harmful Organic Dyes. Opt. Mater. 2020, 109, 110218. [Google Scholar] [CrossRef]
  13. Peng, Y.; Zhang, Y.; Tian, F.; Zhang, J.; Yu, J. Structure Tuning of Bi2MoO6 and Their Enhanced Visible Light Photocatalytic Performances. Crit. Rev. Solid State Mater. Sci. 2017, 42, 347–372. [Google Scholar] [CrossRef]
  14. Yu, H.; Jiang, L.; Wang, H.; Huang, B.; Yuan, X.; Huang, J.; Zhang, J.; Zeng Yu, G.H.; Jiang, L.; Wang, H.; et al. Modulation of Bi2MoO6-Based Materials for Photocatalytic Water Splitting and Environmental Application: A Critical Review. Small 2019, 15, 1901008. [Google Scholar] [CrossRef]
  15. Krishna Moorthy, A.; Govindarajan Rathi, B.; Shukla, S.P.; Kumar, K.; Shree Bharti, V. Acute Toxicity of Textile Dye Methylene Blue on Growth and Metabolism of Selected Freshwater Microalgae. Environ. Toxicol. Pharmacol. 2021, 82, 103552. [Google Scholar] [CrossRef]
  16. Yao, H.; You, X.-M.; Lin, Q.; Li, J.-J.; Guo, Y.; Wei, T.-B.; Zhang, Y.-M. Multi-Stimuli Responsive Metal-Organic Gel of Benzimidazol-Based Ligands with Lead Nitrate and Their Use in Removal of Dyes from Waste-Water. Chin. Chem. Lett. 2013, 24, 703–706. [Google Scholar] [CrossRef]
  17. Gokturk, S.; Kaluc, S. Removal of Selected Organic Compounds in Aqueous Solutions by Activated Carbon. J. Environ. Sci. Technol. 2008, 1, 111–123. [Google Scholar] [CrossRef] [Green Version]
  18. Zhang, J.; Shi, Q.; Zhang, C.; Xu, J.; Zhai, B.; Zhang, B. Adsorption of Neutral Red onto Mn-Impregnated Activated Carbons Prepared from Typha Orientalis. Bioresour. Technol. 2008, 99, 8974–8980. [Google Scholar] [CrossRef]
  19. Cheng, S.; Zhang, L.; Ma, A.; Xia, H.; Peng, J.; Li, C.; Shu, J. Comparison of Activated Carbon and Iron/Cerium Modified Activated Carbon to Remove Methylene Blue from Wastewater. J. Environ. Sci. 2018, 65, 92–102. [Google Scholar] [CrossRef]
  20. Merouani, S.; Hamdaoui, O.; Saoudi, F.; Chiha, M.; Pétrier, C. Influence of Bicarbonate and Carbonate Ions on Sonochemical Degradation of Rhodamine B in Aqueous Phase. J. Hazard. Mater. 2010, 175, 593–599. [Google Scholar] [CrossRef]
  21. Mailler, R.; Gasperi, J.; Coquet, Y.; Derome, C.; Buleté, A.; Vulliet, E.; Bressy, A.; Varrault, G.; Chebbo, G.; Rocher, V. Removal of Emerging Micropollutants from Wastewater by Activated Carbon Adsorption: Experimental Study of Different Activated Carbons and Factors Influencing the Adsorption of Micropollutants in Wastewater. J. Environ. Chem. Eng. 2016, 4, 1102–1109. [Google Scholar] [CrossRef] [Green Version]
  22. Abramian, L.; El-Rassy, H. Adsorption Kinetics and Thermodynamics of Azo-Dye Orange II onto Highly Porous Titania Aerogel. Chem. Eng. J. 2009, 150, 403–410. [Google Scholar] [CrossRef]
  23. Cechinel, M.A.P.; Ulson De Souza, S.M.A.G.; Ulson De Souza, A.A. Study of Lead (II) Adsorption onto Activated Carbon Originating from Cow Bone. J. Clean. Prod. 2014, 65, 342–349. [Google Scholar] [CrossRef]
  24. Loganathan, P.; Vigneswaran, S.; Kandasamy, J. Enhanced Removal of Nitrate from Water Using Surface Modification of Adsorbents—A Review. J. Environ. Manag. 2013, 131, 363–374. [Google Scholar] [CrossRef] [PubMed]
  25. Shah, S.S.; Ahmad, I.; Ahmad, W.; Ishaq, M.; Gul, K.; Khan, R.; Khan, H. Study on Adsorptive Capability of Acid Activated Charcoal for Desulphurization of Model and Commercial Fuel Oil Samples. J. Environ. Chem. Eng. 2018, 6, 4037–4043. [Google Scholar] [CrossRef] [Green Version]
  26. Shah, S.S.; Ahmad, I.; Ahmad, W.; Ishaq, M.; Khan, H. Deep Desulphurization Study of Liquid Fuels Using Acid Treated Activated Charcoal as Adsorbent. Energy Fuels 2017, 31, 7867–7873. [Google Scholar] [CrossRef]
  27. Shah, S.S.; Ahmad, I.; Ahmad, W. Adsorptive Desulphurization Study of Liquid Fuels Using Tin (Sn) Impregnated Activated Charcoal. J. Hazard. Mater. 2016, 304, 205–213. [Google Scholar] [CrossRef] [Green Version]
  28. Spagnol, C.; Rodrigues, F.H.A.; Pereira, A.G.B.; Fajardo, A.R.; Rubira, A.F.; Muniz, E.C. Superabsorbent Hydrogel Nanocomposites Based on Starch-g-Poly(Sodium Acrylate) Matrix Filled with Cellulose Nanowhiskers. Cellulose 2012, 19, 1225–1237. [Google Scholar] [CrossRef]
  29. Tanan, W.; Panichpakdee, J.; Saengsuwan, S. Novel Biodegradable Hydrogel Based on Natural Polymers: Synthesis, Characterization, Swelling/Reswelling and Biodegradability. Eur. Polym. J. 2019, 112, 678–687. [Google Scholar] [CrossRef]
  30. Alam, A.; Zhang, Y.; Kuan, H.C.; Lee, S.H.; Ma, J. Polymer Composite Hydrogels Containing Carbon Nanomaterials—Morphology and Mechanical and Functional Performance. Prog. Polym. Sci. 2018, 77, 1–18. [Google Scholar] [CrossRef]
  31. Ferreira, S.L.C.; Dos Santos, W.N.L.; Quintella, C.M.; Neto, B.B.; Bosque-Sendra, J.M. Doehlert Matrix: A Chemometric Tool for Analytical Chemistry—Review. Talanta 2004, 63, 1061–1067. [Google Scholar] [CrossRef] [PubMed]
  32. Bansal, R.C.; Goyal, M. Activated Carbon Adsorption; CRC Press Inc.: Boca Raton, FL, USA, 2005. [Google Scholar]
  33. Thakur, S.; Arotiba, O.A. Synthesis, Swelling and Adsorption Studies of a PH-Responsive Sodium Alginate–Poly(Acrylic Acid) Superabsorbent Hydrogel. Polym. Bull. 2018, 75, 4587–4606. [Google Scholar] [CrossRef]
  34. Kong, Y.; Zhuang, Y.; Han, Z.; Yu, J.; Shi, B.; Han, K.; Hao, H. Dye Removal by Eco-Friendly Physically Cross-Linked Double Network Polymer Hydrogel Beads and Their Functionalized Composites. J. Environ. Sci. 2019, 78, 81–91. [Google Scholar] [CrossRef] [PubMed]
  35. Momina; Mohammad, S.; Suzylawati, I. Study of the Adsorption/Desorption of MB Dye Solution Using Bentonite Adsorbent Coating. J. Water Process Eng. 2020, 34, 101155. [Google Scholar] [CrossRef]
  36. Pathania, D.; Sharma, S.; Singh, P. Removal of Methylene Blue by Adsorption onto Activated Carbon Developed from Ficus Carica Bast. Arab. J. Chem. 2017, 10, S1445–S1451. [Google Scholar] [CrossRef] [Green Version]
  37. Alver, E.; Metin, A.Ü.; Brouers, F. Methylene Blue Adsorption on Magnetic Alginate/Rice Husk Bio-Composite. Int. J. Biol. Macromol. 2020, 154, 104–113. [Google Scholar] [CrossRef] [PubMed]
  38. Shah, S.S.; Jamroz, N.U.; Sharif, Q.M. Micellization Parameters and Electrostatic Interactions in Micellar Solution of Sodium Dodecyl Sulfate (SDS) at Different Temperatures. Colloids Surfaces A Physicochem. Eng. Asp. 2001, 178, 199–206. [Google Scholar] [CrossRef]
  39. Ravi; Pandey, L.M. Enhanced Adsorption Capacity of Designed Bentonite and Alginate Beads for the Effective Removal of Methylene Blue. Appl. Clay Sci. 2019, 169, 102–111. [Google Scholar] [CrossRef]
  40. Saito, H.; Taguchi, T.; Aoki, H.; Murabayashi, S.; Mitamura, Y.; Tanaka, J.; Tateishi, T. PH-Responsive Swelling Behavior of Collagen Gels Prepared by Novel Crosslinkers Based on Naturally Derived Di- or Tricarboxylic Acids. Acta Biomater. 2007, 3, 89–94. [Google Scholar] [CrossRef]
  41. Khare, A.R.; Peppas, N.A. Swelling/Deswelling of Anionic Copolymer Gels. Biomaterials 1995, 16, 559–567. [Google Scholar] [CrossRef]
  42. He, G.; Ke, W.; Chen, X.; Kong, Y.; Zheng, H.; Yin, Y.; Cai, W. Preparation and Properties of Quaternary Ammonium Chitosan-g-Poly(Acrylic Acid-Co-Acrylamide) Superabsorbent Hydrogels. React. Funct. Polym. 2017, 111, 14–21. [Google Scholar] [CrossRef]
  43. Sanati, A.M.; Kamari, S.; Ghorbani, F. Application of Response Surface Methodology for Optimization of Cadmium Adsorption from Aqueous Solutions by Fe3O4@SiO2@APTMS Core–Shell Magnetic Nanohybrid. Surf. Interfaces 2019, 17, 100374. [Google Scholar] [CrossRef]
  44. Lei, C.; Bian, Y.; Zhi, F.; Hou, X.; Lv, C.; Hu, Q. Enhanced Adsorption Capacity of Cellulose Hydrogel Based on Corn Stalk for Pollutants Removal and Mechanism Exploration. J. Clean. Prod. 2022, 375, 134130. [Google Scholar] [CrossRef]
  45. Hosseini, H.; Zirakjou, A.; McClements, D.J.; Goodarzi, V.; Chen, W.H. Removal of Methylene Blue from Wastewater Using Ternary Nanocomposite Aerogel Systems: Carboxymethyl Cellulose Grafted by Polyacrylic Acid and Decorated with Graphene Oxide. J. Hazard. Mater. 2022, 421, 126752. [Google Scholar] [CrossRef]
  46. Dai, H.; Zhang, Y.; Ma, L.; Zhang, H.; Huang, H. Synthesis and Response of Pineapple Peel Carboxymethyl Cellulose-g-Poly (Acrylic Acid-Co-Acrylamide)/Graphene Oxide Hydrogels. Carbohydr. Polym. 2019, 215, 366–376. [Google Scholar] [CrossRef]
  47. Somsesta, N.; Sricharoenchaikul, V.; Aht-Ong, D. Adsorption Removal of Methylene Blue onto Activated Carbon/Cellulose Biocomposite Films: Equilibrium and Kinetic Studies. Mater. Chem. Phys. 2020, 240, 122221. [Google Scholar] [CrossRef]
  48. Tan, I.A.W.; Hameed, B.H.; Ahmad, A.L. Equilibrium and Kinetic Studies on Basic Dye Adsorption by Oil Palm Fibre Activated Carbon. Chem. Eng. J. 2007, 127, 111–119. [Google Scholar] [CrossRef]
  49. Ho, Y.S.; McKay, G. Sorption of Dye from Aqueous Solution by Peat. Chem. Eng. J. 1998, 70, 115–124. [Google Scholar] [CrossRef]
  50. Junlapong, K.; Maijan, P.; Chaibundit, C.; Chantarak, S. Effective Adsorption of Methylene Blue by Biodegradable Superabsorbent Cassava Starch-Based Hydrogel. Int. J. Biol. Macromol. 2020, 158, 258–264. [Google Scholar] [CrossRef]
  51. Wang, W.; Ni, J.; Chen, L.; Ai, Z.; Zhao, Y.; Song, S. Synthesis of Carboxymethyl Cellulose-Chitosan-Montmorillonite Nanosheets Composite Hydrogel for Dye Effluent Remediation. Int. J. Biol. Macromol. 2020, 165, 1–10. [Google Scholar] [CrossRef]
  52. Makhado, E.; Pandey, S.; Modibane, K.D.; Kang, M.; Hato, M.J. Sequestration of Methylene Blue Dye Using Sodium Alginate Poly(Acrylic Acid)@ZnO Hydrogel Nanocomposite: Kinetic, Isotherm, and Thermodynamic Investigations. Int. J. Biol. Macromol. 2020, 162, 60–73. [Google Scholar] [CrossRef] [PubMed]
  53. Binma-ae, H.; Prasertsan, P.; Choorit, W. Preparation and Characterization of Biopolymers Recovered from Palm Oil Mill Effluent and Their Complex Hydrogels Compared to Commercial Xylan. Waste Biomass Valoriz. 2020, 11, 5109–5121. [Google Scholar] [CrossRef]
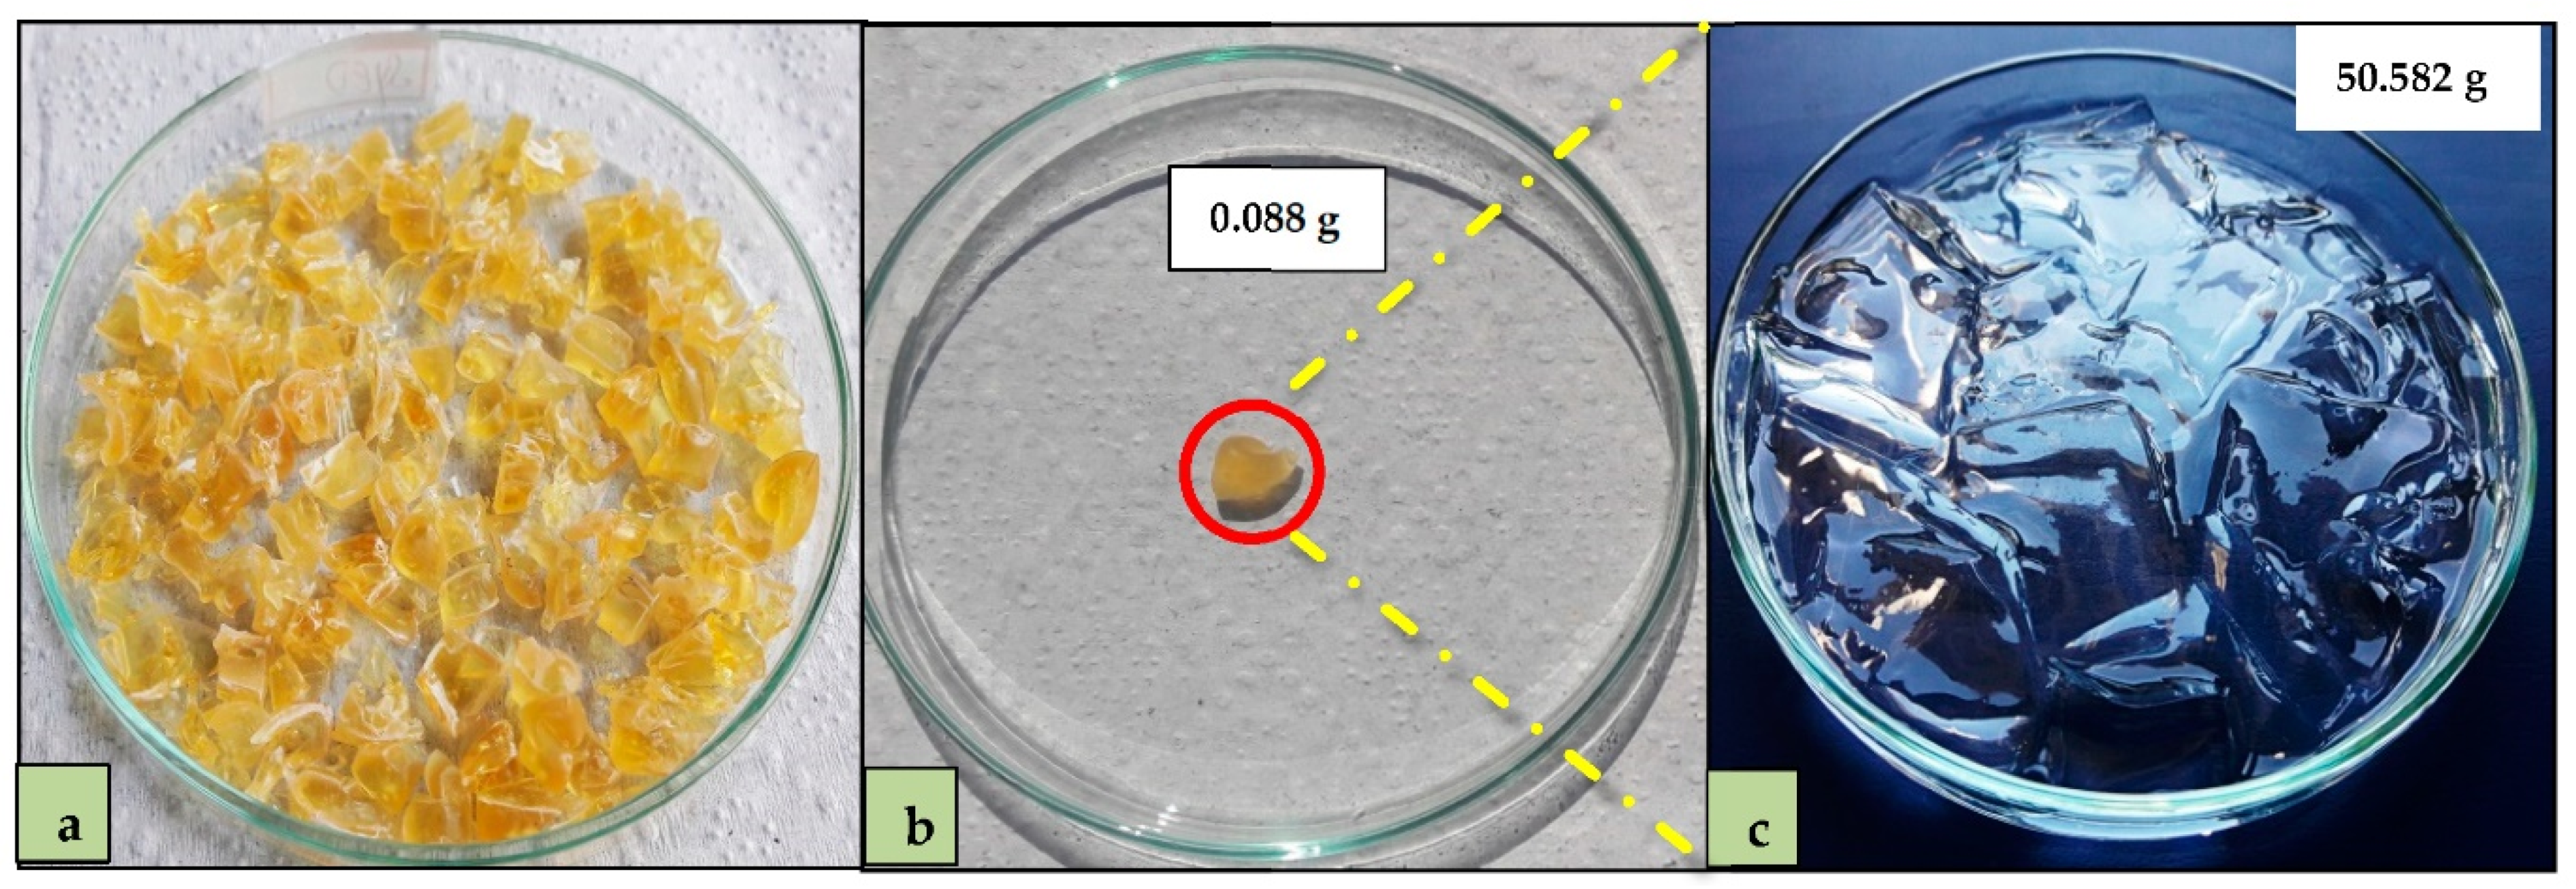
Figure 1. Alginate-acrylic SAP (a) after drying and cutting (b) a small piece for swelling test and (c) hydrogel after 24 h in water.
Water 14 03313 g001
Figure 2. Composite SAP-AC (a) 2 wt% and (b) 5 wt% by solution mixing and (c) freshly prepared SAP-AC (2 wt%) and (d) dried SAP-AC by infiltration method.
Water 14 03313 g002
Figure 3. SAP-AC hydrogel after 24 h (a) in water and (b) in 50 ppm MB solution.
Water 14 03313 g003
Figure 4. MB adsorption as a function of time at pH 6.0 and 37.5 °C using (a) SAP and (b) SAP-AC as adsorbents.
Water 14 03313 g004
Figure 5. MB adsorption as a function of time at 37.5 °C using (a) SAP and (b) SAP-AC as adsorbents.
Water 14 03313 g005
Figure 6. MB adsorption as a function of time at (a) 25 °C and (b) 50 °C using SAP and at (c) 25 °C and (d) 50 °C using SAP-AC as adsorbent.
Water 14 03313 g006
Figure 7. MB adsorption capacity as a function of time at (a) pH 4.0 and (b) pH 8.0 using SAP and at (c) pH 4.0 and (d) pH 8.0 using SAP-AC as adsorbent.
Water 14 03313 g007
Figure 8. Comparison of various reaction parameters using SAP and SAP-AC for (a) percent MB adsorption and (b) swelling ratio.
Water 14 03313 g008
Figure 9. Response surface for the percent adsorption removal of MB by SAP after 24 h of continuous recirculation. (a) Contour plot of adsorption as a function of pH and temperature; (b) Pareto chart of standardized effect estimates; and (c) residual plot showing observed vs. predicted values. (CMB,0 = 50 ppm; V = 300 mL; mSAP,0 = 70 mg.).
Water 14 03313 g009
Figure 10. Response surface for the percent adsorption removal of MB by SAP-AC after 24 h of continuous recirculation. (a) Contour plot of adsorption as a function of pH and temperature; (b) Pareto chart of standardized effect estimates; and (c) residual plot showing observed vs. predicted values. (CMB,0 = 50 ppm; V = 300 mL; mSAP-AC,0 = 70 mg.).
Water 14 03313 g010
Figure 11. MB adsorption as a function of time. (a) Adsorption capacity and (b) percent adsorption using 100 ppm, and (c) adsorption capacity and (d) percent adsorption using 200 ppm initial concentration.
Water 14 03313 g011
Figure 12. MB adsorption kinetics: (a) pseudo first-order and (b) pseudo second-order using SAP, and (c) pseudo first-order and (d) pseudo second-order using SAP-AC as adsorbent.
Water 14 03313 g012
Figure 13. MB adsorption isotherms (a) Langmuir and (b) Freundlich model using SAP and (c) Langmuir and (d) Freundlich model using SAP-AC as adsorbent.
Water 14 03313 g013
Figure 14. SEM micrographs of (a) SAP before MB adsorption, (b) SAP after MB adsorption, (c) SAP-AC before MB adsorption, and (d) SAP-AC after MB adsorption.
Water 14 03313 g014
Figure 15. XRD pattern of SAP and its composite.
Water 14 03313 g015
Figure 16. FTIR spectra of the synthesized SAP and SAP-AC hydrogels.
Water 14 03313 g016
Table 1. Doehlert design for two factors.
Coded Values Real Values
Exp. no.pHTemperature (°C)Exp. no.pHTemperature (°C)
10016.0037.5
1 rep. 1001 rep. 16.0037.5
1 rep. 2001 rep. 26.0037.5
210210.0037.5
30.50.86638.0050.0
4−1042.0037.5
5−0.5−0.86654.0025.0
6−0.50.86664.0050.0
70.5−0.86678.0025.0
Table 2. Comparison of MB adsorption capacities on different adsorbents.
S. no.AdsorbentInitial MB conc.
(mg L−1)
MB Adsorption Capacity
(mg g−1)
Ref.
1.Sodium alginate/cellulose100328.36[44]
2.Carboxymethylcellulose/PAA */GO *100138.4[45]
3.* PCMC/AA/acrylamide/GO200133.32[46]
4.Cellulose/activated carbon100103.66[47]
5.SAP-AC50213.2Current study
6.SAP-AC100399.03Current study
7.SAP-AC200736.75Current study
* PAA = Polyacrylic acid, GO = Graphene oxide, PCMC = Pineapple peel carboxymethyl cellulose.
Table 3. Kinetic parameters for MB adsorption on SAP and SAP-AC as adsorbents.
SAPSAP-AC
Pseudo first-order parametersPseudo second-order parametersPseudo first-order parametersPseudo second-order parameters
qe (mg g−1)118.62qe (mg g−1)208.33qe (mg g−1)87.32qe (mg g−1)216.45
K1 (min−1)0.007K2 (mg g−1 min−1)0.0023K1 (min−1)0.0082K2 (mg g−1 min−1)0.0038
R20.986R20.994R20.976R20.999
Table 4. Isotherm parameters of MB adsorption on SAP and SAP-AC as adsorbents.
SAPSAP-AC
Langmuir isotherm parametersFreundlich isotherm parametersLangmuir isotherm parametersFreundlich isotherm parameters
qm (mg g−1)114.94n1.291qm (mg g−1)917.43n2.146
KL0.435KF54.82KL0.227KF205.54
R20.978R20.994R20.965R20.999
Publisher’s Note: MDPI stays neutral with regard to jurisdictional claims in published maps and institutional affiliations.