3.1. Hydraulic Evaluation
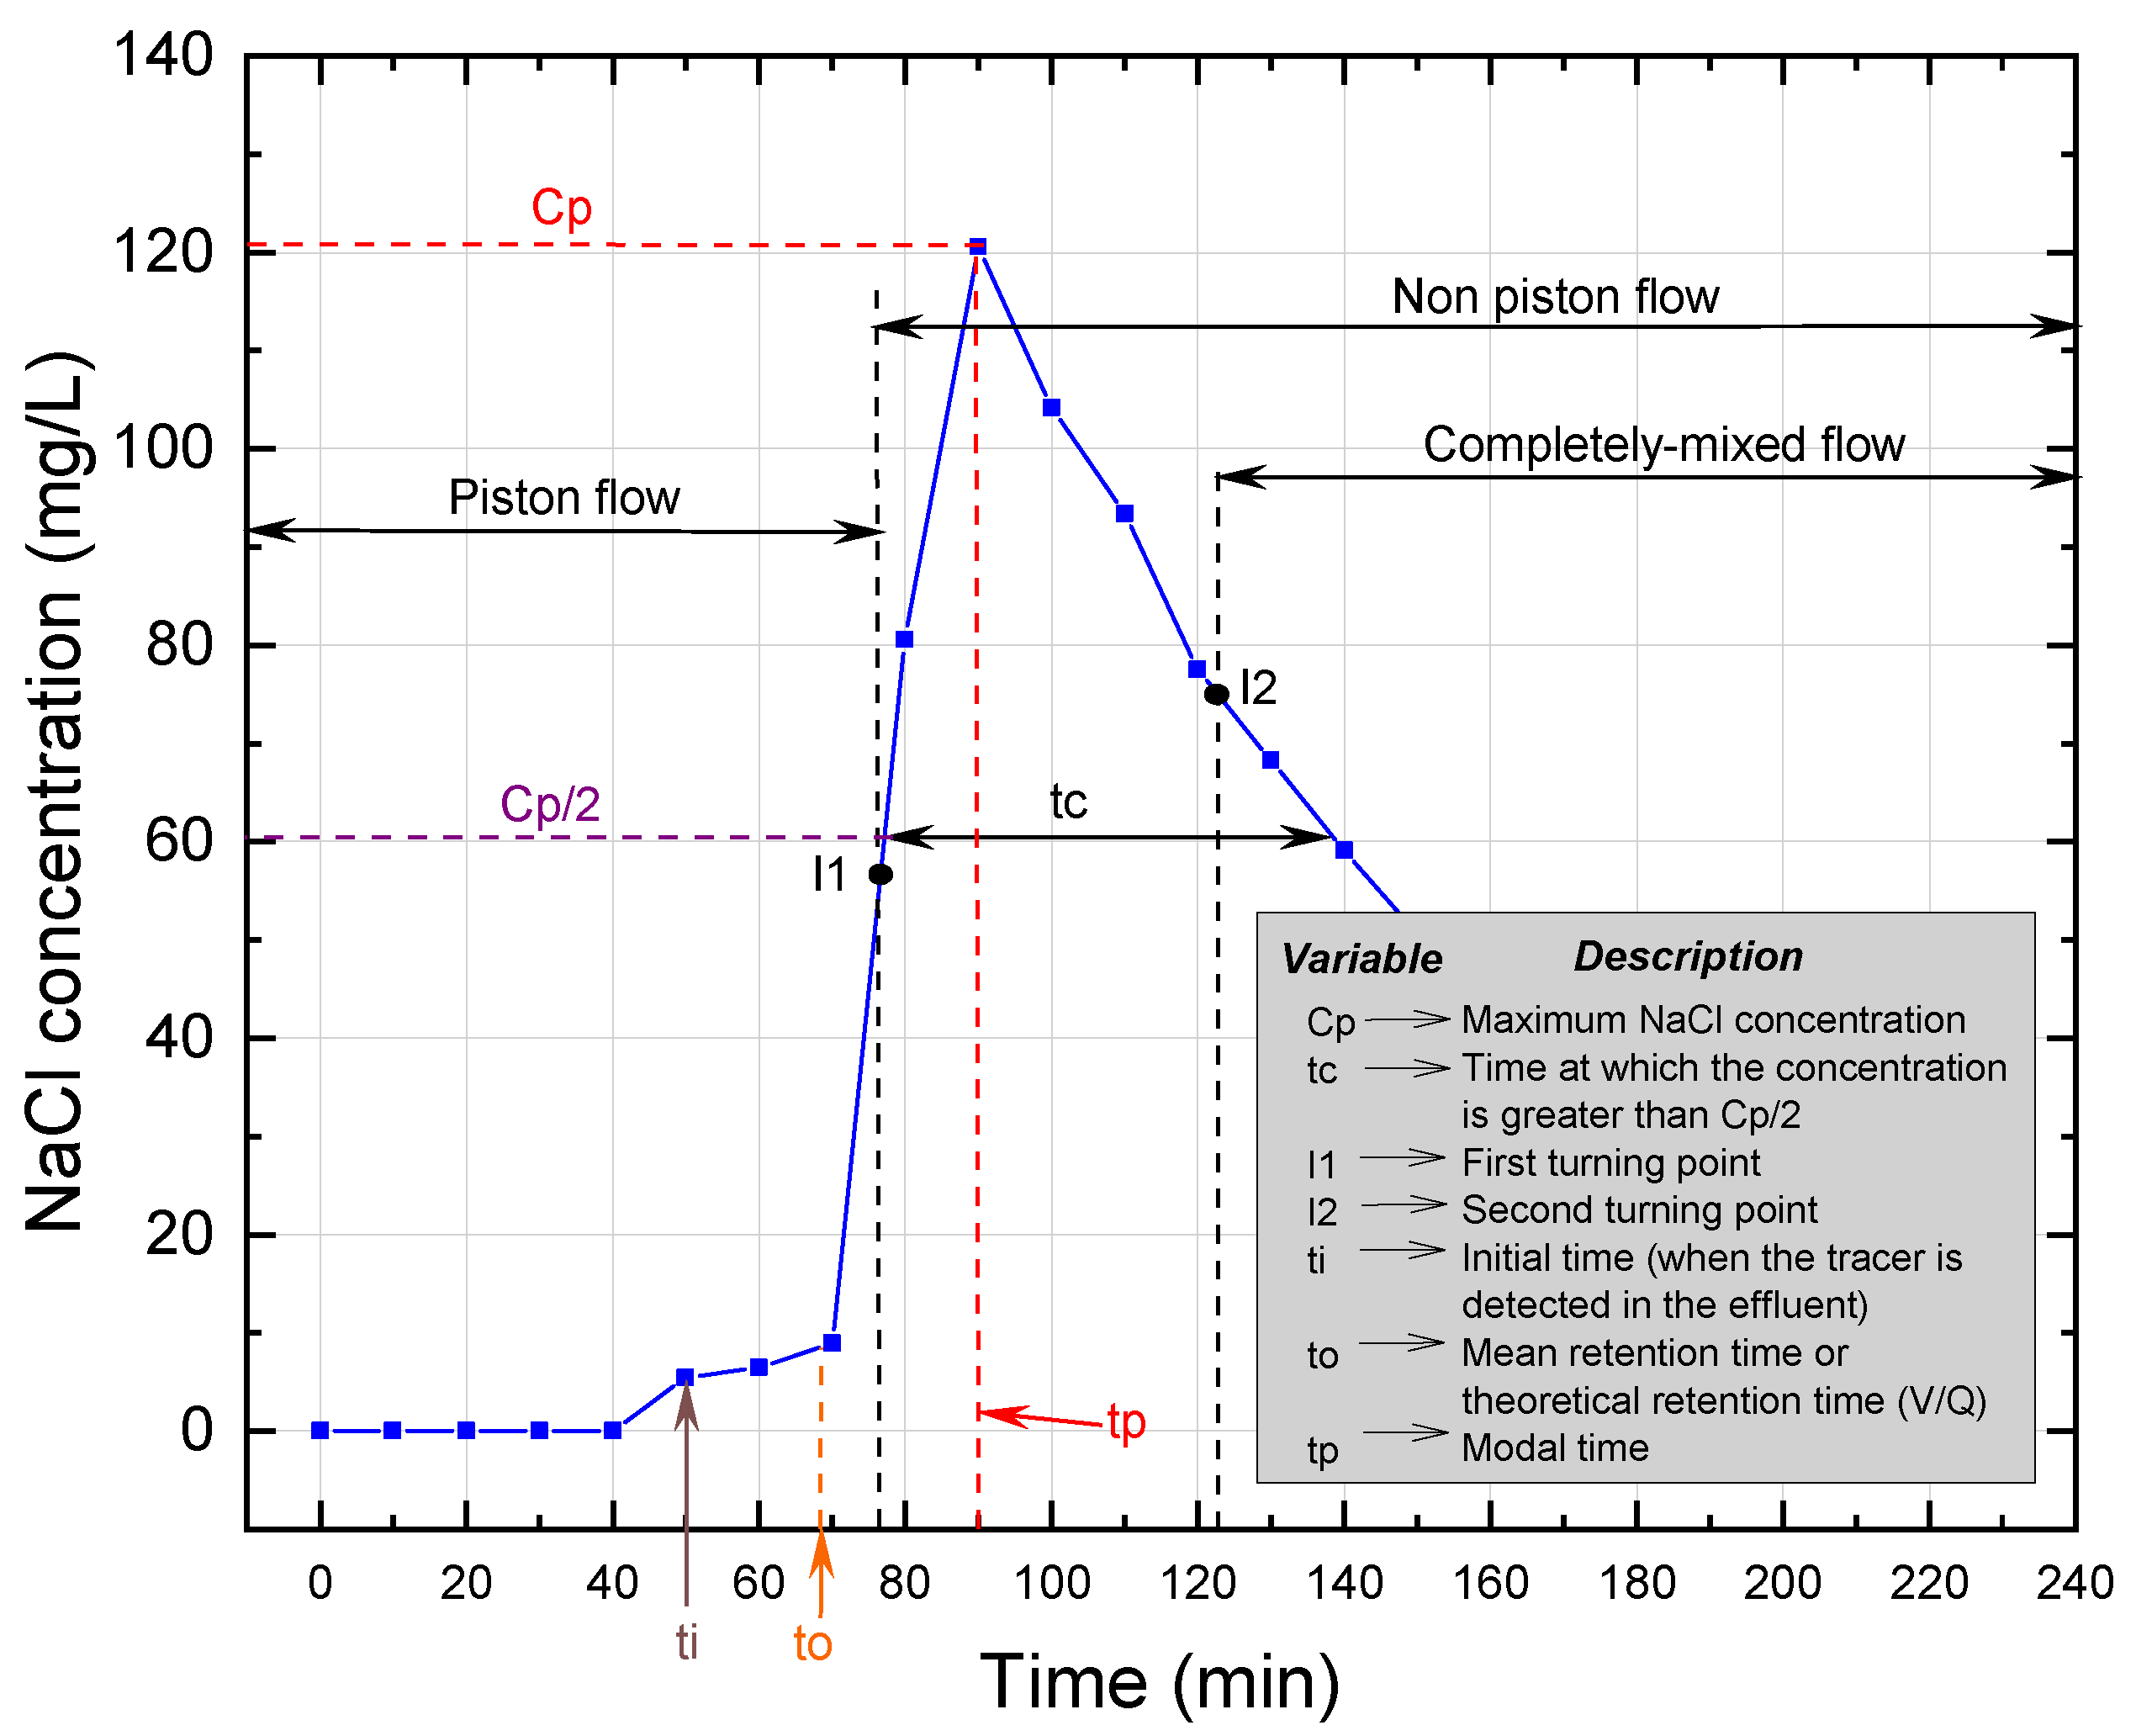
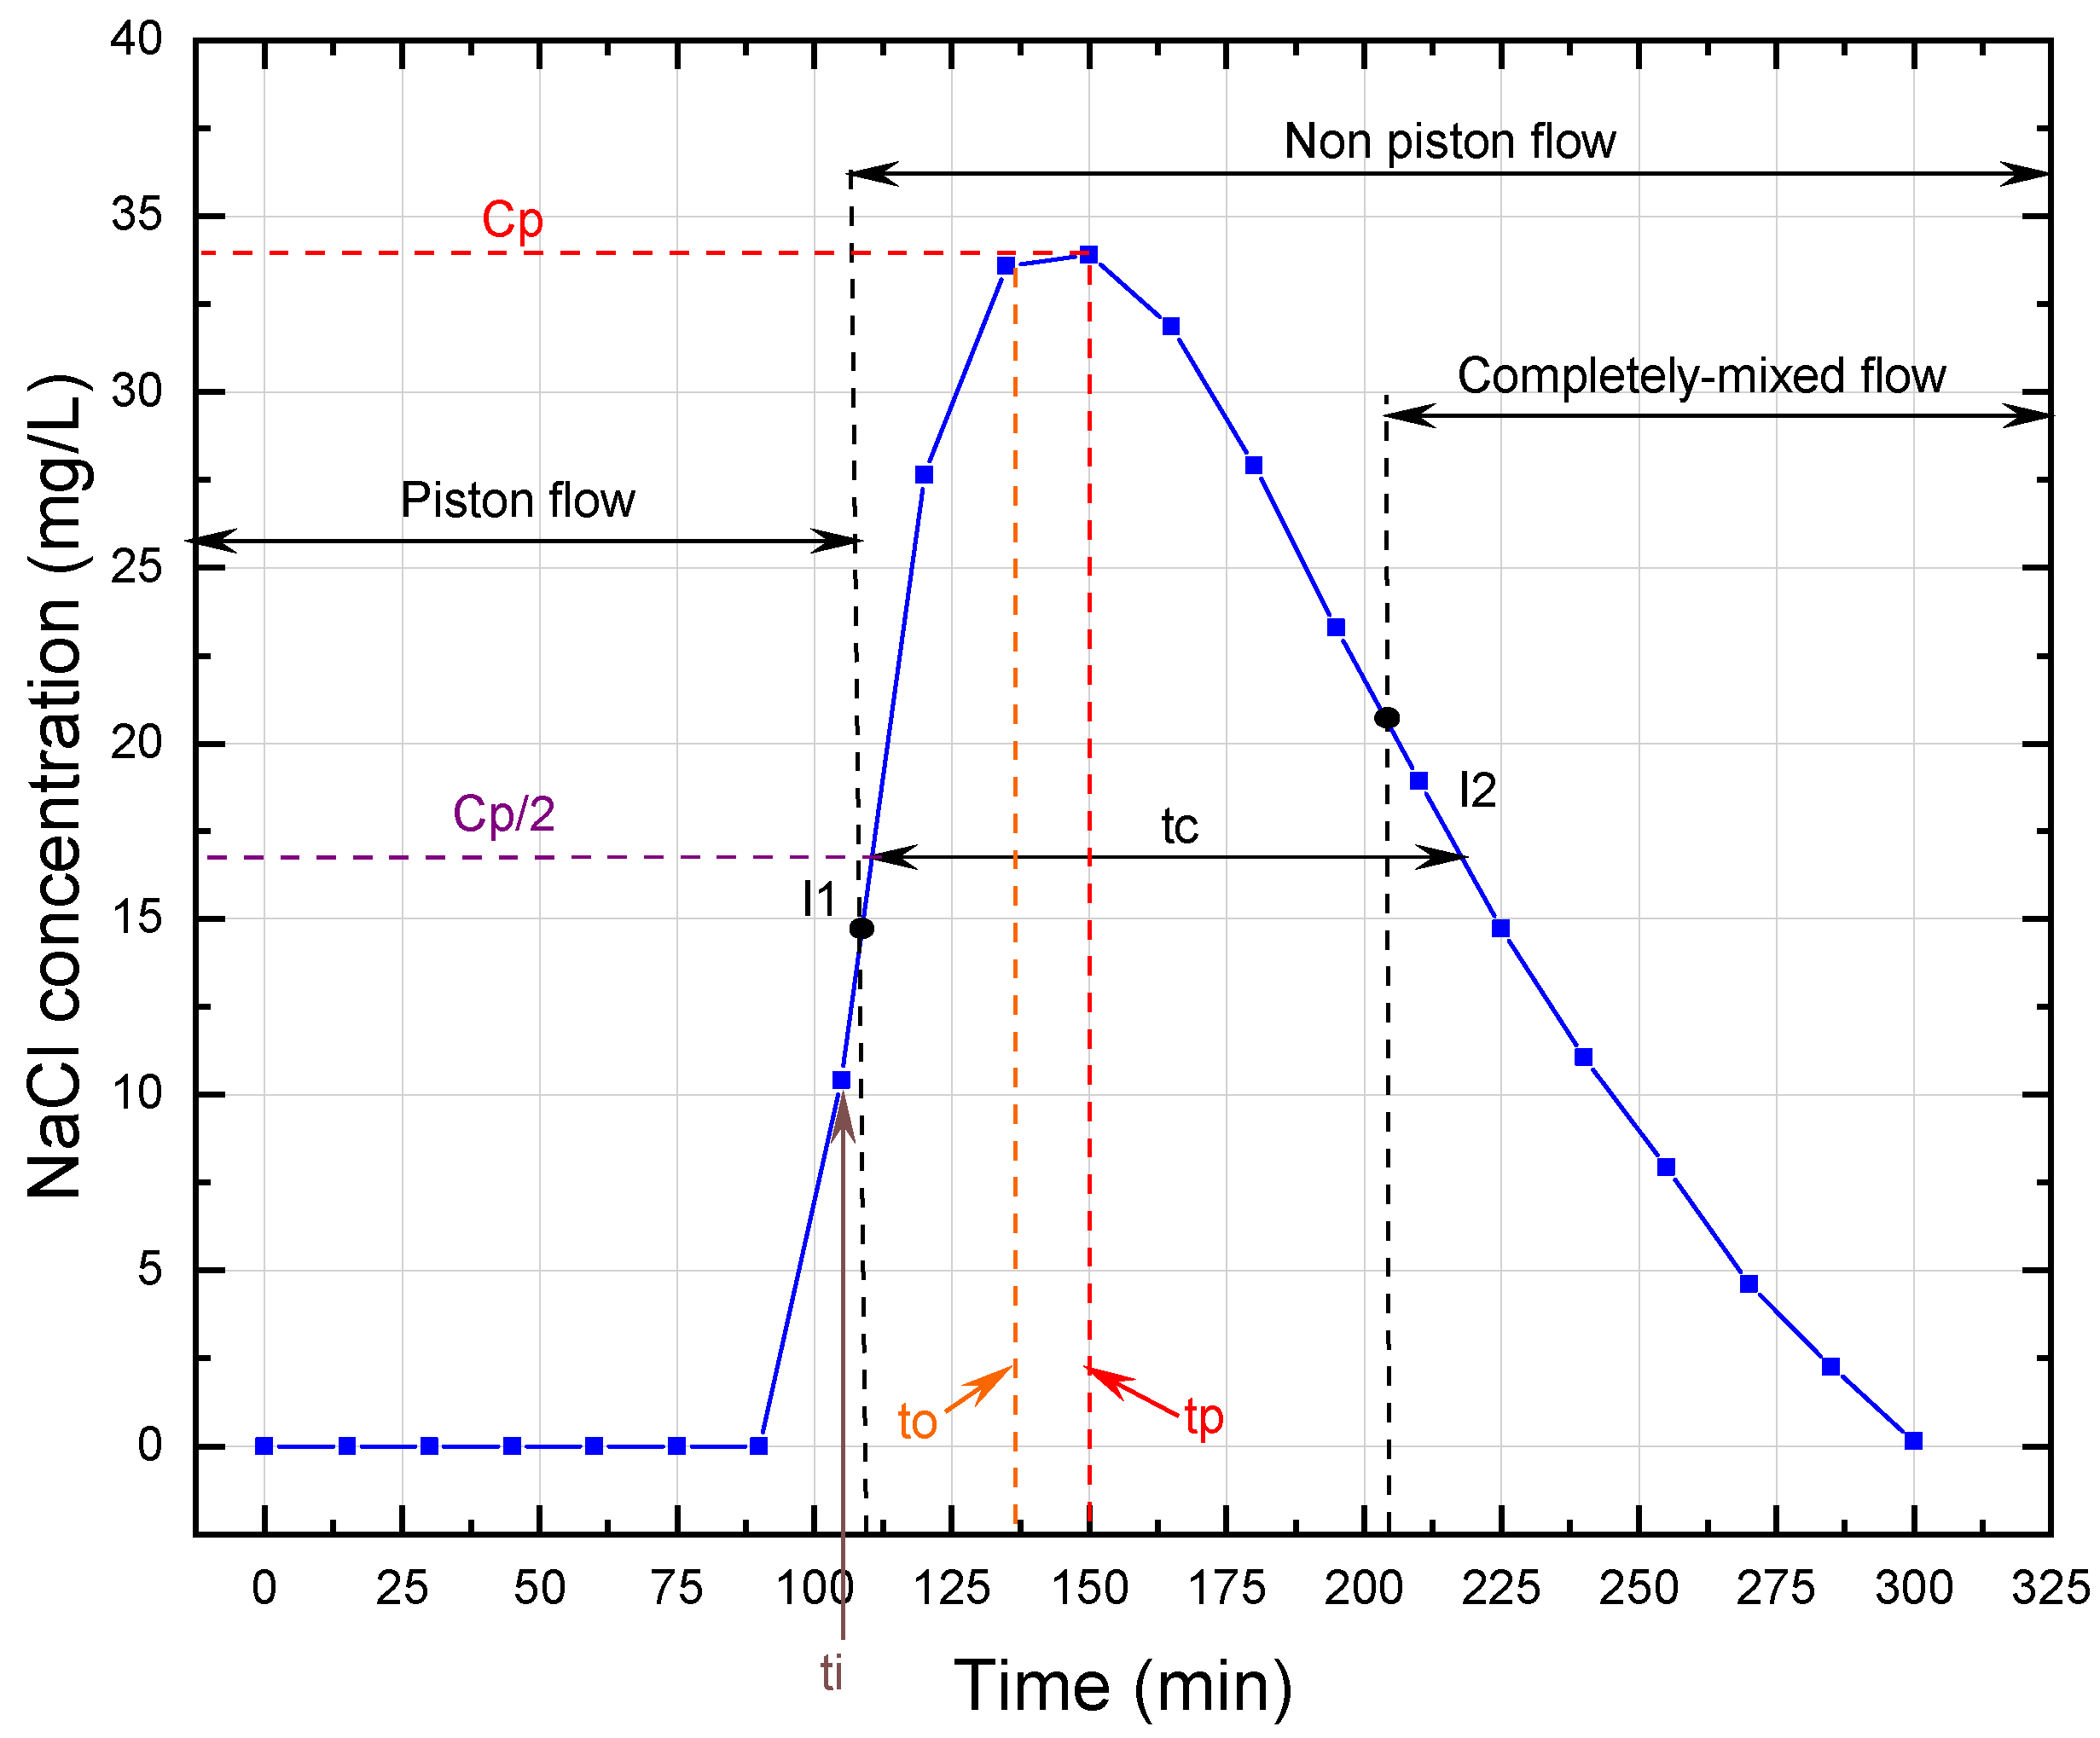
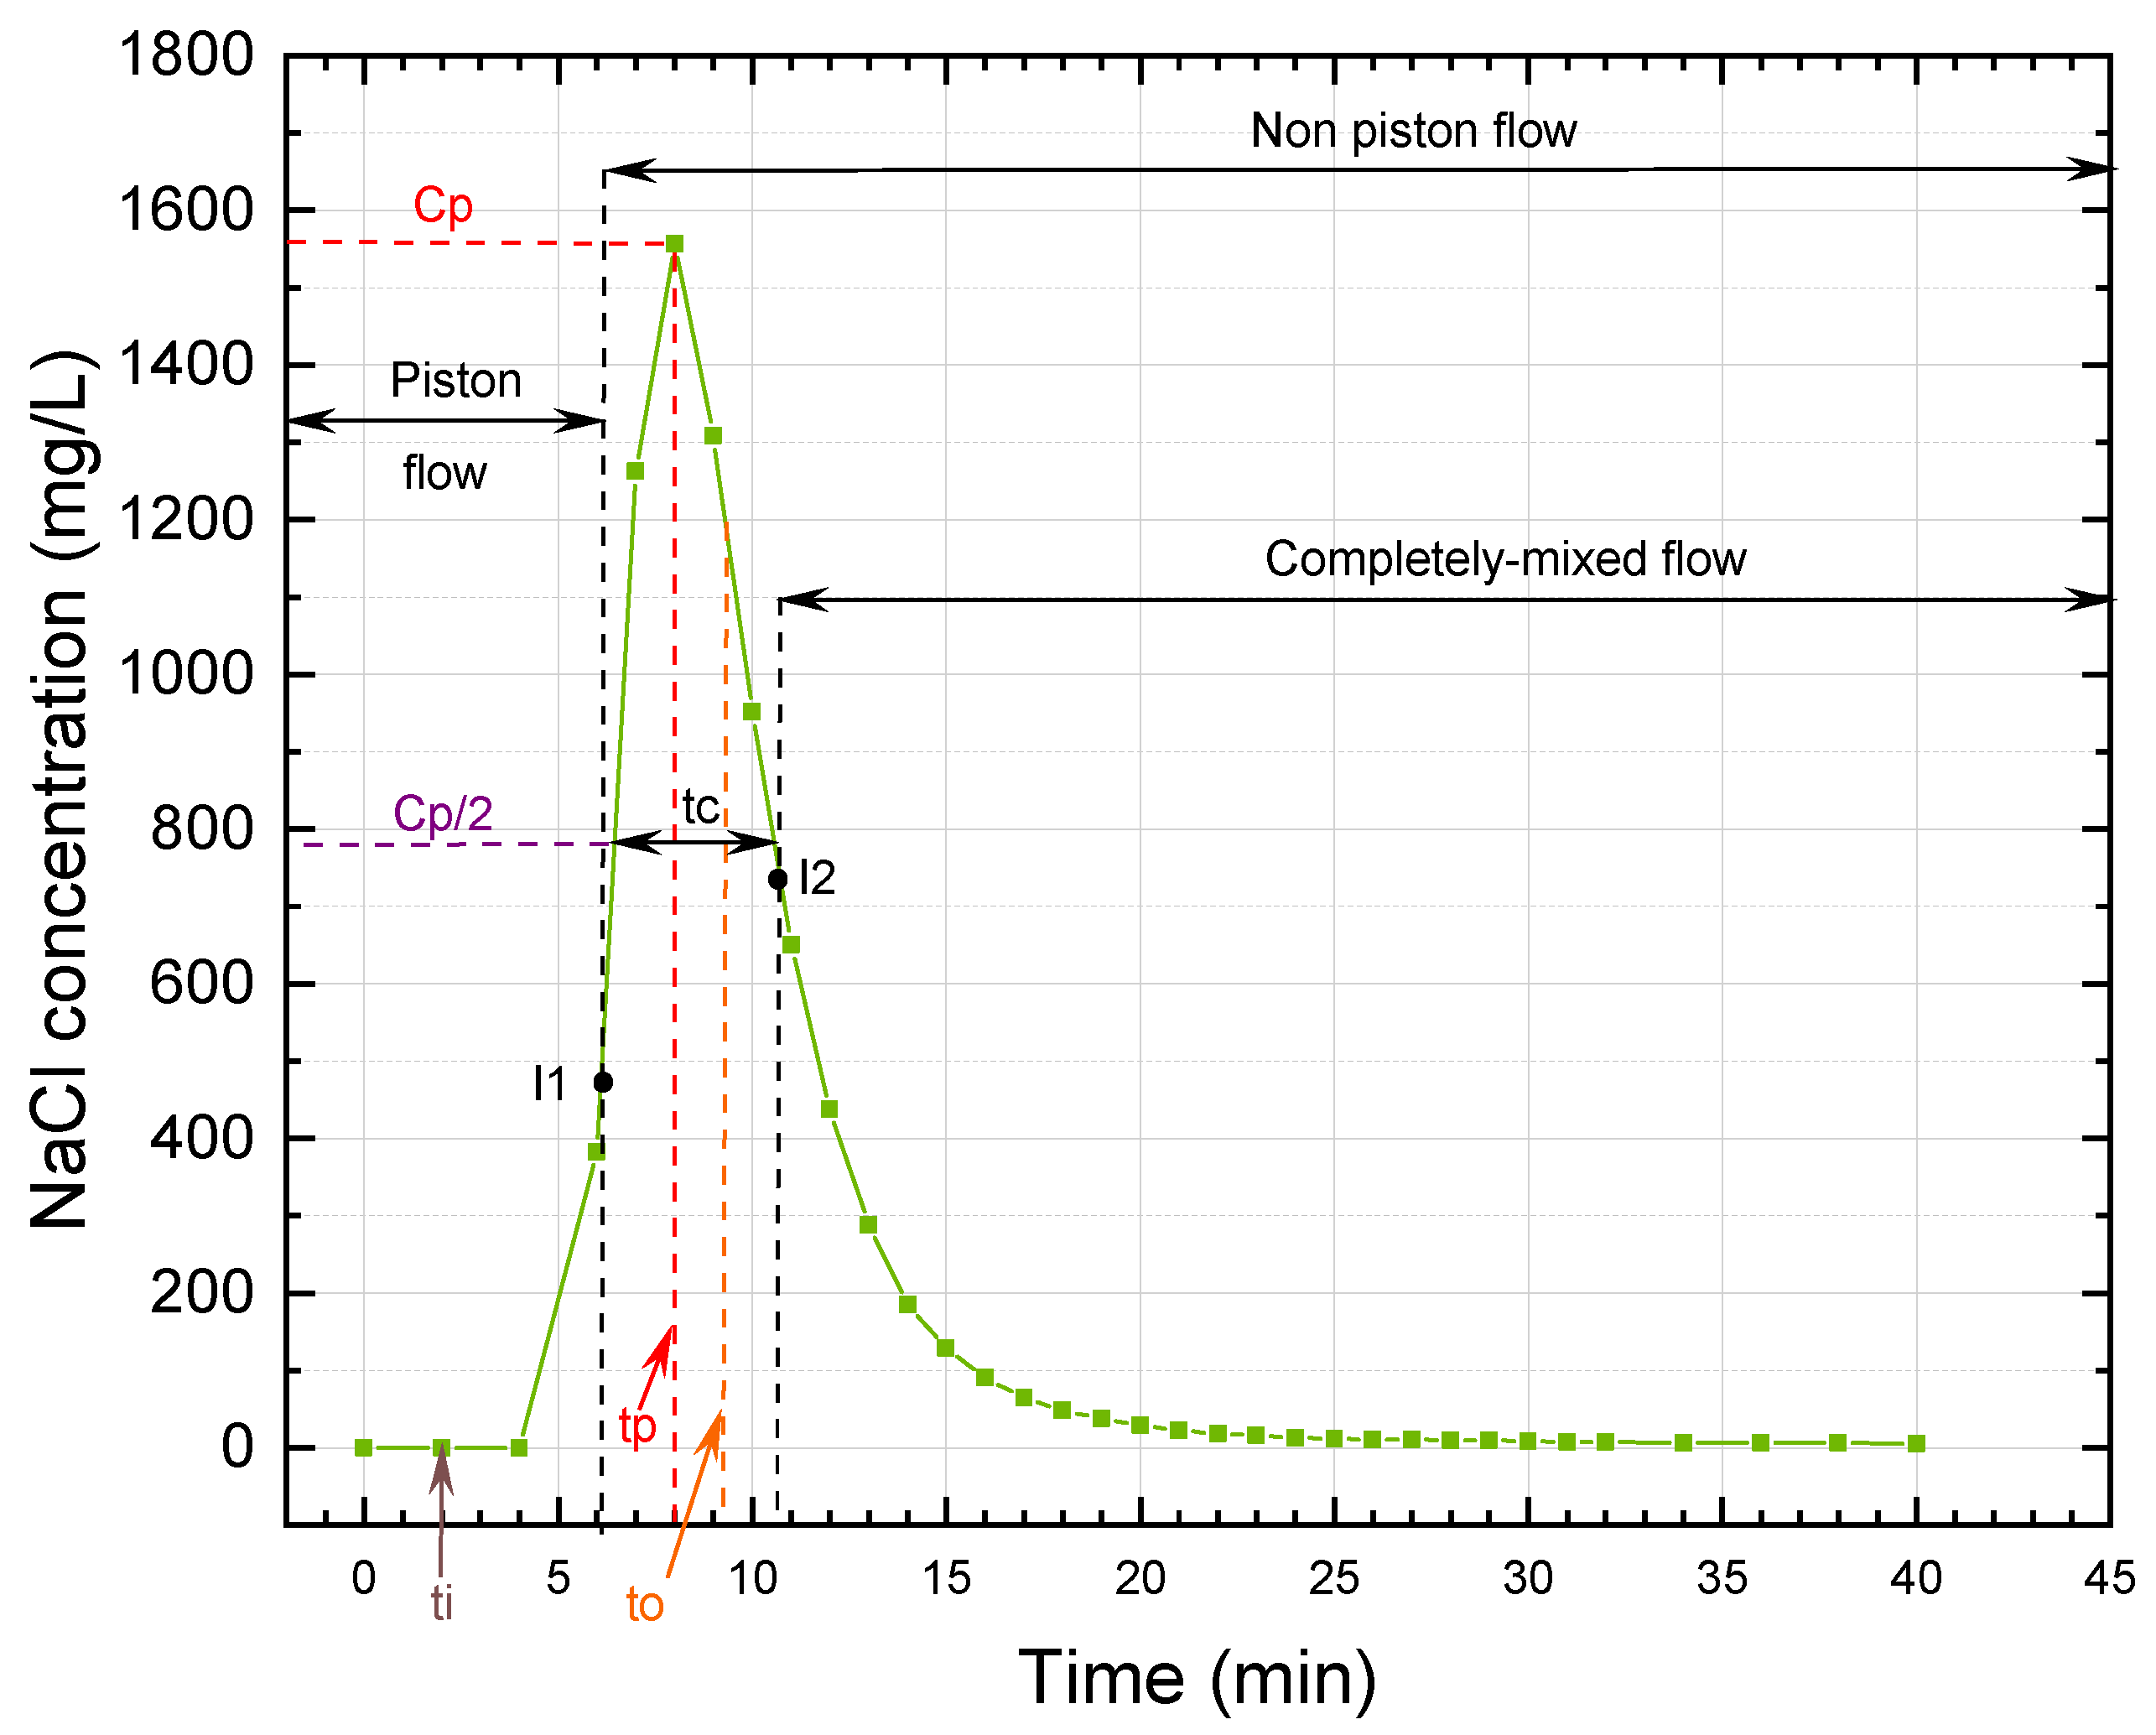
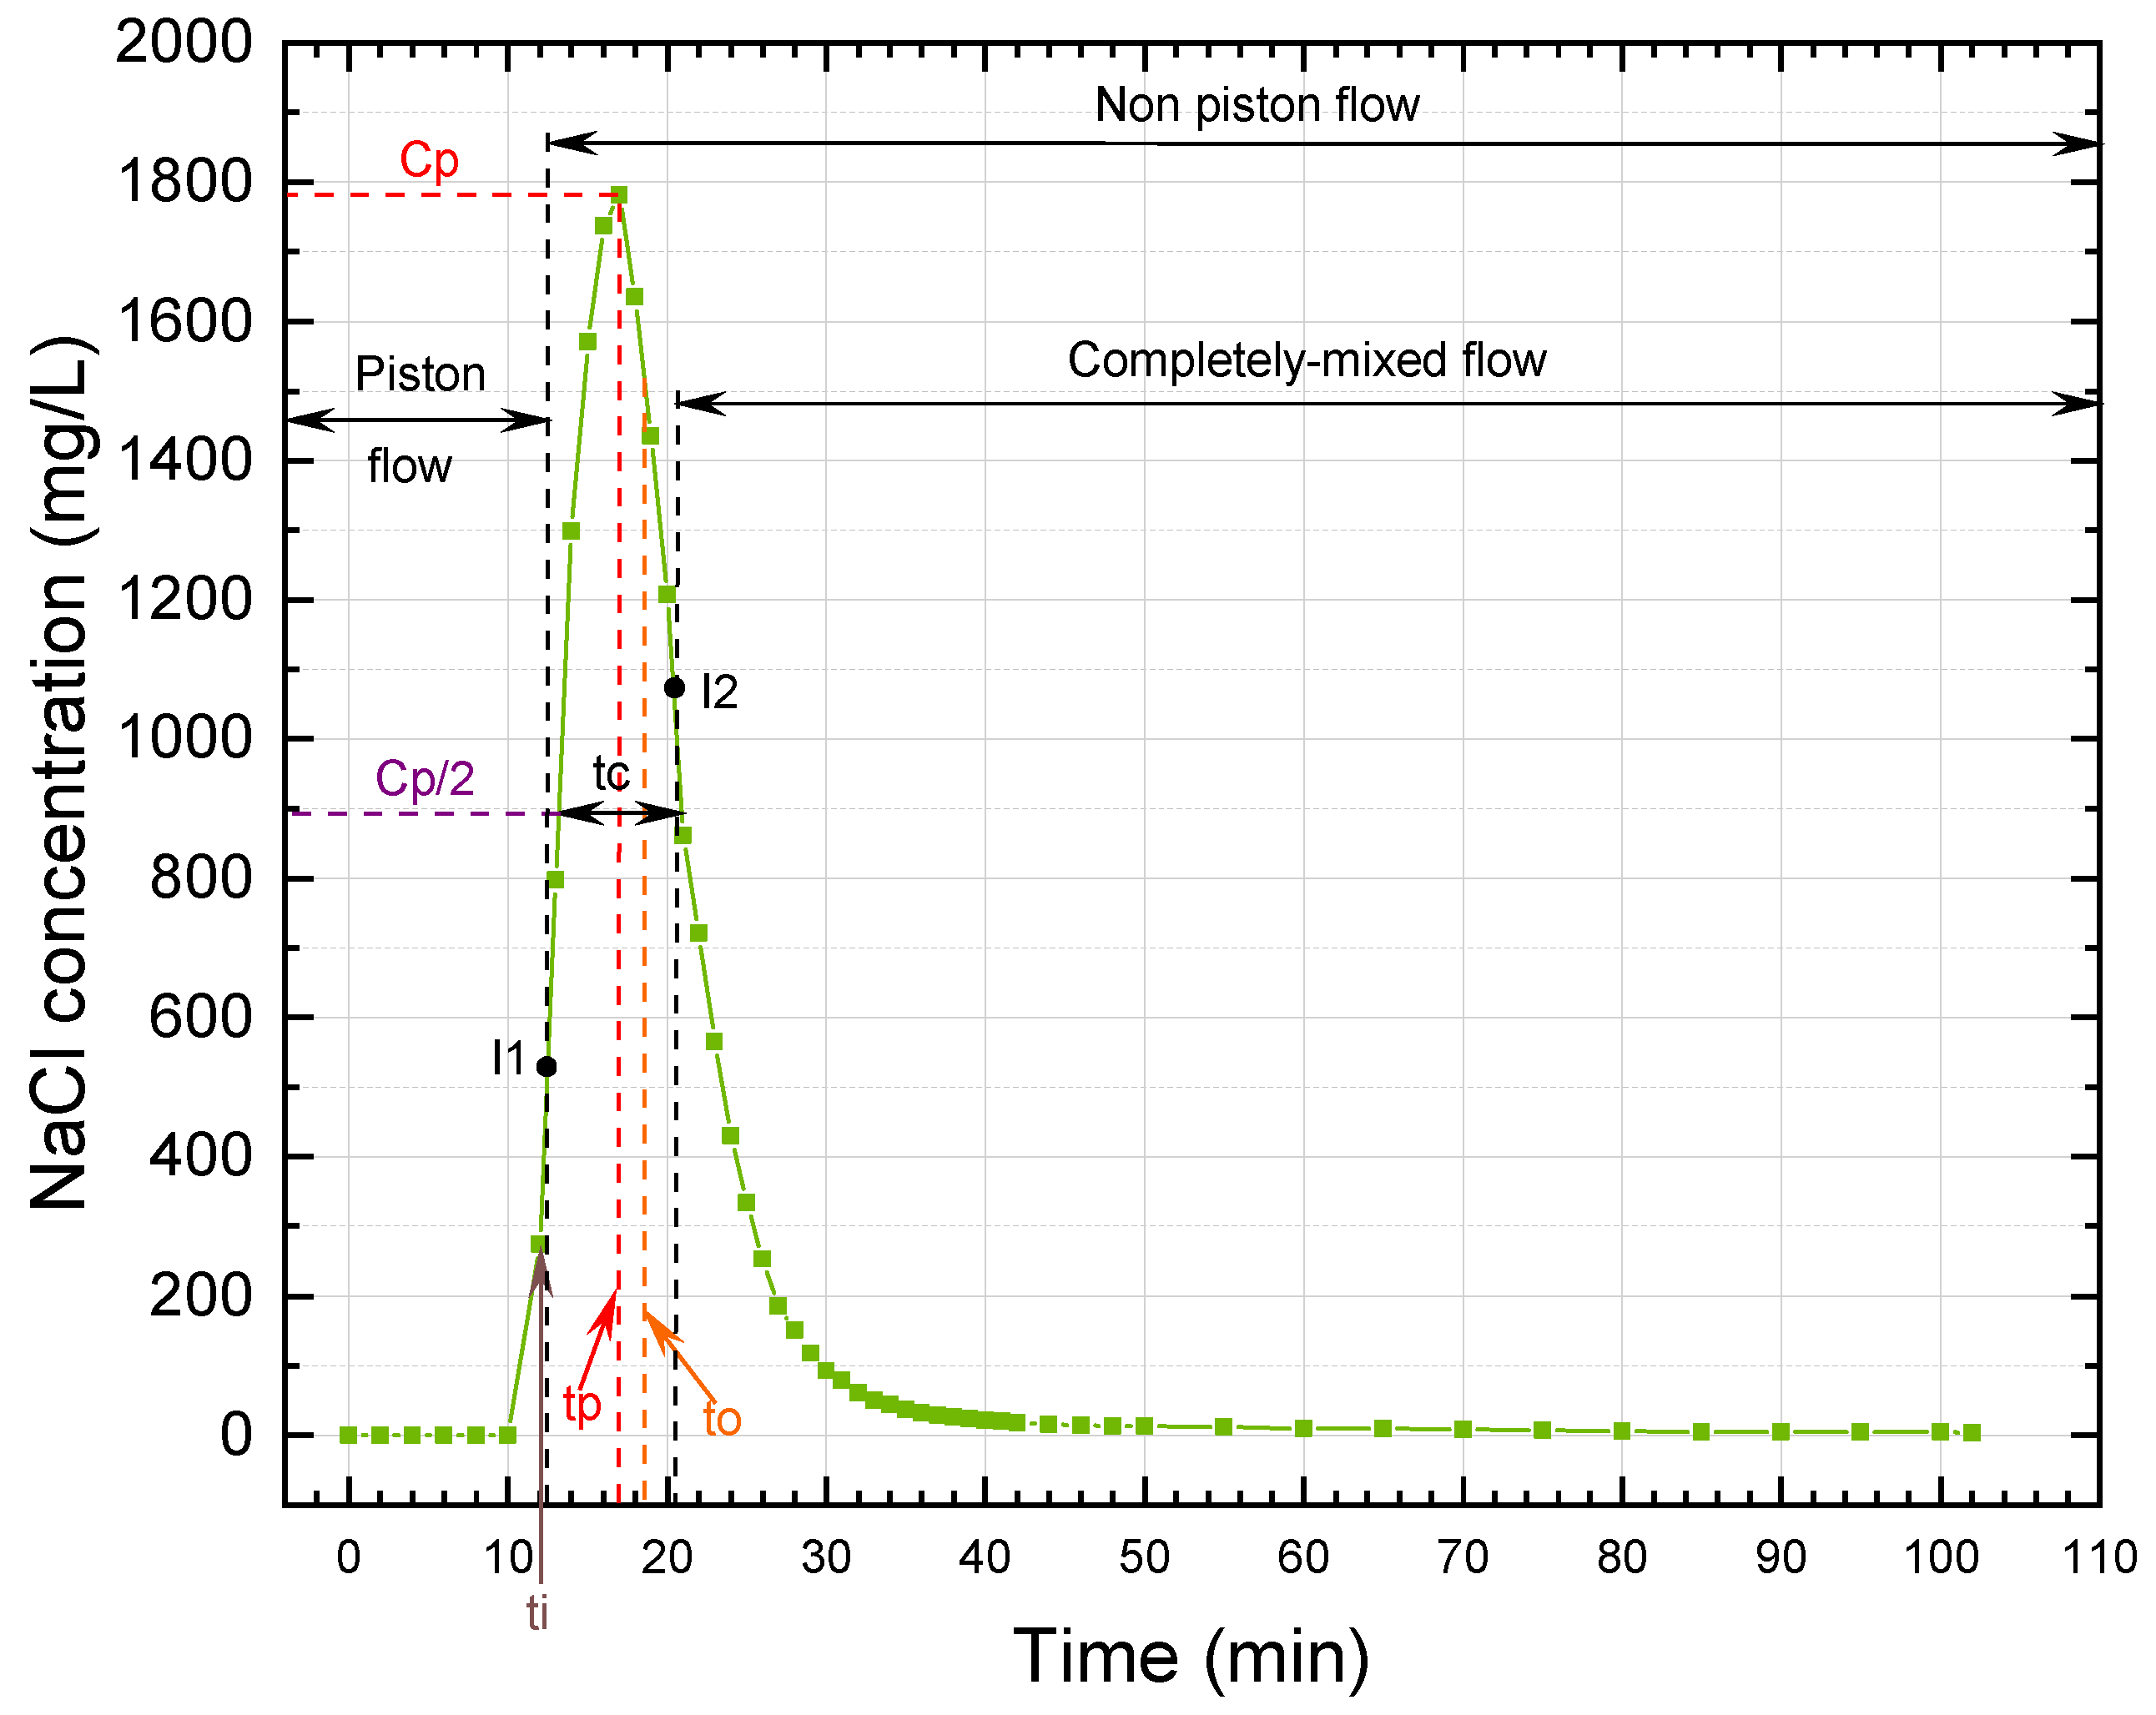
The trends in tracer concentration in the effluent of the UGFL and RSF are shown in
Figure 2,
Figure 3,
Figure 4 and
Figure 5. In addition, the hydraulic parameters for each filter operated at flows of 0.5 and 1.0 m
/d (calculated according to the
Figure 2,
Figure 3,
Figure 4 and
Figure 5) are presented in
Table 4 and
Table 5 for the Wolf-Resnick simplified model and analysis of the trend curve, respectively.
According to the simplified Wolf-Resnick method, at a flow of 0.5 m
/d, the UGFL and RSF had a piston flow (P) of 73% and 74%, respectively. When the flow was increased to 1.0 m
/d, the piston flow was reduced to 62% and 70% for the UGFL and RSF, respectively. These results showed a predominance of piston flow over mixed flow (
) for both filters at both operating flows. The predominance of piston flow was attributed to the inlet structure of the filters, which evenly distributed the flow over the surface area of the filter bed. In addition, in the case of the UGFL, the supernatant water layer collects the filtered water and carries it to the collector [
30]. Similarly, the
(close to 1.0) and
(greater than 0.5) ratios confirmed the predominance of piston flow. The Morril index, with values close to 1.0, reaffirmed the predominance of piston flow obtained with the simplified Wolf-Resnick method.
For the UGFL and RSF at the two operating flows, no dead zones (m = 0%) were evident. Furthermore, the ratio (>0.3) obtained for the UGFL and RSF indicated the absence of hydraulic short circuits for both filters and the two operating conditions.
The predominance of piston flow and the absence of dead zones and short circuits in both filters favoured flocculation and sedimentation of particles in the UGFL and particle transport and adhesion mechanisms in the RSF. These mechanisms generated surface interactions between the particles in the supernatant and the sand grains, allowing the capture and removal of suspended solids [
31]. Similarly, the predominance of piston flow indicates a real contact time or HRT, close to the design or theoretical one.
3.2. Experimental Treatments
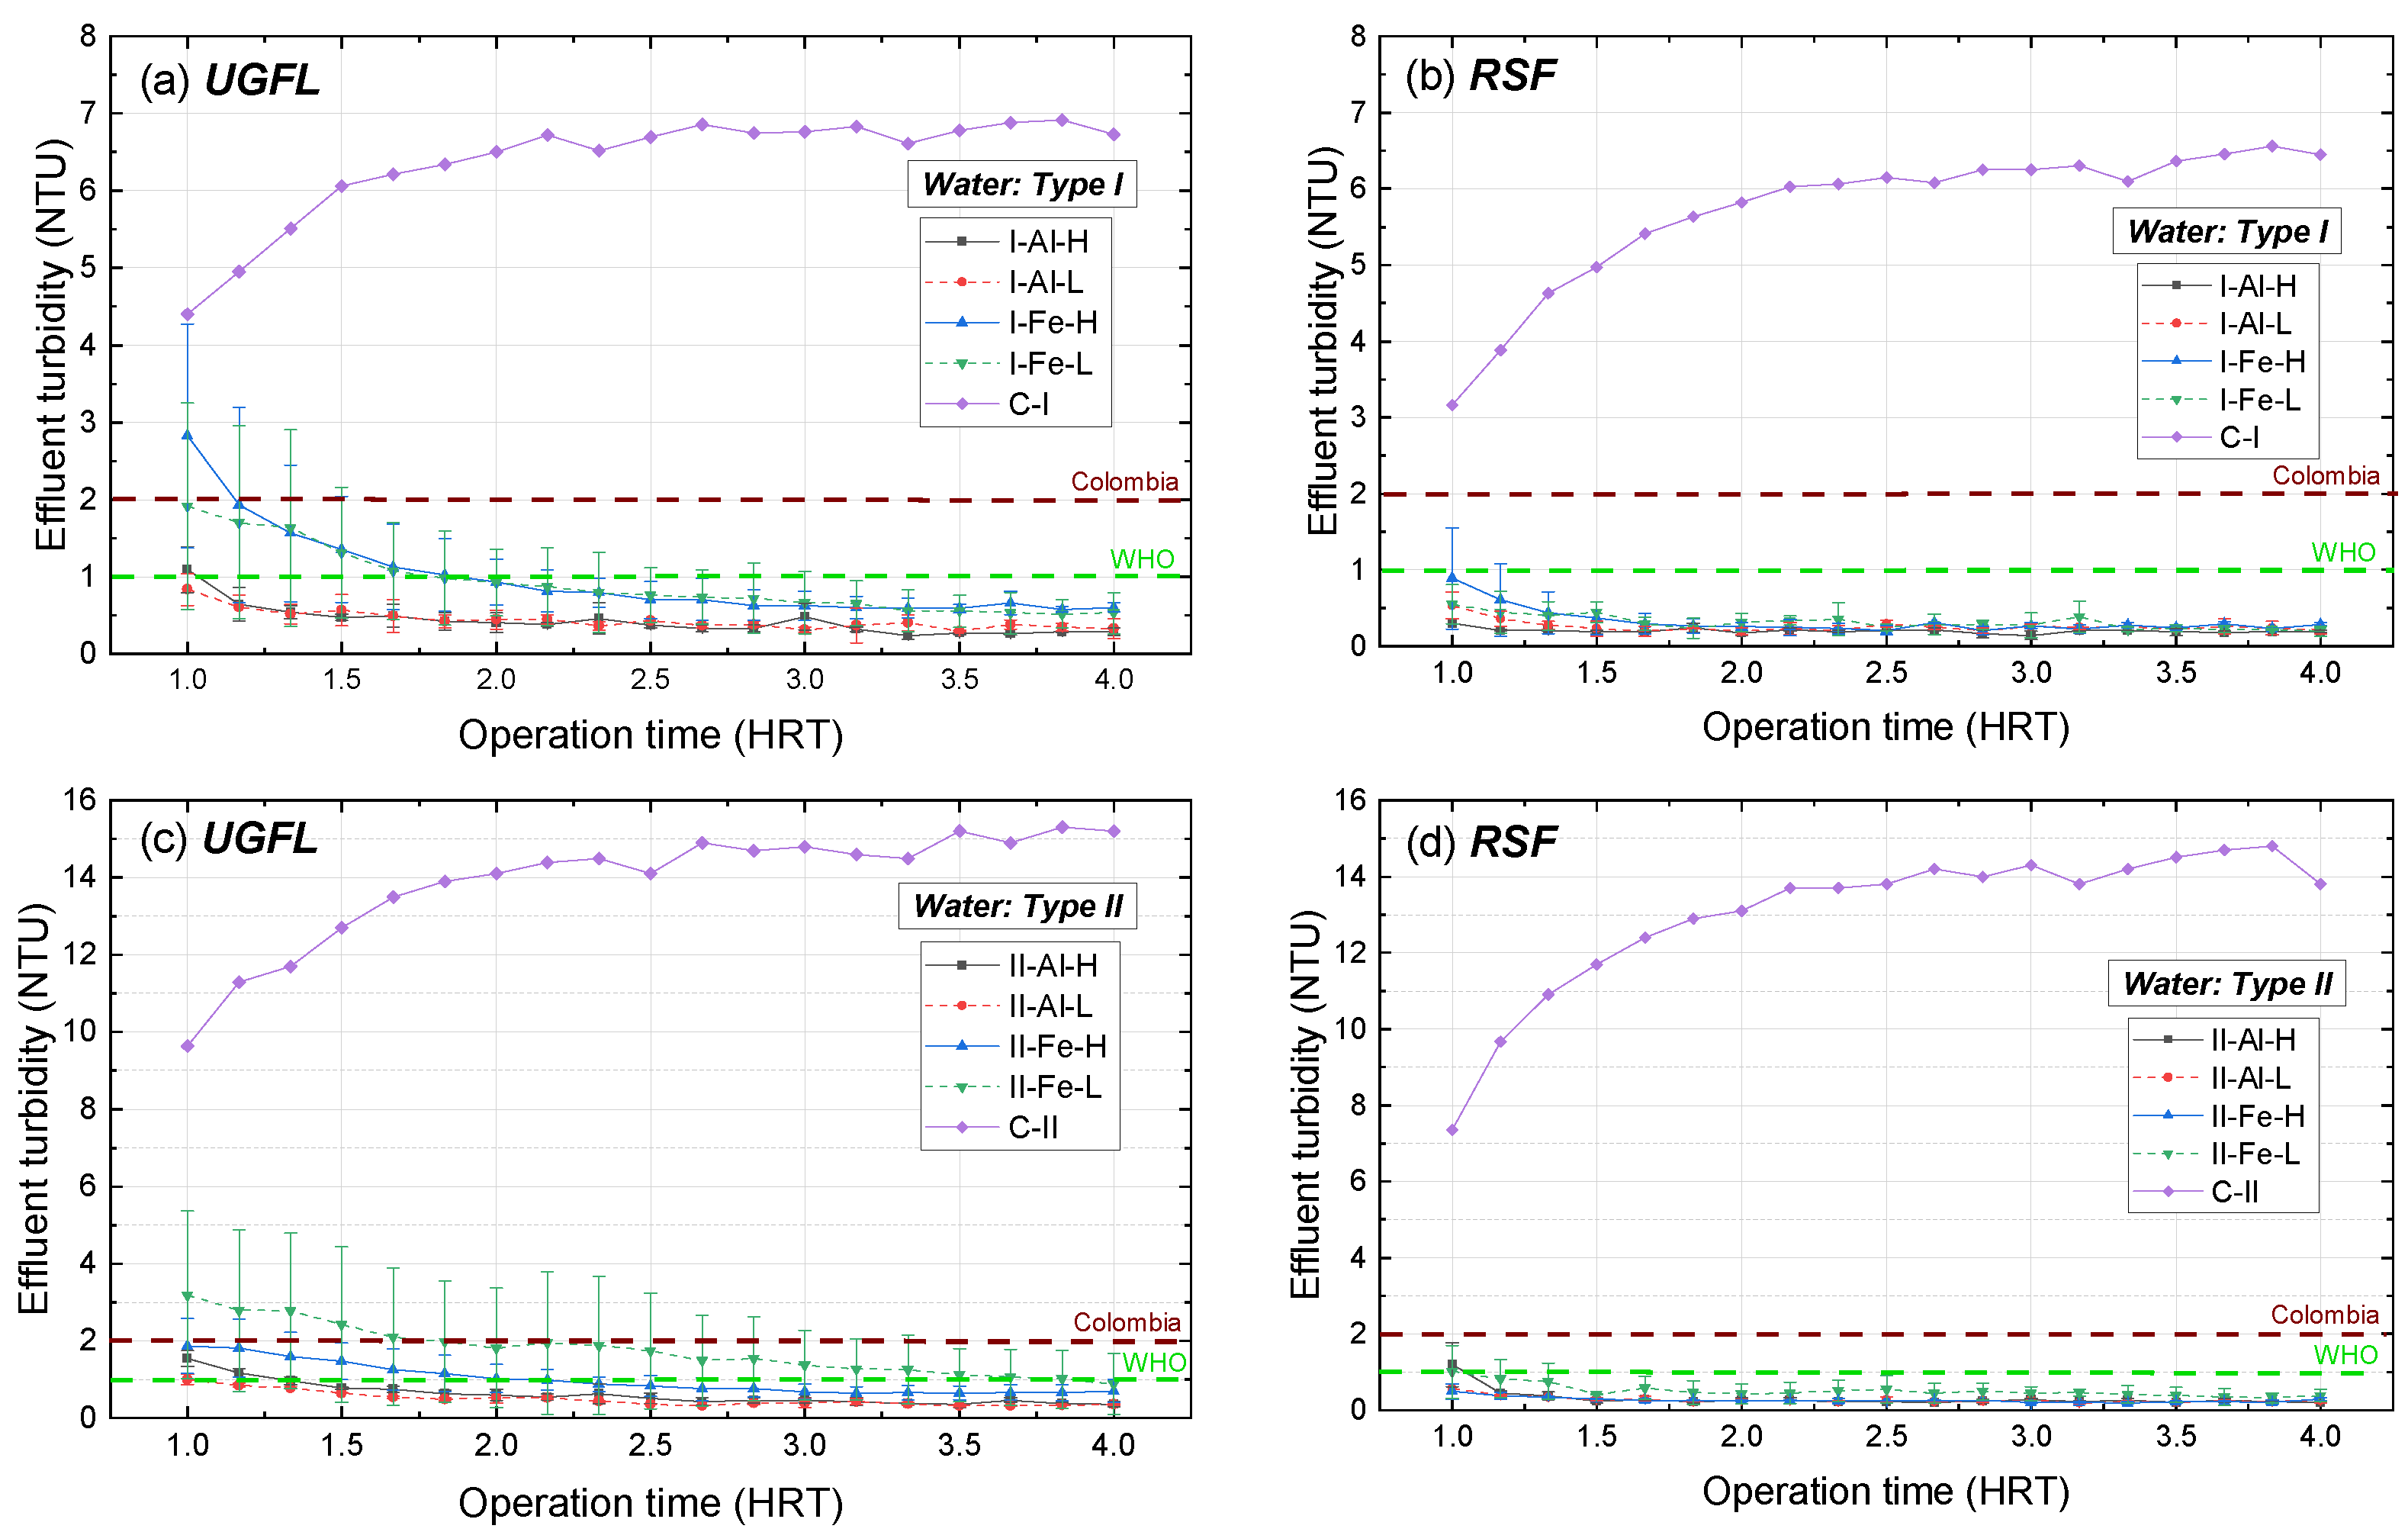
Figure 6 presents the average turbidity results and the error (standard deviations of each test and its replicate) of the UGFL and RSF effluents for the treatments presented in
Table 3 and for the operating times evaluated, reported as HRT. This figure includes the variables water type (I and II), coagulant (Al and Fe) and operating flow (L and H).
As shown in
Figure 6a, when the SDWTS was evaluated with water type I (10 NTU) and the coagulant ferric sulphate (Fe), the average turbidity in the UGFL effluent for the first HRT ranged between 2 and 3 NTU for both operating flows (L and H). With increasing operating time, the turbidity for the two flows was similar with a decreasing trend, reaching stability (around 0.6 NTU) from 3.0 HRT onwards. When the SDWTS was operated with the coagulant PACl (Al), the turbidity in the UGFL effluent showed less variability and was lower than the one with the coagulant ferric sulphate for all HRTs. Concerning the operating flows, with the coagulant PACl, similar turbidity values were also obtained in the UGFL effluent at both flows and its stability was reached from 1.5 HRT onwards, achieving average turbidity values of less than 0.5 NTU.
The average turbidity in the effluent of the RSF with water type I is presented in
Figure 6b. In this figure, it is observed that for the flows and coagulants evaluated, the effluent turbidity of the RSF was similar and, in all cases, lower than 1.0 NTU. As in the UGFL, the effluent turbidity of the RSF showed a decreasing trend with increasing operation time, reaching minimum values between 0.2 and 0.3 NTU before 2.0 HRT. These turbidity levels are lower than those reported by Alsaeed et al. [
32] for a conventional system (between 3.2 and 3.6 NTU) that treated water with initial turbidity of 10 NTU at pH values between 7 and 8 with the coagulant PACl (dose 5 mg/L).
Regarding the evaluation of SDWTS with water type II (20 NTU),
Figure 6c shows the average turbidity of the UGFL effluent. In this test, for all HRTs, the highest average turbidity (between 3.2 and 0.9 NTU) corresponded to the SDWTS operation with coagulant ferric sulphate and low flow (L). In this treatment, the highest variability between replicates was reported, and no stability was evident during operation, reaching the minimum turbidity (0.9 NTU) at 4.0 HRT. For the high flow (H) and the coagulant ferric sulphate, the response in the turbidity of the UGFL was decreasing, obtaining stability from 3.0 HRT with turbidity close to 0.7 NTU. On the contrary, with the coagulant PACl, less variability was observed in the UGFL effluent turbidity, and similar turbidity was reported for the two operating flows, achieving minimum turbidity between 0.40 and 0.5 NTU from 2.5 HRT.
When the SDWTS was evaluated with water type II, the effluent turbidity of the RSF (
Figure 6d) presented a similar trend to that obtained with type I water (
Figure 6b), with stabilisation at 1.5 HRT for all treatments. From this time onwards, the turbidity in the RSF effluent remained between 0.2 and 0.4 NTU with the flows and coagulants evaluated.
When the SDWTS was operated at flow H and without the addition of coagulants (controls), an increase in the effluent turbidity of the UGFL and RSF was observed with increasing operating time for both types of water (
Figure 6a–d). With type I water (C-I), SDWTS turbidity effluent (RSF) higher than 6 NTU was reported at 2.2 HRT, while with type II water (C-II), turbidity higher than 13 NTU was reached at the identical HRT. This turbidity increase was due to an accumulation of particles in the filter bed, which decreased the effective area available for sedimentation. This difference is explained by the fact that in the control experiments, turbidity removal occurs due to the sedimentation of particles present in the types of water studied. In contrast, in the tests with the presence of coagulant, the phenomena of destabilisation of the surface charges, adsorption and adherence to the particles had an influence, increasing turbidity removal in these cases [
5].
Additionally, the paired analysis between the controls and the treatments [(C-I and I-Al-H), (C-I and I-Fe-H), (C-II and II-Al-H) and (C-II and II-Fe-H)] shows that the effluent turbidity in the treatments was significantly lower than that obtained in the controls, given that the
p-value obtained (<0.001) is lower than the significance level of 0.05. Therefore, in all the treatments evaluated, the improvement of water clarification was evidenced with the incorporation of the coagulation stage, prior to the UGFL. Similar results were reported by Sánchez et al. [
21] and Franco et al. [
20], using as coagulants aluminium sulphate and Moringa oleifera seeds, respectively.
Then, from 1.5 HRT operation time in all treatments, treated water (RSF effluent) with turbidity less than 1.0 NTU was obtained, complying with the recommendations of the WHO [
33] and Colombian regulations [
34] to promote effective disinfection. In
Figure 6, the horizontal dashed lines represent the turbidity limits recommended by WHO and Colombia, respectively.
Figure 7 presents the average results for pH and EC in the effluent of the SDWTS system, for both types of water (I and II), with the coagulants PACl (Al) and ferric sulphate (Fe). In this figure, it can be observed that the EC did not present significant variations in the effluent and all the values obtained were lower than the maximum limit (1000 µS/cm) established in the Colombian regulations for drinking water [
34]. It can also be observed that the effluent pH for treatments with the coagulant ferric sulphate presented values close to the lower permissible limit established for this parameter in water for human consumption (6.5 to 9.0 pH units). The WHO does not propose any reference value for this parameter because pH levels found in drinking water do not represent a health concern. However, pH is one of the most important operational parameters of water quality. The optimum pH required will vary in different supplies according to the composition of the water and the nature of the construction materials used in the distribution system, but it is usually in the range 6.5–8.5 [
35]. In the case of treatments with the coagulant PACl, values closer to neutrality were presented, also complying with Colombian regulations for drinking water [
34]. This neutral pH was because the coagulant PACl has basicity (70%) in its chemical composition, implying a lower alkalinity consumption and a lower pH reduction in the treated water compared to the ferric sulphate coagulant [
36]. The temperature of the effluent water was also monitored as a control variable, with an average value of 24.6 °C.
Regarding apparent colour, in all tests and for all operating times, values lower than 10 CU (limit of quantification of the method) were obtained in the effluents for both UGFL and RSF, thus complying with the maximum permissible value of 15 CU established in Colombia for drinking water [
34]. No health-based guideline value is proposed for colour in drinking water by the WHO. However, levels of colour below 15 TCU (True Colour Units) are often acceptable to consumers [
35].
In addition, because of the importance of optimizing coagulation to prevent microbial contamination and the need to minimize deposition of aluminium floc in distribution systems, it is important to ensure that average residuals do not exceed 0.2 mg Al/L in small facilities like the SDWTS. The WHO does not propose a guideline value for iron in drinking water because not of health concerns at levels found in drinking water. The taste and appearance of drinking water will be affected by Fe concentrations. However, there is usually no noticeable taste at iron concentrations below 0.3 mg Fe/L [
35]. The residual coagulant concentrations in the SDWTS effluent for the PACl and ferric sulphate treatments were lower than 0.2 mg Al/L and 0.3 mg Fe/L, respectively. These results indicate that for both coagulants, the maximum acceptable levels for iron and aluminium in drinking water in Colombia were met [
34] and are within the WHO recommended ranges [
35].
During the operation of the SDWTS for the evaluation of the treatments and controls, no head loss was observed in the RSF piezometer, indicating that the load of solids reaching this filter was low and their accumulation during the time of each test (6–10 h) did not generate clogging of the filter bed.
3.3. Factorial Design Analysis
Table 6 presents the results of verifying the assumptions of normal distribution and constant variance for each filter’s turbidity removal data and the operating times evaluated (HRT). The Anderson-Darling Normality Test results indicated that all turbidity removal data for the two filters and the four operating times evaluated follow a normal distribution (
p-value > 0.05).
Similarly, Bartlett’s test shows that for most of the conditions evaluated, there was equality or homogeneity in the turbidity removal variances (p-value > 0.05). Only the turbidity removal data in the UGFL for 4 HRT did not meet the assumption of constant variance (p-value = 0.040). In order to stabilise the variance of these data, a Box-Cox transformation with an estimated = 39.5122 was applied before analysing the factorial design results.
Table 7 presents the standardised effects of the three factors: coagulant (C), type of water (W), flow (F) and
Table 8 shows the results of their interactions (C*W, C*F, W*F and C*W*F) on the turbidity removal in the UGFL and RSF for the four SDWTS operating times. Additionally,
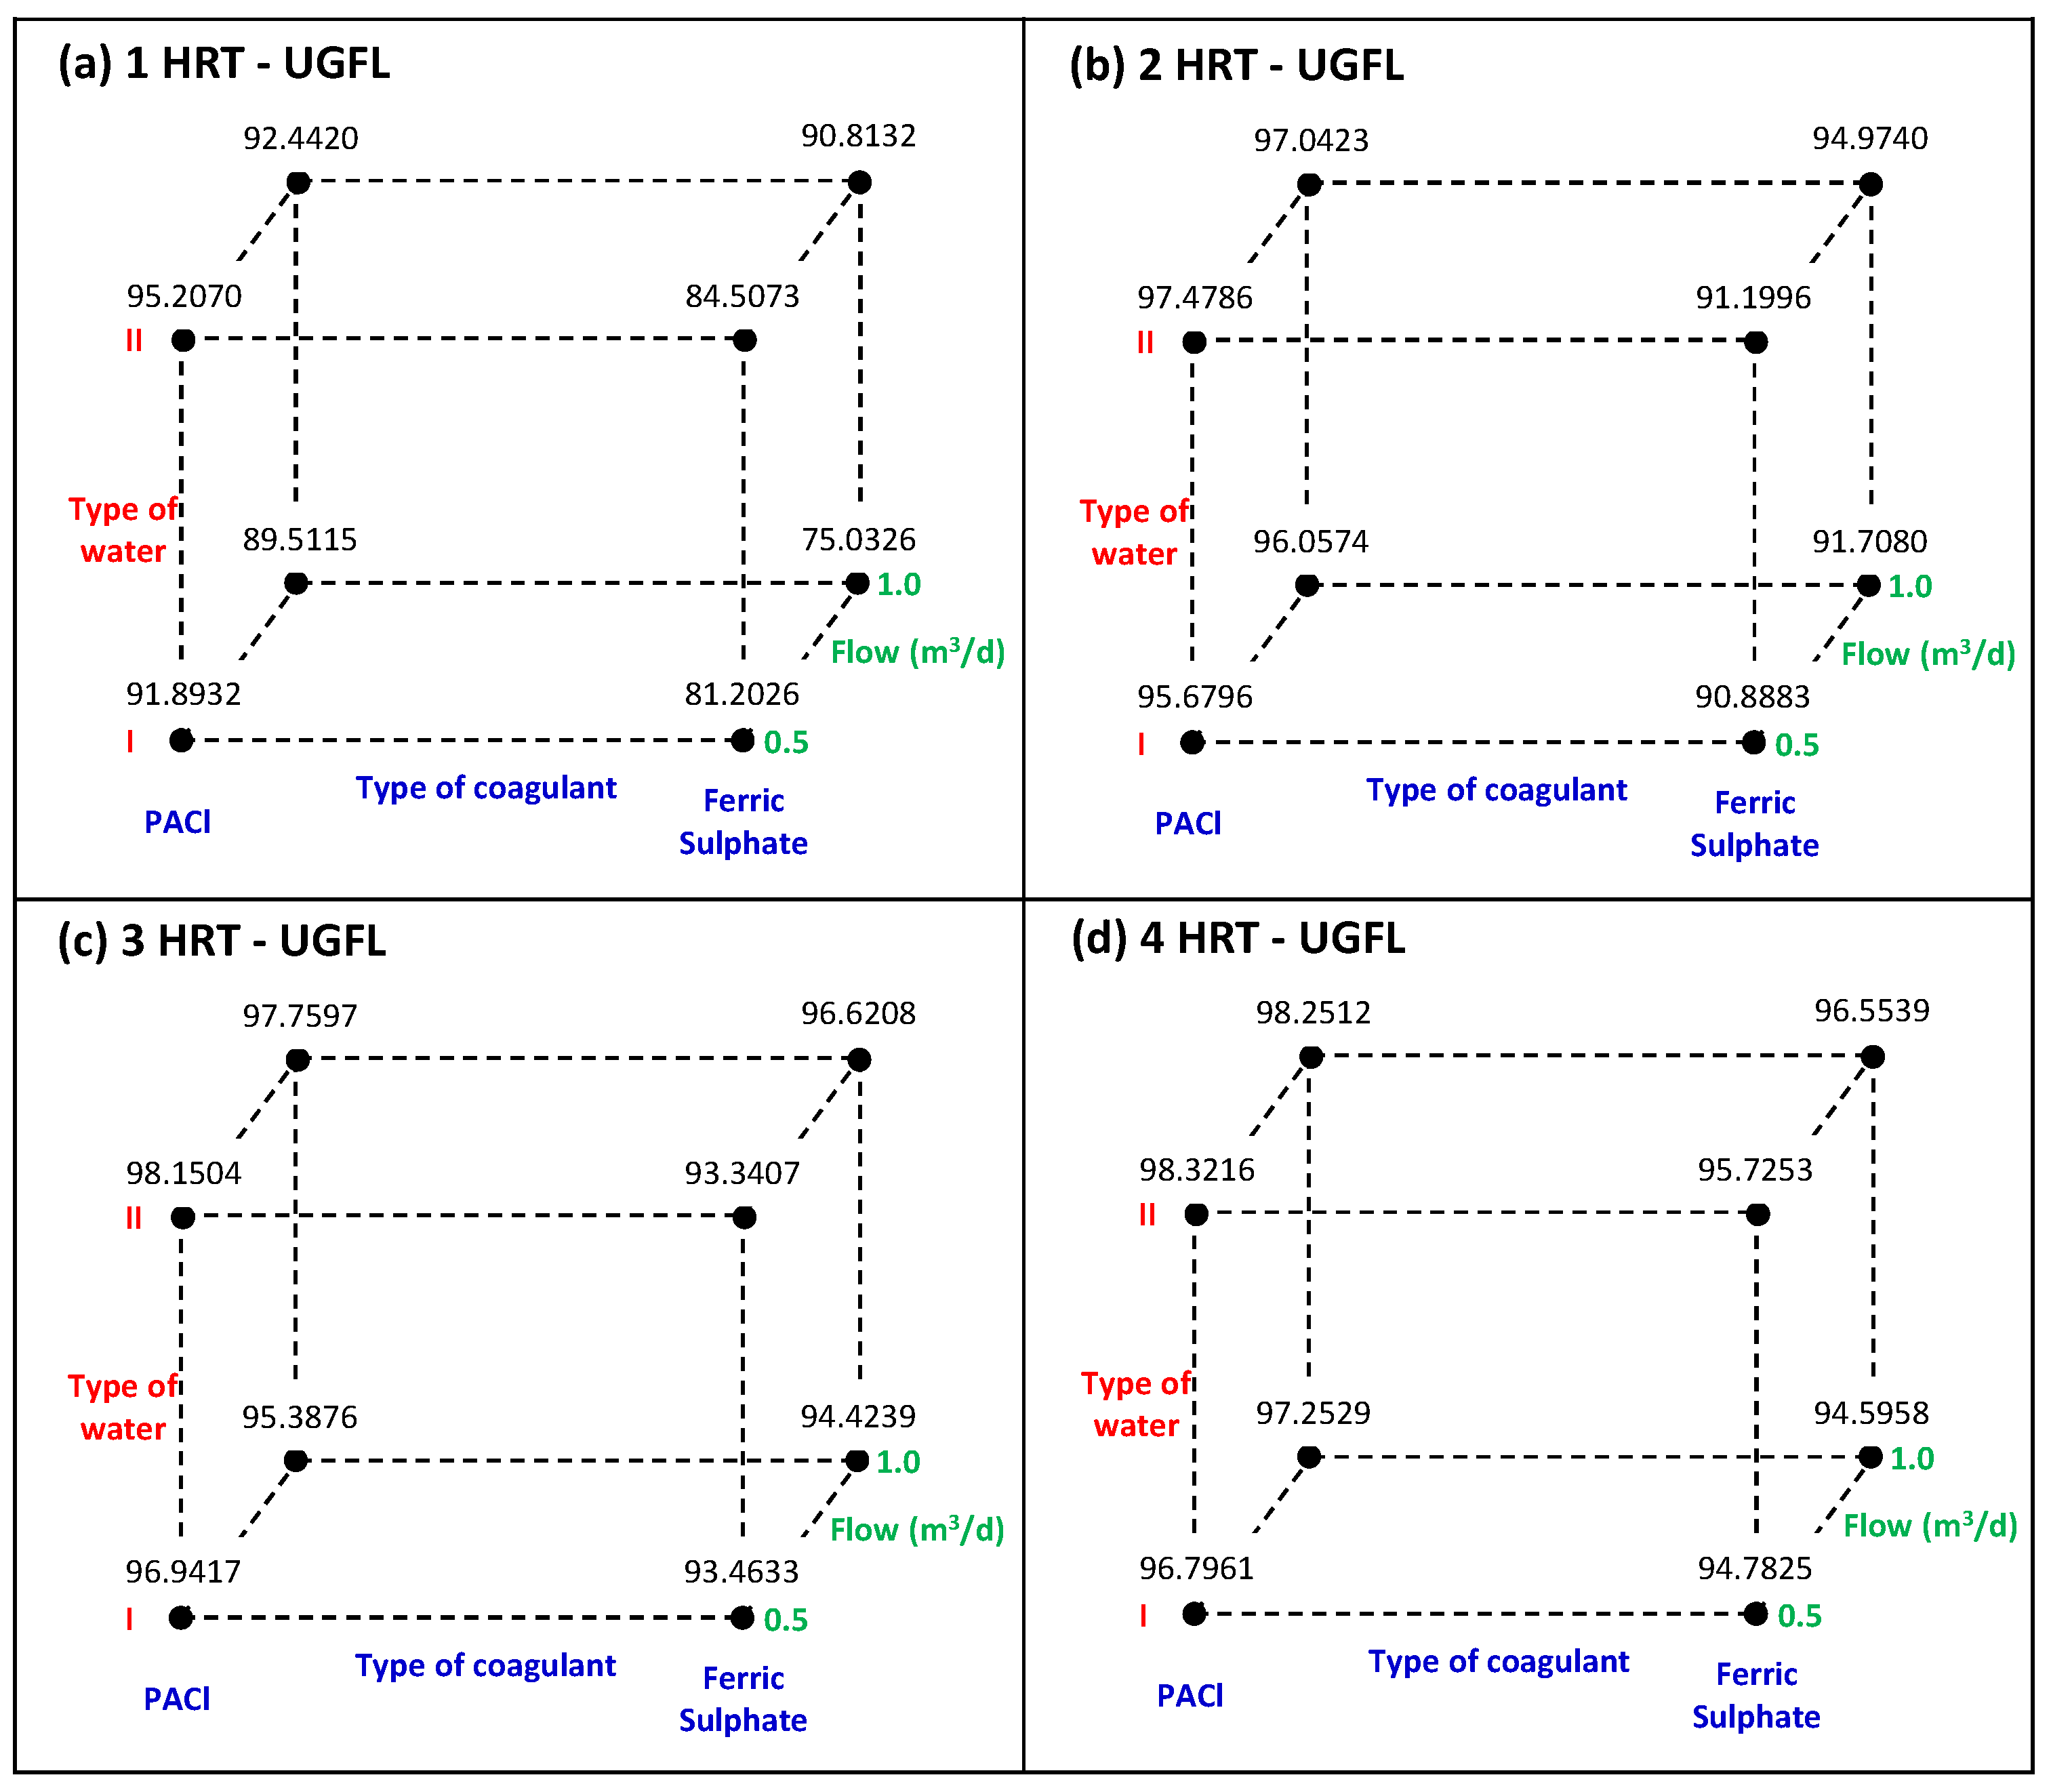
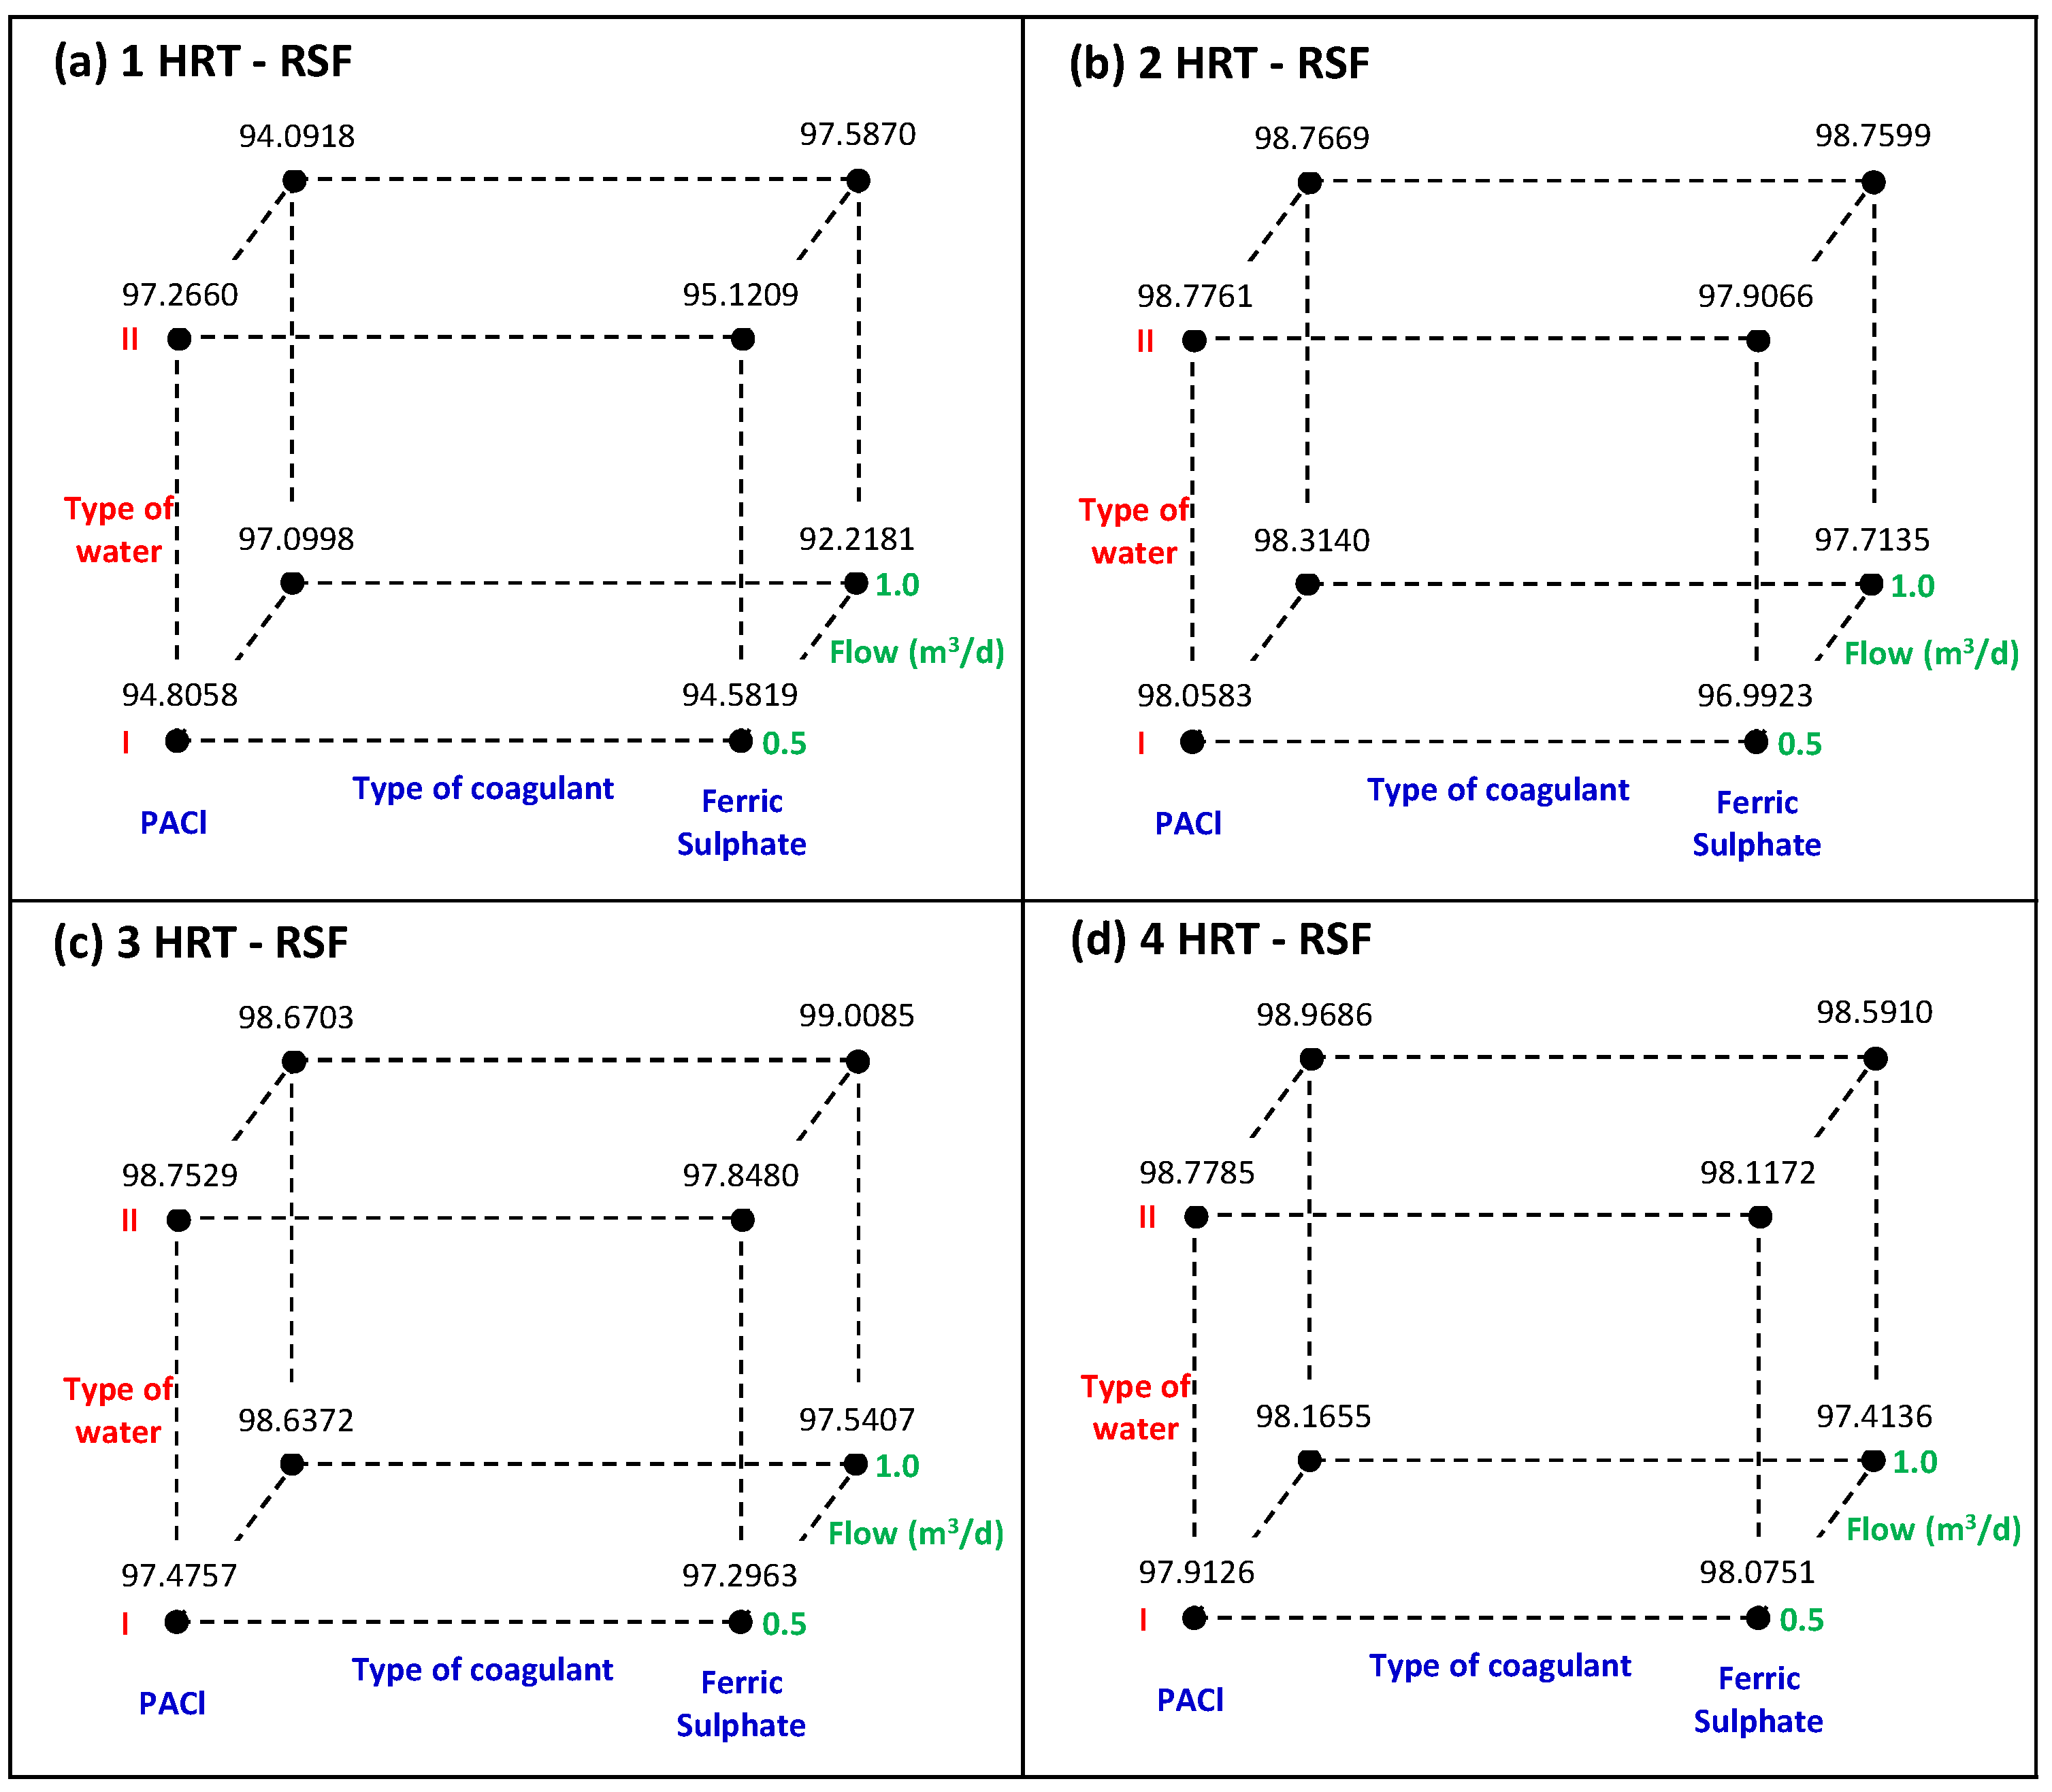
Figure 8 and
Figure 9 present the cube plots for the turbidity removals (adjusted means) with the relationships between the three factors and for UGFL and RSF, respectively.
Table 7 shows that, for the UGFL, the coagulant type is a significant factor (
p values < 0.05) and it had the greatest effect on turbidity removal (between 9.370 and 2.036) for all HRTs. These positive values indicated that higher turbidity removals were achieved with the coagulant PACl compared to ferric sulphate, as shown in
Figure 8. Also, the higher removals correspond to lower turbidity in the UGFL effluent, as shown in
Figure 6a,c. In these Figures, it was also observed that as the operating time (HRT) increases, a more negligible difference in UGFL effluent turbidity is obtained when comparing the coagulants. This is consistent with the decrease in the standardised effect of coagulant type on UGFL as the HRT increases (
Table 7).
Water type factor only had a significant (
p-value = 0.048) and positive effect on turbidity removal at 4 HRT of UGFL operation. This result indicates that at the end of the UGFL experiment, the maximum turbidity removals (>98%) were achieved with water type II (initial turbidity = 20 NTU) and PACl, as shown in
Figure 8d.
For the RSF (in
Table 7), only the water type factor significantly affected turbidity removal after 2 HRT of system operation (
p values < 0.05). The positive effects indicated that the highest turbidity removals in the SDWTS were achieved with water type II (>98.7%), as can be seen in
Figure 9b–d. These high removals corresponded to low turbidity in the effluent of the SDWTS (between 0.2 and 0.4 NTU), as can be seen in
Figure 6b,d. Similar turbidity levels (0.15 NTU) were reported in the drinking water treatment with initial turbidity of 15.4 NTU through a coagulation/flocculation system combined with advanced filtration (ultrafiltration) also using PACl [
37].
The flow factor (
Table 7), two-factor and three-factor interaction (
Table 8) had no significant effect on turbidity removal for UGFL and RSF (
p values > 0.05).
From the analysis of the results of the “experimental treatments” section and the factorial design, the optimal conditions were defined as the operation of the SDWTS with type II water (higher levels of turbidity and colour) and the use of the coagulant PACl. In addition, as the flow did not significantly affect turbidity removal in both filters, the higher flow was selected as the optimum condition that allows a greater volume of water to be treated.
3.4. Operation and Maintenance
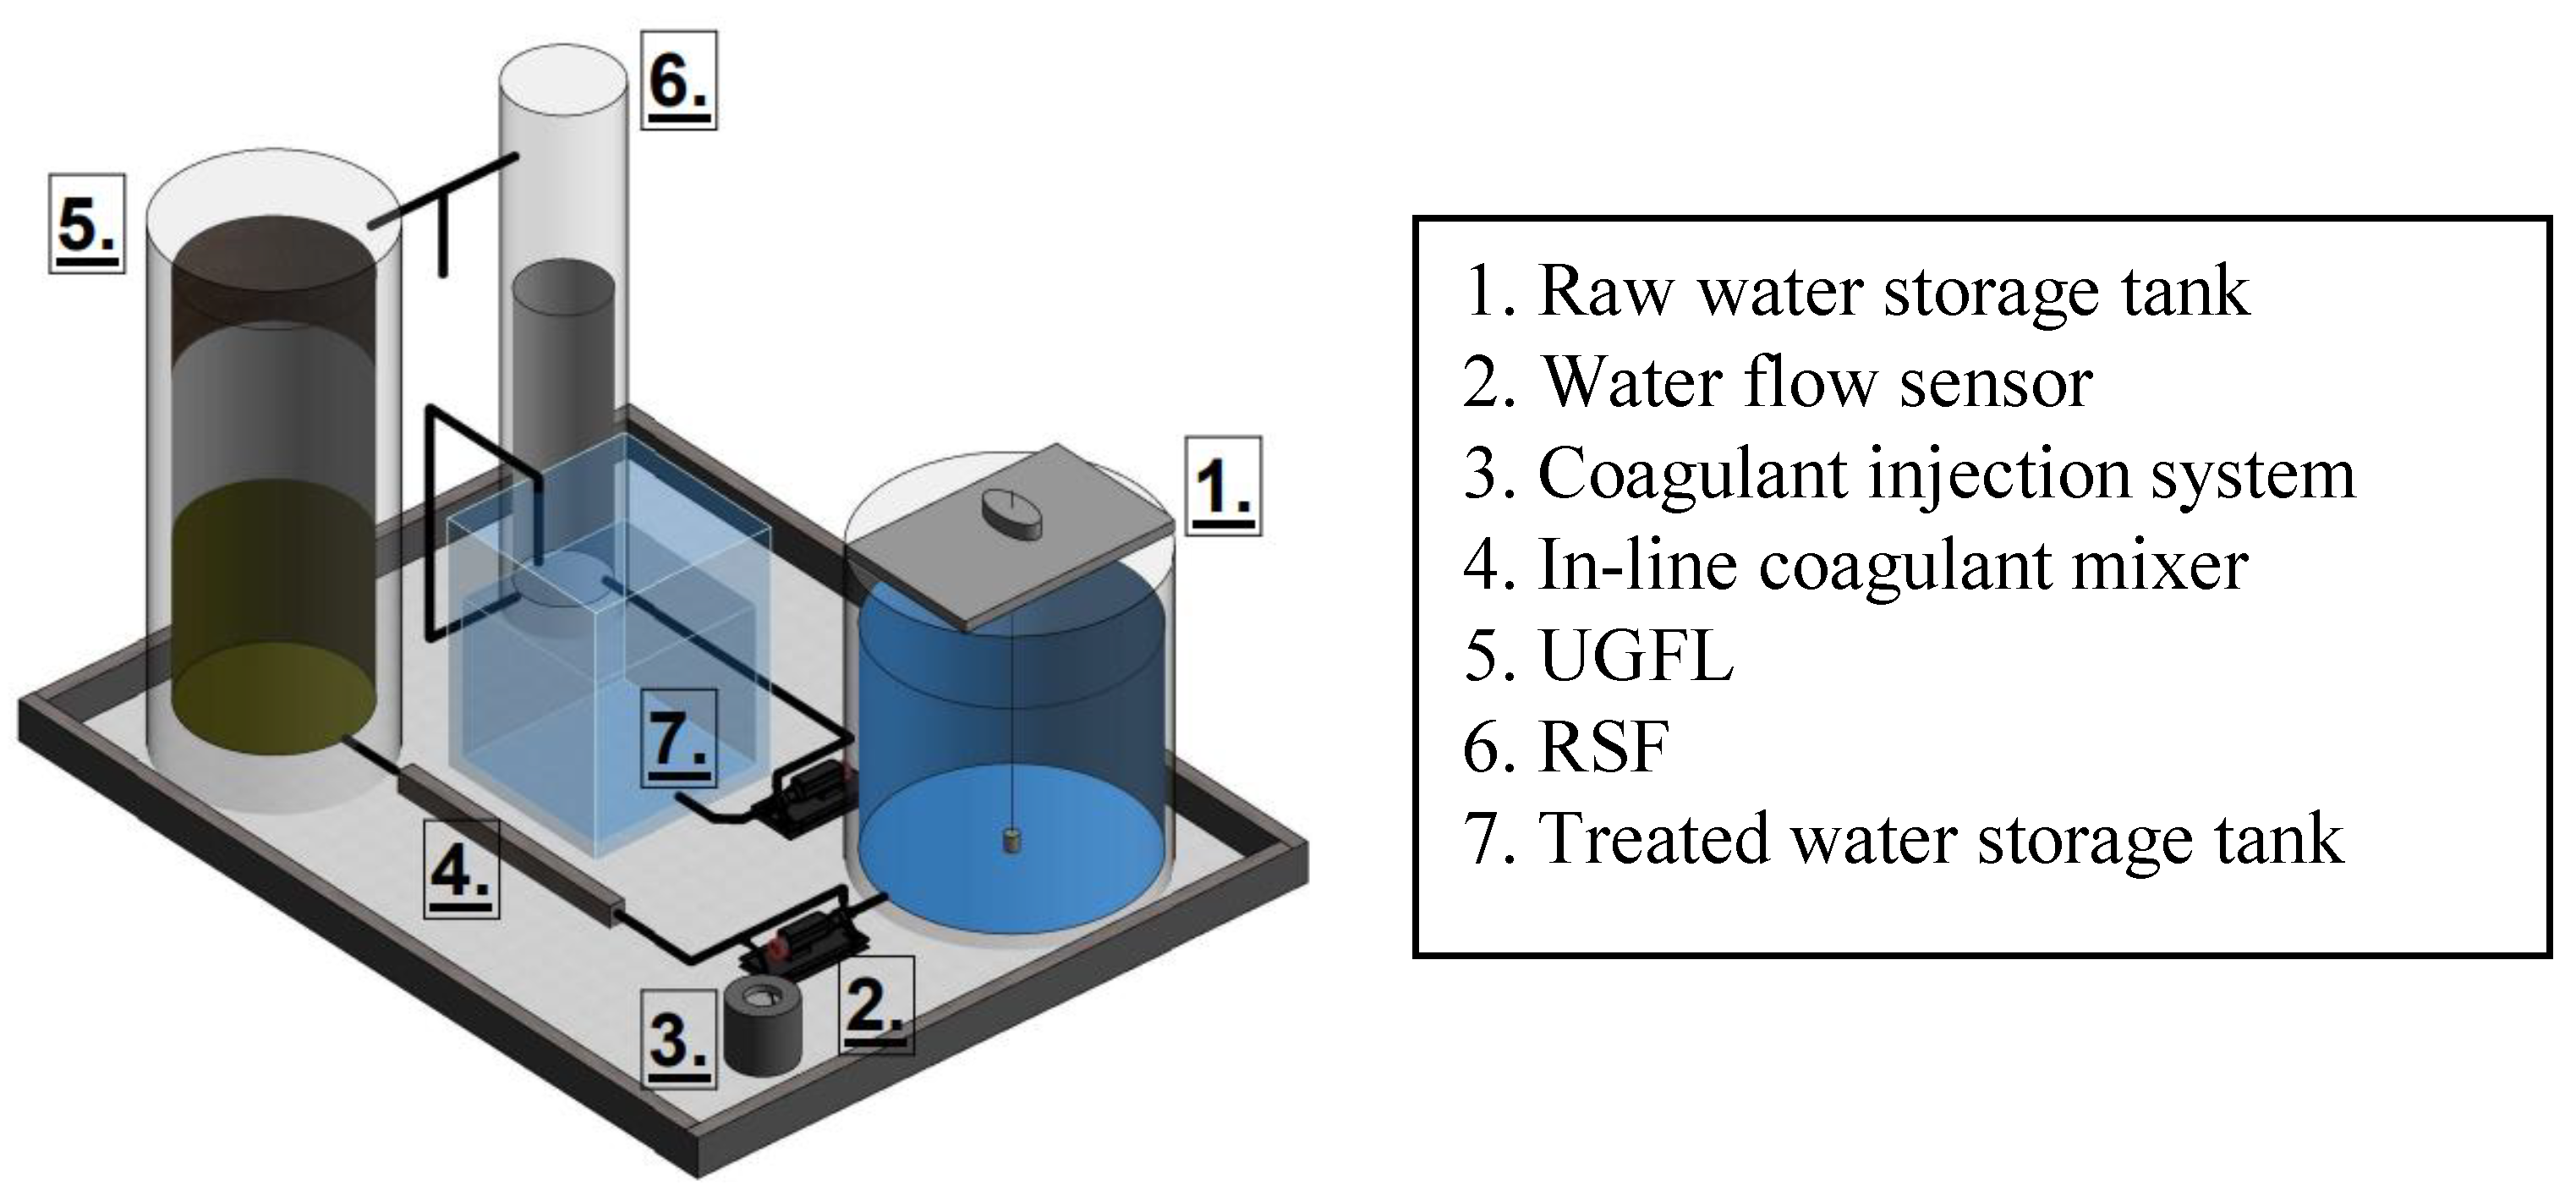
The filtration run was evaluated for the complete system under optimal conditions. The filtration run for the RSF was 172 h and a total production of treated water by the system of 7083 L. The maximum available head loss (75 cm) was reached during this time. During the filtration run, the average turbidity in the UGFL and RSF effluents were 0.30 ± 0.06 NTU and 0.27 ± 0.09 NTU, respectively.
The UFGL washing required 142 L of water and a time of 114 s. The average washing flow was 75.1 ± 6.0 L/min. The wash water reached maximum turbidity of 7600 NTU (at 5 s) and a minimum of 13.8 NTU at the end of the wash. Likewise, the RSF backwash required 83 L of water and a time of 15 min. The average backwashing rate was 42 ± 3.3 m/h and is in the range of typical values for this operation (30 to 60 m/h-Crittenden et al. [
38]). The total volume of washing water generated in the cleaning of the system was 225 L. Considering the filtration run, the effective production of treated water by the system after cleaning the units was 96.9% (6858 L).
The estimated cost of the treatment system (initial investment) is USD 2100. This cost includes UFGL and RSF and all their components, the pumping system for backwashing, the raw and treated water storage tanks, the necessary accessories, and the system’s installation. The system can effectively produce 6858 L/week, considering weekly maintenance with an average water consumption for cleaning of 225 L.
3.5. Removal of Microorganisms
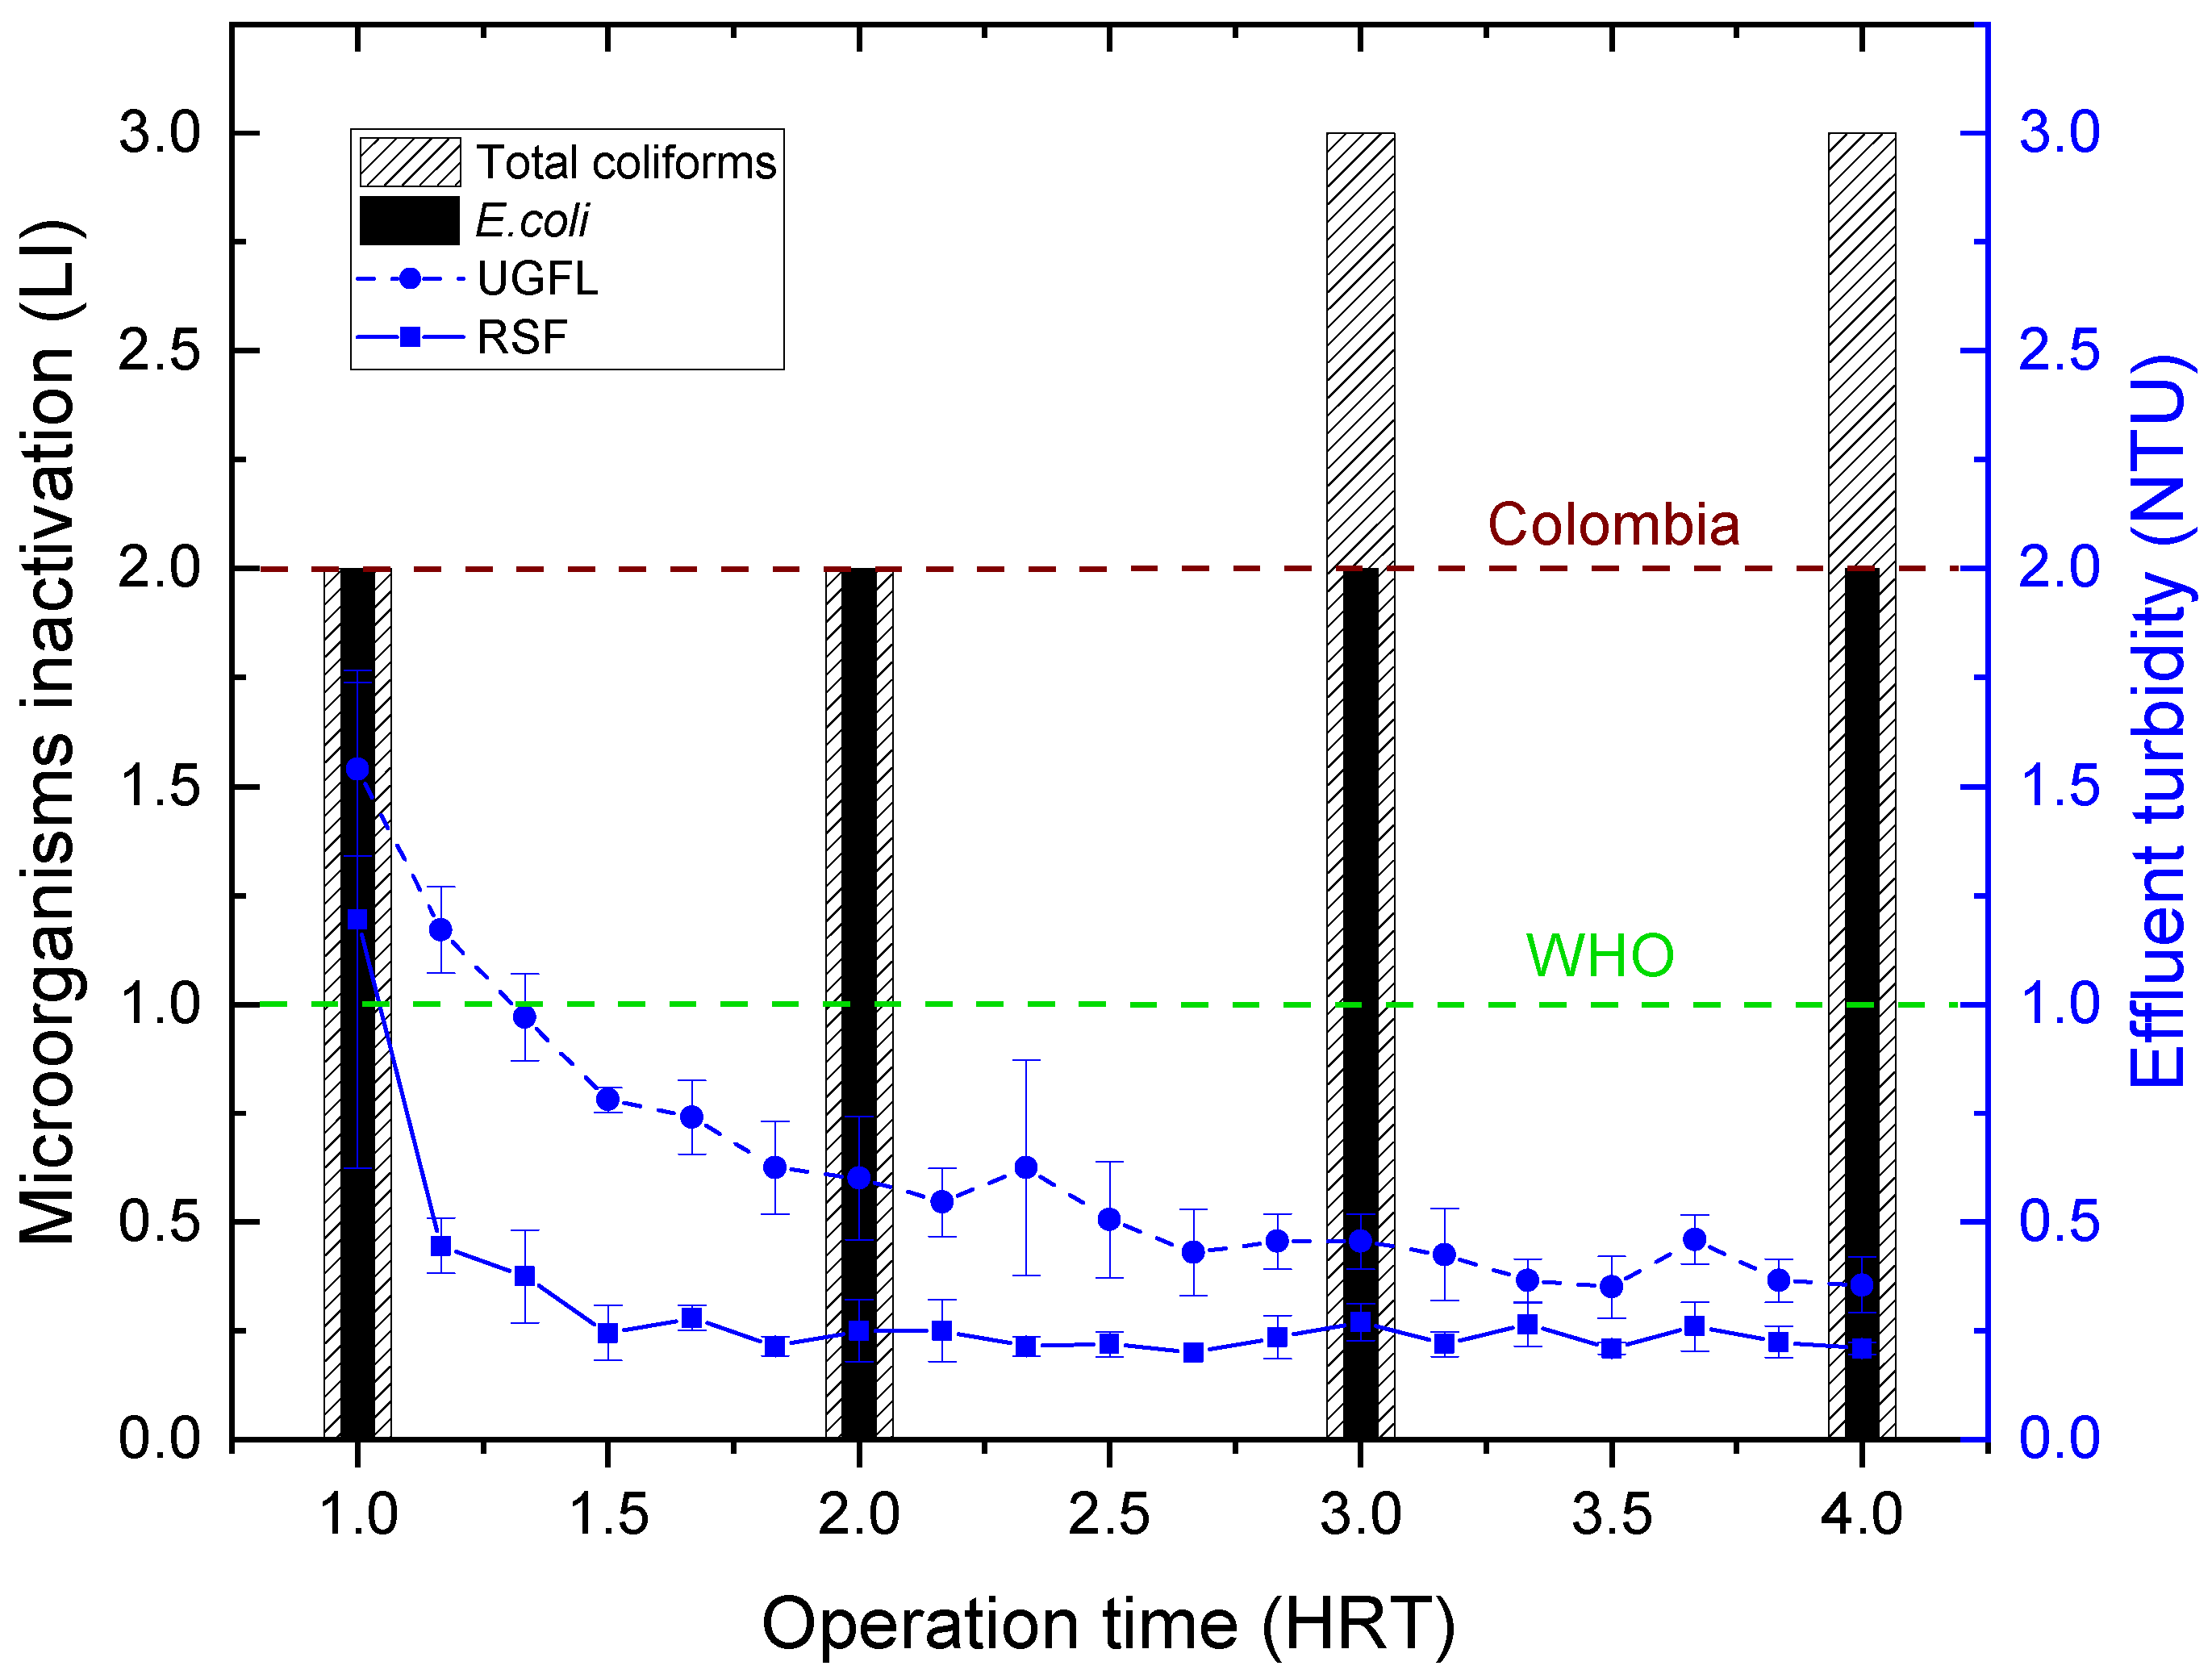
Figure 10 shows the results of total coliform and
inactivation and effluent turbidity in the SDWTS, for water type II, with the coagulant PACl and a flow of 1.0 m
/d. Under these conditions,
concentrations below the method’s limit of quantification (<1 NMP/100 mL) were obtained in the SDWTS effluent for all the HRTs evaluated, which are equivalent to removals greater than 99% (>2 log inactivation, LI).
This
inactivation is similar to those reported by Souza and Sabogal [
39] for a slow filtration system with coagulation as pretreatment for rural community supply (close to 3.0 LI) and Terin et al. [
40] in a multi-barrier system with pretreatment and filtration in Household Slow Sand Filters (close to 2.6 LI). It is also higher than the removals obtained by Medeiros et al. [
3] in a multi-stage filtration system (around 1.0 LI).
As shown in
Figure 10, total coliform removal was 99% (2 LI) for 1 and 2 HRT, corresponding to UGFL effluent turbidity between 1.5 and 0.6 NTU. From 3 HRT, the turbidity in the UGFL effluent stabilised at values between 0.35 and 0.46 NTU, and the removal of total coliforms increased to 99.9% (3 LI). This removal corresponded to a total coliform concentration below the method’s limit of quantification (<1 NMP/100 mL) in the SDWTS effluent. The microorganism removal test shows that the SDWTS can generate water free of total coliforms and
from 3 HRT (<1 MPN/100 mL).
Coagulation/flocculation processes are an essential barrier in drinking water treatment to reduce the concentration of viruses, bacteria and bacterial spores. Additionally, if these processes are used before the RSF, they improve its performance in removing microorganisms, as shown in the research reported by Hijnen and Medema [
41]. The high inactivation of microorganisms shown by the SDWTS can be attributed to adsorption (a mechanism responsible for the attachment of small-sized microorganisms to different charged surfaces of the filter media) and the natural death process of pathogenic microorganisms due to factors such as ageing and stress on the filter media [
42,
43]. In addition, the disinfection process (not evaluated in this work) would complement the inactivation of microorganisms and the protection of treated water during its transport through the distribution network to end users.
3.6. Evaluation of the Increase in the Operating Flow
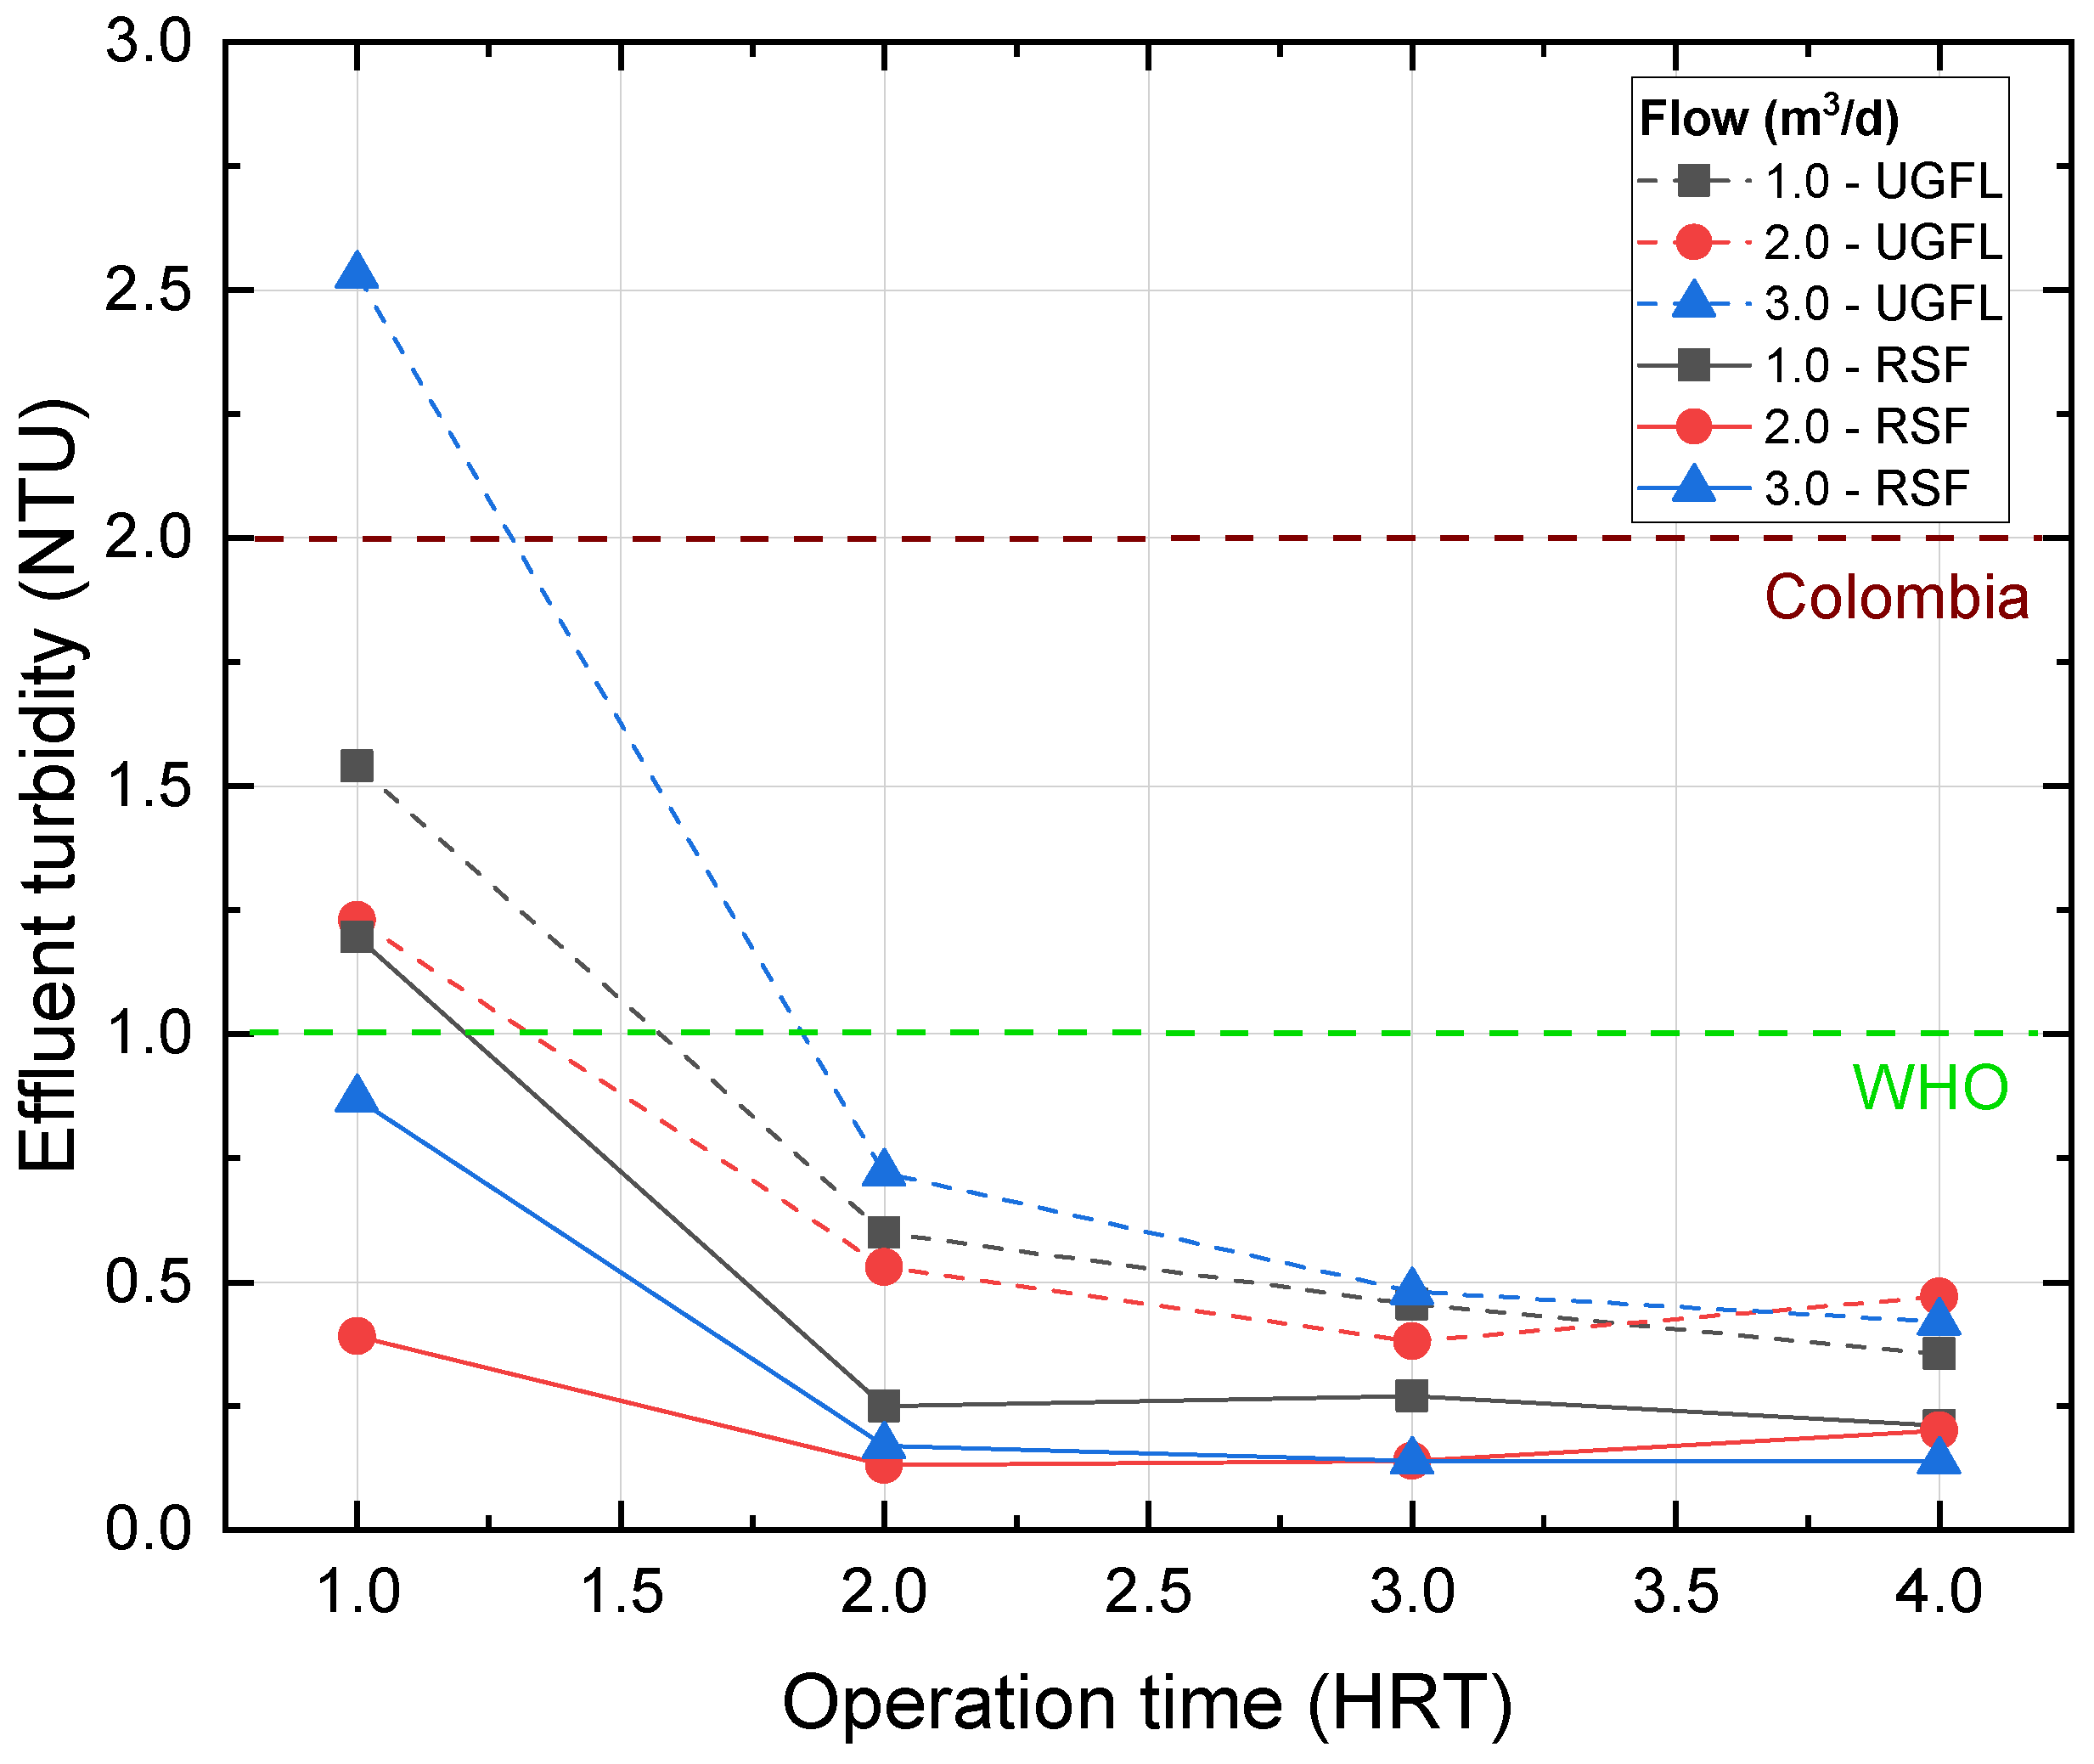
Figure 11 shows the turbidity in the UGFL and RSF effluents for the tests with increasing operating flow, with water type II and with the coagulant PACl, for operating times between 1 and 4 times the actual HRT. This figure shows that for 1 HRT, the lowest effluent turbidity is achieved for the flow of 2 m
/d (1.23 NTU and 0.39 NTU for UGFL and RSF, respectively). When the flow is increased to 3 m
/d, the effluent turbidity increases to values of 2.53 in UGFL and 0.87 in RSF.
After an operating time of 2 HRT, it was observed that the turbidity in the effluent of the UGFL was similar for the three flows evaluated, reaching values between 0.36 and 0.47 NTU at the end of the test. Similar behaviour was observed in the RSF, achieving effluent turbidity between 0.14 and 0.21 NTU for an operating time of 4 HRT for the three flows.
For the tests and for all operating times evaluated, the SDWTS effluent reported values for apparent colour (≤10 CU, for both flows), pH (2.0 m
/d: 6.68 ± 0.10–3.0 m
/d: 6.85 ± 0.08), and electrical conductivity (2.0 m
/d: 99.1 ± 1.6 µS/cm–3.0 m
/d: 97.8 ± 2.7 µS/cm) that comply with the maximum permissible limits for drinking water [
34].
