
Catalytic Ozonation for Effective Degradation of Coal Chemical Biochemical Tail Water by Mn/Ce@RM Catalyst


 and
and 
Abstract
:1. Introduction
2. Materials and Methods
2.1. Materials
2.2. Preparation of Supported Catalyst
2.3. Catalyst Characterization Method
2.4. Experimental Device and Process
2.5. Fuzzy Hierarchical Structure Model
3. Results and Discussions
3.1. Mn/Ce@RM Catalyst Preparation Optimization
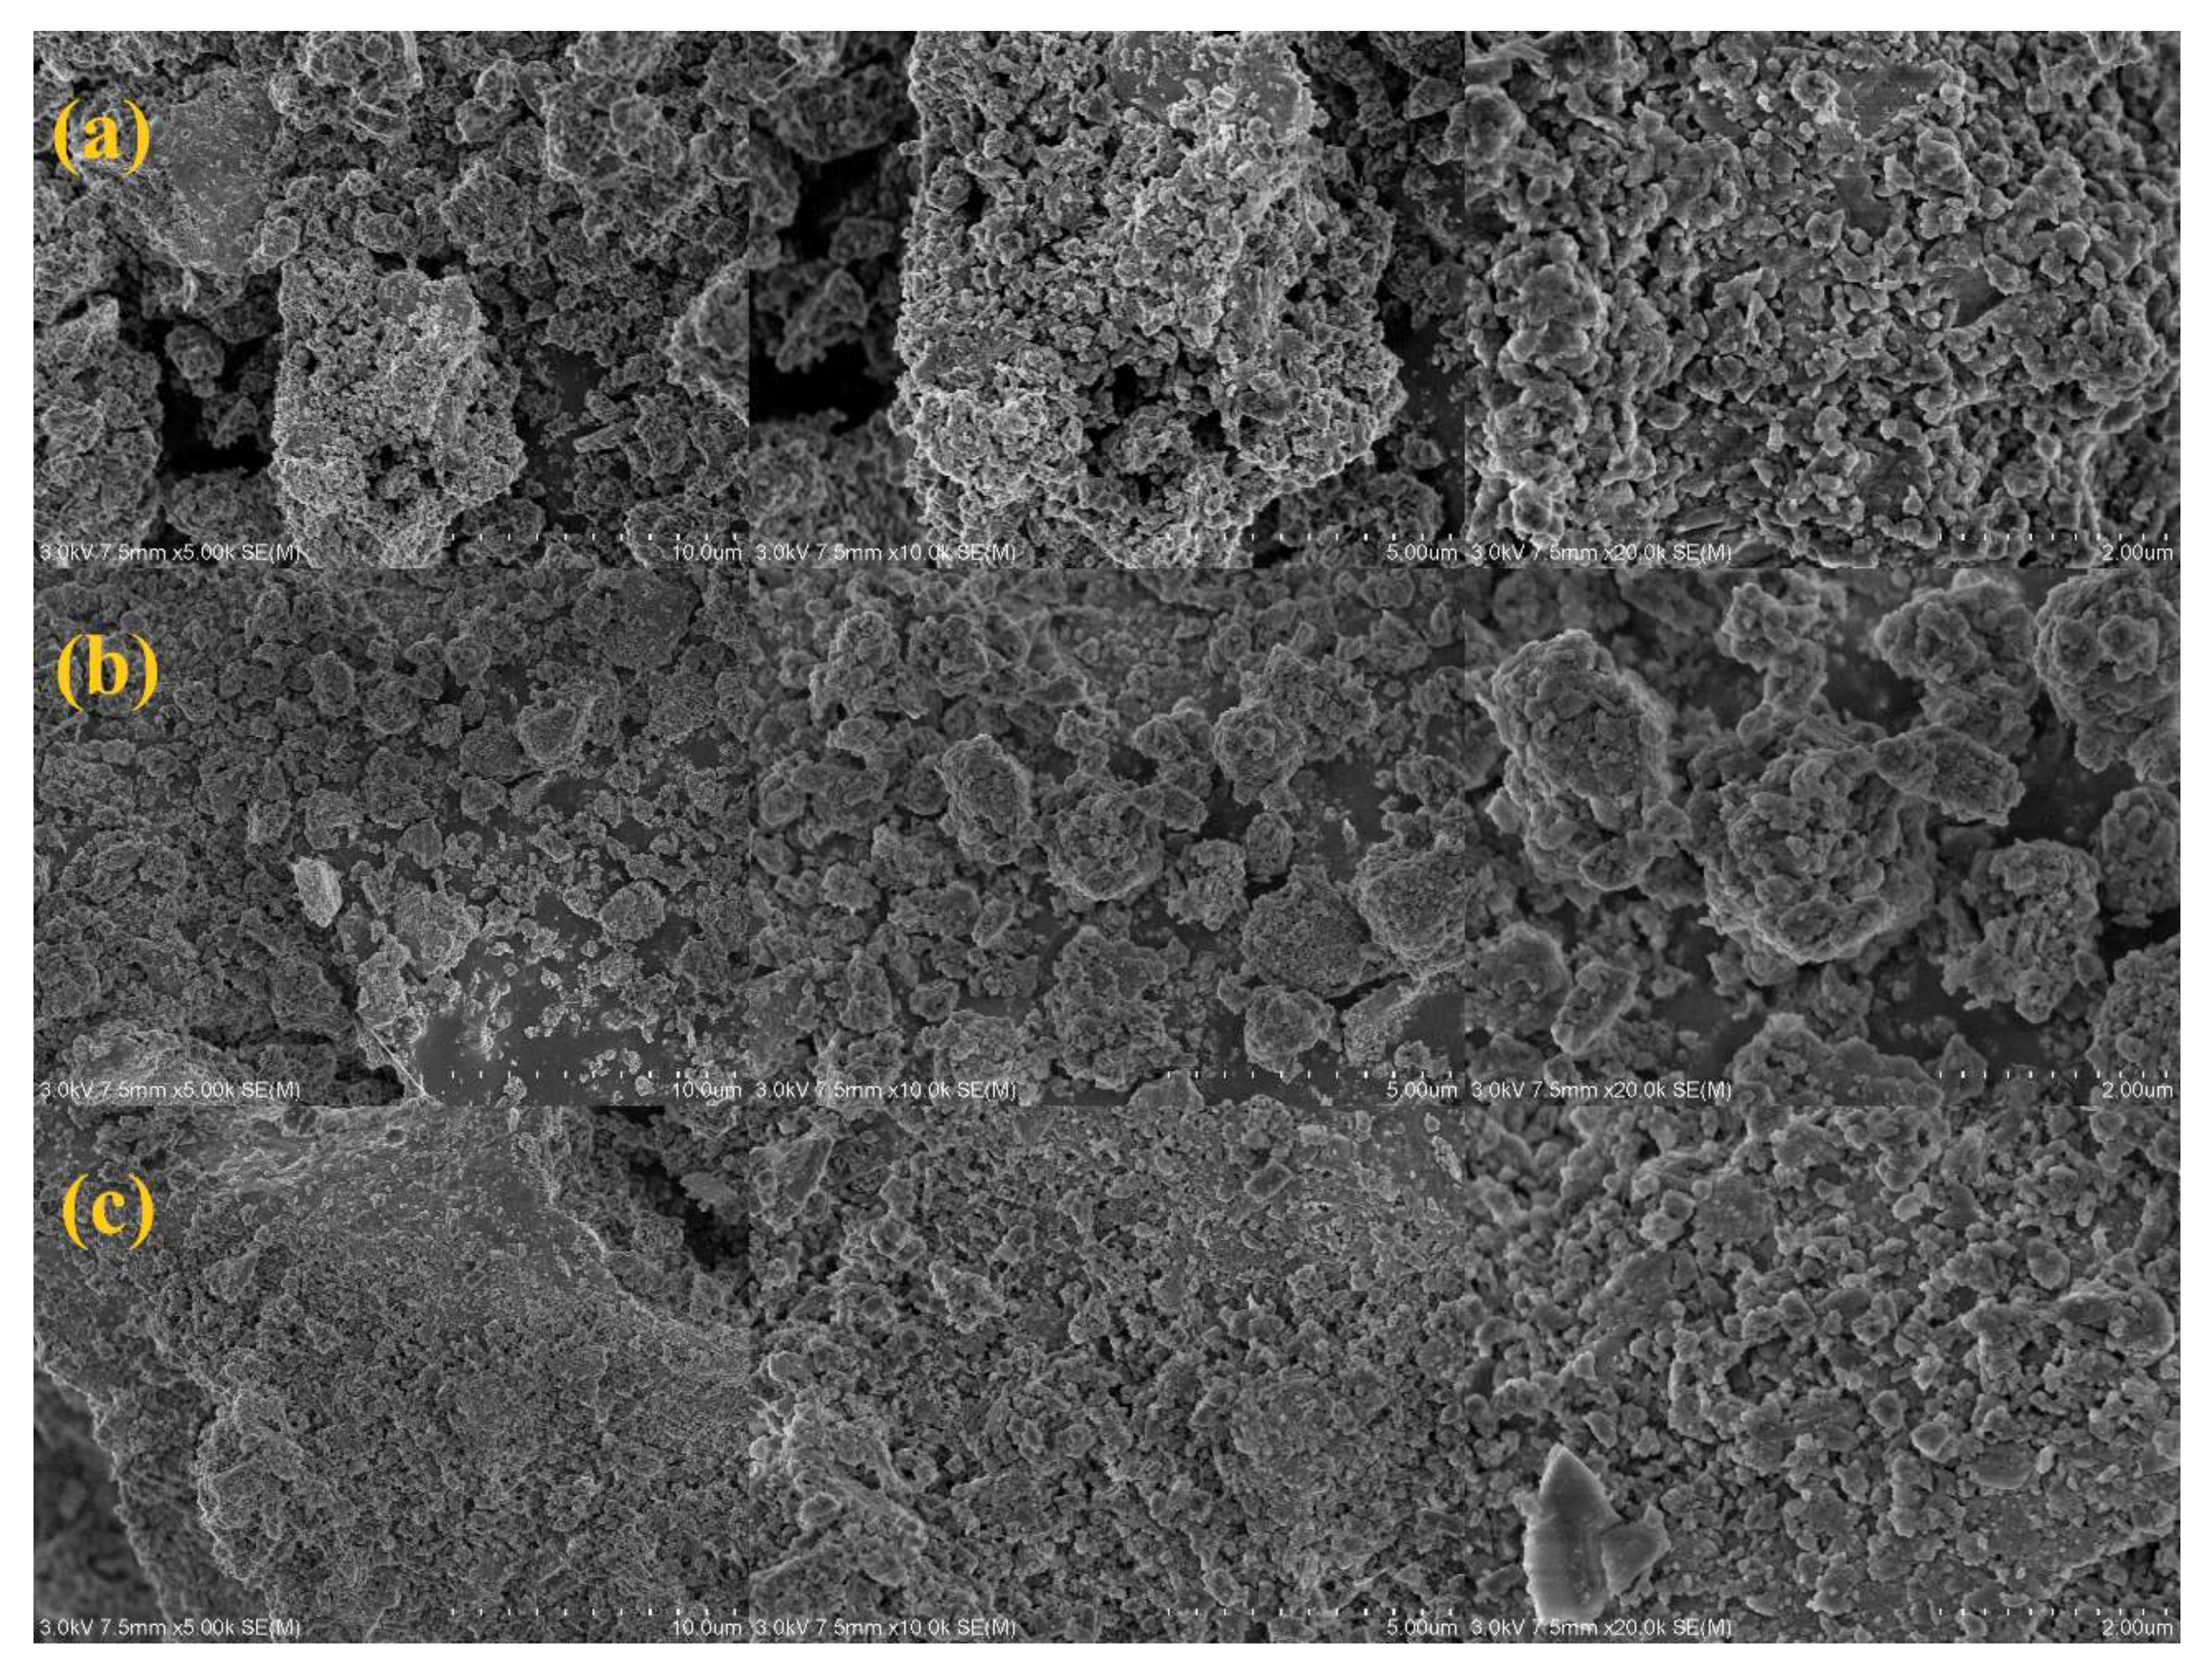
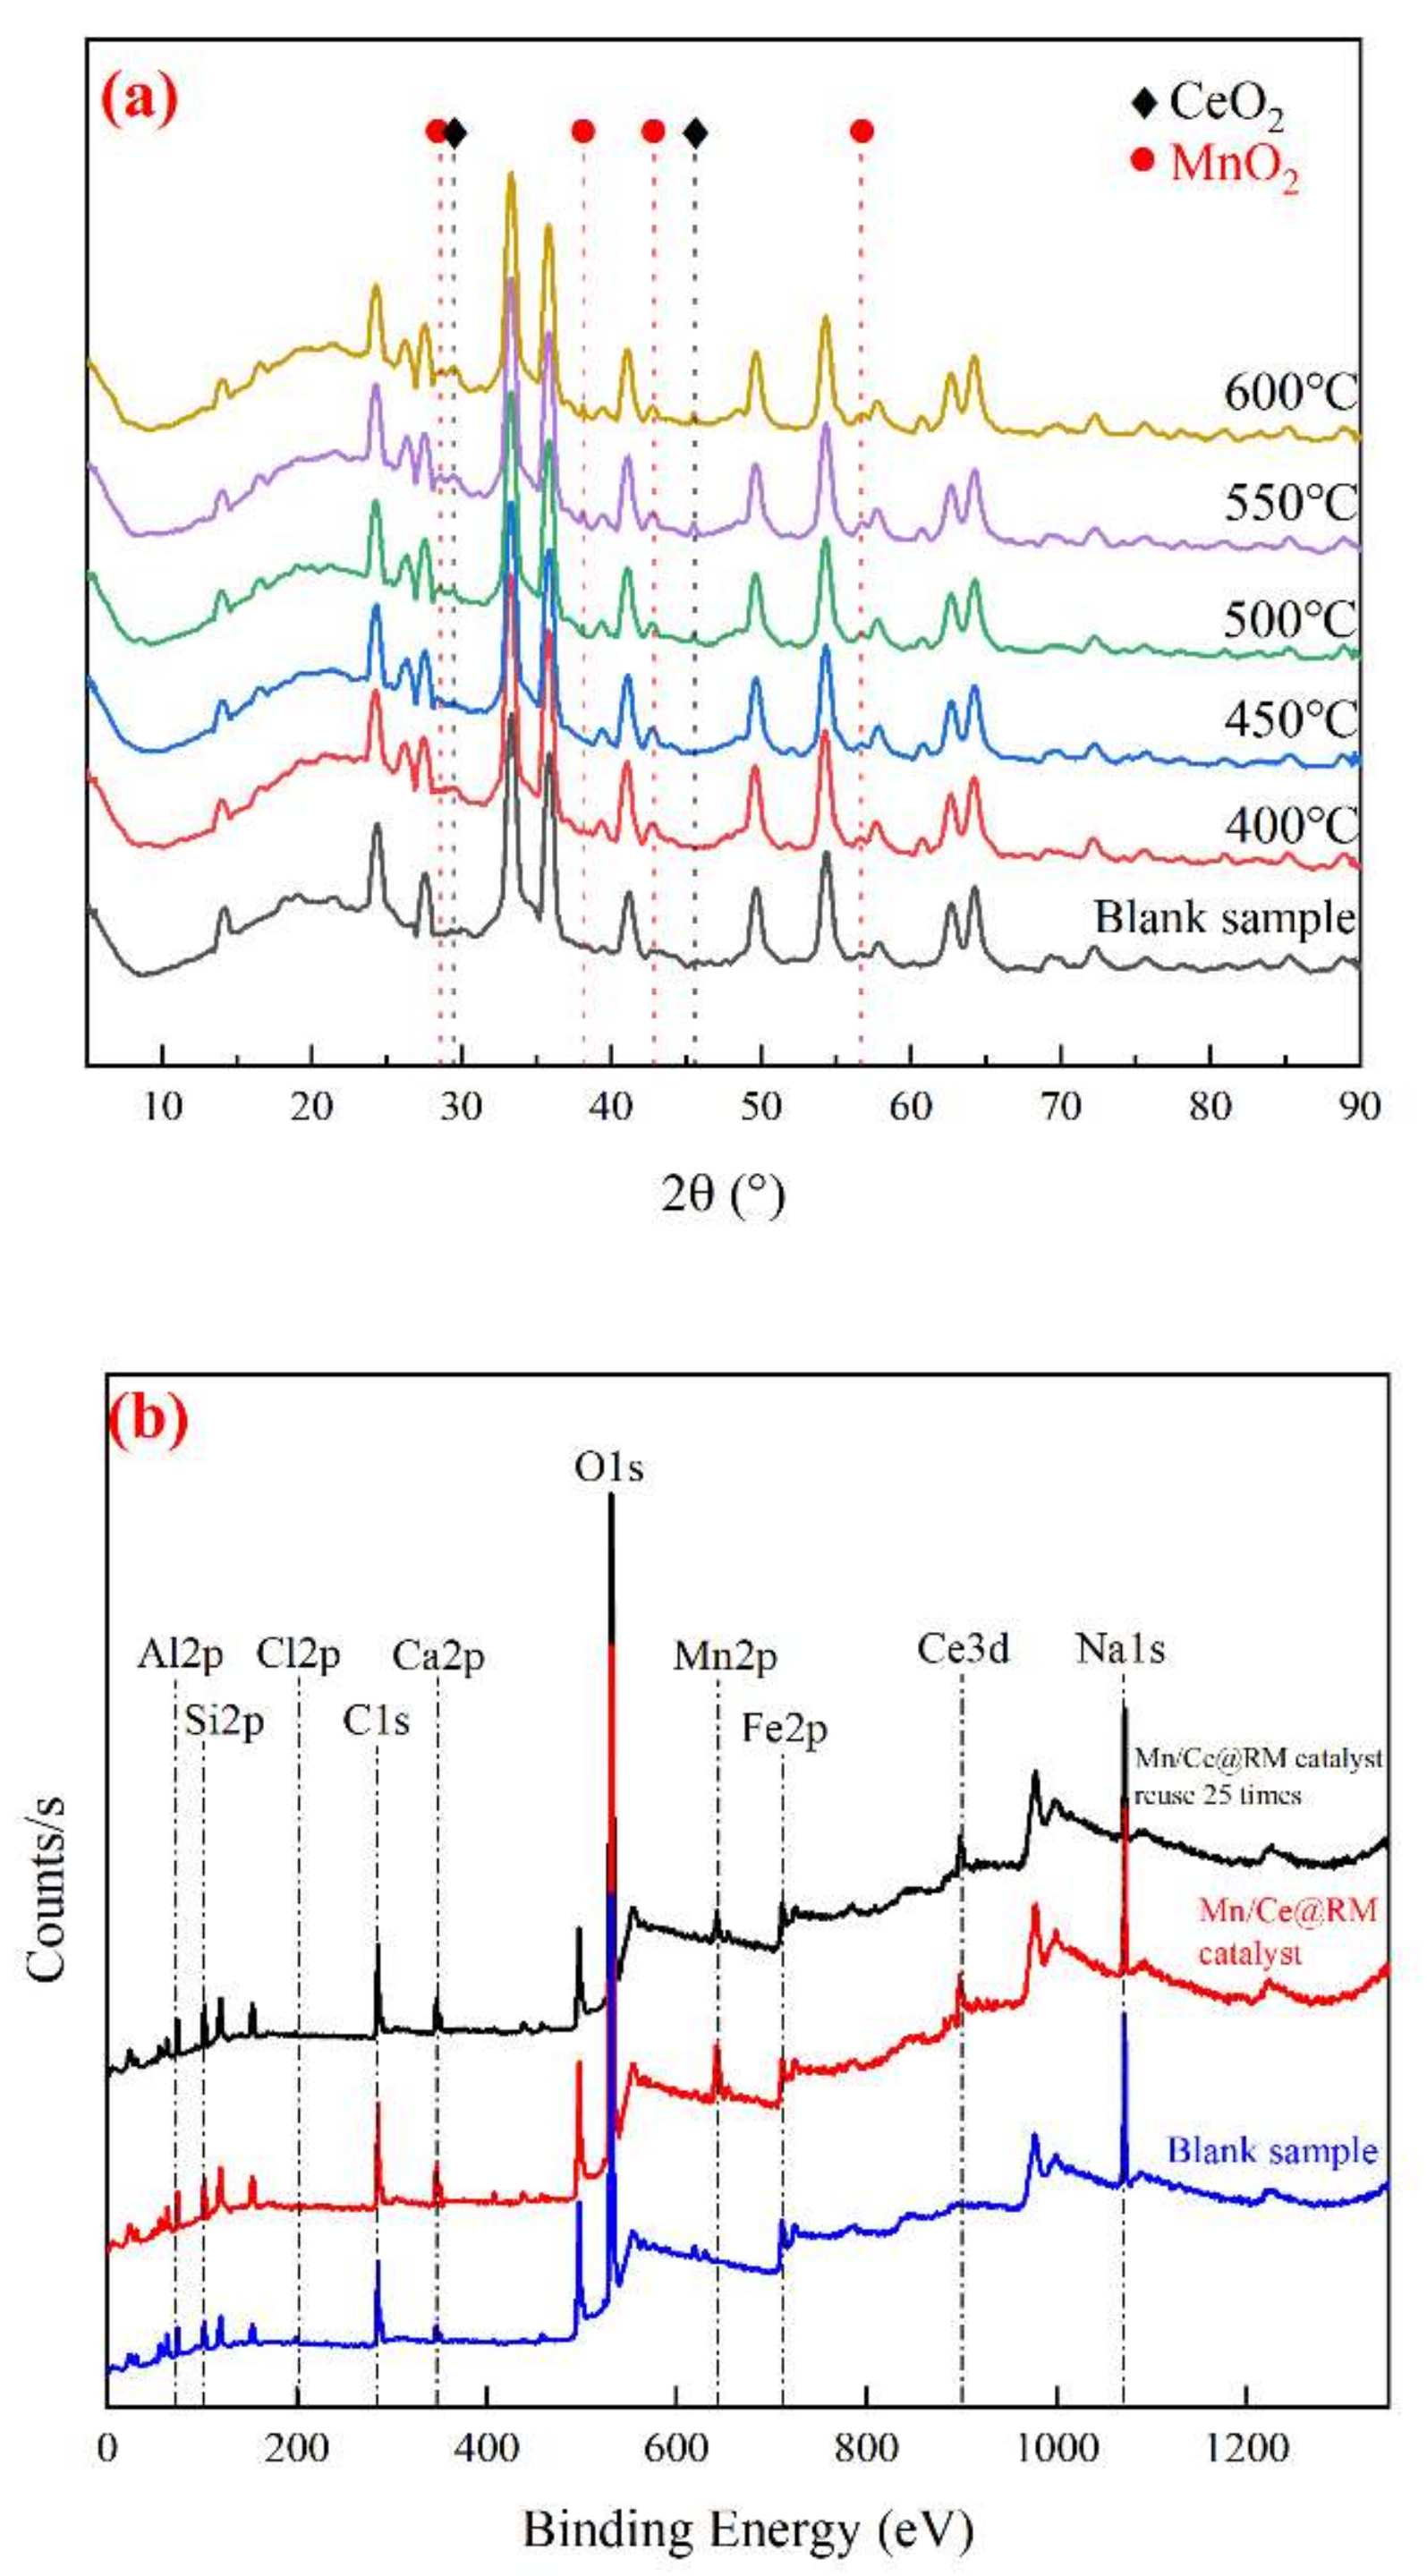
3.2. Characterization of the Mn/Ce@RM Catalyst
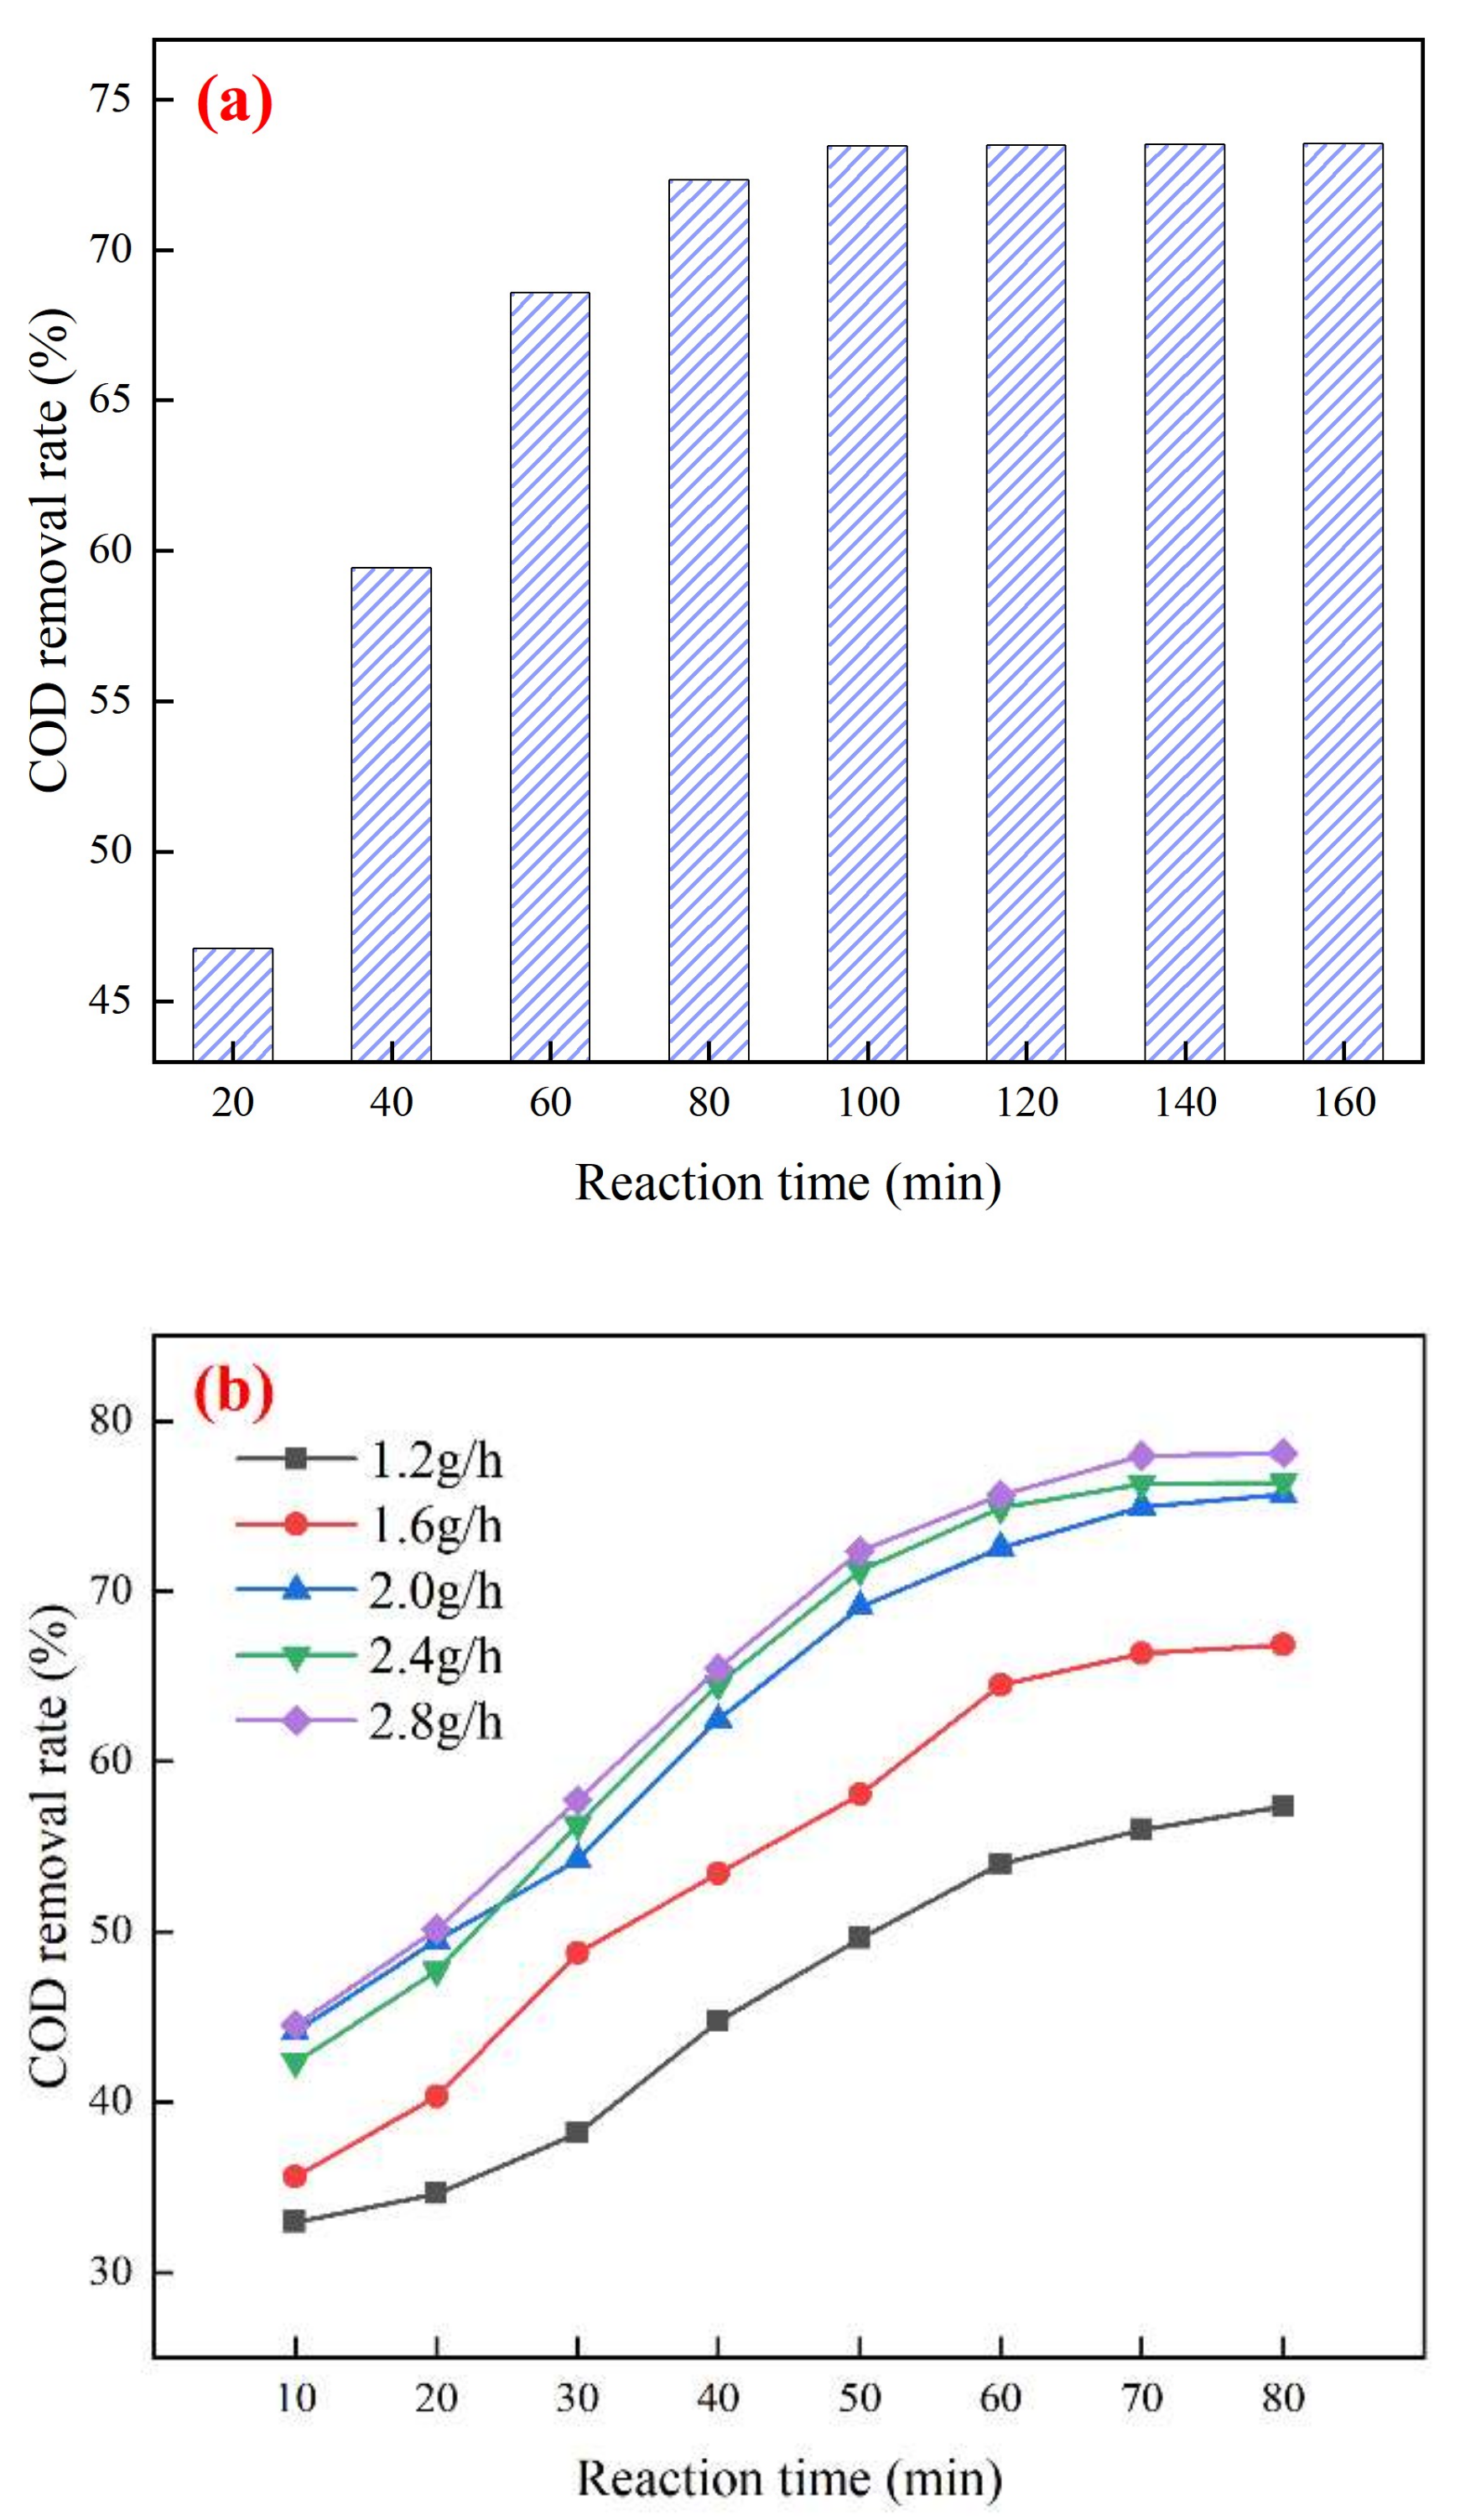
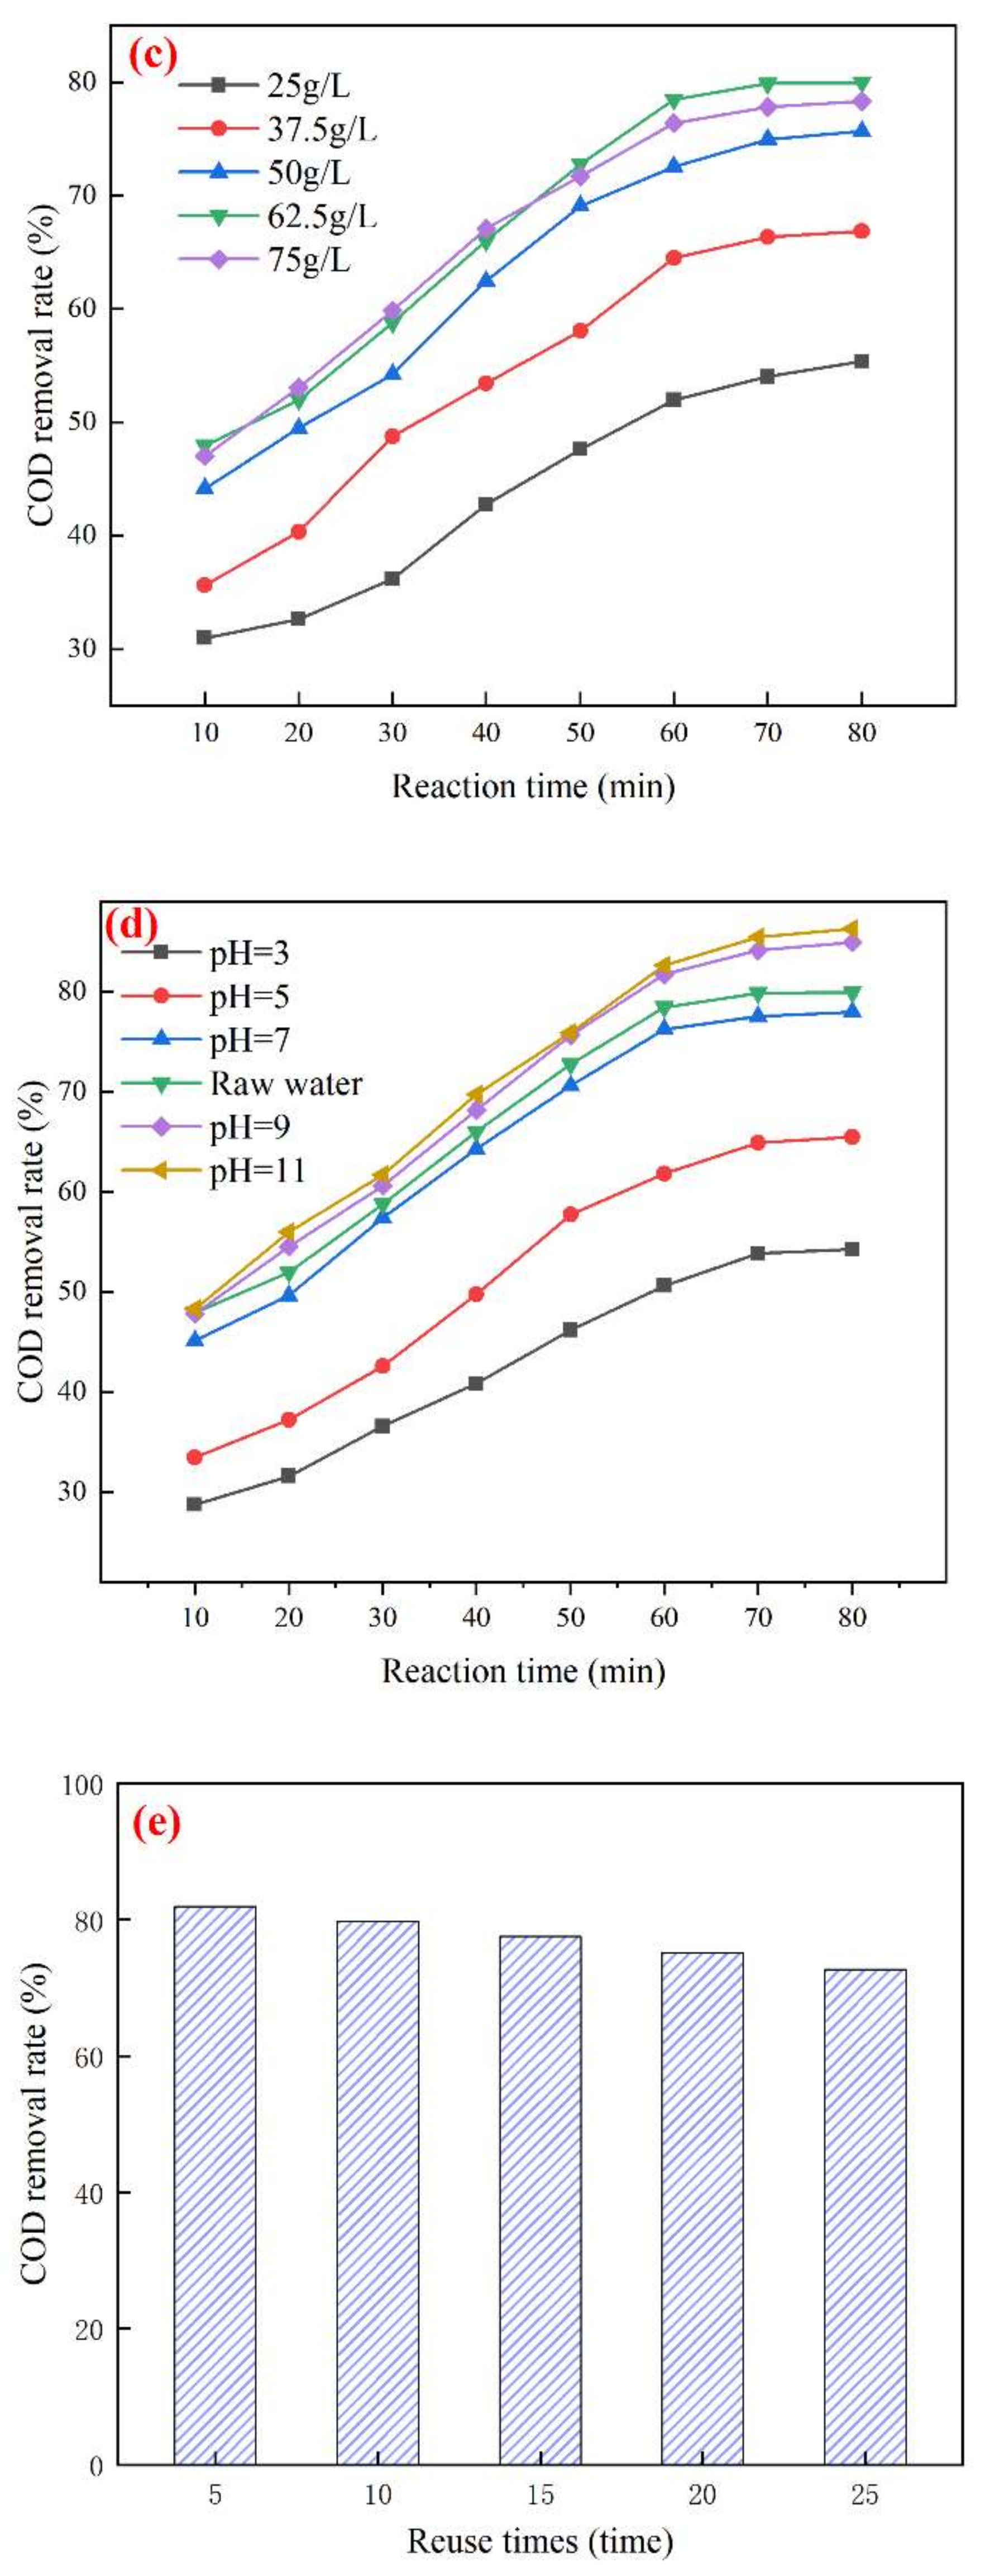
3.3. Study on the Best Operating Conditions for Catalytic Ozonation and Catalyst Stability
3.4. Mechanism Analysis of Catalytic Ozonation Degradation
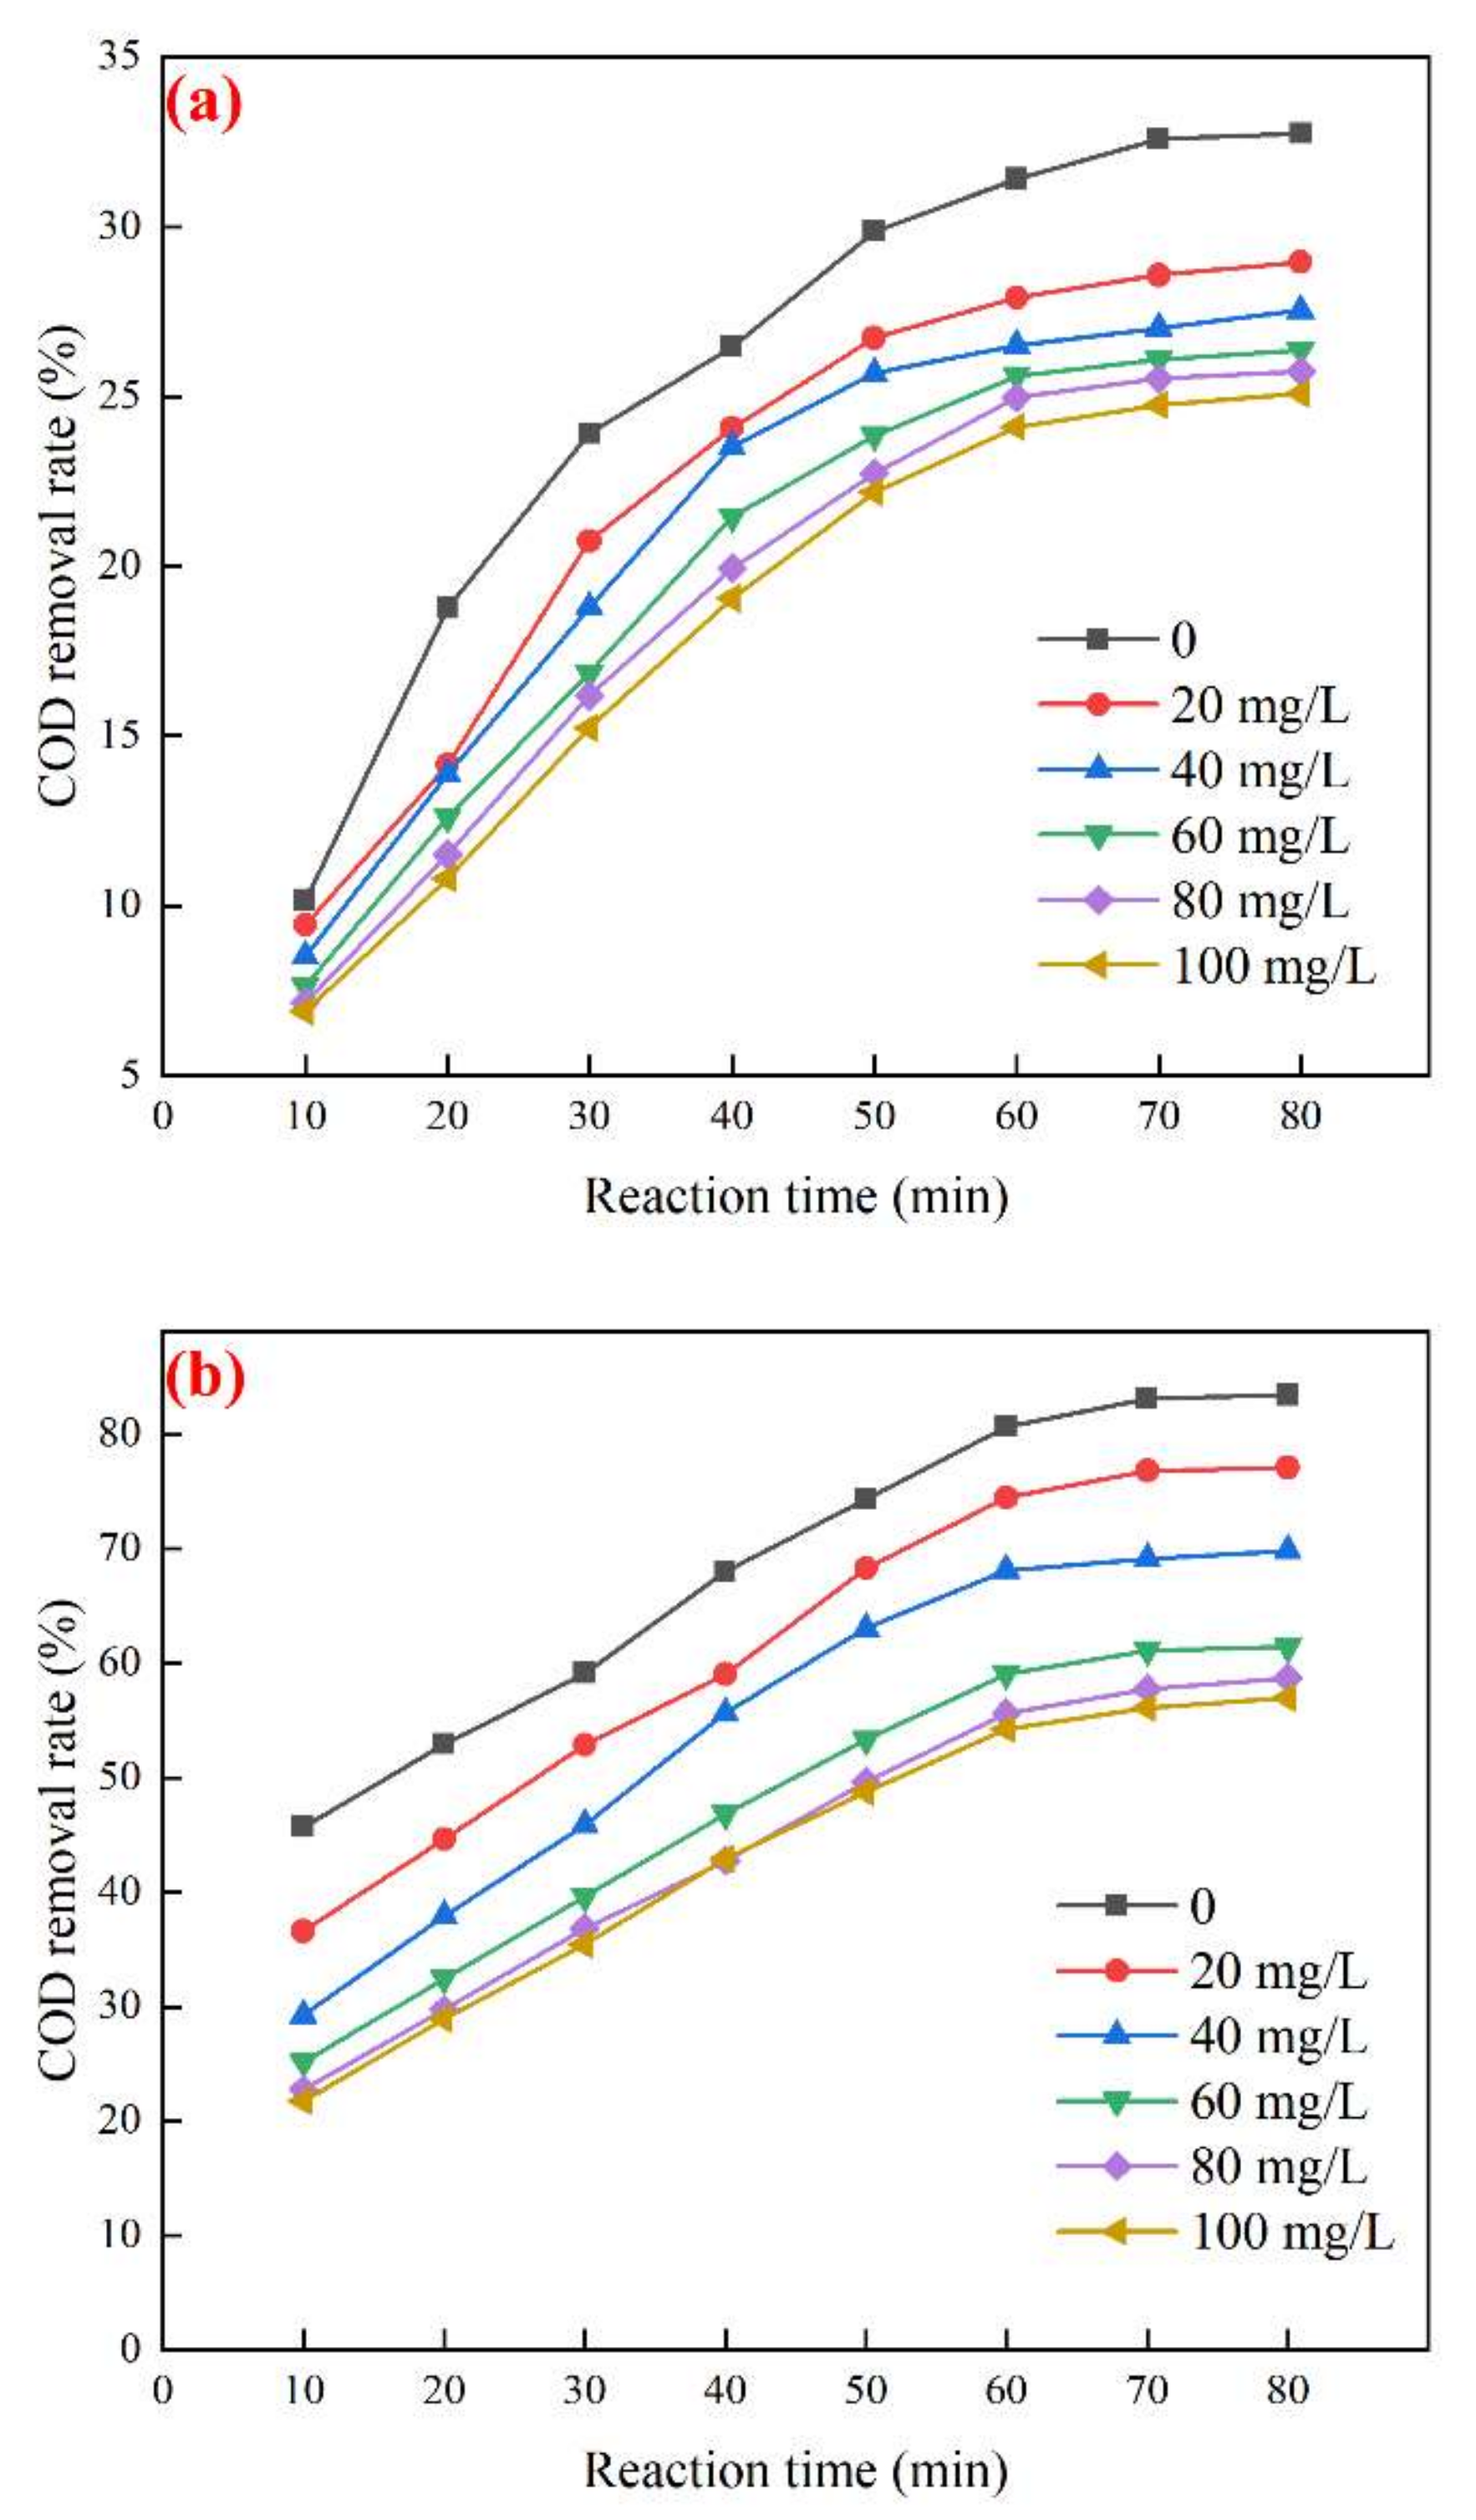
3.4.1. Effect of TBA on the Degradation Performance of Biochemical Tail Water
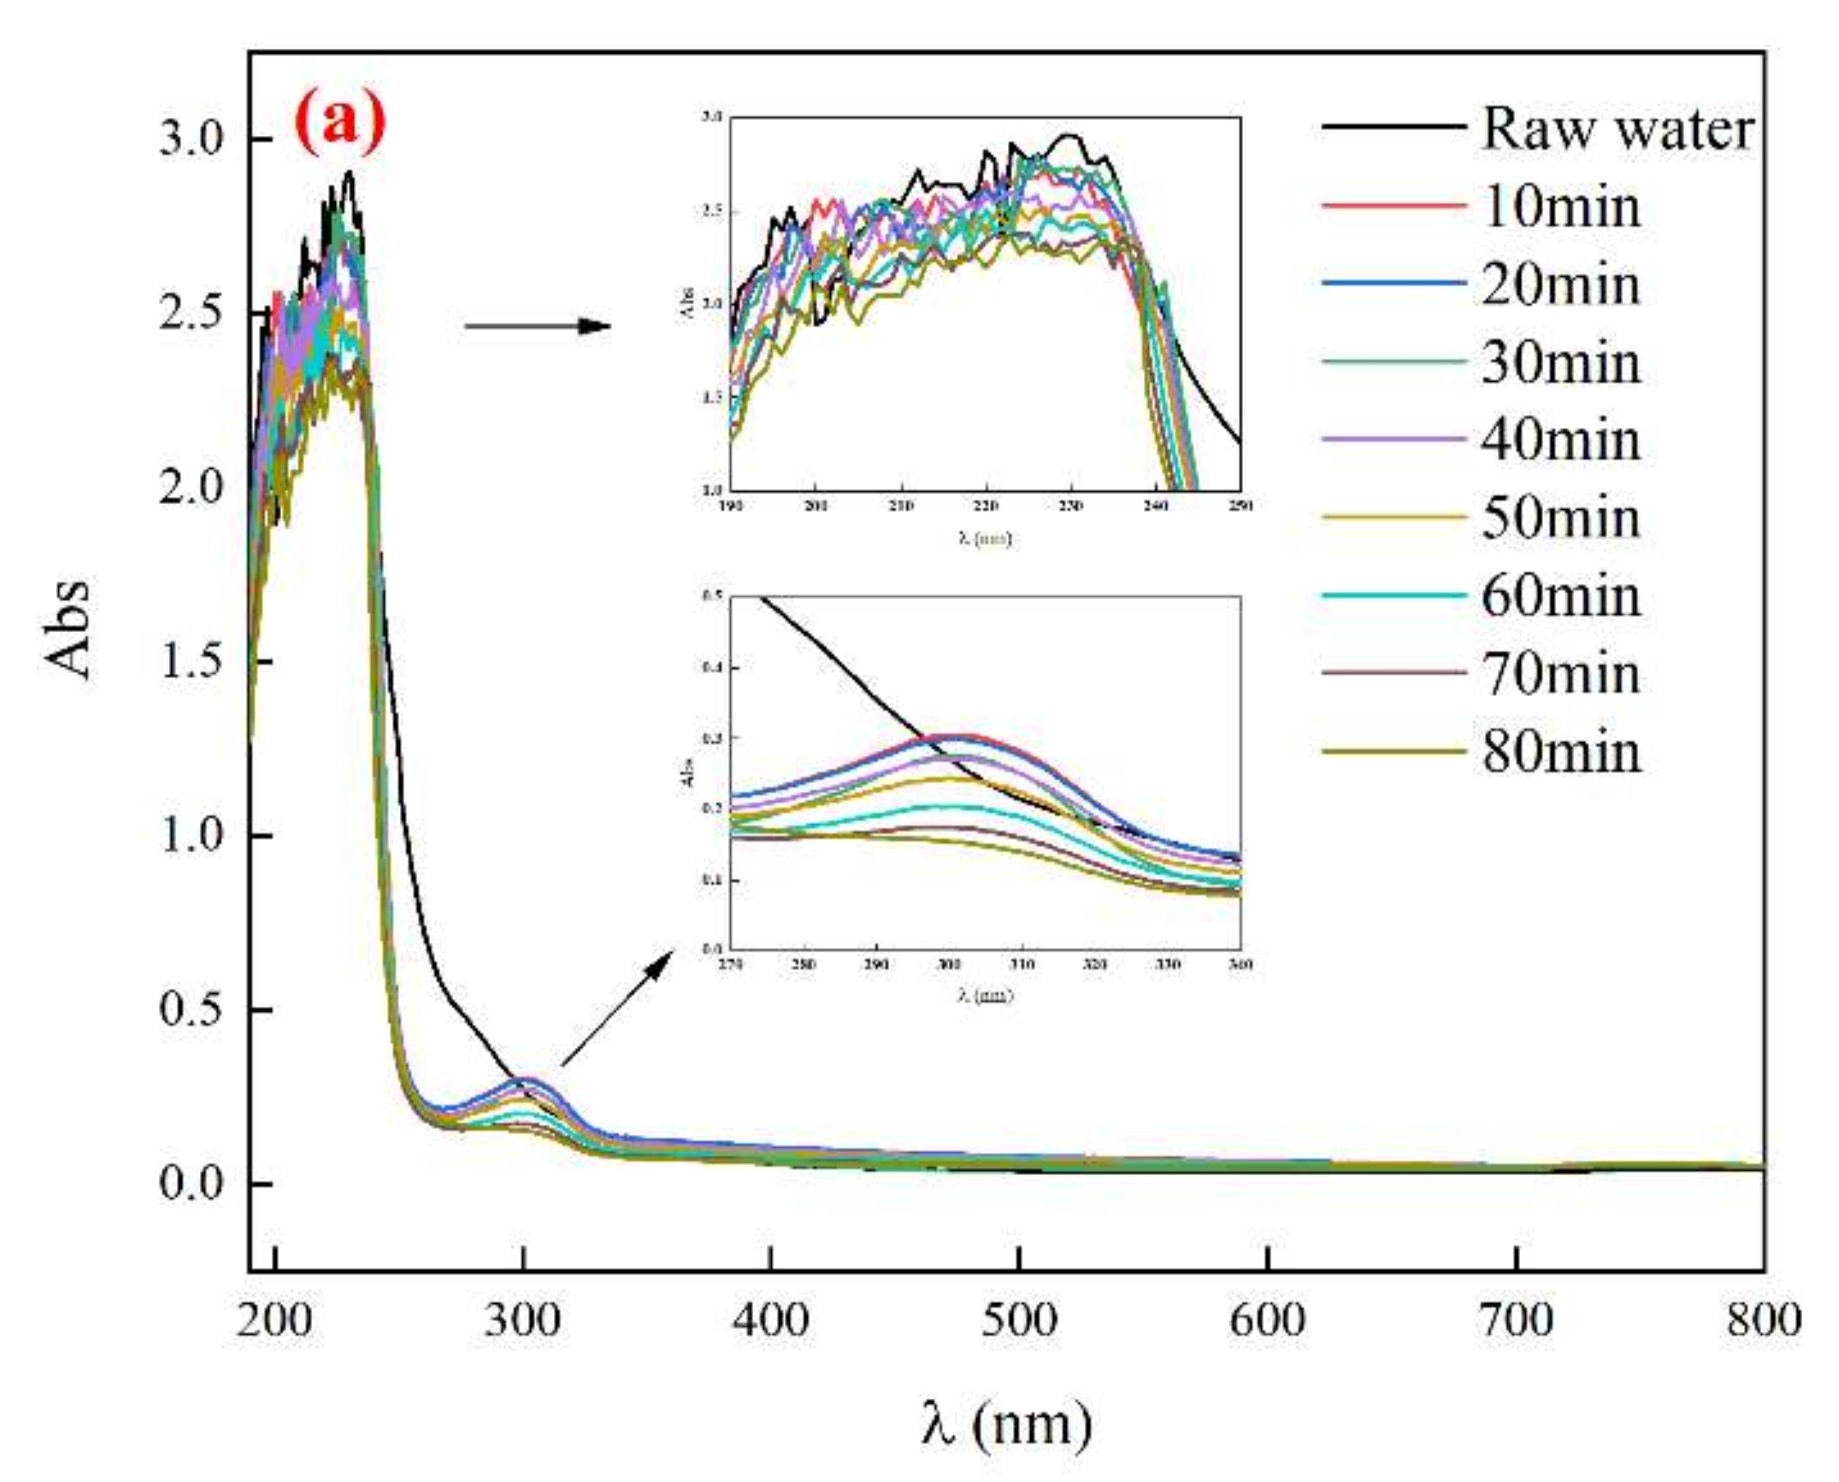
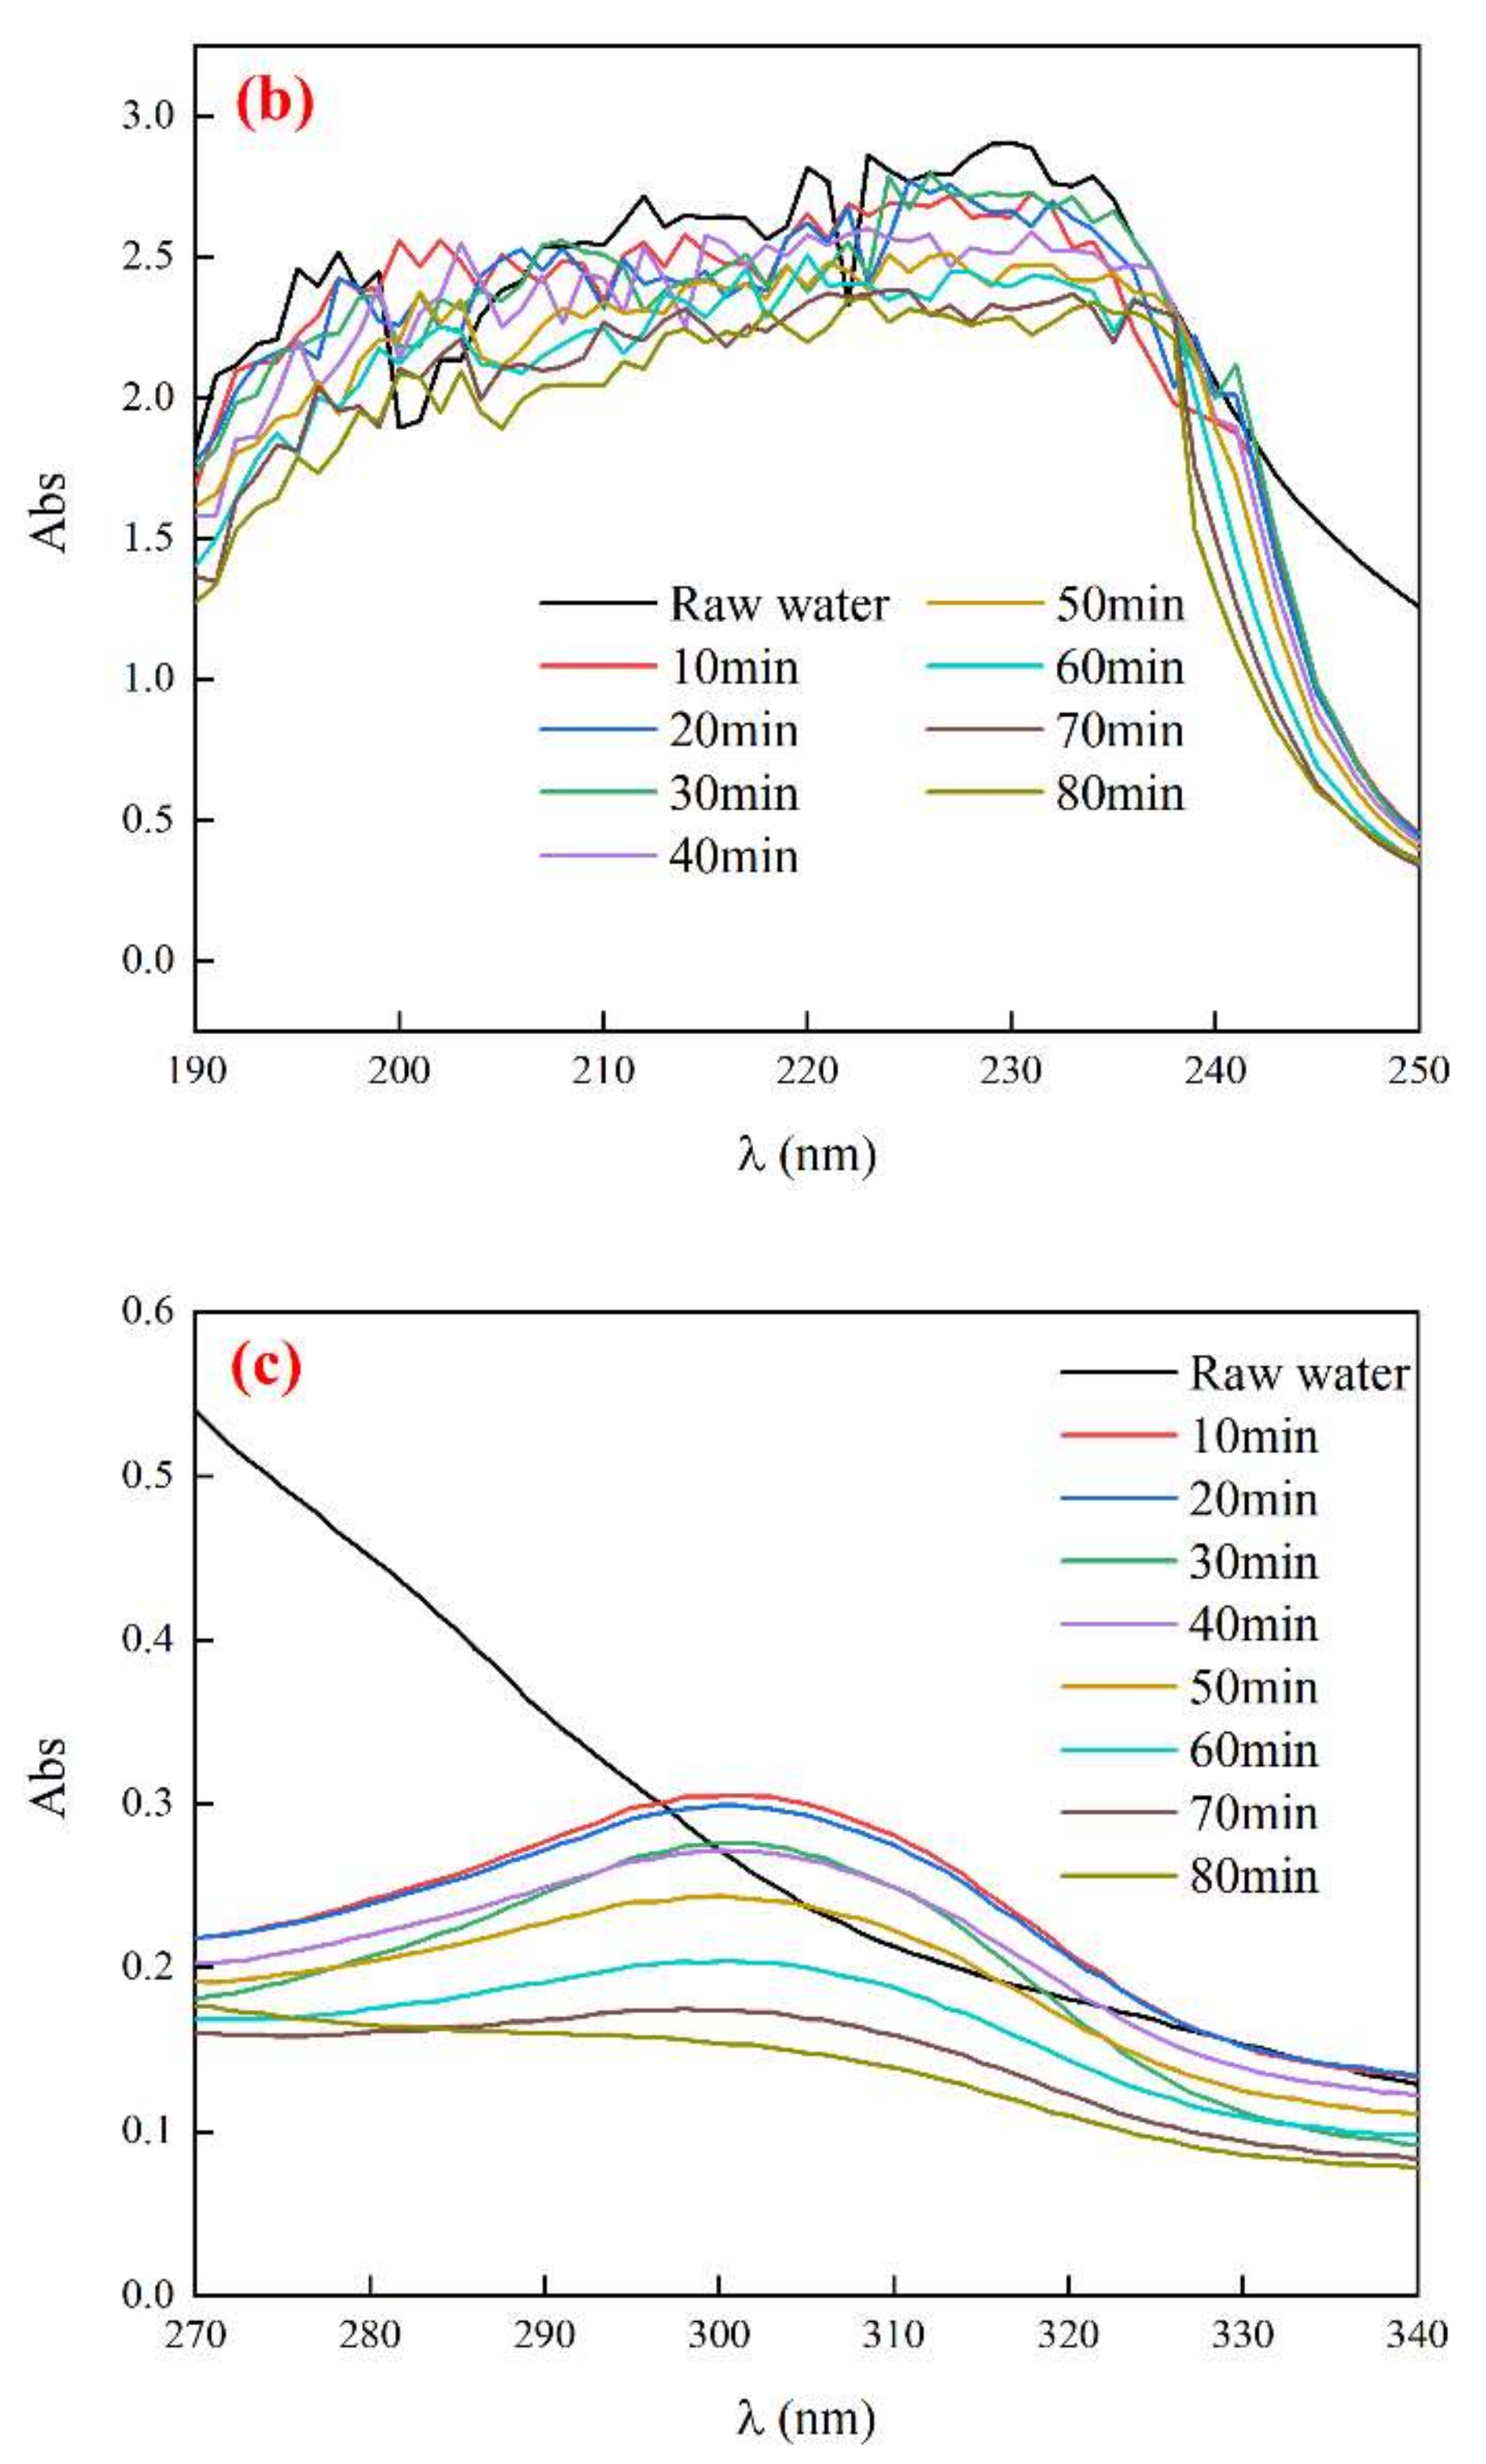
3.4.2. UV Absorption Peak of Biochemical Tail Water
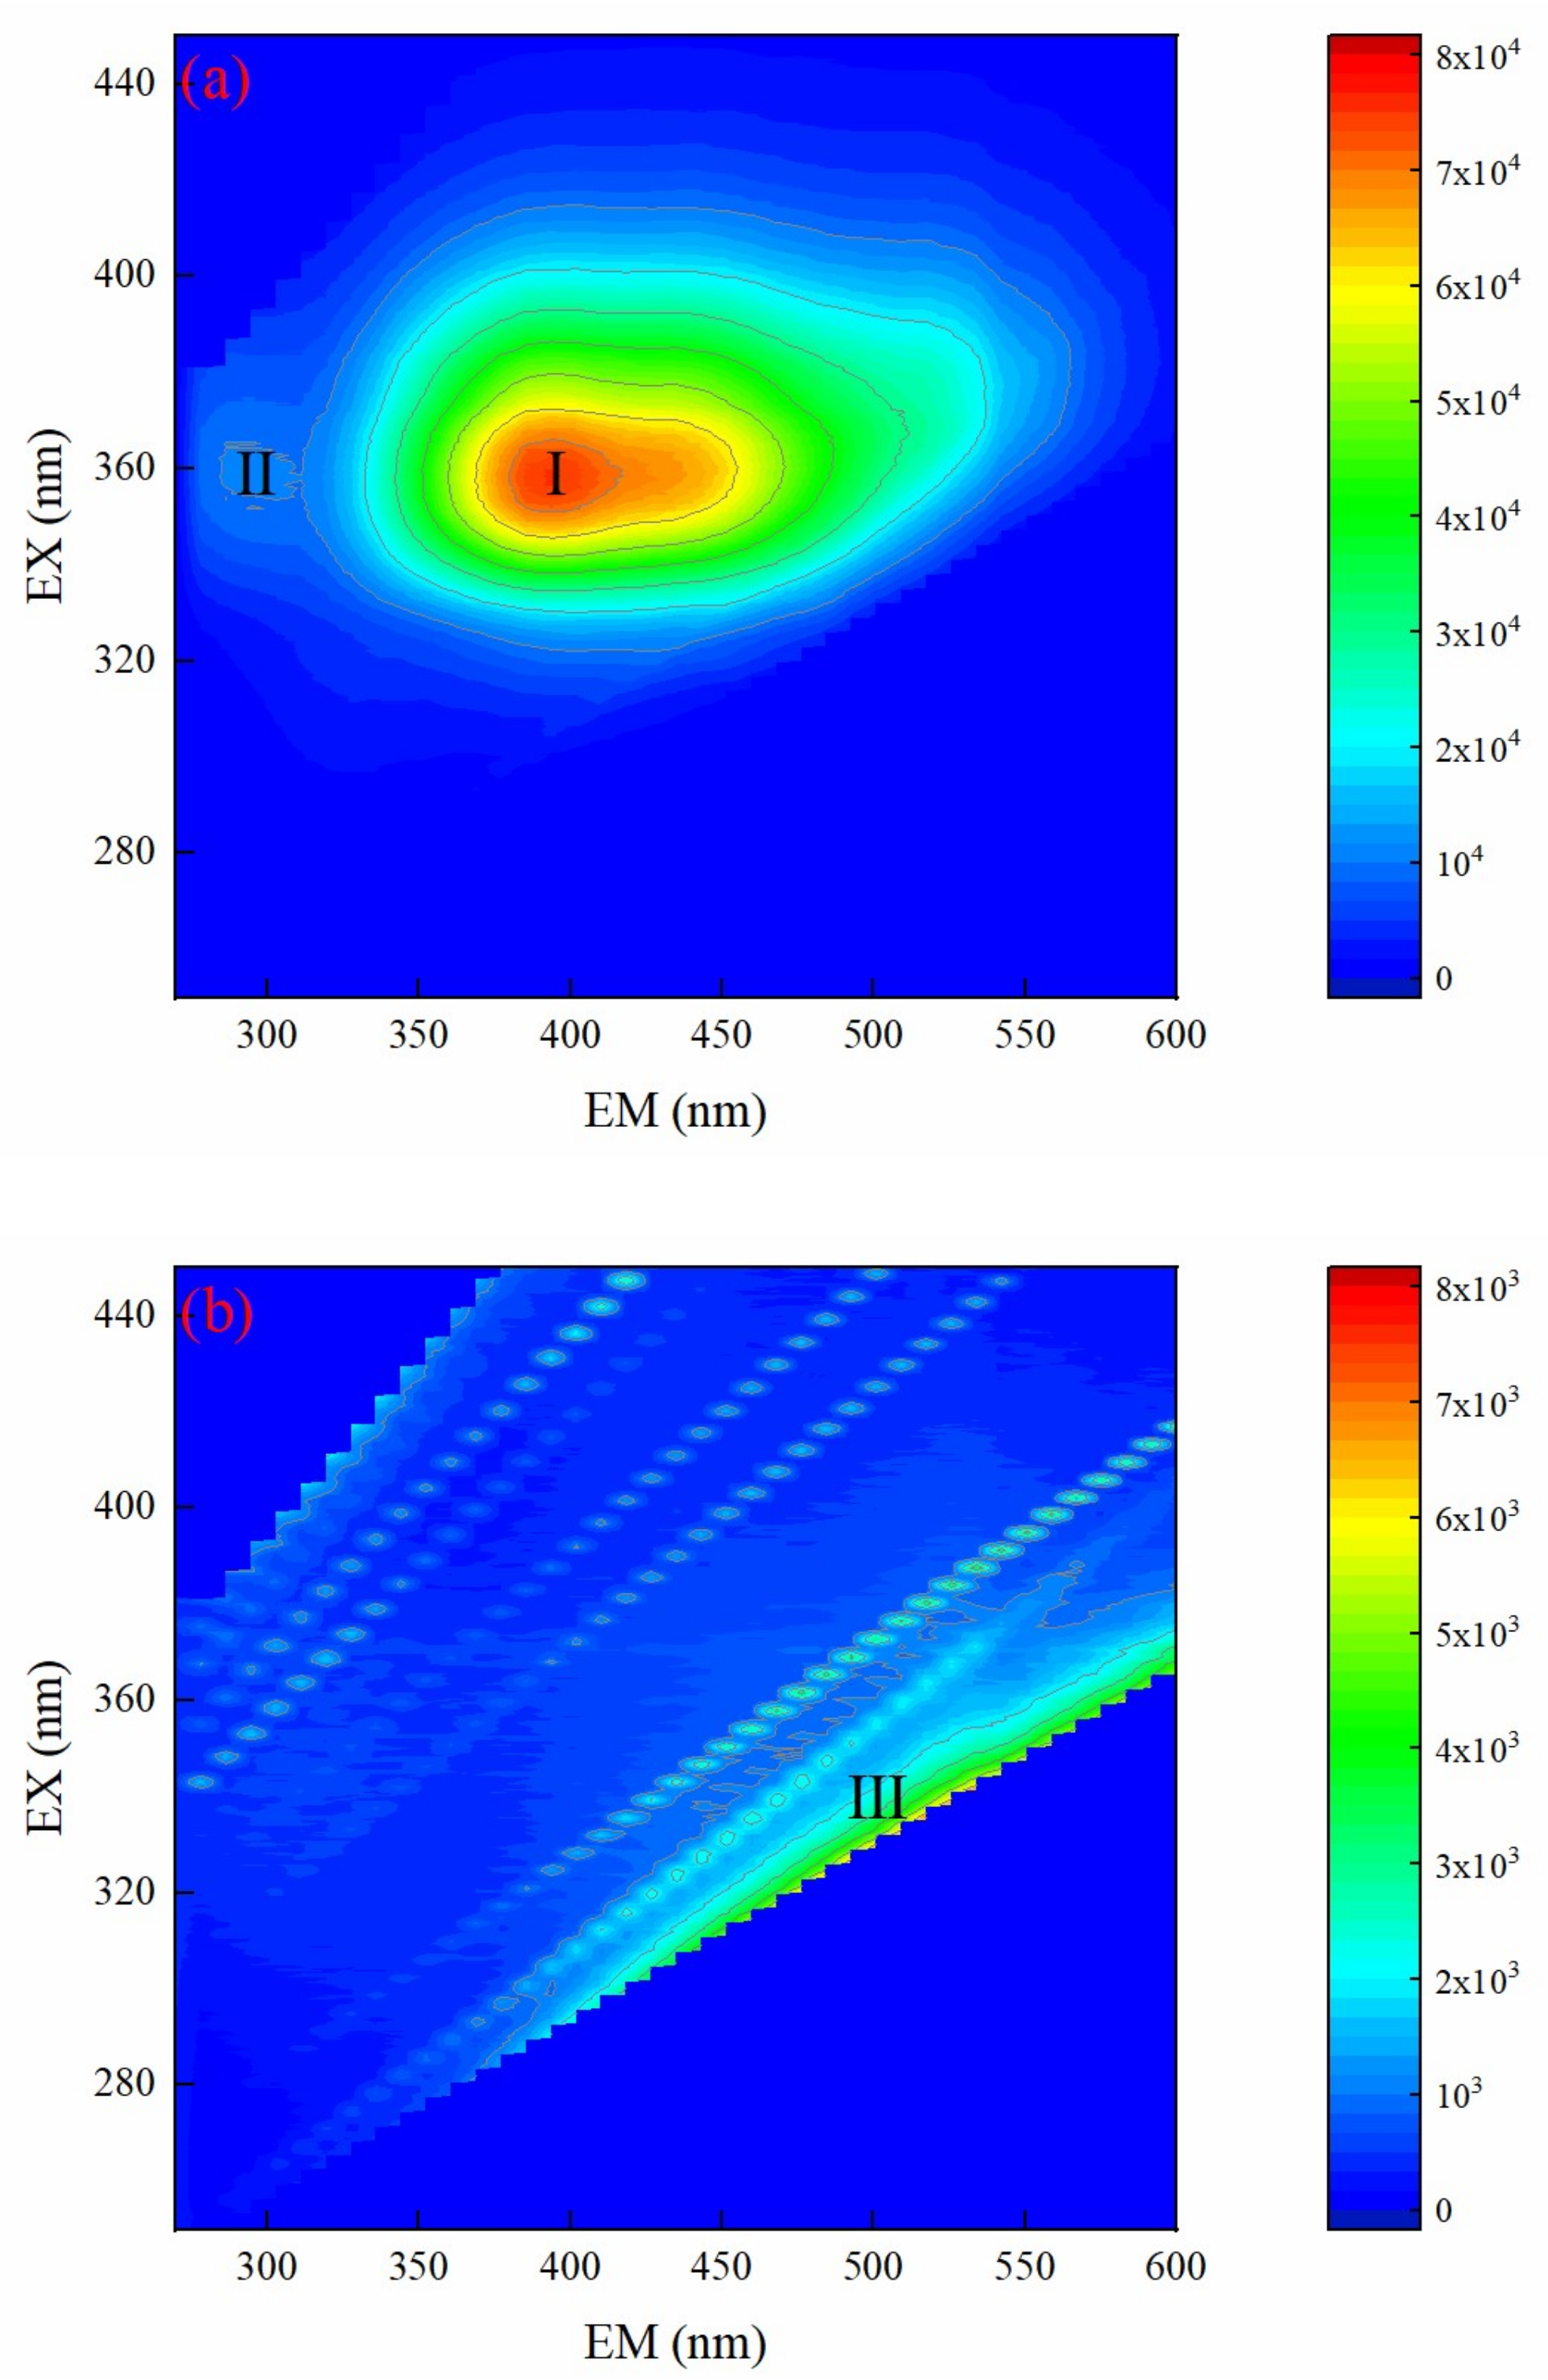
3.4.3. EEM Spectrum Analysis of Biochemical Tail Water
3.5. Fuzzy AHP
4. Conclusions
Supplementary Materials
Author Contributions
Funding
Data Availability Statement
Conflicts of Interest
References
- Hu, Z.; Zhu, Y.; Gao, Z.; Wang, G.; Liu, Y.; Liu, X.; Yuan, Z. CuO catalysts supported on activated red mud for efficient catalytic carbon monoxide oxidation. Chem. Eng. J. 2016, 302, 23–32. [Google Scholar] [CrossRef]
- Pietrantonio, M.; Pucciarmati, S.; Torelli, G.N.; Aria, G.D.; Forte, F.; Fontana, D. Towards an integrated approach for red mud valorisation: A focus on titanium. Int. J. Environ. Sci. Technol. 2021, 18, 455–462. [Google Scholar] [CrossRef]
- Evans, K. The history, challenges, and new developments in the management and use of bauxite residue. J. Sustain. Metall. 2016, 2, 316–331. [Google Scholar] [CrossRef] [Green Version]
- Mayes, W.M.; Burke, I.T.; Gomes, H.I.; Anton, Á.D.; Molnár, M.; Feigl, V.; Ujaczki, É. Advances in understanding environmental risks of red mud after the ajka spill, hungary. J. Sustain. Metall. 2016, 2, 332–343. [Google Scholar] [CrossRef] [Green Version]
- Luo, M.; Qi, X.; Zhang, Y.; Ren, Y.; Tong, J.; Chen, Z.; Hou, Y.; Yeerkebai, N.; Wang, H.; Feng, S.; et al. Study on dealkalization and settling performance of red mud. Environ. Sci. Pollut. R. 2017, 24, 1794–1802. [Google Scholar] [CrossRef]
- Pepper, R.A.; Couperthwaite, S.J.; Millar, G.J. Value adding red mud waste: Impact of red mud composition upon fluoride removal performance of synthesised akaganeite sorbents. J. Environ. Chem. Eng. 2018, 6, 2063–2074. [Google Scholar] [CrossRef] [Green Version]
- Li, H.; Xu, B.; Qi, F.; Sun, D.; Chen, Z. Degradation of bezafibrate in wastewater by catalytic ozonation with cobalt doped red mud: Efficiency, intermediates and toxicity. Appl. Catal. B Environ. 2014, 152–153, 342–351. [Google Scholar] [CrossRef]
- Wang, L.; Sun, N.; Tang, H.; Sun, W. A review on comprehensive utilization of red mud and prospect analysis. Minerals 2019, 9, 362. [Google Scholar] [CrossRef] [Green Version]
- Pande, G.; Selvakumar, S.; Ciotonea, C.; Giraudon, J.; Lamonier, J.; Batra, V.S. Modified red mud catalyst for volatile organic compounds oxidation. Catalysts 2021, 11, 838. [Google Scholar] [CrossRef]
- Wu, J.; Gong, Z.; Lu, C.; Niu, S.; Ding, K.; Xu, L.; Zhang, K. Preparation and performance of modified red Mud-Based catalysts for selective catalytic reduction of NOx with NH3. Catalysts 2018, 8, 35. [Google Scholar] [CrossRef] [Green Version]
- Joseph, C.G.; Taufiq-Yap, Y.H.; Krishnan, V.; Puma, G.L. Application of modified red mud in environmentally-benign applications: A review paper. Environ. Eng. Res. 2020, 25, 795–806. [Google Scholar] [CrossRef]
- Ye, J.; Cong, X.; Zhang, P.; Hoffmann, E.; Zeng, G.; Liu, Y.; Fang, W.; Wu, Y.; Zhang, H. Interaction between phosphate and acid-activated neutralized red mud during adsorption process. Appl. Surf. Sci. 2015, 356, 128–134. [Google Scholar] [CrossRef]
- Kim, S.C.; Nahm, S.W.; Park, Y. Property and performance of red mud-based catalysts for the complete oxidation of volatile organic compounds. J. Hazard. Mater. 2015, 300, 104–113. [Google Scholar] [CrossRef] [PubMed]
- Ryu, S.; Lee, J.; Reddy Kannapu, H.P.; Jang, S.; Kim, Y.; Jang, H.; Ha, J.; Jung, S.; Park, Y. Acid-treated waste red mud as an efficient catalyst for catalytic fast copyrolysis of lignin and polyproylene and ozone-catalytic conversion of toluene. Environ. Res. 2020, 191, 110149. [Google Scholar] [CrossRef] [PubMed]
- Xu, B.; Qi, F.; Sun, D.; Chen, Z.; Robert, D. Cerium doped red mud catalytic ozonation for bezafibrate degradation in wastewater: Efficiency, intermediates, and toxicity. Chemosphere 2016, 146, 22–31. [Google Scholar] [CrossRef]
- Nayak, M.; Dhanarajan, G.; Dineshkumar, R.; Sen, R. Artificial intelligence driven process optimization for cleaner production of biomass with co-valorization of wastewater and flue gas in an algal biorefinery. J. Clean. Prod. 2018, 201, 1092–1100. [Google Scholar] [CrossRef]
- Guo, C.; Tan, Y.; Yang, S.; Qian, Y. Development of phenols recovery process with novel solvent methyl propyl ketone for extracting dihydric phenols from coal gasification wastewater. J. Clean. Prod. 2018, 198, 1632–1640. [Google Scholar] [CrossRef]
- Sun, W.; Sun, Y.; Zhu, H.; Zheng, H. Catalytic activity and evaluation of Fe-Mn@Bt for ozonizing coal chemical biochemical tail water. Sep. Purif. Technol. 2020, 239, 116524. [Google Scholar] [CrossRef]
- Chen, J.; He, Z.; Ji, Y.; Li, G.; An, T.; Choi, W. OH radicals determined photocatalytic degradation mechanisms of gaseous styrene in TiO2 system under 254 nm versus 185 nm irradiation: Combined experimental and theoretical studies. Appl. Catal. B Environ. 2019, 257, 117912. [Google Scholar] [CrossRef]
- Jaafarzadeh, N.; Ghanbari, F.; Ahmadi, M. Efficient degradation of 2,4-dichlorophenoxyacetic acid by peroxymonosulfate/magnetic copper ferrite nanoparticles/ozone: A novel combination of advanced oxidation processes. Chem. Eng. J. 2017, 320, 436–447. [Google Scholar] [CrossRef]
- Nobbs, J.; Tizaoui, C. A modified indigo method for the determination of ozone in nonaqueous solvents. Ozone Sci. Eng. 2014, 36, 110–120. [Google Scholar] [CrossRef] [Green Version]
- Lin, Y.; Wang, W.; Pan, S.; Ho, C.; Hou, C.; Chiang, P. Environmental impacts and benefits of organic Rankine cycle power generation technology and wood pellet fuel exemplified by electric arc furnace steel industry. Appl. Energy 2016, 183, 369–379. [Google Scholar] [CrossRef]
- Qi, F.; Chu, W.; Xu, B. Catalytic degradation of caffeine in aqueous solutions by cobalt-MCM41 activation of peroxymonosulfate. Appl. Catal. B Environ. 2013, 134–135, 324–332. [Google Scholar] [CrossRef]
- Gomes, J.; Costa, R.; Quinta-Ferreira, R.M.; Martins, R.C. Application of ozonation for pharmaceuticals and personal care products removal from water. Sci. Total Environ. 2017, 586, 265–283. [Google Scholar] [CrossRef]
- Wang, J.; Bai, Z. Fe-based catalysts for heterogeneous catalytic ozonation of emerging contaminants in water and wastewater. Chem. Eng. J. 2017, 312, 79–98. [Google Scholar] [CrossRef]
- Wang, Y.; Xie, Y.; Sun, H.; Xiao, J.; Cao, H.; Wang, S. 2D/2D nano-hybrids of γ-MnO2 on reduced graphene oxide for catalytic ozonation and coupling peroxymonosulfate activation. J. Hazard. Mater. 2016, 301, 56–64. [Google Scholar] [CrossRef]
- Tan, X.; Wan, Y.; Huang, Y.; He, C.; Zhang, Z.; He, Z.; Hu, L.; Zeng, J.; Shu, D. Three-dimensional MnO2 porous hollow microspheres for enhanced activity as ozonation catalysts in degradation of bisphenol a. J. Hazard. Mater. 2017, 321, 162–172. [Google Scholar] [CrossRef] [PubMed]
- Dai, Q.; Wang, J.; Yu, J.; Chen, J.; Chen, J. Catalytic ozonation for the degradation of acetylsalicylic acid in aqueous solution by magnetic CeO2 nanometer catalyst particles. Appl. Catal. B Environ. 2014, 144, 686–693. [Google Scholar] [CrossRef]
- Huang, Y.; Cui, C.; Zhang, D.; Li, L.; Pan, D. Heterogeneous catalytic ozonation of dibutyl phthalate in aqueous solution in the presence of iron-loaded activated carbon. Chemosphere 2015, 119, 295–301. [Google Scholar] [CrossRef] [PubMed]
- Van, H.T.; Nguyen, L.H.; Hoang, T.K.; Tran, T.P.; Vo, A.T.; Pham, T.T.; Nguyen, X.C. Using FeO-constituted iron slag wastes as heterogeneous catalyst for Fenton and ozonation processes to degrade Reactive Red 24 from aqueous solution. Sep. Purif. Technol. 2019, 224, 431–442. [Google Scholar] [CrossRef]
- Bai, Z.; Yang, Q.; Wang, J. Catalytic ozonation of sulfamethazine using Ce0.1Fe0.9OOH as catalyst: Mineralization and catalytic mechanisms. Chem. Eng. J. 2016, 300, 169–176. [Google Scholar] [CrossRef]
- Audenaert, W.T.M.; Vandierendonck, D.; Van Hulle, S.W.H.; Nopens, I. Comparison of ozone and HO induced conversion of effluent organic matter (EfOM) using ozonation and UV/H2O2 treatment. Water Res. 2013, 47, 2387–2398. [Google Scholar] [CrossRef]
- Bai, Z.Y.; Yang, Q.; Wang, J.L. Fe3O4/multi-walled carbon nanotubes as an efficient catalyst for catalytic ozonation of phydroxybenzoic acid. Int. J. Environ. Sci. Technol. 2016, 13, 483–492. [Google Scholar] [CrossRef]
- Jothinathan, L.; Hu, J. Kinetic evaluation of graphene oxide based heterogenous catalytic ozonation for the removal of ibuprofen. Water Res. 2018, 134, 63–73. [Google Scholar] [CrossRef] [PubMed]
- Wang, Y.; Yang, W.; Yin, X.; Liu, Y. The role of Mn-doping for catalytic ozonation of phenol using Mn/γ-Al2O3 nanocatalyst: Performance and mechanism. J. Environ. Chem. Eng. 2016, 4, 3415–3425. [Google Scholar] [CrossRef]
- Yu, D.; Wu, M.; Hu, Q.; Wang, L.; Lv, C.; Zhang, L. Iron-based metal-organic frameworks as novel platforms for catalytic ozonation of organic pollutant: Efficiency and mechanism. J. Hazard. Mater. 2019, 367, 456–464. [Google Scholar] [CrossRef] [PubMed]
- Zhang, T.; Li, W.; Croué, J. A non-acid-assisted and non-hydroxyl-radical-related catalytic ozonation with ceria supported copper oxide in efficient oxalate degradation in water. Appl. Catal. B Environ. 2012, 121–122, 88–94. [Google Scholar] [CrossRef]
- Zhang, J.; Hu, Y.; Jiang, X.; Chen, S.; Meng, S.; Fu, X. Design of a direct Z-scheme photocatalyst: Preparation and characterization of Bi2O3/g-C3N4 with high visible light activity. J. Hazard. Mater. 2014, 280, 713–722. [Google Scholar] [CrossRef] [PubMed]
- Sun, W.; Zhou, S.; Sun, Y.; Tang, J.; Zheng, H. Ozone catalytic oxidation capacity of Ti-Co@Al2O3 for the treatment of biochemical tailwater from the coal chemical industry. Water Environ. Res. 2020, 92, 1283–1292. [Google Scholar]
- Hu, E.; Wu, X.; Shang, S.; Tao, X.; Jiang, S.; Gan, L. Catalytic ozonation of simulated textile dyeing wastewater using mesoporous carbon aerogel supported copper oxide catalyst. J. Clean. Prod. 2016, 112, 4710–4718. [Google Scholar] [CrossRef]


| Index | Unit | Content | Method |
|---|---|---|---|
| COD | mg/L | 287.23 | Potassium dichromate method |
| Ammonia nitrogen | mg/L | 0.82 | Nessler’s reagent colorimetric method |
| pH | / | 7.3 | Glass electrode method |
| Turbidity | NTU | 12.75 | Photoelectric turbidimeter |
| Total nitrogen | mg/L | 1.37 | Alkaline potassium persulfate digestion UV spectrophotometric method |
| TOC | mg/L | 95.16 | TOC analyzer |
| Colority | PCU | 122.2 | High-precision colorimeter |
| Total Phosphorus | mg/L | 0.98 | Ammonium molybdate spectrophotometric method |
| Materials | Red Mud Blank Sample | Mn/Ce@RM Catalyst | Mn/Ce@RM Catalyst Reused 25 Times |
|---|---|---|---|
| Specific surface area (m2/g) | 6.1959 | 12.1829 | 11.5218 |
| Specific pore volume (cm3/g) | 0.0401 | 0.0722 | 0.0684 |
| Average pore diameter (nm) | 5.1724 | 3.6185 | 3.5716 |
| CaO | Al2O3 | SiO2 | Na2O | TiO2 | Fe2O3 | MnO2 | CeO2 | |
|---|---|---|---|---|---|---|---|---|
| Red mud blank sample | 5.05 | 25.37 | 12.23 | 7.65 | 4.54 | 39.32 | 0.12 | / |
| Optimal Mn/Ce@RM catalyst sample | 4.41 | 25.19 | 19.04 | 6.73 | 4.18 | 35.02 | 1.69 | 0.75 |
| Mn/Ce@RM catalyst reused 25 times | 4.49 | 25.15 | 18.44 | 6.33 | 4.19 | 31.06 | 1.57 | 0.68 |
| Operating Condition | Environmental Impact I | Economic Benefit B | Fog C | Comprehensive Evaluation Score | Rank |
|---|---|---|---|---|---|
| A1 | 0.0513 | 0.2714 | 0.2000 | 0.5226 | 7 |
| A2 | 0.0578 | 0.2714 | 0.0993 | 0.4285 | 10 |
| A3 | 0.0581 | 0.2714 | 0.0493 | 0.3788 | 11 |
| A4 | 0.0582 | 0.2714 | 0.0245 | 0.3541 | 12 |
| B1 | 0.0272 | 0.4014 | 0.2000 | 0.6286 | 3 |
| B2 | 0.0735 | 0.2714 | 0.2000 | 0.5449 | 5 |
| B3 | 0.0793 | 0.2259 | 0.2000 | 0.5052 | 8 |
| C1 | 0.0316 | 0.4014 | 0.2000 | 0.6330 | 2 |
| C2 | 0.0840 | 0.2714 | 0.2000 | 0.5554 | 4 |
| C3 | 0.1165 | 0.2259 | 0.2000 | 0.5424 | 6 |
| D1 | 0.0245 | 0.1190 | 0.2000 | 0.3435 | 13 |
| D2 | 0.0845 | 0.1512 | 0.2000 | 0.4357 | 9 |
| D3 | 0.2000 | 0.2945 | 0.2000 | 0.6945 | 1 |
Publisher’s Note: MDPI stays neutral with regard to jurisdictional claims in published maps and institutional affiliations. |
© 2022 by the authors. Licensee MDPI, Basel, Switzerland. This article is an open access article distributed under the terms and conditions of the Creative Commons Attribution (CC BY) license (https://creativecommons.org/licenses/by/4.0/).
Share and Cite
Wang, Y.; Wang, Y.; Lu, X.; Sun, W.; Xu, Y.; Zhou, J.; Sun, Y. Catalytic Ozonation for Effective Degradation of Coal Chemical Biochemical Tail Water by Mn/Ce@RM Catalyst. Water 2022, 14, 206. https://doi.org/10.3390/w14020206
Wang Y, Wang Y, Lu X, Sun W, Xu Y, Zhou J, Sun Y. Catalytic Ozonation for Effective Degradation of Coal Chemical Biochemical Tail Water by Mn/Ce@RM Catalyst. Water. 2022; 14(2):206. https://doi.org/10.3390/w14020206
Chicago/Turabian StyleWang, Yicheng, Yingkun Wang, Xi Lu, Wenquan Sun, Yanhua Xu, Jun Zhou, and Yongjun Sun. 2022. "Catalytic Ozonation for Effective Degradation of Coal Chemical Biochemical Tail Water by Mn/Ce@RM Catalyst" Water 14, no. 2: 206. https://doi.org/10.3390/w14020206
APA StyleWang, Y., Wang, Y., Lu, X., Sun, W., Xu, Y., Zhou, J., & Sun, Y. (2022). Catalytic Ozonation for Effective Degradation of Coal Chemical Biochemical Tail Water by Mn/Ce@RM Catalyst. Water, 14(2), 206. https://doi.org/10.3390/w14020206