


Impact of Climate Change on Spatio-Temporal Distribution of Glaciers in Western Karakoram Region since 1990: A Case Study of Central Karakoram National Park


Abstract
1. Introduction
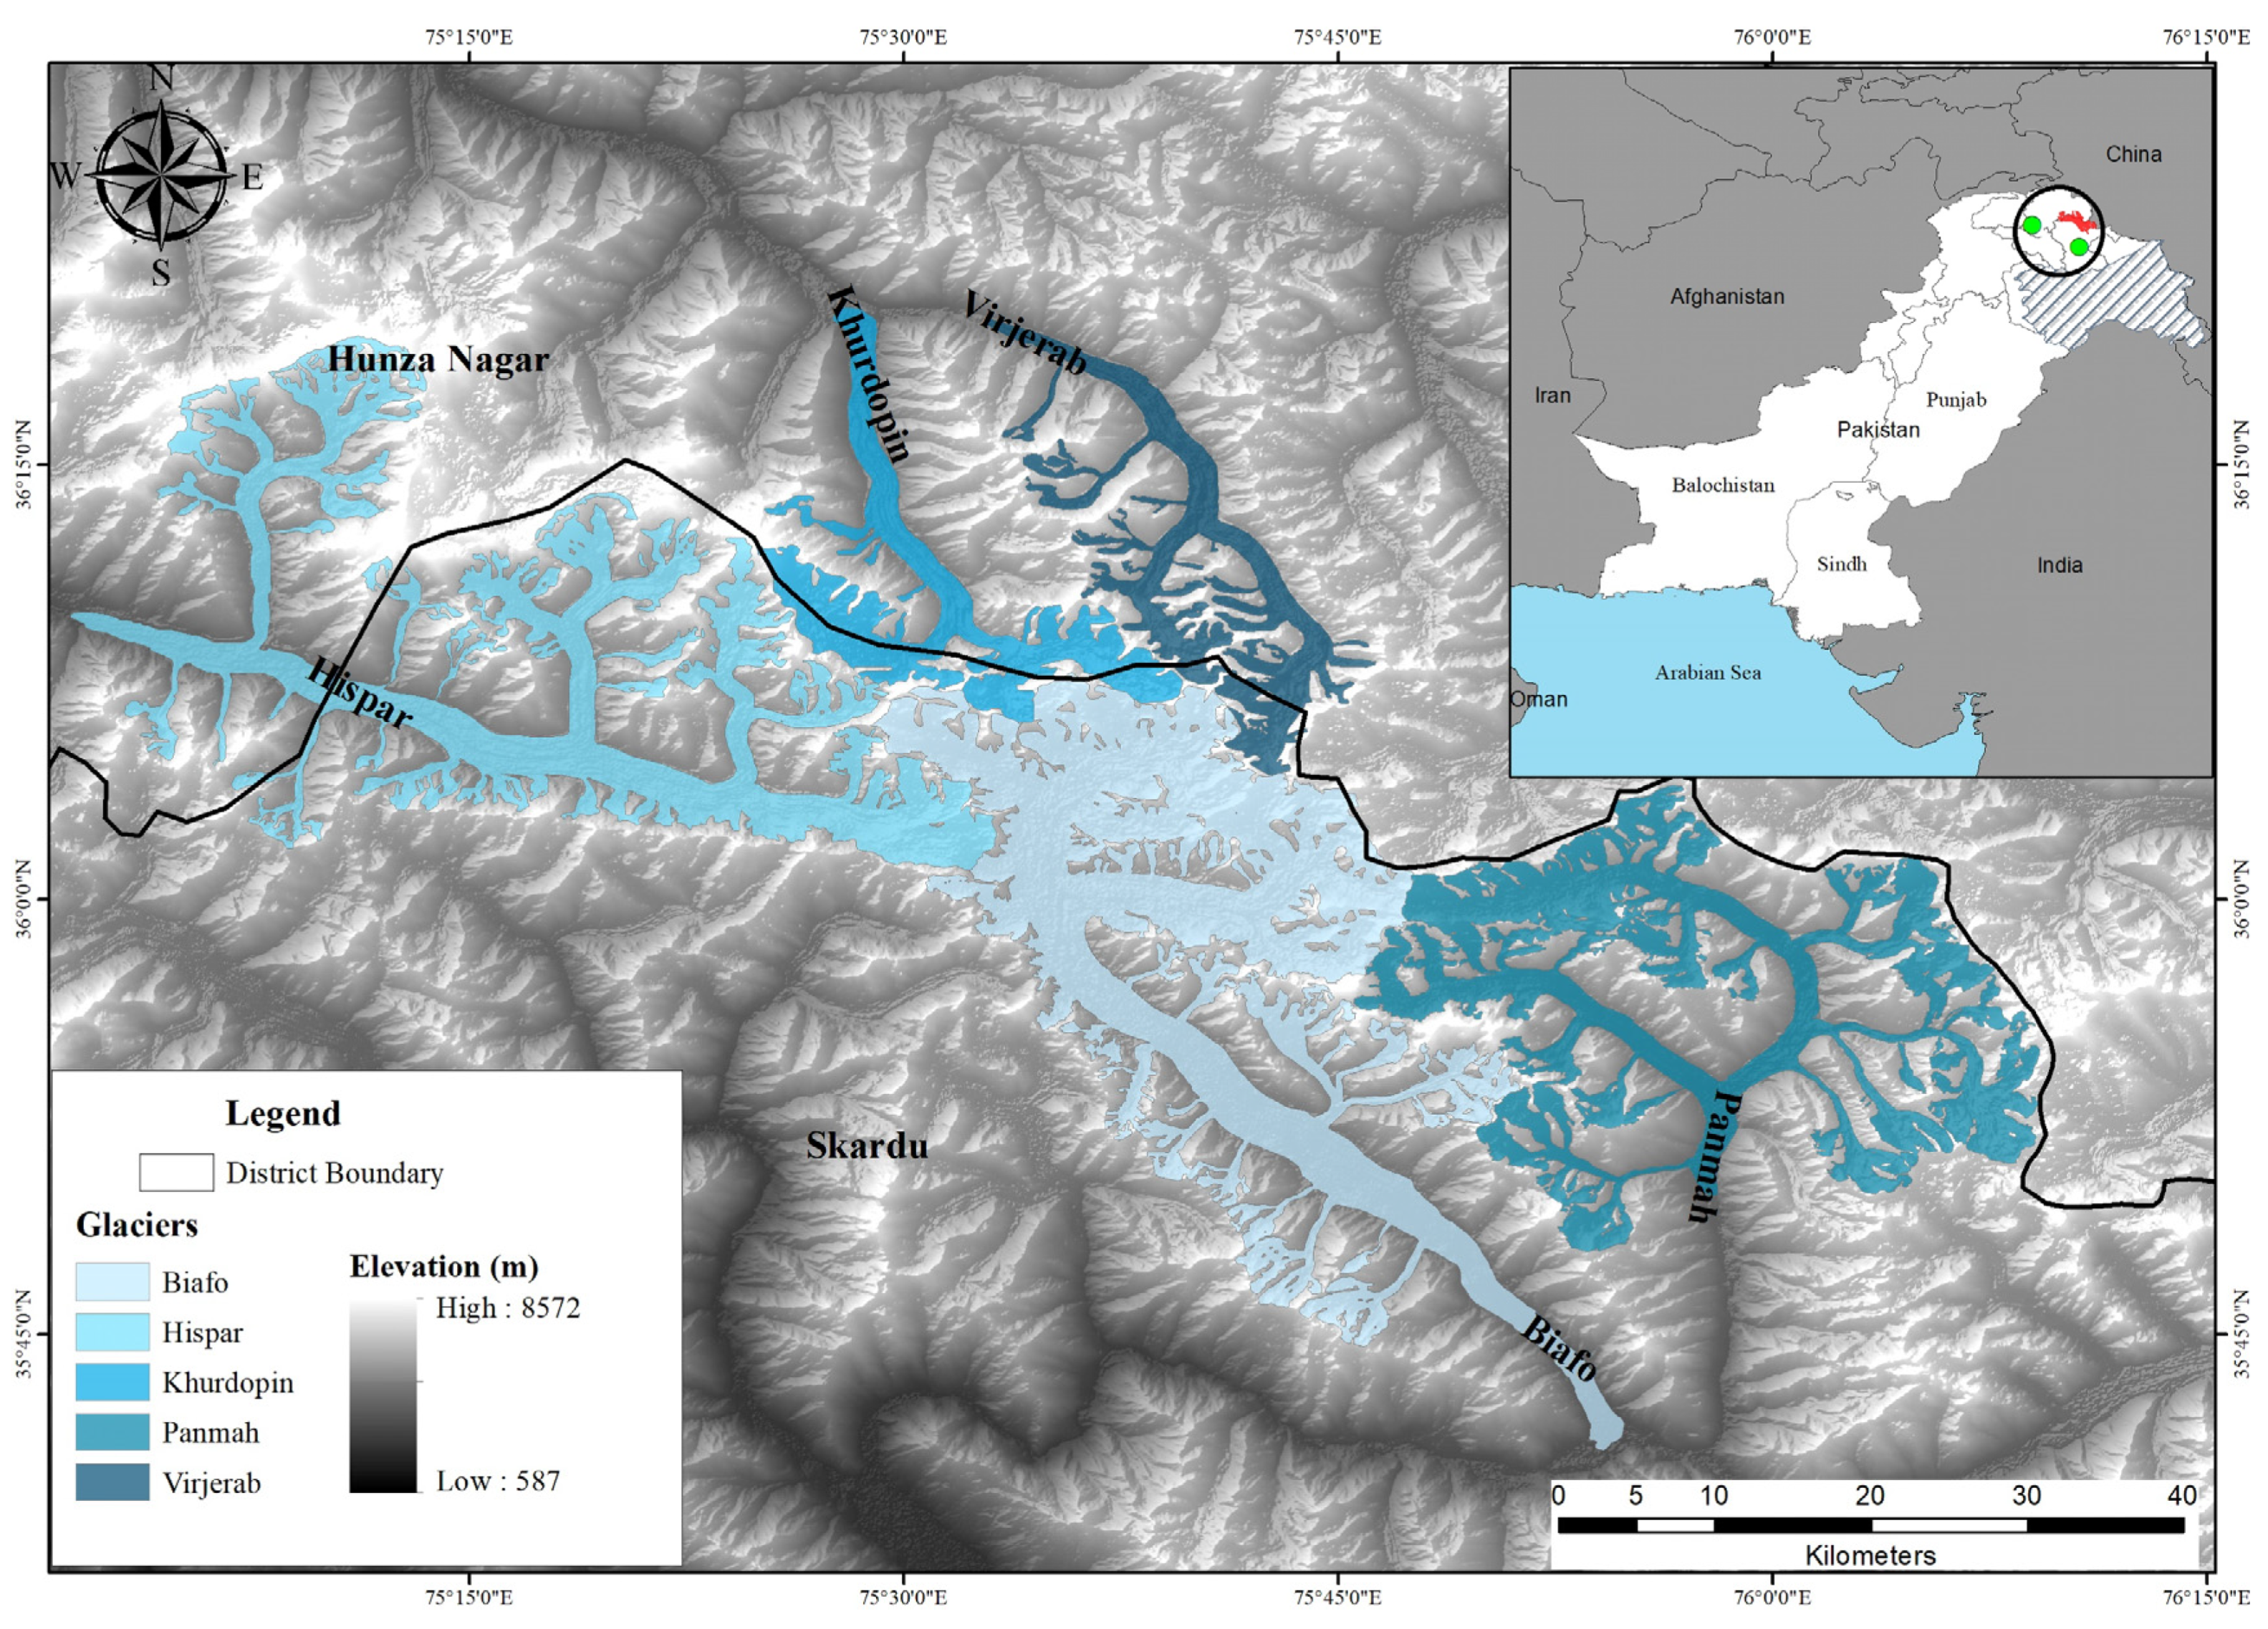
Study Area
2. Materials and Methods
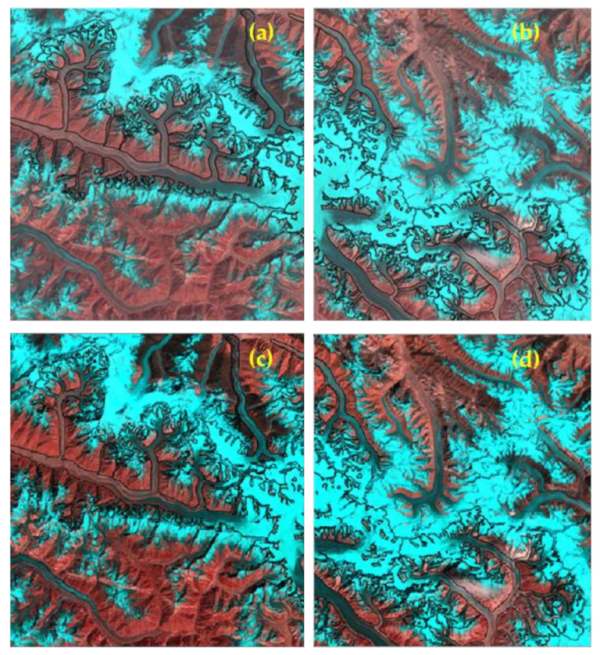
2.1. Satellite Imagery
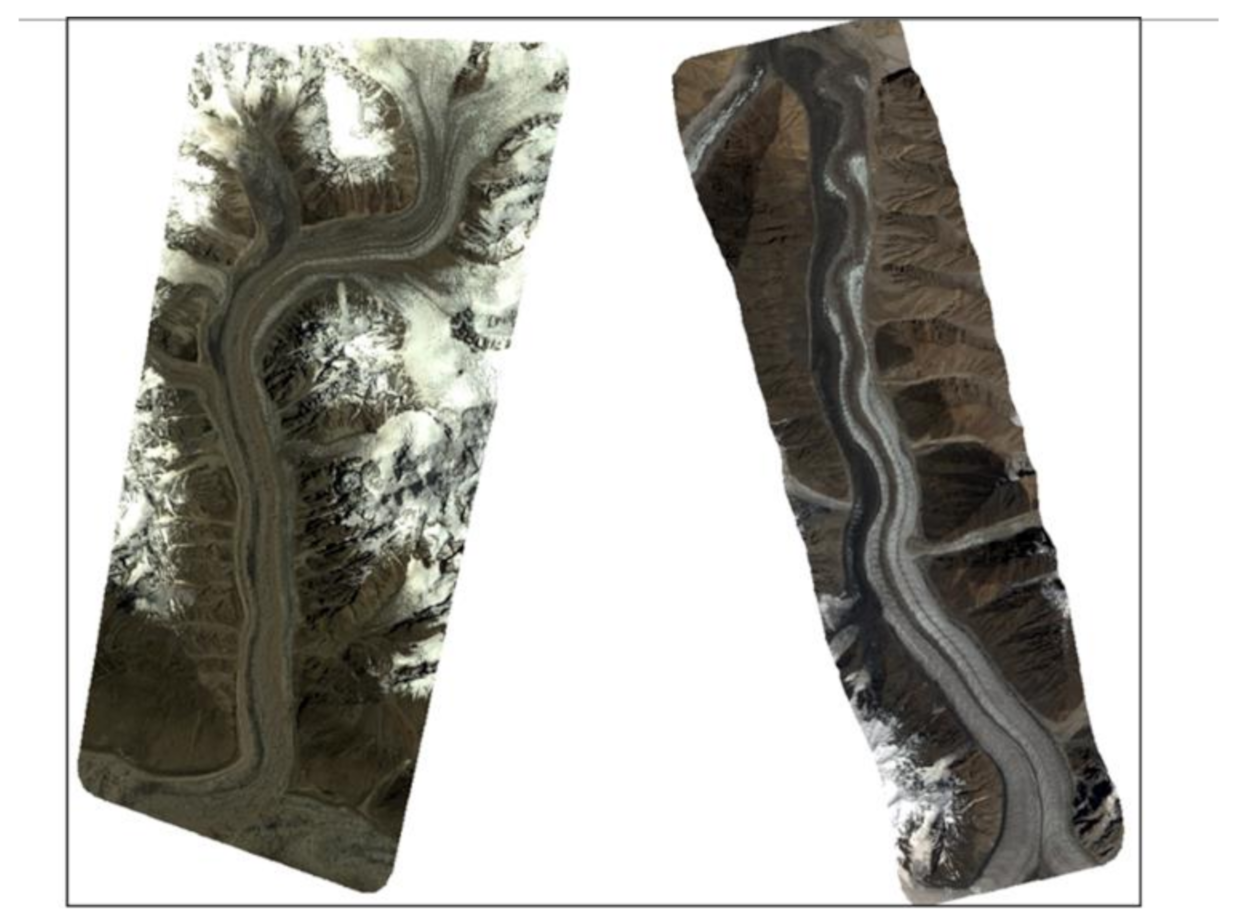
2.1.1. SPOT
2.1.2. Landsat
2.2. Digital Elevation Model (DEM)
2.3. NDSI Calculation
2.4. Climatic Data
3. Results
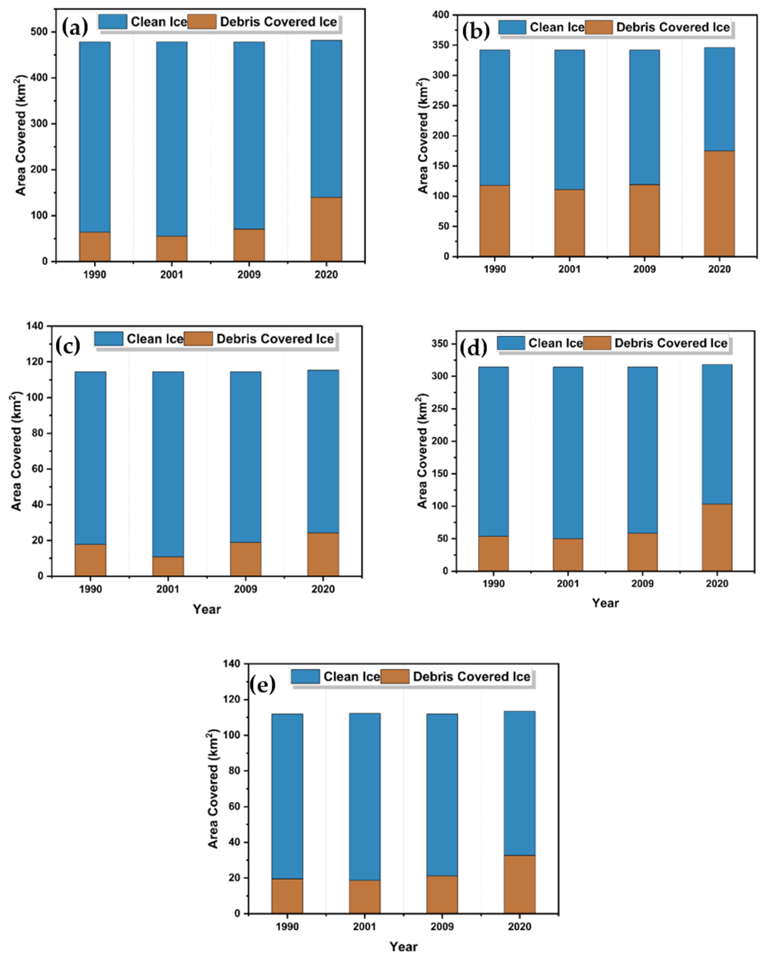
3.1. Spatio-Temporal Changes in Glacier
3.2. Glacier’s Inventory Accuracy Assessment
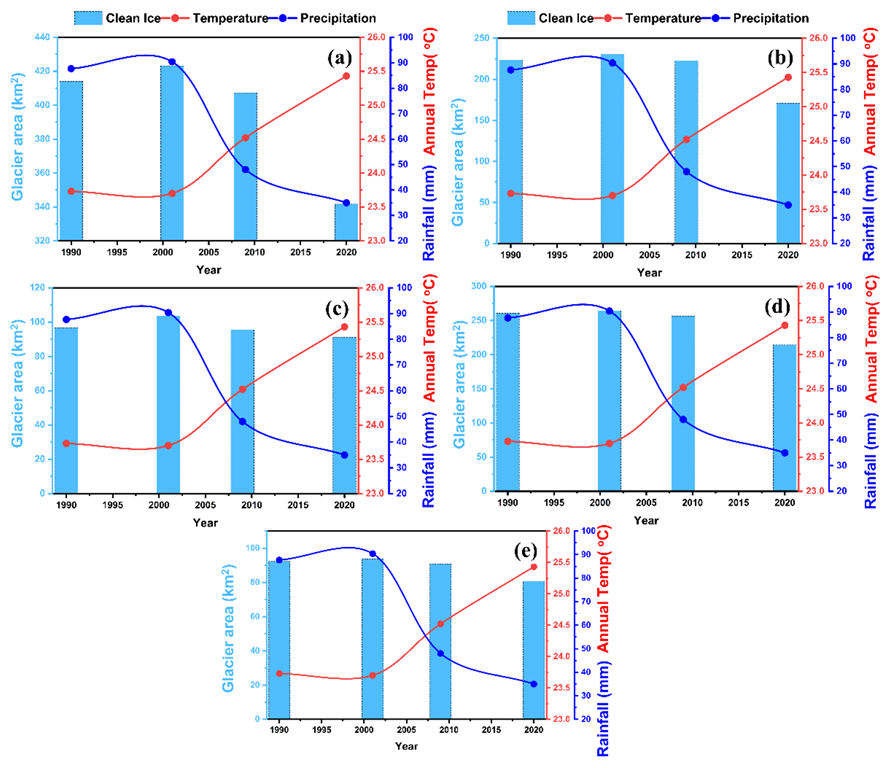
3.3. Climatic Factors and Glacier Changes
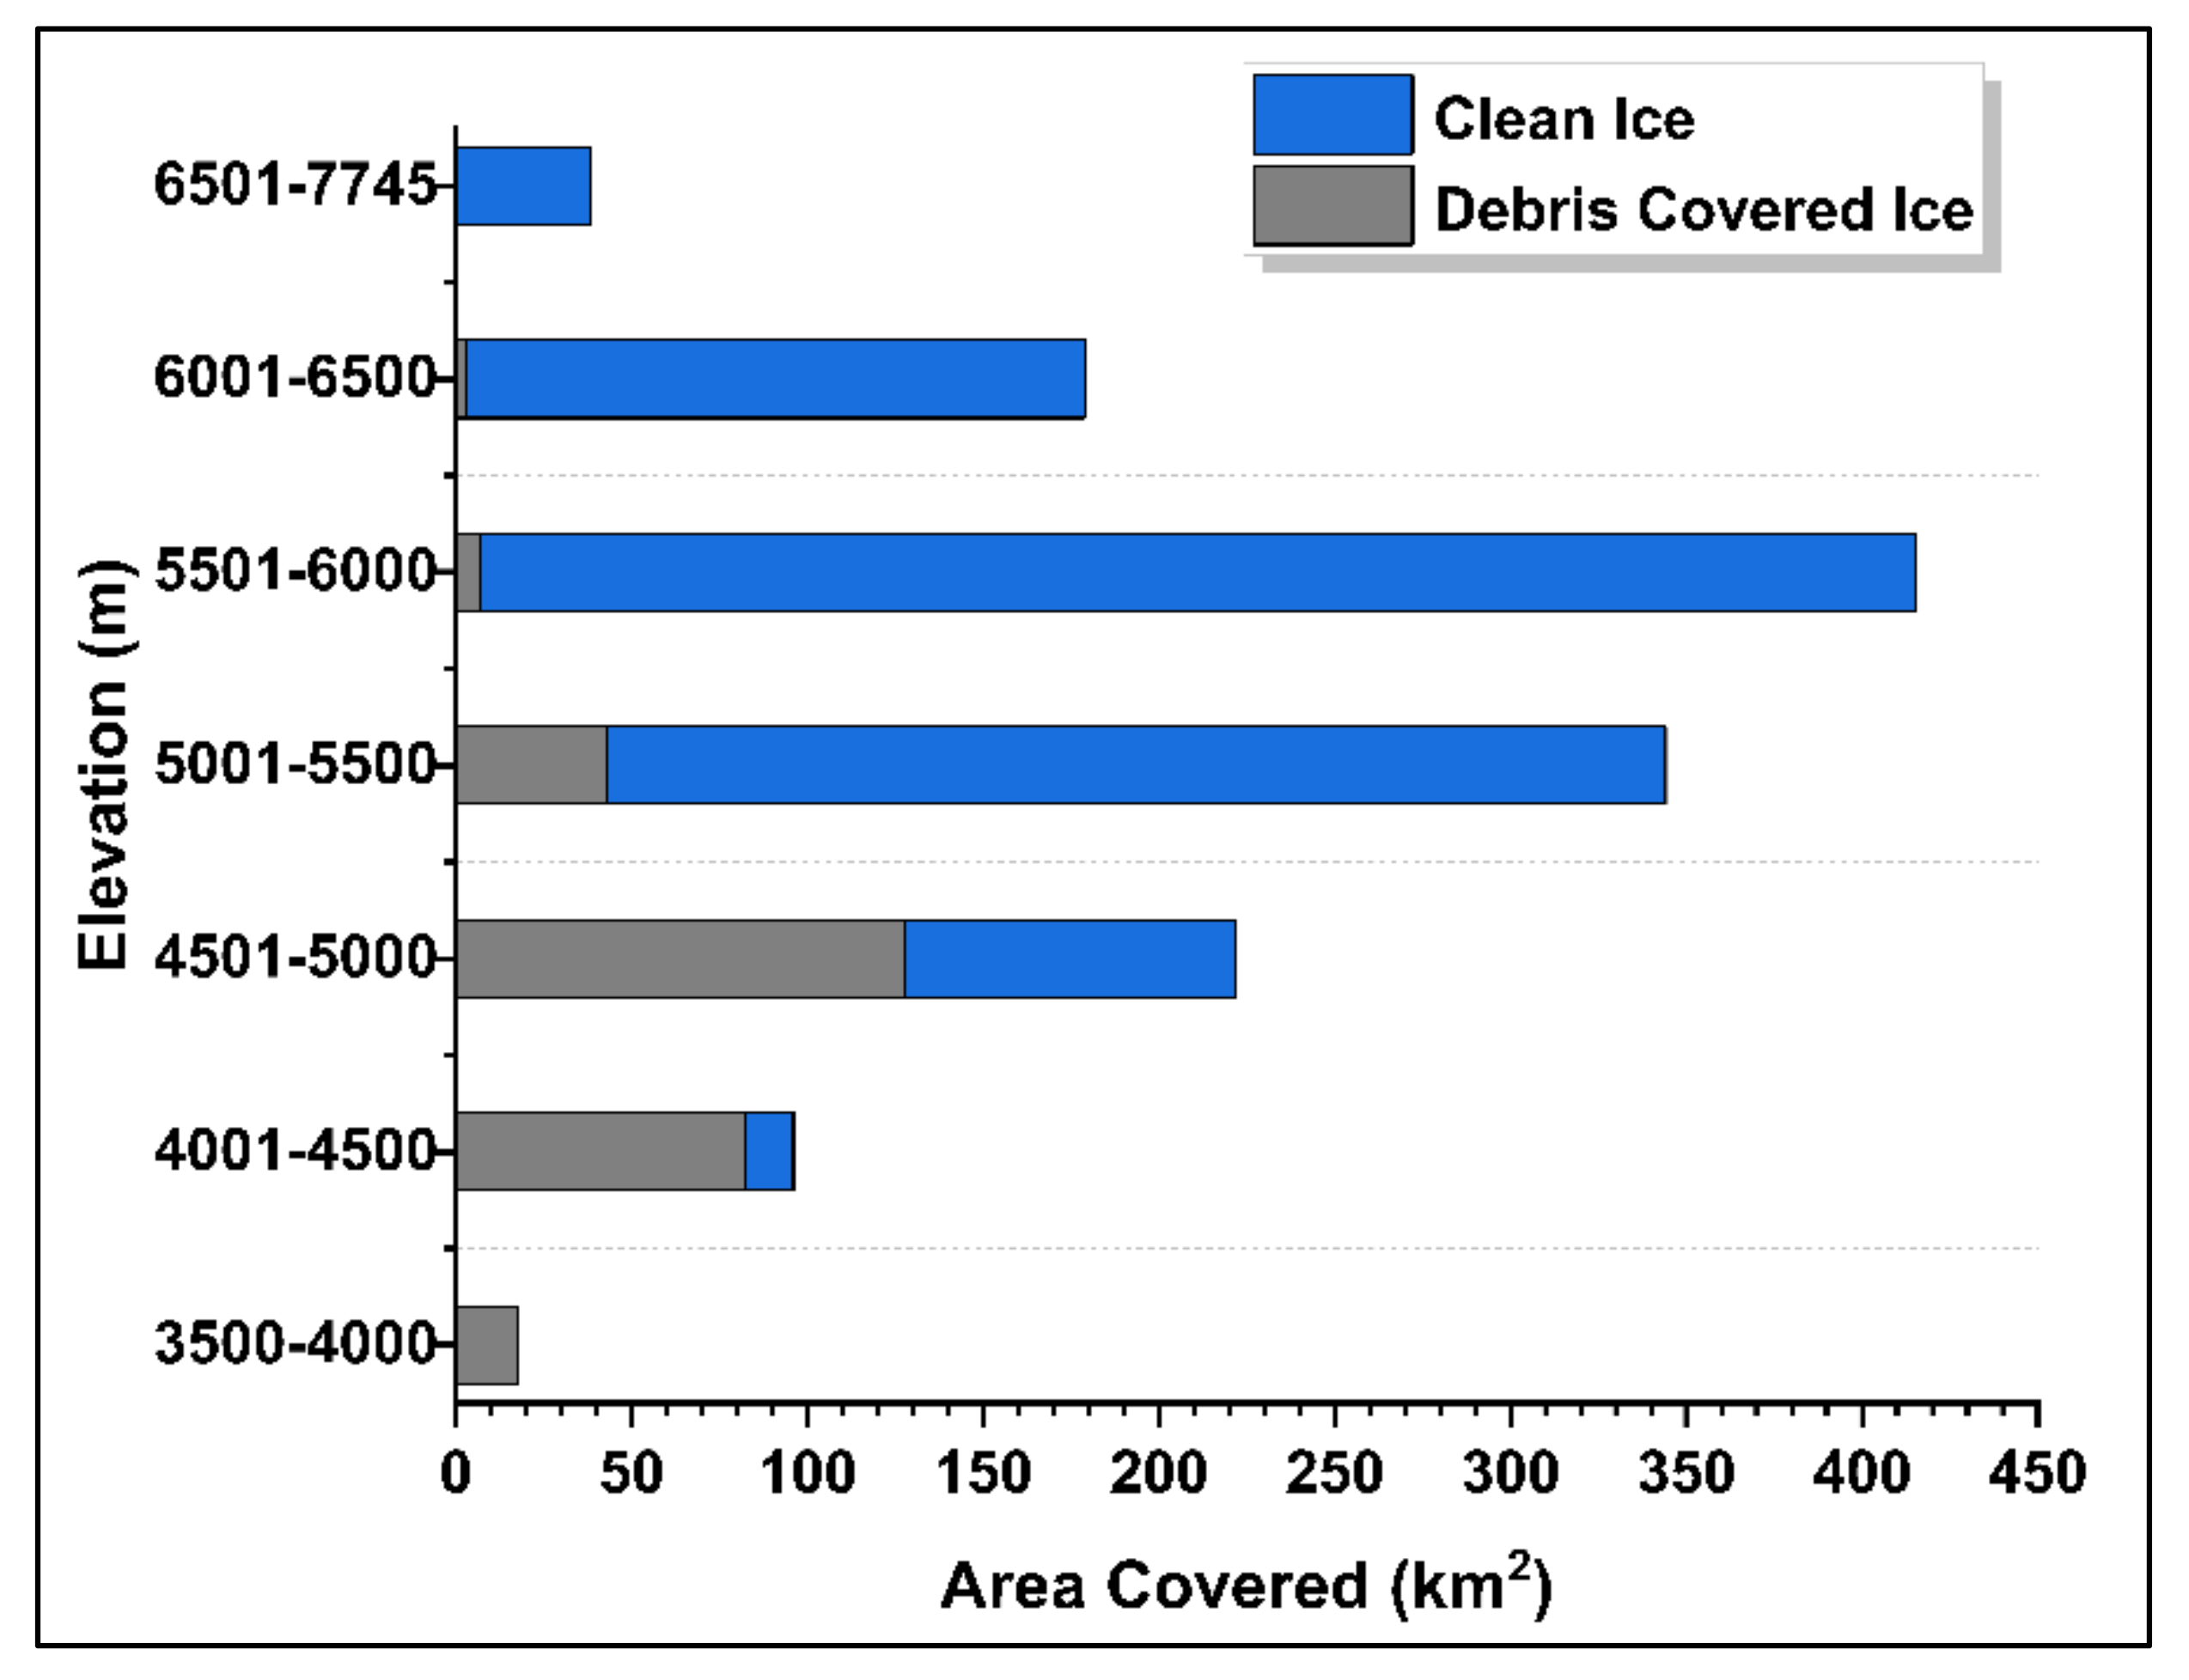
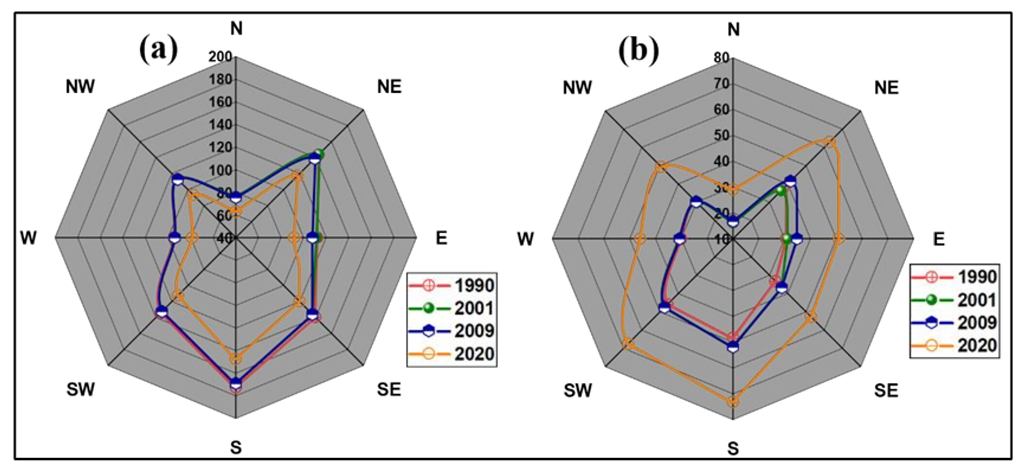
3.4. Area-Altitude Distribution
4. Discussion
5. Conclusions
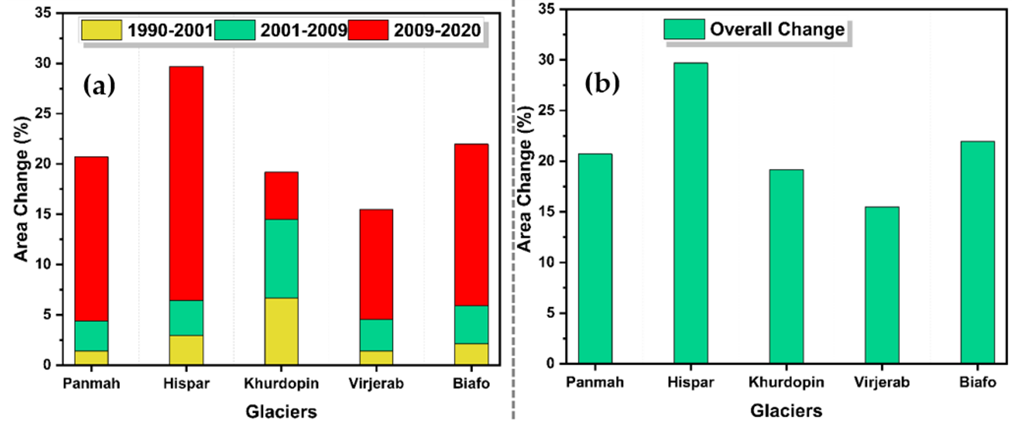
- The glacier retreat in the CKNP region from 1990–2020 for Panmah, Hispar, Khurdopin, Virjerab, and Biafo was 46.05, 52.91, 5.63, 11.57, and 72.27 km2 with 1.48, 1.70, 0.18, 0.37, and 2.33 km2/year, respectively.
- The higher recession rate observed for the Biafo glacier is 2.33 km2/year, which is followed by Hispar (1.70 km2) and Panmah with a rate of 1.48 km2/year. The Khurdopin and Panmah glaciers have retreated 5.63 km2 and 11.57 km2 in the last 31 years (1990–2020).
- From 1990–2001, the glaciers showed a minor advancing trend with 0.33, 0.62, 0.63, 0.12, and 0.82 km2/year for Panmah, Hispar, Khurdopin, Virjerab, and Biafo, respectively, due to increased precipitation at Gilgit station, and the temperature dropped at both stations.
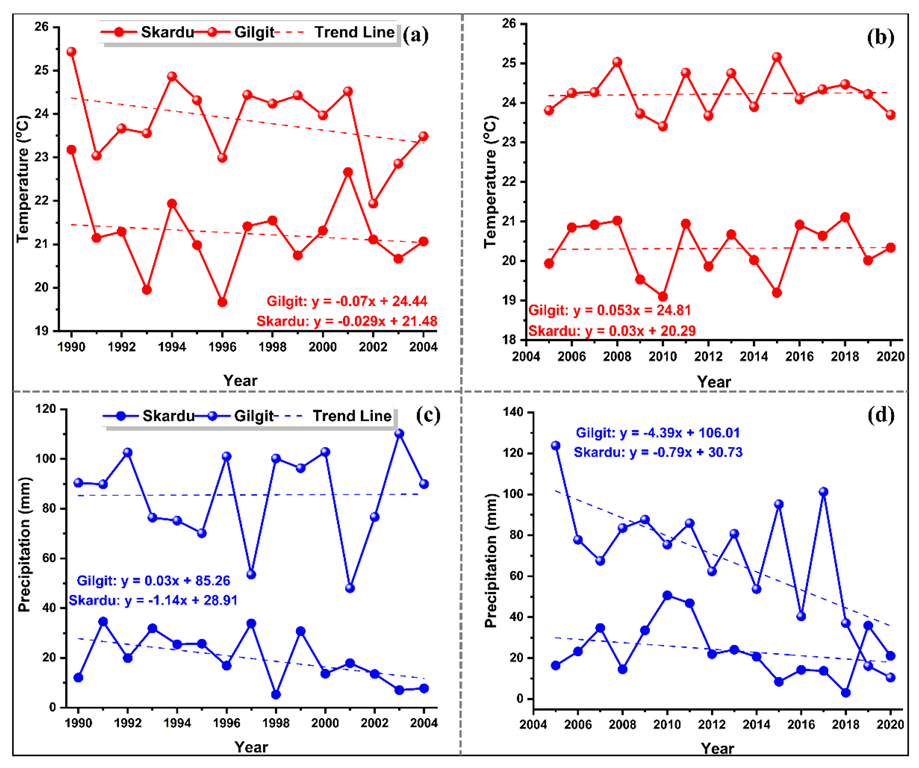
- In the studied time, almost 80% of the retreating trend was found between 2009–2020. This is possibly due to the dramatic decrease in precipitation of both Skardu and Gilgit meteorological stations with −0.79 mm/year and −4.39 mm/year, respectively, for the period from 2005–2020. In addition, it was also observed that the mean summer temperature increased at both stations at a rate of 0.03 °C/year and 0.053 °C/year, respectively.
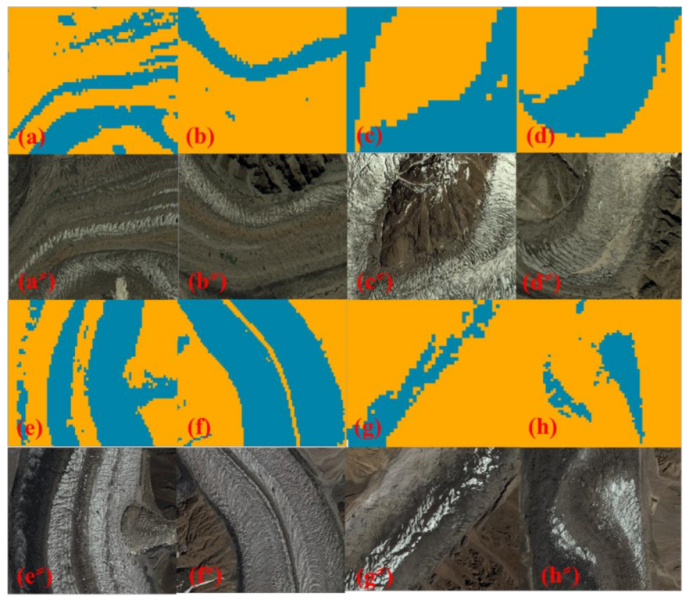
- The rate of glacier area retreat varies in different elevation zones: glaciers are receding at the elevation level of 4500−6000 m; however, the debris-covered ice at low elevation is advancing.
- More than 75% of the area at the elevation level below 4000 MSL is covered by debris-covered ice.
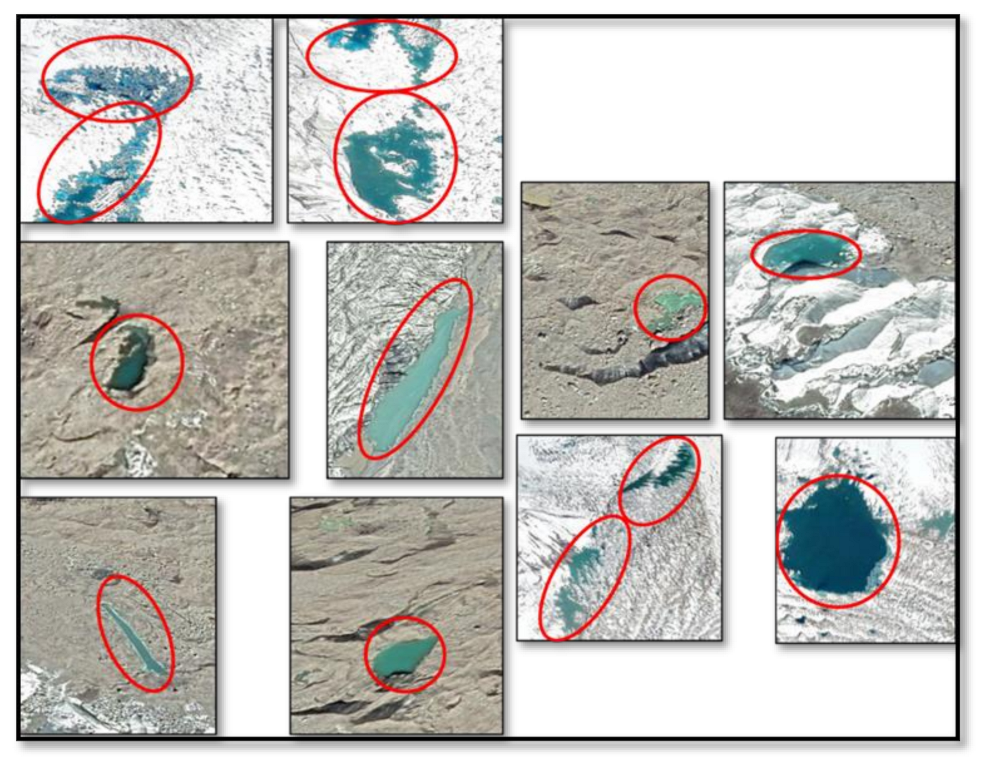
- Supra-glacial lakes have been observed below the elevation of 4500 MSL.
- NDSI, thermal band, and Landsat satellite are very useful to estimate the spatio-temporal ice distribution.
Author Contributions
Funding
Institutional Review Board Statement
Informed Consent Statement
Data Availability Statement
Acknowledgments
Conflicts of Interest
References
- Imran, M.; Ahmad, U. Geospatially analysing the dynamics of the Khurdopin Glacier surge using multispectral and temporal remote sensing and ground observations. Nat. Hazards 2021, 108, 847–866. [Google Scholar] [CrossRef]
- Rowan, A.V.; Quincey, D.J.; Gibson, M.J.; Glasser, N.F.; Westoby, M.; Irvine-Fynn, T.; Porter, P.R.; Hambrey, M.J. The sustainability of water resources in High Mountain Asia in the context of recent and future glacier change. Geol. Soc. Lond. Spéc. Publ. 2018, 462, 189–204. [Google Scholar] [CrossRef]
- Bajracharya, S.R.; Maharjan, S.B.; Shrestha, F. The status and decadal change of glaciers in Bhutan from the 1980s to 2010 based on satellite data. Ann. Glaciol. 2014, 55, 159–166. [Google Scholar] [CrossRef]
- Gul, J.; Muhammad, S.; Liu, S.-Y.; Ullah, S.; Ahmad, S.; Hayat, H.; Tahir, A.A. Spatio-temporal changes in the six major glaciers of the Chitral River basin (Hindukush Region of Pakistan) between 2001 and 2018. J. Mt. Sci. 2020, 17, 572–587. [Google Scholar] [CrossRef]
- Bookhagen, B.; Burbank, D.W. Toward a complete Himalayan hydrological budget: Spatiotemporal distribution of snowmelt and rainfall and their impact on river discharge. J. Geophys. Res. Earth Surf. 2010, 115, 1–25. [Google Scholar] [CrossRef]
- Immerzeel, W.W.; van Beek, L.P.H.; Bierkens, M.F.P. Climate change will affect the Asian Water Towers. Science 2010, 328, 1382–1385. [Google Scholar] [CrossRef]
- Bocchiola, D.; Diolaiuti, G. Recent (1980–2009) evidence of climate change in the upper Karakoram, Pakistan. Theor. Appl. Clim. 2013, 113, 611–641. [Google Scholar] [CrossRef]
- Fowler, H.J.; Archer, D.R. Conflicting Signals of Climatic Change in the Upper Indus Basin. J. Clim. 2006, 19, 4276–4293. [Google Scholar] [CrossRef]
- Hewitt, K. Tributary glacier surges: An exceptional concentration at Panmah Glacier, Karakoram Himalaya. J. Glaciol. 2007, 53, 181–188. [Google Scholar] [CrossRef]
- Sabin, T.; Krishnan, R.; Vellore, R.; Priya, P.; Borgaonkar, H.; Singh, B.B.; Sagar, A. Climate change over the Himalayas. In Assessment of Climate Change over the Indian Region; Springer: Berlin/Heidelberg, Germany, 2020; pp. 207–222. [Google Scholar]
- Krishnan, R.; Shrestha, A.B.; Ren, G.; Rajbhandari, R.; Saeed, S.; Sanjay, J.; Ren, Y. Unravelling Climate Change in the Hindu Kush Himalaya: Rapid Warming in the Mountains and Increasing Extremes. In The Hindu Kush Himalaya Assessment: Mountains, Climate Change, Sustainability and People; Wester, P., Mishra, A., Mukherji, A., Shrestha, A.B., Eds.; Springer International Publishing: Cham, Switzerland, 2019; pp. 57–97. [Google Scholar]
- Sun, X.; Wang, K.; Kang, S.; Guo, J.; Zhang, G.; Huang, J.; Cong, Z.; Sun, S.; Zhang, Q. The role of melting alpine glaciers in mercury export and transport: An intensive sampling campaign in the Qugaqie Basin, inland Tibetan Plateau. Environ. Pollut. 2016, 220, 936–945. [Google Scholar] [CrossRef]
- Bazai, N.A.; Cui, P.; Carling, P.A.; Wang, H.; Hassan, J.; Liu, D.; Zhang, G.; Jin, W. Increasing glacial lake outburst flood hazard in response to surge glaciers in the Karakoram. Earth-Sci. Rev. 2020, 212, 103432. [Google Scholar] [CrossRef]
- Farinotti, D.; Immerzeel, W.W.; de Kok, R.J.; Quincey, D.J.; Dehecq, A. Manifestations and mechanisms of the Karakoram glacier Anomaly. Nat. Geosci. 2020, 13, 8–16. [Google Scholar] [CrossRef]
- Forsythe, N.; Fowler, H.; Li, X.-F.; Blenkinsop, S.; Pritchard, D. Karakoram temperature and glacial melt driven by regional atmospheric circulation variability. Nat. Clim. Chang. 2017, 7, 664–670. [Google Scholar] [CrossRef]
- Scherler, D.; Bookhagen, B.; Strecker, M.R. Spatially variable response of Himalayan glaciers to climate change affected by debris cover. Nat. Geosci. 2011, 4, 156–159. [Google Scholar] [CrossRef]
- Kapnick, S.B.; Delworth, T.L.; Ashfaq, M.; Malyshev, S.; Milly, P.C.D. Snowfall less sensitive to warming in Karakoram than in Himalayas due to a unique seasonal cycle. Nat. Geosci. 2014, 7, 834–840. [Google Scholar] [CrossRef]
- Shafique, M.; Faiz, B.; Bacha, A.S.; Ullah, S. Evaluating glacier dynamics using temporal remote sensing images: A case study of Hunza Valley, northern Pakistan. Environ. Earth Sci. 2018, 77, 162. [Google Scholar] [CrossRef]
- Mazhar, N.; Amjad, D.; Javid, K.; Siddiqui, R.; Nawaz, M.A.; Butt, Z.S. Mapping Fluctuations of Hispar Glacier, Karakoram, using Normalized Difference Snow Index (NDSI) and Normalized Difference Principal Component Snow Index (NDSPCSI). Int. J. Econ. Environ. Geol. 2021, 11, 48–55. [Google Scholar] [CrossRef]
- Chowdhury, A.; Sharma, M.C.; De, S.K.; Debnath, M. Glacier changes in the Chhombo Chhu Watershed of the Tista basin between 1975 and 2018, the Sikkim Himalaya, India. Earth Syst. Sci. Data 2021, 13, 2923–2944. [Google Scholar] [CrossRef]
- Debnath, M.; Sharma, M.C.; Syiemlieh, H.J. Glacier Dynamics in Changme Khangpu Basin, Sikkim Himalaya, India, between 1975 and 2016. Geosciences 2019, 9, 259. [Google Scholar] [CrossRef]
- Kehrwald, N.M.; Thompson, L.G.; Tandong, Y.; Mosley-Thompson, E.; Schotterer, U.; Alfimov, V.; Beer, J.; Eikenberg, J.; Davis, M.E. Mass loss on Himalayan glacier endangers water resources. Geophys. Res. Lett. 2008, 35, 1–6. [Google Scholar] [CrossRef]
- Zhang, M.; Chen, F.; Tian, B.; Liang, D.; Yang, A. Characterization of Kyagar Glacier and Lake Outburst Floods in 2018 Based on Time-Series Sentinel-1A Data. Water 2020, 12, 184. [Google Scholar] [CrossRef]
- Hall, D.K.; Benson, C.S.; Field, W.O. Changes of glaciers in Glacier Bay, Alaska, using ground and satellite measurements. Phys. Geogr. 1995, 16, 27–41. [Google Scholar] [CrossRef]
- McFeeters, S.K. The use of the Normalized Difference Water Index (NDWI) in the delineation of open water features. Int. J. Remote Sens. 1996, 17, 1425–1432. [Google Scholar] [CrossRef]
- Shukla, A.; Ali, I. A hierarchical knowledge-based classification for glacier terrain mapping: A case study from Kolahoi Glacier, Kashmir Himalaya. Ann. Glaciol. 2016, 57, 1–10. [Google Scholar] [CrossRef]
- Kulkarni, A.V.; Singh, S.K.; Mathur, P.; Mishra, V.D. Algorithm to monitor snow cover using AWiFS data of RESOURCESAT-1 for the Himalayan region. Int. J. Remote Sens. 2006, 27, 2449–2457. [Google Scholar] [CrossRef]
- Haq, M.A.; Jain, K.; Menon, K. Development of new thermal ratio index for snow/ice identification. Int. J. Soft Comput. Eng. 2012, 1, 2231–2307. [Google Scholar]
- Bolch, T.; Buchroithner, M.; Pieczonka, T.; Kunert, A. Planimetric and volumetric glacier changes in the Khumbu Himal, Nepal, since 1962 using Corona, Landsat TM and ASTER data. J. Glaciol. 2008, 54, 592–600. [Google Scholar] [CrossRef]
- Burns, P.; Nolin, A. Using atmospherically-corrected Landsat imagery to measure glacier area change in the Cordillera Blanca, Peru from 1987 to 2010. Remote Sens. Environ. 2014, 140, 165–178. [Google Scholar] [CrossRef]
- Paul, F.; Huggel, C.; Kääb, A. Combining satellite multispectral image data and a digital elevation model for mapping debris-covered glaciers. Remote Sens. Environ. 2004, 89, 510–518. [Google Scholar] [CrossRef]
- Pandey, A.; Sarkar, M.S.; Kumar, M.; Singh, G.; Lingwal, S.; Rawat, J.S. Retreat of Pindari glacier and detection of snout position using remote sensing technology. Remote Sens. Appl. Soc. Environ. 2018, 11, 64–69. [Google Scholar] [CrossRef]
- Archer, D. Contrasting hydrological regimes in the upper Indus Basin. J. Hydrol. 2003, 274, 198–210. [Google Scholar] [CrossRef]
- Nüsser, M.; Schmidt, S. Glacier changes on the Nanga Parbat 1856–2020: A multi-source retrospective analysis. Sci. Total Environ. 2021, 785, 147321. [Google Scholar] [CrossRef] [PubMed]
- RGI. A Dataset of Global Glacier Outlines: Version 6.0: Technical Report, Global Land Ice Measurements from Space; CO, USA. 2017. Available online: https://www.glims.org/RGI/ (accessed on 7 August 2022).
- Kääb, A.; Leinss, S.; Gilbert, A.; Bühler, Y.; Gascoin, S.; Evans, S.G.; Bartelt, P.; Berthier, E.; Brun, F.; Chao, W.-A.; et al. Massive collapse of two glaciers in western Tibet in 2016 after surge-like instability. Nat. Geosci. 2018, 11, 114–120. [Google Scholar] [CrossRef]
- Ragettli, S.; Bolch, T.; Pellicciotti, F. Heterogeneous glacier thinning patterns over the last 40 years in Langtang Himal, Nepal. Cryosphere 2016, 10, 2075–2097. [Google Scholar] [CrossRef]
- Patel, A.; Prajapati, R.; Dharpure, J.K.; Mani, S.; Chauhan, D. Mapping and monitoring of glacier areal changes using multispectral and elevation data: A case study over Chhota-Shigri glacier. Earth Sci. Inform. 2019, 12, 489–499. [Google Scholar] [CrossRef]
- Sevestre, H.; Benn, D.I. Climatic and geometric controls on the global distribution of surge-type glaciers: Implications for a unifying model of surging. J. Glaciol. 2015, 61, 646–662. [Google Scholar] [CrossRef]
- Tong, R.; Parajka, J.; Komma, J.; Blöschl, G. Mapping snow cover from daily Collection 6 MODIS products over Austria. J. Hydrol. 2020, 590, 125548. [Google Scholar] [CrossRef]
- Jabbar, A.; Othman, A.A.; Merkel, B.; Hasan, S.E. Change detection of glaciers and snow cover and temperature using remote sensing and GIS: A case study of the Upper Indus Basin, Pakistan. Remote Sens. Appl. Soc. Environ. 2020, 18, 100308. [Google Scholar] [CrossRef]
- Abid, Z.; Zia, S. Mapping and analysis of Baltoto glacier and Shigar river. Pak. Geogr. Rev. 2019, 74, 20–32. [Google Scholar]
- Sommer, C.; Malz, P.; Seehaus, T.C.; Lippl, S.; Zemp, M.; Braun, M.H. Rapid glacier retreat and downwasting throughout the European Alps in the early 21st century. Nat. Commun. 2020, 11, 3209. [Google Scholar] [CrossRef]
- Härer, S.; Bernhardt, M.; Siebers, M.; Schulz, K. On the need for a time- and location-dependent estimation of the NDSI threshold value for reducing existing uncertainties in snow cover maps at different scales. Cryosphere 2018, 12, 1629–1642. [Google Scholar] [CrossRef]
- Khan, A.A.; Zhao, Y.; Khan, J.; Rahman, G.; Rafiq, M.; Moazzam, M.F.U. Spatial and Temporal Analysis of Rainfall and Drought Condition in Southwest Xinjiang in Northwest China, Using Various Climate Indices. Earth Syst. Environ. 2021, 5, 1–16. [Google Scholar] [CrossRef]
- Sigl, M.; Abram, N.J.; Gabrieli, J.; Jenk, T.M.; Osmont, D.; Schwikowski, M. 19th century glacier retreat in the Alps preceded the emergence of industrial black carbon deposition on high-alpine glaciers. Cryosphere 2018, 12, 3311–3331. [Google Scholar] [CrossRef]
- Carlson, A.E.; Kilmer, Z.; Ziegler, L.B.; Stoner, J.S.; Wiles, G.C.; Starr, K.; Walczak, M.H.; Colgan, W.; Reyes, A.V.; Leydet, D.J.; et al. Recent retreat of Columbia Glacier, Alaska: Millennial context. Geology 2017, 45, 547–550. [Google Scholar] [CrossRef]
- Gilany, S.N.A.; Iqbal, J. Geospatial analysis of glacial hazard prone areas of Shigar and Shayok basins. Int. J. Innov. Appl. Stud. 2016, 14, 623. [Google Scholar]
- Pepin, N.; Bradley, R.S.; Diaz, H.F.; Baraer, M.; Caceres, E.B.; Forsythe, N.; Fowler, H.; Greenwood, G.; Hashmi, M.Z.; Liu, X.D.; et al. Elevation-dependent warming in mountain regions of the world. Nat. Clim. Chang. 2015, 5, 424–430. [Google Scholar] [CrossRef]
- Chaudhry, Q.; Mahmood, A.; Rasul, G.; Afzaal, M. Climate Change Indicators of Pakistan; Pakistan Meteorological Department: Islamabad, Pakistan, 2009. [Google Scholar]
- Raza, M.; Hussain, D.; Rasul, G. Climatic Variability and Linear Trend Models for the Six Major Regions of Gilgit-Baltistan, Pakistan: Climatic Variability and Linear Trend Models. Proc. Pak. Acad. Sci. B. Life Environ. Sci. 2016, 53, 129–136. [Google Scholar]
- Minora, U.; Bocchiola, D.; D’Agata, C.; Maragno, D.; Mayer, C.; Lambrecht, A.; Diolaiuti, G.A. Glacier area stability in the Central Karakoram National Park (Pakistan) in 2001–2010: The “Karakoram Anomaly” in the spotlight. Prog. Phys. Geogr. 2016, 40, 629–660. [Google Scholar] [CrossRef]
- Minora, U.; Bocchiola, D.; D’Agata, C.; Maragno, D.; Mayer, C.; Lambrecht, A.; Diolaiuti, G. 2001–2010 glacier changes in the Central Karakoram National Park: A contribution to evaluate the magnitude and rate of the “Karakoram anomaly”. Cryosphere Discuss. 2013, 7, 2891–2941. [Google Scholar]
- Hussain, A.; Sagin, J.; Bekbayeva, A.; Abid, M. Climate Change and its Impact on Glaciers in Hindu Kush Region: A Case Study of Yarkhun Valley, Chitral Pakistan. In Proceedings of the 40th Asian Conference on Remote Sensing, Daejeon, Korea, 14–18 October 2019. [Google Scholar]


| S. No | Acquisition Date | Sensor | Satellite | Spatial Resolution (m) | Cloud Cover |
|---|---|---|---|---|---|
| 1 | 7 August 1990 | Thematic Mapper (TM) | Landsat 5 | 30 | <10% |
| 2 | 29 August 2001 | Enhanced thematic mapper plus (ETM+) | Landsat 7 | 30 | 10% |
| 3 | 26 August 2009 | Thematic Mapper (TM) | Landsat 5 | 30 | <10% |
| 4 | 25 August 2020 | Operational land imager and thermal infrared sensor (OLI-TIRS) | Landsat 8 | 30 | <10% |
| 5 | 7 August 2020 | SPOT 7 | 1.5 m (Pan-sharpen) 6 m Multispectral | 5% | |
| 6 | November 2013 | ASTER GDEM | 30 m |
| SPOT 7 (km2) | Landsat 8 (km2) | Difference (km2) | Accuracy (%) | |
|---|---|---|---|---|
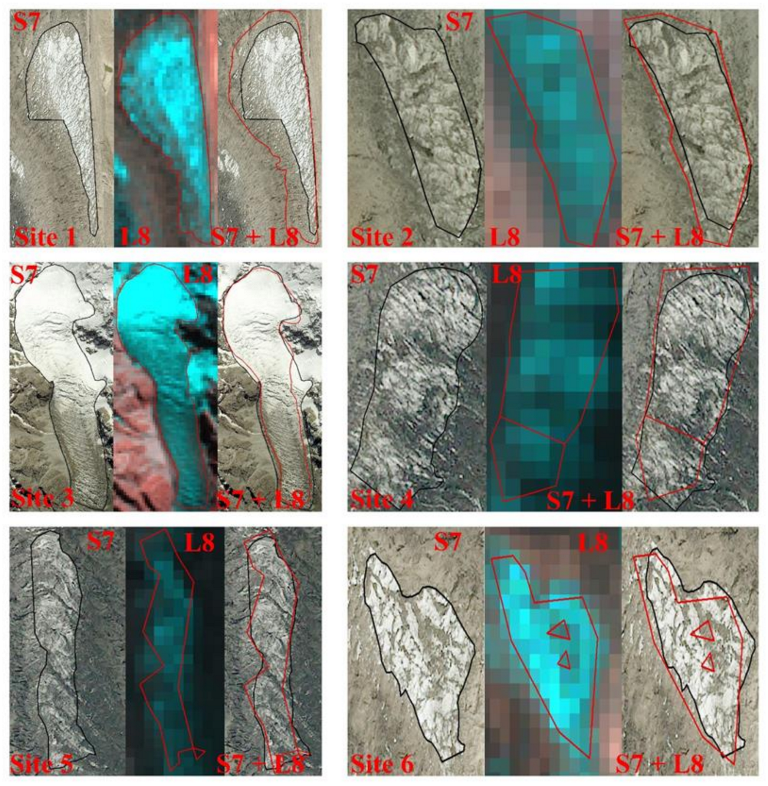
| Site 1 | 1.68 | 1.45 | 0.23 | 86.31 |
| Site 2 | 0.42 | 0.69 | −0.27 | 60.87 |
| Site 3 | 0.06 | 0.07 | −0.01 | 85.71 |
| Site 4 | 0.08 | 0.07 | 0.01 | 87.50 |
| Site 5 | 0.04 | 0.05 | −0.01 | 80.00 |
| Site 6 | 0.066 | 0.062 | 0.004 | 93.95 |
| Time Series | Linear Regression 1990–2004 | MK Test 1990–2004 | Linear Regression 2005–2020 | MK Test 2005–2020 |
|---|---|---|---|---|
| Precipitation (mm/year) | ||||
| Skardu | −1.14 | −1.40 | -0.79 | −0.86 |
| Gilgit | 0.03 | 0.22 | −4.39 | −4.89 |
| Temperature (°C/year) | ||||
| Skardu | −0.029 | −0.04 | 0.03 | 0.006 |
| Gilgit | −0.07 | −0.083 | 0.053 | 0.06 |
| Temperature | Precipitation | |
|---|---|---|
| Clean Ice Panmah | −0.935 | 0.802 |
| Clean Ice Hispar | −0.915 | 0.773 |
| Clean Ice Khurdopin | −0.846 | 0.835 |
| Clean Ice Virjerab | −0.953 | 0.836 |
| Clean Ice Biafo | −0.940 | 0.813 |
| Altitude | Glacier Area (km2) | Glacier Area Loss % | |||||
|---|---|---|---|---|---|---|---|
| MSL | 1990 | 2001 | 2009 | 2020 | 1990–2001 | 2001–2009 | 2009–2020 |
| <4500 | 107.52 | 121.51 | 94.53 | 36.90 | 13.01 (+) | 22.20 (−) | 60.96 (−) |
| 5000 | 301.29 | 299.93 | 300.06 | 253.76 | 0.45 (−) | 0.04 (+) | 15.43 (−) |
| 5500 | 408.3 | 397.08 | 406.18 | 399.77 | 2.74 (−) | 2.20 (+) | 1.57 (−) |
| >5500 | 214.34 | 205.54 | 212.20 | 210.62 | 4.1 (−) | 3.24 (+) | 0.74 (−) |
| Total | 1031.46 | 1024.06 | 1012.97 | 901.06 | 0.71 (−) | 1.08 (−) | 11.04 (−) |
| Glaciers | Period | Present Study | Previous Studies | References | |
|---|---|---|---|---|---|
| Rate (%) | Rate (%) | Coverage km2 | |||
| Panmah | 1.48 | ||||
| Hispar | 1990–2018 | 1.7 | 1.35 | 245 | Mazhar et al. 2020 [19] |
| 1977–2014 | 0.17 | 398 | Shafique et al. 2018 [18] | ||
| Virjerab | 0.37 | ||||
| Biafo | 1990–2000 | 2.33 | 0.7 | Gilany and Iqbal 2016 [48] | |
| Khurdopin | 0.18 | ||||
Publisher’s Note: MDPI stays neutral with regard to jurisdictional claims in published maps and institutional affiliations. |
© 2022 by the authors. Licensee MDPI, Basel, Switzerland. This article is an open access article distributed under the terms and conditions of the Creative Commons Attribution (CC BY) license (https://creativecommons.org/licenses/by/4.0/).
Share and Cite
Moazzam, M.F.U.; Bae, J.; Lee, B.G. Impact of Climate Change on Spatio-Temporal Distribution of Glaciers in Western Karakoram Region since 1990: A Case Study of Central Karakoram National Park. Water 2022, 14, 2968. https://doi.org/10.3390/w14192968
Moazzam MFU, Bae J, Lee BG. Impact of Climate Change on Spatio-Temporal Distribution of Glaciers in Western Karakoram Region since 1990: A Case Study of Central Karakoram National Park. Water. 2022; 14(19):2968. https://doi.org/10.3390/w14192968
Chicago/Turabian StyleMoazzam, Muhammad Farhan Ul, Jinho Bae, and Byung Gul Lee. 2022. "Impact of Climate Change on Spatio-Temporal Distribution of Glaciers in Western Karakoram Region since 1990: A Case Study of Central Karakoram National Park" Water 14, no. 19: 2968. https://doi.org/10.3390/w14192968
APA StyleMoazzam, M. F. U., Bae, J., & Lee, B. G. (2022). Impact of Climate Change on Spatio-Temporal Distribution of Glaciers in Western Karakoram Region since 1990: A Case Study of Central Karakoram National Park. Water, 14(19), 2968. https://doi.org/10.3390/w14192968