


Effect of Rill Development on Slope Erosion and Sediment Yield Based on Stereophotogrammetry Technology

Abstract
:1. Introduction
2. Materials and Methods
2.1. Study Area and Experimental Soil
2.2. Experimental Design
- (1)
- Rainfall test
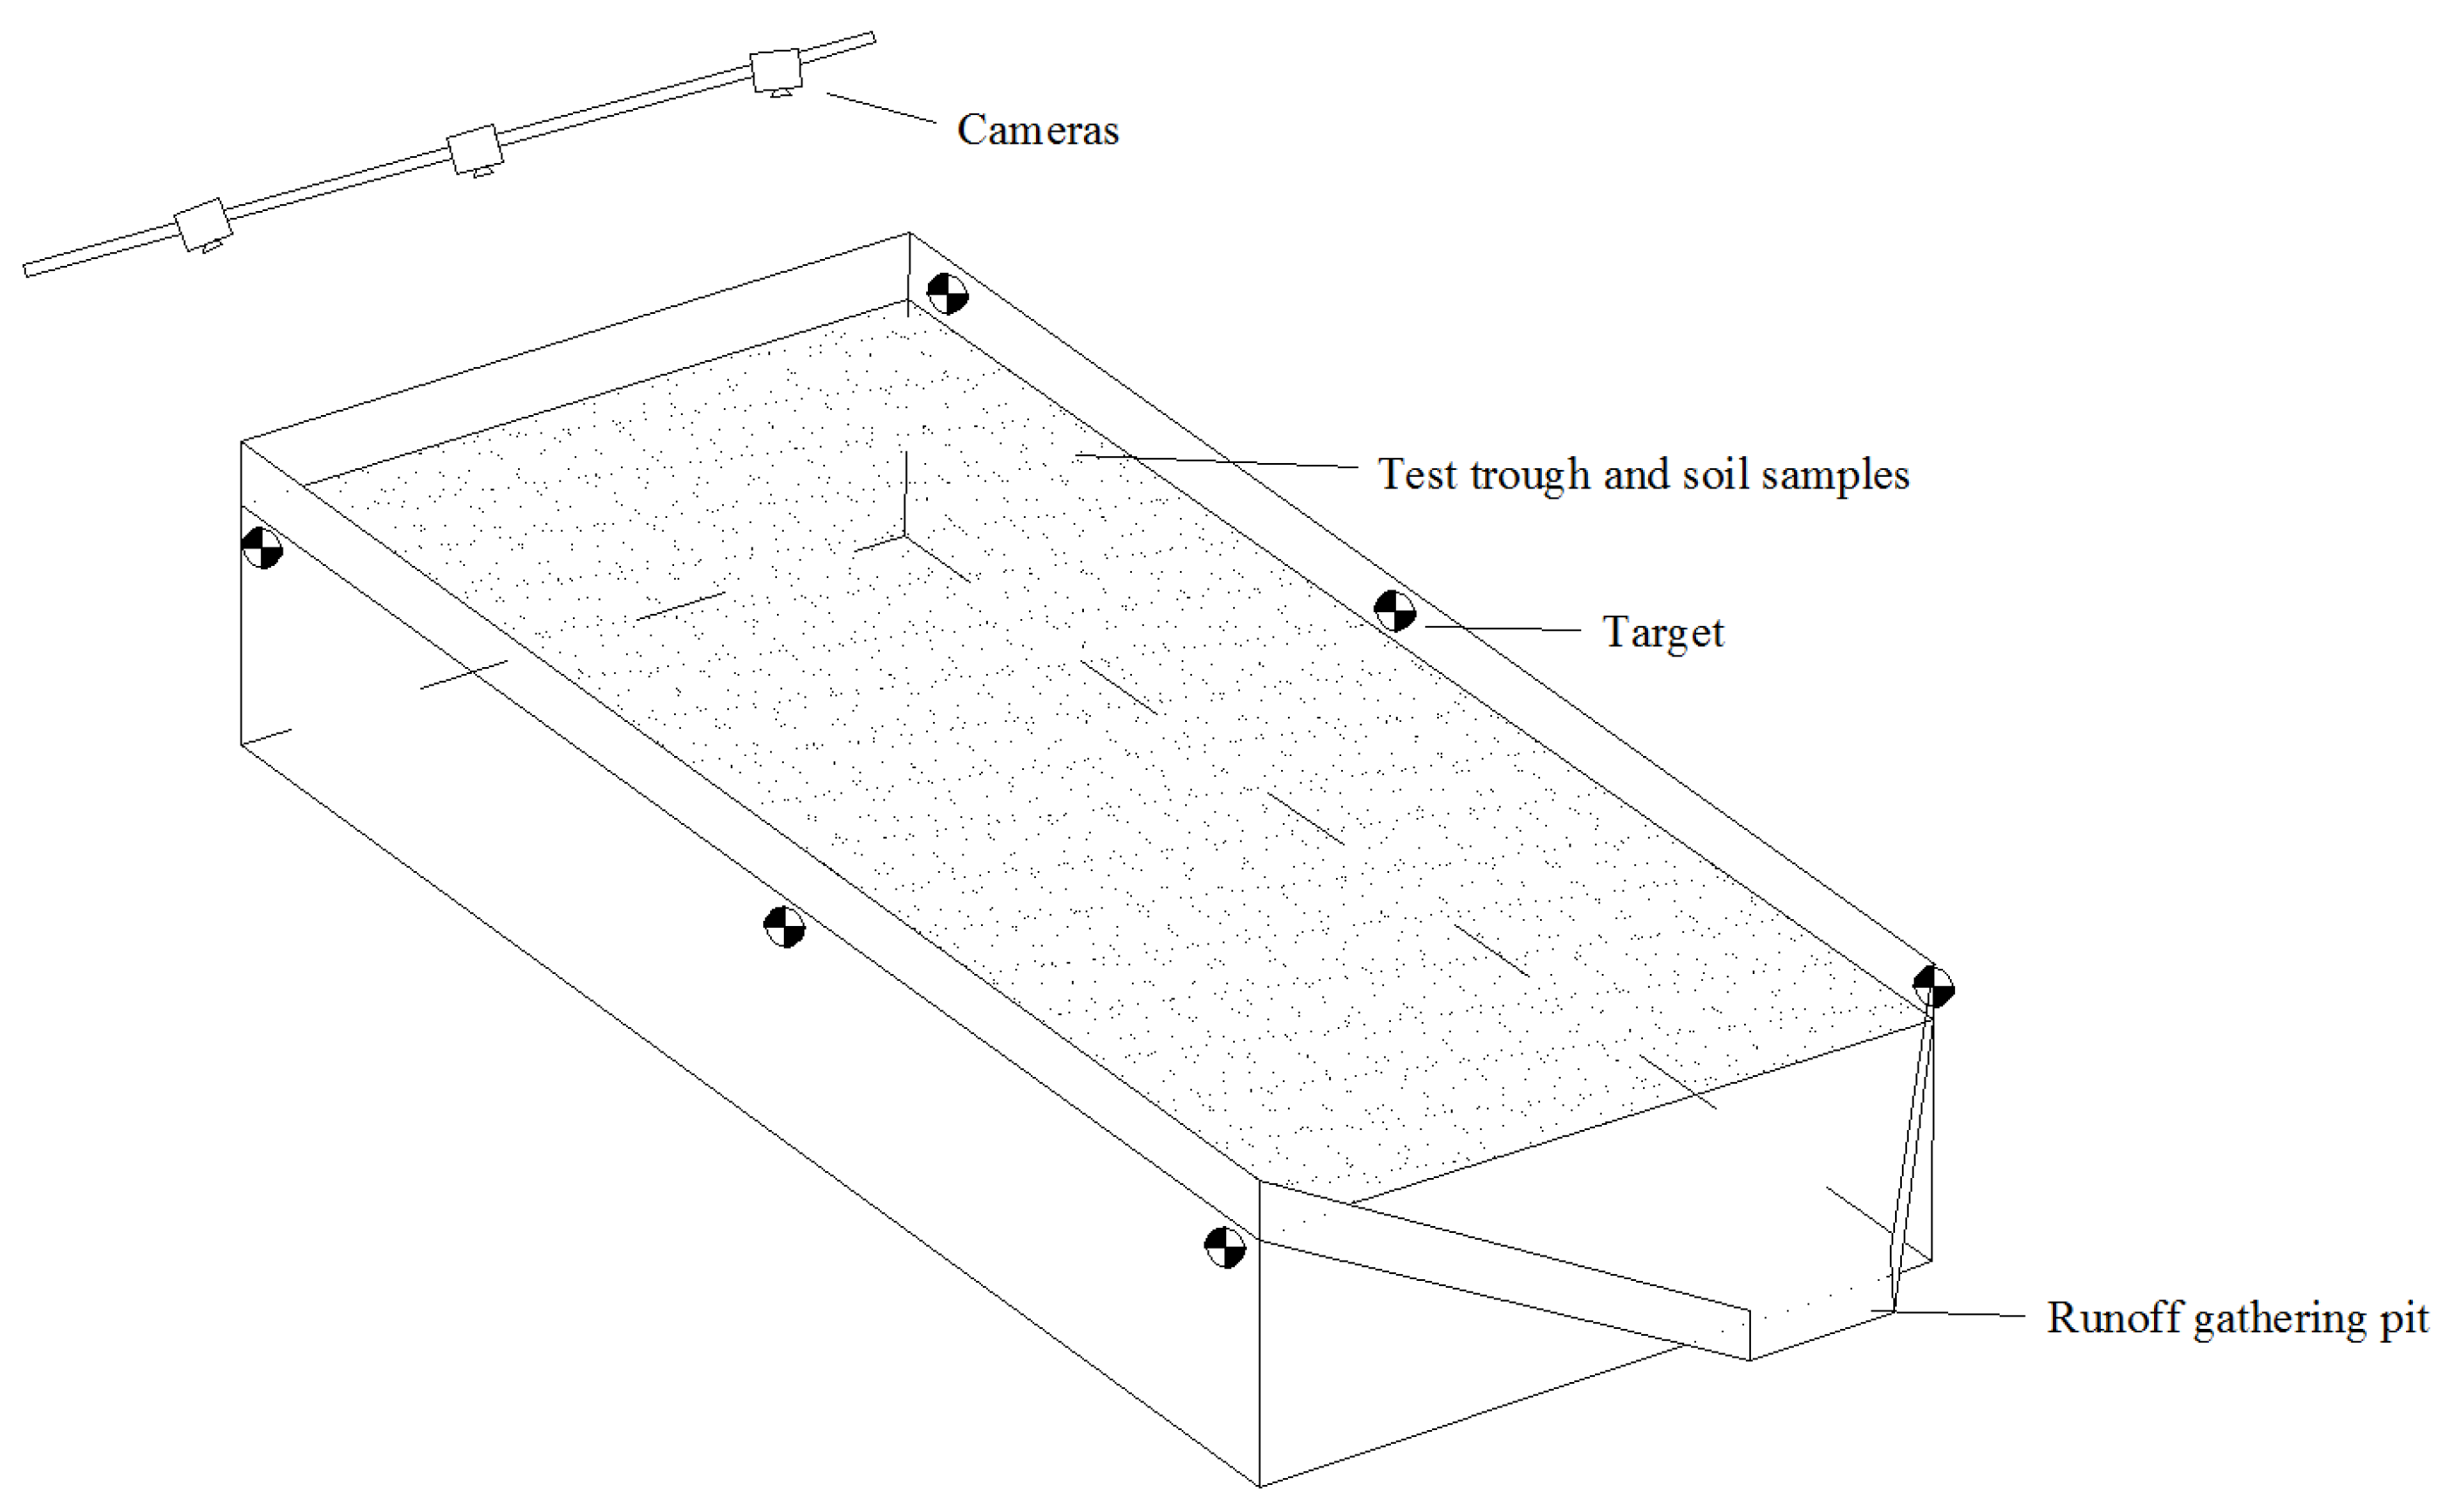
- (2)
- Stereophotogrammetric arrangement
2.3. Calculations and Statistical Analysis
3. Results
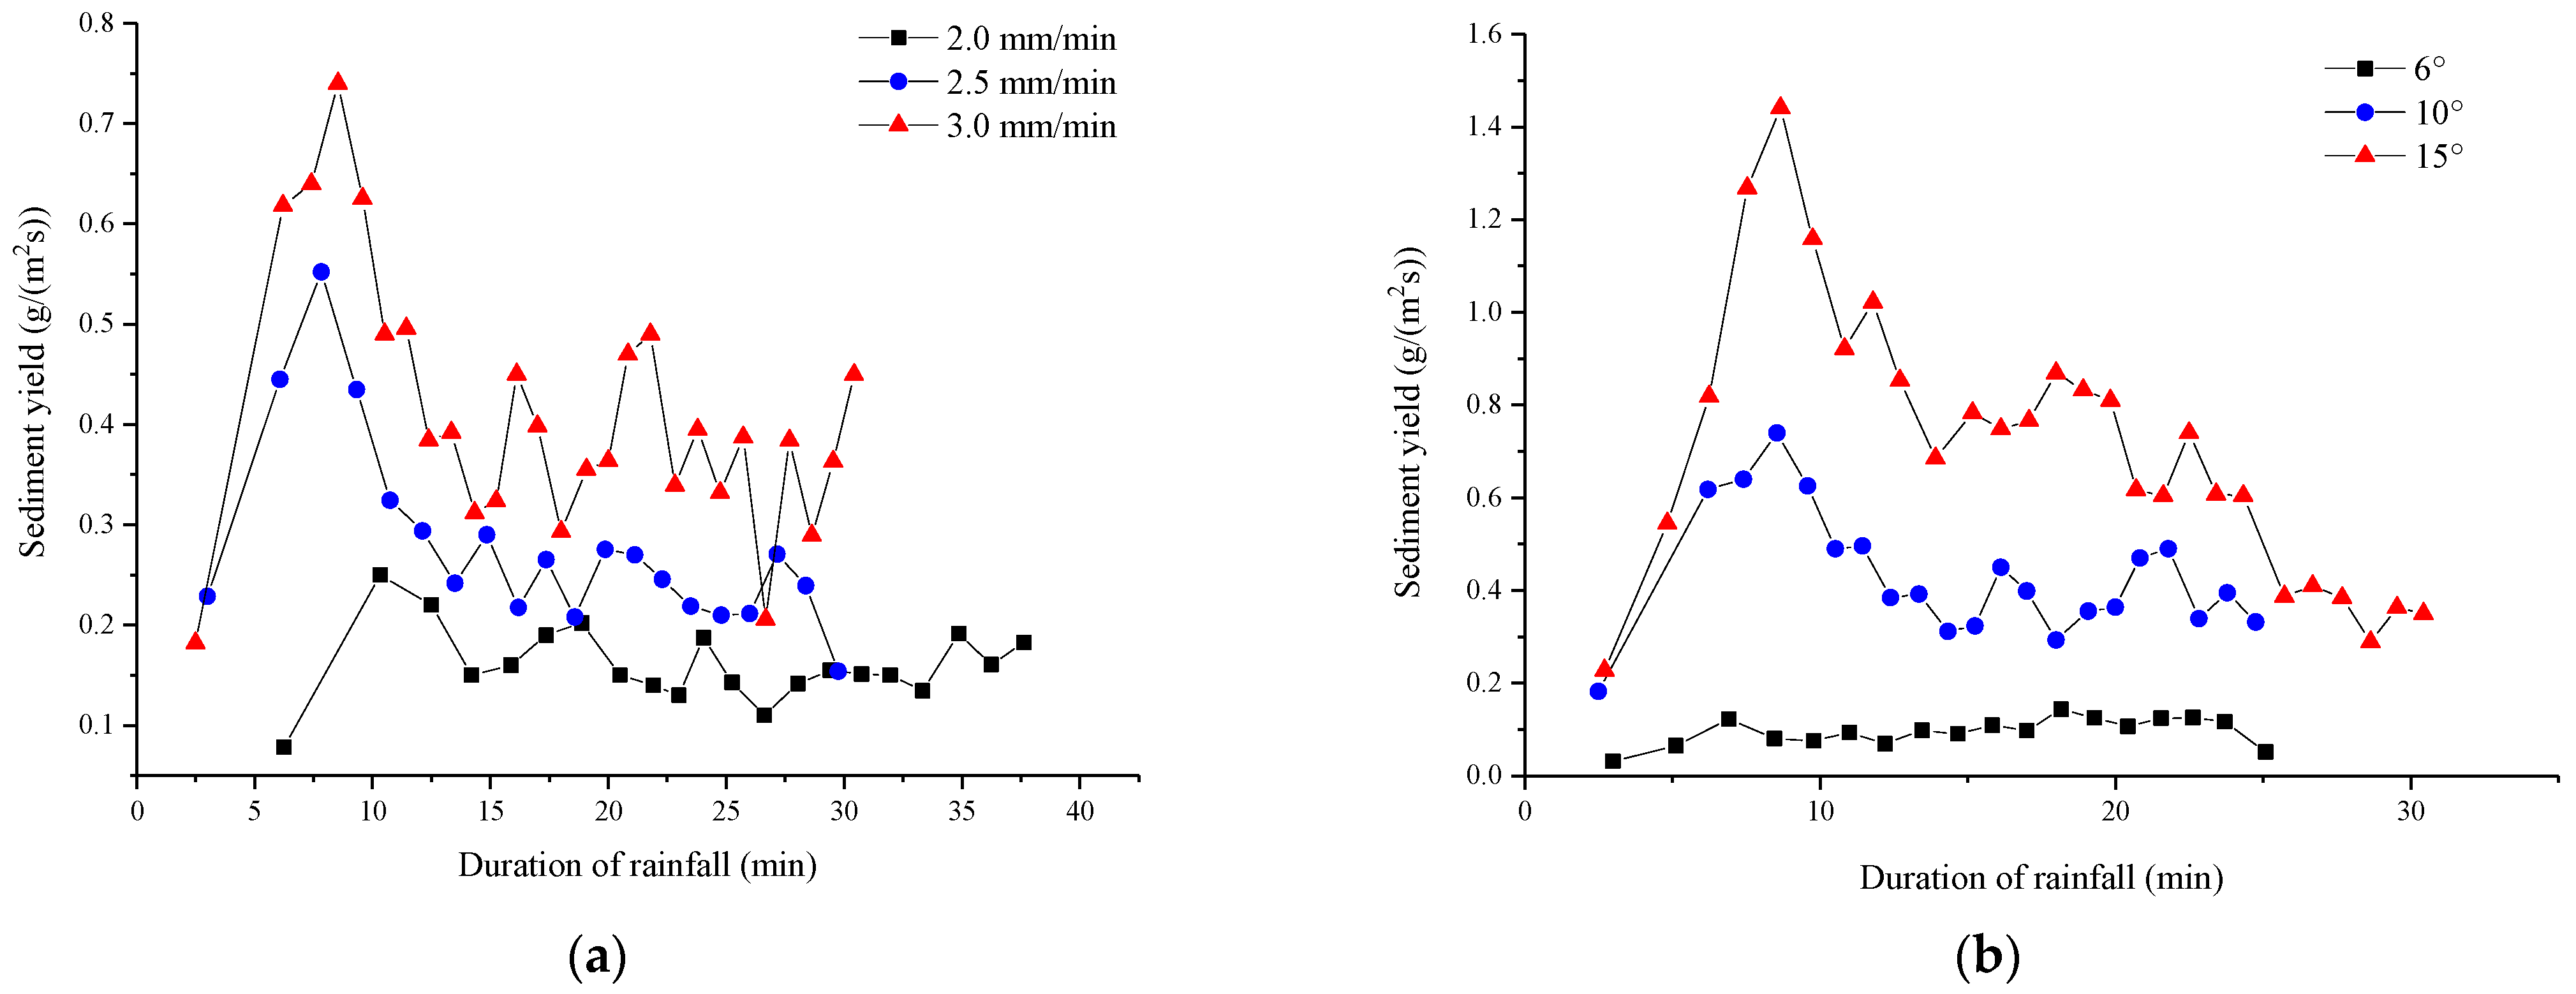
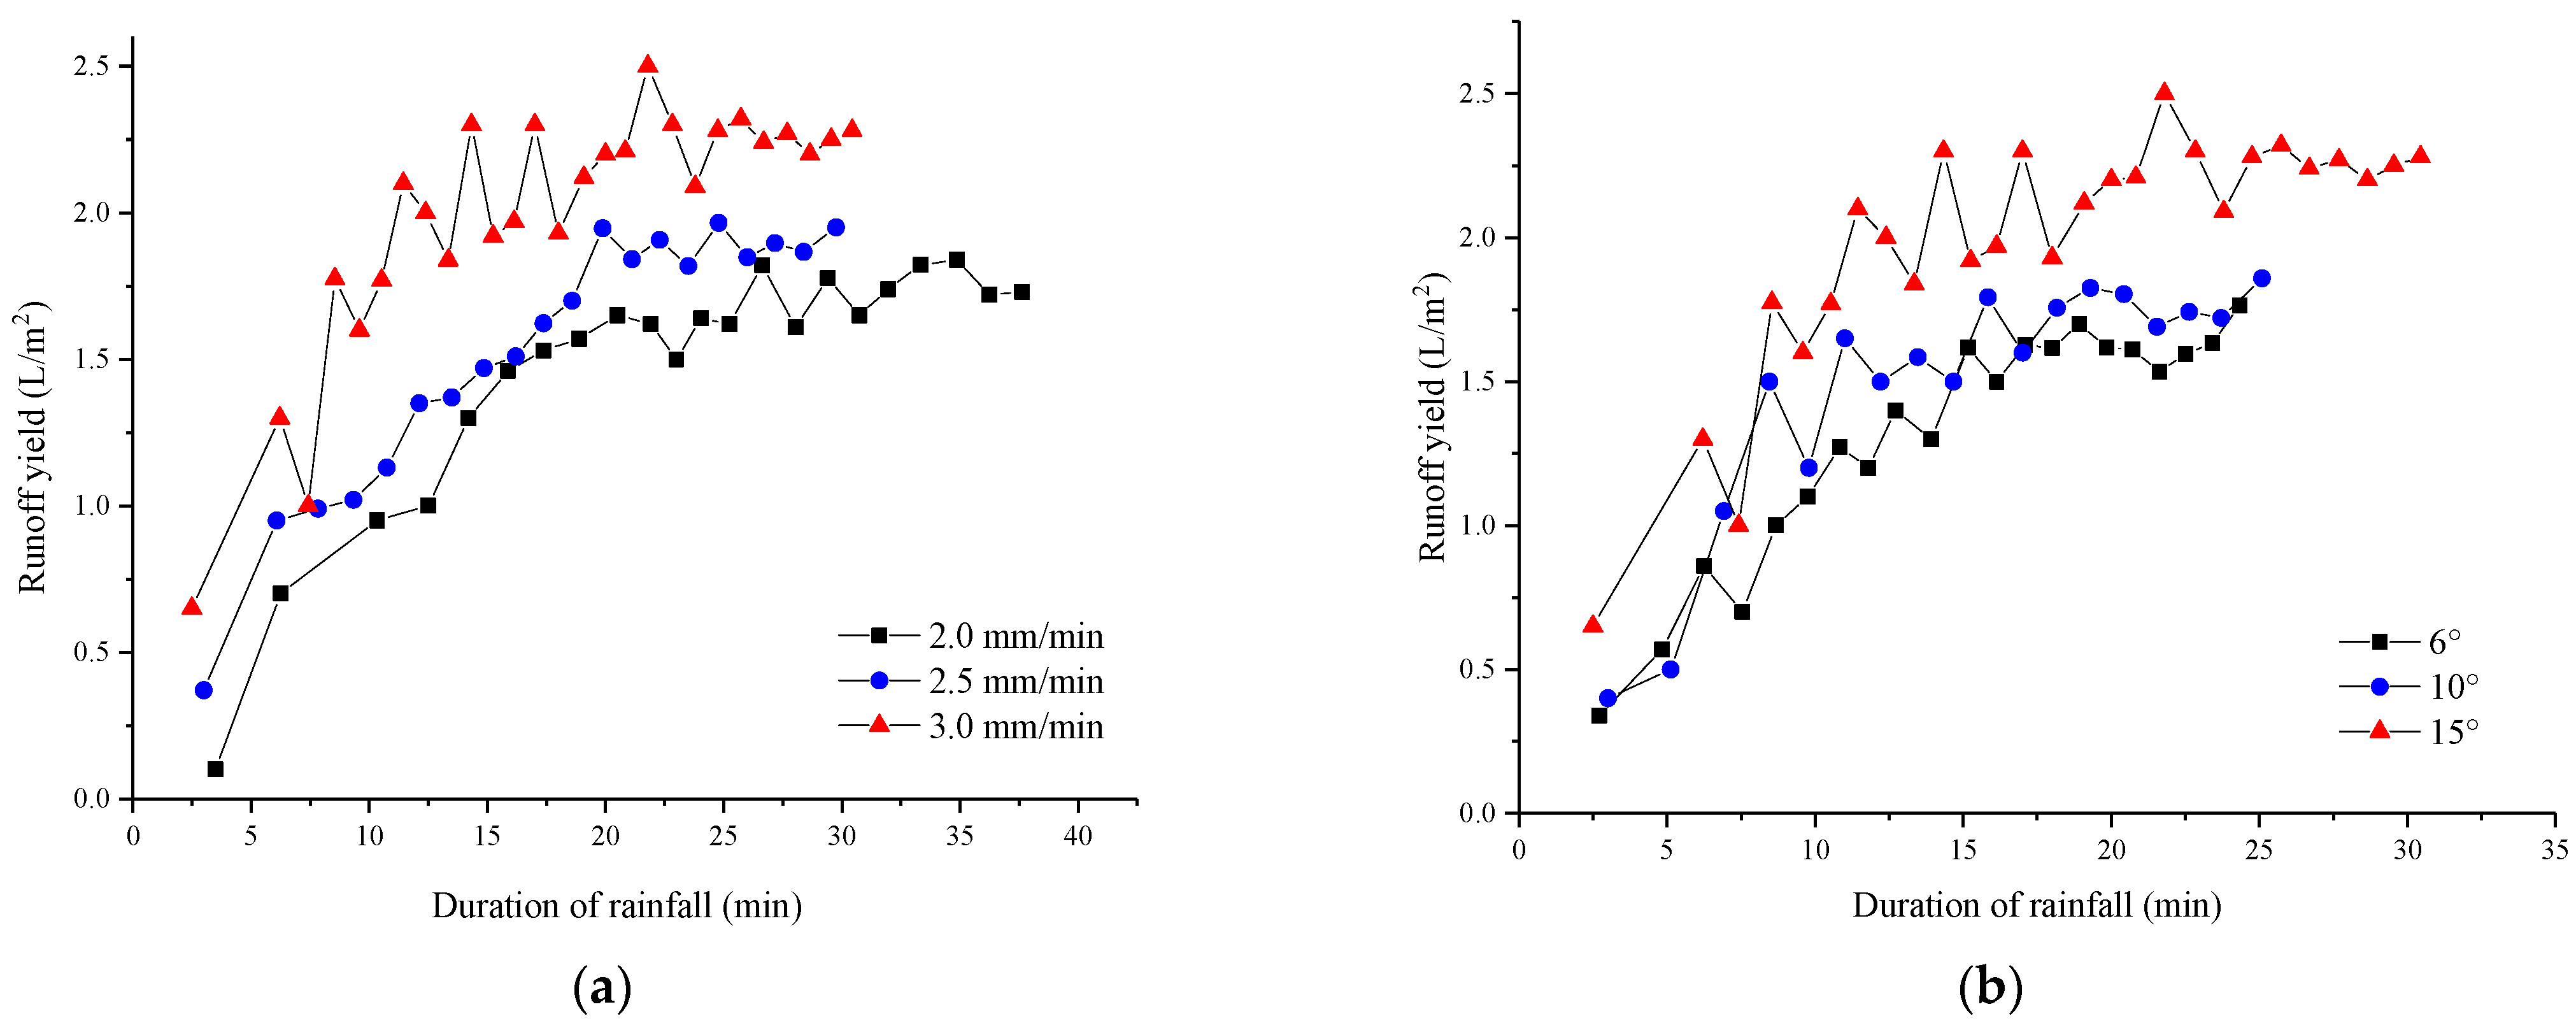
3.1. Process of Runoff and Sediment Yield on Slope
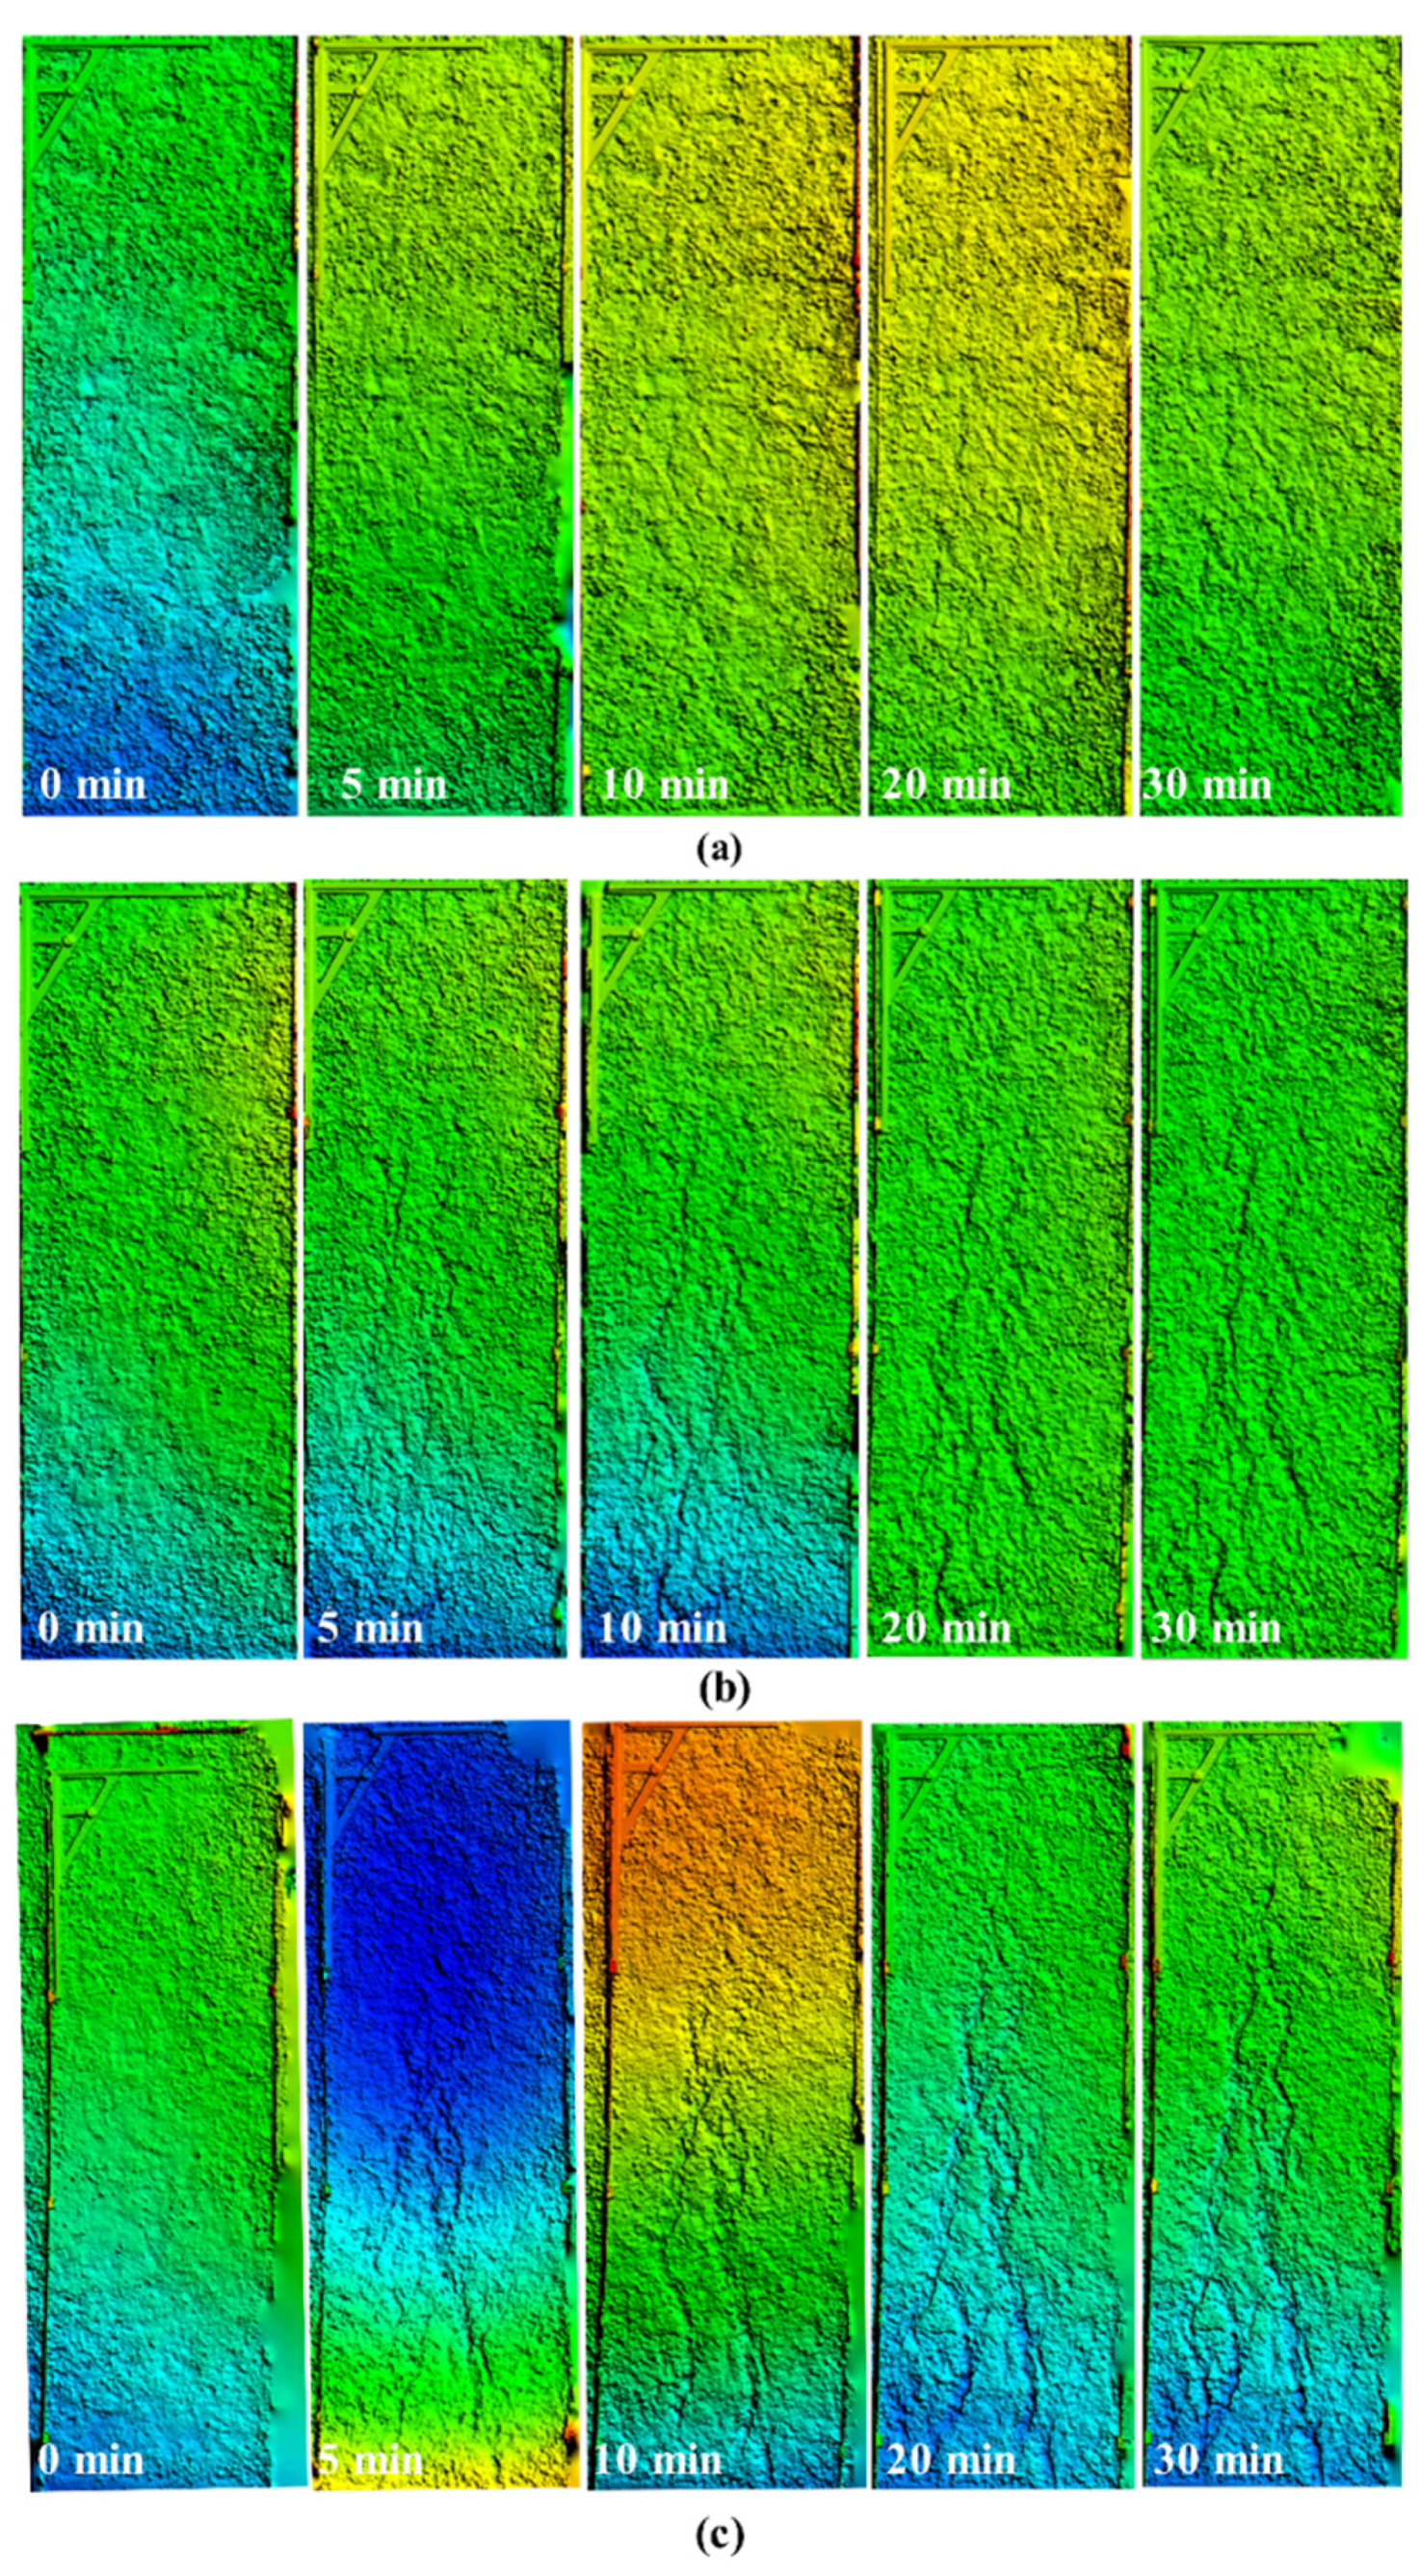
3.2. Variation of Rill Morphological
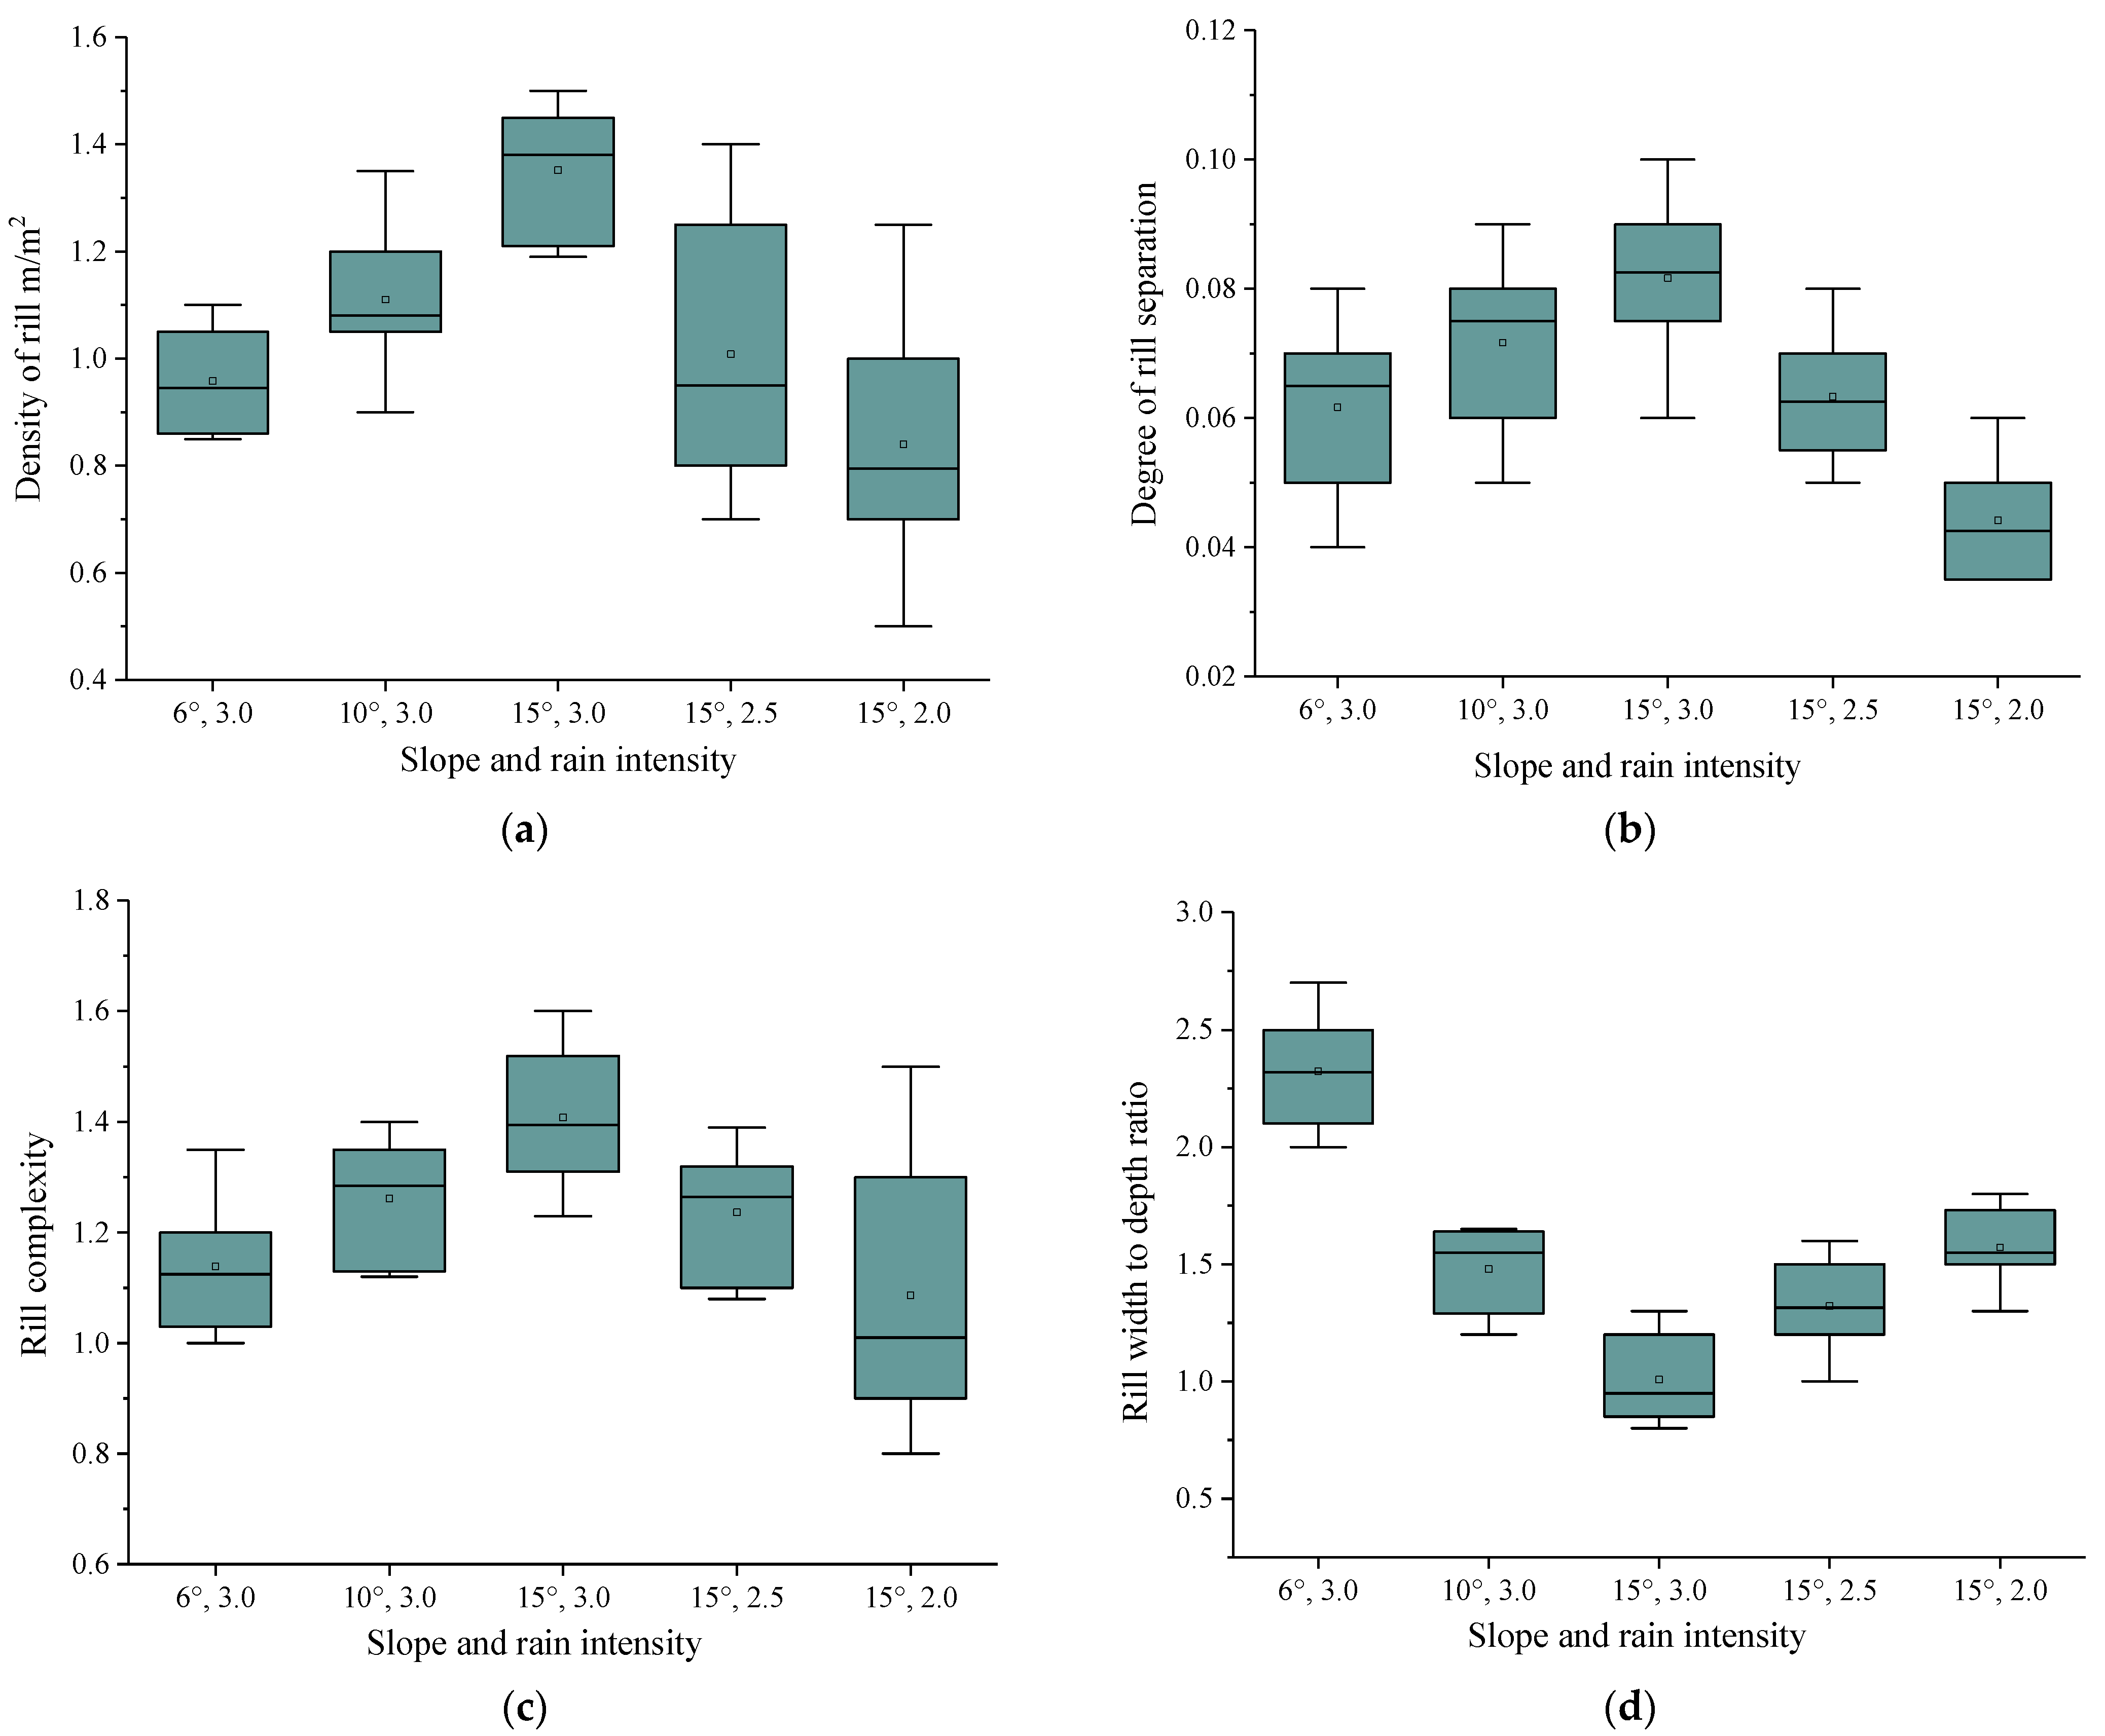
3.3. Variation of Rill Morphological Indexes
3.4. Simulation of Sediment Yield on Rill Slope
4. Discussions
5. Conclusions
Author Contributions
Funding
Acknowledgments
Conflicts of Interest
References
- Luca, M. Govern our soils. Nature 2015, 528, 32–33. [Google Scholar]
- Mohammed, S.; Al-Ebraheem, A.; Holb, I.J.; Alsafadi, K.; Dikkeh, M.; Pham, Q.B.; Linh, N.T.T.; Szabo, S. Soil management effects on soil water erosion and runoff in central Syria—A comparative evaluation of general linear model and random forest regression. Water 2020, 12, 2529. [Google Scholar] [CrossRef]
- Zheng, F.L.; Tang, K.L.; Zhou, P.H. Study on influencing factors of rill erosion in sloping land. Acta Pedol. Sin. 1989, 2, 109–116. [Google Scholar]
- Shen, H.O.; Zheng, F.L.; Wen, L.L. Advances in rill development and morphological characteristics. Acta Ecol. Sin. 2018, 38, 6818–6825. [Google Scholar]
- Zhang, K.L.; Qiuji, K.H. Study on critical hydraulic conditions of rill erosion on slope surface. J. Soil Eros. Soil Water Conserv. 1998, 1, 42–47. [Google Scholar]
- Brunton, D.A.; Bryan, R.B. Rill network development and sediment budgets. Earth Surf. Process. Landf. 2000, 25, 783–800. [Google Scholar] [CrossRef]
- Wang, L.S.; Cai, Q.G.; Cai, C.F.; Sun, L.Y. Morphological changes of rill on loess slope and its relationship with flow velocity. Trans. Chin. Soc. Agric. Eng. 2014, 30, 110–117. [Google Scholar]
- Geng, R.; Jin, Q.; Lei, S.H.; Liu, H.Y.; Lu, B.; Xie, M.X. Comparison of Critical Shear Stress of Rill Erosion Estimated from Two Methods. Water 2022, 14, 1949. [Google Scholar] [CrossRef]
- Vinci, A.; Brigante, R.; Todisco, F.; Mannocchi, F.; Radicioni, F. Measuring rill erosion by laser scanning. CATENA 2015, 124, 97–108. [Google Scholar] [CrossRef]
- Zhang, G.H.; Xie, Z.F. Soil surface roughness decay under different topographic conditions. Geoderma 2019, 187, 92–101. [Google Scholar] [CrossRef]
- Jiang, Y.; Wang, J.; Zhang, L. Morphology anddistribution characteristics of erosion gully in the typical black soil region of Northeast China. Trans. Chin. Soc. Agric. Eng. 2020, 36, 157–165. [Google Scholar]
- He, J.J.; Li, X.J.; Jia, L.J. Experimental study of rill evolution processes and relationships between runoff and erosion on clay loam and loess. Soil Sci. Soc. Am. J. 2014, 78, 1716–1725. [Google Scholar] [CrossRef]
- Mancilla, G.A.; Chen, S.; McCool, D.K. Rill density prediction and flow velocity distributions on agricultural areas in the Pacific Northwest. Soil Tillage Res. 2005, 84, 54–66. [Google Scholar] [CrossRef]
- Tang, H.; Li, Z.B.; Li, P. Runoff, sediment yield and micro-topography of loess slope under artificial rain. J. Desert Res. 2016, 36, 1708–1712. [Google Scholar]
- Berger, C.; Schulze, M.; Rieke-Zapp, D.; Schlunegger, F. Rill development and soil erosion: A laboratory study of slope and rainfall intensity. Earth Surf. Process. Landf. 2010, 35, 1456–1467. [Google Scholar] [CrossRef]
- Lou, Y.C.; Gao, Z.L.; Sun, G.F.; Wu, T.; Zhou, F.Y.; Ai, J.W.; Cen, Y.F.; Xie, J.B. Runoff scouring experimental study of rill erosion of spoil tips. CATENA 2022, 214, 106249. [Google Scholar] [CrossRef]
- Guo, M.; Wang, W.; Shi, Q.; Chen, Q. An experimental study on the effects of grass root density on gully headcut erosion in the gully region of China’s Loess Plateau. Land Degrad. Dev. 2019, 30, 1–19. [Google Scholar] [CrossRef]
- Luo, J.; Zheng, Z.C.; Li, T.X.; He, S.; Zhang, X.; Huang, H.; Wang, Y. Quantifying the contributions of soil surface microtopography and sediment concentration to rill erosion. Sci. Total Environ. 2020, 752, 141886. [Google Scholar] [CrossRef]
- Che, X.C.; Zhao, W.T.; Shen, H.O.; Mou, T.S. Experimental study of rill morphology and its profile characteristics at chinese mollisol hillslope. Bull. Soil Water Conserv. 2020, 40, 55–59. [Google Scholar]
- Mike, K. Modelling the interactions between soil surface properties and water erosion. Catena 2002, 46, 89–102. [Google Scholar]
- Morbidelli, R.; Saltalippi, C.; Flammini, A.; Cifrodelli, M.; Corradini, C.; Govindaraju, R.S. Infiltration on sloping surfaces: Laboratory experimental evidence and implications for infiltration modeling. J. Hydrol. 2015, 523, 79–85. [Google Scholar] [CrossRef]
- Yan, D.C.; Wang, Y.F.; Wen, A.B.; Shi, Z.L.; Long, Y. Morphological evolution of rill development on purple soil slope. Mt. Res. 2011, 29, 469–473. [Google Scholar]
- He, J.J.; Lv, Y.; Gong, H.L.; Cai, Q.G. Experimental study on rill erosion characteristics and sediment production process. J. Hydraul. Eng. 2013, 44, 398–405. [Google Scholar]
- Gilley, J.E.; Kottwitz, E.R.; Simanton, J.R. Hydraulic characteristics of rills. Trans. ASAE 1990, 33, 1900–1906. [Google Scholar] [CrossRef]
- Bewket, W.; Sterk, G. Assessment of soil erosion in cultivated fields using a survey methodology for rills in the Chemoga watershed, Ethiopia. Agric. Ecosyst. Environ. 2003, 97, 81–93. [Google Scholar] [CrossRef]
- Schneider, A.; Gerke, H.H.; Maurer, T.; Nenov, R. Initial hydro-geomorphic development and rill network evolution in an artificial catchment. Earth Surf. Process. Landf. 2013, 38, 1496–1512. [Google Scholar] [CrossRef]
- Yuan, G.L.; Che, A.L. Evolution and spatio-temporal characteristics of slope erosion due to rainfall in Southwest China. Bull. Eng. Geol. Environ. 2022, 81, 270. [Google Scholar] [CrossRef]
- Wu, S.F.; Liu, B.Y.; Lei, Q.; Sun, L.Q.; Guo, H.L.; Feng, Z.; Qian, K. Study on rill erosion evolution based on 3D reconstruction technique. Trans. Chin. Soc. Agric. Eng. 2019, 35, 114–120. [Google Scholar]
- Wang, F.; Xu, G.; Li, L.; Li, Z.; Li, P.; Zhang, J.; Cheng, Y. Response Relationship between Microtopographic Variation and Slope Erosion under Sand-Cover. Water 2019, 11, 2488. [Google Scholar] [CrossRef]
- Zhu, L.J.; Zhang, G.H.; Hu, G.F. Study on evaluation ultrasonic measurement system of overland flow depth. J. Soil Water Conserv. 2013, 27, 235–239. [Google Scholar]
- Liu, G.; Yang, M.Y.; Liu, P.L.; Tian, J.L. 7Be traces rill and rill erosion in sub-rainfall on sloping land. Trans. Chin. Soc. Agric. Eng. 2009, 25, 47–53. [Google Scholar]
- Nouwakpo, S.; Huang, C.H.; Bowling, L.; Owens, P.; Weltz, M. Inferring Sediment Transport Capacity from Soil Microtopography Changes on a Laboratory Hillslope. Water 2021, 13, 929. [Google Scholar] [CrossRef]
- Qin, C.; Zheng, F.L.; Xu, X.M.; He, X. Measurement of rill and rill flow parameters based on stereo photography. Trans. Chin. Soc. Agric. Mach. 2016, 47, 150–156. [Google Scholar]
- Qin, C.; He, C.; Zheng, F.L.; Han, L.F.; Zeng, C.S. Quantitative research of rill head advancing process on loessial hillslope. Trans. Chin. Soc. Agric. Eng. 2018, 34, 160–167. [Google Scholar]
- Oliveira, V.N.; Gitirana, G.d.F.N., Jr.; dos Anjos Mascarenha, M.M.; Sales, M.M.; Varrone, L.F.R.; da Luz, M.P. An Enhanced Flume Testing Procedure for the Study of Rill Erosion. Water 2021, 13, 2956. [Google Scholar] [CrossRef]
- Bai, Q.J.; Ma, S.S. Mechanism of water drop pit in rill erosion process. J. Soil Water Conserv. 2001, S2, 62–65. [Google Scholar]
- Ma, X.L.; Zhang, K.D.; Yang, F.; Yang, M.Y.; Dong, X. Influencing factor analysis of rill erosion section morphology development on slope and its dynamic characteristic experiment. Trans. Chin. Soc. Agric. Eng. 2017, 33, 209–216. [Google Scholar]
- Chen, A.Q.; Zhang, D.; Peng, H. Experimental study on the development of collapse of overhanging layers of gully in Yuanmou Valley, China. Catena 2013, 109, 177–185. [Google Scholar] [CrossRef]
- Warner, W.S.; Reutebuch, S.E.; Service, U.F. Application and accuracy of two fixed base camera systems. Photogramm. Rec. 2010, 16, 423–432. [Google Scholar] [CrossRef]
- Gomez-Gutierrez, A.; Schnabel, S.; Berenguer-Sempere, F. Using 3D photo-reconstruction methods to estimate gully headcut erosion. CATENA 2014, 120, 91–101. [Google Scholar] [CrossRef]
- Petr, K.; Jakub, J.; Martin, L. SMODERP2D—Sheet and Rill Runoff Routine Validation at Three Scale Levels. Water 2022, 14, 327. [Google Scholar]
- Shen, H.O.; Zheng, F.L.; Wang, L.L.; Lu, J.; Jiang, Y.L. An experimental study of rill erosion and morphology. Geomorphology 2015, 231, 193–201. [Google Scholar] [CrossRef]
- Bouguerra, S.; Jebari, S. Identification and prioritization of sub-watersheds for land and water management using InVEST SDR model: Rmelriver basin, Tunisia. Arab. J. Geosci. 2017, 10, 348. [Google Scholar] [CrossRef]
- Wang, Z.G.; Liu, C.M.; Huang, Y.B. Research on principle, structure and application of SWAT model. Prog. Geogr. 2003, 1, 79–86. [Google Scholar]


| RER kg/(m2·s) | RD (m∙m−2) | RFD | RC | RWDR | |
|---|---|---|---|---|---|
| RER | 1 | ||||
| RD | 0.75 | 1 | |||
| RFD | 0.76 | 0.91 | 1 | ||
| RC | 0.85 | 0.82 | 0.89 | 1 | |
| RWDR | −0.73 | −0.84 | −0.77 | −0.90 | 1 |
| Slope | Rainfall Intensity | Formation Time of Step–Pools | Connection Time of Step–Pools | Peak Sediment Yield (g/s) | Peak Last |
|---|---|---|---|---|---|
| 6° | 3.0 | 3′00 | 8′20 | 7.97 | 7′35 |
| 10° | 3.0 | 3′40 | 5′40 | 12.72 | 7′33 |
| 15° | 3.0 | 3′03 | 4′30 | 12.30 | 4′21 |
| 15° | 2.5 | 3′10 | 7′17 | 8.59 | 7′20 |
| 15° | 2.0 | 3′00 | 10′33 | 2.39 | 9′40 |
Publisher’s Note: MDPI stays neutral with regard to jurisdictional claims in published maps and institutional affiliations. |
© 2022 by the authors. Licensee MDPI, Basel, Switzerland. This article is an open access article distributed under the terms and conditions of the Creative Commons Attribution (CC BY) license (https://creativecommons.org/licenses/by/4.0/).
Share and Cite
Zuo, Z.; Wang, H.; Ding, S.; Wu, Y. Effect of Rill Development on Slope Erosion and Sediment Yield Based on Stereophotogrammetry Technology. Water 2022, 14, 2951. https://doi.org/10.3390/w14192951
Zuo Z, Wang H, Ding S, Wu Y. Effect of Rill Development on Slope Erosion and Sediment Yield Based on Stereophotogrammetry Technology. Water. 2022; 14(19):2951. https://doi.org/10.3390/w14192951
Chicago/Turabian StyleZuo, Zilin, Hui Wang, Shuwen Ding, and Yijin Wu. 2022. "Effect of Rill Development on Slope Erosion and Sediment Yield Based on Stereophotogrammetry Technology" Water 14, no. 19: 2951. https://doi.org/10.3390/w14192951
APA StyleZuo, Z., Wang, H., Ding, S., & Wu, Y. (2022). Effect of Rill Development on Slope Erosion and Sediment Yield Based on Stereophotogrammetry Technology. Water, 14(19), 2951. https://doi.org/10.3390/w14192951