Article

Future Projections and Uncertainties of CMIP6 for Hydrological Indicators and Their Discrepancies from CMIP5 over South Korea

School of Civil and Environmental Engineering, University of Ulsan, Ulsan 44610, Korea
*
Author to whom correspondence should be addressed.
Water 2022, 14(18), 2926; https://doi.org/10.3390/w14182926
Submission received: 27 August 2022 / Revised: 12 September 2022 / Accepted: 15 September 2022 / Published: 18 September 2022

Abstract

:
Future climate projections and their uncertainties affect many aspects of the world, so reliable assessments are essential for policymakers who need to prepare mitigation measures in the context of climate change. In this study, we examined the projected future climate and estimated uncertainty for South Korea using results from the global climate model (GCM), updated from the sixth phase of the coupled model intercomparison project (CMIP6); we then compared the differences in outcome between the fifth and sixth phases of the CMIP (CMIP5 and CMIP6). Future projections were estimated as the averaged climatological mean (denoted as C M ¯ ) for the four proposed hydrological indicators. Model uncertainty (UEMI) and stochastic uncertainty (USTO) were quantified as the range of ensembles of the climatological mean, while the emission uncertainty (UEMI) was estimated as the difference between the C M ¯ values of two emission scenarios. The following are the key findings of our study: (1) using an ensemble of multiple GCMs is recommended over using individual GCMs, and models in CMIP6 performed better for reproducing climate during the control period than models in the CMIP5; (2) the C M ¯ values in the CMIP6 increased for future periods, especially toward the end of this century, increasing mean temperature (meanTa) by approximately 5 °C, total precipitation (totPr), and daily maximum precipitation (maxDa) by about 20%, and these values were higher than those of the CMIP5; (3) the UGCM, USTO, and UEMI values increased for future periods in most of the indices; (4) the UGCM (for meanTa, totPr, and maxDa) and USTO (for totPr and maxDa) magnitudes in the CMIP6 were higher than those in the CMIP5, while the UEMI values between the two CMIPs were similar for all of the indices; (5) the UGCM was the major source of the largest uncertainty for meanTa, the USTO had a significant impact on future projections of totPr and maxDa, especially in the summer, and the UEMI became the dominant source of uncertainty for projecting the future meanTa, especially in the period farthest from the present. These results should provide useful information for studies that quantify future climate-induced hydrological impacts.

1. Introduction

Climate change is increasingly affecting many sectors, such as agriculture, the environment, and water resources in many parts of the world [1]. Developing an accurate assessment of how the climate will change in the future is still a challenge, despite improvements in climate projection. Incomplete or unreliable information from future predictions can lead to unpredictable damage to both property and life. To better understand the past and future climates, different phases of the coupled model intercomparison project (CMIP) have been built by the World Climate Research Program’s (WCRP) Working Group of Coupled Modeling (WGCM). The global climate model (GCM) adopted by the CMIP is an effective tool for providing predictions of past and future climates through simulations of the major climate system components (atmosphere, land surface, ocean, and sea ice) and their interactions. Until recently, the GCM output from the fifth phase of the CMIP (CMIP5) [2] was used extensively in climate studies, while the sixth phase of the CMIP (CMIP6) [3] has recently been employed. Improvements in CMIP6 include an increased representation of physical understanding, increased horizontal and vertical resolution, and updated emission scenarios (i.e., a shared socioeconomic pathway—SSP). The CMIP6 dataset is expected to provide a better understanding of climate change arising from natural (unforced) variability or due to radiative forcings in a multi-model context in different periods (i.e., in the past, present, and future). Therefore, there is a need to investigate and improve our understanding of the present climate system and the projections of future climate change by analyzing the updated results of CMIP6, including what the mean and extreme climate conditions will be in the future and whether the uncertainties in future projections will decrease.
While many previous studies have demonstrated that the models in CMIP6 are better at simulating results for the mean and extreme precipitation values for the historical climate measurements than CMIP5 [4,5,6,7,8,9,10], the results of some studies have indicated that simulations of the historical averages and extremes in CMIP6 did not reflect model improvements when compared to simulations in CMIP5 [11,12,13]. Differences in the projected future changes between CMIP5 and CMIP6 depend on the variables of interest and geological locations. For example, the difference in projected changes in temperature extremes between CMIP5 and CMIP6 is insignificant, but the difference in precipitation extremes is considerable [14]. For global monsoons, CMIP6 projections differ from CMIP5 projections in some regions [15], but the differences are negligible in others [9]. Since the future climate projections of CMIP5 and CMIP6 have been reported with inconsistent and regionally mixed results, we need to continue investigating the climate variables of interest at a local scale for new GCM datasets in CMIP6.
As the results of the new generations of climate models have become available, a number of studies were conducted to compare and evaluate the performance of the previous and new-generation models, e.g., CMIP3 vs. CMIP5 [16,17,18,19,20] and CMIP5 vs. CMIP6 [8,9,12,13,14,21,22,23,24,25]. Despite the many studies noted above, these comparisons have been evaluated on coarse (global or regional) spatial scales, and efforts to assess the performance on finer (local or station) spatial scales have been less common [4,26,27,28]. The performance of GCMs for simulating climate variables at a fine spatial scale may differ from that at a coarse spatial scale, so they may require evaluation at various spatial resolutions.
The reason for the inconsistency of future projection results, according to the regions and variables of interest, is that the contributions of various sources of uncertainty are different. Sources of uncertainty arise primarily from the imperfect structure of climate models, emission scenarios, and climate internal variability (CIV) [29]. Mixed results have been reported due to the differences in contributions and the importance of each source of uncertainty, varying with projection lead time, climate variables of interest, or the spatiotemporal scale. For example, climate model uncertainty can be the main component of total uncertainty for forecasting global mean temperatures [30], while the contribution of this uncertainty to the global mean precipitation is smaller than that of other uncertainties [30,31]. This uncertainty was found to increase in the future and become dominant at the end of this century for global mean precipitation [32] and for the ENSO projection [33]. For the emission scenario uncertainty, its contribution to uncertainty with regard to the mean monthly temperature is greater than that of the other contributors [32,34,35]; however, its contribution was found to be relatively small for the ENSO projection throughout the 21st century [33] and for the mean precipitation [32,34,35]. In terms of stochastic uncertainty due to the CIV, its contribution was minor and would not change in the future for the mean temperature [36,37,38]. Stochastic uncertainty was found to be a major source of uncertainty for the mean and extreme precipitation values on a local scale for far-future projection [34,35]. A noteworthy question arose as to whether uncertainties in future climate projections were reduced with the updated GCMs in CMIP6, compared to those in CMIP5. When uncertainties are better described and quantified, decision-makers can easily design mitigation measures or adaptation policies from reliable information about future climate projections.
In this study, we sought to quantify the future projections of the climatological mean and uncertainties in the context of climate change and to investigate what the differences in those values would be between CMIP5 and CMIP6. Those differences may be particularly pronounced due to the complex climatological nature of South Korea. As a result of its geographical location on a peninsula (it is surrounded by the sea on three sides), Korea is influenced by continental and marine climates with unique characteristics, and because of its topographical features (70% of the land is mountainous), the climatic differences among regions are significant. The combination of topographical characteristics and the prevailing system can create unique spatial distributions of climatic variables, especially in terms of precipitation. In this study, the Bayesian weighted averaging (BWA) approach [39], facilitated with the Markov chain Monte Carlo (MCMC) simulation, and the stochastic weather generator, also known as the advanced weather generator (AWE-GEN) [40,41] were employed to quantify the three uncertainties.

2. Methodology

The following procedure describes how we investigated the change in future temperature and precipitation from the GCM models of CMIPs and how we quantified the uncertainties of the projection. A flow chart showing our methodology is illustrated in Figure 1.
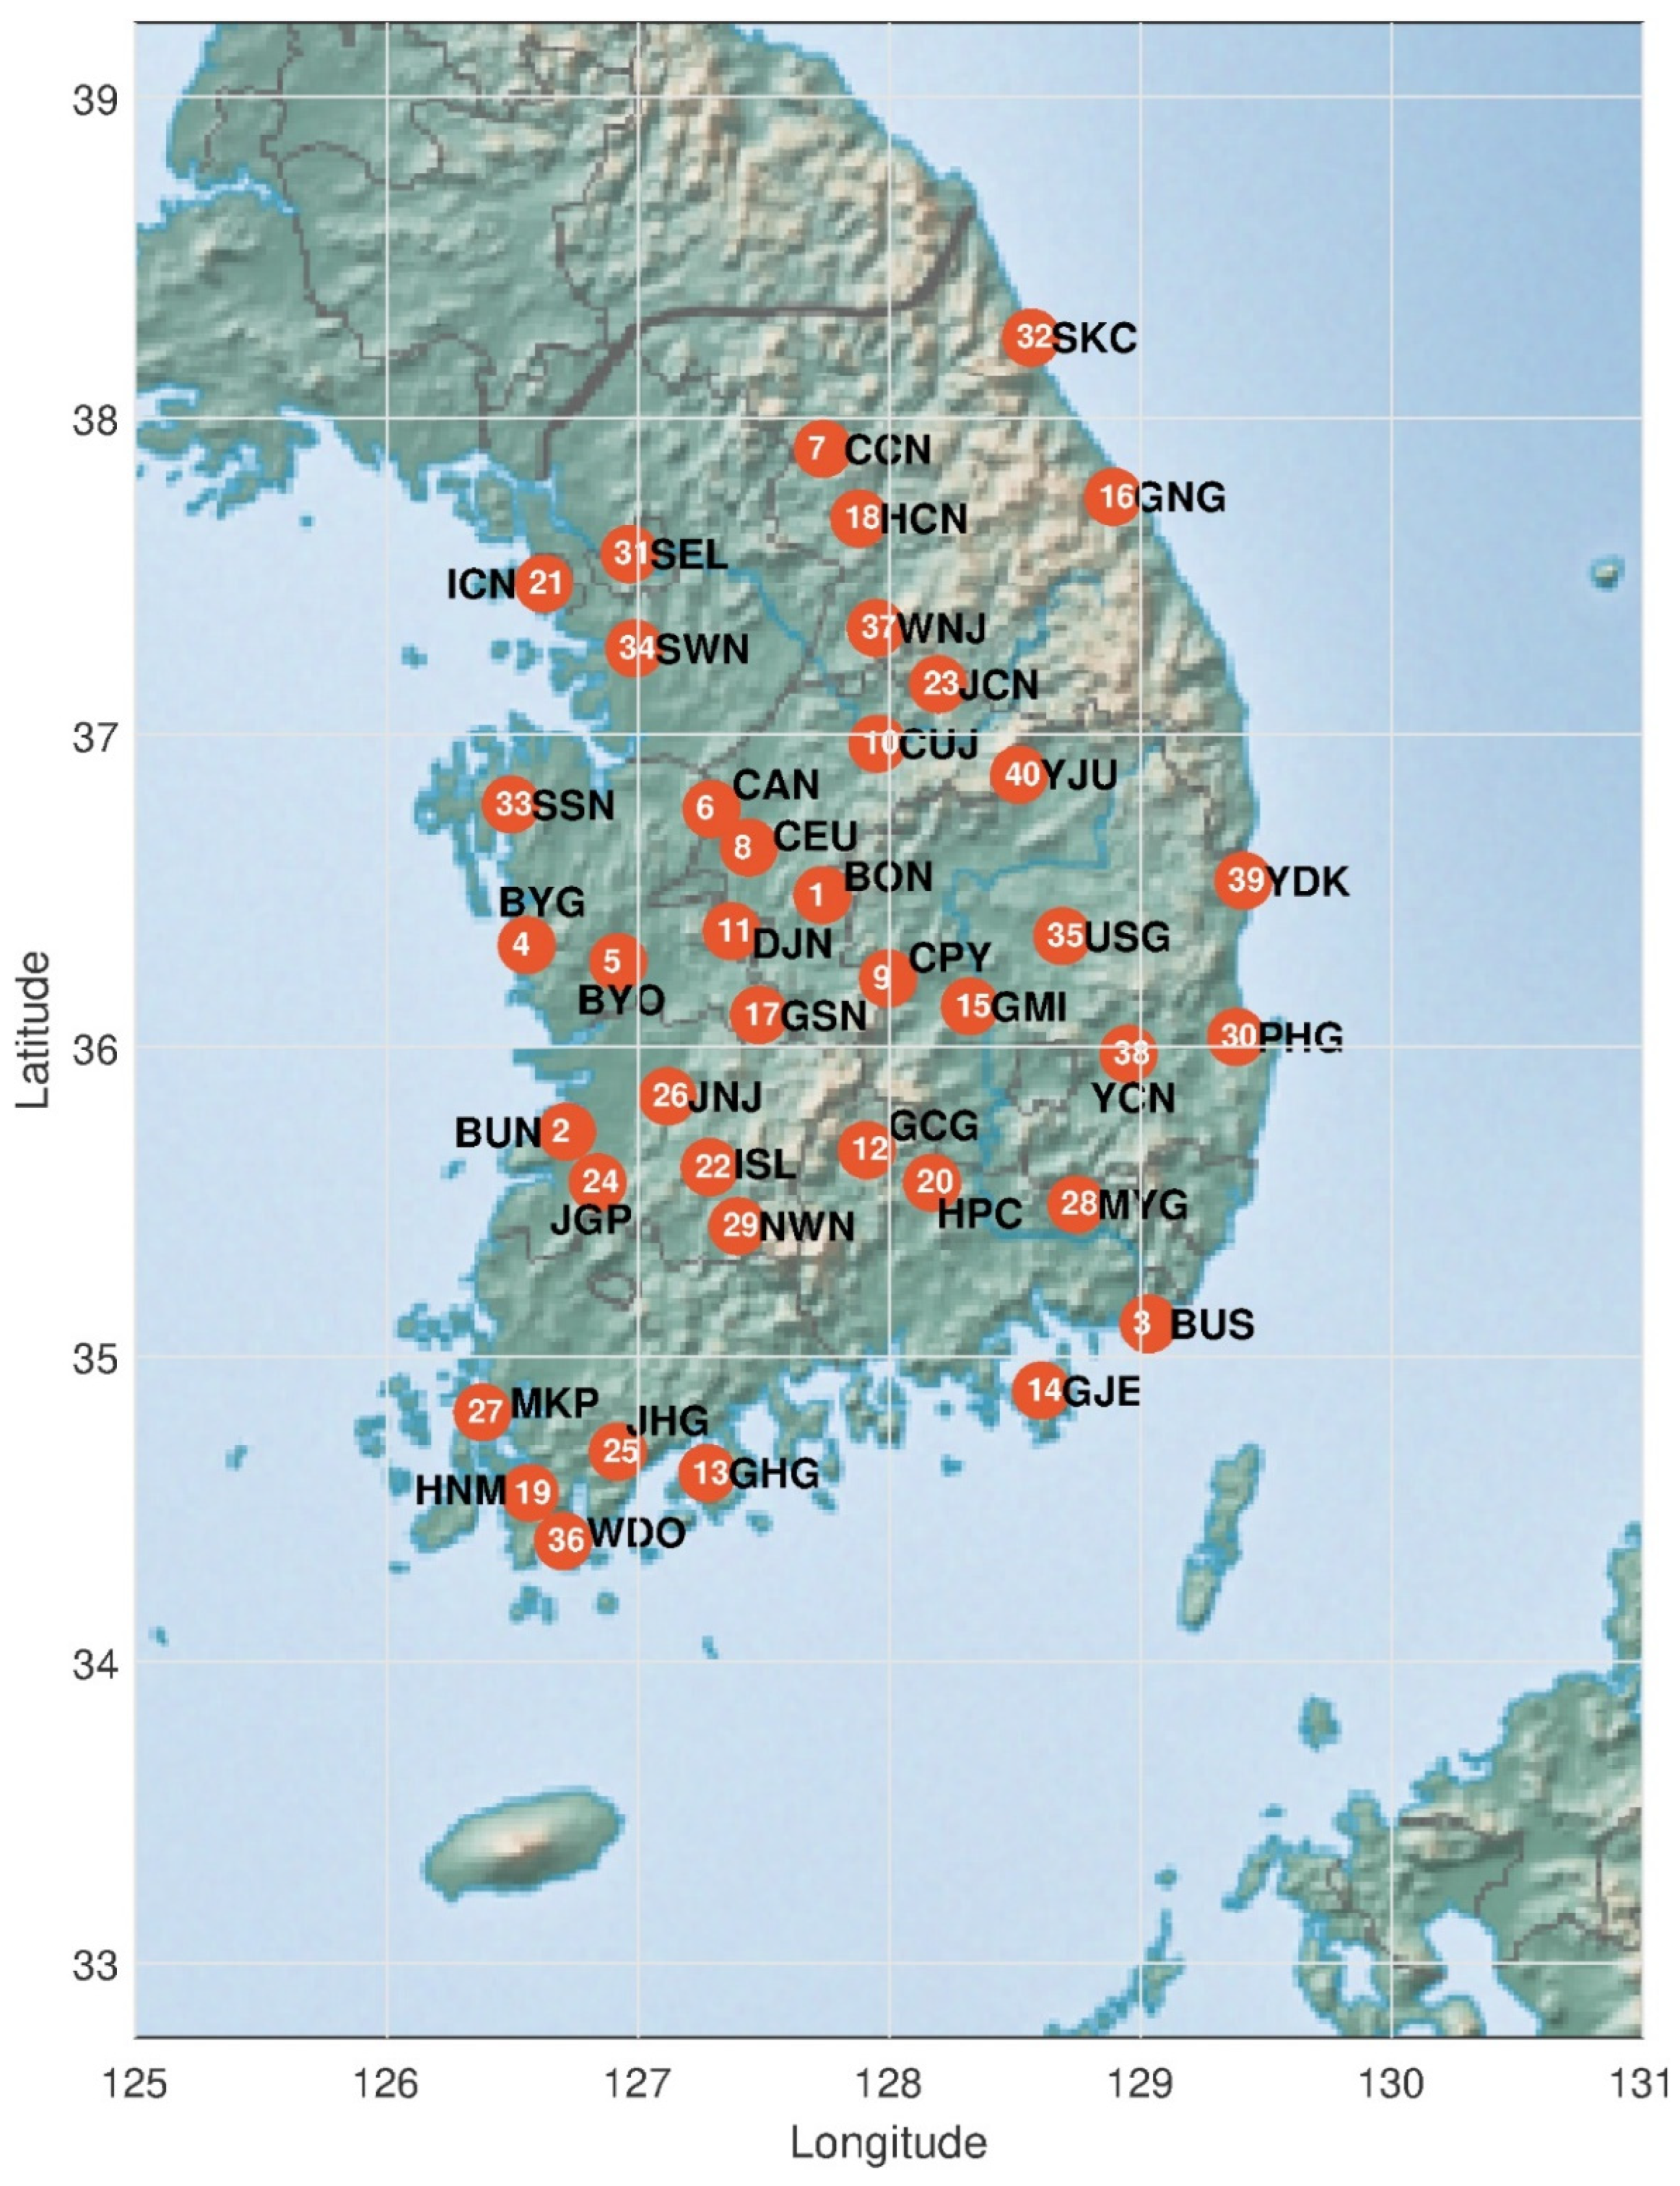
First, the hourly time series of meteorological variables were collected at the gauge location of interest. This data was obtained from an automatic weather observation station operated by the Korean Meteorological Administration as part of the Automated Surface Observing System (https://data.kma.go.kr/data/grnd/selectAsosList.do?pgmNo=36, accessed on 10 September 2021). Forty stations were selected because of the availability of data, providing at least 30 years of hourly records, and then the data were examined carefully to avoid any potential errors [42]. A spatial map of the 40 stations across South Korea is shown in Figure 2.
In this study, we downloaded the time series data for daily precipitation and monthly temperature that were simulated using the global circulation models (GCMs) in the fifth and sixth phases of the coupled model intercomparison project (CMIP5 and CMIP6) archive [3]. To compare the results of CMIP5 and CMIP6 under seamless conditions, the same number of GCMs were selected. A total of 18 models were chosen, of which 16 were updated versions of the CMIP5 model from the same institution (see Table 1 for detailed information). The data from CMIP6 and CMIP5 were downloaded from the database portal (https://esgf-node.llnl.gov/search/cmip6/, accessed on 15 June 2021) and (https://esgf-node.llnl.gov/search/cmip5/, accessed on 10 August 2018), respectively. For the other two models of CMIP6, new models were added since there was no updated version from the same institution. Future results from different emission scenarios were compared using the RCP (representative concentration pathway) 4.5 and RCP 8.5 scenarios in CMIP5, along with the SSP2-4.5 and SSP5-8.5 scenarios in CMIP6 [43], which showed similar levels regarding fossil-fuel socioeconomics and carbon dioxide emissions. The simulated period for quantifying future changes was divided into a historical control period (CTL: 1981–2010) and three future periods (ERY: 2016–2040, MID: 2041–2070, and END: 2071–2100). These periods in CMIP6 were identical to those in CMIP5, except for the ERY period in CMIP5, which was 5 years longer (2011–2040). After attaining those time series of precipitation and temperature from both the observations and GCMs, a range of statistics (i.e., mean, variance, skewness, and frequency of non-precipitation) spanning daily, monthly, and annual scales were calculated on four aggregation time intervals (i.e., 24, 48, 72, and 96 h)—a total of 170 statistics were employed.
Due to the different degrees of understanding of climate physics and dissimilar spatial resolutions for simulations, GCMs provide inconsistent projected outcomes. Thus, the random selection of GCMs can introduce significant uncertainties and risks in climate change assessments. To quantify the potential uncertainty of GCMs, the Bayesian weighted averaging (BWA) [39] method was applied to the statistical properties of 18 GCMs and observations. The outputs of the BWA approach were the posterior distributions of the 170 statistics, in the form of either “product” types for precipitation or “additive” types for factors of change (FOCs) with regard to temperature [35,42,64,65,66,67]. In total, 1000 samples were generated from the Markov chain Monte Carlo (MCMC) algorithm. For more detailed information on the BWA parameters, the assumption of the prior distributions, the MCMC algorithm, the burn-in period, etc., refer to Step (2) in a previously published study [35].
We generated 100 ensembles of 30-year time series for the new set of AWE-GEN parameters. These repeated simulations of AWE-GEN were derived from a population with the same climate characteristics (i.e., using the same AWE-GEN parameters), indicating that external forcing conditions were equally controlled under a stationary assumption. Therefore, these ensemble simulation results, which corresponded to 3000 years, could be considered to be a good sample by which to quantify the stochasticity of precipitation, i.e., the climate internal variability (CIV) [35,42,65,68]. The ensemble simulation of AWE-GEN was implemented for the control period (1981–2010) and the early (2016–2040), middle (2041–2070), and end (2071–2100) future periods, along with two emission scenarios from CMIP6 and CMIP5.
From the generated time series, we extracted the values for four hydrological indicators to quantify uncertainty about future projection estimates. The indicators employed were mean temperature (meanTa), total precipitation (totPr), maximum daily precipitation (maxDa), and the number of dry days (nonPr), which were calculated monthly and for the full year to evaluate the seasonal and annual patterns. These indices were chosen as variables that could attract policymakers, such as floods (refer to maxDa), droughts (nonPr), or average patterns (meanTa, totPr). In this study, the number of ensembles reconstructed from the MCMC simulation results used to quantify the GCM uncertainty was 4 (indices) × 13 (12 months and the whole year) × 40 (locations) × 7 (periods and scenarios) × 1000 (MCMC results). On the other hand, the number of ensembles reconstructed from AWE-GEN realizations used to quantify the stochastic uncertainty was 4 (indices) × 13 (12 months and the whole year) × 40 (locations) × 7 (periods and scenarios) × 100 (AWE-GEN realizations).
Once the annual time series for the four indicators were reconstructed, the most likely climate was estimated by computing the climatological mean (CM), and its three uncertainty magnitudes were quantified. The three uncertainties considered were the GCM uncertainty (UGCM), the emission scenario uncertainty (UEMI), and the stochastic uncertainty (USTO). The CM for each ensemble member was calculated as follows, using Equation (1):
C M m = 1 T t = 1 T X m t
where X m t is the annual value of the four indices for the m-th ensemble member and the t-th year, and T is the number of years (T = 30). In this study, the averaged climatological mean ( C M ¯ ) was defined by averaging the climatological mean of the ensemble members, and the UGCM was defined as the range. The difference between the 5th and 95th percentiles of the 1000 C M values was calculated using Equation (2):
U G C M = r a n g e ( C M m = 1 : M )
where M is the number of ensemble members for the MCMC simulation (M = 1000). The 1000 MCMC samples were used for GCM uncertainty quantification because they reflected the spread of the predicted values of the 18 GCMs. The UEMI was simply computed in Equation (3) as the difference between the average CM values of two emission scenarios:
U E M I = ( 1 M m = 1 M ( C M m ) ) 85 ( 1 M m = 1 M ( C M m ) ) 45
where 85 and 45 refer to the emission scenarios of RCP 8.5 and RCP 4.5 in CMIP5 and SSP5-8.5 and SSP2-4.5 in CMIP6, respectively. Lastly, the USTO was defined as the range of the 100 C M values, calculated using Equation (4), as follows:
U S T O = r a n g e ( C M m = 1 : W )
where W is the number of ensemble members for the AWE-GEN simulation (W = 100). The 100 AWE-GEN samples were used for the stochastic uncertainty quantification because they maintained stationarity, excluding any external factors [35,41,42,64,65,66].

3. Results and Discussions

3.1. Comparison of the BWA Mean and Individual GCMs for the Control Period

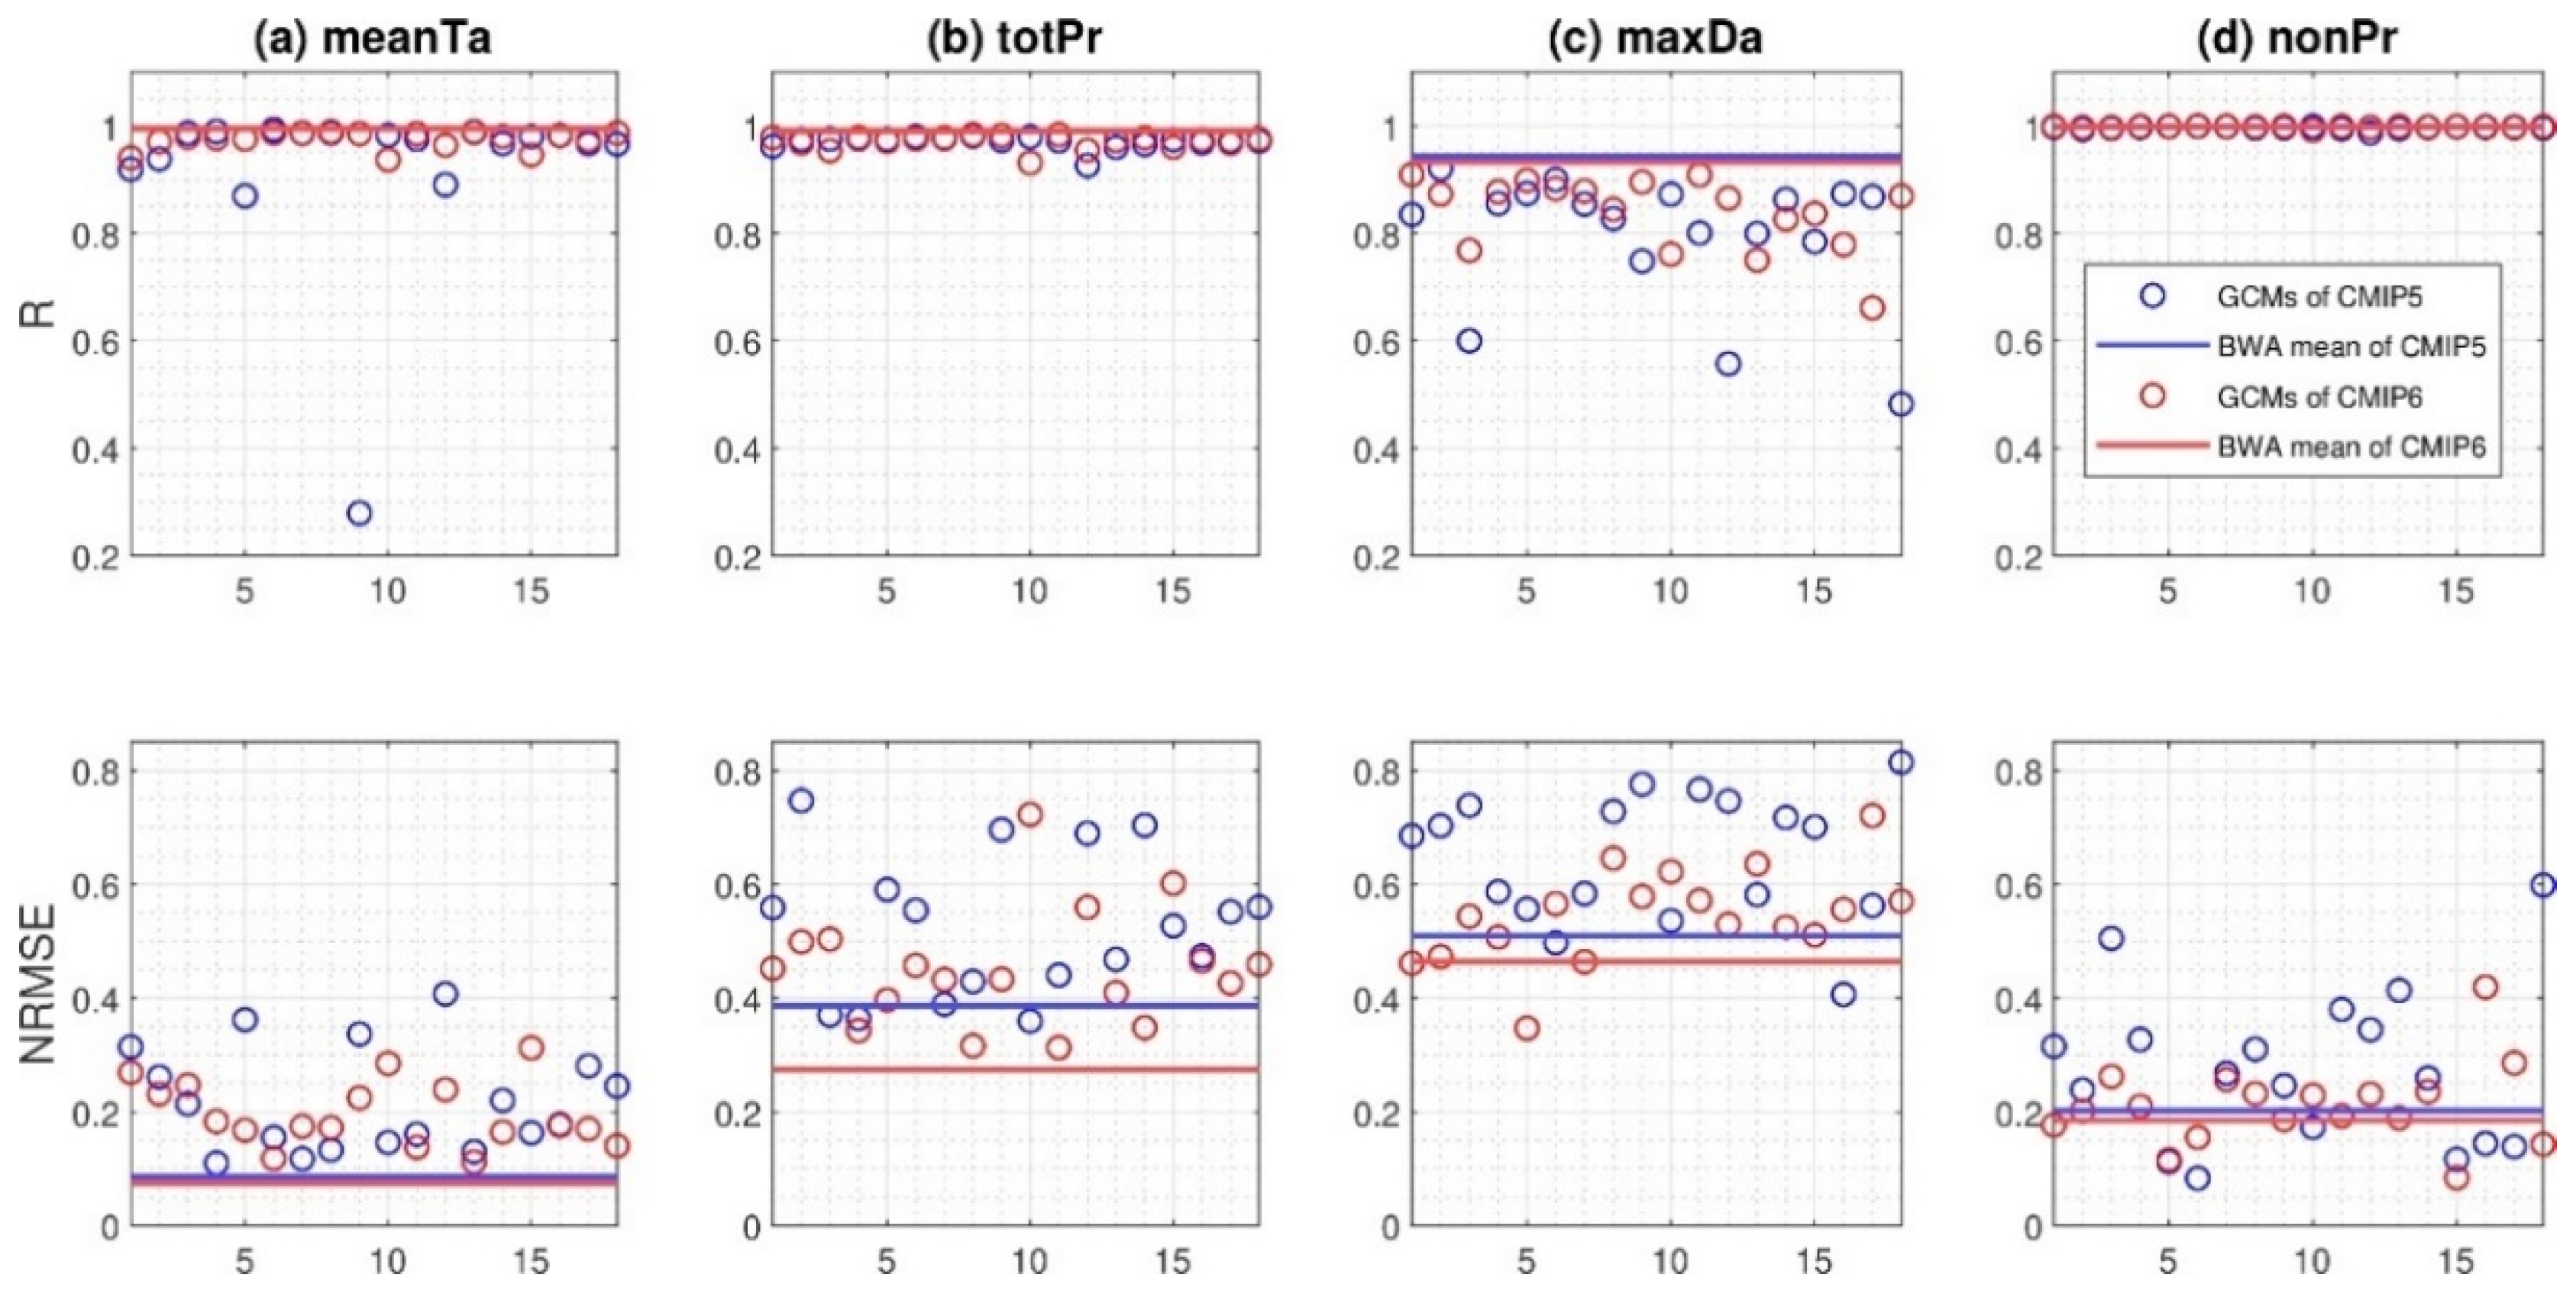
In this study, we employed the BWA approach facilitated by the MCMC simulation to generate an ensemble of the climate variables used for quantifying the GCM uncertainty. Prior to analyzing forecasts for the future, we examined how much uncertainty was embraced when the indices were reproduced using individual GCMs compared to the observed indices for the control period. Figure 3 illustrates the correlation coefficient (R) and the normalized root mean squared error (NRMSE) computed for 40 locations and 13 months with 18 GCMs and their BWA mean. Overall, it was found that using the BWA approach, which aggregated the results of multiple GCMs, yielded predictions more similar to the observations than those from individual GCMs. In both the CMIP5 and CMIP6 results, it was confirmed that the BWA mean had a high correlation with the observed data and that the NRMSE values were small. For example, the R values ranged from 0.94 to 0.99 for CMIP5 (blue line) and 0.93 to 0.99 for CMIP6 (red line). The NRMSE value for the BWA approach was 0.075 for the meanTa of CMIP6, whereas those for the 18 GCMs varied from 0.111 to 0.312. More specific results are shown in Table 2.
The NRMSE values varied greatly depending on which GCM was selected, and it was also confirmed that some GCMs could provide better predictions than the average value of BWA if some of the GCMs were used, with good results. For example, the NRMSE values of the fifth GCM were 0.346 and 0.116 for the maxDa and nonPr of CMIP6, respectively, which were smaller than the NMRSE values of the BWA mean (0.464 and 0.185 for maxDa and nonPr, respectively). However, it should be noted that this improved performance of GCM was not a consistent result. Depending on the statistics used, the geological locations, and the seasonality, some GCMs may or may not have performed well. The NMRSE values of the same, fifth, GCM did not perform better in terms of meanTa and totPr. From the results noted above, we showed that using the BWA approach to forecast climate indices was more reliable than selecting individual GCMs.

3.2. Future Projection from the CMIP5 and CMIP6 Databases

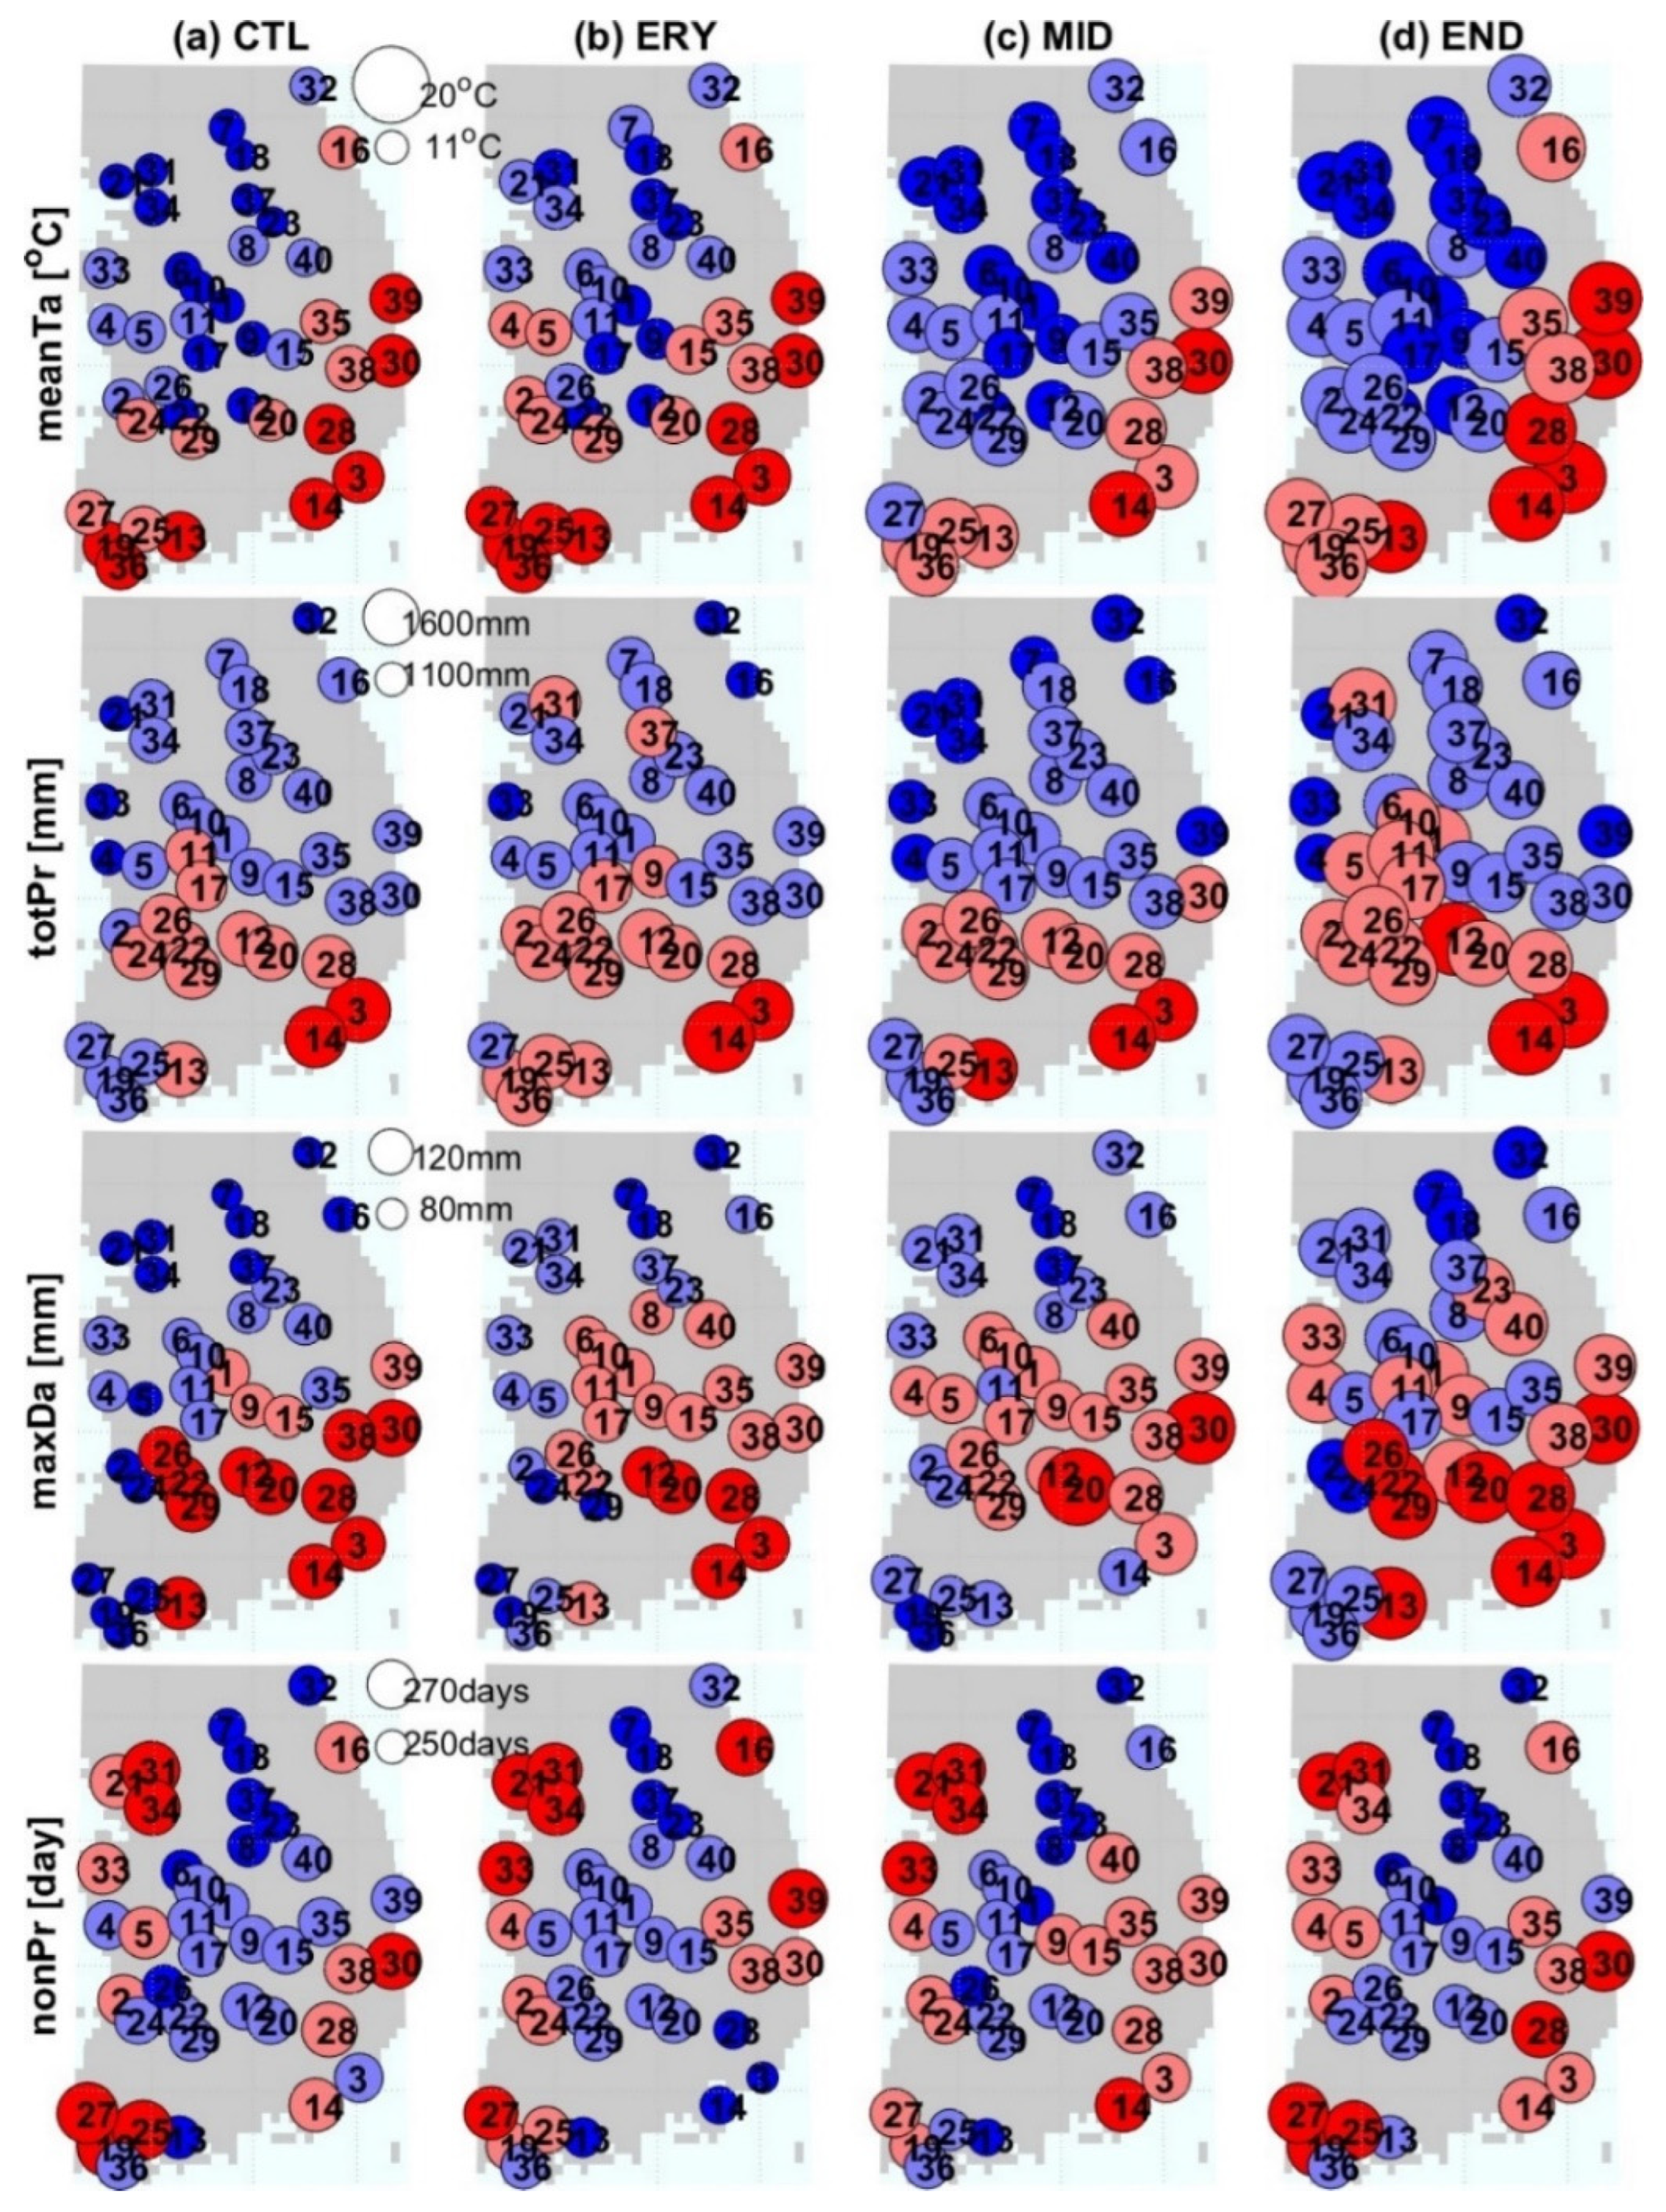
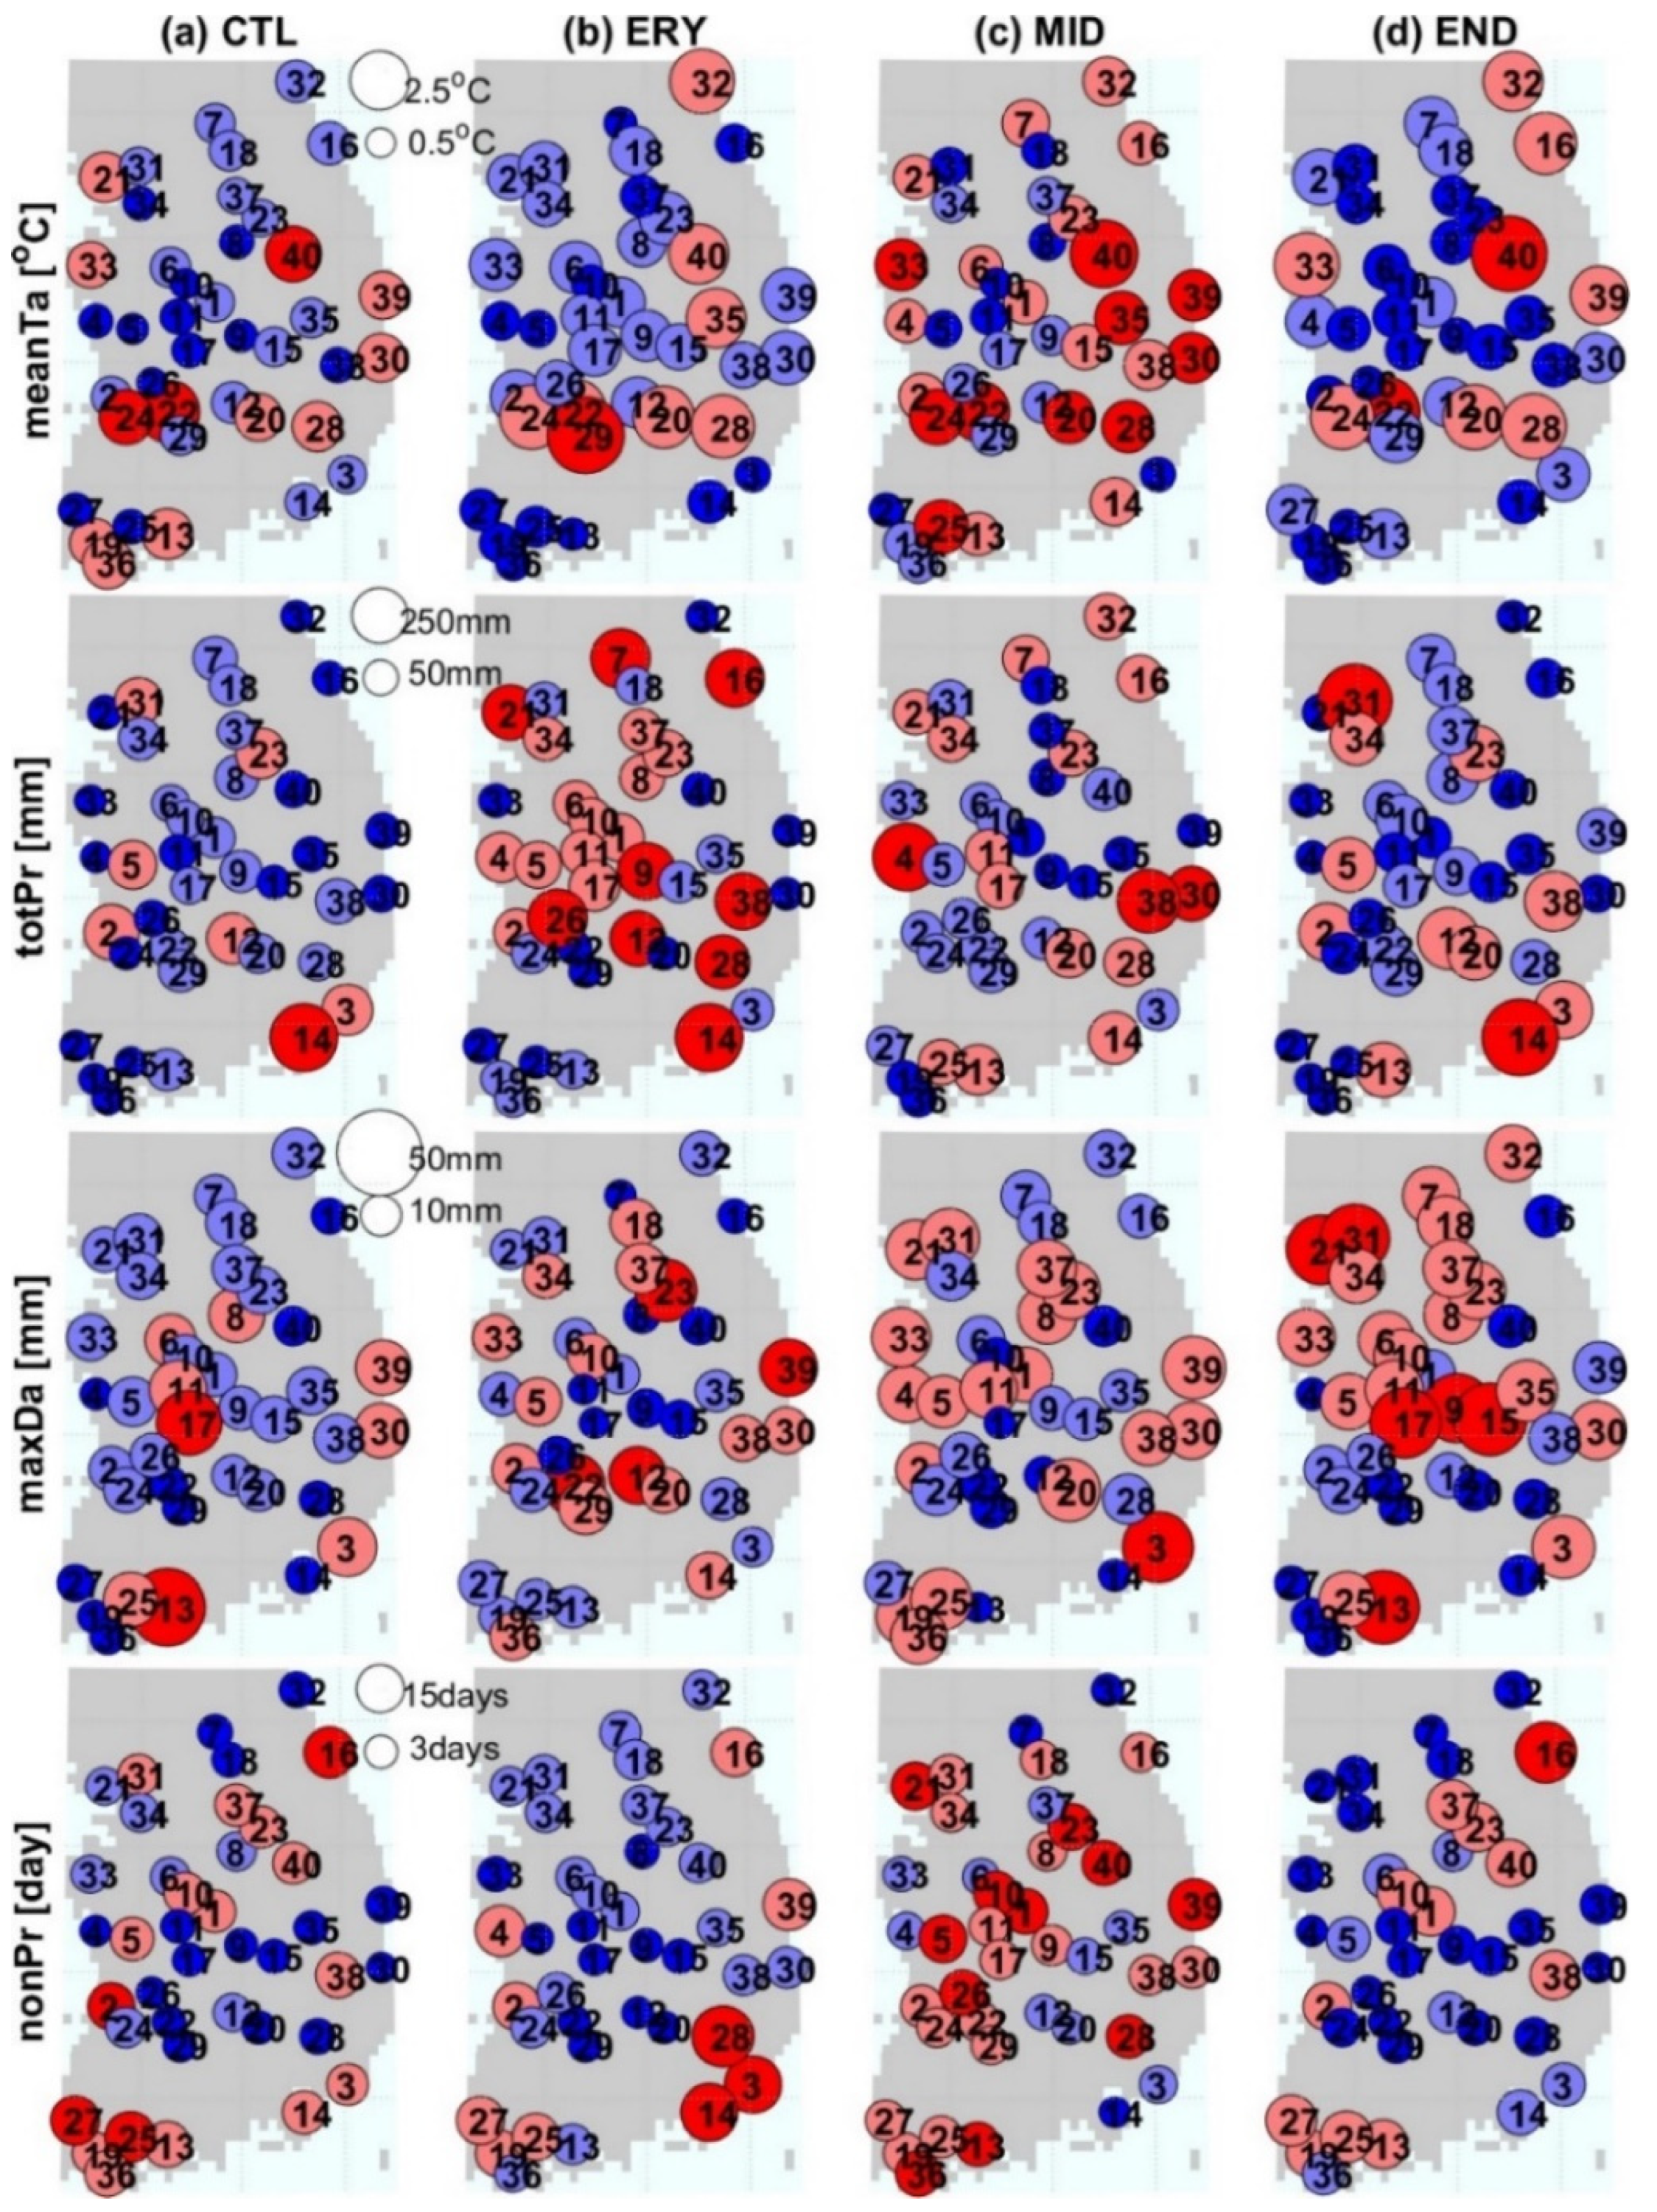
In this study, the control and future climate for temperature and precipitation indices were compared by using the average of 1000 CM values ( C M ¯ ) for each location across South Korea. The C M ¯ values for the indices varied spatially: these values for the meanTa in the control period (CTL), simulated from the CMIP6 database over 40 locations, ranged from 10.4 to 15.0 °C and increased significantly in the END period, ranging from 15.6 to 19.9 °C for SSP5-8.5 (see Figure 4 and Table 3). Considering seasonal variability, these values increased up to 1.19, 2.92, and 4.91 °C for the ERY, MID, and END periods, respectively (see Figure S1 in the Supplementary Materials). For the indices of totPr and maxDa, the C M   ¯ values showed an increasing trend as the period progressed. For example, the C M ¯ values for totPr ranged from 1034.3 to 1452.7 mm in the CTL period and increased up to 1148.7 and 1523.6 mm in the END period (see Table 3). Figure 4 shows only the C M ¯ values for the entire year, but when examining seasonal changes, the spatial average of these values increased in the END period compared to the CTL by 20.5% and 20.3% for the totPr and maxDa, respectively (see Table S2 and Figure S1 in the Supplementary Materials). However, the overall trend of the C M ¯ values for the nonPr was different from those of the other indices. The total number of days without precipitation in the future periods was comparable to that recorded in the CTL period.
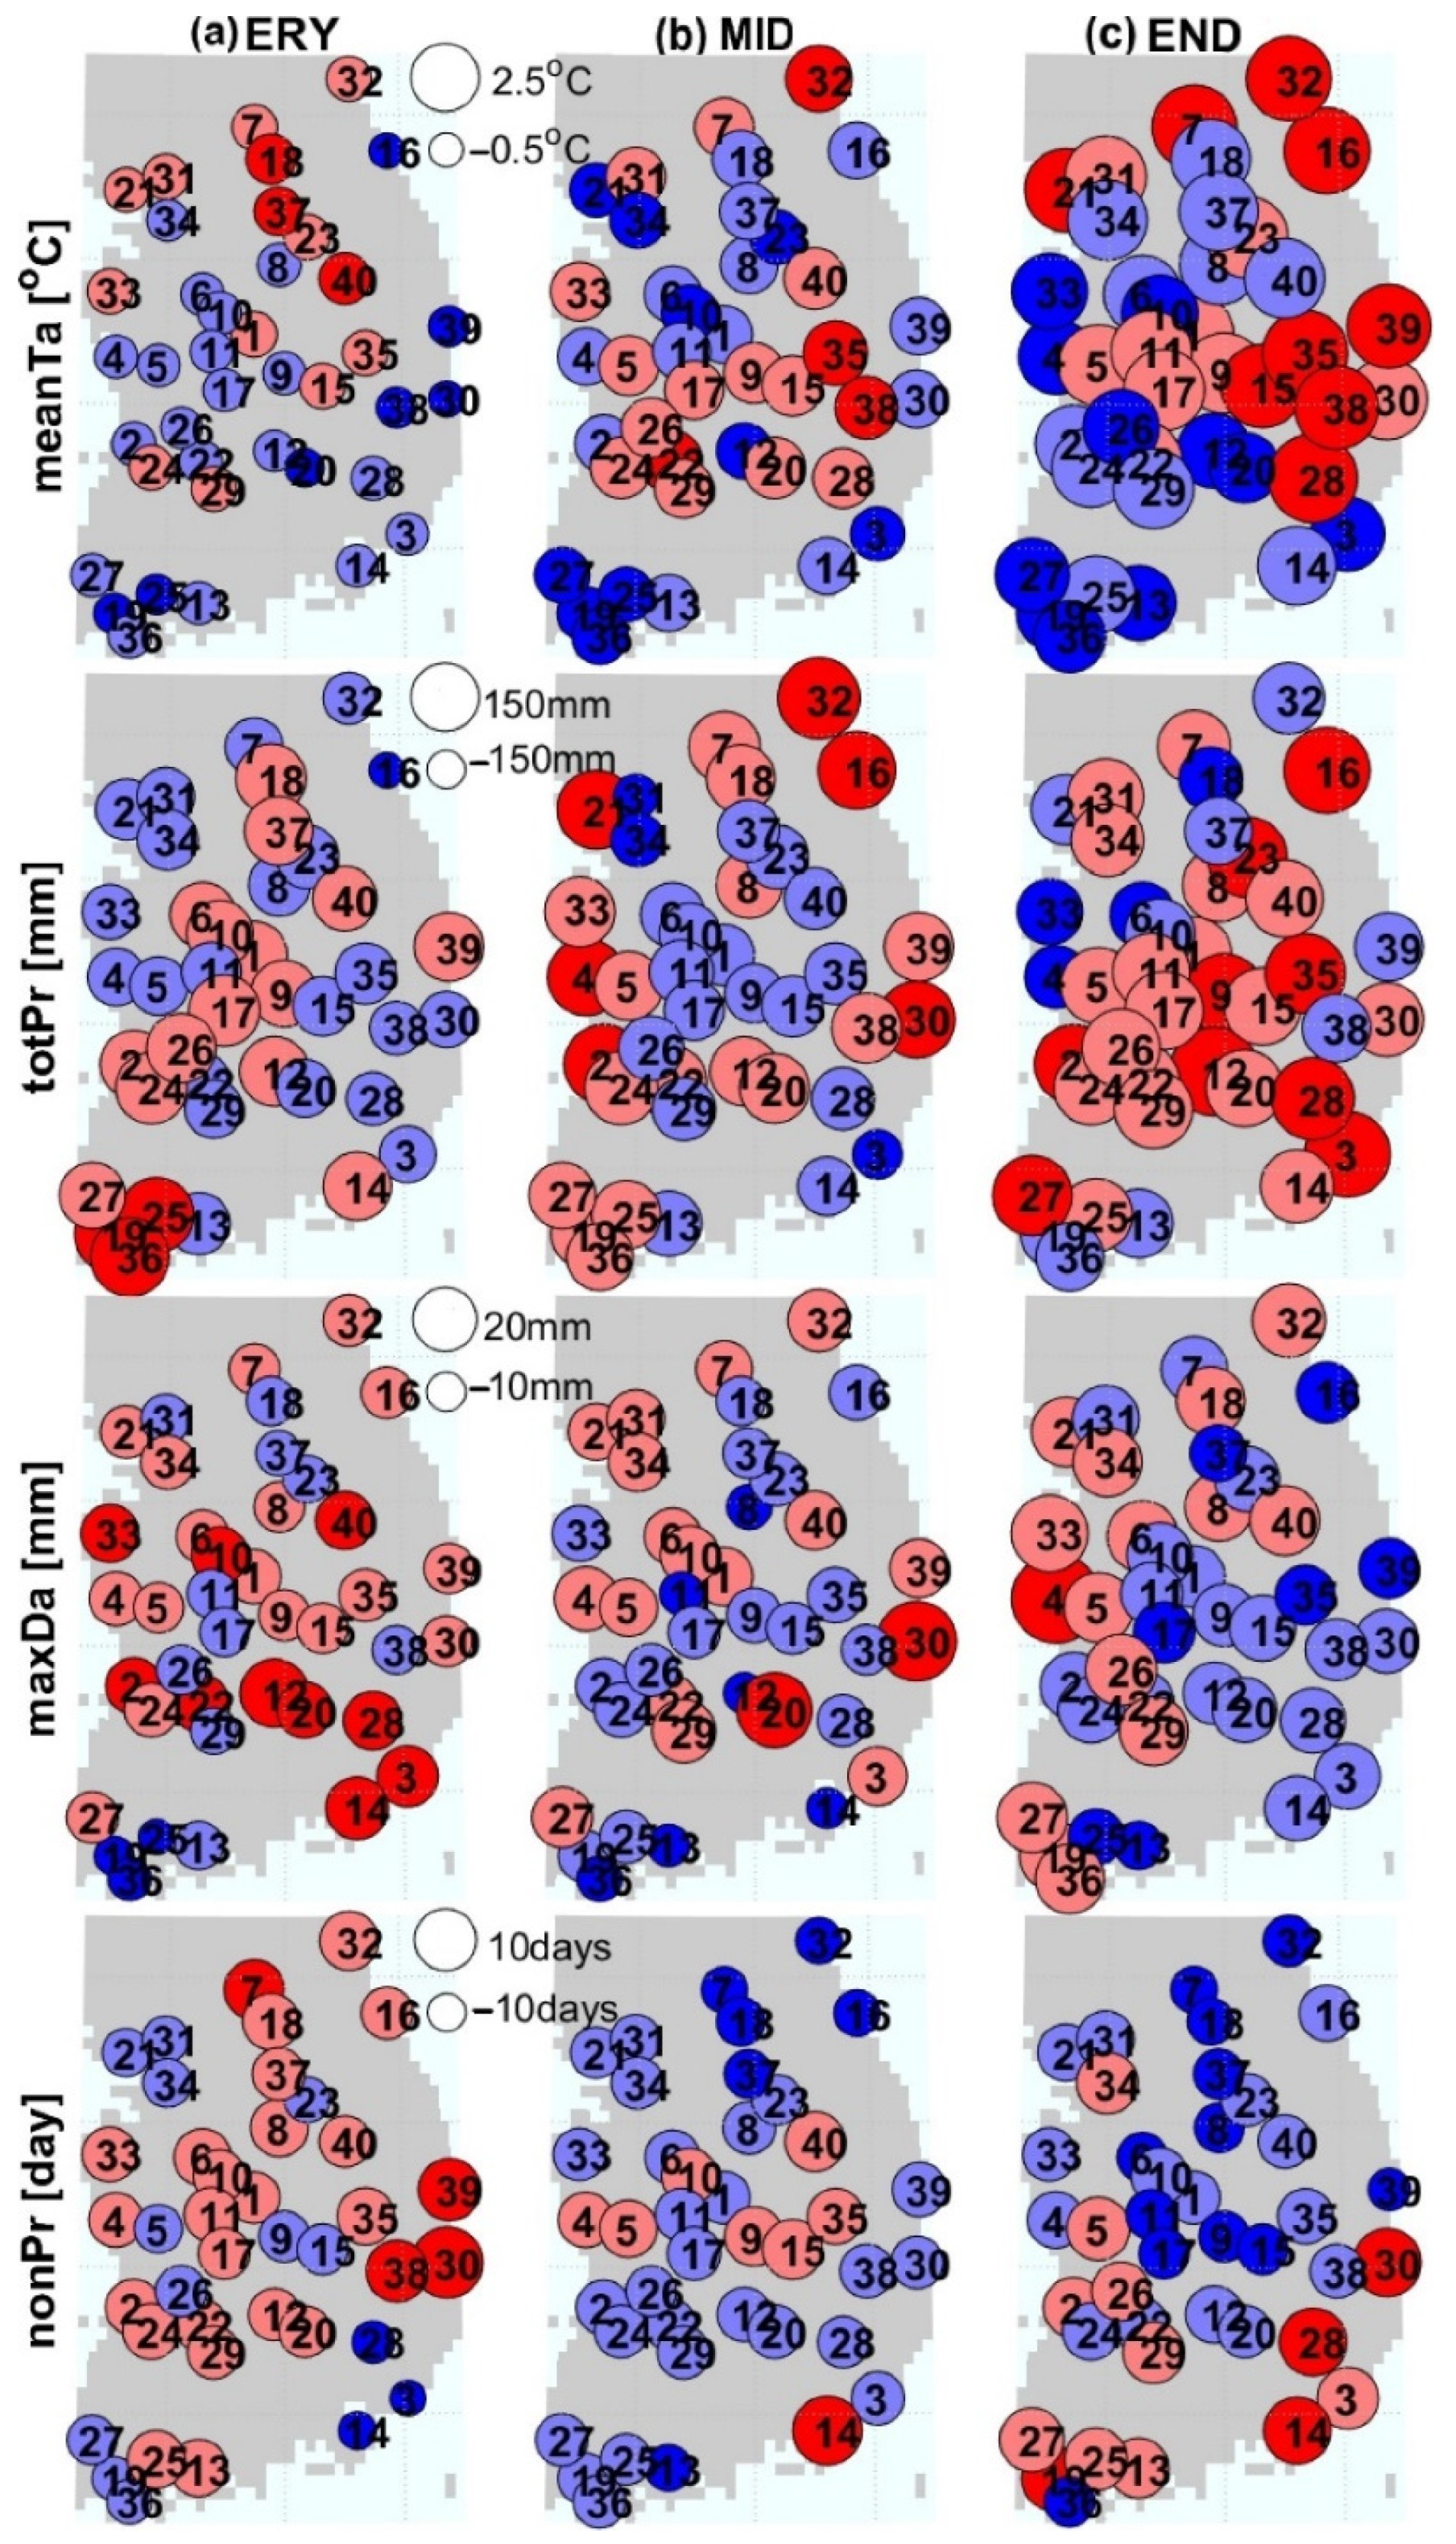
Once the C M ¯ values for each location were estimated, it was interesting to look at the spatial distribution and pattern of these values across South Korea, which were dissimilar among the indices. A K-means cluster algorithm was employed for these values to divide 40 locations into 4 distinctive zones (K = 4), according to the Elbow method [42]. For the index of meanTa, the regions with higher C M ¯ values (light red and red circles in Figure 3) were mostly located in the southeastern and southern coastal regions of South Korea, while the lower C M ¯ values (blue circles) were distributed in the central and northern regions of the country. For the indices of totPr and maxDa, the locations in the southeastern coastal and central inland regions showed higher C M ¯ values, while the western coastal and northern regions of the country corresponded to regions with lower values. For nonPr, the locations with lower C M ¯ values were located mostly in the central inland area of the country. The spatial pattern of the C M ¯ values in the SSP2-4.5 scenario was mostly identical to that in the SSP5-8.5 for all the indices (see Figure S2 in the Supplementary Materials).
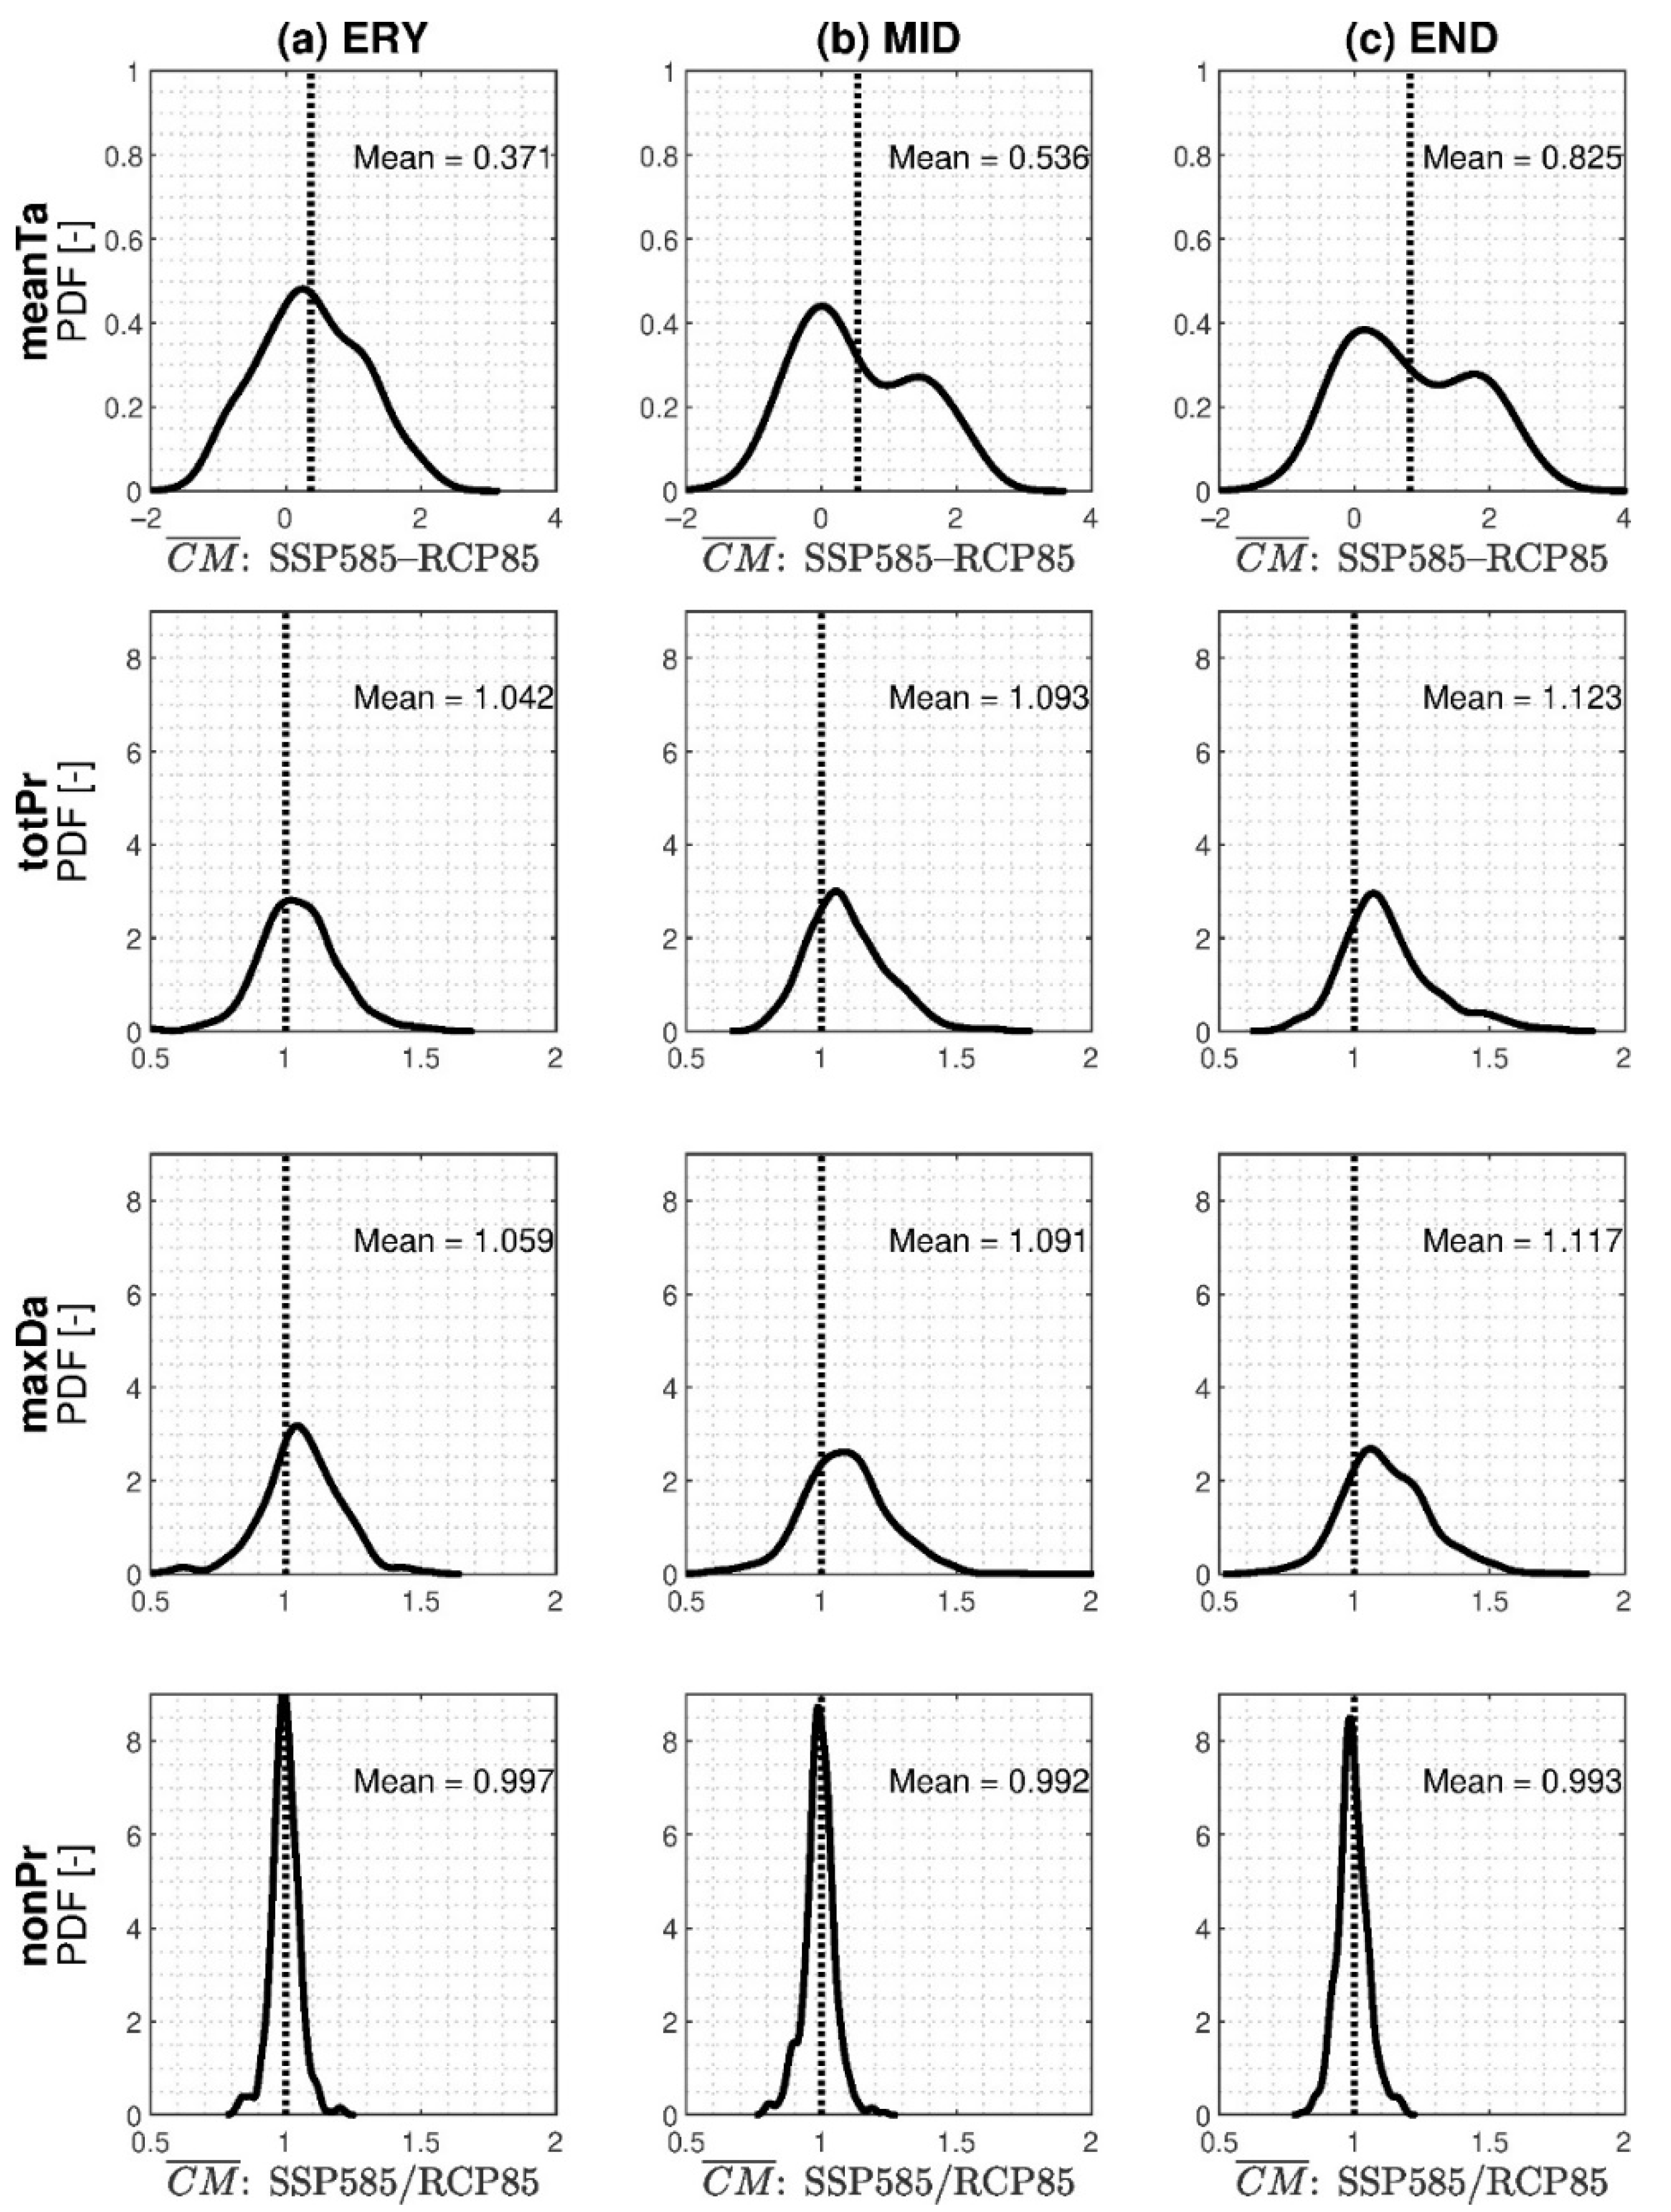
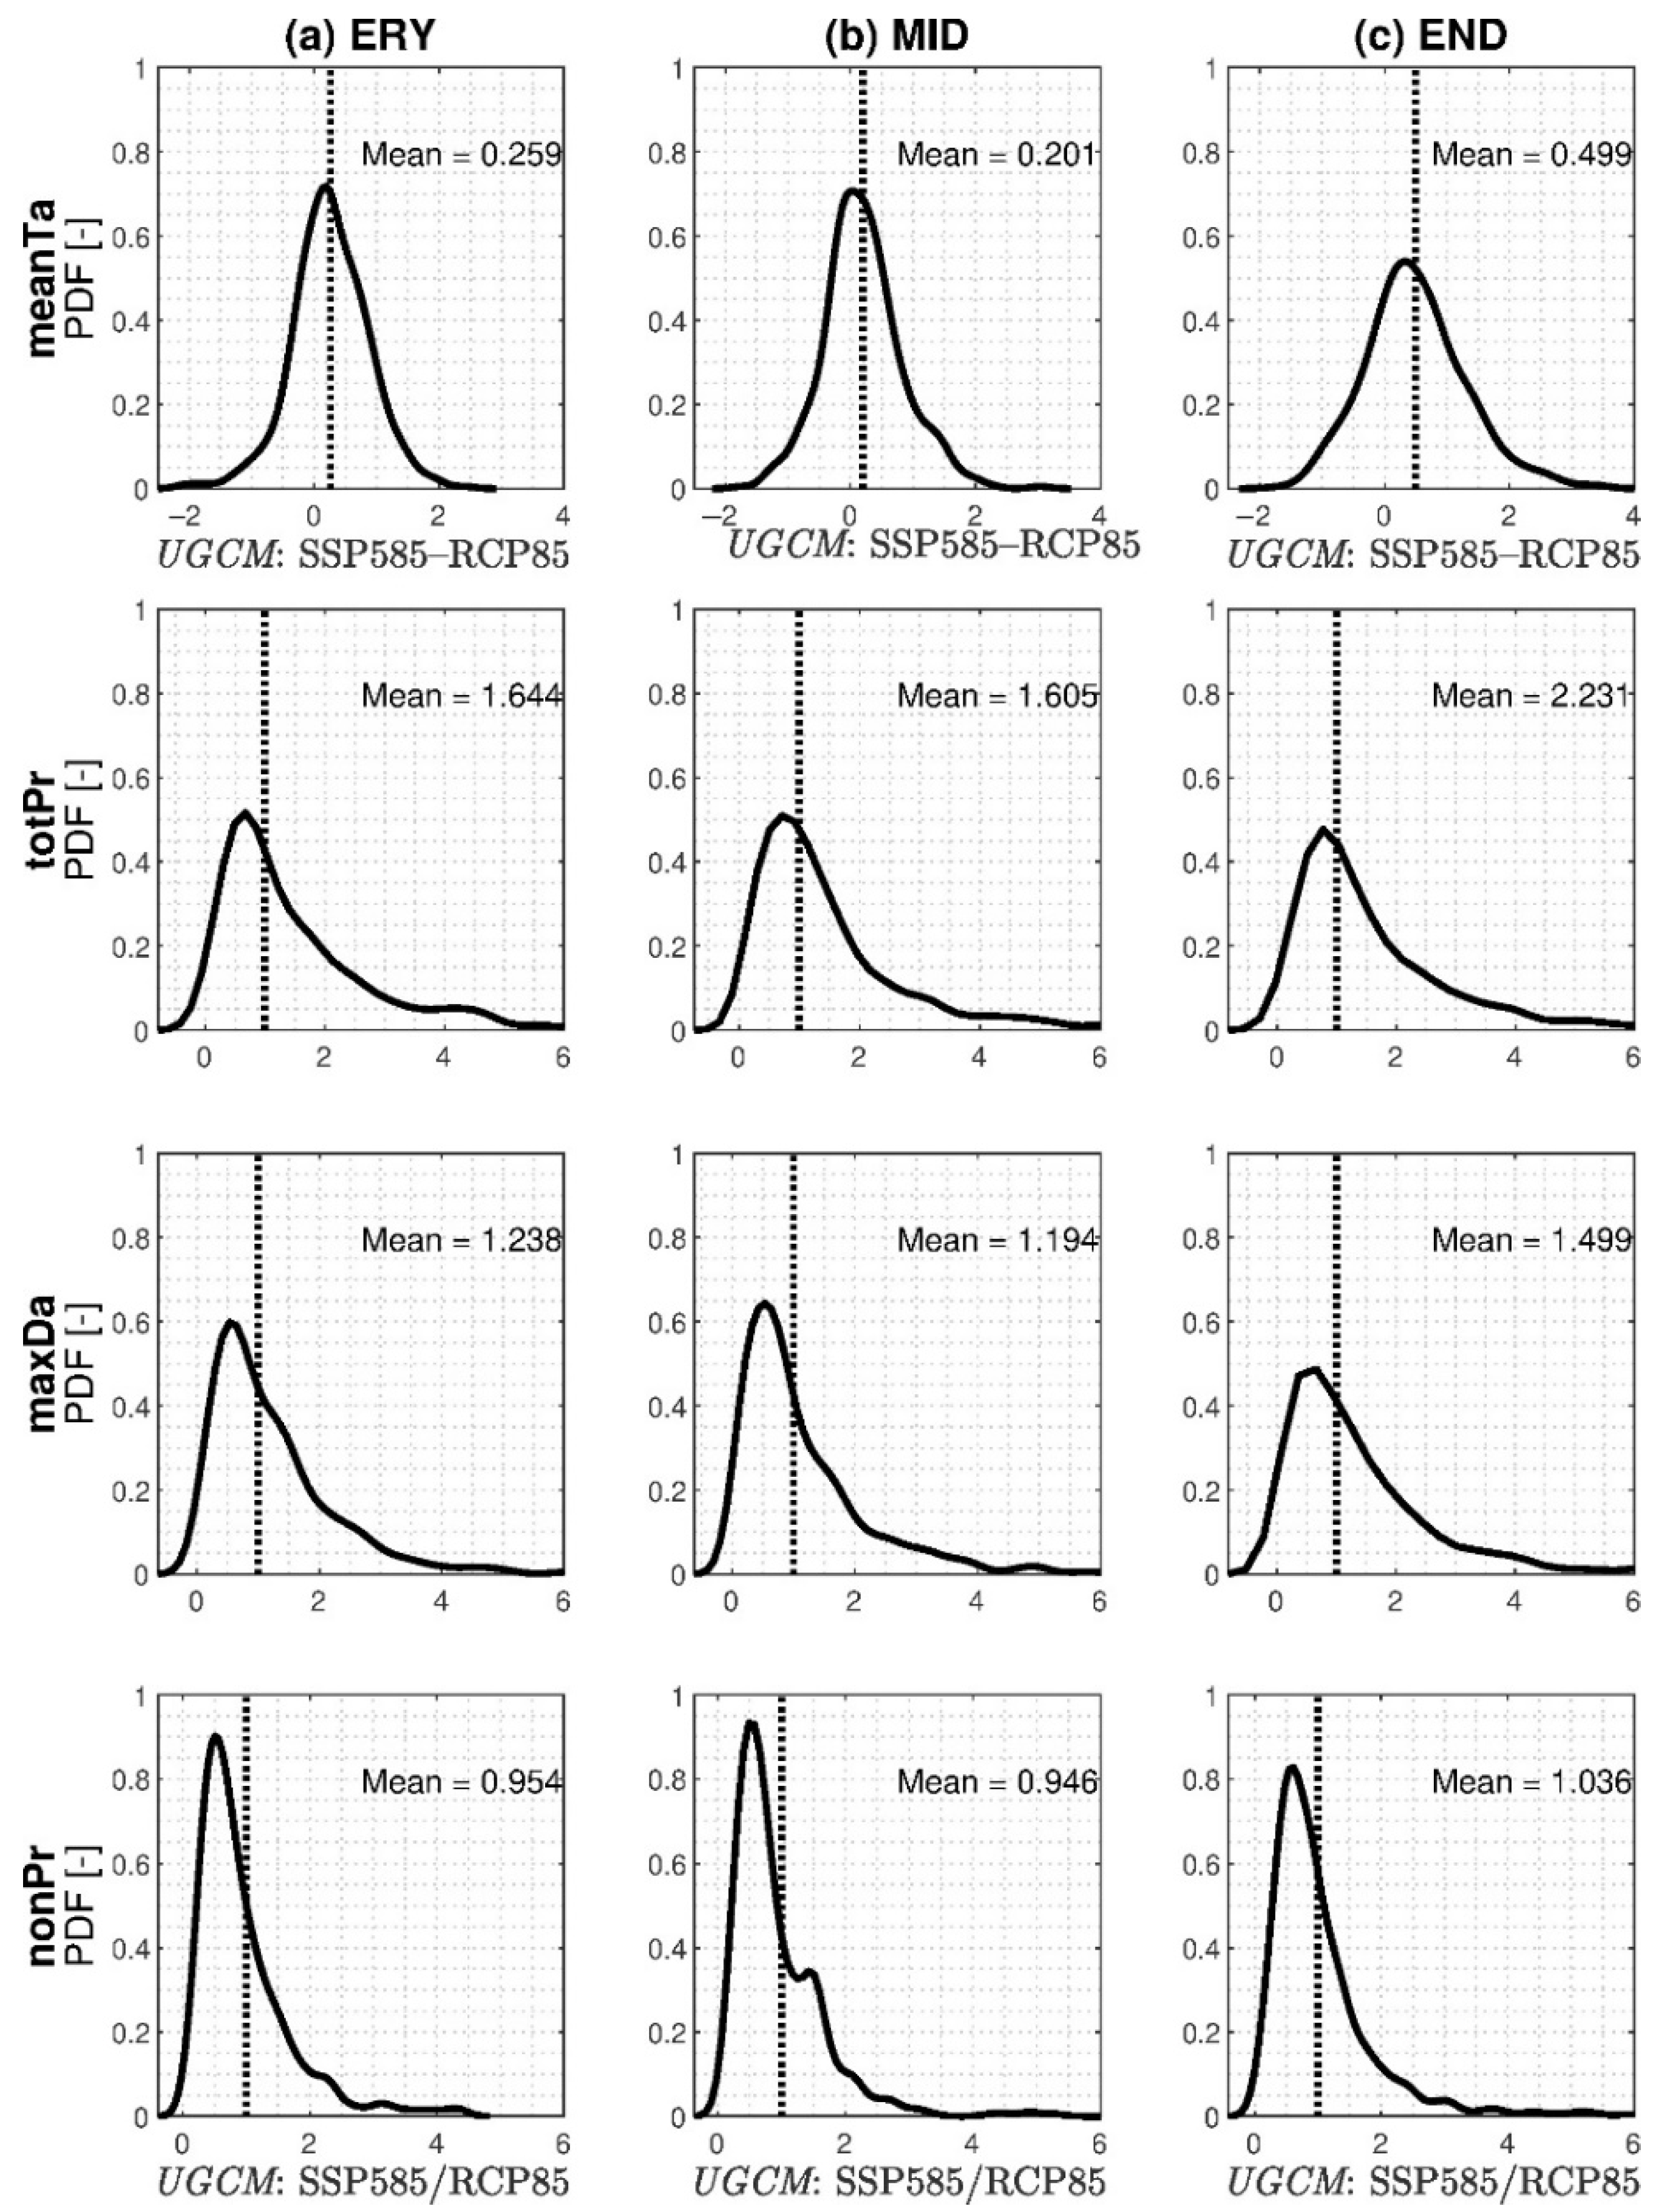
We found that the spatial patterns of the C M ¯ values using both the CMIP5 (see Figure S3 in the Supplementary Materials) and CMIP6 databases were similar; however, there was a difference in the magnitude of these values between the two CMIPs for each location in the future period. We investigated how these values differed when seasonality was taken into account. Figure 5 illustrates the non-parametric kernel distributions for the ratio (i.e., CMIP6/CMIP5 for the 3 precipitation indices) or the difference (i.e., CMIP6–CMIP5 for meanTa) of the C M ¯ values, calculated monthly and annually. Thus, the number of data points for the distributions was 520 with 40 locations and 13 cases (12 months plus the whole year). If the differences (or ratios) on the x-axis were greater than 0 (or 1), the C M ¯ values of the CMIP6 database were greater than those using the CMIP5 database. Figure 5 shows that the C M ¯ values using the CMIP6 were greater than those of the CMIP5 in future periods, especially in the END period, for the indices of meanTa, totPr, and maxDa, except for nonPr. For example, for meanTa, the projection of CMIP6 was expected to be hotter in the future on average, with a difference in the C M ¯ values between the two CMIPs of approximately 0.37 °C in the ERY period; this difference increased up to 0.83 °C in the END period. For totPr and maxDa, the projection of CMIP6 also predicted more (annual and monthly) precipitation overall, with differences between the two CMIPs of about 4.2% and 5.9% in the ERY period, respectively; these differences increased to 12.3% and 11.7% in the END period. Figure 5 presents the difference in the emission scenarios between SSP5-8.5 in CMIP6 and RCP 8.5 in CMIP5. Similar differences in C M ¯ values were also observed between SSP2-4.5 in CMIP6 and RCP 4.5 in CMIP5 (see Figure S4 in the Supplementary Materials). Regardless of the emission scenarios, the CMIP6 projection results showed that a greater increase in temperature and higher precipitation levels would occur in the future.

3.3. GCM Uncertainty in the CMIP6 Database and its Differences from CMIP5

Global climate models have been extensively used to predict the future climate. These models were developed to mimic and reproduce past and present climates and then generate simulations of the future climate. These models are imperfect, resulting in inevitable uncertainty (referred to herein as the GCM uncertainty, UGCM). One of our tasks was to estimate this uncertainty and evaluate how much this value changed when the global climate models were updated in CMIP6. We quantified the UGCM value for each location in South Korea during the control and future periods (see Figure 6 and Table 4). The UGCM values computed for the entire year ranged from 0.55 to 1.98 °C in the control period for meanTa; these values increased in the END period, varying from 0.69 to 2.60 °C. The GCM uncertainty tended to increase in the future period from that at the present time, with the monthly and yearly UGCM values increasing in their uncertainty by 0.22, 0.19, and 0.58 °C for the ERY, MID, and END periods, respectively (see Figure S5 in the Supplementary Materials). Similarly, future uncertainties have been observed to increase significantly over the present GCM uncertainties for the precipitation indices. For example, the UGCM values for the totPr index varied from 6.28 mm to 248.50 mm during the CTL period; these values increased considerably to 11.27 mm and 305.46 mm during the END period. The monthly and yearly UGCM values for this index increased significantly by 72.3, 93.5, and 85.6%, respectively, during the ERY, MID, and END periods (see Figure S5). In the case of another precipitation index, maxDa, the future UGCM values increased by 48.6, 39.1, and 49.7%, and for nonPr they increased by 33.2, 30.9, and 23.2%. Such an increasing trend in UGCM values for future periods was also observed in the SSP2-4.5 scenario for both the temperature and precipitation indices.
The spatial distribution of UGCM values depends on many factors, such as indices, seasons, and emission scenarios. The K-mean cluster algorithm was employed to divide the UGCM values into 4 distinctive groups. A particular spatial pattern of the high and low UGCM values was not observed for all of the indices (similar to SSP2-4.5 shown in Figure S6 in the Supplementary Materials). Although there was no spatial distribution pattern, the UGCM values varied greatly from location to location, and the distribution of those values varied depending on the index. For example, the UGCM values for totPr in Busan (No. 3) and Goeje (No. 14) at nearby locations were 186.44 mm and 305.45 mm, respectively, which values were high for Goeje, but the UGCM values for maxDa were the opposite at those locations (20.27 mm and 6.5 mm in Busan and Geoje, respectively). This result implies that if one knows the UGCM value of a specific location, regionalizing it to a nearby location is risky. It was interesting to see how the spatial distribution and pattern of the UGCM values in the CMIP6 database differed from those when using the CMIP5 database (see Figure S7 in the Supplementary Materials). As with CMIP6, the UGCM values in the future periods were higher than those in the present period for CMIP5 (see Table S2 in the Supplementary Materials). However, the magnitude of the UGCM values of CMIP6 was not significantly larger than that of CMIP5 for meanTa and nonPr, but it was larger on a statistically significant level for totPr and maxDa (Figure 7 and Figure S8 in the Supplementary Materials). For example, the UGCM values of CMIP6 were 123% and 50% greater than those of CMIP5 for totPr and maxDa, respectively, for the END period. This phenomenon was similarly observed for another emission scenario of SSP2-4.5 in CMIP6 and RCP 4.5 in CMIP5. In summary, although there were improvements and updates in the GCMs in CMIP6, the GCM uncertainty in CMIP6 was higher than that in CMIP5 for totPr and maxDa. These results implied that improvements in the model showed better simulation results for the control climate but did not make more exact predictions about the future climate.

3.4. Stochastic Uncertainty in the CMIP6 Database and Its Difference from CMIP5

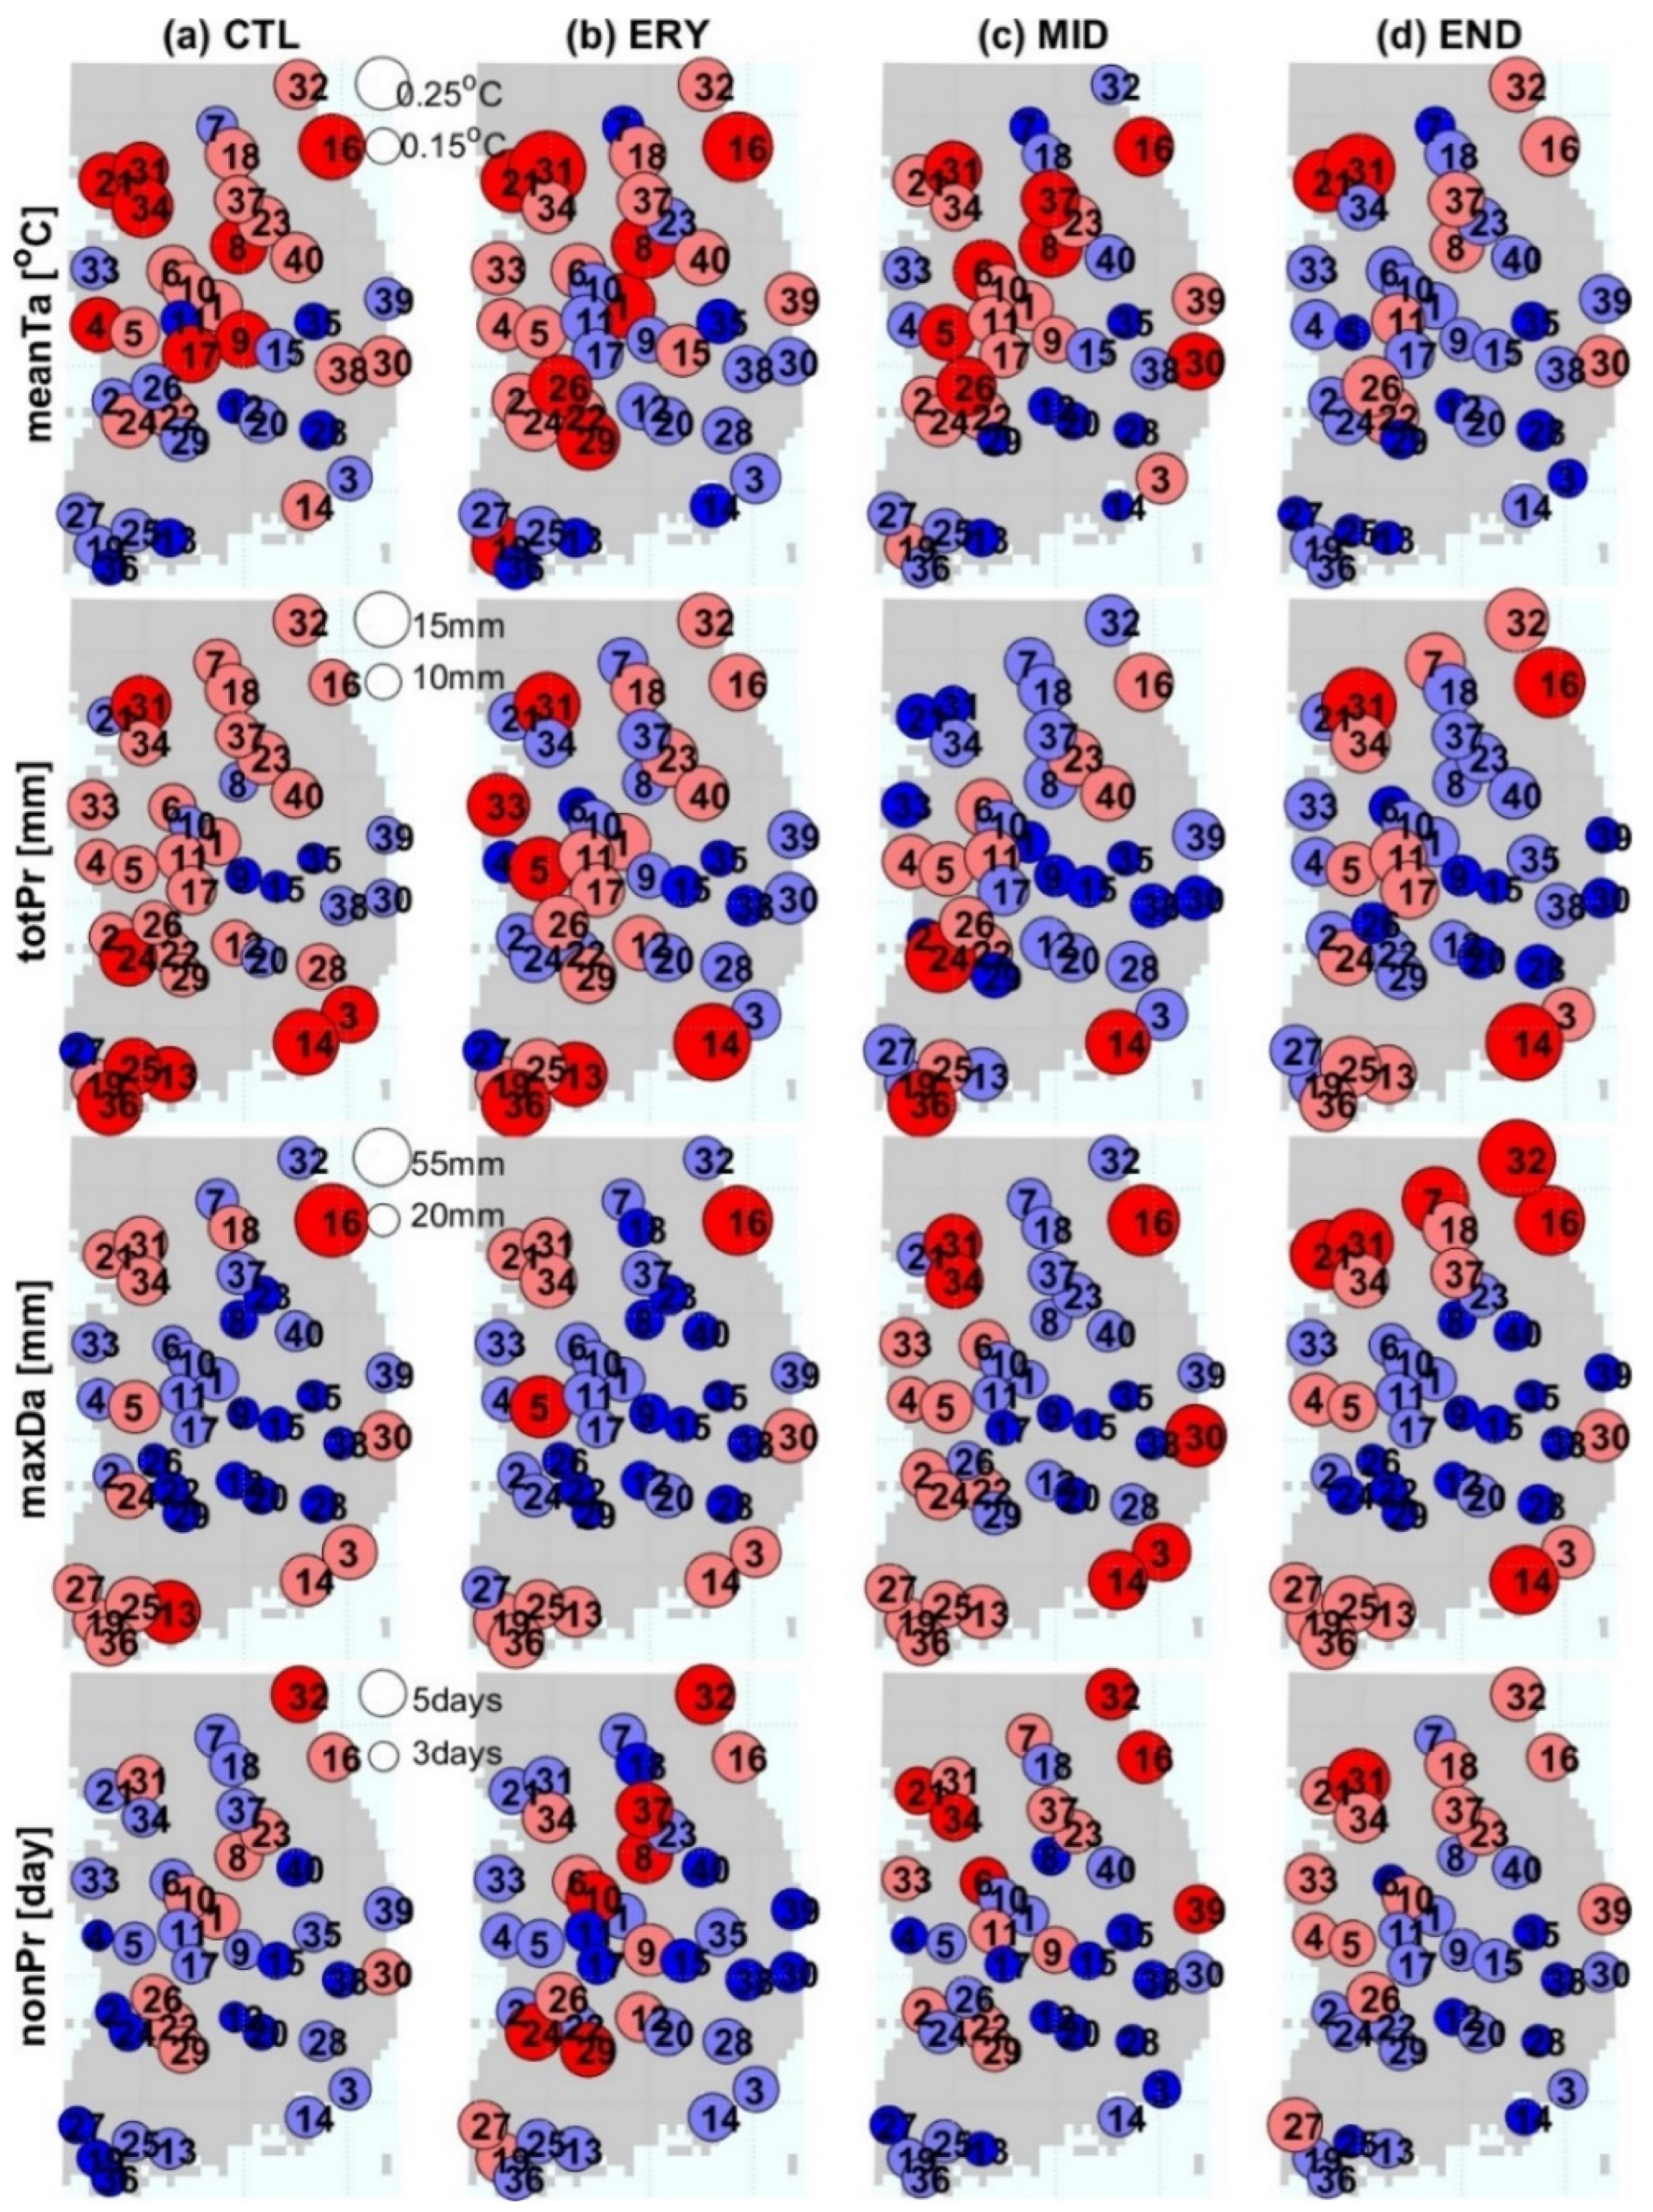
After estimating the stochastic uncertainty, the USTO for each location and the spatial distribution and pattern of these values across South Korea were investigated via indices, periods, and scenarios. First, the USTO values in the CTL period ranged from 0.78 to 1.28 °C, depending on the location for meanTa, which was the same as the values for the future periods (see Figure 8 and Table 5). On the other hand, the USTO values for future periods, especially during the END period, were large for the totPr and maxDa indices. For example, for totPr on an annual scale, the minimum and maximum USTO values were 239.7 mm and 497.5 mm, depending on the locations in the CTL period, which increased up to 264.5 mm and 556.7 mm during the END period. If we calculated the increase in totPr and maxDa values on a monthly and annual scale for 40 locations, then the USTO values during the END period were 22.8% and 23.7% greater than the values during the CTL period (see Figure S9 in the Supplementary Materials). In the case of nonPr, similar to the meanTa, the future changes in USTO values (especially during the END period) were not large.
The spatial distribution and pattern of USTO values also differed among indices. Higher USTO values were observed in the northern inland region for meanTa and nonPr, in the south-western region for totPr, and in the three coastal areas (i.e., west, south, and east) for maxDa (Figure 8 for SSP5-8.5 and Figure S10 in the Supplementary Materials for SSP2-4.5). Even if one knows the exact USTO value for a specific location, one should be careful about regionalization to a nearby location. For example, the USTO values for Pohang (No. 30) and Yeongcheon (No. 38) were significantly different at 37.34 mm and 20.35 mm, respectively, but the distance between the two locations was only 40 km.
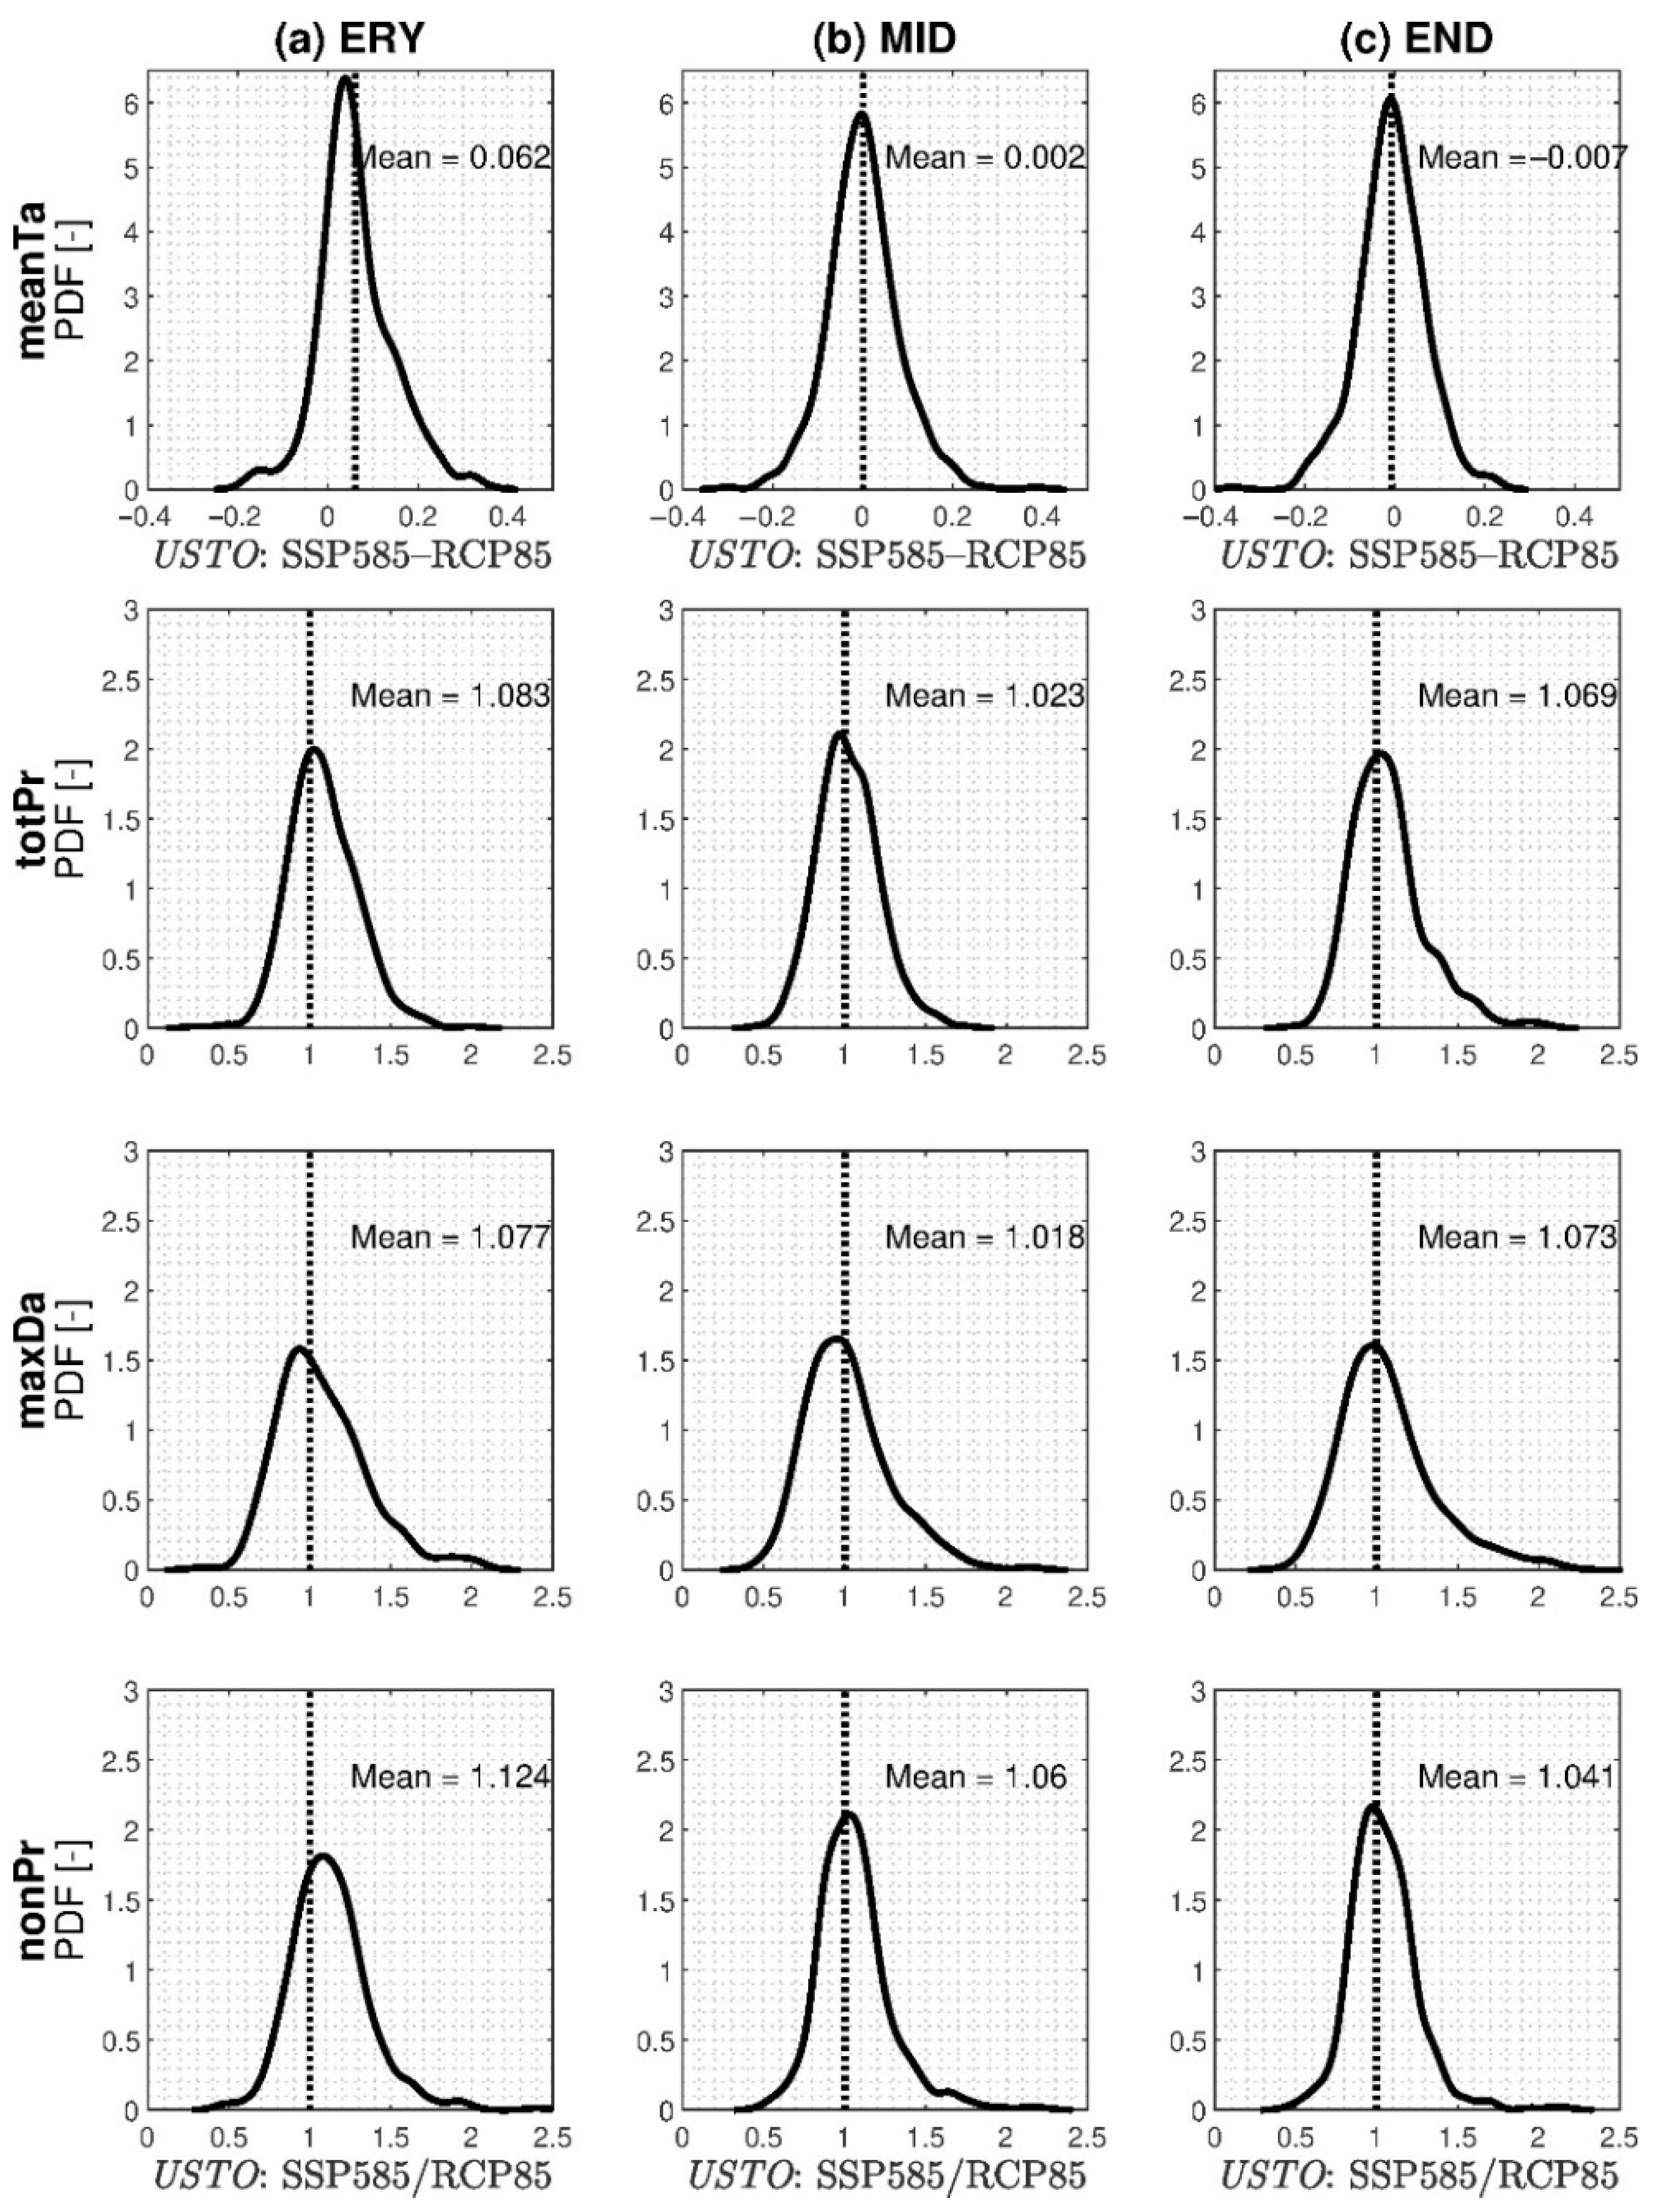
Next, when the CMIP5 database was used, the USTO values and their spatial distributions were investigated, and the results were fully compared with the stochastic uncertainty of the CMIP6 database. Future USTO values using the CMIP5 database also tended to increase for the totPr and maxDa indices, with the exception of the meanTa and nonPr indices, compared with those of the control period (see Table S2), and very similar spatial patterns were observed (Figure S11 in the Supplementary Materials). We quantified the difference in the magnitude of the stochastic uncertainty calculated from the CMIP5 and CMIP6 databases. Figure 9 and Figure S12 in the Supplementary Materials illustrate the nonparametric kernel distribution for the ratio of the two USTO values of CMIP5 and CMIP6. As a result, there was no difference in the USTO values between the two CMIP databases for meanTa during the future periods. However, in the case of the remaining three indices, differences in the USTO values occurred and the USTO values of CMIP6, in particular, were larger during the ERY period than during the END period. For example, the USTO of CMIP6 was larger than that of CMIP5 by 8.3% for totPr, 7.7% for maxDa, and 12.4% for nonPr.

3.5. Emission Scenario Uncertainty in the CMIP6 Database and Its Difference from CMIP5

Emission scenarios aim to provide information on the possible future developments in the anthropogenic driving factors of climate change that are consistent with socioeconomic development. The possibility of any single scenario that will occur is highly uncertain. Therefore, it is necessary to quantify the uncertainty caused by emission scenarios. In this study, the emission scenario uncertainty (UEMI) value was quantified as the difference between the C M ¯ of two lower and higher emission scenarios (radiative forcing 4.5 and 8.5). These UEMI values could be positive (negative) when the C M ¯ values of the SSP5-8.5 scenario were greater (smaller) than those of the SSP2-4.5 values, or they could be approximately equal to zero when the C M ¯ values of the two scenarios were almost similar. Figure 10 and Figure S13 in the Supplementary Materials show the spatial distribution of the UEMI values for CMIP6 and CMIP5, respectively; 40 locations were also divided into 4 groups by applying the K-means cluster algorithm. For meanTa, the UEMI values were found to be low in the coastal regions of the country, and high values were found in the central inland and northern regions. For precipitation indices, the spatial distribution of higher and lower UEMI values depended on the index over future periods, there was no clear overall trend. However, it was confirmed that the emission uncertainty increased as the time period (END rather than ERY) progressed.
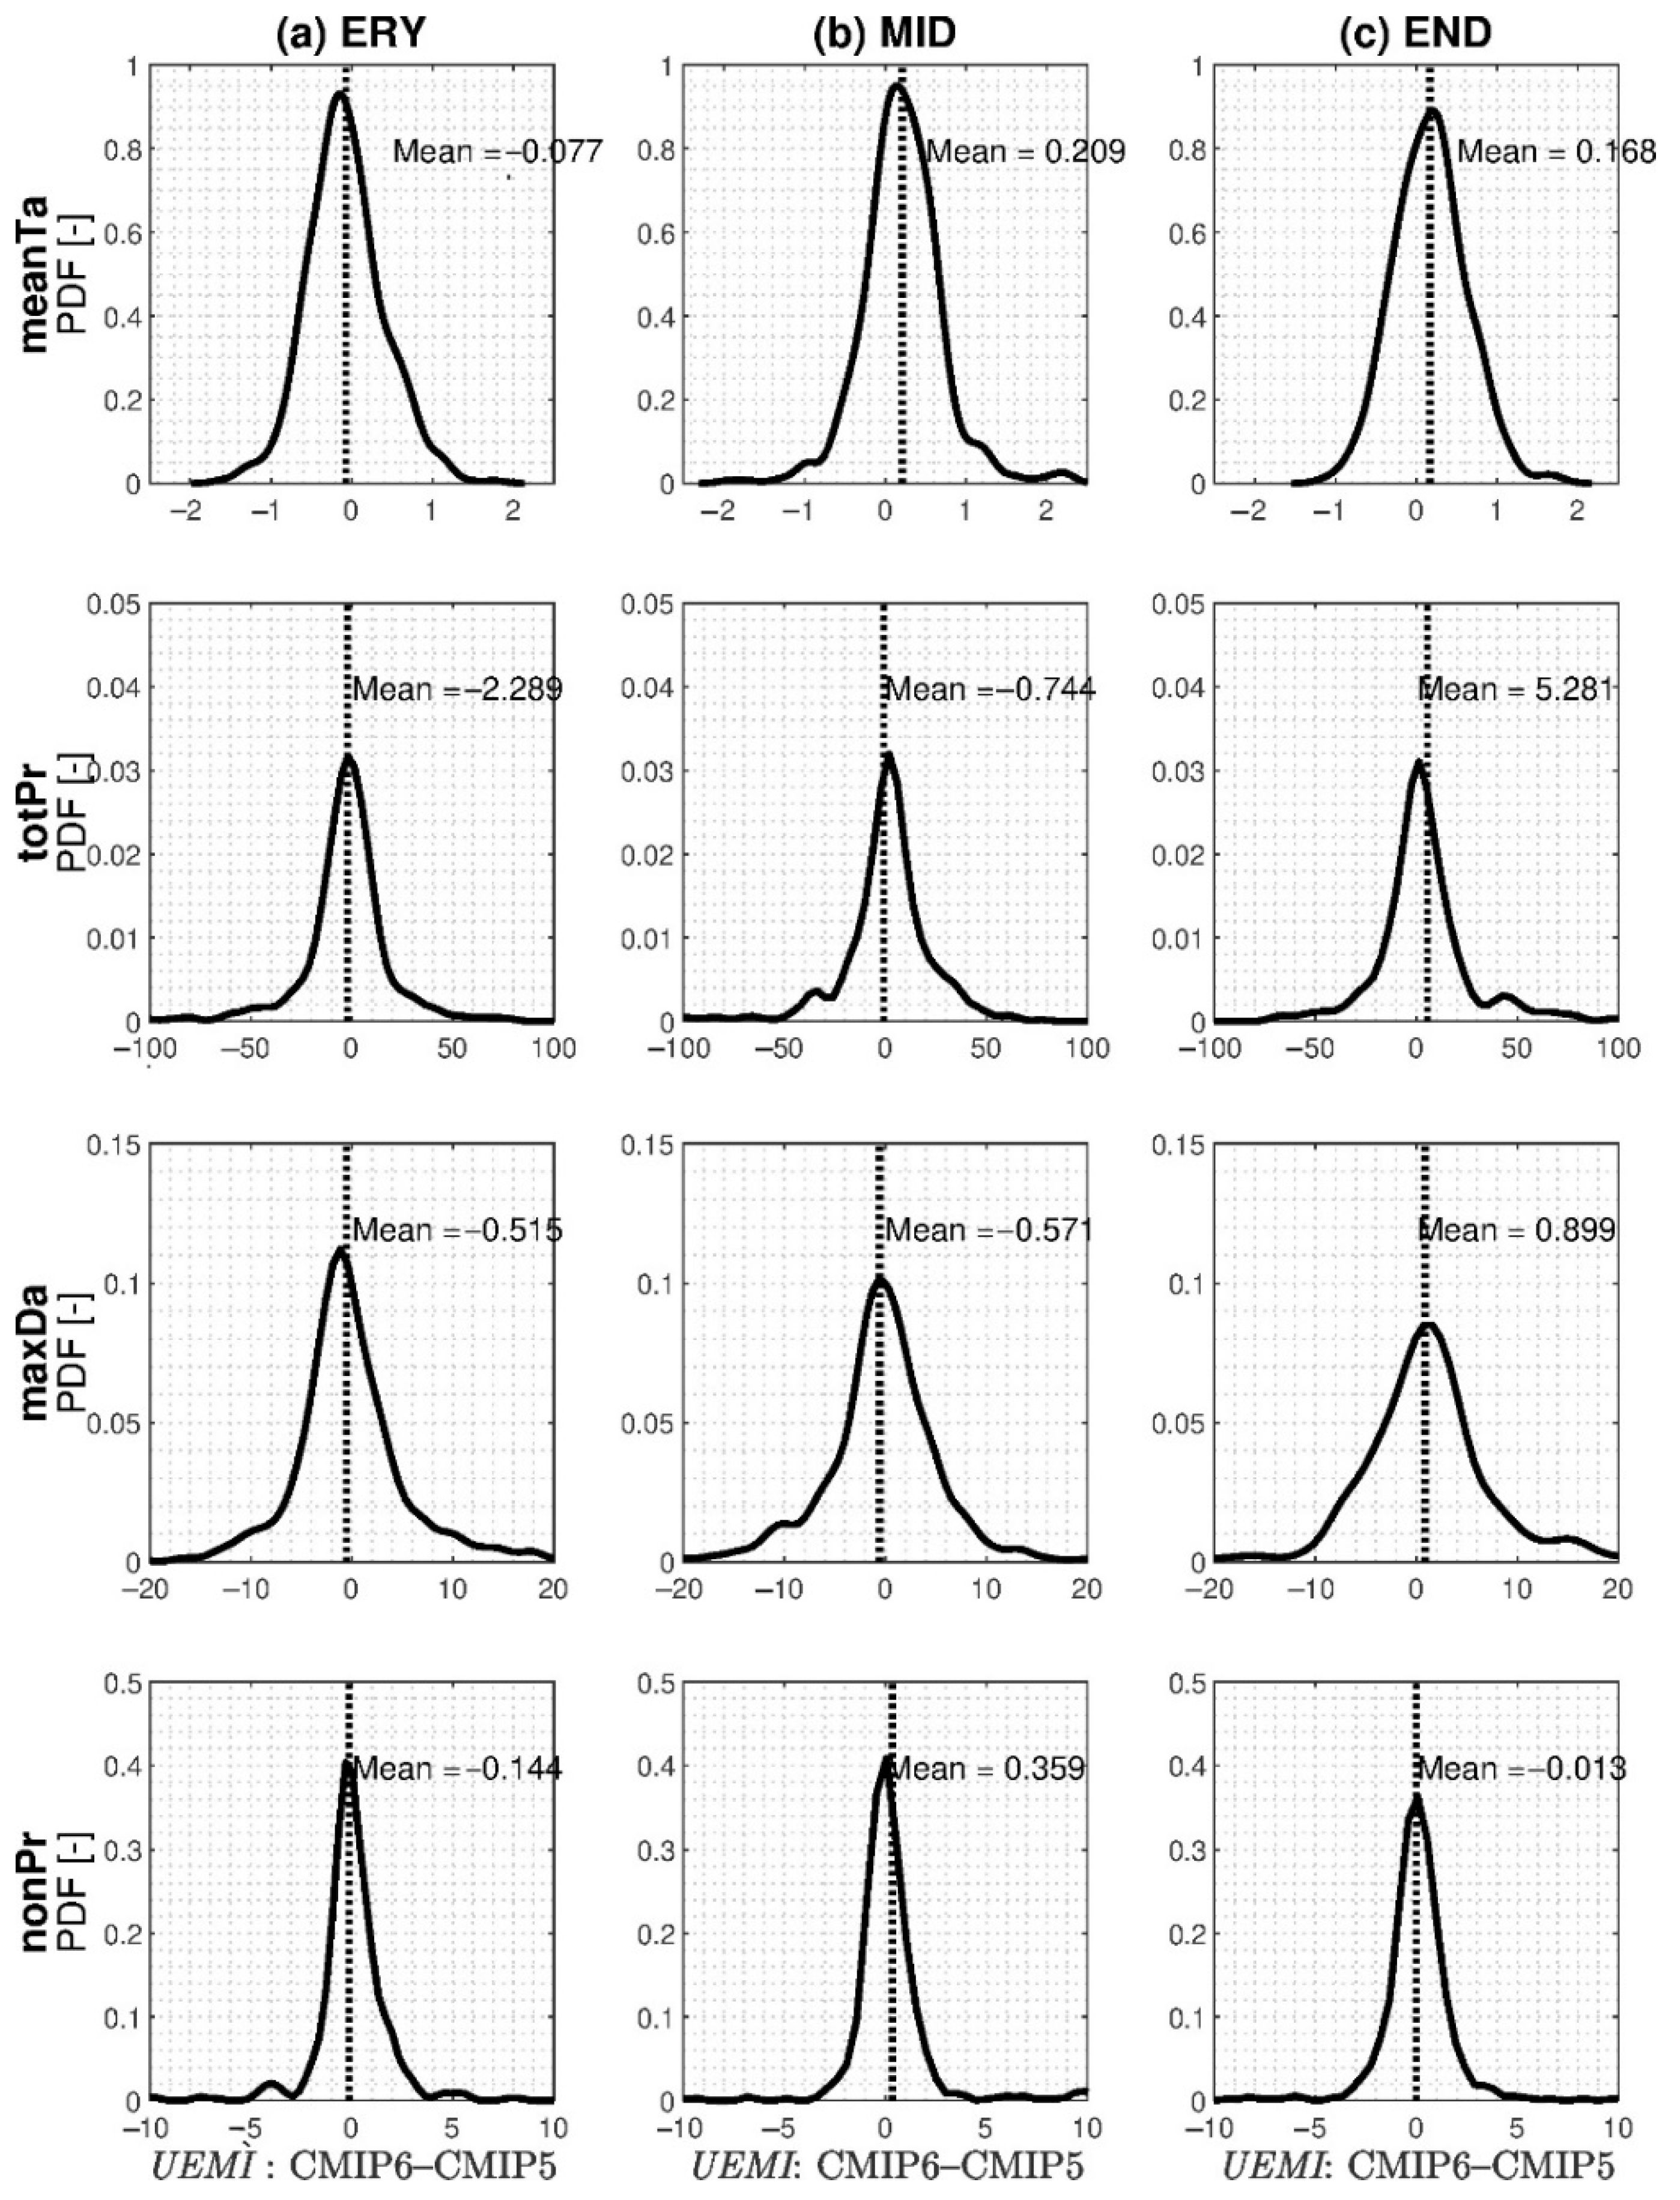
As noted above, when the UEMI values for each station were determined, how much the UEMI values in the updated CMIP6 differed from the previous CMIP5 was investigated. Figure 11 illustrates the non-parameter kernel distribution of the difference in the UEMI values between CMIP5 and CMIP6, where the mean value of the distribution was greater (smaller) than 0, the UEMI values from CMIP6 were greater (smaller) than those from CMIP5. For meanTa, the UEMI values between the two CMIPs were very similar during the ERY period, but these values of CMIP6 were 0.2 and 0.17 °C greater than those of CMIP5 during the MID and END periods. For totPr, the emission uncertainty of CMIP6 was 5.28 mm greater than that of CMIP5 during the END period. For maxDa and nonPr, the difference in emission scenario uncertainty between the two CMIPs was negligible. In general, the emission scenario uncertainty for CMIP6 was not significantly different from that for CMIP5.

3.6. Relative Contributions of Three Uncertainty Sources

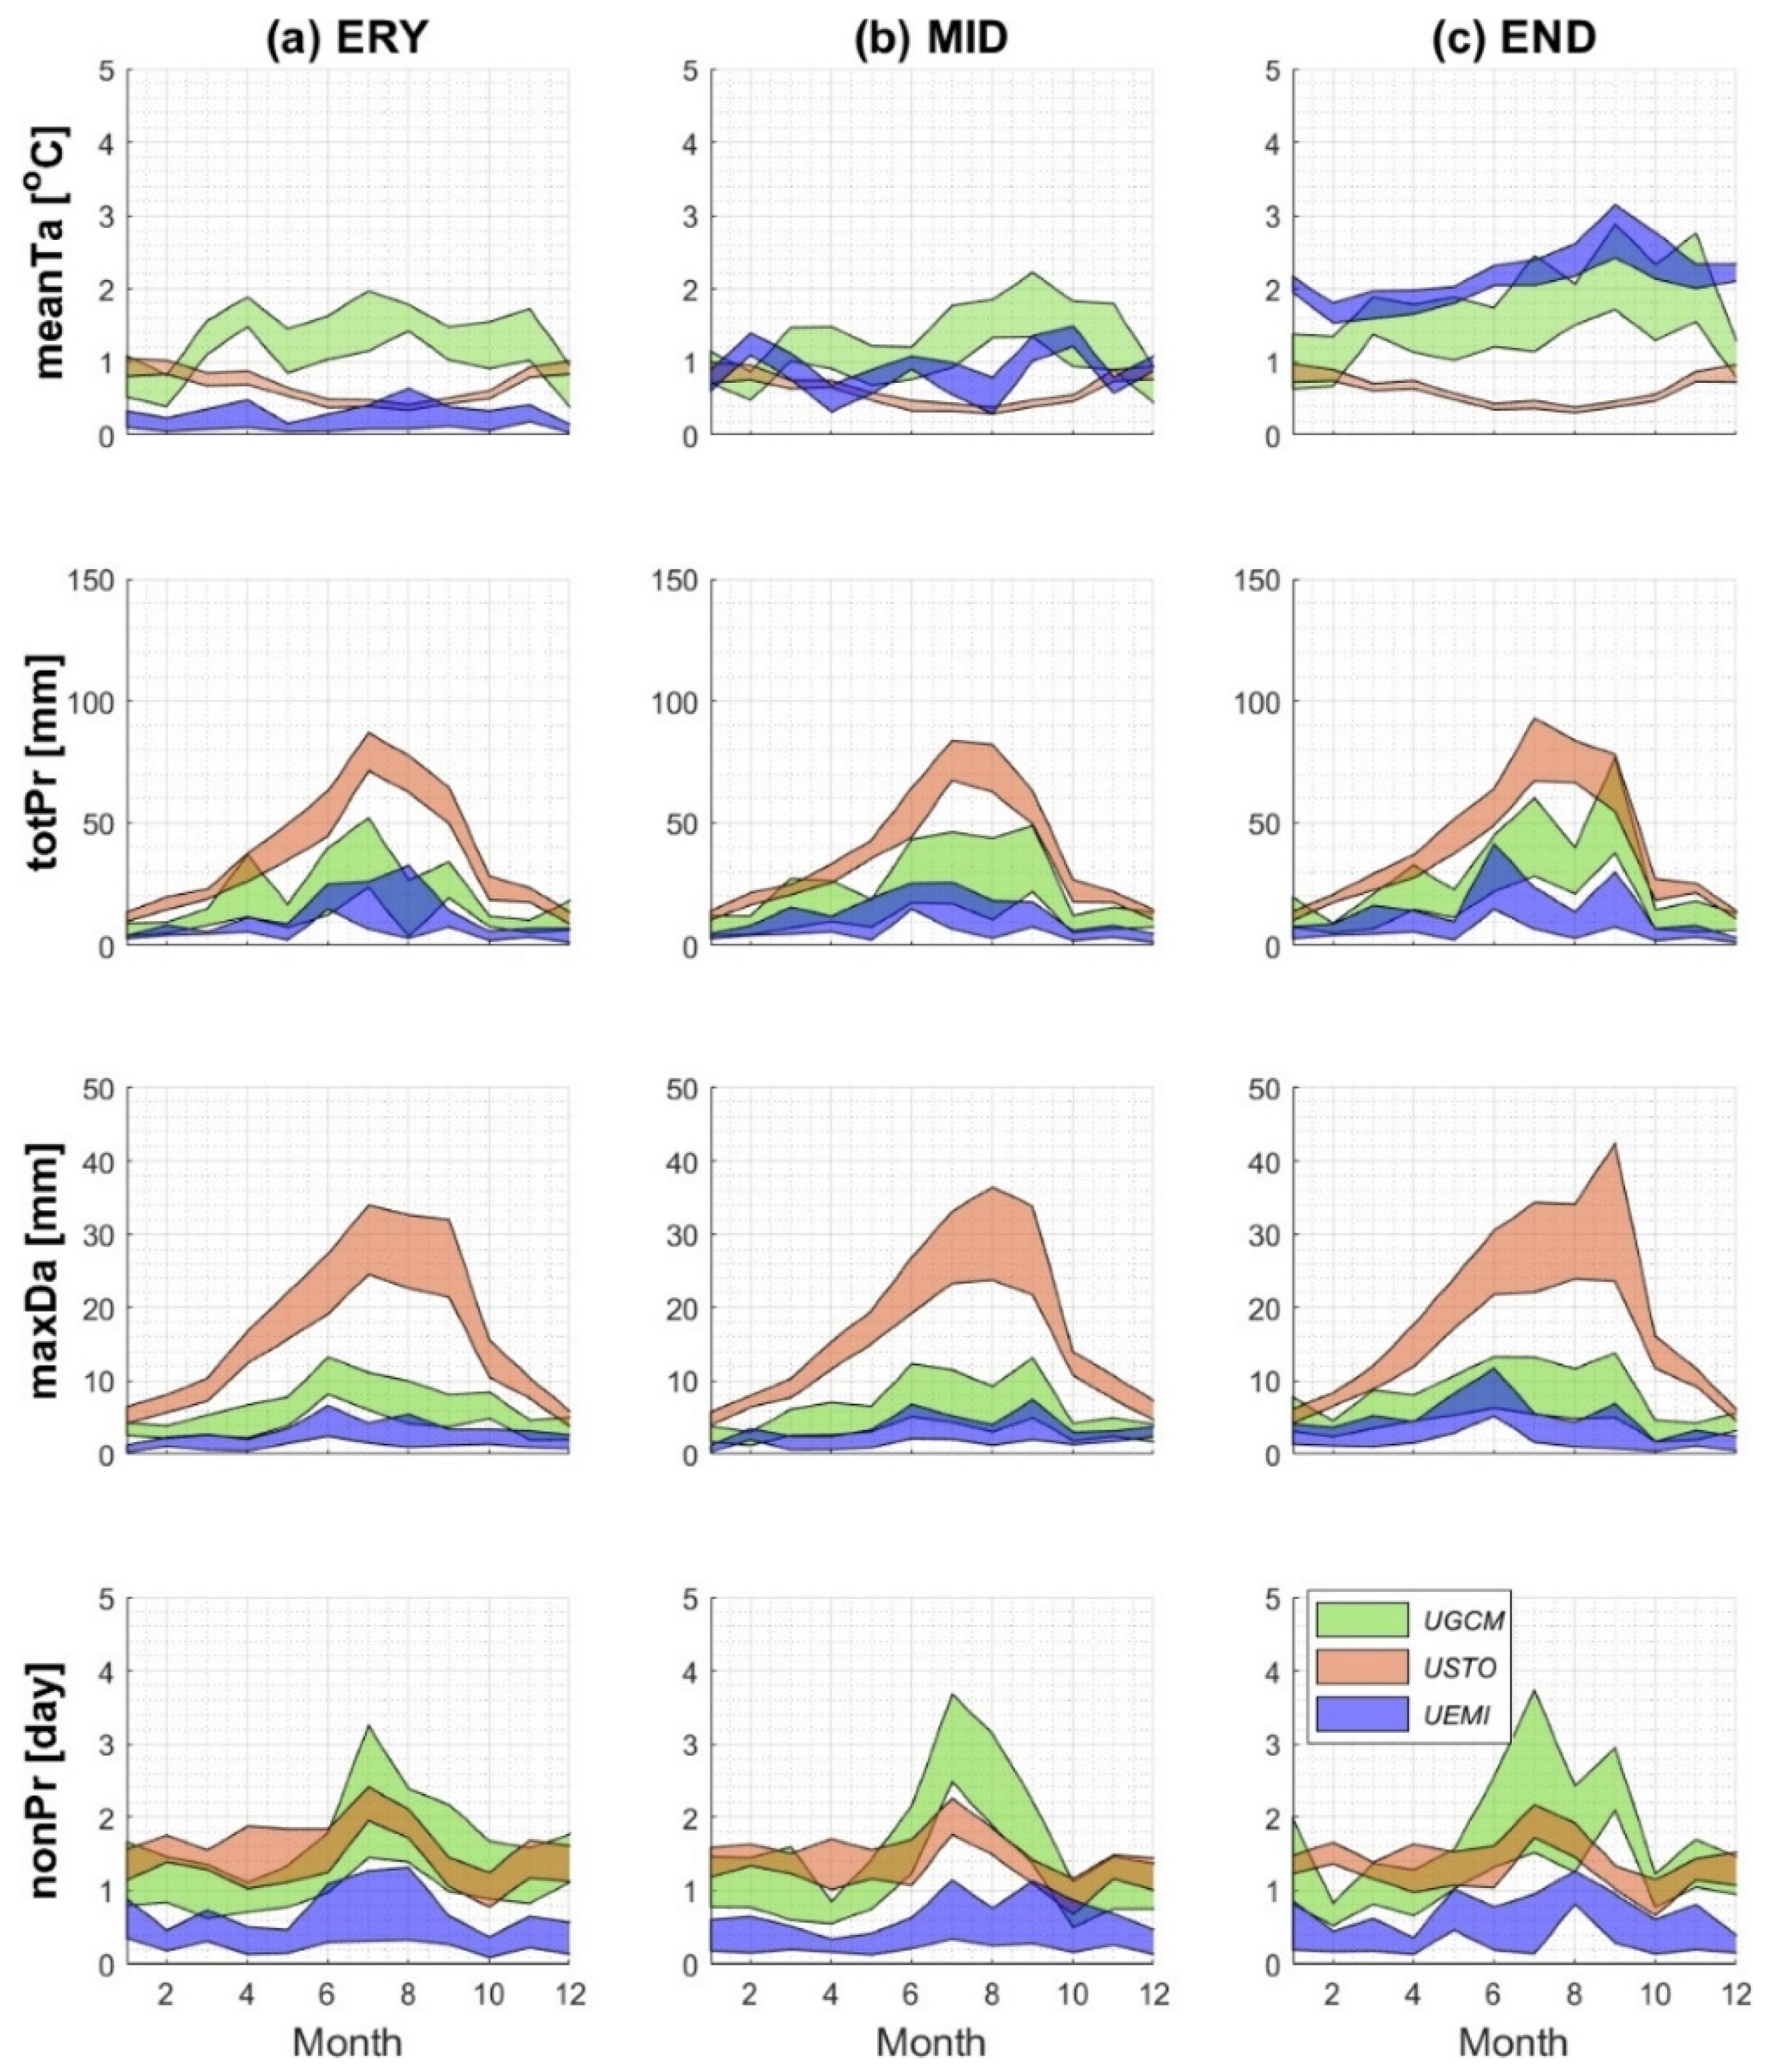
We estimated three uncertainty values for all locations for every month, future periods, and emission scenarios, since the contribution of each uncertainty for South Korea depended on indices, future periods, and seasons. The relative contributions of three uncertainties over 40 locations per month were plotted as shown in Figure 12 and Figure S14 in the Supplementary Materials for CMIP6 and CMIP5, respectively. The model uncertainty, UGCM (green shaded area), was the major contributor to the largest uncertainty in terms of mean temperature predictions (meanTa) over South Korea. On the other hand, in the case of the stochastic uncertainty (red shaded area), its contribution was negligible for meanTa, but dominated (especially in the summer season) for totPr and maxDa. This uncertainty was much greater in the summer season (June to September) than in the winter season (November to February), so one should be cautious when forecasting future precipitation in the rainy summer months. In the case of nonPr, the magnitudes of the three uncertainties were very stable (about 2 days), and the UGCM and USTO had a relatively large influence. Emission scenario uncertainty (shown by the blue shaded area) had a relatively low overall contribution, especially for precipitation-related indices, but the uncertainty contribution in projecting the future meanTa far from the present time increased significantly. Indeed, the significance of this uncertainty was less during the ERY period but became one of the dominant sources of uncertainty during the END period.

3.7. Implications for Stakeholders

Many studies projecting future climate have warned that precipitation and temperature will increase globally [69,70,71,72] and also in South Korea [26,50,72,73], but the extent of that increase depends on the region, indicators, and the GCMs used [22,74]. For example, our results show that under SSP5-8.5, the national average temperature increases by about 5 °C, while temperatures in other regions may increase by 3.5 °C in Central East Africa [22] to 6 °C in the northwestern parts of South Asia [74]. In addition, the future change in average precipitation in Korea is 14.6% in the far future in this study, which is comparable to the results of 14.41% in Central Asia [75] and 15.9% [26] in Korea. However, this change could be even higher, e.g., it is 27.3% in India and 26.4% in Pakistan [74]. Stakeholders and policymakers should keep in mind that when utilizing research findings for developing policies, actions, and laws, the results may be subject to uncertainty, depending on the GCM chosen for each region.
There have been many studies comparing the model performance of two CMIPs to see how well they reproduce the historical climate [4,8,13,21,27,28,76], but the comparison studies of future projections between the two generation models are comparatively limited [14,23,26,77], and show mixed outcomes. While some studies have reported no significant differences for global future projections of mean temperature and total precipitation between the two CMIPs [14,23,77], others on a local scale report differences [26]. Our study also confirmed that there is an evident difference in C M ¯ values (especially for meanTa, totPr, and maxDa) between the two CMIPs in South Korea (see Figure 5); in particular, the GCM uncertainty in CMIP6 is significantly larger than in CMIP5 (see Figure 7), which is consistent with the recent results [74,78]. Although few studies on South Korea have considered quantifying uncertainties in future projections [26,73], this study is the first attempt to unambiguously quantify the sources of uncertainty in future projections for various hydrologic indicators that can infer Korea’s floods, droughts, and flow averages, and to examine the discrepancies between CMIPs. The findings that climatological means and their uncertainty in CMIP6 are greater than those in CMIP5 will motivate stakeholders to evaluate whether policies designed based on past calculations with CMIP5 are still appropriate, and actively update them to reflect the new CMIP6 scenarios.

4. Conclusions

Despite many previous studies comparing hydrological indicators between CMIP5 and CMIP6, this study has novelty in that it analyzes the future changes of various climate indicators and can infer floods, droughts, and flow averages on a local scale; it identifies all sources of uncertainty, including the stochastic uncertainty from a large number of ensemble generations. The main purpose of this study was to quantify the future projections of the climatological mean and three sources of uncertainty, and to investigate the differences in these values between CMIP5 and CMIP6. As a result, we sought to improve our understanding of future projections of climate values for mitigation actions in the context of climate change, ascertain what the future climate will be, and explore how uncertainty can be reduced when considering improvements in climate models and emission scenarios. Both CMIPs used the same number of GCMs, and most of the GCMs selected in CMIP6 were the updated versions from CMIP5. The BWA approach facilitated by the MCMC simulation was used for quantifying the model uncertainty, and the stochastic weather generator called AWE-GEN was employed for generating stochastic ensembles. It is an advantage of this study to be able to generate an ensemble with a large number of members (i.e., 1000 MCMC simulations and 100 AWE-GEN realizations) for performing the future projections and quantifying the uncertainties of variables of interest. The number of ensembles reconstructed from the MCMC simulation was 4 (indices) × 13 (12 months and the whole year) × 40 (locations) × 7 (periods and scenarios) × 1000 (MCMC results), while the number of ensembles from the AWE-GEN realizations was 4 (indices) × 13 (12 months and the whole year) × 40 (locations) × 7 (periods and scenarios) × 100 (AWE-GEN realizations). The future projections of the 4 proposed indices were quantified by averaging the ensembles of the climatological mean (denoted as C M ¯ ). The model and stochastic uncertainties were estimated as the range of ensembles of the climatological mean, while the emission scenario uncertainty was estimated as the difference between the C M ¯ values of two emission scenarios.
To examine whether using the ensemble (BWA) approach was better than using individual GCMs in climate simulations, we computed the correlation coefficient (R) and the normalized root mean square error (NRMSE). Overall, the ensemble mean (the BWA approach), which aggregated the results of multiple GCMs, performed better. The performance of GCMs in climate simulations depends on many factors, such as indices, seasons, and temporal scales. Therefore, choosing one specific GCM model is risky because it may be good in some cases but not suitable in others. In addition, using GCMs from CMIP6 for reproducing the control climate was superior to using those in CMIP5.
Since CMIP6 was released with a new generation of GCMs, with improvements over CMIP5, we wanted to know what the future climate would be and the differences between CMIP6 and CMIP5. Our results indicated that: (1) the spatial average of the C M ¯ value in CMIP6 increased by up to 5 °C for temperature and 20% for totPr and maxDa in the END period, except for nonPr, which was relatively unchanged; (2) the spatial patterns of higher and lower C M ¯ values were dissimilar among indices, but these patterns for each index remained the same for future periods; and (3) future climate projections of CMIP6 were higher than those of CMIP5 for meanTa (0.83 °C), totPr (12.3%), and maxDa (11.7%), except for nonPr, with similar future projections in both CMIPs.
Uncertainty in future climate projections is inevitable. We quantified the uncertainty arising from three distinct sources, including model uncertainty, stochastic uncertainty, and emission scenario uncertainty. First, we quantified the model uncertainty (UGCM) values for each location in the control and future periods for the proposed indicators, and then compared these uncertainties between CMIP6 and CMIP5. We found that: (1) the spatial average of UGCM increased up to 0.58 °C for meanTa, and 85.6%, 49.7%, and 23.2% for totPr, maxDa, and nonPr, respectively, during the END period; (2) no specific spatial patterns of high and low UGCM were observed in all indices, and since UGCM values varied widely from location to location, regionalizing UGCM values in a specific location to the periphery was risky; (3) the UGCM values of CMIP6 were higher than the CMIP5 values in future periods for meanTa, totPr, and maxDa, especially during the END period, while the UGCM differences between the two CMIPs for nonPr were negligible.
The emission scenario uncertainty (UEMI) was quantified as the difference between the averaged CM values of the two emission scenarios (i.e., SSP2-4.5 and SSP5-8.5 in CMIP6). The UEMI values were calculated in the future time periods in CMIP6 for the proposed indices and then compared with their corresponding values in CMIP5. The findings were as follows: (1) UEMI values increased over time, especially for meanTa; (2) an evident spatial pattern of UEMI values was observed for meanTa while no specific pattern was observed for the precipitation indices; (3) the differences in the emission scenario uncertainty between the two CMIPs were not significant.
Finally, the stochastic uncertainty (USTO) was also quantified in the control and future periods in CMIP6 for the proposed indices, and then the differences in the USTO values between CMIP5 and CMIP6 were investigated. As a result: (1) the USTO values increased by 22.8% for totPr and 23.7% for maxDa in the future periods while the values of meanTa and nonPr were not significantly different from those in the control period; (2) since the spatial pattern of high USTO values was dissimilar among indices, even if we knew the spatial pattern information of one index, regionalization of the other index should not be performed; and (3) the USTO values of the precipitation indices in CMIP6 were higher than those in CMIP5, but the differences in the meanTa USTO values between the two CMIPs were insignificant.
The relative contribution of each uncertainty depended on many factors, such as the index, projection lead time, and season. The model uncertainty (green shaded area) was the major source of the largest uncertainty for meanTa. The stochastic uncertainty (red shaded area) dominated the uncertainties for totPr and maxDa in many regions, especially in the summer. The emission uncertainty made only a small contribution to the precipitation-related indices, but it became the dominant source of uncertainty in projecting the future meanTa.
In this study, C M ¯ values that represent long-term averages and their uncertainties were quantified and compared. However, examining the climate variability that has occurred over a period may be more central to understanding the extreme phenomena. In particular, evaluating the impact of climate internal variability on future projections of extreme precipitation is essential because it is irreducible and relatively difficult to predict [66,79]. Therefore, further studies of the effects of climate variability on hydrological regimes or extreme flow characteristics (e.g., frequency, intensity) could be conducted.
Future research into the hydrological impacts of climate will benefit from our findings. Stakeholders and policymakers need to know how future projections of climate-related indices lead to hydrological conditions on the microscale (e.g., dam inflow and flooding [80,81]), or how differences in future projections between two CMIPs can affect hydrological outcomes. Ultimately, to plan and propose future mitigation actions, we must decide whether policies that are planned based on future projections using CMIP5 should be appropriately changed or if they should continue to be employed, based on the updated CMIP6.

Supplementary Materials

The following are available online at https://www.mdpi.com/article/10.3390/w14182926/s1, Figure S1: Non-parametric kernel distribution for the FOCs of the C M ¯ values over South Korea with scenario SSP5-8.5: (a) ERY, (b) MID, and (c) END. Each row plots correspond to indices of meanTa, totPr, maxDa, and nonPr, respectively. The number of data points for making distribution is 520 (40 locations × 13 (12 months + year)), Figure S2: Similar to Figure 4, but for SSP2-4.5, Figure S3: Similar to Figure 4, but for scenario RCP 8.5 of CMIP5, Figure S4: Similar to Figure 5, but for SSP2-4.5 in CMIP6 and RCP 4.5 in CMIP5, Figure S5: Non-parametric kernel distribution for the FOCs of the UGCM values over South Korea with scenario SSP5-8.5: (a) ERY, (b) MID, and (c) END. Each row plots correspond to indices of meanTa, totPr, maxDa, and nonPr, respectively. The number of data points for making distribution is 520 (40 locations × 13 (12 months + year)), Figure S6: Similar to Figure 6, but for SSP2-4.5, Figure S7: Similar to Figure 6, but for RCP 8.5 of CMIP5, Figure S8: Similar to Figure 7, but for SSP2-4.5 in CMIP6 and RCP 4.5 in CMIP5, Figure S9: Non-parametric kernel distribution for the FOCs of STOU values between future and control period for scenarios of SSP5-8.5: (a) ERY, (b) MID, and (c) END. Each row plots correspond to indices of meanTa, totPr, maxDa, and nonPr, respectively. The number of data points for making distribution is 520 (40 locations × 13 (12 months + year)), Figure S10: Similar to Figure 8, but for SSP2-4.5, Figure S11: Similar to Figure 8, but for RCP 8.5 of CMIP5, Figure S12: Similar to Figure 9, but for SSP2-4.5 in CMIP6 and RCP 4.5 in CMIP5, Figure S13: Similar to Figure 10 but for CMIP5, Figure S14: Similar to Figure 12, but for CMIP5, Table S1. List of 40 locations over South Korea, Table S2. Comparisons of the factor of change (FOC) computed as difference (for temperature) or ratio (for precipitation indices) of C M ¯ , UGCM, and USTO values between future and control periods over the 40 locations and 13 (12 months +1 year) between scenario RCP 8.5 for CMIP5 and SSP 5-8.5 for CMIP6.

Author Contributions

Conceptualization, M.V.D. and J.K.; methodology, M.V.D. and J.K.; formal analysis, M.V.D. and J.K.; writing—original draft preparation, M.V.D.; writing—review and editing, M.V.D. and J.K.; visualization, M.V.D.; funding acquisition, J.K. All authors have read and agreed to the published version of the manuscript.

Funding

This work was supported by the National Research Foundation of Korea (NRF) grant funded by the Korean government (MSIT)(NRF-2022R1A2C2008584), and by the Korean Environment Industry and Technology Institute (KEITI) through the Water Management Program for Drought Program funded by the Korean Ministry of the Environment (2022003610003).

Institutional Review Board Statement

Not applicable.

Informed Consent Statement

Not applicable.

Data Availability Statement

Data are contained within the article.

Conflicts of Interest

The authors declare no conflict of interest.

References

  1. IPCC. Climate Change 2013: The Physical Science Basis. Contribution of Working Group I to the Fifth Assessment Report of the Intergovernmental Panel on Climate Change; Cambridge University Press: Cambridge, UK; New York, NY, USA, 2013; 1535p. [Google Scholar]
  2. Taylor, K.E.; Stouffer, R.J.; Meehl, G.A. An Overview of CMIP5 and the Experiment Design. Bull. Am. Meteorol. Soc. 2012, 93, 485–498. [Google Scholar] [CrossRef]
  3. Eyring, V.; Bony, S.; Meehl, G.A.; Senior, C.A.; Stevens, B.; Stouffer, R.J.; Taylor, K.E. Overview of the Coupled Model Intercomparison Project Phase 6 (CMIP6) experimental design and organization. Geosci. Model Dev. 2016, 9, 1937–1958. [Google Scholar] [CrossRef]
  4. Kim, M.K.; Yu, D.G.; Oh, J.S.; Byun, Y.H.; Boo, K.O.; Chung, I.U.; Park, J.S.; Park, D.S.R.; Min, S.K.; Sung, H.M. Performance Evaluation of CMIP5 and CMIP6 Models on Heatwaves in Korea and Associated Teleconnection Patterns. J. Geophys. Res. Atmos. 2020, 125, e2020JD032583. [Google Scholar] [CrossRef]
  5. Bracegirdle, T.J.; Holmes, C.R.; Hosking, J.S.; Marshall, G.J.; Osman, M.; Patterson, M.; Rackow, T. Improvements in Circumpolar Southern Hemisphere Extratropical Atmospheric Circulation in CMIP6 Compared to CMIP5. Earth Space Sci. 2020, 7, e2019EA001065. [Google Scholar] [CrossRef]
  6. Kim, Y.-H.; Min, S.-K.; Zhang, X.; Sillmann, J.; Sandstad, M. Evaluation of the CMIP6 multi-model ensemble for climate extreme indices. Weather. Clim. Extrem. 2020, 29, 100269. [Google Scholar] [CrossRef]
  7. Zhu, H.; Jiang, Z.; Li, J.; Li, W.; Sun, C.; Li, L. Does CMIP6 Inspire More Confidence in Simulating Climate Extremes over China? Adv. Atmos. Sci. 2020, 37, 1119–1132. [Google Scholar] [CrossRef]
  8. Ayugi, B.; Zhihong, J.; Zhu, H.; Ngoma, H.; Babaousmail, H.; Rizwan, K.; Dike, V. Comparison of CMIP6 and CMIP5 models in simulating mean and extreme precipitation over East Africa. Int. J. Climatol. 2021, 41, 6474–6496. [Google Scholar] [CrossRef]
  9. Wang, B.; Jin, C.; Liu, J. Understanding Future Change of Global Monsoons Projected by CMIP6 Models. J. Clim. 2020, 33, 6471–6489. [Google Scholar] [CrossRef]
  10. Scoccimarro, E.; Gualdi, S. Heavy Daily Precipitation Events in the CMIP6 Worst-Case Scenario: Projected Twenty-First-Century Changes. J. Clim. 2020, 33, 7631–7642. [Google Scholar] [CrossRef]
  11. Agel, L.; Barlow, M. How Well Do CMIP6 Historical Runs Match Observed Northeast U.S. Precipitation and Extreme Precipitation–Related Circulation? J. Clim. 2020, 33, 9835–9848. [Google Scholar] [CrossRef]
  12. Wehner, M.; Gleckler, P.; Lee, J. Characterization of long period return values of extreme daily temperature and precipitation in the CMIP6 models: Part 1, model evaluation. Weather. Clim. Extrem. 2020, 30, 100283–100298. [Google Scholar] [CrossRef]
  13. Thorarinsdottir, T.L.; Sillmann, J.; Haugen, M.; Gissibl, N.; Sandstad, M. Evaluation of CMIP5 and CMIP6 simulations of historical surface air temperature extremes using proper evaluation methods. Environ. Res. Lett. 2020, 15, 124041–124054. [Google Scholar] [CrossRef]
  14. Wehner, M.F. Characterization of long period return values of extreme daily temperature and precipitation in the CMIP6 models: Part 2, projections of future change. Weather. Clim. Extrem. 2020, 30, 100284–100297. [Google Scholar] [CrossRef]
  15. Moon, S.; Ha, K.-J. Future changes in monsoon duration and precipitation using CMIP6. NPJ Clim. Atmos. Sci. 2020, 3, 45. [Google Scholar] [CrossRef]
  16. Perez, J.; Menendez, M.; Mendez, F.J.; Losada, I.J. Evaluating the performance of CMIP3 and CMIP5 global climate models over the north-east Atlantic region. Clim. Dyn. 2014, 43, 2663–2680. [Google Scholar] [CrossRef]
  17. Das, L.; Meher, J.K.; Akhter, J.; Benestad, R.E.; Mezghani, A. Performance of CMIP3 and CMIP5 GCMs to Simulate Observed Rainfall Characteristics over the Western Himalayan Region. J. Clim. 2017, 30, 7777–7799. [Google Scholar] [CrossRef]
  18. Grose, M.R.; Brown, J.N.; Narsey, S.; Brown, J.R.; Murphy, B.F.; Langlais, C.; Gupta, A.S.; Moise, A.F.; Irving, D.B. Assessment of the CMIP5 global climate model simulations of the western tropical Pacific climate system and comparison to CMIP3. Int. J. Climatol. 2014, 34, 3382–3399. [Google Scholar] [CrossRef]
  19. Scoccimarro, E.; Gualdi, S.; Bellucci, A.; Zampieri, M.; Navarra, A. Heavy Precipitation Events in a Warmer Climate: Results from CMIP5 Models. J. Clim. 2013, 26, 7902–7911. [Google Scholar] [CrossRef]
  20. Ogata, T.; Ueda, H.; Inoue, T.; Hayasaki, M.; Yoshida, A.; Watanabe, S.; Kira, M.; Ooshiro, M.; Kumai, A. Projected Future Changes in the Asian Monsoon: A Comparison of CMIP3 and CMIP5 Model Results. J. Meteorol. Soc. Jpn. Ser. II 2014, 92, 207–225. [Google Scholar] [CrossRef]
  21. Chen, H.; Sun, J.; Lin, W.; Xu, H. Comparison of CMIP6 and CMIP5 models in simulating climate extremes. Sci. Bull. 2020, 65, 1415–1418. [Google Scholar] [CrossRef]
  22. Almazroui, M.; Saeed, F.; Saeed, S.; Islam, M.N.; Ismail, M.; Klutse, N.A.B.; Siddiqui, M.H. Projected Change in Temperature and Precipitation Over Africa from CMIP6. Earth Syst. Environ. 2020, 4, 455–475. [Google Scholar] [CrossRef]
  23. Grose, M.R.; Narsey, S.; Delage, F.P.; Dowdy, A.J.; Bador, M.; Boschat, G.; Chung, C.; Kajtar, J.B.; Rauniyar, S.; Freund, M.B.; et al. Insights from CMIP6 for Australia’s Future Climate. Earth’s Future 2020, 8, e2019EF001469. [Google Scholar] [CrossRef]
  24. Stefanidis, S. Ability of Different Spatial Resolution Regional Climate Model to Simulate Air Temperature in a Forest Ecosystem of Central Greece. J. Environ. Prot. Ecol. 2021, 22, 1488–1495. [Google Scholar]
  25. Tolika, K.; Anagnostopoulou, C.; Velikou, K.; Vagenas, C. A comparison of the updated very high resolution model RegCM3_10 km with the previous version RegCM3_25 km over the complex terrain of Greece: Present and future projections. Theor. Appl. Climatol. 2016, 126, 715–726. [Google Scholar] [CrossRef]
  26. Song, Y.H.; Chung, E.S.; Shahid, S. Spatiotemporal differences and uncertainties in projections of precipitation and temperature in South Korea from CMIP6 and CMIP5 general circulation models. Int. J. Climatol. 2021, 41, 5899–5919. [Google Scholar] [CrossRef]
  27. Monerie, P.-A.; Wainwright, C.M.; Sidibe, M.; Akinsanola, A.A. Model uncertainties in climate change impacts on Sahel precipitation in ensembles of CMIP5 and CMIP6 simulations. Clim. Dyn. 2020, 55, 1385–1401. [Google Scholar] [CrossRef]
  28. Zamani, Y.; Hashemi Monfared, S.A.; Azhdari Moghaddam, M.; Hamidianpour, M. A comparison of CMIP6 and CMIP5 projections for precipitation to observational data: The case of Northeastern Iran. Theor. Appl. Climatol. 2020, 142, 1613–1623. [Google Scholar] [CrossRef]
  29. Hawkins, E.; Sutton, R. The Potential to Narrow Uncertainty in Regional Climate Predictions. Bull. Am. Meteorol. Soc. 2009, 90, 1095–1108. [Google Scholar] [CrossRef]
  30. Lafaysse, M.; Hingray, B.; Mezghani, A.; Gailhard, J.; Terray, L. Internal variability and model uncertainty components in future hydrometeorological projections: The Alpine Durance basin. Water Resour. Res. 2014, 50, 3317–3341. [Google Scholar] [CrossRef]
  31. Hingray, B.; Said, M. Partitioning Internal Variability and Model Uncertainty Components in a Multimember Multimodel Ensemble of Climate Projections. J. Clim. 2014, 27, 6779–6798. [Google Scholar] [CrossRef]
  32. Hawkins, E.; Sutton, R. The potential to narrow uncertainty in projections of regional precipitation change. Clim. Dyn. 2010, 37, 407–418. [Google Scholar] [CrossRef]
  33. Beobide-Arsuaga, G.; Bayr, T.; Reintges, A.; Latif, M. Uncertainty of ENSO-amplitude projections in CMIP5 and CMIP6 models. Clim. Dyn. 2021, 56, 3875–3888. [Google Scholar] [CrossRef]
  34. Fatichi, S.; Ivanov, V.Y.; Paschalis, A.; Peleg, N.; Molnar, P.; Rimkus, S.; Kim, J.; Burlando, P.; Caporali, E. Uncertainty partition challenges the predictability of vital details of climate change. Earth’s Future 2016, 4, 240–251. [Google Scholar] [CrossRef]
  35. Kim, J.; Ivanov, V.Y.; Fatichi, S. Climate change and uncertainty assessment over a hydroclimatic transect of Michigan. Stoch. Environ. Res. Risk Assess. 2016, 30, 923–944. [Google Scholar] [CrossRef]
  36. Hawkins, E.; Smith, R.S.; Gregory, J.M.; Stainforth, D.A. Irreducible uncertainty in near-term climate projections. Clim. Dyn. 2015, 46, 3807–3819. [Google Scholar] [CrossRef]
  37. Monerie, P.-A.; Sanchez-Gomez, E.; Pohl, B.; Robson, J.; Dong, B. Impact of internal variability on projections of Sahel precipitation change. Environ. Res. Lett. 2017, 12, 114003. [Google Scholar] [CrossRef]
  38. Olonscheck, D.; Notz, D. Consistently Estimating Internal Climate Variability from Climate Model Simulations. J. Clim. 2017, 30, 9555–9573. [Google Scholar] [CrossRef]
  39. Tebaldi, C.; Smith, R.L.; Nychka, D.; Mearns, L.O. Quantifying uncertainty in projections of regional climate change: A Bayesian approach to the analysis of multimodel ensembles. J. Clim. 2005, 18, 1524–1540. [Google Scholar] [CrossRef]
  40. Ivanov, V.Y.; Bras, R.L.; Curtis, D.C. A weather generator for hydrological, ecological, and agricultural applications. Water Resour. Res. 2007, 43, 1–21. [Google Scholar] [CrossRef]
  41. Fatichi, S.; Ivanov, V.Y.; Caporali, E. Simulation of future climate scenarios with a weather generator. Adv. Water Resour. 2011, 34, 448–467. [Google Scholar] [CrossRef]
  42. Kim, J.; Tanveer, M.E.; Bae, D.-H. Quantifying climate internal variability using an hourly ensemble generator over South Korea. Stoch. Environ. Res. Risk Assess. 2018, 32, 3037–3051. [Google Scholar] [CrossRef]
  43. O’Neill, B.C.; Tebaldi, C.; van Vuuren, D.P.; Eyring, V.; Friedlingstein, P.; Hurtt, G.; Knutti, R.; Kriegler, E.; Lamarque, J.-F.; Lowe, J.; et al. The Scenario Model Intercomparison Project (ScenarioMIP) for CMIP6. Geosci. Model Dev. 2016, 9, 3461–3482. [Google Scholar] [CrossRef]
  44. Wu, T.; Lu, Y.; Fang, Y.; Xin, X.; Li, L.; Li, W.; Jie, W.; Zhang, J.; Liu, Y.; Zhang, L.; et al. The Beijing Climate Center Climate System Model (BCC-CSM): The main progress from CMIP5 to CMIP6. Geosci. Model Dev. 2019, 12, 1573–1600. [Google Scholar] [CrossRef]
  45. Swart, N.C.; Cole, J.N.S.; Kharin, V.V.; Lazare, M.; Scinocca, J.F.; Gillett, N.P.; Anstey, J.; Arora, V.; Christian, J.R.; Hanna, S.; et al. The Canadian Earth System Model version 5 (CanESM5.0.3). Geosci. Model Dev. 2019, 12, 4823–4873. [Google Scholar] [CrossRef]
  46. Cherchi, A.; Fogli, P.G.; Lovato, T.; Peano, D.; Iovino, D.; Gualdi, S.; Masina, S.; Scoccimarro, E.; Materia, S.; Bellucci, A.; et al. Global mean climate and main patterns of variability in the CMCC-CM2 coupled model. J. Adv. Model. Earth Syst. 2018, 11, 185–209. [Google Scholar] [CrossRef]
  47. Voldoire, A.; Saint-Martin, D.; Sénési, S.; Decharme, B.; Alias, A.; Chevallier, M.; Colin, J.; Guérémy, J.F.; Michou, M.; Moine, M.P.; et al. Evaluation of CMIP6 DECK Experiments With CNRM-CM6-1. J. Adv. Model. Earth Syst. 2019, 11, 2177–2213. [Google Scholar] [CrossRef]
  48. Ziehn, T.; Chamberlain, M.A.; Law, R.M.; Lenton, A.; Bodman, R.W.; Dix, M.; Stevens, L.; Wang, Y.P.; Srbinovsky, J. The Australian Earth System Model: ACCESS-ESM1. 5. J. South. Hemisph. Earth Syst. Sci. 2020, 70, 193–214. [Google Scholar] [CrossRef]
  49. Bi, D.H.; Dix, M.; Marsland, S.; O’Farrell, S.; Sullivan, A.; Bodman, R.; Law, R.; Harman, I.; Srbinovsky, J.; Rashid, H.A.; et al. Configuration and spin-up of ACCESS-CM2, the new generation Australian Community Climate and Earth System Simulator Coupled Model. J. South. Hemisph. Earth Syst. Sci. 2020, 70, 225–251. [Google Scholar] [CrossRef]
  50. Song, Y.H.; Nashwan, M.S.; Chung, E.S.; Shahid, S. Advances in CMIP6 INM-CM5 over CMIP5 INM-CM4 for precipitation simulation in South Korea. Atmos. Res. 2021, 247, 105261. [Google Scholar] [CrossRef]
  51. Volodin, E.M.; Mortikov, E.V.; Kostrykin, S.V.; Galin, V.Y.; Lykossov, V.N.; Gritsun, A.S.; Diansky, N.A.; Gusev, A.V.; Iakovlev, N.G. Simulation of the present-day climate with the climate model INMCM5. Clim. Dyn. 2017, 49, 3715–3734. [Google Scholar] [CrossRef]
  52. Boucher, O.; Servonnat, J.; Albright, A.L.; Aumont, O.; Balkanski, Y.; Bastrikov, V.; Bekki, S.; Bonnet, R.; Bony, S.; Bopp, L.; et al. Presentation and Evaluation of the IPSL-CM6A-LR Climate Model. J. Adv. Model. Earth Syst. 2020, 12, e2019MS002010. [Google Scholar] [CrossRef]
  53. Li, L.J.; Yu, Y.Q.; Tang, Y.L.; Lin, P.F.; Xie, J.B.; Song, M.R.; Dong, L.; Zhou, T.J.; Liu, L.; Wang, L.; et al. The Flexible Global Ocean-Atmosphere-Land System Model Grid-Point Version 3 (FGOALS-g3): Description and Evaluation. J. Adv. Model. Earth Syst. 2020, 12, e2019MS002012. [Google Scholar] [CrossRef]
  54. Tatebe, H.; Ogura, T.; Nitta, T.; Komuro, Y.; Ogochi, K.; Takemura, T.; Sudo, K.; Sekiguchi, M.; Abe, M.; Saito, F.; et al. Description and basic evaluation of simulated mean state, internal variability, and climate sensitivity in MIROC6. Geosci. Model Dev. 2019, 12, 2727–2765. [Google Scholar] [CrossRef]
  55. Roberts, M.J.; Baker, A.; Blockley, E.W.; Calvert, D.; Coward, A.; Hewitt, H.T.; Jackson, L.C.; Kuhlbrodt, T.; Mathiot, P.; Roberts, C.D.; et al. Description of the resolution hierarchy of the global coupled HadGEM3-GC3.1 model as used in CMIP6 HighResMIP experiments. Geosci. Model Dev. 2019, 12, 4999–5028. [Google Scholar] [CrossRef]
  56. Müller, W.A.; Jungclaus, J.H.; Mauritsen, T.; Baehr, J.; Bittner, M.; Budich, R.; Bunzel, F.; Esch, M.; Ghosh, R.; Haak, H.; et al. A Higher-resolution Version of the Max Planck Institute Earth System Model (MPI-ESM1.2-HR). J. Adv. Model. Earth Syst. 2018, 10, 1383–1413. [Google Scholar] [CrossRef]
  57. Yukimoto, S.; Kawai, H.; Koshiro, T.; Oshima, N.; Yoshida, K.; Urakawa, S.; Tsujino, H.; Deushi, M.; Tanaka, T.; Hosaka, M.; et al. The Meteorological Research Institute Earth System Model Version 2.0, MRI-ESM2.0: Description and Basic Evaluation of the Physical Component. J. Meteorol. Soc. Jpn. Ser. II 2019, 97, 931–965. [Google Scholar] [CrossRef]
  58. Feng, R.; Otto-Bliesner, B.L.; Brady, E.C.; Rosenbloom, N. Increased Climate Response and Earth System Sensitivity from CCSM4 to CESM2 in Mid-Pliocene Simulations. J. Adv. Model. Earth Syst. 2020, 12, e2019MS002033. [Google Scholar] [CrossRef]
  59. Danabasoglu, G.; Lamarque, J.F.; Bacmeister, J.; Bailey, D.A.; DuVivier, A.K.; Edwards, J.; Emmons, L.K.; Fasullo, J.; Garcia, R.; Gettelman, A.; et al. The Community Earth System Model Version 2 (CESM2). J. Adv. Model. Earth Syst. 2020, 12, e2019MS001916. [Google Scholar] [CrossRef]
  60. Seland, Ø.; Bentsen, M.; Olivié, D.; Toniazzo, T.; Gjermundsen, A.; Graff, L.S.; Debernard, J.B.; Gupta, A.K.; He, Y.-C.; Kirkevåg, A.; et al. Overview of the Norwegian Earth System Model (NorESM2) and key climate response of CMIP6 DECK, historical, and scenario simulations. Geosci. Model Dev. 2020, 13, 6165–6200. [Google Scholar] [CrossRef]
  61. Dunne, J.P.; Horowitz, L.W.; Adcroft, A.J.; Ginoux, P.; Held, I.M.; John, J.G.; Krasting, J.P.; Malyshev, S.; Naik, V.; Paulot, F.; et al. The GFDL Earth System Model Version 4.1 (GFDL-ESM 4.1): Overall Coupled Model Description and Simulation Characteristics. J. Adv. Model. Earth Syst. 2020, 12, e2019MS002015. [Google Scholar] [CrossRef]
  62. Rong, X.; Li, J.; Chen, H.; Xin, Y.; Su, J.; Hua, L.; Zhou, T.; Qi, Y.; Zhang, Z.; Zhang, G.; et al. The CAMS Climate System Model and a Basic Evaluation of Its Climatology and Climate Variability Simulation. J. Meteorol. Res. 2019, 32, 839–861. [Google Scholar] [CrossRef]
  63. Cao, J.; Wang, B.; Yang, Y.-M.; Ma, L.; Li, J.; Sun, B.; Bao, Y.; He, J.; Zhou, X.; Wu, L. The NUIST Earth System Model (NESM) version 3: Description and preliminary evaluation. Geosci. Model Dev. 2018, 11, 2975–2993. [Google Scholar] [CrossRef]
  64. Fatichi, S.; Ivanov, V.Y.; Caporali, E. Assessment of a stochastic downscaling methodology in generating an ensemble of hourly future climate time series. Clim. Dyn. 2013, 40, 1841–1861. [Google Scholar] [CrossRef]
  65. Doi, M.V.; Kim, J. Projections on climate internal variability and climatological mean at fine scales over South Korea. Stoch. Environ. Res. Risk Assess. 2020, 34, 1037–1058. [Google Scholar] [CrossRef]
  66. Doi, M.V.; Kim, J. Addressing Climate Internal Variability on Future Intensity-Duration-Frequency Curves at Fine Scales across South Korea. Water 2021, 13, 2828. [Google Scholar] [CrossRef]
  67. Kim, J.; Ivanov, V.Y. A holistic, multi-scale dynamic downscaling framework for climate impact assessments and challenges of addressing finer-scale watershed dynamics. J. Hydrol. 2015, 522, 645–660. [Google Scholar] [CrossRef]
  68. Tran, V.N.; Kim, J. Quantification of predictive uncertainty with a metamodel: Toward more efficient hydrologic simulations. Stoch. Environ. Res. Risk Assess. 2019, 33, 1453–1476. [Google Scholar] [CrossRef]
  69. Chen, Z.; Zhou, T.; Zhang, L.; Chen, X.; Zhang, W.; Jiang, J. Global Land Monsoon Precipitation Changes in CMIP6 Projections. Geophys. Res. Lett. 2020, 47, e2019GL086902. [Google Scholar] [CrossRef]
  70. Ha, K.J.; Moon, S.; Timmermann, A.; Kim, D. Future Changes of Summer Monsoon Characteristics and Evaporative Demand Over Asia in CMIP6 Simulations. Geophys. Res. Lett. 2020, 47, e2020GL087492. [Google Scholar] [CrossRef]
  71. Jin, C.; Wang, B.; Liu, J. Future Changes and Controlling Factors of the Eight Regional Monsoons Projected by CMIP6 Models. J. Clim. 2020, 33, 9307–9326. [Google Scholar] [CrossRef]
  72. Sung, H.M.; Kim, J.; Shim, S.; Seo, J.-b.; Kwon, S.-H.; Sun, M.-A.; Moon, H.; Lee, J.-H.; Lim, Y.-J.; Boo, K.-O.; et al. Climate Change Projection in the Twenty-First Century Simulated by NIMS-KMA CMIP6 Model Based on New GHGs Concentration Pathways. Asia-Pac. J. Atmos. Sci. 2021, 57, 851–862. [Google Scholar] [CrossRef]
  73. Shin, Y.; Shin, Y.; Hong, J.; Kim, M.-K.; Byun, Y.-H.; Boo, K.-O.; Chung, I.-U.; Park, D.-S.R.; Park, J.-S. Future Projections and Uncertainty Assessment of Precipitation Extremes in the Korean Peninsula from the CMIP6 Ensemble with a Statistical Framework. Atmosphere 2021, 12, 97. [Google Scholar] [CrossRef]
  74. Almazroui, M.; Saeed, S.; Saeed, F.; Islam, M.N.; Ismail, M. Projections of Precipitation and Temperature over the South Asian Countries in CMIP6. Earth Syst. Environ. 2020, 4, 297–320. [Google Scholar] [CrossRef]
  75. Jiang, J.; Zhou, T.; Chen, X.; Zhang, L. Future changes in precipitation over Central Asia based on CMIP6 projections. Environ. Res. Lett. 2020, 15, 054009. [Google Scholar] [CrossRef]
  76. Kamruzzaman, M.; Shahid, S.; Islam, A.R.M.T.; Hwang, S.; Cho, J.; Zaman, M.A.U.; Ahmed, M.; Rahman, M.M.; Hossain, M.B. Comparison of CMIP6 and CMIP5 model performance in simulating historical precipitation and temperature in Bangladesh: A preliminary study. Theor. Appl. Climatol. 2021, 145, 1385–1406. [Google Scholar] [CrossRef]
  77. Tebaldi, C.; Debeire, K.; Eyring, V.; Fischer, E.; Fyfe, J.; Friedlingstein, P.; Knutti, R.; Lowe, J.; O’Neill, B.; Sanderson, B.; et al. Climate model projections from the Scenario Model Intercomparison Project (ScenarioMIP) of CMIP6. Earth Syst. Dyn. 2021, 12, 253–293. [Google Scholar] [CrossRef]
  78. Stouffer, R.J.; Eyring, V.; Meehl, G.A.; Bony, S.; Senior, C.; Stevens, B.; Taylor, K.E. CMIP5 Scientific Gaps and Recommendations for CMIP6. Bull. Am. Meteorol. Soc. 2017, 98, 95–105. [Google Scholar] [CrossRef]
  79. Kim, J.; Ivanov, V.Y.; Fatichi, S. Soil erosion assessment—Mind the gap. Geophys. Res. Lett. 2016, 43, 12446–12456. [Google Scholar] [CrossRef]
  80. Tran, V.N.; Kim, J. A robust surrogate data assimilation approach to real-time forecasting using polynomial chaos expansion. J. Hydrol. 2021, 598, 126367. [Google Scholar] [CrossRef]
  81. Tran, V.N.; Kim, J. Robust and efficient uncertainty quantification for extreme events that deviate significantly from the training dataset using polynomial chaos-kriging. J. Hydrol. 2022, 609, 127716. [Google Scholar] [CrossRef]
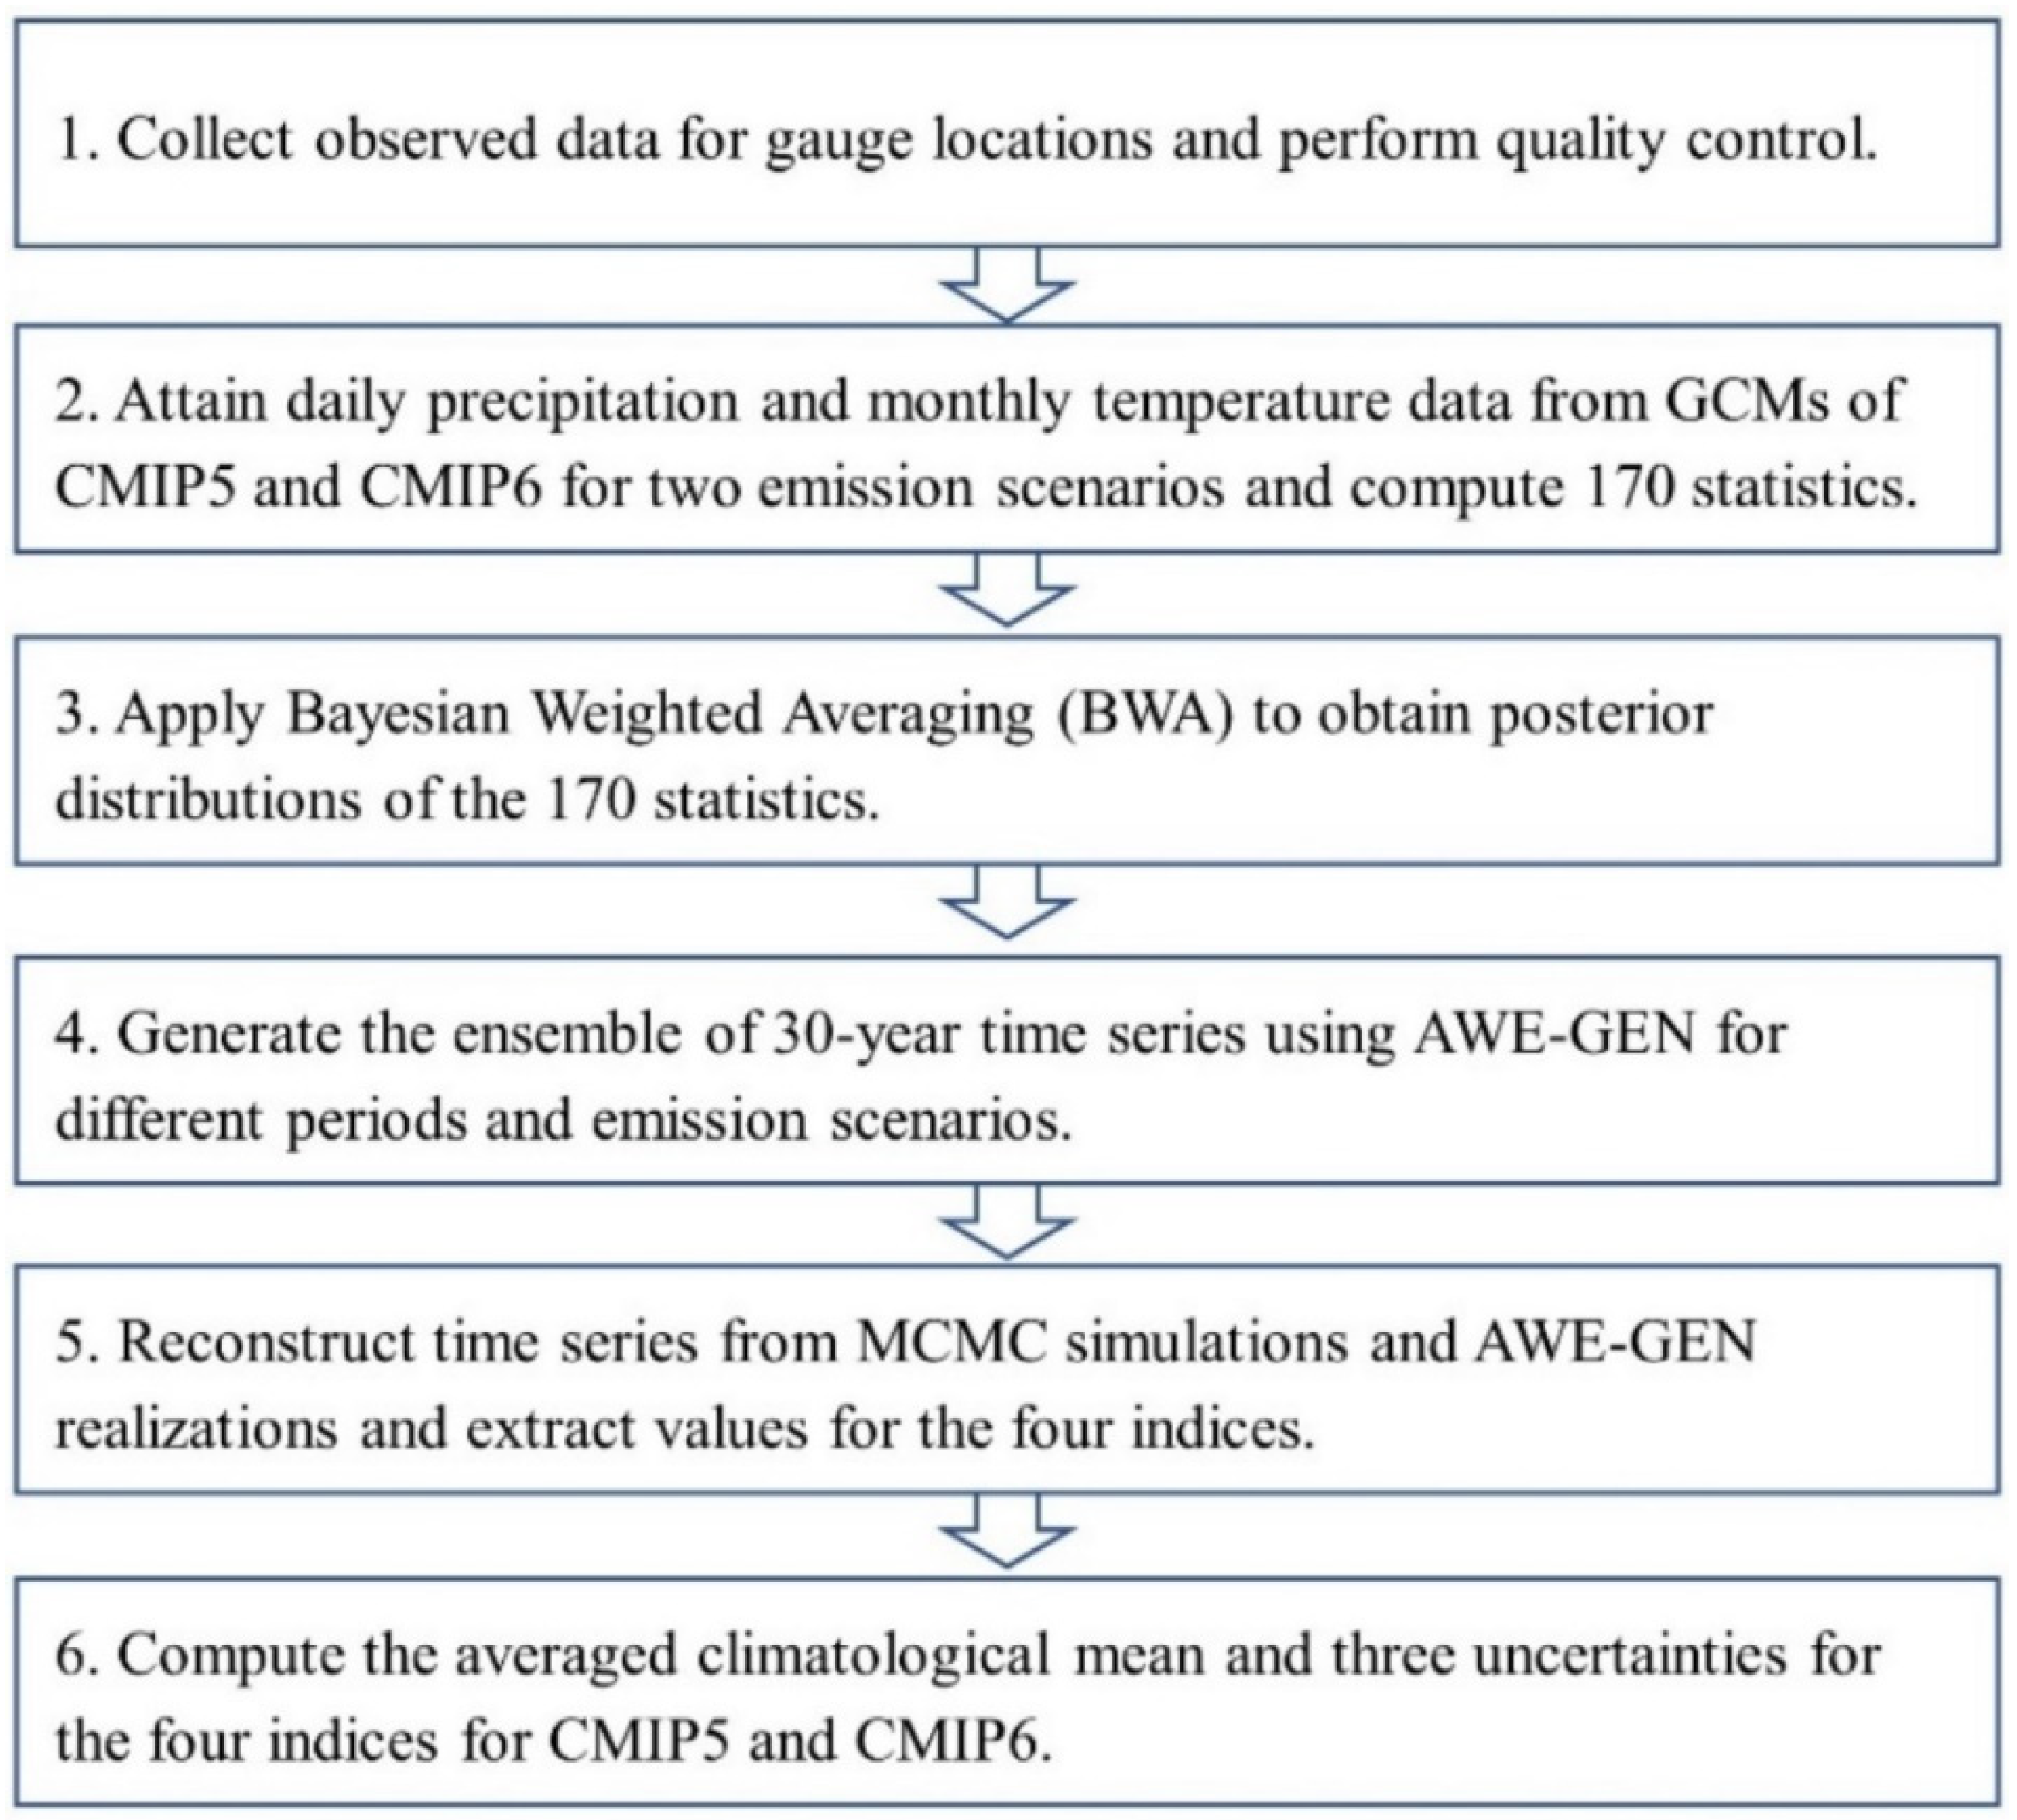
Figure 1. Flow chart of the methodology.
Water 14 02926 g001
Figure 2. Spatial map of 40 stations across South Korea. The name, latitude, and longitude of each location are given in Table S1 in the Supplementary Materials.
Water 14 02926 g002
Figure 3. Comparisons of the correlation coefficient (R) and the normalized root mean squared error (NRMSE) for individual 18 GCMs and their BWA mean for the control period: (a) meanTa, (b) totPr, (c) maxDa, and (d) nonPr. The R and NRMSE values were calculated for the 520 climatological mean (CM) values of each GCM (and BWA mean) and observations. The NRMSE was normalized by the mean of observations. The 520 refers to 40 locations × 13 (12 months + year).
Water 14 02926 g003
Figure 4. Spatial distribution of the C M ¯ values across South Korea for (a) CTL, (b) ERY, (c) MID, and (d) END period for the SSP5-8.5 emission scenario. The 4 indices were illustrated for the entire year. Spatially, 40 locations are classified into 4 distinct clusters (from the smallest (dark, blue-colored circles) to the largest cluster (red-colored circles)), by applying the K-means algorithm.
Water 14 02926 g004
Figure 5. Non-parametric kernel distributions for the difference (i.e., CMIP6-CMIP5 for meanTa) and the ratio (i.e., CMIP6/CMIP5 for totPr, maxDa, nonPr) of the C M ¯ values of 1000 MCMC ensemble members: (a) ERY, (b) MID, and (c) END. The number of data points for making these distributions is 520 (40 locations × 13 (12 months + year)).
Water 14 02926 g005
Figure 6. Spatial distributions of the UGCM values over South Korea in the (a) CTL, (b) ERY, (c) MID, and (d) END periods for the SSP5-8.5 for 4 indices, computed for the whole year. In total, 40 locations were classified into 4 clusters (from the smallest cluster (dark, blue-colored circles) to the largest cluster (red colored circles)) by applying the K-means algorithm.
Water 14 02926 g006
Figure 7. Non-parametric kernel distributions for the ratio of the UGCM values between the emission scenario SSP5-8.5 of CMIP6 and RCP 8.5 of CMIP5: (a) ERY, (b) MID, and (c) END. Each row plots correspond to indices of meanTa, totPr, maxDa, and nonPr, respectively. The number of data points for establishing the distribution is 520 (40 locations × 13 (12 months + year)).
Water 14 02926 g007
Figure 8. Spatial distribution of the USTO values over South Korea in the (a) CTL, (b) ERY, (c) MID, and (d) END periods, with the SSP5-8.5 for 4 indices computed for the whole year. In total, 40 locations are classified into 4 clusters (from the smallest cluster (dark, blue-colored circles) to the largest cluster (red colored circles)) by applying the K-means algorithm.
Water 14 02926 g008
Figure 9. Non-parametric kernel distributions for the ratio of the USTO values between the emission scenario SSP5-8.5 of CMIP6 and RCP 8.5 of CMIP5: (a) ERY, (b) MID, and (c) END. Each row of plots corresponds to indices of meanTa, totPr, maxDa, and nonPr, respectively. The number of data points for establishing the distribution is 520 (40 locations × 13 (12 months + year)).
Water 14 02926 g009
Figure 10. Spatial distribution of the UEMI values over South Korea in the (a) ERY, (b) MID, and (c) END periods, with the SSP5-8.5 for 4 indices computed for the whole year. In total, 40 locations are classified into 4 clusters (from the smallest cluster (dark, blue-colored circles) to the largest cluster (red colored circles)) by applying the K-means algorithm.
Water 14 02926 g010
Figure 11. Comparisons of the UEMI values between CMIP5 and CMIP6 for 4 indices: meanTa, totPr, maxDa, and nonPr in the (a) ERY, (b) MID, and (c) END periods. The number of data points to make the distribution is 520 (40 locations × 13 (12 months + year)).
Water 14 02926 g011
Figure 12. Comparisons of monthly uncertainties, including climate model uncertainty (UGCM), stochastic uncertainty (USTO), and emission scenario uncertainty (UEMI) for 4 indices for the (a) ERY, (b) MID, and (c) END periods. For each month, the shaded area was computed as the difference between the 25th and 75th percentiles of 40 values across South Korea.
Water 14 02926 g012
Table 1. List of global climate models (GCMs) in the CMIP6 and their previous version in the CMIP5.
No.CMIP5CMIP6Ref.
InstituteModel NameLon × LatInstituteModel NameLon × Lat
1BCCBCC-CSM1-1128 × 128BCCBCC-CSM2-MR320 × 160[44]
2CCCMACanESM2128 × 64CCCMACanESM5128 × 64[45]
3CMCCCMCC-CM480 × 480CMCCCMCC-CM2-SR5288 × 192[46]
4CNRMCNRM-CM5256 × 128CNRM-CERFACSCNRM-CM6-1256 × 128[47]
5CSIRO-BOMACCESSS1-0288 × 192CSIROACCESS-ESM1-5192 × 145[48]
6CSIRO-QCCECSIRO-Mk3-6-0192 × 96CSIRO-ARCCSSACCESS-CM2192 × 144[49]
7INMINM-CM-4180 × 120INMINM-CM-5180 × 120[50,51]
8IPSLIPSL-CM5A-LR96 × 96IPSLIPSL-CM6A-LR144 × 143[52]
9LASG-CESSFGOALS-g2128 × 128CASFGOALS-g3180 × 90[53]
10MIROCMIROC5256 × 256MIROCMIROC6256 × 256[54]
11MOHCHadGEM2-ES192 × 145MOHCHadGEM3-GC31-LL192 × 145[55]
12MPI-MMPI-ESM-MR192 × 192MPI-MMPI-ESM1-2-HR384 × 192[56]
13MRIMRI-CGCM3320 × 160MRIMRI-ESM2-0320 × 160[57]
14NCARCCSM4288 × 192NCARCESM2288 × 192[58,59]
15NCCNorESM1-M144 × 96NCCNorESM2-LM144 × 96[60]
16NOAA-GFDLGFDL-ESM2G180 × 180NOAA-GFDLGFDL-ESM4360 × 180[61]
17BNUBNU-ESM128 × 128CAMSCAMS-CSM1-0 * 360 × 200[62]
18NSF-DOECESM1-CAM5382 × 288NUISTNESM3 *192 × 96[63]
Note: * The new models in the CMIP6.
Table 2. The values of coefficient of correlation (R) and normalized root mean square error (NRMSE) for BWA means and individual GCMs for 4 indices for CMIP5 (the first row in each index) and for CMIP6 (the second row in each index).
IndexRNRMSE
BWA MeanGCMsBWA MeanGCMs
meanTa (°C)0.9950.278–0.9930.0850.109–0.407
0.9940.936–0.9870.0740.111–0.312
totPr (mm)0.9890.926–0.9810.3850.359–0.474
0.9900.931–0.9840.2740.312–0.722
maxDa (mm)0.9430.482–0.9200.5090.406–0.814
0.9320.661–0.9080.4640.346–0.721
nonPr (day)0.9980.987–0.9990.2010.112–0.598
0.9990.992–0.9990.1850.084–0.419
Table 3. The minimum and maximum of the C M ¯ values from MCMC simulations values over 40 locations in scenario RCP 8.5 (the first row of each index) for CMIP5 and scenario SSP5-8.5 (the second row of each index) for CMIP6.
IndexCTLERYMIDEND
meanTa (°C)9.8–14.211.2–15.612.8–17.214.5–18.7
10.4–15.011.7–15.813.1–17.715.6–19.9
totPr (mm)959.6–1299.5995.9–1388.91112.8–1467.51128.7–1466.9
1034.3–1452.71143.5–1474.11083.0–1505.61148.7–1523.6
maxDa (mm)66.9–93.175.0–97.181.8–109.782.6–112.0
75.1–112.981.5–100.682.3–107.880.9–123.2
nonPr (day)238–270242–270237–271240–269
250–264246–265250–265249–264
Table 4. The minimum and maximum of the UGCM values over 40 locations, which are computed for the whole year for control (CTL) and 3 future periods (ERY, MID, and END) of scenario RCP 8.5 (the first row of each index) for CMIP5 and scenario SSP5-8.5 (the second row of each index) for CMIP6.
IndexCTLERYMIDEND
meanTa (°C)0.49–1.870.40–1.570.44–1.660.62–1.68
0.55–1.980.60–2.650.63–2.240.69–2.60
totPr (mm)22.62–278.026.77–252.665.78–260.7933.75–256.91
6.28–248.5010.24–248.4221.59–245.8811.27–305.46
maxDa (mm)1.18–41.432.52–31.525.02–50.851.47–71.74
1.63–22.280.71–19.410.71–25.431.94–25.84
nonPr (day)2–403–332–473–33
1–151–211–151–21
Table 5. The minimum and maximum of the USTO values over 40 locations, which are computed for the whole year for the control (CTL) and 3 future periods (ERY, MID, and END) of scenario RCP 8.5 (the first row of each index) for CMIP5 and scenario SSP5-8.5 (the second row of each index) for CMIP6.
IndexCTLERYMIDEND
meanTa (°C)0.77–1.280.77–1.270.77–1.260.77–1.26
0.78–1.280.77–1.250.77–1.270.77–1.27
totPr (mm)239.7–497.5206.7–487.8205.8–558.7238.1–544.3
239.7–497.5199.3–480.9216.5–474.5264.5–556.7
maxDa (mm)41.2–105.0043.2–115.348.1–110.548.6–110.1
41.2–105.0038.7–105.442.6–116.547.9–132.3
nonPr (day)8–107–97–97–10
8–107–108–107–9
Publisher’s Note: MDPI stays neutral with regard to jurisdictional claims in published maps and institutional affiliations.