Article

Long-Term (1990–2013) Changes and Spatial Variations of Cropland Runoff across China

1
College of Environmental & Resource Sciences, Zhejiang University, Hangzhou 310058, China
2
Agriculture Ministry Key Laboratory of Healthy Freshwater Aquaculture, Key Laboratory of Fish Health and Nutrition of Zhejiang Province, Zhejiang Institute of Freshwater Fisheries, Huzhou 313001, China
3
Zhejiang Provincial Key Laboratory of Agricultural Resources and Environment, Zhejiang University, Hangzhou 310058, China
4
Ministry of Education Key Laboratory of Environment Remediation and Ecological Health, Zhejiang University, Hangzhou 310058, China
*
Author to whom correspondence should be addressed.
Water 2022, 14(18), 2918; https://doi.org/10.3390/w14182918
Submission received: 22 August 2022 / Revised: 10 September 2022 / Accepted: 13 September 2022 / Published: 17 September 2022
(This article belongs to the Section Hydrology)

Abstract

:
Quantitative information on regional cropland runoff is important for sustainable agricultural water quantity and quality management. This study combined the Soil Conservation Service Curve Number (SCS-CN) method and geostatistical approaches to quantify long-term (1990–2013) changes and regional spatial variations of cropland runoff in China. Estimated CN values from 17 cropland study sites across China showed reasonable agreement with default values from the National Engineering Handbook (R2 = 0.76, n = 17). Among four commonly used geostatistical interpolation methods, the inverse distance weighting (IDW) method achieved the highest accuracy (R2 = 0.67, n = 209) for prediction of cropland runoff. Using default CN values and the IDW method, estimated national annual cropland runoff volume and runoff depth in 1990–2013 were 253 ± 25 km3 yr−1 and 182 ± 15 mm yr−1, respectively. Estimated cropland runoff depth gradually increased from the drier northwest inland region to the wetter southeast coastal region (range: 2–1375 mm yr−1). Regionally, eastern, central and southern China accounted for 39% of the cultivated area and 53% of the irrigated land area and contributed to 68% of the national cropland runoff volume. In contrast, northwestern, northern, southwestern and northeastern China accounted for 61% of the cultivated area and 47% of the irrigated land area and contributed to 32% of the runoff volume. Rainfall was the main source (72%) of cropland runoff for the entire nation, while irrigation became the main source of cropland runoff in drier regions (northwestern and southwestern China). Over the 24-year study period, estimated cropland runoff depth showed no significant trends, whereas cropland runoff volume and irrigation-contributed percentages decreased by 7% and 35%, respectively, owing to implementation of water-saving irrigation technologies. To reduce excessive runoff and increase water utilization efficiencies, regionally specific water management strategies should be further promoted. As the first long-term national estimate of cropland runoff in China, this study provides a simple framework for estimating regional cropland runoff depth and volume, providing critical information for guiding developments of management practices to mitigate agricultural nonpoint source pollution, soil erosion and water scarcity.

1. Introduction

Excessive cropland runoff causes soil erosion, nutrient losses and decreased water utilization efficiency [1,2,3], thereby aggravating worldwide water resource shortages, soil degradation, aquatic eutrophication and decreased crop productivity [4,5]. Shortage of water resources, soil erosion/degradation and nonpoint source pollution are major challenges for agricultural sustainability at the global scale [6]. A quantitative understanding of regional cropland runoff depth and volume is critical for developing sustainable management measures for water and land resource utilization.
The Soil Conservation Service Curve Number (SCS-CN) method [7] is the most widely adopted approach for estimating soil runoff [8,9,10]. Due to its simplicity and low data requirements [11], many watershed hydrology and water quality models, such as CREAMS, AGNPS, EPIC and SWAT [12], adopt this method to predict runoff depth/volume [13]. The SCS-CN method estimates runoff from an expression for a rainfall-runoff curve that varies according to a single parameter, termed the curve number [8]. The CN value that represents soil infiltration capacity is a highly sensitive parameter [9,14], with a ±10% variation in the CN value leading to a −45% to +55% variation in estimated runoff depth [15]. The CN value is mainly affected by soil properties [15], land-use type [16], slope [17], antecedent moisture conditions [18], land management practices [14] and rainfall amount [19].
To extend the SCS-CN method in application, the USDA Soil Conservation Service developed the National Engineering Handbook (NEH) [20], which compiles the recommended CN values for different soil, climate and land management schemes based on monitoring data from 150 watersheds in the midwestern USA [7]. However, the recommended CN default values provided in the NEH may not be suitable for some sites or regions given its midwestern regional bias, e.g., Romanian River Basins [21] and southeastern Arizona [22]. Therefore, previous studies modified CN values by considering rainfall intensity [23], soil moisture [24] and slope [17]. A recent study reported the large difference of default CN values between that provided by USDA and revised CN values in China based on rainfall-runoff monitoring data, which may lead to huge errors in runoff estimation [19]. Several other studies suggested that the CN default values in the NEH should be modified by considering slope, soil moisture [25] and rainfall [26] based on field or catchment conditions to reduce the potential uncertainties in runoff estimation. However, the applicability of CN default values for estimating national cropland runoff in China has not been fully evaluated.
China is one of the most water-scarce countries (the water resources per capita level is only 25% of the world average [27]) with the agricultural sector consuming ~67% of total water withdrawals [28]. Although advanced irrigation technologies have been gradually applied [29], the utilization efficiency of agricultural water resources remains at a low level. For example, 55% of Chinese provinces had agricultural water resource efficiencies less than 0.6 [30]. As a result, many regions of China produce excessive cropland runoff and, consequently, serious soil and nutrient losses [31,32]. Accurate quantitative information concerning cropland runoff depths/volumes, sources (e.g., rainfall and irrigation) and their long-term variations is required for optimizing water management practices, which is essential for improving agricultural water resource use efficiency and mitigating nonpoint source nutrient pollution.
This study combined the SCS-CN method and geostatistical techniques to estimate long-term (1990–2013) and regional variations of cropland runoff derived from rainfall and irrigation across the diverse landscapes and climates in China. The primary objectives of this work were to (1) evaluate the applicability of the SCS-CN method combined with geostatistical methods for assessment of cropland runoff at the national/regional scales; (2) address spatial patterns of cropland runoff depth/volume; and (3) estimate historical trends (1990–2013) of national cropland runoff depth/volume. As the first estimation of long-term and spatial cropland runoff dynamics in China, this study provides critical knowledge for guiding the development of sustainable agricultural and water resource management strategies, and also provides a simple framework for validating CN values and estimating cropland runoff at the regional scale.

2. Materials and Methods

2.1. Data Resources

To estimate cropland runoff across China from 1990 to 2013, we collected data concerning rainfall-runoff of monitoring sites (used for estimated CN values), soil properties, land use, rainfall, irrigation and cultivated land area from relevant sources. Rainfall–runoff data from 19 monitoring sites (13 experimental plots and 6 watersheds) in 6 geographical regions of China were collected from published papers and the Chinese Ecosystem Research Network (Table 1). Soil texture and 1 km land-use data for croplands were obtained from the Chinese Academy of Sciences Resource and Environmental Science Data Center (http://www.resdc.cn/ accessed on 16 September 2022). Daily rainfall data were derived from the China meteorological network (http://data.cma.cn/ accessed on 16 September 2022). Annual irrigation data (Table S1) were obtained from Zhou et al. [29] and the China Water Resources Bulletin (http://www.mwr.gov.cn/sj/tjgb/szygb/ accessed on 16 September 2022). Cultivated land area was acquired from the Chinese Academy of Sciences Resource and Environmental Science Data Center (http://www.resdc.cn/ accessed on 16 September 2022) and statistical yearbooks (http://www.stats.gov.cn/tjsj/ndsj/ accessed on 16 September 2022). Annual cropland irrigated area was derived from the China Water Conservancy Yearbook (https://navi.cnki.net/knavi/yearbooks/YAGUJ/detail accessed on 16 September 2022) and Wang et al. [33].

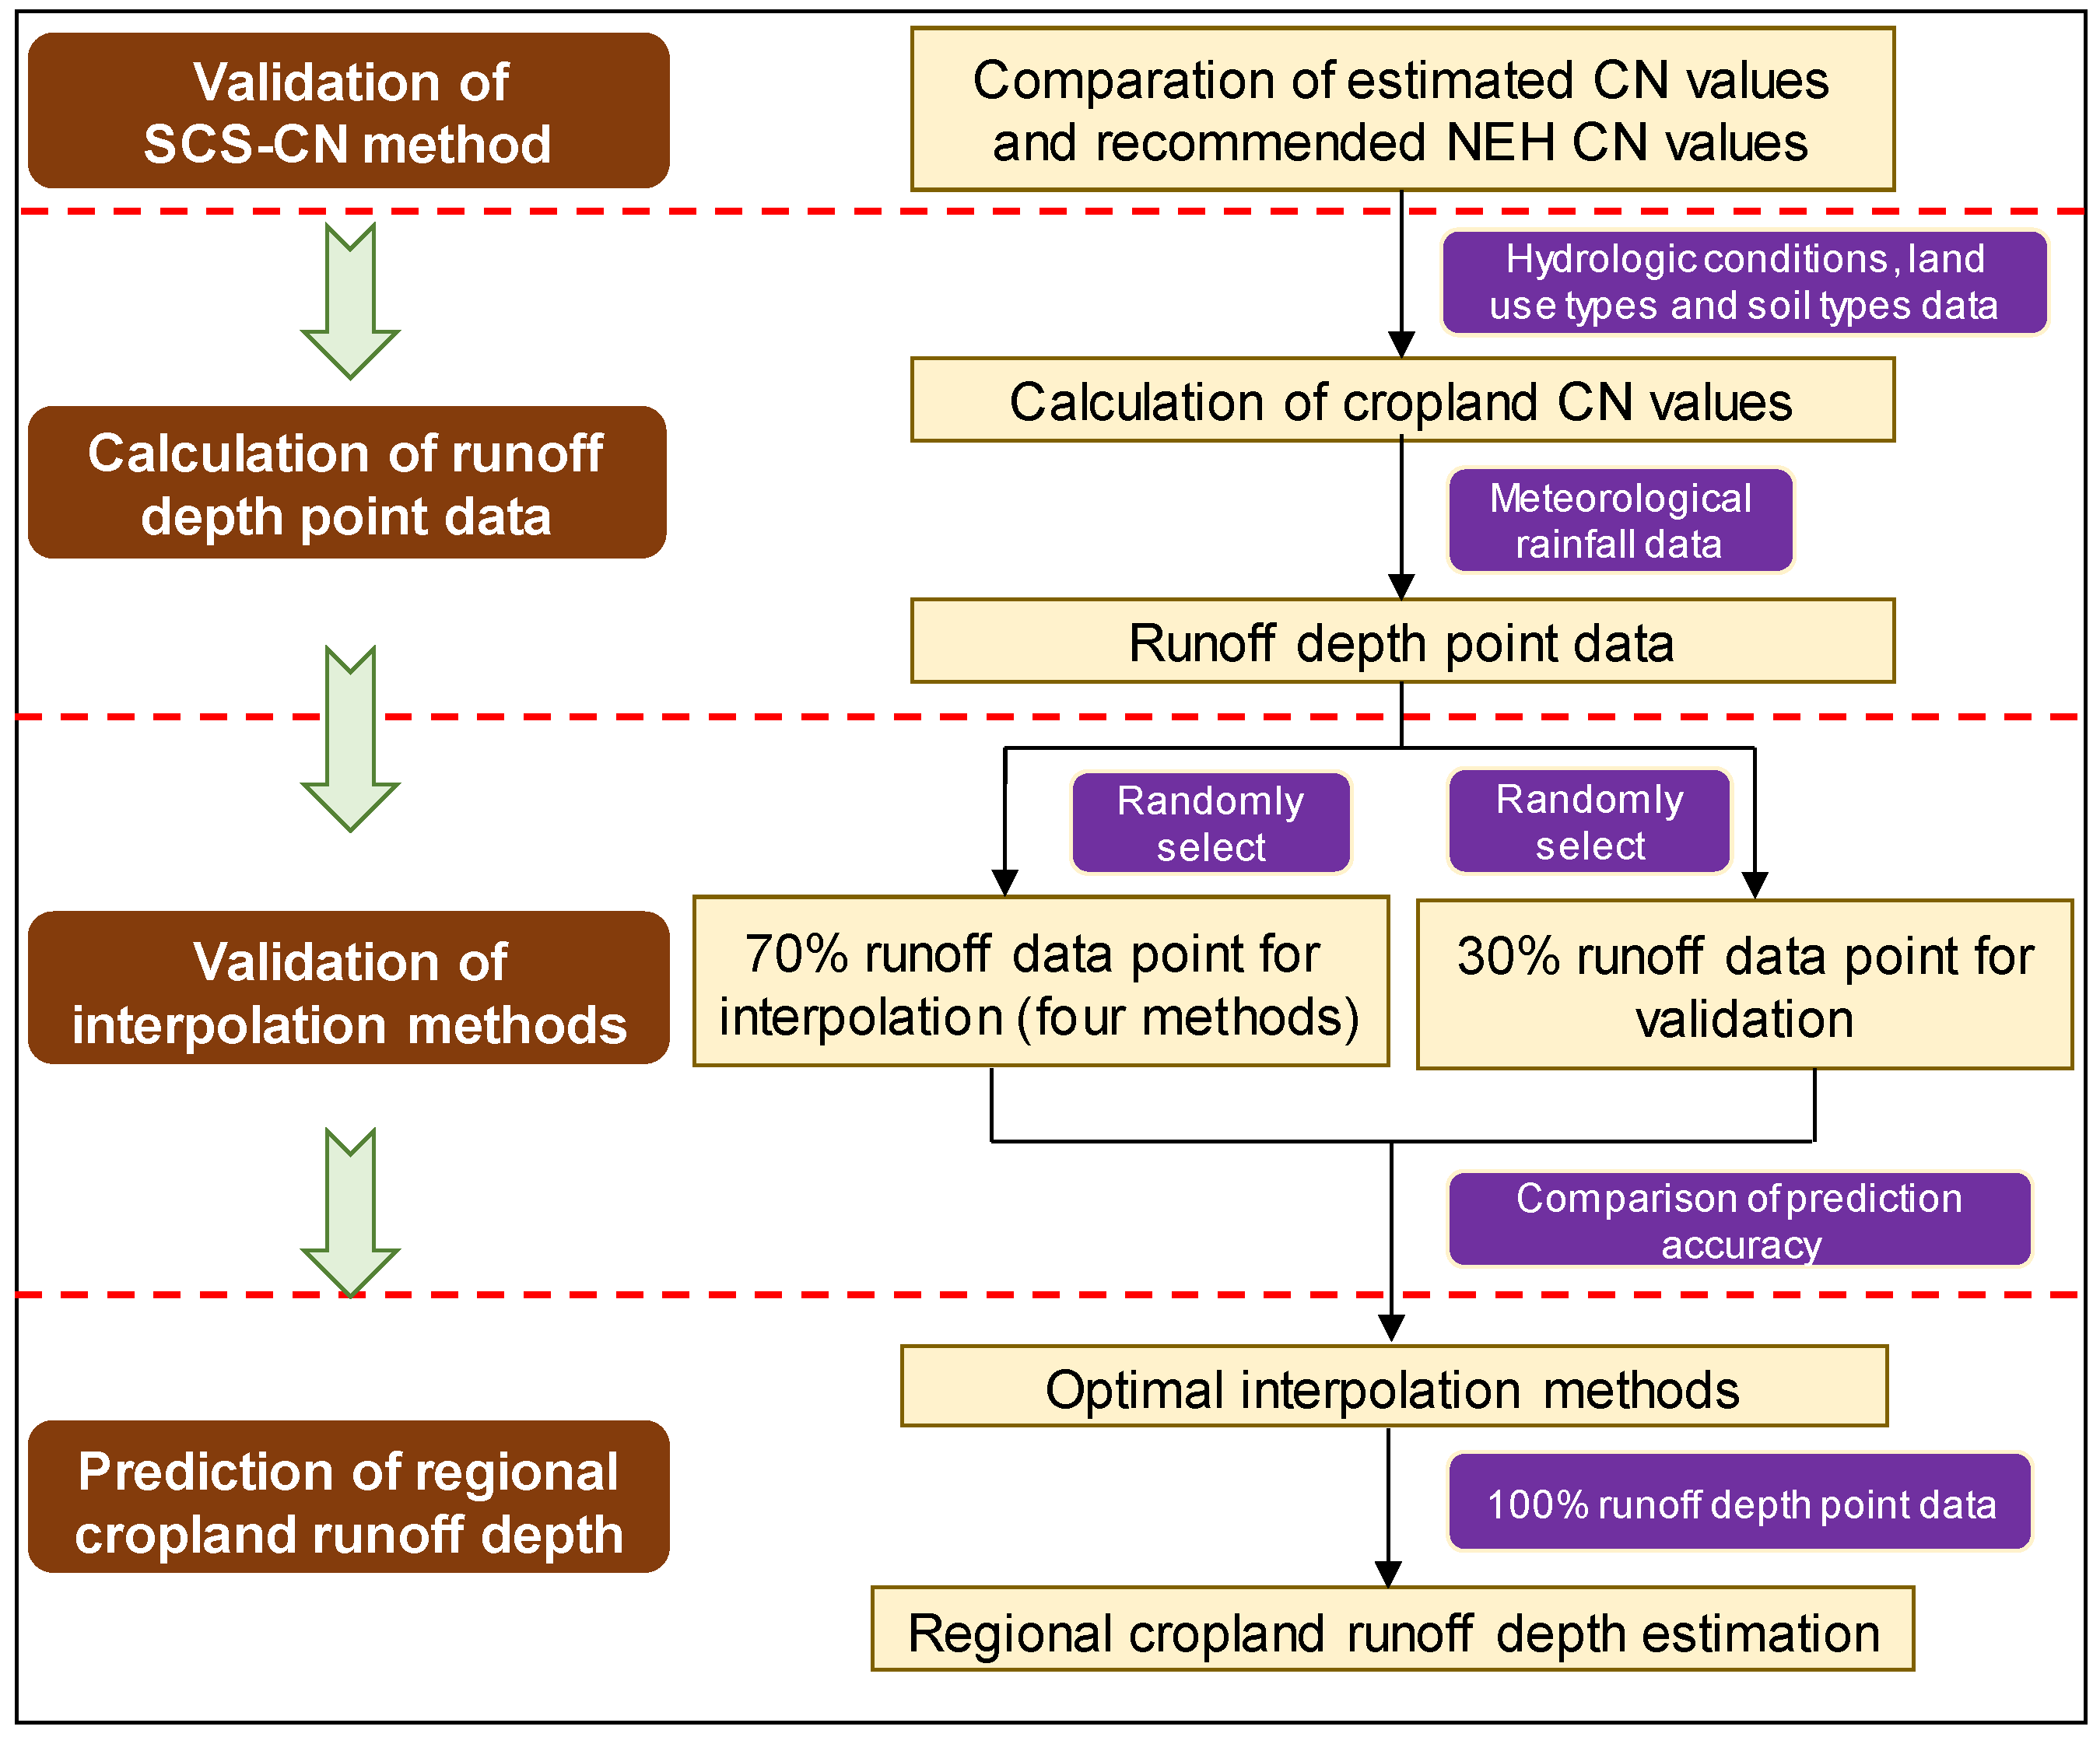
2.2. Framework for Cropland Runoff Depth Estimation

This study developed a framework that combined the SCS-CN method with geostatistical techniques to estimate regional cropland runoff (Figure 1). First, we validated the applicability of the SCS-CN method for cropland runoff estimation in China by evaluating the goodness of fit between estimated CN values from specific field experiments and default CN values from the NEH. Second, we generated cropland runoff depths using the CN value map (Figure S1) and available data for rainfall and irrigation. Third, we determined the optimal geostatistical interpolation method for cropland runoff estimation based on the goodness of fit for four interpolation schemes. Finally, we combined the SCS-CN method and optimal spatial interpolation method to predict spatially explicit runoff depths across China.

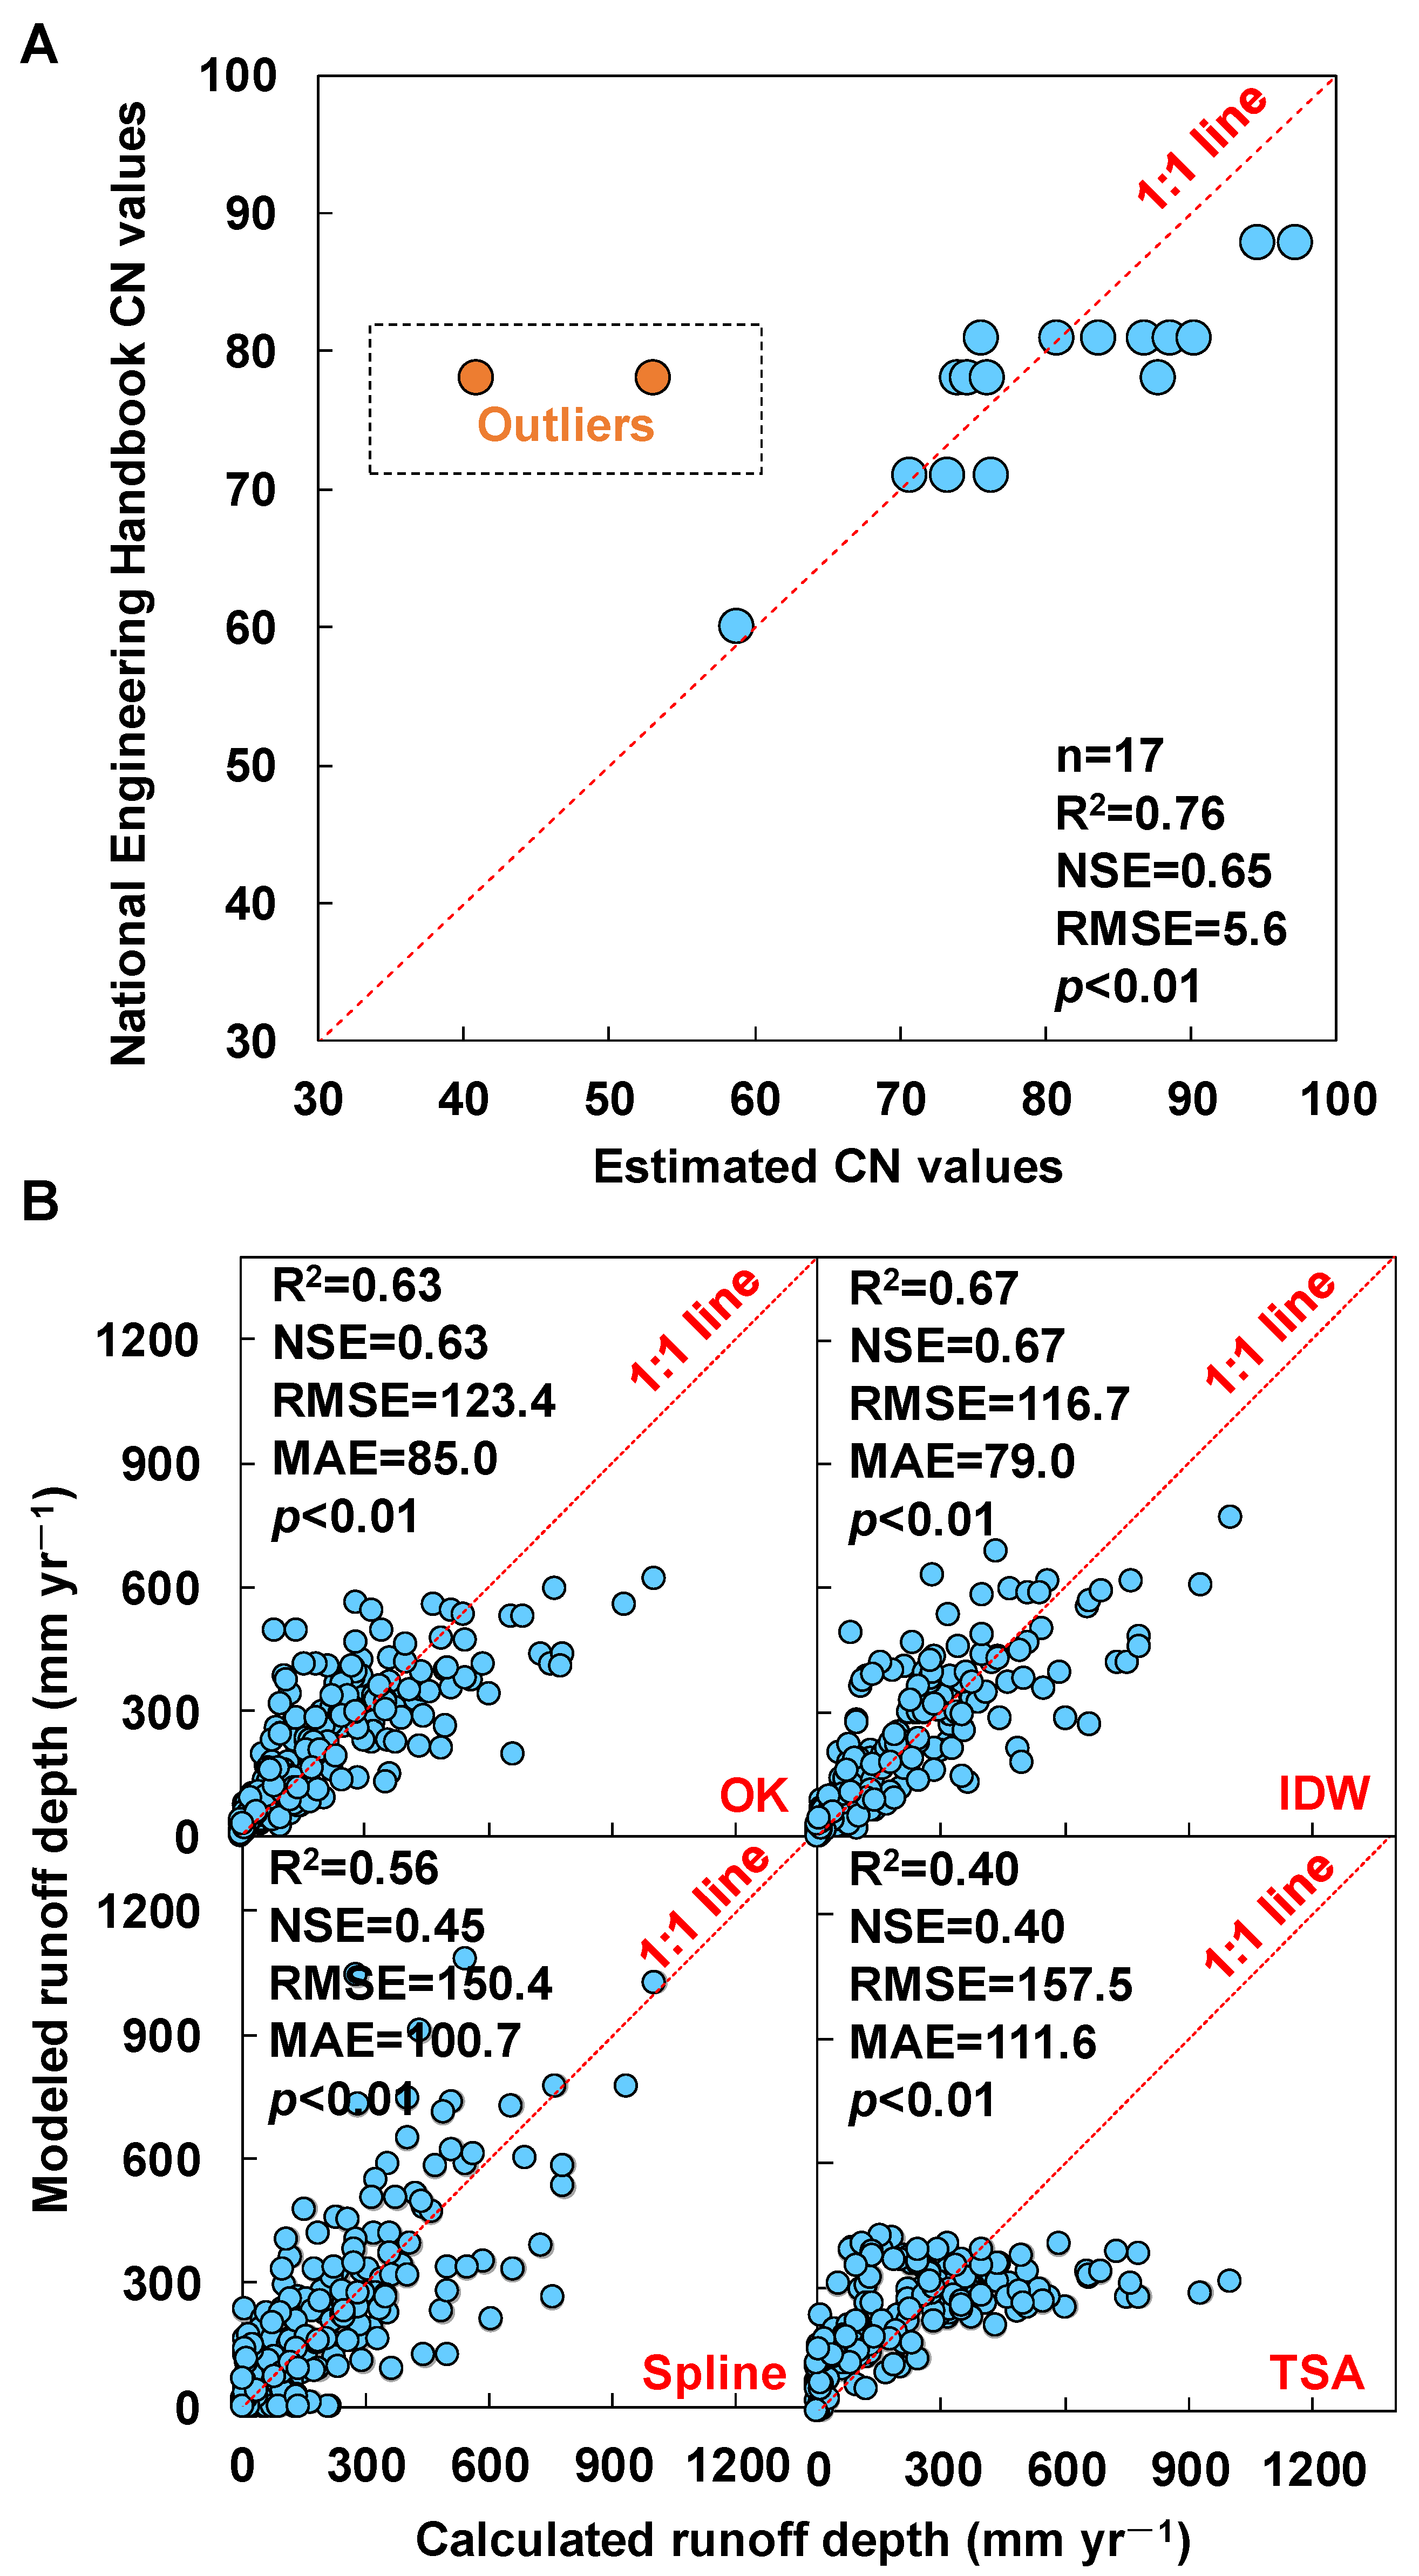
2.2.1. Validation of the SCS-CN Method

The SCS-CN method [7] is based on the water balance equation and two fundamental hypotheses. The first hypothesis is that the ratio of direct runoff to the maximum potential runoff is equal to the ratio of the amount of actual infiltration to the potential maximum retention. The second hypothesis states that the amount of initial abstraction is some fraction of the potential maximum retention [47]. The cure number and runoff depth (Q, mm) can be estimated as follows:
C N = 25,400 S + 254
Q = P λ S 2 P λ S + S P λ S 0 P λ S
where CN is a dimensionless parameter ranging from 0 to 100 (higher CN values indicate a greater potential for surface runoff); S is the potential maximum retention or infiltration (mm); P is the daily rainfall depth (mm); and λ is the initial abstraction coefficient that was empirically treated as a constant value of 0.2. Additionally, CN values were based on one of three antecedent soil moisture conditions: CN I-dry, CN II-average and CN III-wet [48]. To evaluate the suitability of the SCS-CN method for cropland runoff estimation in China, we compared the default CN values in the NEH with estimated CN values from specific field experiments (Table 1). Nash–Sutcliffe Efficiency (NSE), root mean squared error (RMSE) and R-squared (R2) metrics were used to evaluate the goodness of fit.

2.2.2. Comparison of Geostatistical Methods

Four common geostatistical methods were evaluated for the spatial interpolation of cropland runoff: (1) inverse distance weighting (IDW), (2) ordinary kriging (OK), (3) spline and (4) trend surface analysis (TSA) [49]. IDW assumes that each measurement point has a regional influence that decreases with distance. Thus, the closer a point is to the center of the site to be estimated, the higher the weight given by IDW. Like IDW, kriging gives the closest donor the highest weight. However, kriging is more sophisticated than IDW in that kriging weights come from a semivariogram with an assumption that the spatial variation is homogeneous across the surface. Among various forms of kriging, OK has been widely demonstrated as a reliable estimation method. The spline interpolation method estimates runoff for an ungauged catchment by fitting a minimum-curvature surface to the calibration data. It resembles a flexible plastic sheet passing through each data point, but otherwise bending as little as possible. The TSA (polynomial regression) is a deterministic interpolation method utilizing a polynomial fit to georeferenced data through a multiple regression process between observed values and geographic locations.
To select the best interpolation method for cropland runoff estimation, we split the available data sets (n = 697) into two parts; 70% were randomly selected for model calibration and the remaining 30% were used for validation. We used ArcGIS (10.2) to extract the predicted runoff depth from interpolated results, then compared it with the calculated runoff depth (validation data set) to evaluate the goodness of fit for the predictions. The NSE, RMSE, R2 and mean absolute error (MAE) [50] were used to evaluate the goodness of fit for the different interpolation methods [51]. This validation scheme overcomes the limitation of cross-validation techniques that often suffer from the lack of independence [52].

2.2.3. National Cropland Runoff Estimations

Based on default CN values in the NEH and daily rainfall data, the daily rainfall-runoff depth for croplands in China was estimated. We summed the daily rainfall-runoff depth to calculate the annual rainfall-runoff depth. We then used the best spatial interpolation method to predict the annual regional rainfall-runoff depth. According to regional crop irrigation information (irrigation amount, irrigation date and frequency, etc. [53,54], Table S1), we estimated the daily irrigation-runoff depths for crops during the growing season. Runoff volume is the sum of rainfall- and irrigation-contributed volumes, in which the rainfall-runoff volume was equal to the product of the rainfall-runoff depth and the cultivated land area (similarly, irrigation-runoff volume is equal to the product of rainfall-runoff depth and irrigated land area). For regionally explicit spatial analysis, China was divided into seven geographical regions, i.e., northern China (NC), northeast China, eastern China (EC), central China (CC), southern China (SC), southwest China (SWC) and northwest China (NWC).

2.3. Statistical Analyses

The temporal trends of annual runoff depth, runoff volume, irrigation contribution, cultivated area and irrigated area were determined with linear least-squares regression analyses using SPSS (ver. 17.0, SPSS, Chicago, IL, USA). One-way ANOVA with a least-significant difference (LSD) multiple comparisons test were performed using SPSS (ver. 17.0, SPSS, Chicago, IL, USA) to assess differences in runoff depth among different land uses, components, as well as across seven geographic regions. Spatial interpolation and raster calculation of runoff depth were performed using ArcGIS software (ver. 10.2, ESRI, Redlands, CA, USA). All graphs were generated using Excel 2017 (Microsoft, Inc., Redmond, Washington, DC, USA) and Prism 8.0 (GraphPad Software, Inc., San Diego, CA, USA).

3. Results and Discussion

3.1. Performance of the SCS-CN and Geostatistical Methods

Estimated CN values from the 17 experimental plots and catchments in China demonstrated satisfactory agreement with the default CN values from the NEH [7] with an R2 value of 0.76 (Figure 2A). For this analysis, two data points that used monthly rather than daily rainfall-runoff data were excluded due to their outlier status. Differences between the estimated and default CN values ranged from –5.4 to 9.9, with an RMSE of 5.6. The runoff monitoring data used to estimate CN values in this study were collected from 6 geographical regions (Table 1) representing nearly all major soil types, crop types, slopes, climate and ancillary attributes of China’s croplands. Thus, the default CN values in the NEH were deemed suitable for cropland runoff estimation in China.
Among the four spatial interpolation methods evaluated, the IDW (with a value of 2 for the power parameter, Figure S2) performed best with an R2 of 0.67 and RMSE of 116.7 mm yr−1. In contrast, the TSA method provided the poorest metrics with an R2 of 0.40 and RMSE of 157.5 mm yr−1 (Figure 2B). The better performance of the distance-based IDW and OK methods (Figure 2B) indicated that runoff depth was strongly influenced by its migration distance [55], which may be related to the high spatial heterogeneities in climate, topography and farming practices. The IDW method provided a lower runoff bias than the OK method (Figure 2B), indicating that the more complex method failed to provide a higher accuracy [56]. The poor performances (i.e., lower R2 and NSE values) of the TSA and the Spline methods (Figure 2B) in predicting national cropland runoff depths might be related to the assumptions of monotonic or continuous spatial distribution trends of estimated variables in these methods. In general, regional cropland runoff depths showed non-monotonic or discontinuous spatial distribution trends due to the mixed influence of multiple factors (e.g., irrigation, soils, terrain, etc.) [10]. In addition, the sparse sampling density (~19,700 km2 per sampling point) in this study aggravates the uncertainties to predict non-monotonic or discontinuous spatial distribution trends of national cropland runoff depths using the TSA or Spline methods [57].
Considering its highest prediction accuracy, the IDW method was subsequently used for spatial interpolation of cropland runoff depths across different time scales. Similar to precipitation prediction results [58], prediction accuracies for runoff depth showed significantly (p < 0.05) increasing trends with increasing time scales (Figure S3). This indicates that, as the time scale decreases, the spatial autocorrelation of precipitation data also decreases [59]. Considering its superior prediction accuracy (R2 = 0.69, NSE = 0.69), the yearly scale for runoff depth point data was used for regional cropland runoff predictions.

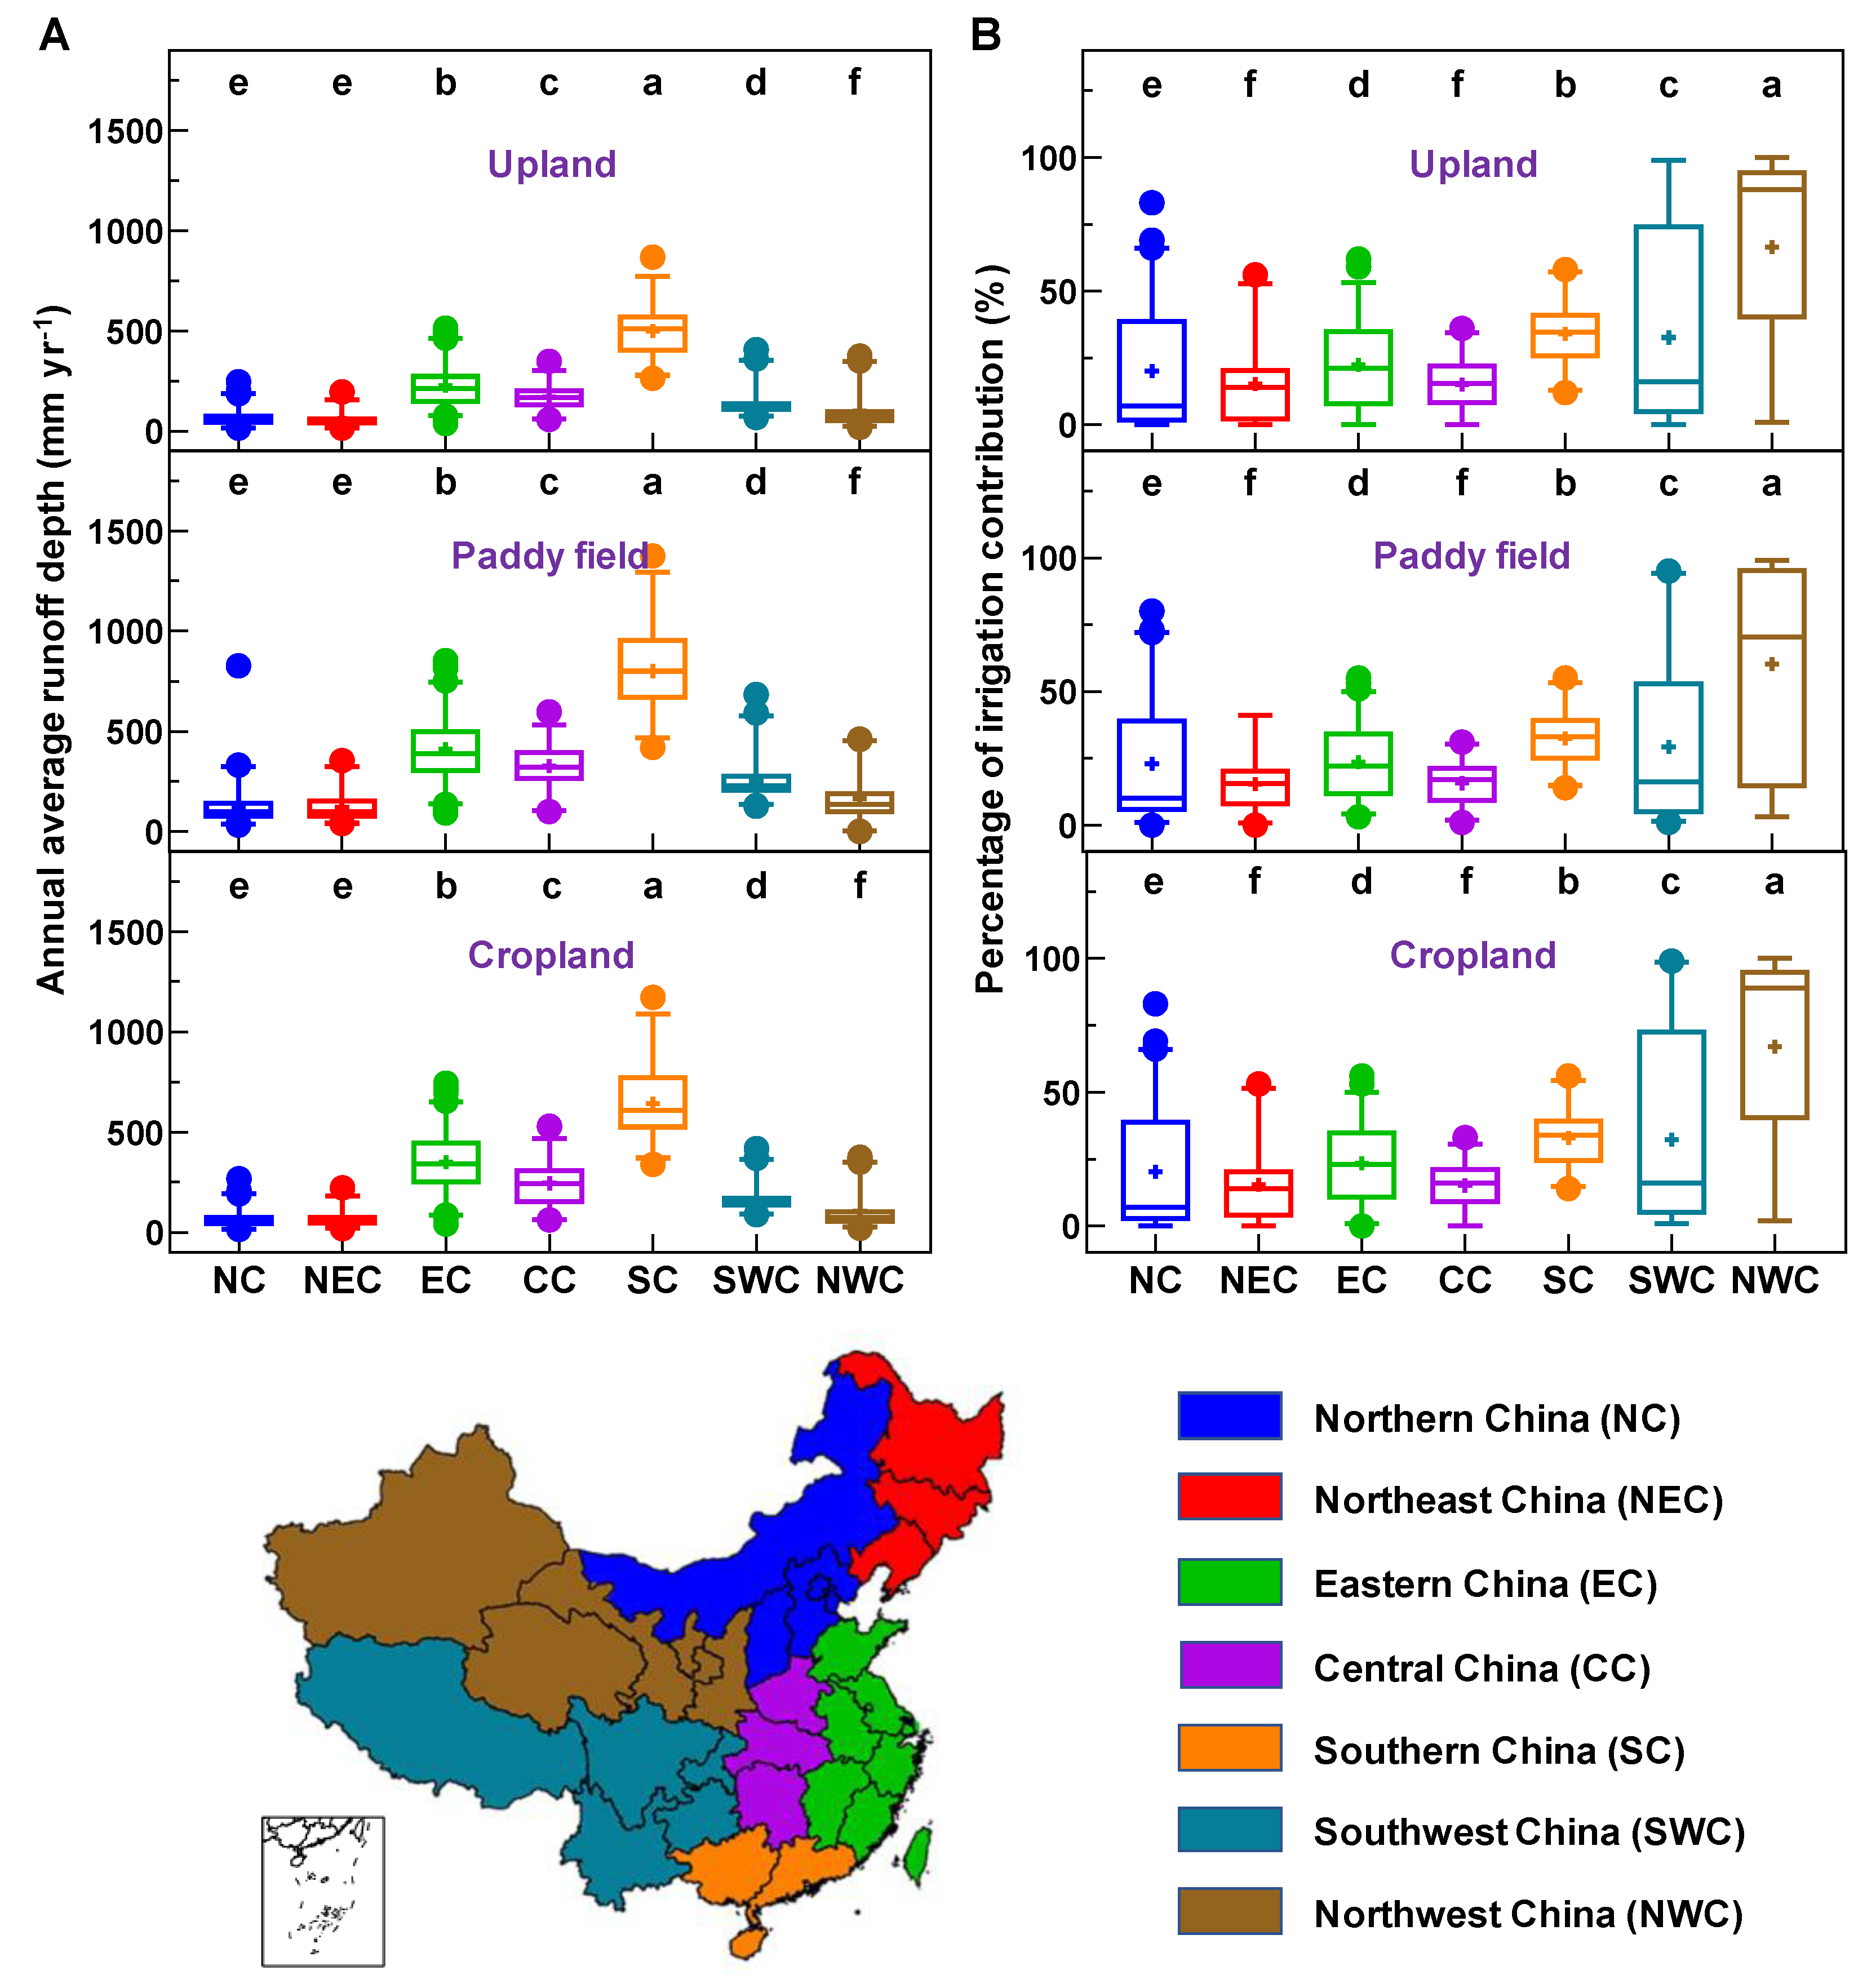
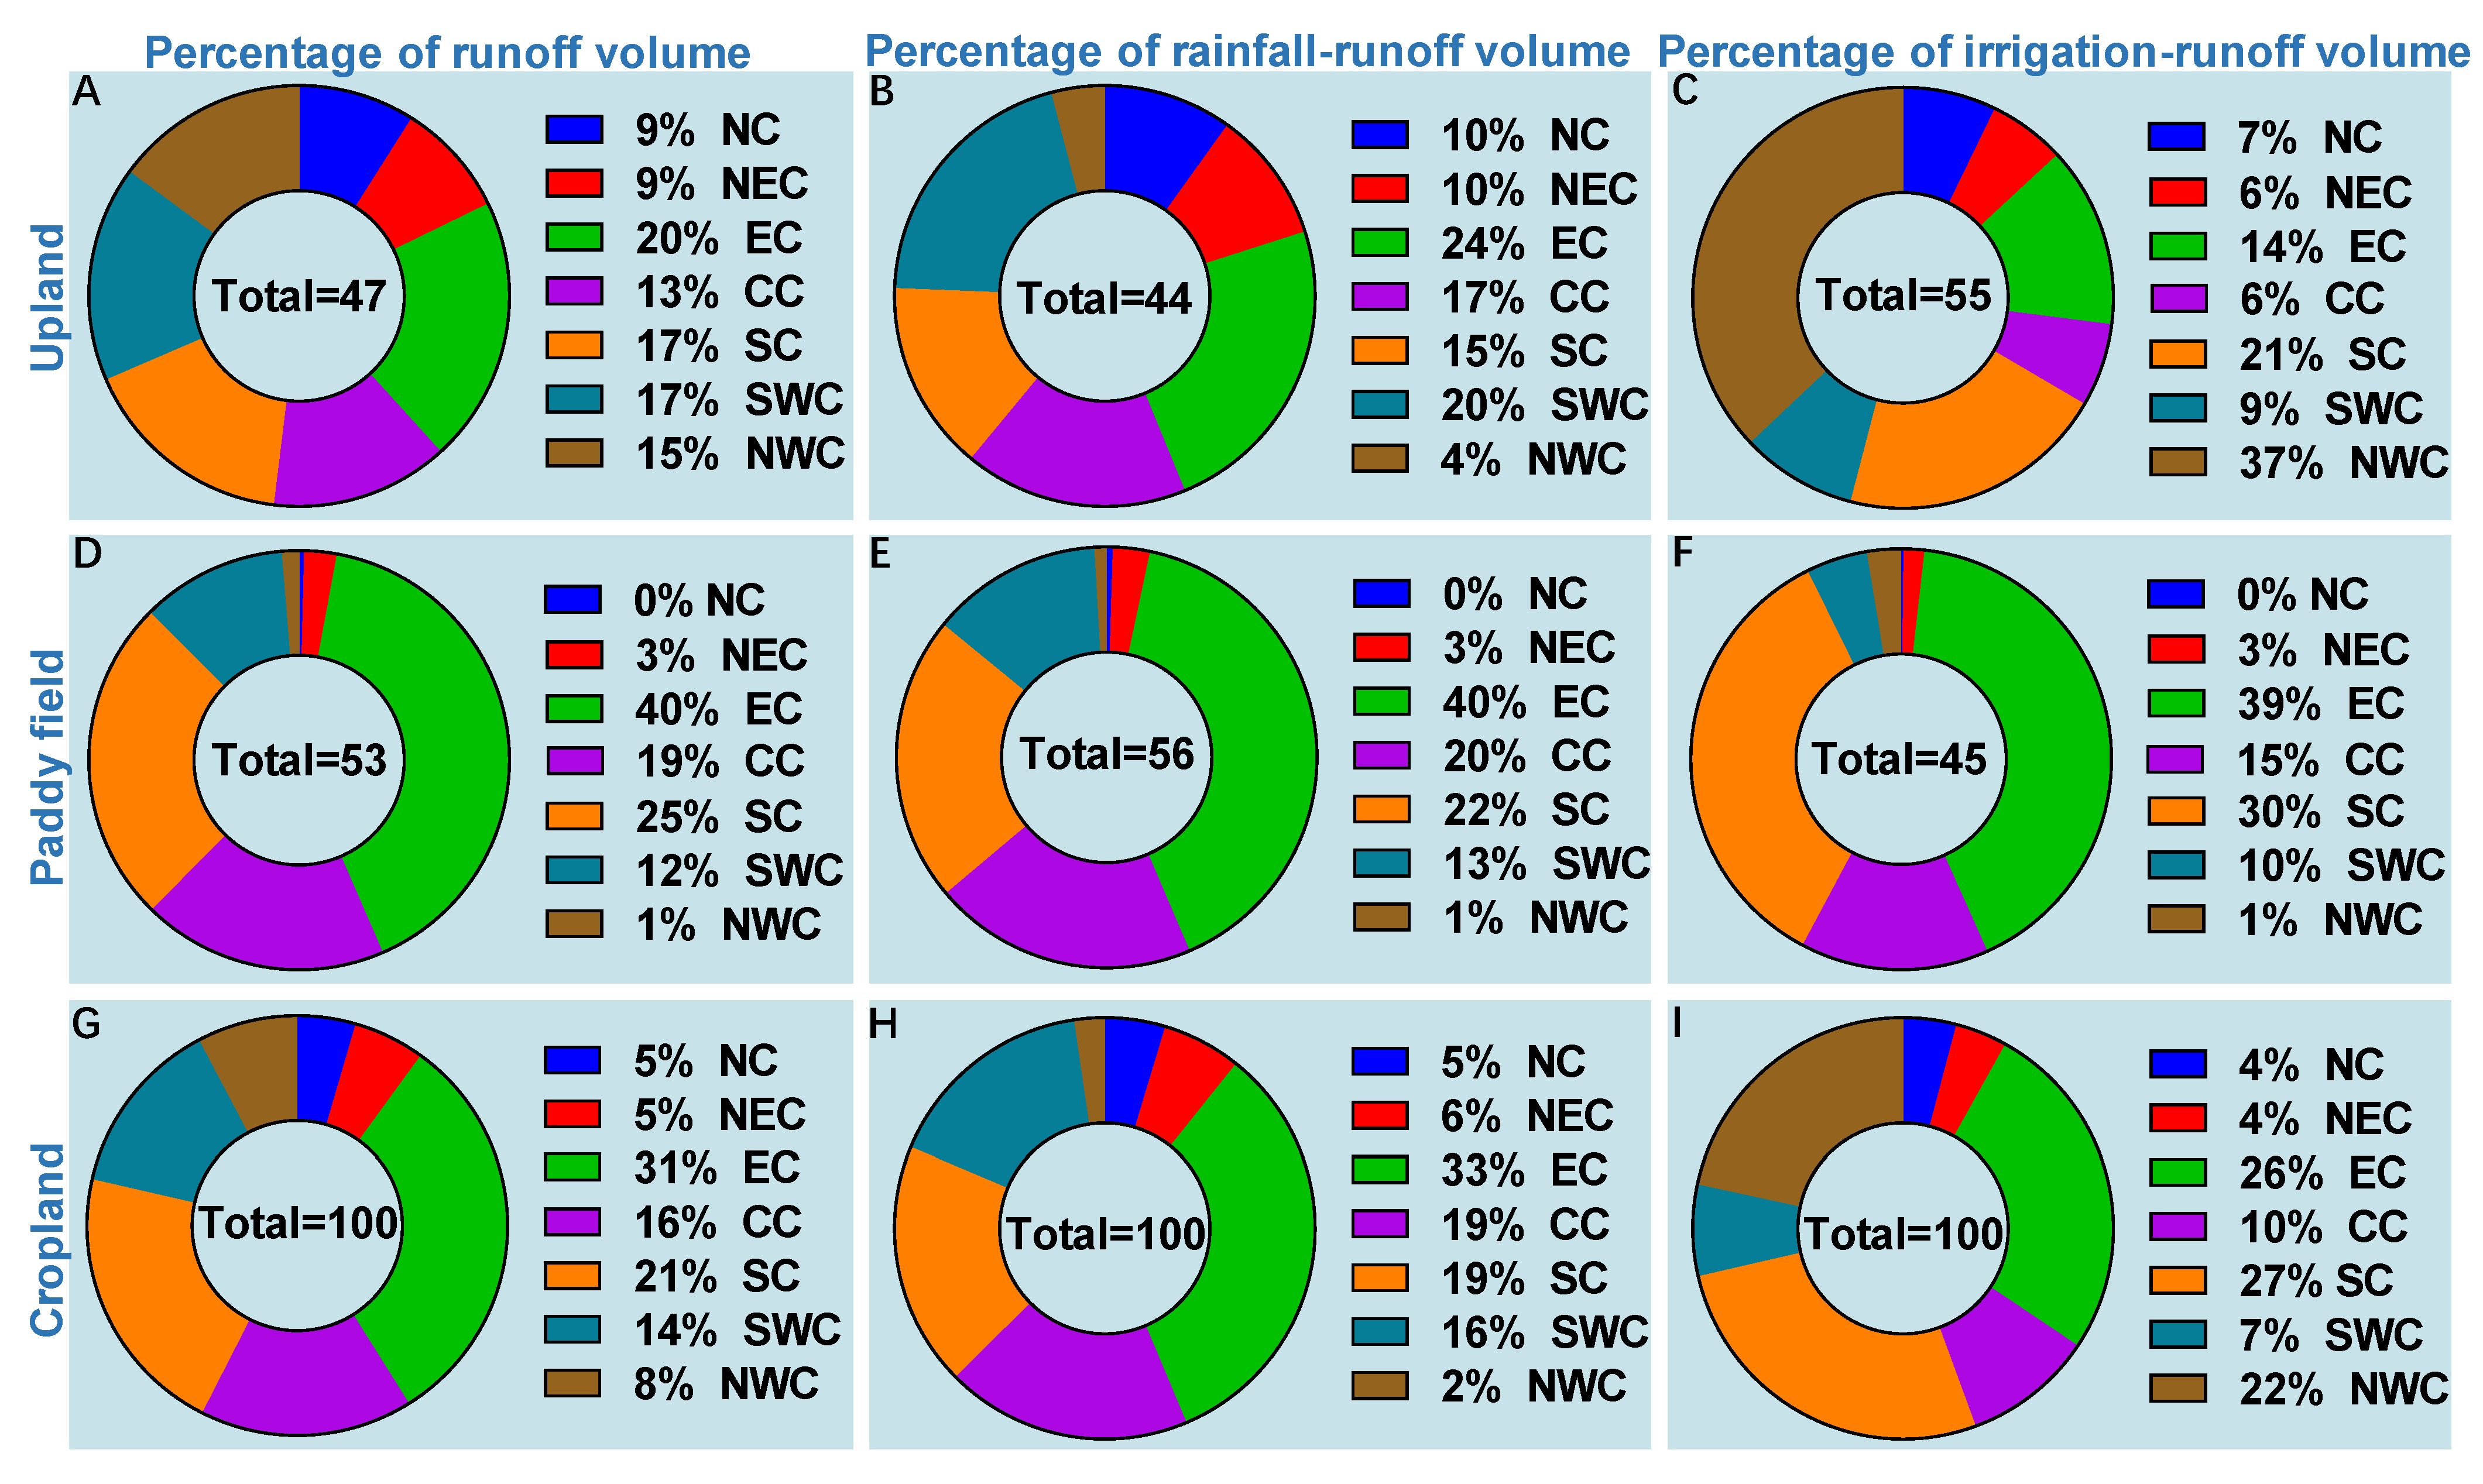
3.2. Spatial Patterns of National Cropland Runoff

Using default CN values from the NEH and the IDW method, estimated national average cropland runoff depth (Mean ± SD) was 182 ± 15 mm yr−1 from 1990 to 2013. Due to the high rainfall associated with paddy fields distributed in the wetter regions (i.e., EC, CC, SC and SWC [60]), estimated paddy field runoff depth (370 ± 35 mm yr−1) was ~3.2-fold higher than that of upland agricultural lands (Figure S4A). Comparing cropland runoff sources (precipitation vs. irrigation, Figure S4B), the rainfall-runoff depth (131 ± 15 mm yr−1) was significantly (p < 0.01) higher than the irrigation-runoff depth (51 ± 4 mm yr−1). Our estimated rainfall-runoff depth (131 ± 15 mm yr−1) was within the range (67 to 203 mm yr−1) reported in previous studies [61,62], providing a measure of validation for our results.
Estimated cropland runoff depth (upland: 16–869 mm yr−1; paddy field: 2–1375 mm yr−1) varied by one to three orders of magnitude across all provinces in China (Figure 3A). Estimated cropland runoff depth gradually increased from the drier northwest inland to the wetter southeast coast (Figure 3A) due to the spatial distribution of rainfall [60]. As such, the estimated cropland runoff depths in the EC, CC and SC regions were much higher than the national average, with Guangdong (812 ± 141 mm yr−1), Guangxi (481 ± 77 mm yr−1) and Hainan (638 ± 101 mm yr−1) having the highest cropland runoff depths. The high cropland runoff depths (Figure 3A) in the EC, CC and SC regions were attributed to the high rainfall and low agricultural water-use efficiency (0.53 ± 0.09 in 2000–2015, Wang et al. [30]). Due to high cropland runoff depths (Figure 3A), the EC, CC and SC regions were identified as potential hotspots for cropland nutrient losses in China [2,63].
Conversely, estimated cropland runoff depths in the drier NC, NEC and NWC regions were much lower than the national average, with Shanxi (32 ± 10 mm yr−1) and Inner Mongolia (39 ± 16 mm yr−1) having the lowest cropland runoff depths (Figure 3A). Low rainfall [60] and low CN values (Figure S1) due to low antecedent soil moisture conditions were the major causes of limited cropland runoff in these drier regions [64]. However, low vegetation coverage, high slopes and low agricultural water-use efficiency (0.30 ± 0.23 from 2000 to 2015, Wang et al. [30]) in the NWC region make this area a hotspot for soil erosion in China [3]. Although there was high agricultural water-use efficiency (0.63 ± 0.13 from 2000 to 2015, Wang et al. [30]) in the NC and NEC regions (the major grain production area in China [65]), water scarcity is a critical risk in this region [66]. Therefore, it is strongly warranted to avoid unnecessary cropland runoff and increase agricultural water-use efficiency in the NC, NEC and NWC regions.
Annual average national cropland runoff volume estimated from the cultivated area and runoff depth was 253 ± 25 km3 yr−1 with 120 ± 15 km3 yr−1 from upland crops and 133 ± 14 km3 yr−1 from paddy fields. Although paddy fields and irrigated areas accounted for ~1/3 of the upland area (Figure S5B,D), the total paddy field (Figure 4D) runoff volume was 11% higher than that in the uplands (Figure 4A). The EC, CC and SC regions accounted for 39% of the cultivated area (Figure S5E) and 53% of the irrigated area (Figure S5F) and resulted in a 68% contribution to the national runoff volume (Figure 4G). In contrast, the NC, NEC, SWC and NWC regions accounted for 61% of the cultivated area (Figure S5E) and 47% of the irrigated area (Figure S5F), but contributed only 32% of the total national runoff volume (Figure 4G).
In terms of runoff components, estimated rainfall- and irrigation-runoff volumes were 182 ± 22 km3 yr−1 and 81 ± 8 km3 yr−1, respectively. Although rainfall was the main source (72%) of cropland runoff for the entire nation, irrigation was the main source of cropland runoff in regions with lower runoff depths (NWC and SWC, Figure 3B). This implies a complementary relationship between water inputs from irrigation and rainfall [67]. The EC, CC, SC and SWC regions accounted for 87% of total cropland rainfall-runoff volume (Figure 4H) owing to their higher rainfall [60]. Notably, despite the high rainfall in the SC region, irrigation still contributed to more than 20% of cropland runoff volume (Figure 3B), which was ascribed to the large irrigation requirements to support the multi-cropping systems (2–3 crop types grown per year) [68].

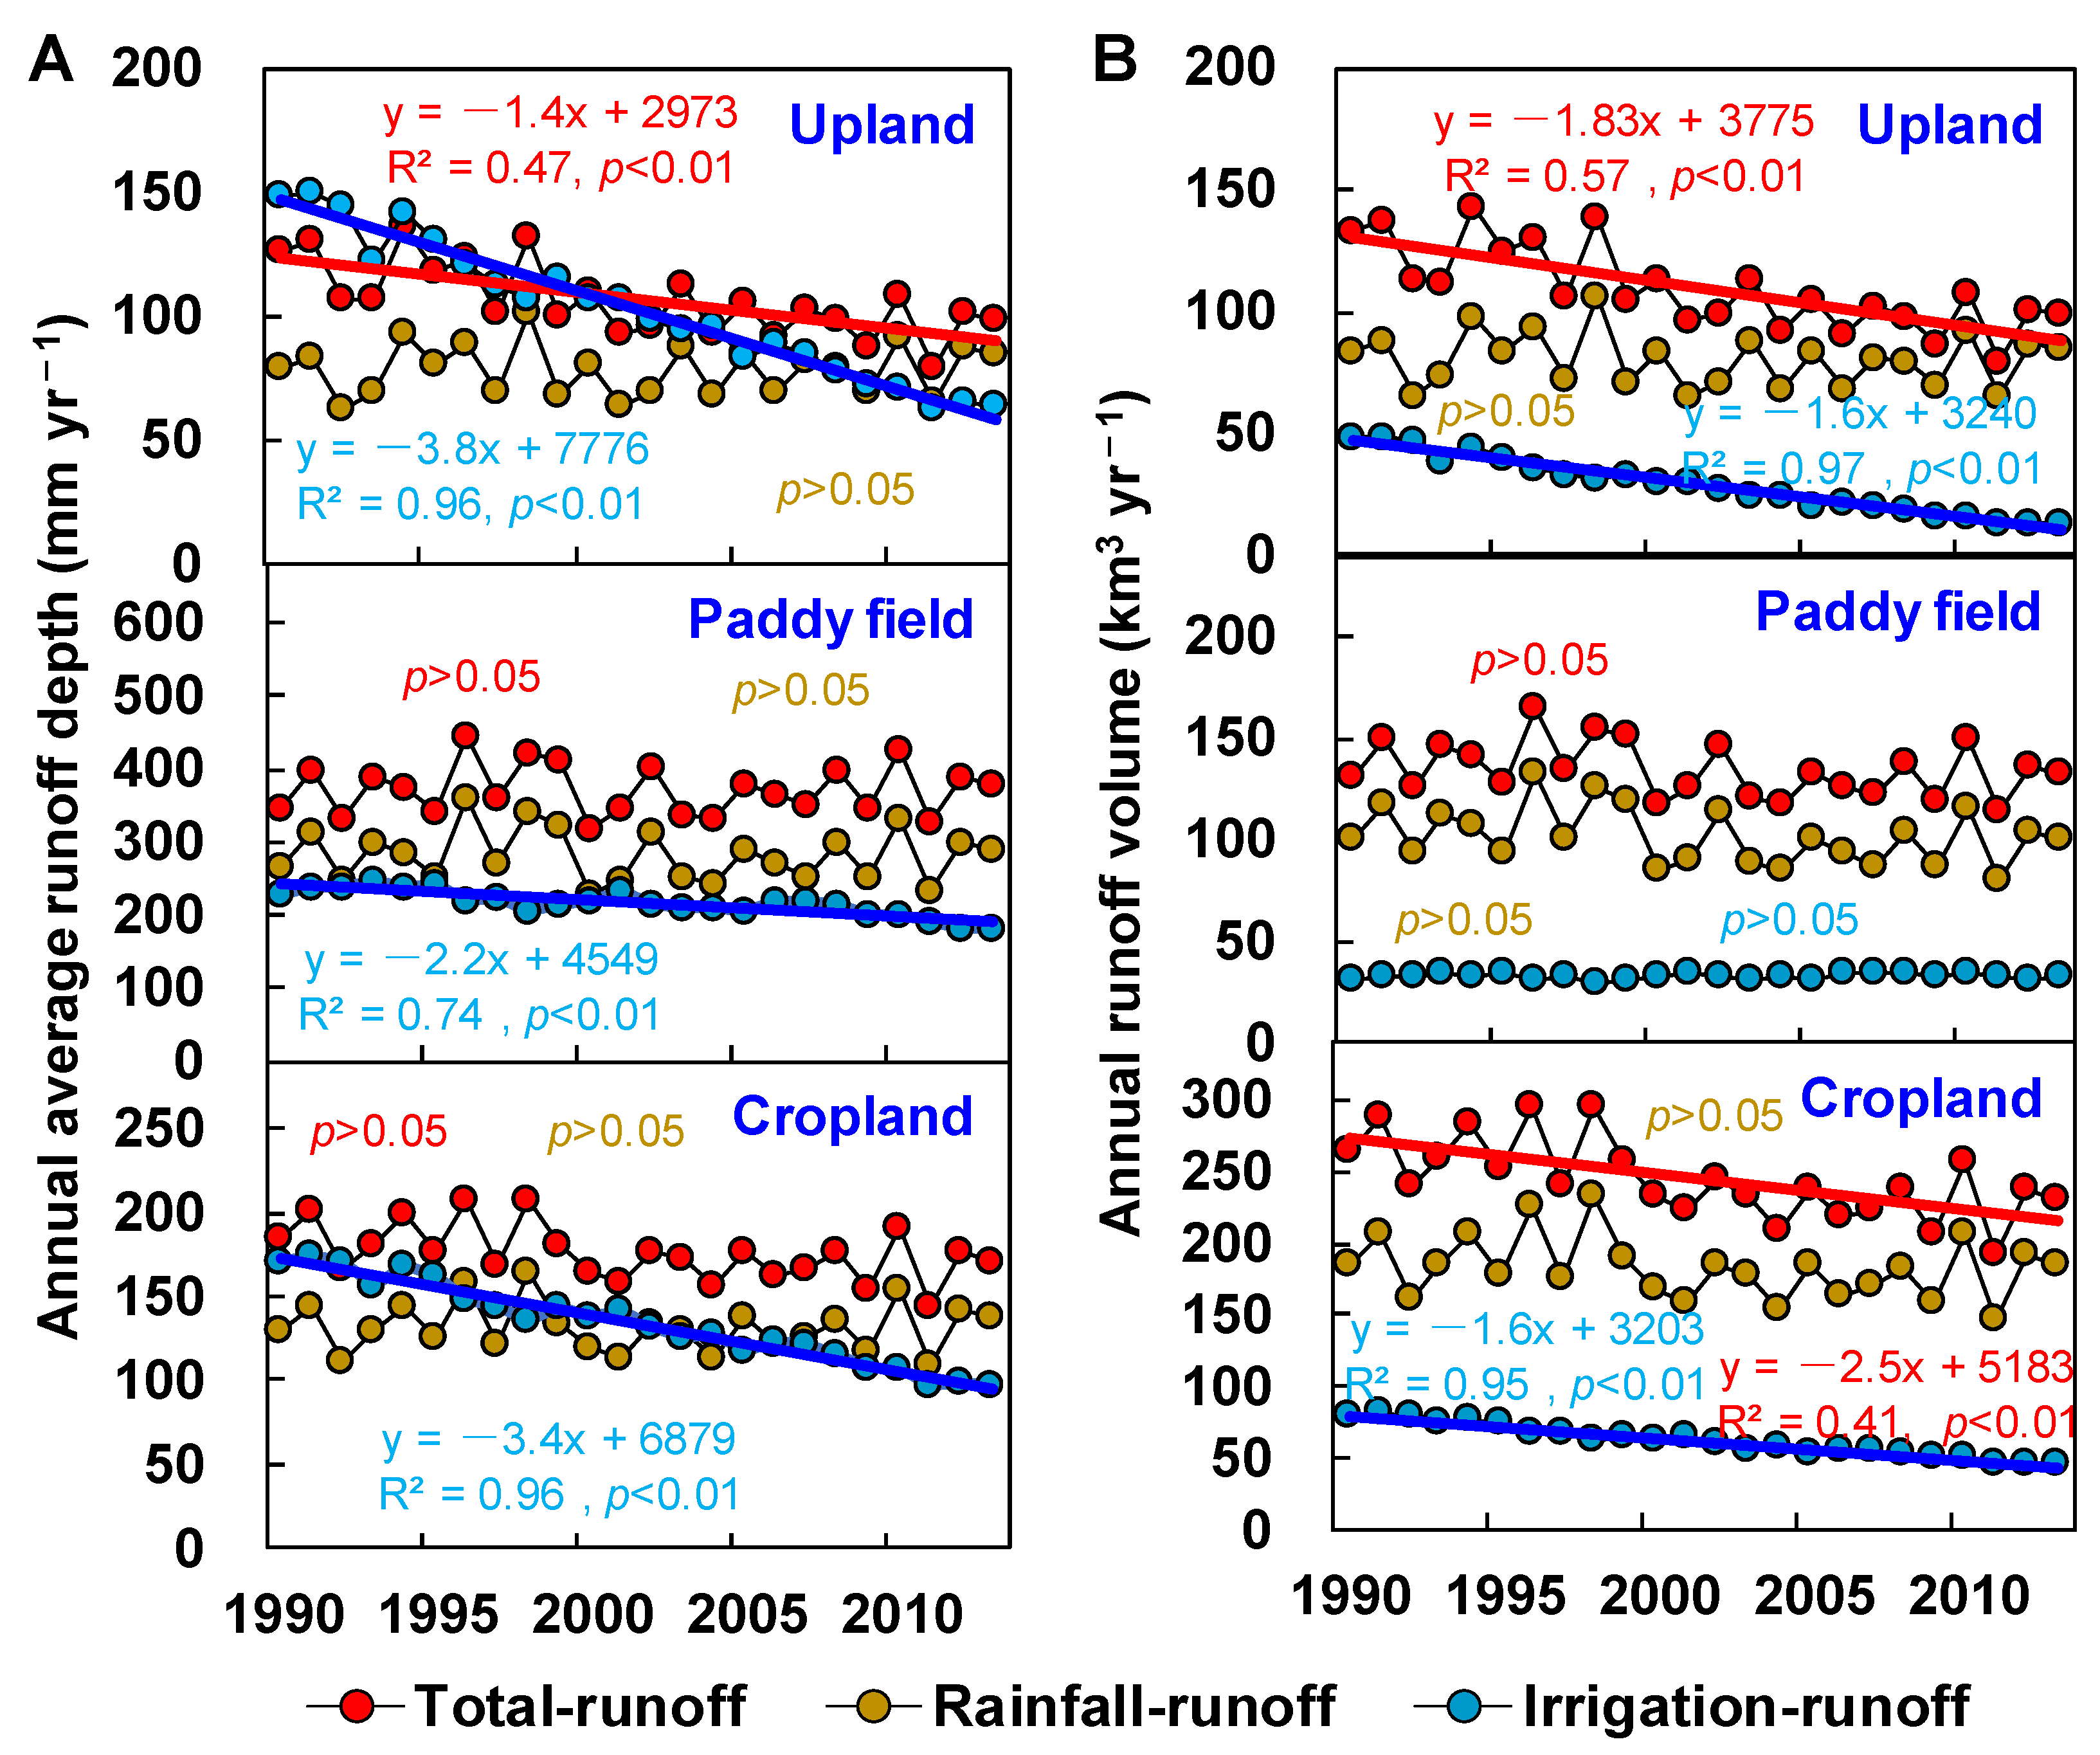
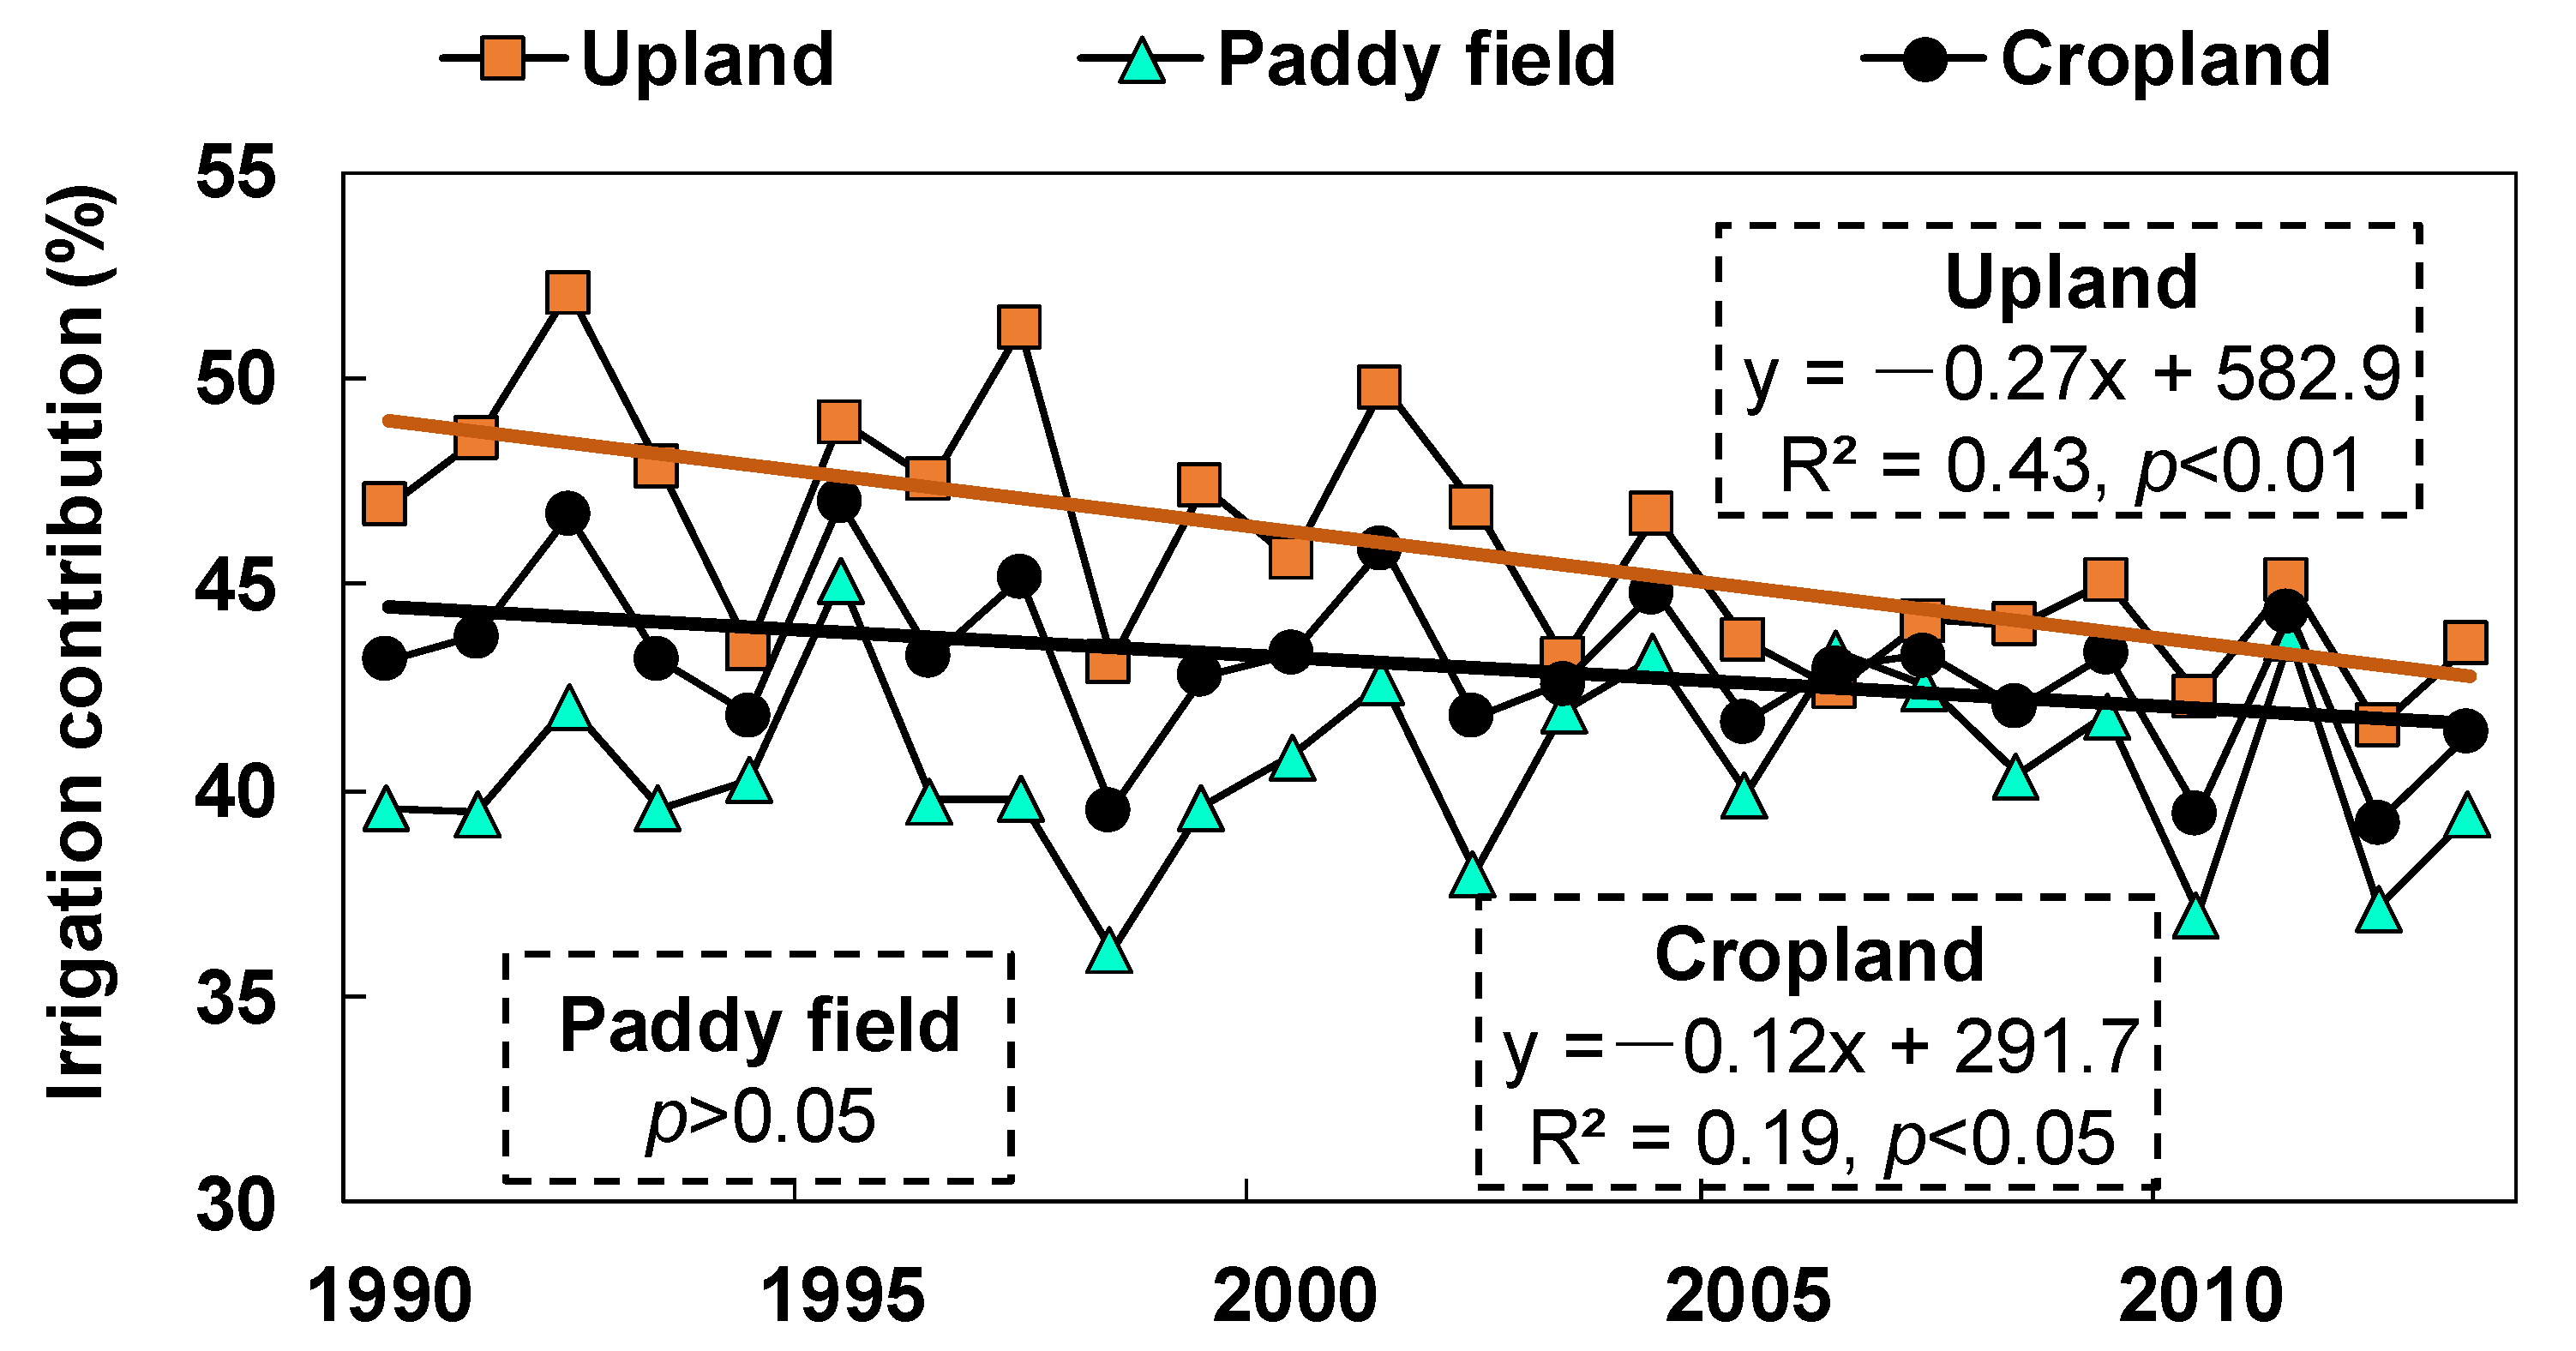
3.3. Temporal Variations in National Cropland Runoff

Estimated cropland and paddy field runoff depths showed no significant (p > 0.05) trends over the 1990–2013 period of investigation, whereas a significant (p < 0.01) downward trend was observed for the upland areas in China (Figure 5A). The irrigation-runoff depth of upland and paddy fields showed significant (p < 0.01) decreasing trends with rates of −3.8 mm yr−1 and −2.2 mm yr−1, respectively, whereas no significant (p > 0.05) change was observed for rainfall-runoff depth (Figure 5A). Therefore, the decline in upland runoff depth was attributed to a decrease in irrigation-runoff depth. Paddy fields were mainly distributed in the EC, CC and SWC regions (Figure S5C,D) where rainfall was the major water source for runoff (Figure 3B), thereby resulting in no change in paddy field runoff depth over the investigation period. The declining trend for irrigation-runoff depths (Figure 5A) was mainly ascribed to increasing irrigation water-use efficiency in China (increasing from 0.51 in 2011 to 0.57 in 2020, Figure S6A), resulting from water-saving irrigation technologies (WSI, e.g., drip irrigation, micro-sprinkler irrigation and shallow-wet irrigation, [69]. From 2000 to 2012, the irrigated area employing WSI technologies increased by 90% (from 16.4 × 10⁴ km2 to 31.2 × 10⁴ km2, Figure S6B) due to increased investments in agricultural irrigation efficiency projects [33].
Although cropland runoff depths showed no temporal trends at the national scale (Figure 5A), upland runoff depths in the Zhejiang, Yunnan, Xinjiang, Qinghai, Ningxia, Inner Mongolia, Heilongjiang and Shanghai provinces and paddy field runoff depths in the Yunnan, Xinjiang, Qinghai, Ningxia, Inner Mongolia, Heilongjiang and Shanghai provinces showed significant (p < 0.05) downward trends during the 1990–2013 investigation period (Figure 6A–C). The decline in irrigation-runoff depth was the major driver for decreasing cropland-runoff depth in these provinces (Figure S7A–F). Widespread adoption of WSI technologies was the largest contributor to the decreased irrigation-runoff depth in the NC region. In contrast, the reduced irrigation-runoff depth (Figure 6G–I) in the SC region was attributed to a reduced multiple cropping index [70]. Meanwhile, Shaanxi province showed a significant (p < 0.05) upward trend in both upland and paddy field runoff depths (Figure 6A–C), ascribed primarily to a change in cropping systems from low-water-consuming crops to high-water-consuming crops [71].
Estimated cropland runoff volume (Figure 5B) and irrigation-contributed percentage (Figure 7) in China decreased by 7% and 35% from 1990 to 2013, respectively. Upland runoff volume (Figure 5B) and its irrigation-contributed percentage (Figure 7) showed significant (p < 0.05) decreasing trends, while no significant changing trend (p > 0.05) was observed for paddy fields (Figure 5B and Figure 7). Considering the decreased cultivated area (Figure S8A) in cropland during the 1990–2013 period contributed no change in the rainfall-runoff volume (Figure 5B), and a ~31% increase in irrigated cropland area (Figure S8B). Therefore, decreasing irrigation-runoff depth was the main cause of decreasing cropland runoff volume. Similarly, the irrigated area in the uplands increased by 31% (Figure S8B); no significant changing trend was observed in the rainfall-runoff volume (Figure 5B). Thus, decreasing irrigation-runoff depth was the major driver for the decreasing upland runoff volume and irrigation-contributed percentage (Figure 5B). The lack of temporal changing trend for paddy field runoff volume was attributed to the offsetting effects of decreasing runoff depth and increasing the irrigated area (Figure S8B).
There were contrasting temporal trends for cropland runoff volumes across the different regions (Figure 6D–F). Estimated upland runoff volumes showed decreasing trends in the NC, NEC, EC, CC, SWC and NWC regions (Figure 6D), whereas decreasing trends were observed for paddy field runoff volumes mainly in the SWC, CC and EC regions (Figure 6E). Decreasing runoff volumes for most provinces were attributed to reduced irrigation-runoff depth (Figure S7D–F), especially in provinces (i.e., Zhejiang, Yunnan and Guizhou) with decreased cultivated land areas (Figure 6G–I). In contrast, increasing upland and paddy field runoff volumes in Shaanxi province (Figure 6D–F) were ascribed to the combination of increasing rainfall-runoff depth (Figure S7A–C), irrigation-runoff depth (Figure S7D–F) and irrigated area (Figure 6J–L). Increasing cropland runoff volume in Tibet (Figure 6D–F) was mainly attributed to increasing irrigation-runoff depth (Figure S7D–F) and irrigated land area (Figure 6J–L).

3.4. Implications for Cropland Water Management

In China, agricultural nonpoint source pollution [2,63], soil erosion [62] and water scarcity [66] are major risks to agricultural sustainability. Therefore, it is necessary to reduce excessive cropland runoff to mitigate agricultural nutrient loss, soil loss and water scarcity. Given the severe negative environmental impacts caused by excessive runoff (Figure 3A) in the EC, CC and SC (nonpoint source pollution [63]), NWC (soil erosion [3]), and NC and NEC (water scarcity [66]) regions, these areas should be prioritized for region-specific actions to reduce cropland runoff.
Considering the marked decrease in the national cropland runoff volume originating from implementation of WSI technologies from 1990 to 2013 (Figure 5), relevant WSI technologies (i.e., drip and micro-sprinkler irrigation in uplands and shallow-wet irrigation in paddy fields, [69]) should be further extended to reduce excessive runoff and associated nutrient/soil loss. Given the high rainfall (Figure 3A) and low agricultural water-use efficiency (0.59 ± 0.13) in the EC, CC and SC regions [30], optimization of cropping systems [72] and WSI technologies should be preferentially implemented to reduce upland runoff. To mitigate paddy field runoff, it is warranted to adopt WSI technologies and cyclic irrigation technology (partially reusing runoff water as irrigation water [67]. In areas with water scarcity due to limited rainfall (Figure 3A) and low agricultural water-use efficiency (0.30 ± 0.23), such as the NWC region [30], implementing WSI technologies, optimized cropping systems, rainwater harvesting and water-conserving crops (i.e., plant low-water-consuming crops) could attenuate soil and water loss caused by runoff. Rainwater harvesting technologies not only reduce cropland runoff yield, but also drastically improve agricultural productivity and reduce sediment/nutrient transport in arid and semi-arid regions [73]. As the main grain-producing region in China, the NC region with low rainfall (Figure 3A) and high demand for agricultural water resources requires intensive use of WSI technologies and rainwater harvesting technologies to increase water-use efficiency.

4. Conclusions

This study developed a framework to estimate the long-term (1990–2013) and regional variations of cropland runoff derived from rainfall and irrigation in China. Integration of the SCS-CN and geostatistical (IDW) methods provided a reasonable estimate of cropland runoff for China. Estimated annual national cropland runoff depth and runoff volume in 1990–2013 were 182 ± 15 mm yr−1 and 253 ± 25 km3 yr−1, respectively. Cropland runoff depth gradually increased from the drier northwest inland to the wetter southeast coast (range: 2–1375 mm yr−1). The EC, CC and SC regions accounted for 39% of the cultivated area and 53% of the irrigated land area and contributed 68% of the national runoff volume. In contrast, the NEC, NC, SWC and NWC regions accounted for 61% of the cultivated area and 47% of the irrigated land area, but contributed only 32% of the runoff volume. Rainfall was the main source (72%) of cropland runoff for the entire nation, whereas irrigation became the main source for cropland runoff in drier regions (NWC and SWC) with lower runoff depths. Over the 24-year study period, estimated cropland runoff volume and the irrigation-contributed percentage in China decreased by 7% and 35%, respectively, which was primarily attributed to the implementation of water-saving irrigation (WSI) technologies. Relevant water management strategies (i.e., WSI technologies, optimized cropping systems, rainwater harvesting, etc.) are warranted to further reduce cropland runoff in different regions of China. The developed framework provided a useful tool for estimating cropland runoff at the national and regional scales.

Supplementary Materials

The following supporting information can be downloaded at: https://www.mdpi.com/article/10.3390/w14182918/s1, Figure S1–S8; Table S1.

Author Contributions

Conceptualization, Y.Z. and D.C.; methodology, Y.Z., X.J., Y.W. and D.C.; software, Y.Z., X.J. and Y.W.; validation, Y.Z., X.J. and D.C.; formal analysis, Y.W., H.W., Z.P. and D.C.; investigation, Y.Z., H.W., Z.P. and D.C.; resources, M.L., J.Y., M.N. and Z.Z.; data curation, Y.Z. and Y.W.; writing—original draft preparation, Y.Z.; writing—review and editing, L.Z. and D.C.; visualization, Y.Z. and H.W.; supervision, D.C.; project administration, D.C.; funding acquisition, D.C. All authors have read and agreed to the published version of the manuscript.

Funding

This work was financially supported by the Zhejiang Provincial Key Research and Development Program of China (2019C02047), the Zhejiang Provincial Natural Science Foundation of China (LR19D010002), the National Natural Science Foundation of China (41877465 and 42107393) and the National Key Research and Development Program of China (2021YFD1700802).

Institutional Review Board Statement

Not applicable.

Informed Consent Statement

Not applicable.

Data Availability Statement

Not applicable.

Acknowledgments

We thank Randy A. Dahlgren for his preliminary review of the manuscript.

Conflicts of Interest

The authors declare no conflict of interest.

References

  1. Riaz, F.; Riaz, M.; Arif, M.S.; Yasmeen, T.; Ashraf, M.A.; Adil, M.; Ali, S.; Mahmood, R.; Rizwan, M.; Hussain, Q. Alternative and non-conventional soil and crop management strategies for increasing water use efficiency. In Environment, Climate, Plant and Vegetation Growth; Springer: Cham, Switzerland, 2020; pp. 323–338. [Google Scholar]
  2. Zhang, Y.F.; Wu, H.; Yao, M.Y.; Zhou, J.; Wu, K.B.; Hu, M.P.; Shen, H.; Chen, D.J. Estimation of nitrogen runoff loss from croplands in the Yangtze River Basin: A meta-analysis. Environ. Pollut. 2021, 272, 116001. [Google Scholar] [CrossRef] [PubMed]
  3. Borrelli, P.; Robinson, D.A.; Panagos, P.; Lugato, E.; Yang, J.E.; Alewell, C.; Wuepper, D.; Montanarella, L.; Ballabio, C. Land use and climate change impacts on global soil erosion by water (2015–2070). Proc. Natl. Acad. Sci. USA 2020, 117, 21994–22001. [Google Scholar] [CrossRef] [PubMed]
  4. Richter, A.; Burrows, J.P.; Nuss, H.; Granier, C.; Niemeier, U. Increase in tropospheric nitrogen dioxide over China observed from space. Nature 2005, 437, 129–132. [Google Scholar] [CrossRef] [PubMed]
  5. Breitburg, D.; Levin, L.A.; Oschlies, A.; Grégoire, M.; Jing, Z. Declining oxygen in the global ocean and coastal waters. Science 2018, 359, eaam7240. [Google Scholar] [CrossRef] [PubMed]
  6. Zhang, X.; Davidson, E.A.; Mauzerall, D.L.; Searchinger, T.D.; Dumas, P.; Shen, Y. Managing nitrogen for sustainable development. Nature 2015, 528, 51–59. [Google Scholar] [CrossRef]
  7. USDA; SCS. National Engineering Handbook, Section 4: Hydrology; Soil Conservation Service: Washington, DC, USA, 1972; pp. 1–44.
  8. Beven, K.J. Rainfall-Runoff Modelling: The Primer; John Wiley & Sons: Hoboken, NJ, USA, 2011. [Google Scholar]
  9. Ponce, V.M.; Hawkins, R.H. Runoff curve number: Has it reached maturity? J. Hydrol. Eng. 1996, 1, 11–19. [Google Scholar] [CrossRef]
  10. Al-Ghobari, H.; Dewidar, A.; Alataway, A. Estimation of Surface Water Runoff for a Semi-Arid Area Using RS and GIS-Based SCS-CN Method. Water 2020, 12, 1924. [Google Scholar] [CrossRef]
  11. Xiao, B.; Wang, Q.; Fan, J.; FP, H.; QH, D. Application of the SCS-CN model to runoff estimation in a small watershed with high spatial heterogeneity. Pedosphere 2011, 21, 738–749. [Google Scholar] [CrossRef]
  12. Zhang, D.; Lin, Q.; Chen, X.; Chai, T. Improved curve number estimation in SWAT by reflecting the effect of rainfall intensity on runoff generation. Water 2019, 11, 163. [Google Scholar] [CrossRef]
  13. Bartlett, M.; Parolari, A.J.; McDonnell, J.; Porporato, A. Beyond the SCS-CN method: A theoretical framework for spatially lumped rainfall-runoff response. Water Resour. Res. 2016, 52, 4608–4627. [Google Scholar] [CrossRef] [Green Version]
  14. Zouré, C.; Queloz, P.; Koita, M.; Niang, D.; Fowé, T.; Yonaba, R.; Consuegra, D.; Yacouba, H.; Karambiri, H. Modelling the water balance on farming practices at plot scale: Case study of Tougou watershed in Northern Burkina Faso. Catena 2019, 173, 59–70. [Google Scholar] [CrossRef]
  15. Boughton, W. A review of the USDA SCS curve number method. Soil Res. 1989, 27, 511–523. [Google Scholar] [CrossRef]
  16. Dong, L.; Xiong, L.; Lall, U.; Wang, J. The effects of land use change and precipitation change on direct runoff in Wei River watershed, China. Water Sci. Technol. 2015, 71, 289–295. [Google Scholar] [CrossRef]
  17. Huang, M.; Gallichand, J.; Wang, Z.; Goulet, M. A modification to the Soil Conservation Service curve number method for steep slopes in the Loess Plateau of China. Hydrol. Process. 2006, 20, 579–589. [Google Scholar] [CrossRef]
  18. Lal, M.; Mishra, S.; Kumar, M. Reverification of antecedent moisture condition dependent runoff curve number formulae using experimental data of Indian watersheds. Catena 2019, 173, 48–58. [Google Scholar] [CrossRef]
  19. Lian, H.; Yen, H.; Huang, C.; Feng, Q.; Qin, L.; Bashir, M.A.; Wu, S.; Zhu, A.-X.; Luo, J.; Di, H. CN-China: Revised runoff curve number by using rainfall-runoff events data in China. Water Res. 2020, 177, 115767. [Google Scholar] [CrossRef]
  20. Choubin, B.; Moradi, E.; Golshan, M.; Adamowski, J.; Sajedi-Hosseini, F.; Mosavi, A. An ensemble prediction of flood susceptibility using multivariate discriminant analysis, classification and regression trees, and support vector machines. Sci. Total Environ. 2019, 651, 2087–2096. [Google Scholar] [CrossRef]
  21. Voda, M.; Sarpe, C.A.; Voda, A.I. Romanian River Basins Lag Time Analysis. The SCS-CN Versus RNS Comparative Approach Developed for Small Watersheds. Water Resour. Manag. 2018, 33, 245–259. [Google Scholar] [CrossRef]
  22. Yuan, Y.; Nie, W.; Mccutcheon, S.C.; Taguas, E.V. Initial abstraction and curve numbers for semiarid watersheds in Southeastern Arizona. Hydrol. Process. 2014, 28, 774–783. [Google Scholar] [CrossRef]
  23. Elhakeem, M.; Papanicolaou, A.N. Estimation of the runoff curve number via direct rainfall simulator measurements in the state of Iowa, USA. Water Resour. Manag. 2009, 23, 2455–2473. [Google Scholar] [CrossRef]
  24. Tessema, S.M.; Lyon, S.W.; Setegn, S.G.; Mörtberg, U. Effects of different retention parameter estimation methods on the prediction of surface runoff using the SCS curve number method. Water Resour. Manag. 2014, 28, 3241–3254. [Google Scholar] [CrossRef]
  25. Cao, W.; Li, Y. Optimization and Application of SCS Model for Typical Forest Stand in the Hilly Region of South-Central Shandong Province. Soil Water Conserv. China 2021, 6, 34–38. (In Chinese) [Google Scholar]
  26. Zhang, X.; Meng, F.; Ding, N. Application of SCS Model to Estimating the Quantity of Runoff of Small Watershed in Semi-arid or Arid Region. Res. Soil Water Conserv. 2003, 10, 172–174. (In Chinese) [Google Scholar]
  27. Song, M.; Wang, R.; Zeng, X. Water resources utilization efficiency and influence factors under environmental restrictions. J. Clean. Prod. 2018, 184, 611–621. [Google Scholar] [CrossRef]
  28. Ma, T.; Sun, S.; Fu, G.; Hall, J.W.; Ni, Y.; He, L.; Yi, J.; Zhao, N.; Du, Y.; Pei, T. Pollution exacerbates China’s water scarcity and its regional inequality. Nat. Commun. 2020, 11, 650. [Google Scholar] [CrossRef]
  29. Zhou, F.; Bo, Y.; Ciais, P.; Dumas, P.; Tang, Q.; Wang, X.; Liu, J.; Zheng, C.; Polcher, J.; Yin, Z. Deceleration of China’s human water use and its key drivers. Proc. Natl. Acad. Sci. USA 2020, 117, 7702–7711. [Google Scholar] [CrossRef]
  30. Wang, F.; Yu, C.; Xiong, L.; Chang, Y. How can agricultural water use efficiency be promoted in China? A spatial-temporal analysis. Resour. Conserv. Recy. 2019, 145, 411–418. [Google Scholar] [CrossRef]
  31. Liu, X.; Sheng, H.; Jiang, S.; Yuan, Z.; Zhang, C.; Elser, J.J. Intensification of phosphorus cycling in China since the 1600s. Proc. Natl. Acad. Sci. USA 2016, 113, 2609–2614. [Google Scholar] [CrossRef]
  32. Fuentes, E.; Arce, L.; Salom, J. A review of domestic hot water consumption profiles for application in systems and buildings energy performance analysis. Renew. Sustain. Energy Rev. 2018, 81, 1530–1547. [Google Scholar] [CrossRef]
  33. Wang, J.; Zhu, Y.; Sun, T.; Huang, J.; Zhang, L.; Guan, B.; Huang, Q. Forty years of irrigation development and reform in China. Aust. J. Agric. Resour. Econ. 2020, 64, 126–149. [Google Scholar] [CrossRef]
  34. Xu, Q.; Ma, X.; An, M.; Ji, Y. SCS model application on calculation of small watersheds rain runoff. J. Southwest Agric. Univ. 2002, 24, 97. [Google Scholar]
  35. Sheng, H.; Zheng, F.; Cai, Q.; Sun, L. Effects of rainfall intensity and slope gradient on sheet erosion at the clay loess hillslope. J. Soil Water Conserv. 2016, 30, 13–23. (In Chinese) [Google Scholar]
  36. Qin, C.; Zheng, F.; Liu, P.; Xu, X.; Wu, H.; Wang, Y. Effect of a new soil amendment-corn stalk sap on loessial soil anti-erodibility. Acta Pedol. Sin. 2017, 54, 367–378. (In Chinese) [Google Scholar]
  37. Changbin, L.; Jiangwei, Q.; Jinbiao, L. Application of Computational Curve Number to Precipitation-runoff Simulation in a Typical Watershed in Chinese Loess Plateau. J. Arid Land Res. 2008, 22, 67–70. [Google Scholar]
  38. Zhou, S.; Lei, T. Calibration of SCS-CN Initial Abstraction Ratio of a Typical Small Watershed in the Loess Hilly-Gully Region. Sci. Agric. Sin. 2011, 44, 4240–4247. (In Chinese) [Google Scholar]
  39. Chen, Z.; Liu, X.; Zhu, B. Runoff estimation in hillslope cropland of purple soil based on SCS-CN model. Trans. Chin. Soc. Agric. Eng. 2014, 30, 72–81. (In Chinese) [Google Scholar]
  40. Tang, Q.; Sun, F. The research of Slope Surface erosion in different vegetation pattern in the purple soil region in Sichuan Province. J. Chongqing Univ. Arts Sci. 2009, 5, 71–73. (In Chinese) [Google Scholar]
  41. Yan, F.; He, B.A.; Liu, L. Soil Erosion Characteristics of Purple Soil Upland under the Different Land Use Types in Fuling District. Subtrop. Soil Water Conserv. 2009, 21, 14–19. (In Chinese) [Google Scholar]
  42. Fu, S.; Wang, H.; Wang, X.; Yuan, A.-P.; Lu, B.-J. The runoff curve number of SCS-CN method in Beijing. Geogr. Res. 2013, 32, 797–807. [Google Scholar]
  43. Liu, H.; Wang, S. The Application of SCS Model in Runoff Calculation in Tumen Xigou River Basin. J. Yueyang Vocat. Tech. Coll. 2011, 2, 82–85. (In Chinese) [Google Scholar]
  44. Guo, Q.; Zhang, B.; Zhong, J. Mathematical model and dynamic characteristic of rainfall-infiltration-runoff of latored soils in hills. J. Soil Water Conserv. 2001, 15, 62–65. (In Chinese) [Google Scholar]
  45. Chen, J. Study on the Adaptability of WEPP Model to the Red Soil Orchard Area in South China; Fujian Agriculture and Forestry University: Fuzhou, China, 2012. [Google Scholar]
  46. Xiao, J.; Sun, Z.; Jiang, C.; Zheng, J.; Feng, L.; Bai, W.; Yang, N. Influencing factors and their correlations of soil erosion on sloping farmland in western liaoning. J. Soil Water Conserv. 2015, 29, 13–19. (In Chinese) [Google Scholar]
  47. Mishra, S.K.; Singh, V.P. Another Look at SCS-CN Method. J. Hydrol. Eng. 1999, 4, 257–264. [Google Scholar] [CrossRef]
  48. Mack, M.C.; Schuur, E.A.G.; Bret-Harte, M.S.; Shaver, G.R.; Chapin, F.S. Ecosystem carbon storage in arctic tundra reduced by long-term nutrient fertilization. Nature 2004, 431, 440–443. [Google Scholar] [CrossRef]
  49. Xia, Y.; Zhang, M.; Tsang, D.C.; Geng, N.; Lu, D.; Zhu, L.; Igalavithana, A.D.; Dissanayake, P.D.; Rinklebe, J.; Yang, X. Recent advances in control technologies for non-point source pollution with nitrogen and phosphorous from agricultural runoff: Current practices and future prospects. Appl. Biol. Chem. 2020, 63, 8. [Google Scholar] [CrossRef]
  50. Maestre-Valero, J.F.; Martin-Gorriz, B.; Nicolas, E.; Martinez-Mate, M.A.; Martinez-Alvarez, V. Deficit irrigation with reclaimed water in a citrus orchard. Energy and greenhouse-gas emissions analysis. Agric. Syst. 2018, 159, 93–102. [Google Scholar] [CrossRef]
  51. Goovaerts, P. Geostatistical approaches for incorporating elevation into the spatial interpolation of rainfall. J. Hydrol. 2000, 228, 113–129. [Google Scholar] [CrossRef]
  52. Tveito, O.; Wegehenkel, M.; van der Wel, F.; Dobesch, H. COST Action 719: The Use of Geographic Information Systems in Climatology and Meteorology: Final Report; EUR-OP, Office for Official Publications of the European Communities: Luxembourg, 2008. [Google Scholar]
  53. Cao, X.; Li, Y.; Wu, M. Irrigation water use and efficiency assessment coupling crop cultivation, commutation and consumption processes. Agric. Water Manag. 2022, 261, 107370. [Google Scholar] [CrossRef]
  54. Ding, Y.; Wang, W.; Song, R.; Shao, Q.; Jiao, X.; Xing, W. Modeling spatial and temporal variability of the impact of climate change on rice irrigation water requirements in the middle and lower reaches of the Yangtze River, China. Agric. Water Manag. 2017, 193, 89–101. [Google Scholar] [CrossRef]
  55. Chaplot, V.A.; Le Bissonnais, Y. Runoff features for interrill erosion at different rainfall intensities, slope lengths, and gradients in an agricultural loessial hillslope. Soil Sci. Soc. Am. J. 2003, 67, 844–851. [Google Scholar] [CrossRef]
  56. Lennon, J.J.; Turner, J.R. Predicting the spatial distribution of climate: Temperature in Great Britain. J. Anim. Ecol. 1995, 64, 370–392. [Google Scholar] [CrossRef]
  57. Shi, X.; Yang, L.; Zhang, L. Comparison of Spatial Interpolation Methods for Soil Available Kalium. J. Soil Water Conserv. 2006, 20, 68–72. (In Chinese) [Google Scholar]
  58. Zhu, H.; Jia, S. Uncertainty in the Spatial Interpolation of Rainfall Data. Prog. Geogr. 2004, 23, 34–42. [Google Scholar]
  59. Xu, J.; Shu, H. Time-scale effects on accuracy of spatially kriging interpolation for rainfall data. J. Geomat. 2009, 34, 29–30. (In Chinese) [Google Scholar]
  60. Wang, D.; Chen, L.; Ding, Y. China’s precipitation, rainy days and its relationship with global temperature changes in the past 40 years. J. Trop. Meteorol. 2006, 22, 283–289. [Google Scholar]
  61. Zhu, Q.; Hong, J.; Liu, J.; Wei, X.; Peng, C.; Fang, X.; Liu, S.; Zhou, G.; Yu, S.; Ju, W. Evaluating the spatiotemporal variations of water budget across China over 1951–2006 using IBIS model. Hydrol. Process. 2010, 24, 429–445. [Google Scholar] [CrossRef]
  62. Guo, Q.; Hao, Y.; Liu, B. Rates of soil erosion in China: A study based on runoff plot data. Catena 2015, 124, 68–76. [Google Scholar] [CrossRef]
  63. Wang, M.; Ma, L.; Strokal, M.; Ma, W.; Liu, X.; Kroeze, C. Hotspots for nitrogen and phosphorus losses from food production in China: A county-scale analysis. Environ. Sci. Technol. 2018, 52, 5782–5791. [Google Scholar] [CrossRef] [Green Version]
  64. Yang, H.; Adler, R.F.; Hossain, F.; Curtis, S.; Huffman, G.J. A first approach to global runoff simulation using satellite rainfall estimation. Water Resour. Res. 2007, 43. [Google Scholar] [CrossRef]
  65. Liu, Y.; Wang, E.; Yang, X.; Wang, J. Contributions of climatic and crop varietal changes to crop production in the North China Plain, since 1980s. Glob. Chang. Biol. 2010, 16, 2287–2299. [Google Scholar] [CrossRef]
  66. Jiao, L. FOOD SECURITY Water Shortages Loom as Northern China’s Aquifers Are Sucked Dry. Science 2010, 328, 1462–1463. [Google Scholar] [CrossRef]
  67. Hama, T.; Nakamura, K.; Kawashima, S.; Kaneki, R.; Mitsuno, T. Effects of cyclic irrigation on water and nitrogen mass balances in a paddy field. Ecol. Eng. 2011, 37, 1563–1566. [Google Scholar] [CrossRef]
  68. Wang, R.; Li, X.; Tan, M.; Xin, L.; Wang, X.; Wang, Y.; Jiang, M. Inter-provincial differences in rice multi-cropping changes in main double-cropping rice area in China: Evidence from provinces and households. Chin. Geogr. Sci. 2019, 29, 127–138. [Google Scholar] [CrossRef]
  69. Zhuang, Y.; Zhang, L.; Li, S.; Liu, H.; Zhai, L.; Zhou, F.; Ye, Y.; Ruan, S.; Wen, W. Effects and potential of water-saving irrigation for rice production in China. Water Resour. Manag. 2019, 217, 374–382. [Google Scholar] [CrossRef]
  70. Xie, H.; Liu, G. Spatiotemporal differences and influencing factors of multiple cropping index in China during 1998–2012. J. Geogr. Sci. 2015, 25, 1283–1297. [Google Scholar] [CrossRef]
  71. Hui, X.; Chen, X.; Song, J. Assessing crop production eco-efficiency based on water footprints: The case of Shaanxi Province. Acta Ecol. Sin. 2021, 41, 14. (In Chinese) [Google Scholar]
  72. Ali, I.; Khan, F.; Bhatti, A. Soil and nutrient losses by water erosion under mono-cropping and legume inter-cropping on sloping land. Pak. J. Agric. Res. 2007, 20, 161–166. (In Pakistan) [Google Scholar]
  73. Díaz, F.; Tejedor, M.; Jiménez, C.; Dahlgren, R. Soil fertility dynamics in runoff-capture agriculture, Canary Islands, Spain. Agric. Ecosyst. Environ. 2011, 144, 253–261. [Google Scholar]
Figure 1. Framework for estimating national cropland runoff depth in China.
Water 14 02918 g001
Figure 2. (A) Comparisons of estimated CN values from 19 studied catchments in China (orange dots denote CN values estimated from monthly rainfall-runoff data that were excluded due to their outlier status) and default CN values in the National Engineering Handbook, and (B) comparisons among four spatial interpolation methods (i.e., inverse distance weighting (IDW), ordinary kriging (OK), spline and trend surface analysis (TSA)) for predicting annual cropland runoff depths. n = 209.
Water 14 02918 g002
Figure 3. Spatial patterns of (A) annual average cropland runoff depth (different lowercase letters indicate that mean values are statistically different at p < 0.01), and (B) the irrigation-runoff percentages across seven geographical regions in China. Box plots illustrate the 25th, 50th and 75th percentiles; whiskers indicate the 2.5th and 97.5th percentiles; and points represent data outliers. The smaller map frame at the lower left corner represents the ten-dash line of Nansha Islands.
Water 14 02918 g003
Figure 4. Contribution percentage of cropland (A,D,G) runoff volume, (B,E,H) rainfall-runoff volume, and (C,F,I) irrigation-runoff volume from the seven geographical regions (see Figure 3 for locations) to the total runoff of China.
Water 14 02918 g004
Figure 5. Temporal trends of national cropland (A) runoff depth and (B) runoff volume during 1990–2013 in China. Rainfall-runoff volume was equal to the product of rainfall-runoff depth and cultivated land area; irrigation-runoff volume is equal to the product of rainfall-runoff depth and irrigated land area.
Water 14 02918 g005
Figure 6. Temporal trends of annual (AC) cropland runoff depth, (DF) cropland runoff volume, (GH) cultivated area and (JL) irrigated area from 1990 to 2013. Unchanged indicated by p > 0.05, * indicates p < 0.05, ** indicates p < 0.01. The smaller map frame of each figure at the lower right corner represents the ten-dash line of Nansha Islands.
Water 14 02918 g006
Figure 7. Temporal trend of the irrigation contribution to cropland runoff during 1990–2013 in China.
Water 14 02918 g007
Table 1. Characteristics of 19 rainfall-runoff studied catchments in China.
IDProvinceGeographical RegionsTimeCatchment Area (km2)nClay (%)Sand (%)SlopeCrop TypesLatLongReference
1ShaanxiNorthwest China1959-86.3777NACorn, wheat38.3°110.3°Xu et al. [34]
2Shaanxi1959–1972-718.2655.21NACorn, wheat39.2°110.2°Xu et al. [34]
3Shaanxi1959–2008-520.134.33NACorn, wheat34.9°109.7°Xu et al. [34]
4Shaanxi1959–1995-328.8524.94NACorn, wheat35.2°108.2°Xu et al. [34]
5Shaanxi1959–2005-319.6638.13Corn, wheat34.8°109.2°Xu et al. [34]
6Shaanxi20150.51621.9826.5910Corn, wheat34.2°108°Sheng et al. [35]
7Shaanxi1958–196621813.4755.6515Corn, wheat36.8°109.3°Qin et al. [36]
8Gansu1989-512.1553.9235Corn, wheat35.6°104.3°Li et al. [37]
9Gansu19871001413.146.77NACorn, wheat34.7°106.1°Zhou and Lei [38]
10SichuanSouthwest China20131002513.1767.926.5Rice, corn31.5°105.3°Chen et al. [39]
11Sichuan20135.31513.3963.716.5Rice, corn31.1°105.6° Chen et al. [39]
12Sichuan20061004241.0331.755Rice, corn27.5°102.2°Tang and Sun [40]
13Chongqing20061006031.7723.3510Rice30.1107.4°Yan et al. [41]
14BeijingNorthern China2001–200650924.7143.52NACorn40.6°116°Fu et al. [42]
15Beijing1993–20065036.1362.7814.6Corn40.6°117.2°Liu and Wang [43]
16GuangdongSouthern China1995100137.2460.44NARice23.1°113.4°Guo et al. [44]
17FujianEastern China20111003315.1231.5815Rice26.2°119.1°Chen [45]
18Anhui201550636.3526.11NARice, corn31.8117.6°Zhou and Lei [38]
19LiaoningNortheast China2008601827.2450.0310Corn, rice41°122.3°Xiao et al. [46]
Note: “n” denotes the number of studied rainfall-runoff events.
Publisher’s Note: MDPI stays neutral with regard to jurisdictional claims in published maps and institutional affiliations.

