1. Introduction
The human need for closing the electricity access gap has stimulated the search for new sources of cost-effective renewable energy in the background of carbon peaking and carbon neutrality goals [
1,
2]. In response to this need, major new initiatives in hydropower development are now under way. At least 3700 major dams, each with a capacity of more than 1 MW, are either planned or under construction, primarily in countries with emerging economies [
3]. Meanwhile, the river runoff in some semi-humid and semi-arid areas decreased significantly due to climate change and human activities. Environmental flow (e-flow) releases were required to reduce stress on river ecosystems caused by the flow alterations of dams as a formal government policy in many countries [
4,
5]. With the over-exploitation of water resources and intense human activities, e-flow evaluation of dammed rivers is particularly important. Clearly, there is an urgent need to evaluate and mitigate the impacts of boom in global dam construction. To enable advanced assessments and support strategies for mitigating ecohydrological and socioeconomic costs, many databases and practices were introduced [
6,
7]. How to choose an effective e-flow from a set of values determined with a variety of calculation methods has been a challenge faced by many water managers for a long time. There are more than 200 methods for calculating e-flows around the world that can be summarized as four categories: hydrological methods, hydraulics methods, habitat methods and holistic methods [
8]. Most of these existing methods aimed at a specific watershed, timing goals or ecological and environmental objectives [
9,
10]. Undoubtedly, each calculation method has a corresponding premise. Although many rivers in the world have carried out different extents of e-flow research, there is still no all-around method which can be applied to any conditions [
11]. Here, what we make the effort to pursue is not a specific approach to e-flow calculation. The final goal we seek is to help water managers in choosing a good technical and economy performance method through a scientific process so that they can make more proper decisions.
As a driving force for ecological conditions, the ecological response of hydrological and hydraulic alteration becomes very sensitive. Many scholars believe that changes in hydrological and hydraulic conditions can reflect the health of a river ecosystem, and the results of these methods meet the needs of ecosystems [
12]. However, the ecosystem is a complex organization involved all aspects. Ecologists believe that it is impossible to describe ecological variations accurately without considering the ecological process [
10,
13,
14]. Hence, many holistic e-flow frameworks have emerged and have been widely applied around the world [
15], such as the ecological limits of hydrologic alteration (ELOHA), which is one of the most complete and influential holistic methods from the last decade [
16]. It has made the hydrological and ecological characteristics have the possibility of transferability between the similar impacts of the study of dams on ecosystems [
17]. Affected by dam operation, the volumes, frequencies, and peaks of the flows have changed to varying degrees [
18]. It is difficult to quantize the relationship between hydrological alteration and ecological conditions without a lot of initial investment, such as continuous monitoring and positive support from all parties involved [
19]. Due to the limitations of various calculation methods, it has been more challenging for water managers to choose an appropriate method and e-flow according to the valuable dataset of the dammed river and make a more proper decision based on the different results.
In China, hydrological methods and hydraulic methods have been widely used in many specific rivers which are recommended by the e-flow-related government guidelines [
20]. Due to the limitations of the ecological data and funds, holistic methods could be utilized to assess e-flows only in some large river basins [
13] What is more, the relevant laws, standards or guidelines related to e-flows suggest that water managers should consider the geography, climate characteristics of the basin and valuable data to choose the appropriate calculation method for ecological conservation objectives or other aspects [
21]. Until now, little research has focused on analyzing and quantifying the efficiency of methods to select the e-flow calculation method based on the dam attributes [
22]. In order to avoid the manager’s subjectivity, considering the particularity of dammed rivers, quantifying the consequences of different e-flow scenarios calculated by different methods is imperative.
When evaluating the rationality of e-flows, it is necessary to consider not only the spatial–temporal variation of flows and the benefits distribution of different targets in the river but also the experts’ experience in different disciplines [
23] The most obvious is biologists’ experience with the e-flow requirements of aquatic organisms. In this study, a logical decision support evaluation (DSE) model, based on the matter element analysis (MEA) method [
24] with the relevant government guidelines and downstream conservation objectives in dammed rivers, was proposed for selecting an appropriate method to determine the e-flows. When combining the analysis methods, the evaluation results are represented by quantitative values so that the evaluation grade of things can be objectively and comprehensively reflected. This DSE model can improve the Chinese e-flow assessment framework and propose a reasonable e-flow to reduce the negative impacts on the river ecosystem by dam projects.
2. Method
We included three main steps in developing the DSE model process. The first step is to create different e-flow scenarios based on the dammed rivers’ priority classification list and Chinese government guidelines for the selection process. The second step is to analyze the e-flows based on the MEA method to quantify the rationality of different e-flow processes. The third step is to summarize the evaluation criteria according to the relevant government guidelines and evaluate the e-flow results calculated by different methods quantitatively.
2.1. Create E-Flow Scenarios
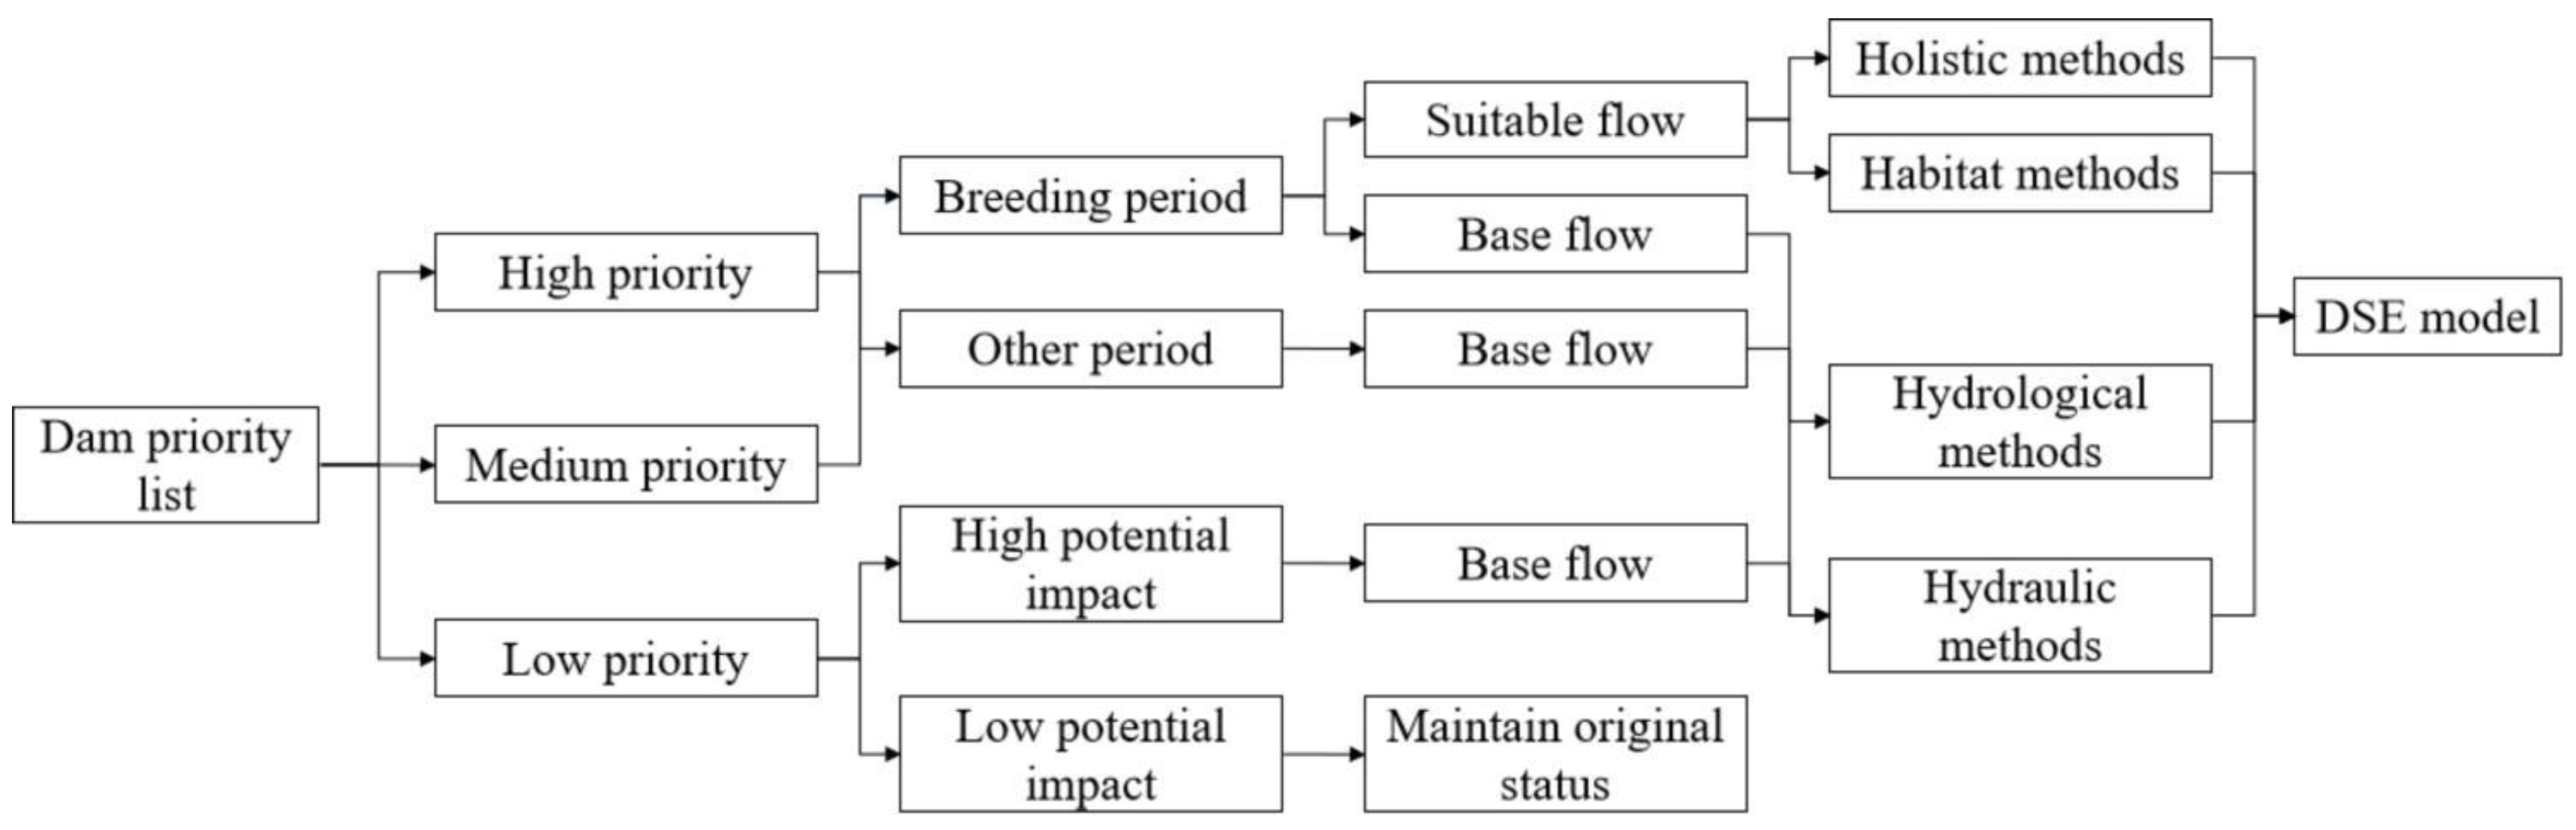
For the first step, we identified the dam’s category according to its attributes (e.g., hydrological alteration, degree of regulation and downstream fish species) (
Figure 1). All the dams were divided into three priority lists (high, medium and low priority) based on the classifying framework which was completed in a previous study [
25]. There were some differences for the different priorities. In this study, high-priority and medium-priority dams were defined as dams with rare and endangered fish species in the downstream. Low-priority dams were defined as dams without rare or endangered fish species in the downstream.
Then, we took different considerations into account for the condition of conservation objectives in the downstream. Based on the priority list, we could consider the ecological attributes to classify the dam into different categories. Due to the government guidelines for e-flows, whether there are spawning areas or whether there are national nature reserves in the downstream is important. The e-flow process in this study was divided into two components, including the based flow and suitable flow (also known as the goal flow). The base flow is defined as the flow that should be maintained within the river channel throughout the year, especially in the dry season, to sustain basic ecosystem functions and prevent the shrinkage or discontinuity of a river [
26]. The functions of the base flow include eco-environmental functions, natural functions and social functions. The suitable flow is defined as the flow that should be maintained in the specific period within the year, such as the bankful flow, overbank flow and flow for biodiversity. In general, the suitable flow is the flow for specific flow-sensitive objectives. Here, we also created the reference flows which integrate the related policies as a criterion to assess the results. It is also noted that the base flow and the suitable flow are the main flow elements we have to pay more attention to. What is more, the guidelines also recommend some common methods for water managers. More detailed information can be found in another paper about the dam classification framework in China [
25]. In the normal evaluation framework, the envelop curve of each e-flow calculation method is the final e-flow result [
27] so that the maximum value of e-flows in every temporal unit can be grouped, and e-flows relevant to stakeholders will reach agreement with the result, even though it is not scientific enough. However, in this paper, the DSE model takes the place of the envelop curve, which lacks a scientific methodology basis. The DSE model provides more e-flow choices for stakeholders to select, and a more scientific basis for the e-flow results was developed simultaneously.
2.2. Apply MEA to E-Flows
2.2.1. Constructing the Conceptual Framework of the DSE Model
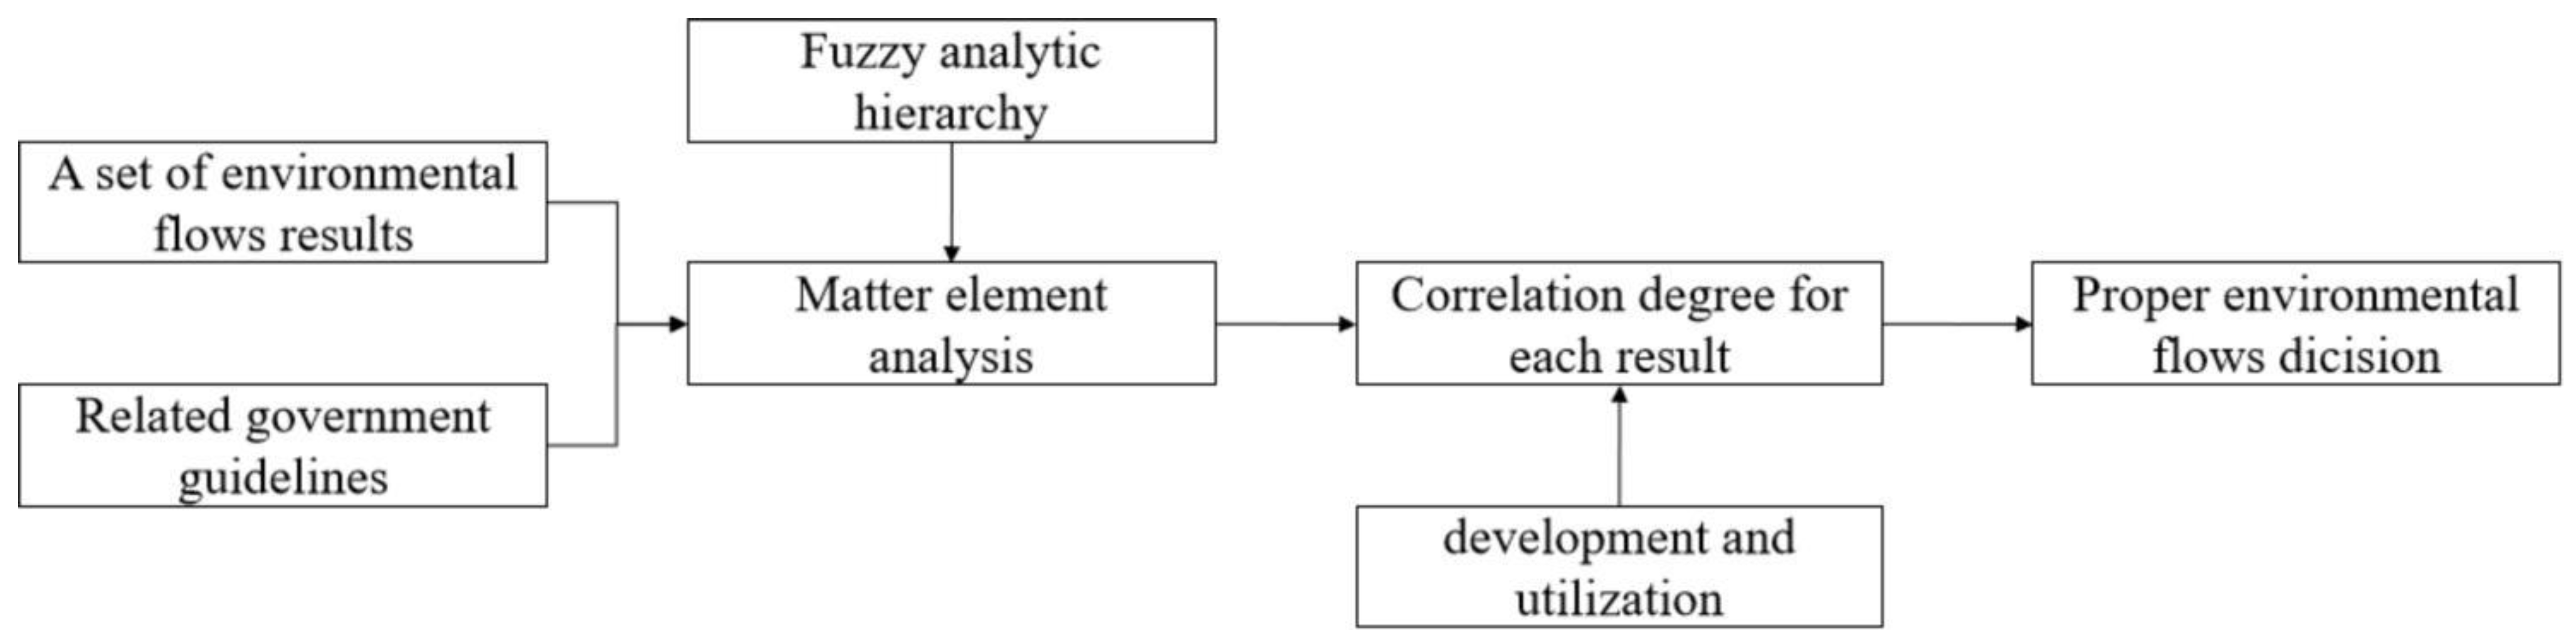
During the whole process, the most important step is to quantize the appropriate e-flow results. The MEA method is a possible solution to contradictory problems and one of the effective methods for dealing with incompatible and contradictory problems (
Figure 2), as it has been applied in many fields of research [
28]. An incompatible problem is a class of contradictory problem in which the goal cannot be achieved under the given conditions [
29]. The e-flow decision-making problem is a significant incompatibility problem because there is a contradiction between the limited water resources for e-flows and unlimited e-flow water requirement for each e-flow objective.
The MEA method is a type of evaluation model that solves for the ambiguity, diversity and incompatibility of various indicators. By introducing ecological and environmental objectives and constructing the correlation function to construct the DSE model, the efficiency of e-flow implementation could be improved and thus realize the sustainable development of ecological protection and economic development. An MEA method has to be built by implementing three steps.
2.2.2. Constructing the Evaluation Element
The first step is to construct the matter element
R, classical domain
Rj and joint domain
Rp for evaluation. In particular, a matter element is the basic unit of the model, and all things can be described as a matter element in three elements, where the given item is the name of the thing (
N), the feature of the thing (
C) and the value corresponding to the feature (
X). Lastly, the matter element is expressed as follows:
The e-flow status was regarded as an evaluation index, and the temporal scale might be in hours, days, months, years or other time units. In this paper, we used months in a year for the e-flow evaluation index and recorded it as
n characteristics:
where
R stands for the e-flow process for
n months with a maximum of 12,
P0 is the unit to be evaluated,
Ci is the
ith feature of the unit to be evaluated, the e-flow status is for the
ith month and
Xi is the quantity corresponding to the evaluation index
Ci:
where
Pj is the grade of the standard and
Xji is the percentage of the
ith month’s e-flows in the
jth grade. In the
jth grade,
aji is the lower limit and the
bji is the upper limit percentage for the e-flows accounting for natural flow:
where
Pp is all grades of the standard,
Xpi is the
ith month’s e-flow set,
api is the lower limit and the
bpi is the upper limit percentage for the e-flows. Here,
Xpi = [0, 100].
2.2.3. Determining Indicator Weights
The second step is to determine the indicators’ weights. The weight of the evaluation index reflects the role of a certain index in the system. Due to the conservation objectives in the downstream in the case study, considering that the breeding period is more important than the normal period, a fuzzy analytic hierarchy process was selected to determine the weight [
3]. The weight value does not change with the indicator state or values.
2.2.4. Determining the Correlation Degree
The third step is to calculate the degree of membership and determine the correlation degree between the calculated result and
jth standard evaluation grade:
Before this is determining the distance from the evaluated objects (
R) to the classical domain (
Rj) and joint domain (
Rp). According to the mathematical concepts, distance is a function that acts based on a specific set of rules. There are specific ways to describe how elements in a space “approach” or “move away” from each other. Here, we determined the distance from
to
X_ji = [
a_ji,
b_ji] and
X_pi = [
a_pi, b_pi] as follows:
The correlation function
Kj(xi) represents the closeness degree, which the matter element conforms to the required value range:
where
represents the comprehensive correlation degree of the
jth standard evaluation grade for the object and
wi is the weight for the
ith month.
If , this means that the e-flow regimes meet the requirements of the standard evaluation grade.
If , this indicates that it does not meet the requirements of the standard evaluation grade but has the conditions to convert to the grade. The smaller the value is, the easier this is to achieve.
If , this means that it does not meet the requirements of the standard evaluation grade and cannot be converted into the grade.
If , this means that the upper limit of the standard grade is exceeded.
2.3. Summary of the Evaluation Criteria
The purpose of the DSE model for method selection is to avoid the uncertainty caused by subjective factors efficiently. The model clarifies the evaluation criteria according to the relevant government guidelines “Code for calculation of ecological flow of hydropower projects” (
Table 1) and “Specification for calculation of environmental flow in rivers and lakes” (
Table 2) [
7,
30], and it evaluates the e-flow results calculated by different methods quantitatively. The two periods of the dry period and wet period were determined by precipitation at different times in China [
31]. The condition thresholds were determined based on the study of Tennant [
32], which is usually regarded as the most original study of the e-flow standard. The two evaluation criteria take into account the flow regimes and the development of water resources in the basin. When calculating e-flows, reasonable e-flows need to meet both criteria to have a chance of being adopted, and regional water resource conflicts can be reduced to a certain extent.
We could find different e-flow scenarios by different methods, and these e-flow scenarios met the two criteria. The main problem to be solved in this study is to analyze and compare a large number of e-flow scenarios that meet the conditions by introducing the MEA method to select the most suitable e-flow process from a large number of qualified calculation results.
3. General Information of Case Study Area
3.1. Study Area
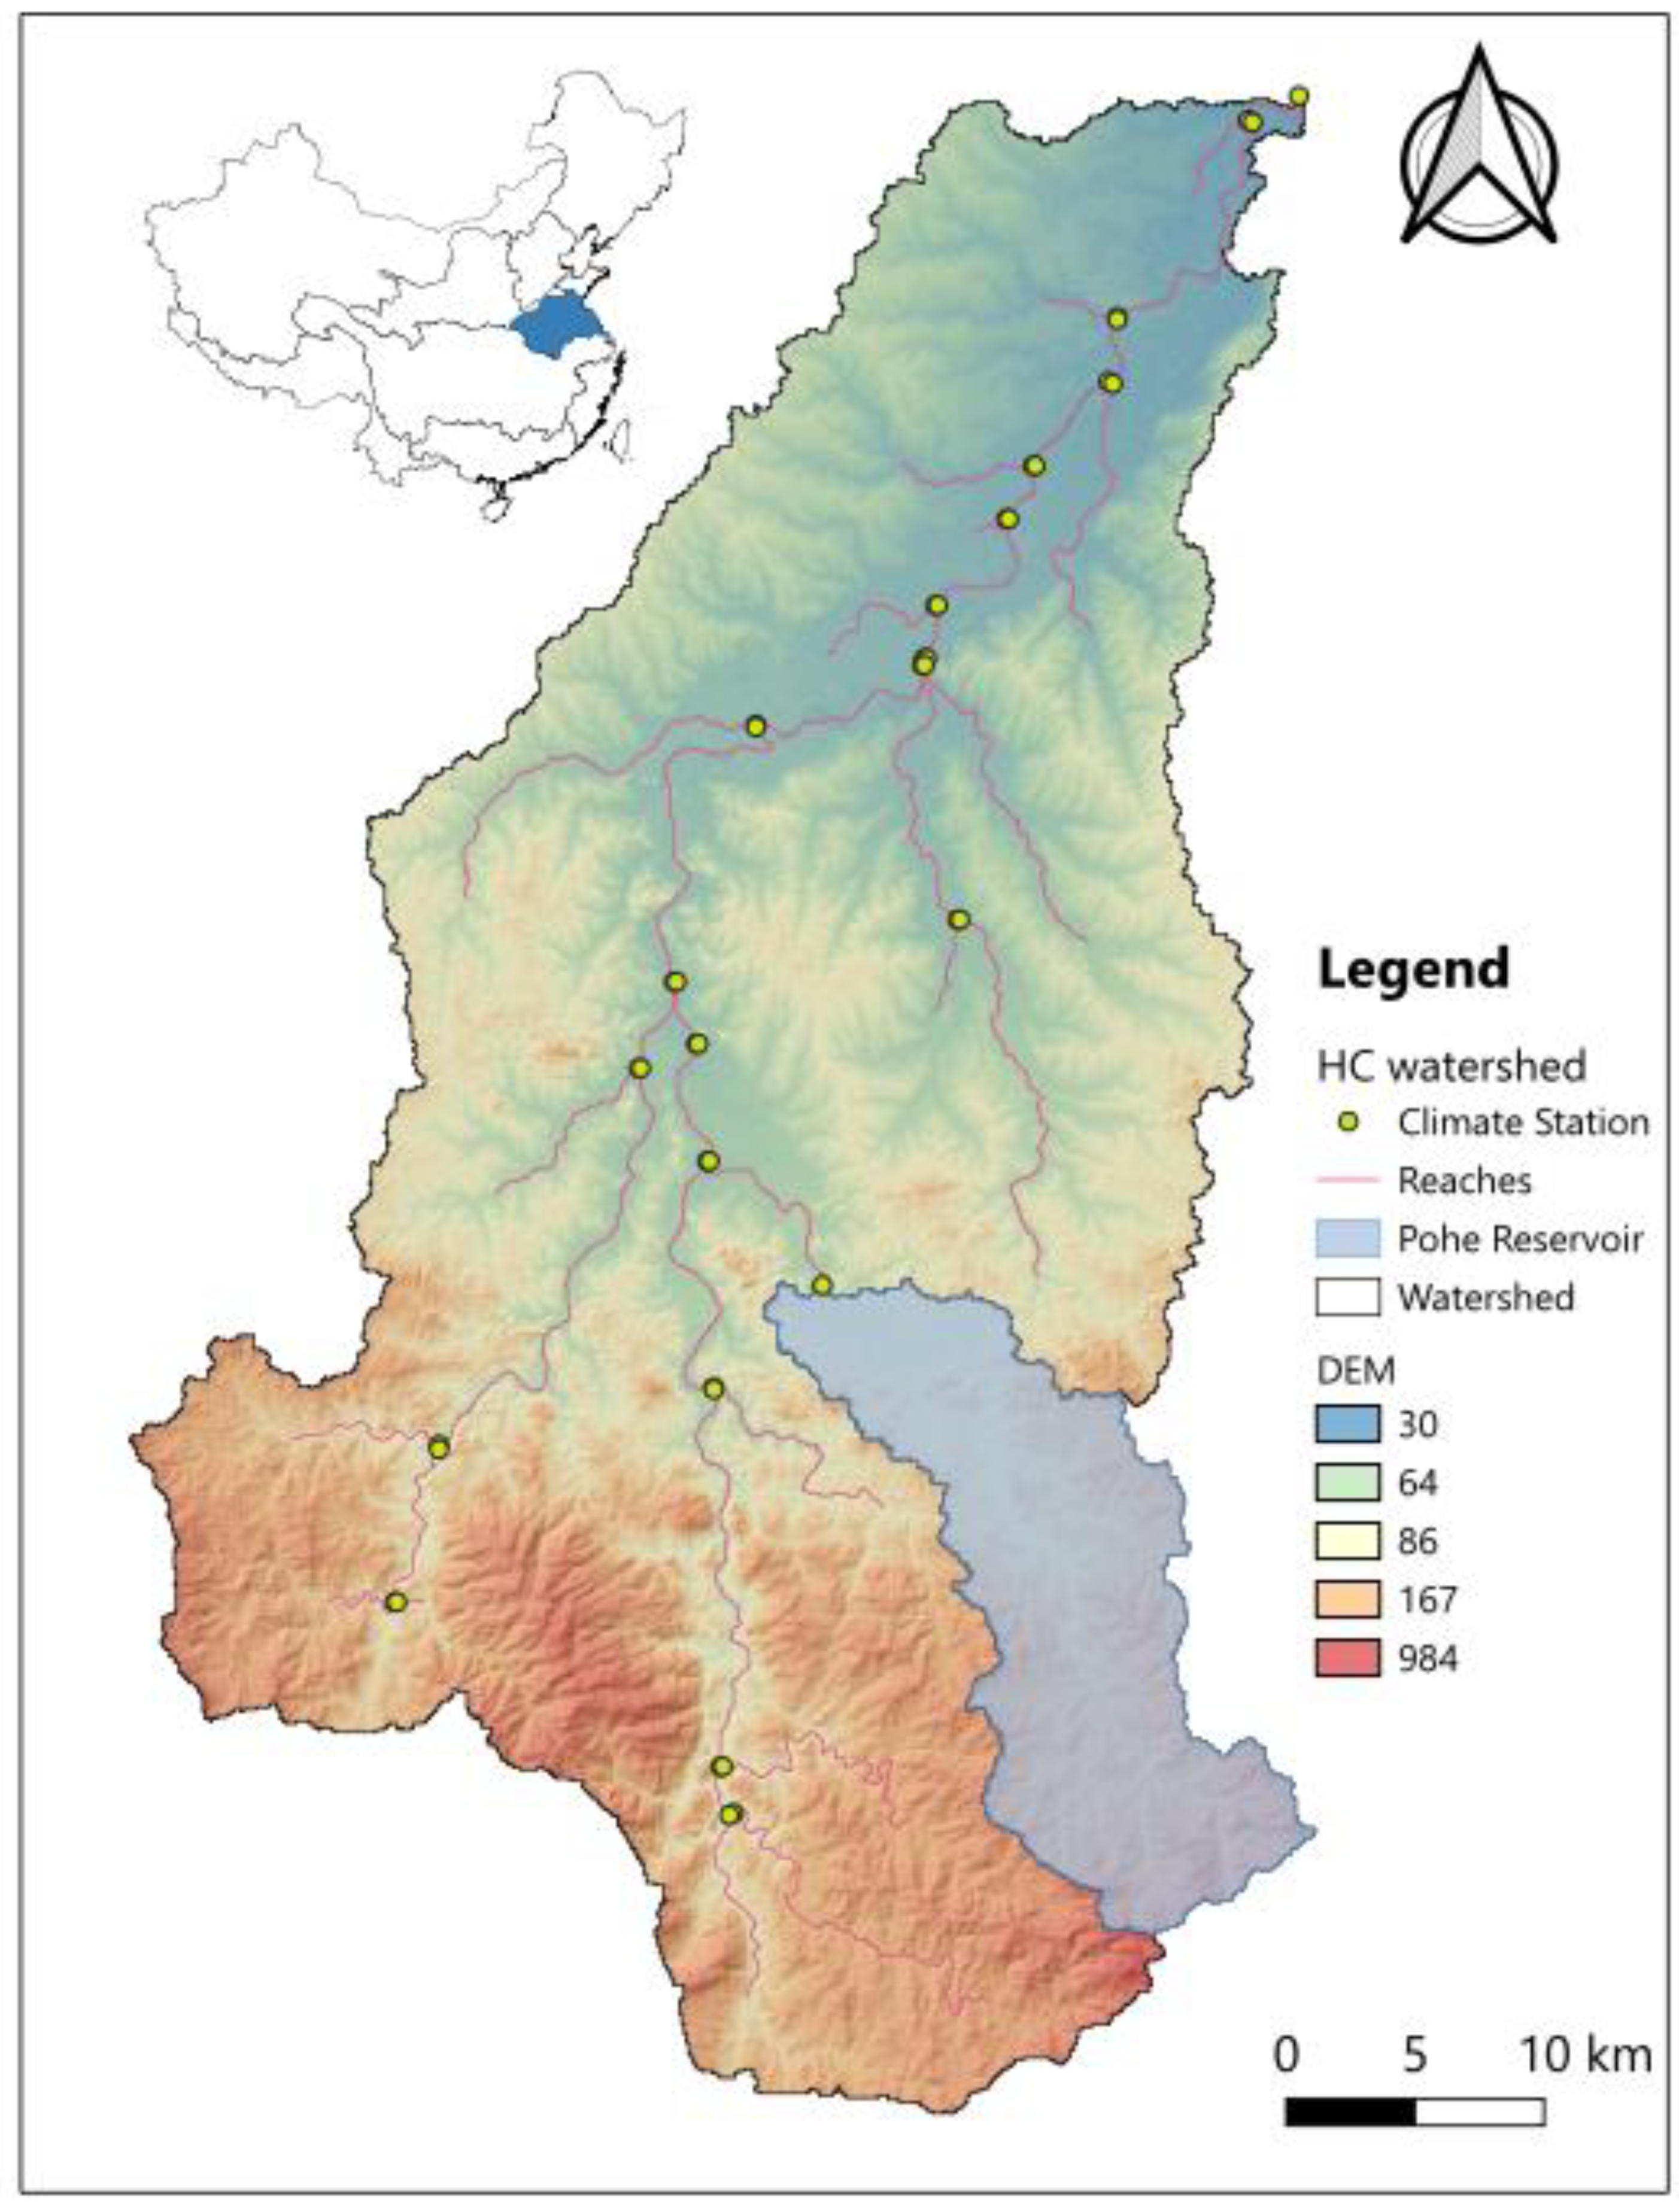
The Huangchuan River is located at the upper portion of the Huaihe River in China. It is from 114°53′~115°21′ east longitude and 31°52′~32°22′ north latitude (
Figure 3). The drainage area is 2050 km
2. The unit of DEM is 90 m, which was used in this study. The average annual rainfall of the Huangchuan River is 800~1050 mm, and the average annual runoff depth is about 371 mm. The average annual water surface evaporation is 1039 mm. Of the annual rainfall in the Huangchuan River, 50% is concentrated in the time period from June to August. The basin has a large reservoir, the Pohe reservoir, with a total storage capacity of 235 million m
3 and a controlled drainage area of 222 km
2. Its construction began in 1966 and was completed in 1972. This study selected the daily observation flow of the river outlet station from 1955 to 2012, and all of the data came from the annual hydrological reports of the People’s Republic of China.
3.2. Hydrological Basis
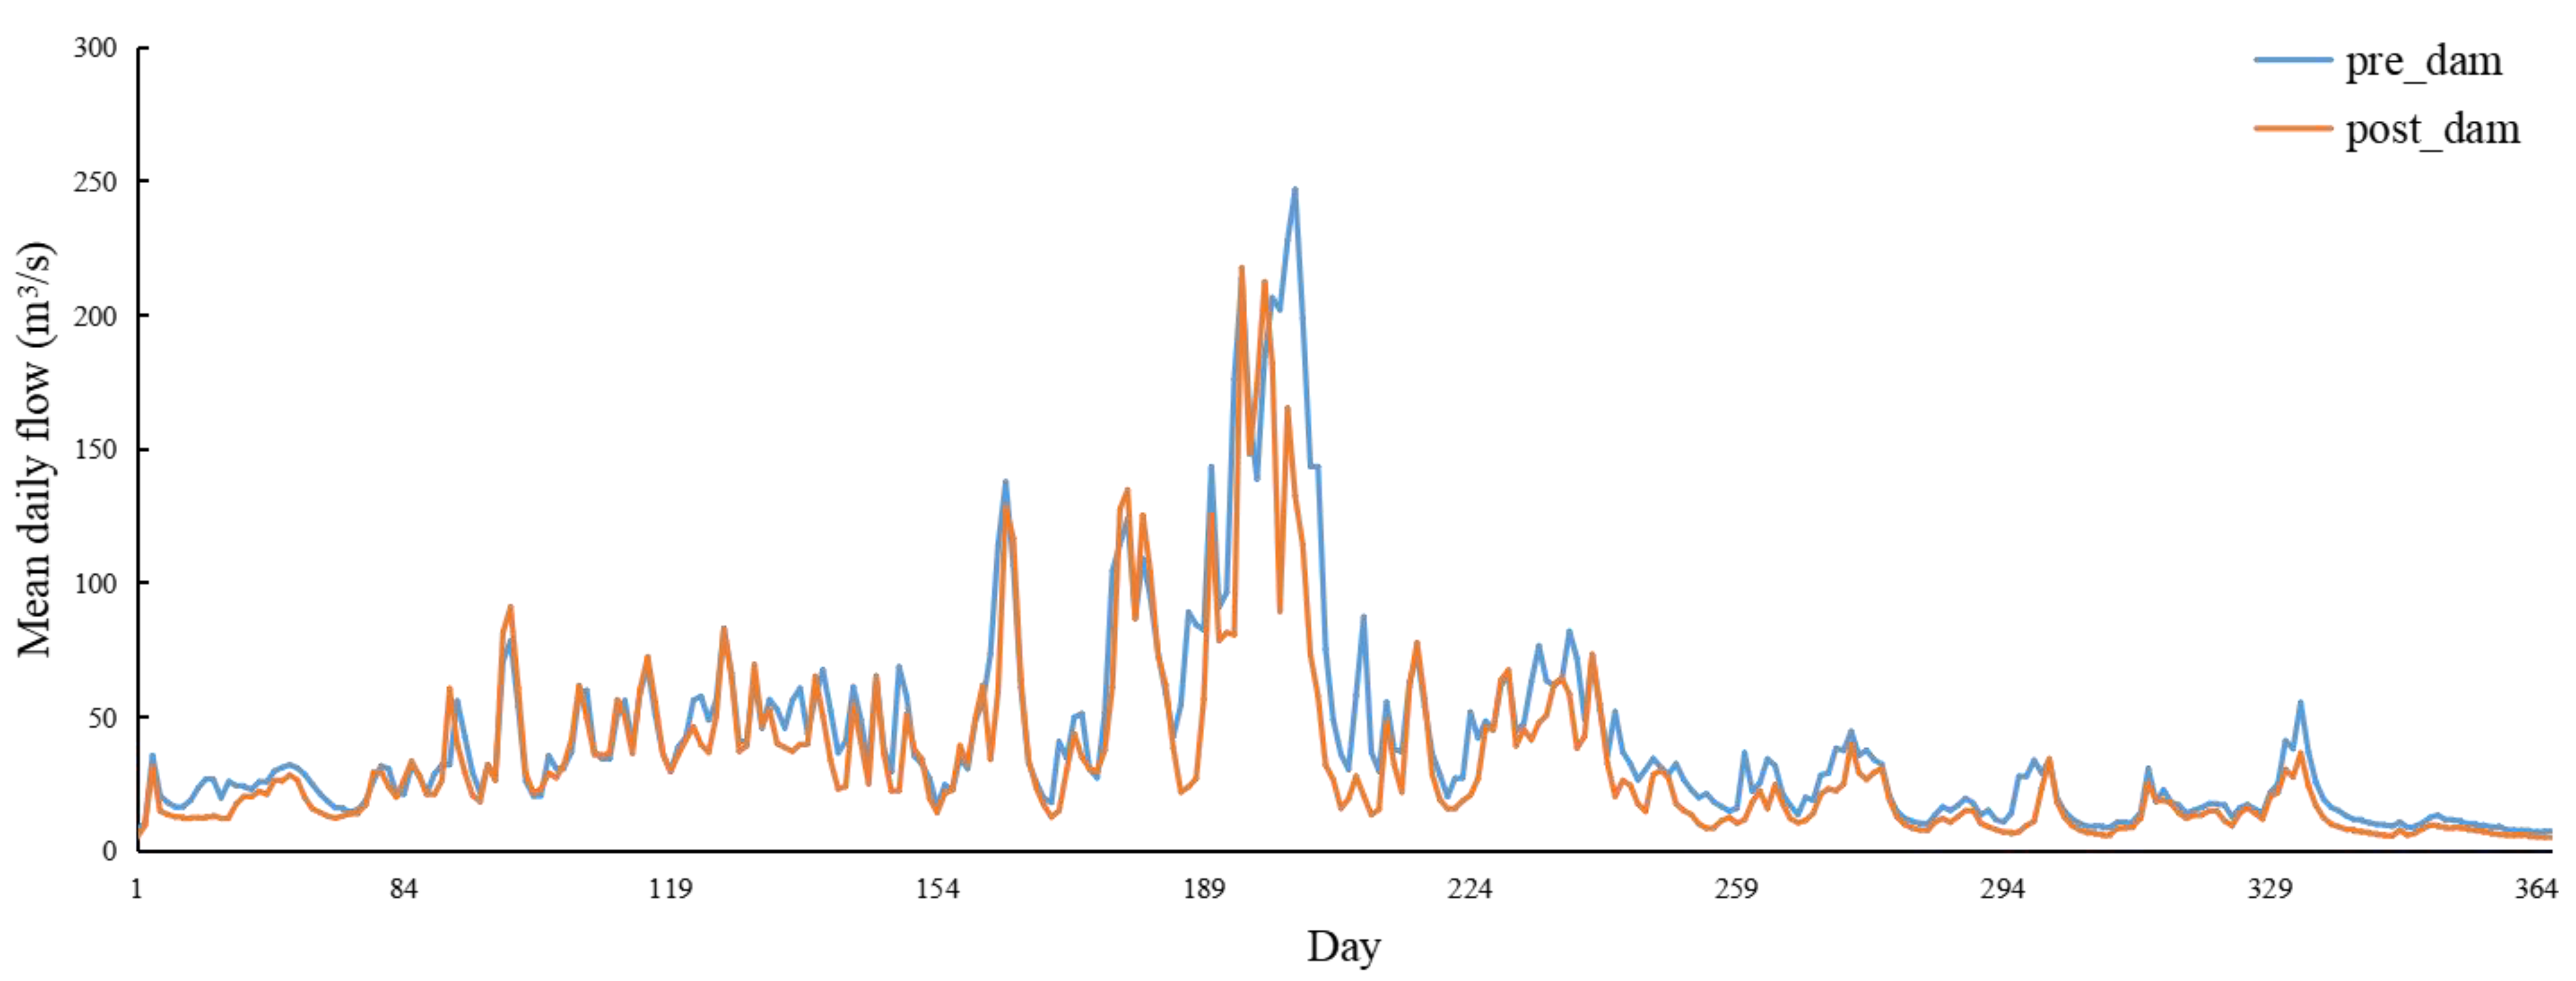
We collected 57 years (from 1955 to 2012, excluding 1966) of daily flow data from the outlet of the Huangchuan River. Two periods were defined, with the pre_dam period being 1955–1972 and the post_dam period being 1973–2012 (
Figure 4). Because of the start of the dam’s construction, there were missing data for the whole year of 1966. The annual average flow of the pre_dam period was 37.62 m
3/s, and the value was 22.77 m
3/s for the post_dam period. The flow decreased significantly in the post_dam period.
According to the general information of the study area and the hydrological data available, the average flows for each month during the pre_dam period and post_dam period were calculated (
Table 3). It is obvious that the mean flow variation for February, April, May, June and July made a great contribution to the hydrological alteration. As a result, the e-flows in these months attracted more attention, and the weights for these months were relatively larger.
4. Results
4.1. Creating E-Flow Scenarios
4.1.1. Identify the E-Flow Element Priority
After the basic data collection for the river, the regulation coefficient of Pohe reservoir was 0.872, which is the ratio of the utilizable capacity and average annual runoff. The regulation coefficient presents the regulation performance of a dam and is strongly correlated with the hydrological alteration indicators. There are some spawning areas in the downstream, and we have to consider the spawning period from April to September. In addition, Pohe reservoir mainly provides irrigation for agricultural production, and rice is mainly cultivated in the downstream irrigation area. The irrigation period is usually from the start of May to the end of September. Given the conservation objectives in the downstream, each e-flow plan included two periods in this case study (breeding period and normal period). The breeding period is from April to September, while the dry period is from October to March in the next year. Hence, based on the dam classification list, Pohe reservoir is a medium-priority hydropower project.
4.1.2. Calculate the E-Flows of Different Scenarios
Because of the difficulty of obtaining ecological data such as spawning areas, habitat simulations and holistic methods could not be implemented in this study area. Most rivers usually use hydrological methods for the calculation of e-flows, especially in many small- or medium-sized rivers [
29]. When we calculated it, the base flow was regarded as the e-flows in the normal period, and the suitable flow was regarded as the e-flows in the breeding period. Utilizing the existing valuable data, six methods were selected for calculating e-flows in this paper, and all of them are recommended by government guidelines (
Table 4).
4.2. E-Flow Evaluation Based on MEA
4.2.1. Constructing the Evaluation Matter Element
We only used the compositive hydrological methods to calculate the e-flows for the Huangchuan River (
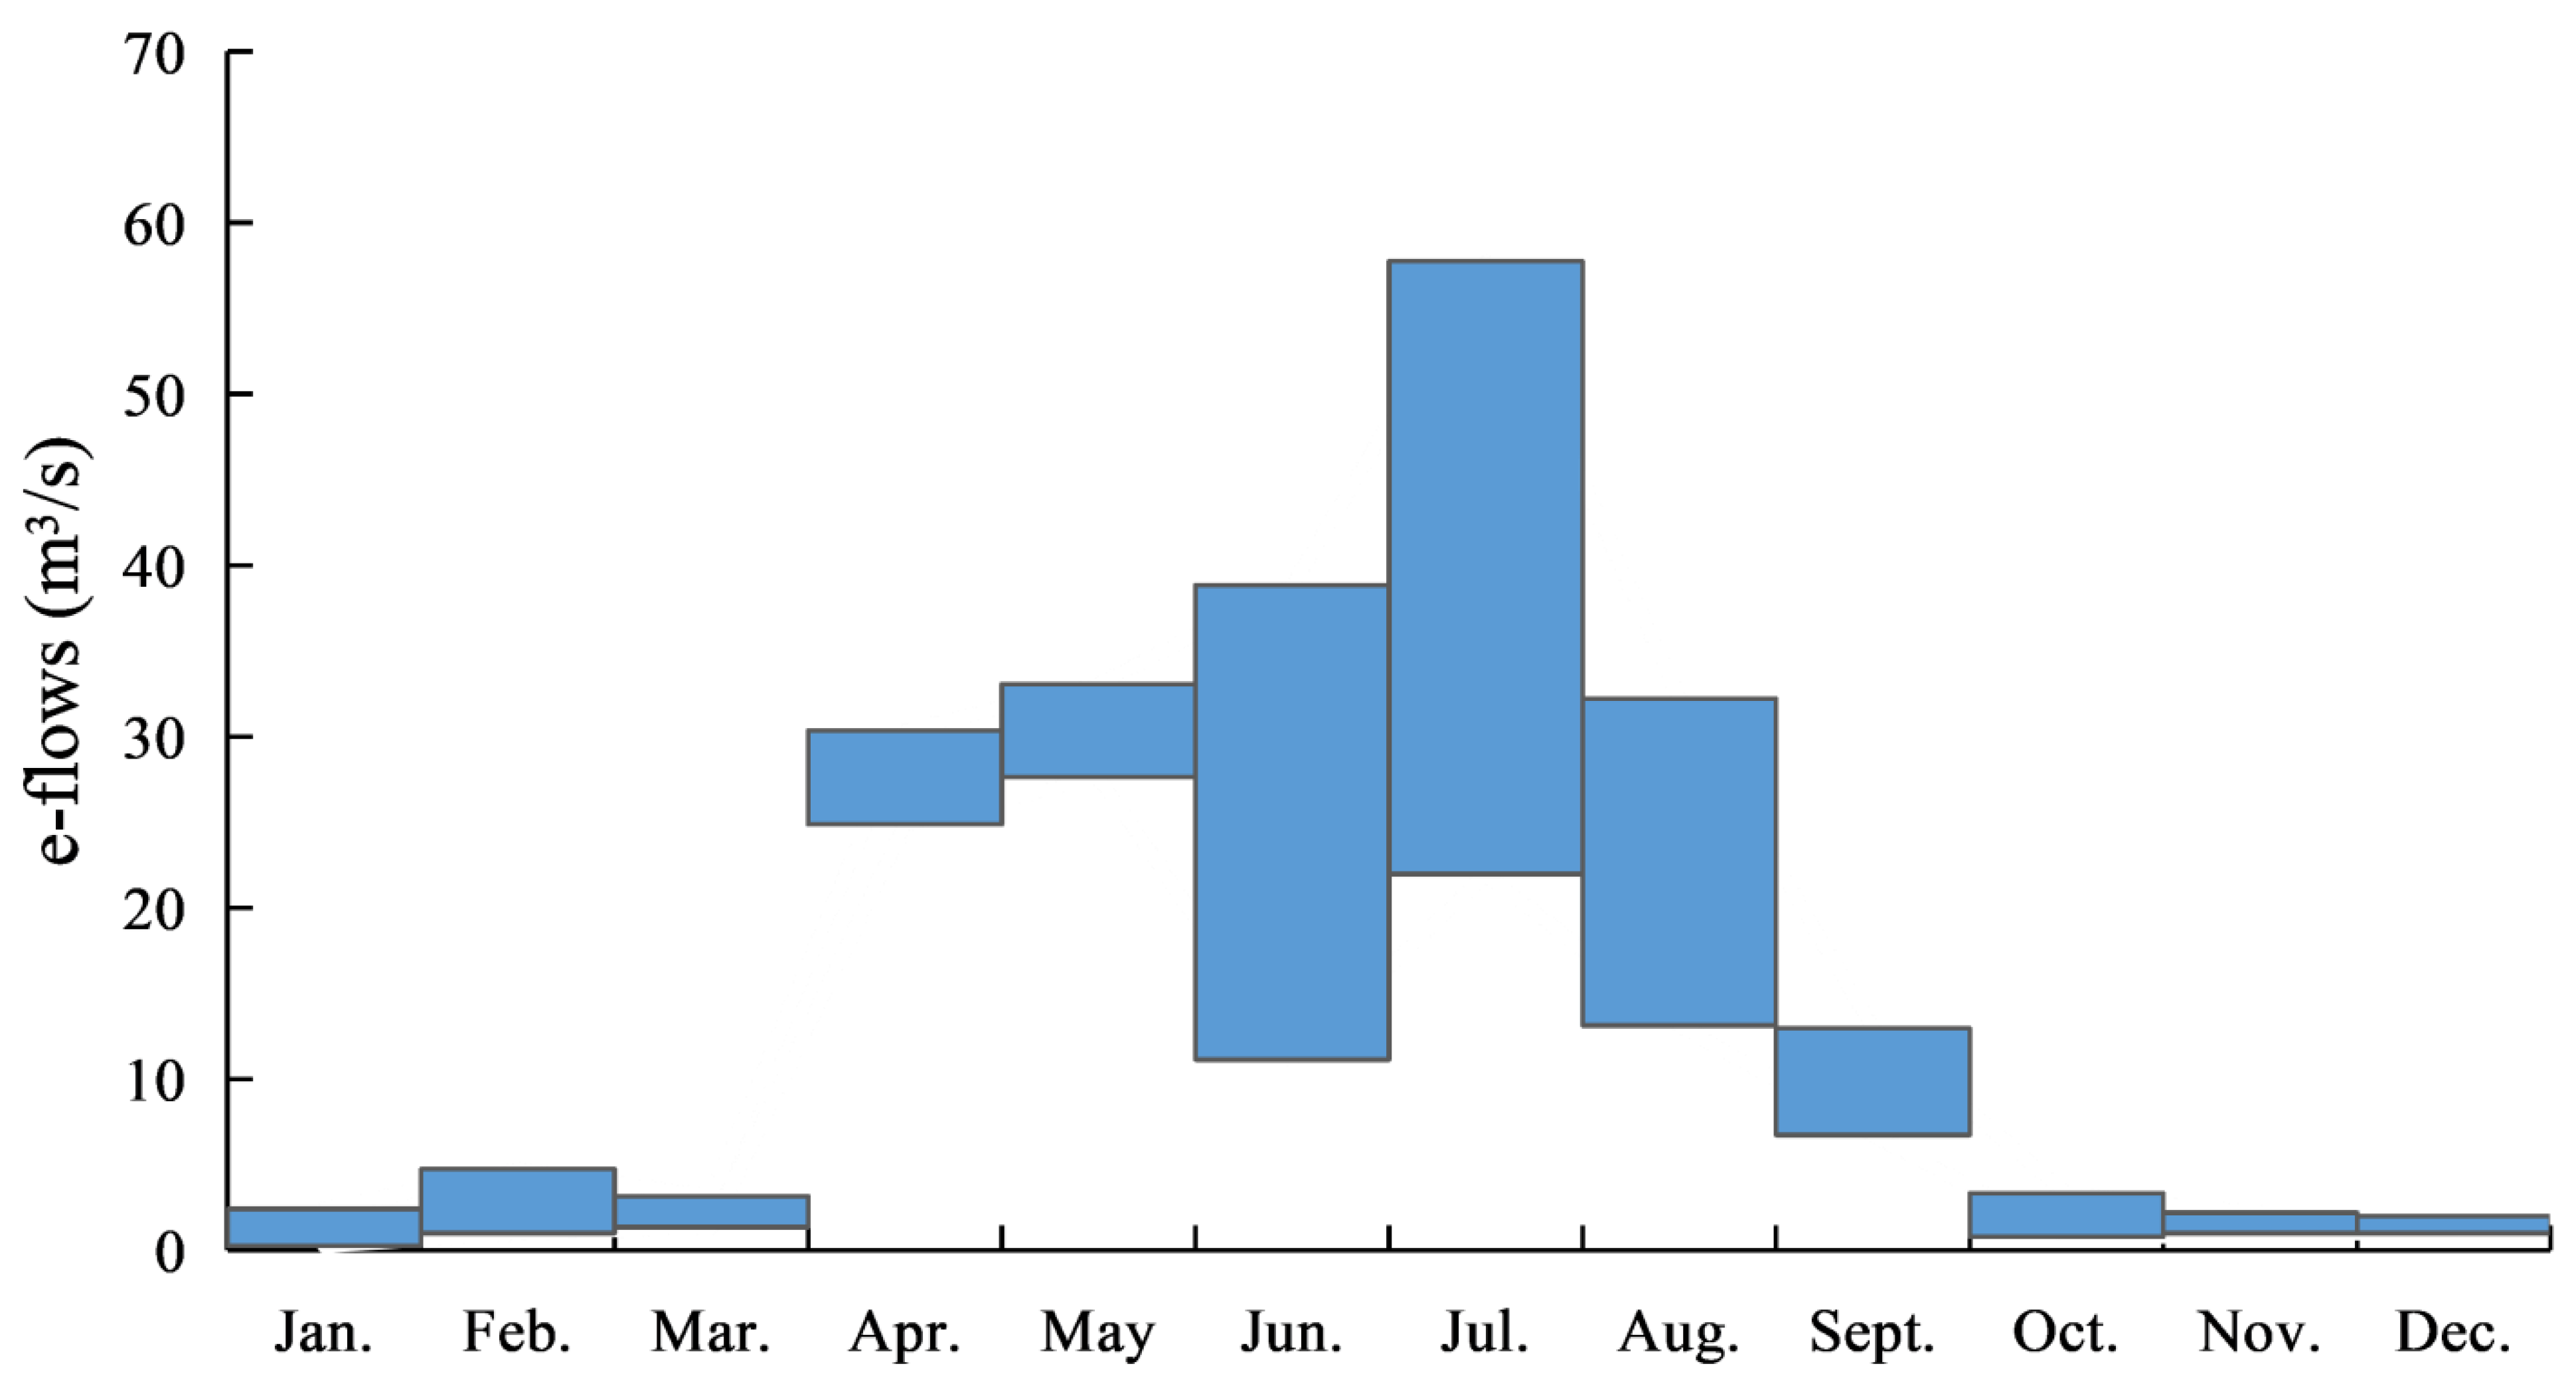
Table 5). Nine combinatorial scenarios (a: M1_M4, b: M1_M5, c: M1_M6, d: M2_M4, e: M2_M5, f: M2_M6, g: M3_M4, h: M3_M5 and i: M3_M6) of hydrological methods were provided for constructing the evaluation matter element, classical domain and joint domain. Due to the limitation of the ecological data, we did not consider ecological indicators such as the spawning areas directly, and a range of two e-flow interval curves could be identified as a boundary (
Figure 5). The maximum value of the curve was the envelope value of all scenarios, while the minimum value was the minimum value of all scenarios.
After the input of nine e-flow scenarios into the matter element, a matter element of e-flows could be constructed. The three elements were the name of the scenarios (
N), the unit of the evaluation (
C), and the value corresponding to the evaluation unit (
X). In this study, we used percentages instead of numerical values to describe the e-flows in the matter element in order to keep uniformity with the government guidelines in
Table 1 and
Table 2. Lastly, the matter element of the e-flows
R is expressed as follows:
where
Ri stands for the
ith e-flow scenario for
n months, in which the maximum for
n is 12,
P0 is the name of the scenarios,
Ci is the
ith feature of the unit to be evaluated for the e-flow status of the
ith month,
Xi is the value corresponding to the evaluation index
Ci and we define the percentage of the
ith month’s flow value of the
ith e-flow senarios in the monthly average flow in the pre_dam period as
Xi (e.g., for e-flows in January for the
ith e-flow scenarios is
Q1, the monthly average flow in the pre_dam period is
Q2, and then
Xi could be calculated as
Q1/Q2):
For constructing the classical domain
Rj, five standard evaluation grades (
Table 6) were selected (i.e., perfect, very good, good, fair and poor).
Then, the classical domain
Rj is expressed as follows:
For constructing the joint domain
Rp, the upper and lower thresholds of the e-flows in different periods were determined to be 10–100% in the normal period and 20–100% in the breeding period. Then, the joint domain
Rp is expressed as follows:
4.2.2. Determine the Indicator Weights
Before evaluating the different results, we needed to calculate the weights of each month in different periods, which were considered separately. Weights usually indicate the contribution of each month throughout the whole period, which means that the greater the weight, the more important that month’s e-flows. The water manager needs to pay more attention to the high weight months for determining e-flows. In this study, the fuzzy analytic hierarchy process (FAHP) was used to calculate the weight of each month in different periods (
Table 7). The value of the weight depends on the range of hydrological alteration in each month, and the scientific experience of the water managers was also considered. Here, priority was given to the importance of the breeding period, and it was considered that the breeding period was much more important than the normal period.
4.2.3. Correlation Degree Calculation
The premise of using MEA is to maximize the use of effective watershed data and select different calculation methods for e-flow calculation. Before that, we needed to calculate the distance from the evaluated objects (
R) to the classical domain (
Rj) and joint domain (
Rp). We took the standard evaluation grade “perfect” as an example here to explain its calculation:
Since
is less than
, then
is 34.35%, and all the e-flow results of different methods (
Table 8) and scenarios (
Table 9) which met the requirements of the standard grade and the best e-flow results could be recognized.
4.3. Optimized E-Flow Results
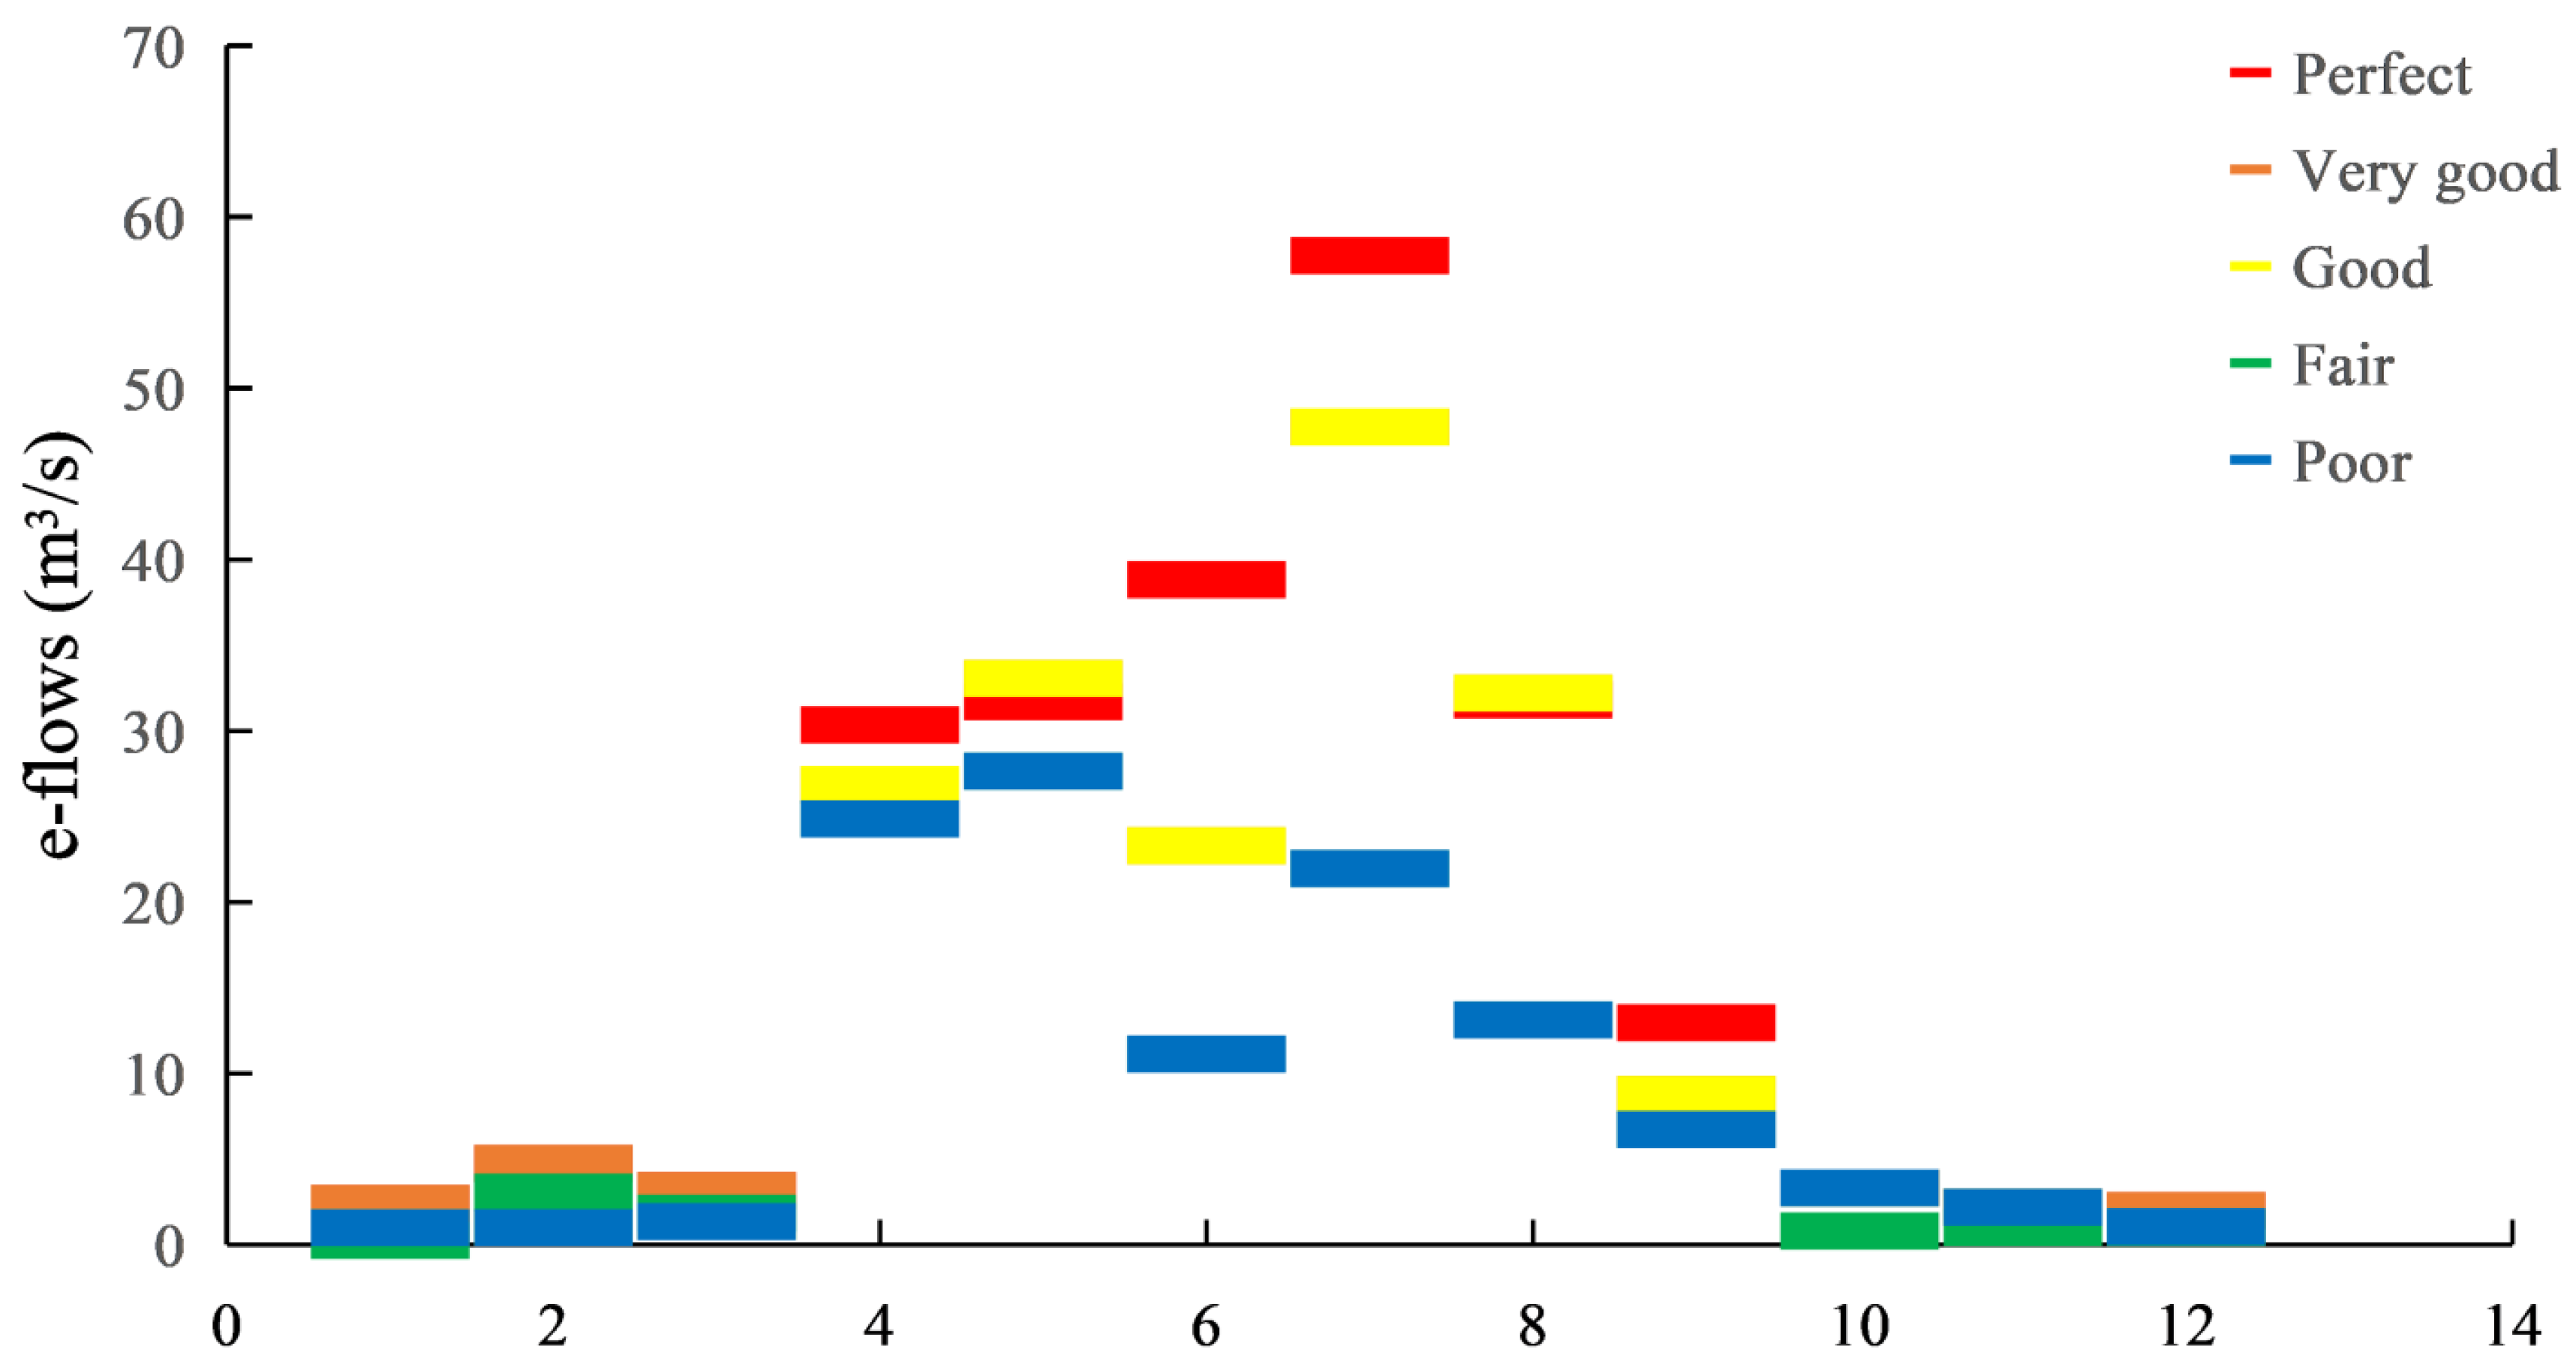
Based on MEA, a new optimized range of interval e-flow curves in 12 months was drawn (
Figure 6). According to the calculated results in
Table 9 and Equation (8), it can be seen that under the perfect criterion, schemes d and g met the requirements. The remaining solutions were not satisfied. Plan d was better from the point of view of improving economic benefits. Under the very good criterion, plans a, c, d, f and i met the requirements. However, the economic benefits of several schemes were prioritized as c > d > a > i > f. Under the condition of good, all the environmental flow scenarios met the conditions, but from the perspective of economic benefits, plan d was the optimal process. However, in the process of water resource management, due to the different water resource conditions between southern and northern China, water resource managers need to not only consider economic benefits but also take into account the sustainable development of river ecology.
The best e-flows are also shown in
Table 9. However, how to select a result for the end e-flow planning depends on water managers and the overall planning requirements for watershed water resources. After all, the evaluation results were optimized when compared with the envelope curve results in this paper.
5. Discussion
According to the priority classification list, the study area ranked as a medium-priority dam in the classification framework. There are no rare species in the downstream, but it does have a spawning area. One has to consider the breeding period requirements. Because of its high degree of regulation, water managers can make full use of water resources and minimize the negative impacts on the ecosystem if appropriate e-flows can be formulated.
Comparing the different periods for dam construction, the flow process had undergone significant changes. Due to the role of reservoir regulation and irrigation, between the pre_dam and post_dam period, the flow was reduced significantly from March to July and changed smoothly over the months. Since the spawning period is between April and September each year, this makes water allocation during this period particularly important.
The water allocation for the whole year consists of different periods for every single river. In the Huangchuan River, water managers need to consider the valuable hydrological database and the related guidelines. Three hydrological methods were collected to calculate the base flow and the other three hydrological methods for suitable flow. We adopted nine hydrological scenarios which were recombined by the six methods. The historical data of each month was calculated by frequency. In fact, in the hydrological methods from the government guidelines, most of them are based on frequency calculation. Then, water managers formulate e-flows according to different objectives by selecting different percentiles. In this case study, there were some important spawning areas for fresh-water fish species, which play a key role in the local economies and can bring considerable economic income to local residents [
33]. Based on many examples in specific rivers, here, we selected the 95th and 90th percentiles as the e-flow standards for the base flow. What is more, we paid more attention to the breeding period (April–September). Then, we could find nine different e-flow scenarios planned for evaluation. The nine e-flow scenarios showed some differences in each month due to the different emphases on the calculation method.
In the government guidelines, it can be noticed that if there is a river rich in water resources, we have to keep the river in “very good” condition for the base flow, and the suitable flow has to be above the “perfect” condition. If there is a river poor in water resources, we have to keep the river in “good” condition for the base flow and keep the river in “perfect” condition for the suitable flow. In China, most of the medium-to-small-scale rivers are normally under such limited data situations, and water managers always can just use the hydrological methods to plan the e-flows, such as with the Huangchuan River. Due to the irrigation purpose of the dam, water managers need to maximize the economic rationale and minimize the pressure on the ecosystem to try and make the least amount of flow alterations.
Here, we built the DSE model to quantify different e-flow planning based on the MEA method. If the result of the correlation degree calculation is between 0 and 1, this indicates that the result meets the current ecological grade. If the result is greater than −1 and less than 0, then the result does not meet the current ecological grade, but the current grade can be achieved by flow adjustment, and the smaller the value, the easier it is to reach the standard evaluation grade. It can be seen from the results that the flow scenarios obtained by the compositive hydrological scenarios rarely met the requirements of the recommended grade in the guide. There was only one solution that achieved the good condition, which means water managers can use the flow regime for the e-flows if they just want a good ecosystem condition. However, all of the solutions can be achieved for the corresponding grade. For water managers, the biggest difficulty is how to effectively choose a proper calculation method and make a cost-effective decision. Here, the objective is not only to meet the ecological needs but also to determine the most rational use of water resources to create economic value and reduce regional water conflicts. From the government guidelines, Huangchuan River needs to be at least above the “good” condition. The resulting value simply indicated whether the result was up to standard for the corresponding grade.
6. Conclusions
As is the case with most studies, the hydrological approach is suitable as a means of macro-management rather than as a means of calculation for technical implementation. Due to the complex precipitation condition and strong human activities, it is not reasonable to just use hydrological methods to calculate e-flows in the study area. It can be seen from the calculation results that even if the demand conditions of different periods were considered, a reasonable e-flow process could not be obtained. There is no doubt that in the e-flow assessment, ecological factors need to be fully considered to accurately formulate the flow process and meet the needs of the ecosystem. However, when utilizing this DSE model, water managers can select the appropriate scenario from various methods for the calculation of the e-flows according to their specific needs instead of by their subjective judgment.
By analyzing the relevant guidelines for e-flows promulgated by the Chinese government, it is not difficult to find that although the e-flow assessment framework proposed by the Chinese government is comparatively complete. However, due to the data limitations of most rivers and the dramatic disruption of human activities caused by economic development, it is difficult for water managers to rely solely on official guidelines for accurate environmental assessments. The technical components in the guidelines are lacking. It can be seen that it is absolutely necessary to evaluate the effectiveness of the results of different methods. The DSE model proposed in this study is just able to quantify the merits of the calculation results of different methods.
On the other hand, because of the numerous methods for determining e-flows and the lack of rigorous quantitative calculations for the assessment of effectiveness, the MEA method used in this study can scientifically reflect the pros and cons of each method. These advantages and disadvantages depend on the water managers’ appeal to the river basin management. By using this method to evaluate the results, it can effectively help water managers make more scientific decisions. The DSE model can enable water managers to choose the most suitable plan from various e-flow scenarios according to their own needs. However, in the face of complex ecosystems and increasingly severe ecological conditions, stakeholders need to actively participate in the study of e-flow assessment to propose a more proper e-flow assessment framework that can effectively help manage water resources and to achieve sustainable development of water resources.


