Overflow Tests on Grass-Covered Embankments at the Living Lab Hedwige-Prosperpolder: An Overview
Abstract
:1. Introduction
2. Materials and Methods
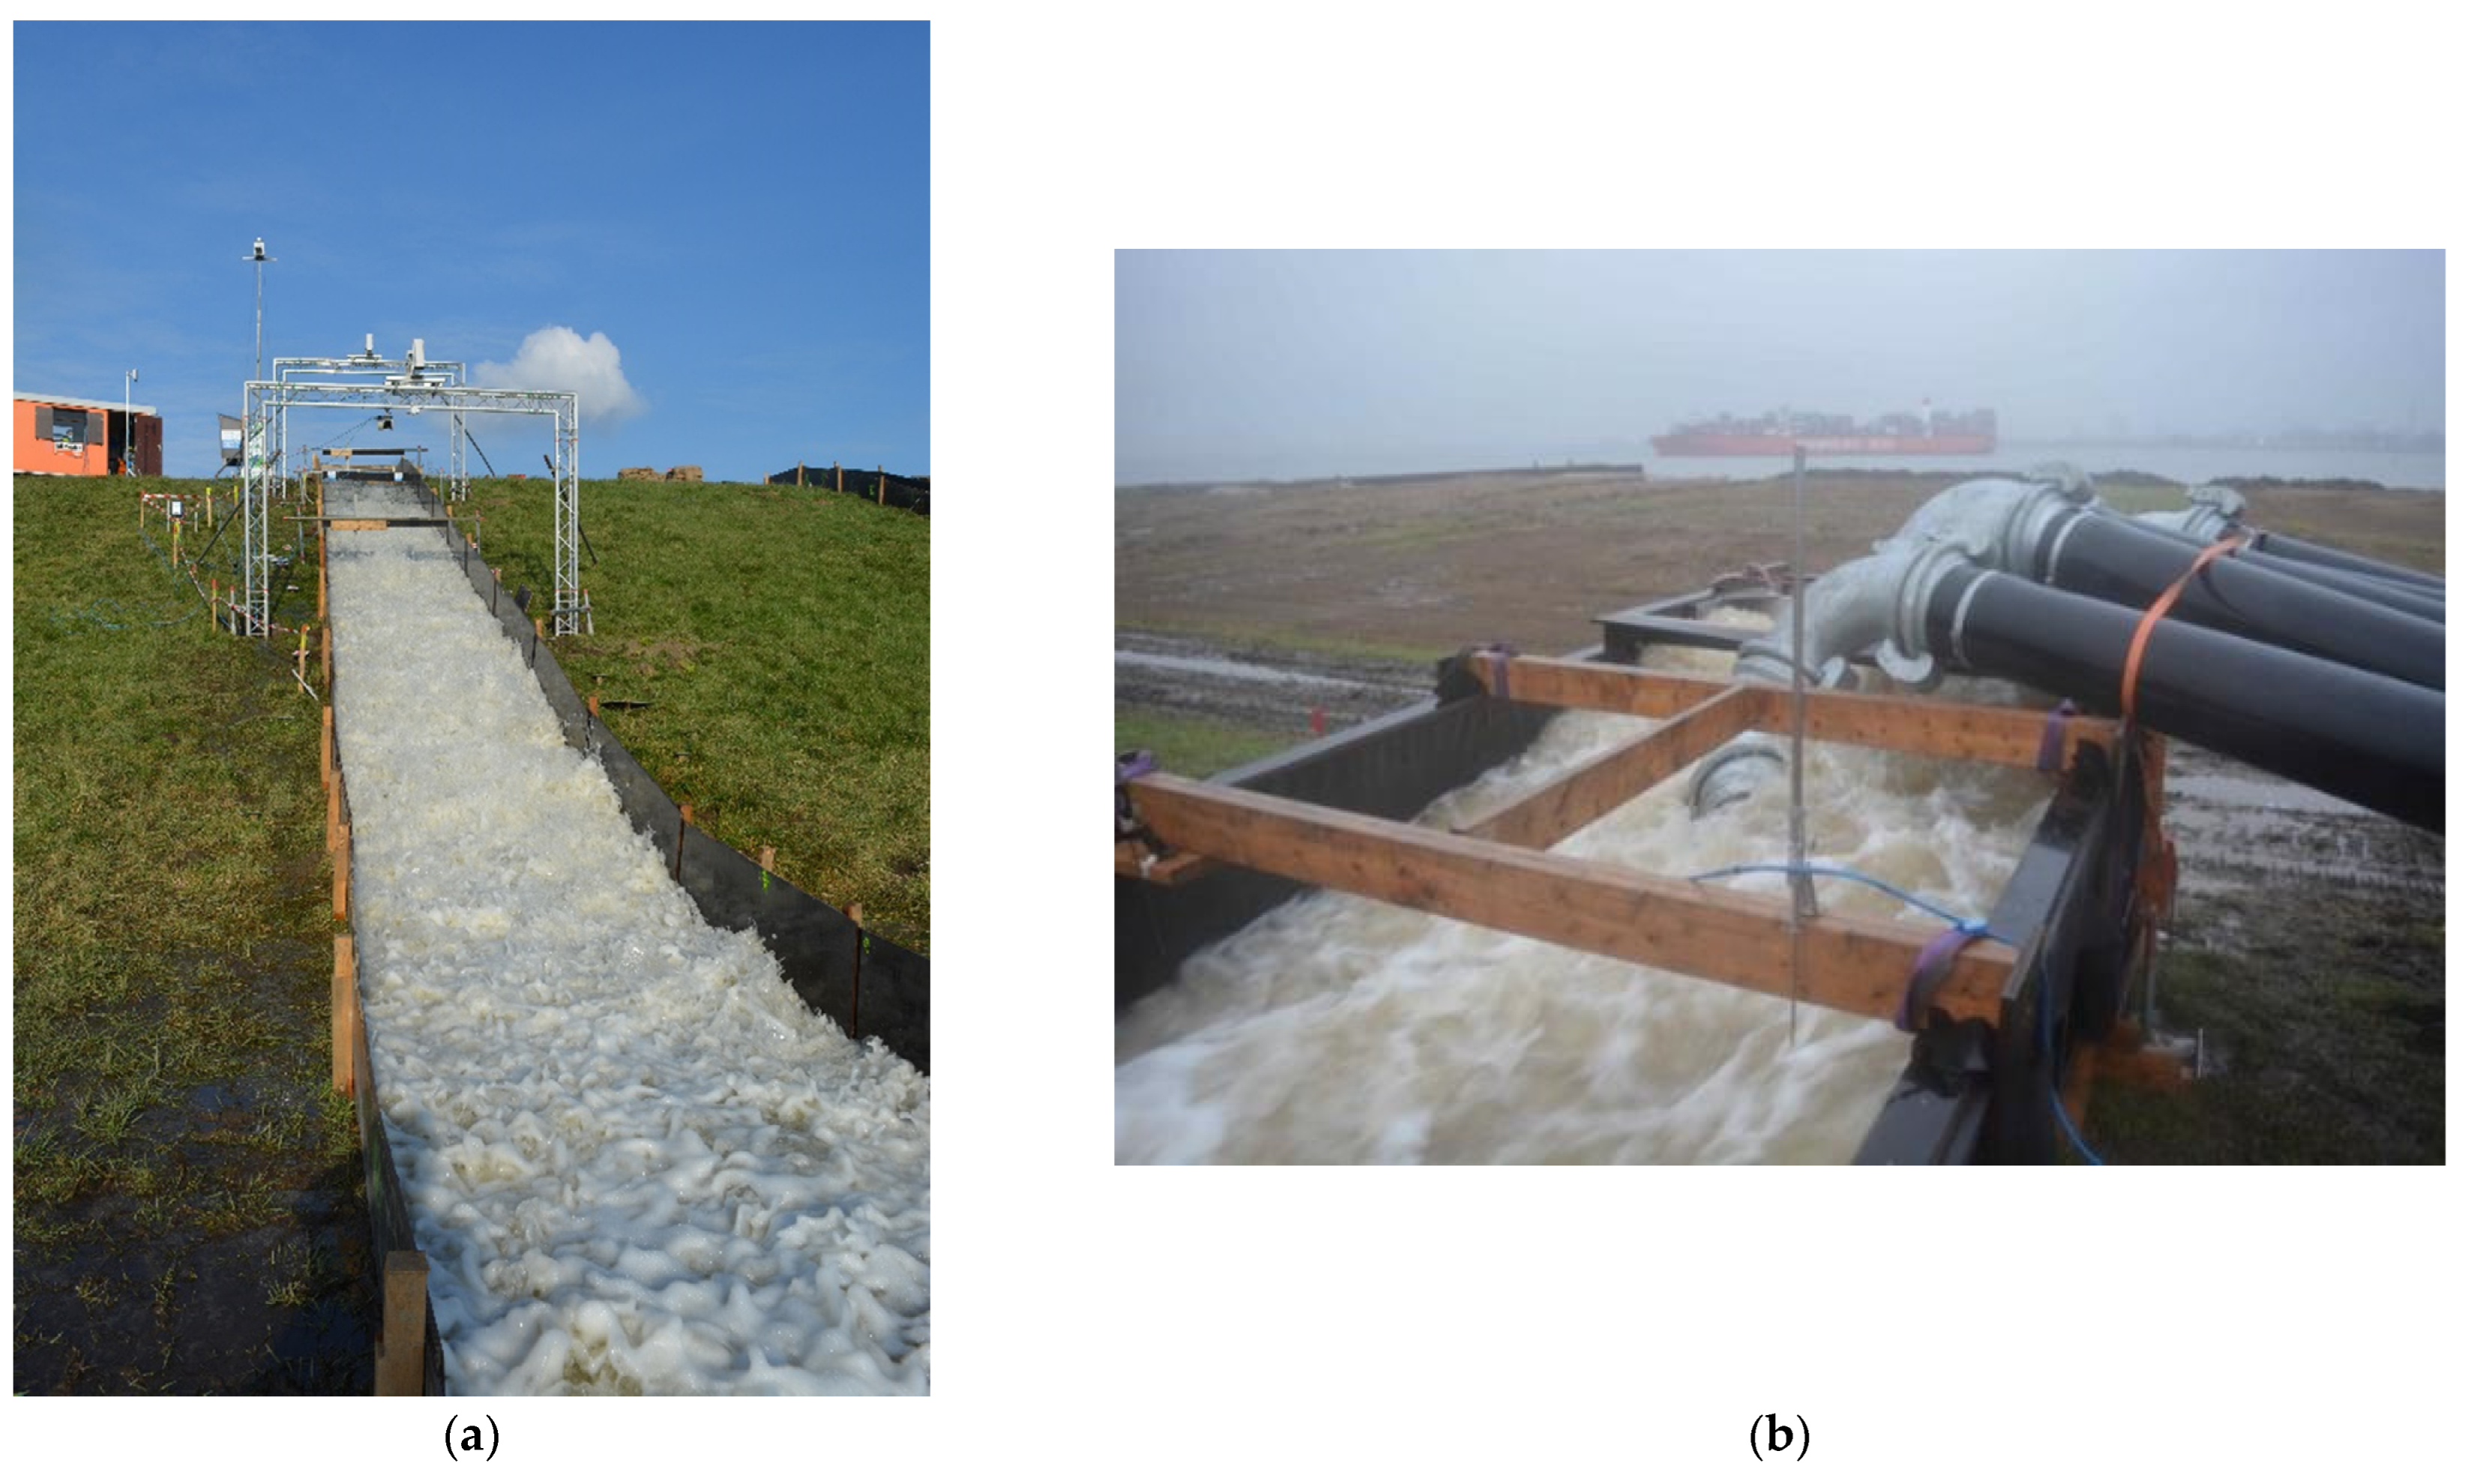
2.1. The Overflow Simulator
2.2. The Test Setup at the Dike
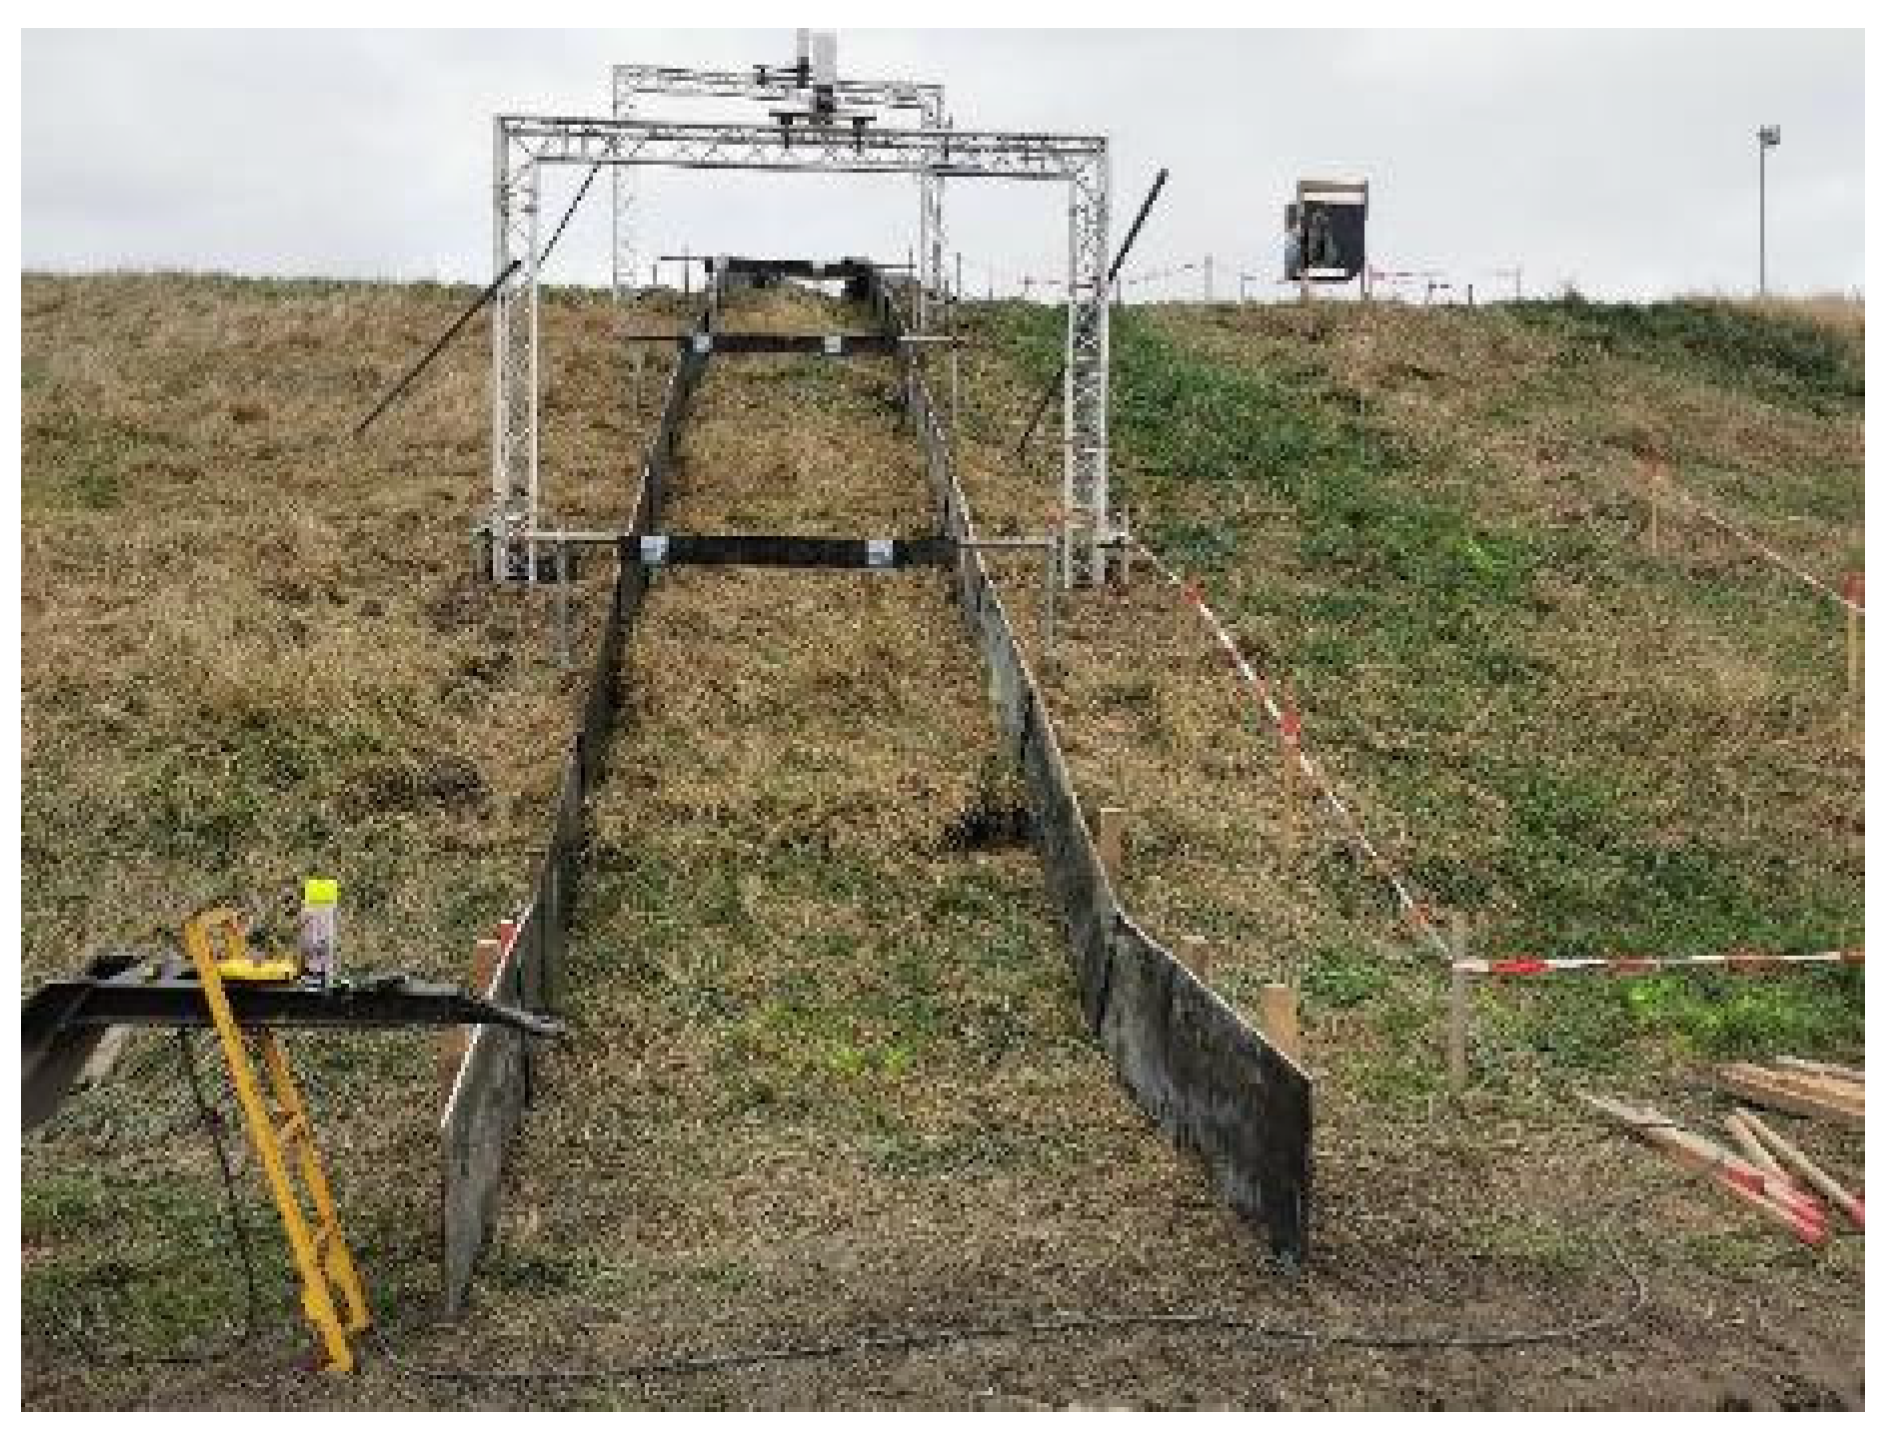
2.2.1. Flow Canal
2.2.2. Test Plan and Goals of Each Test
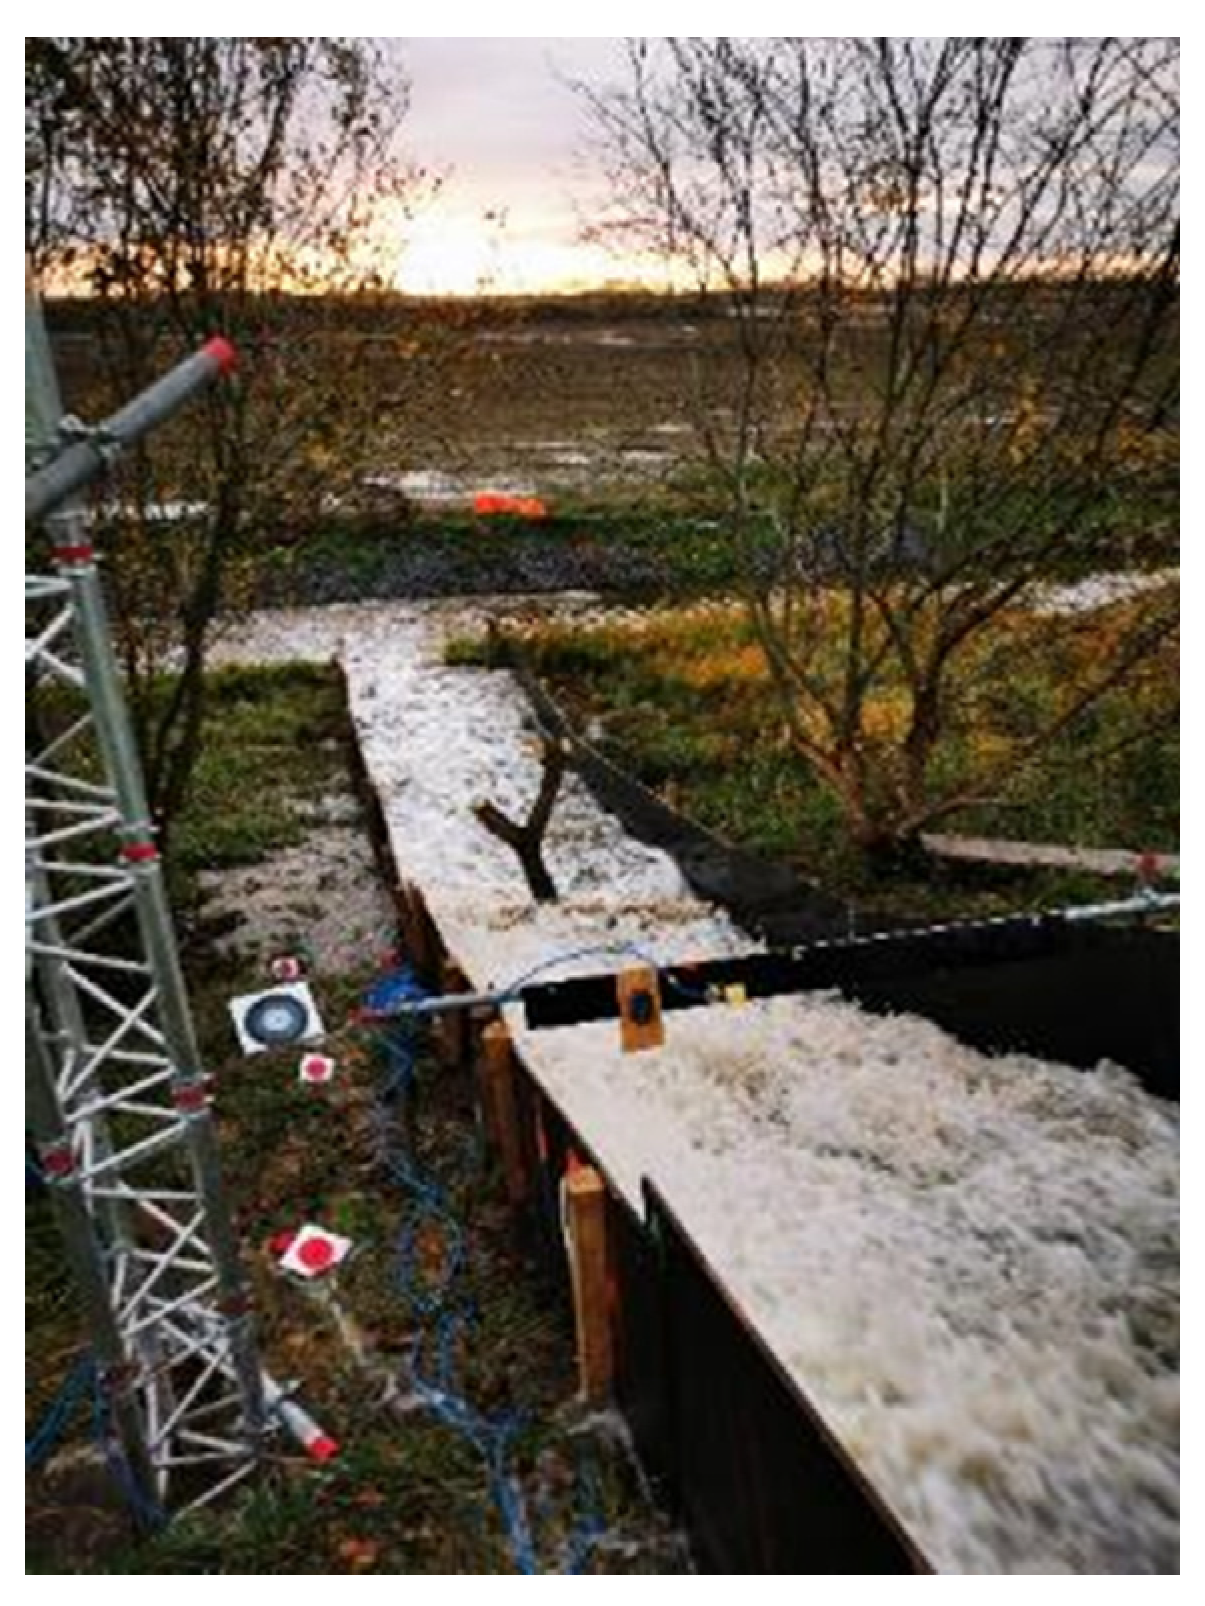
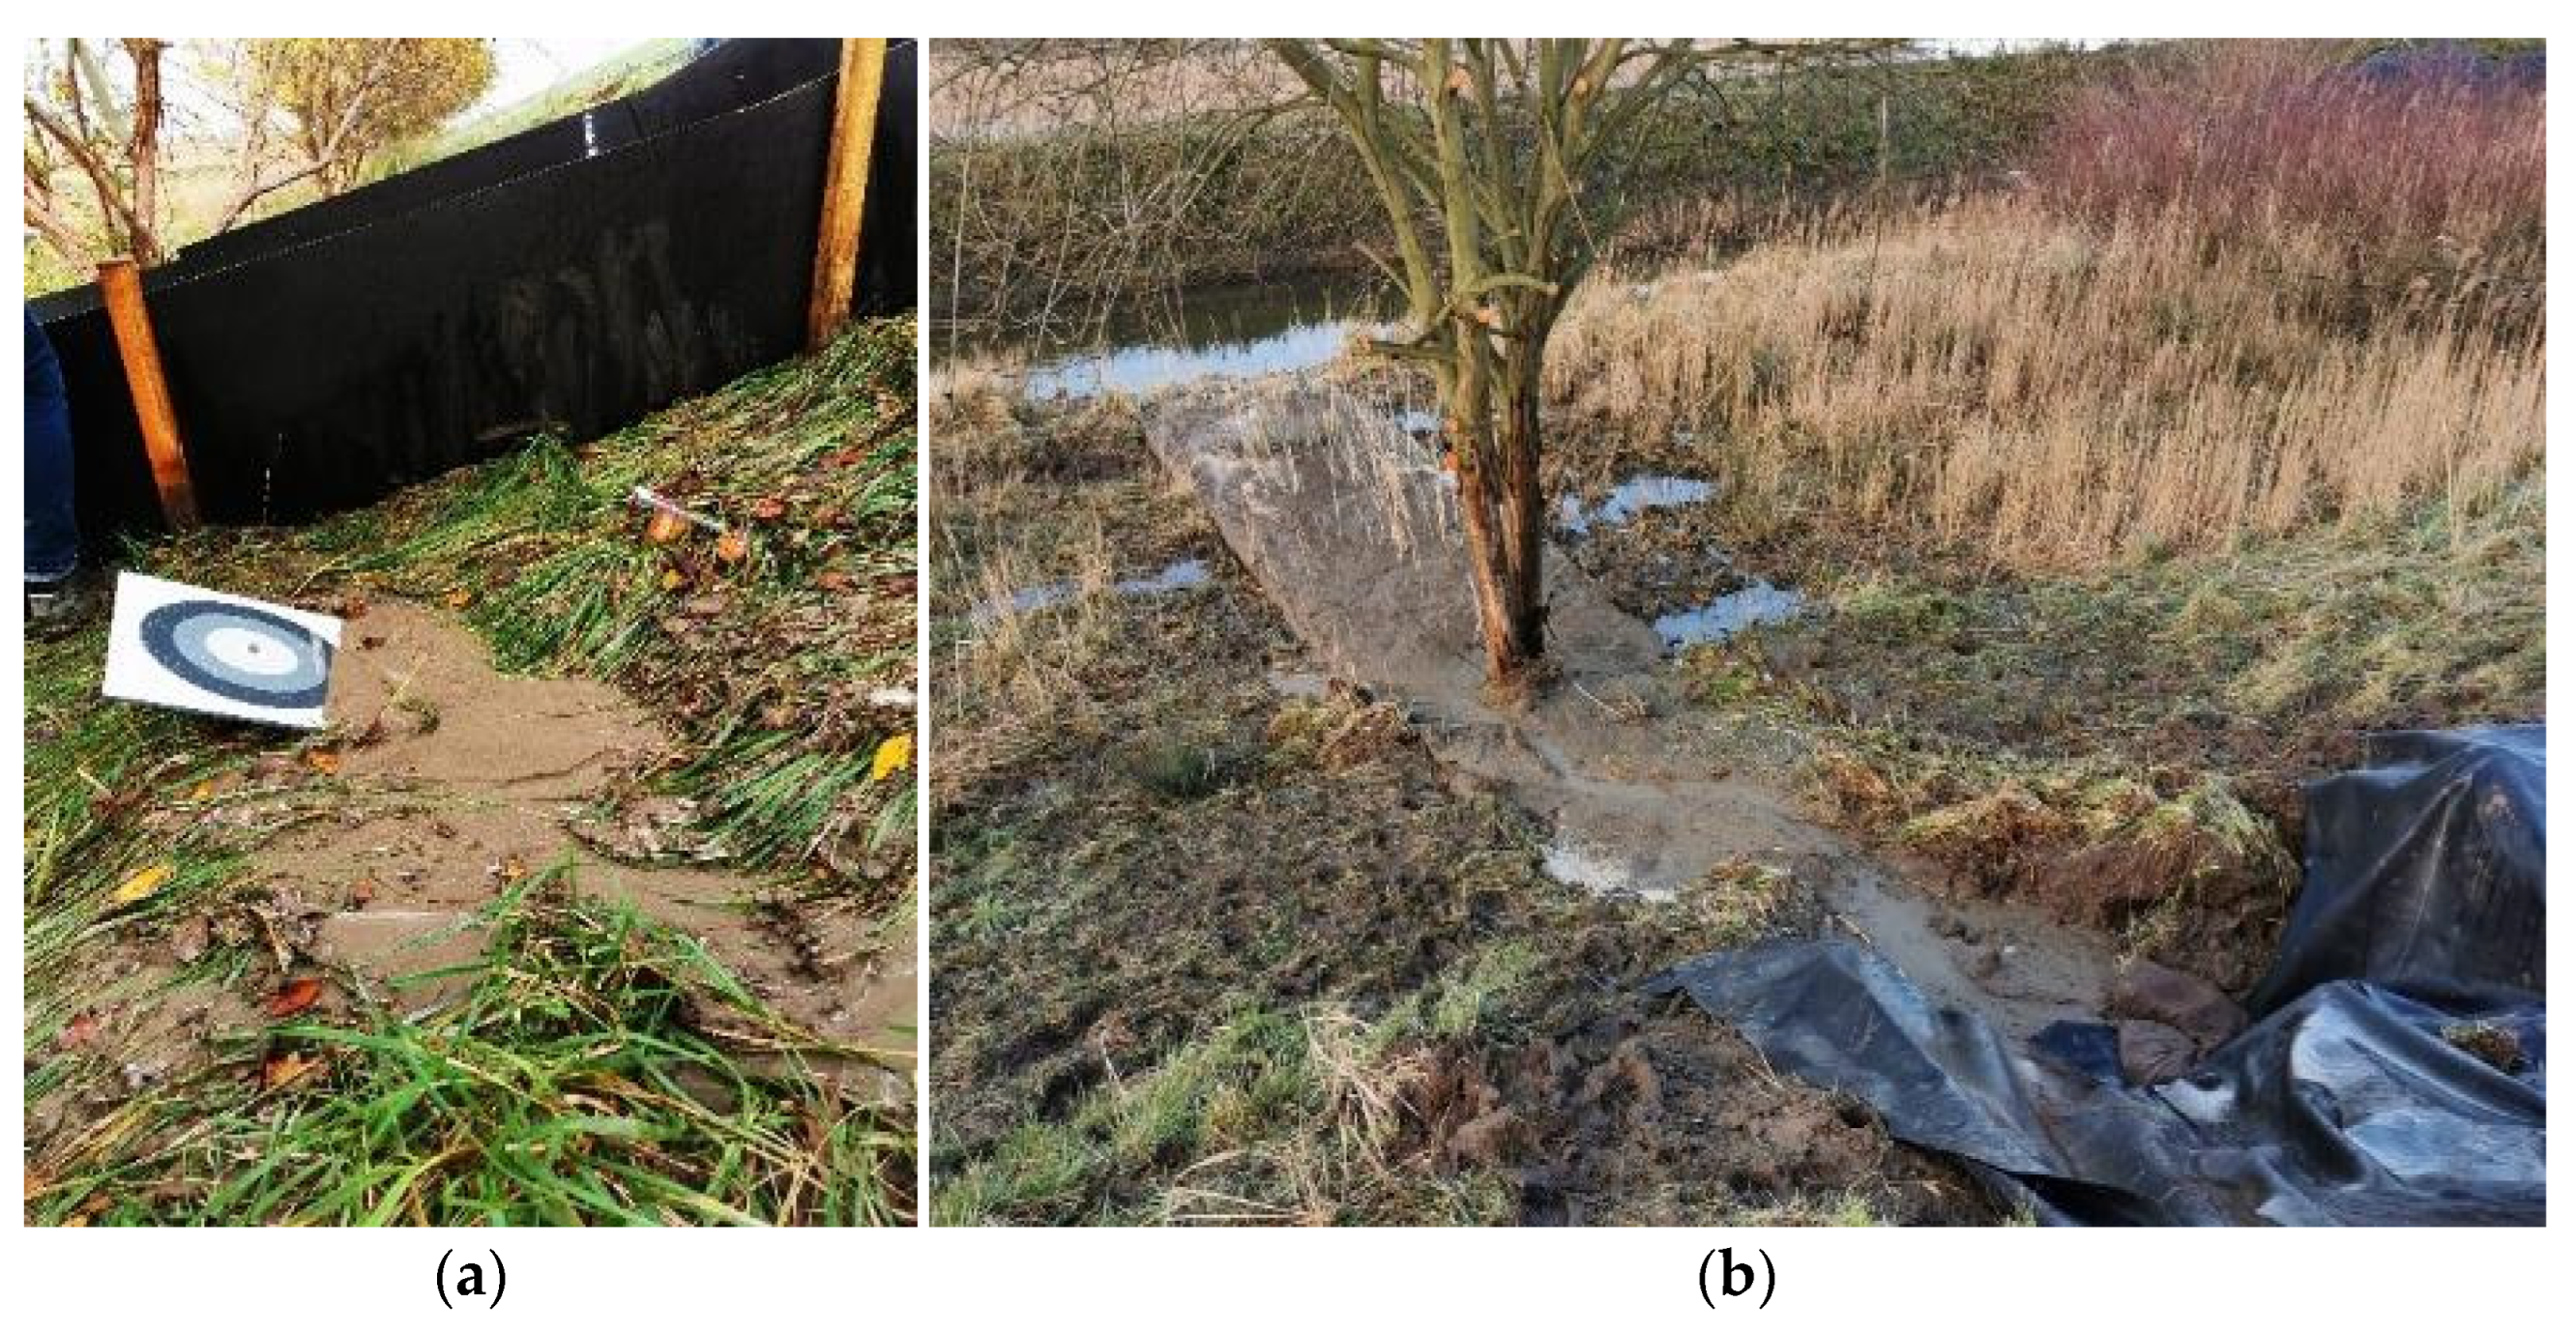
- the presence of a tree at the toe of a dike in the test section (Figure 4);
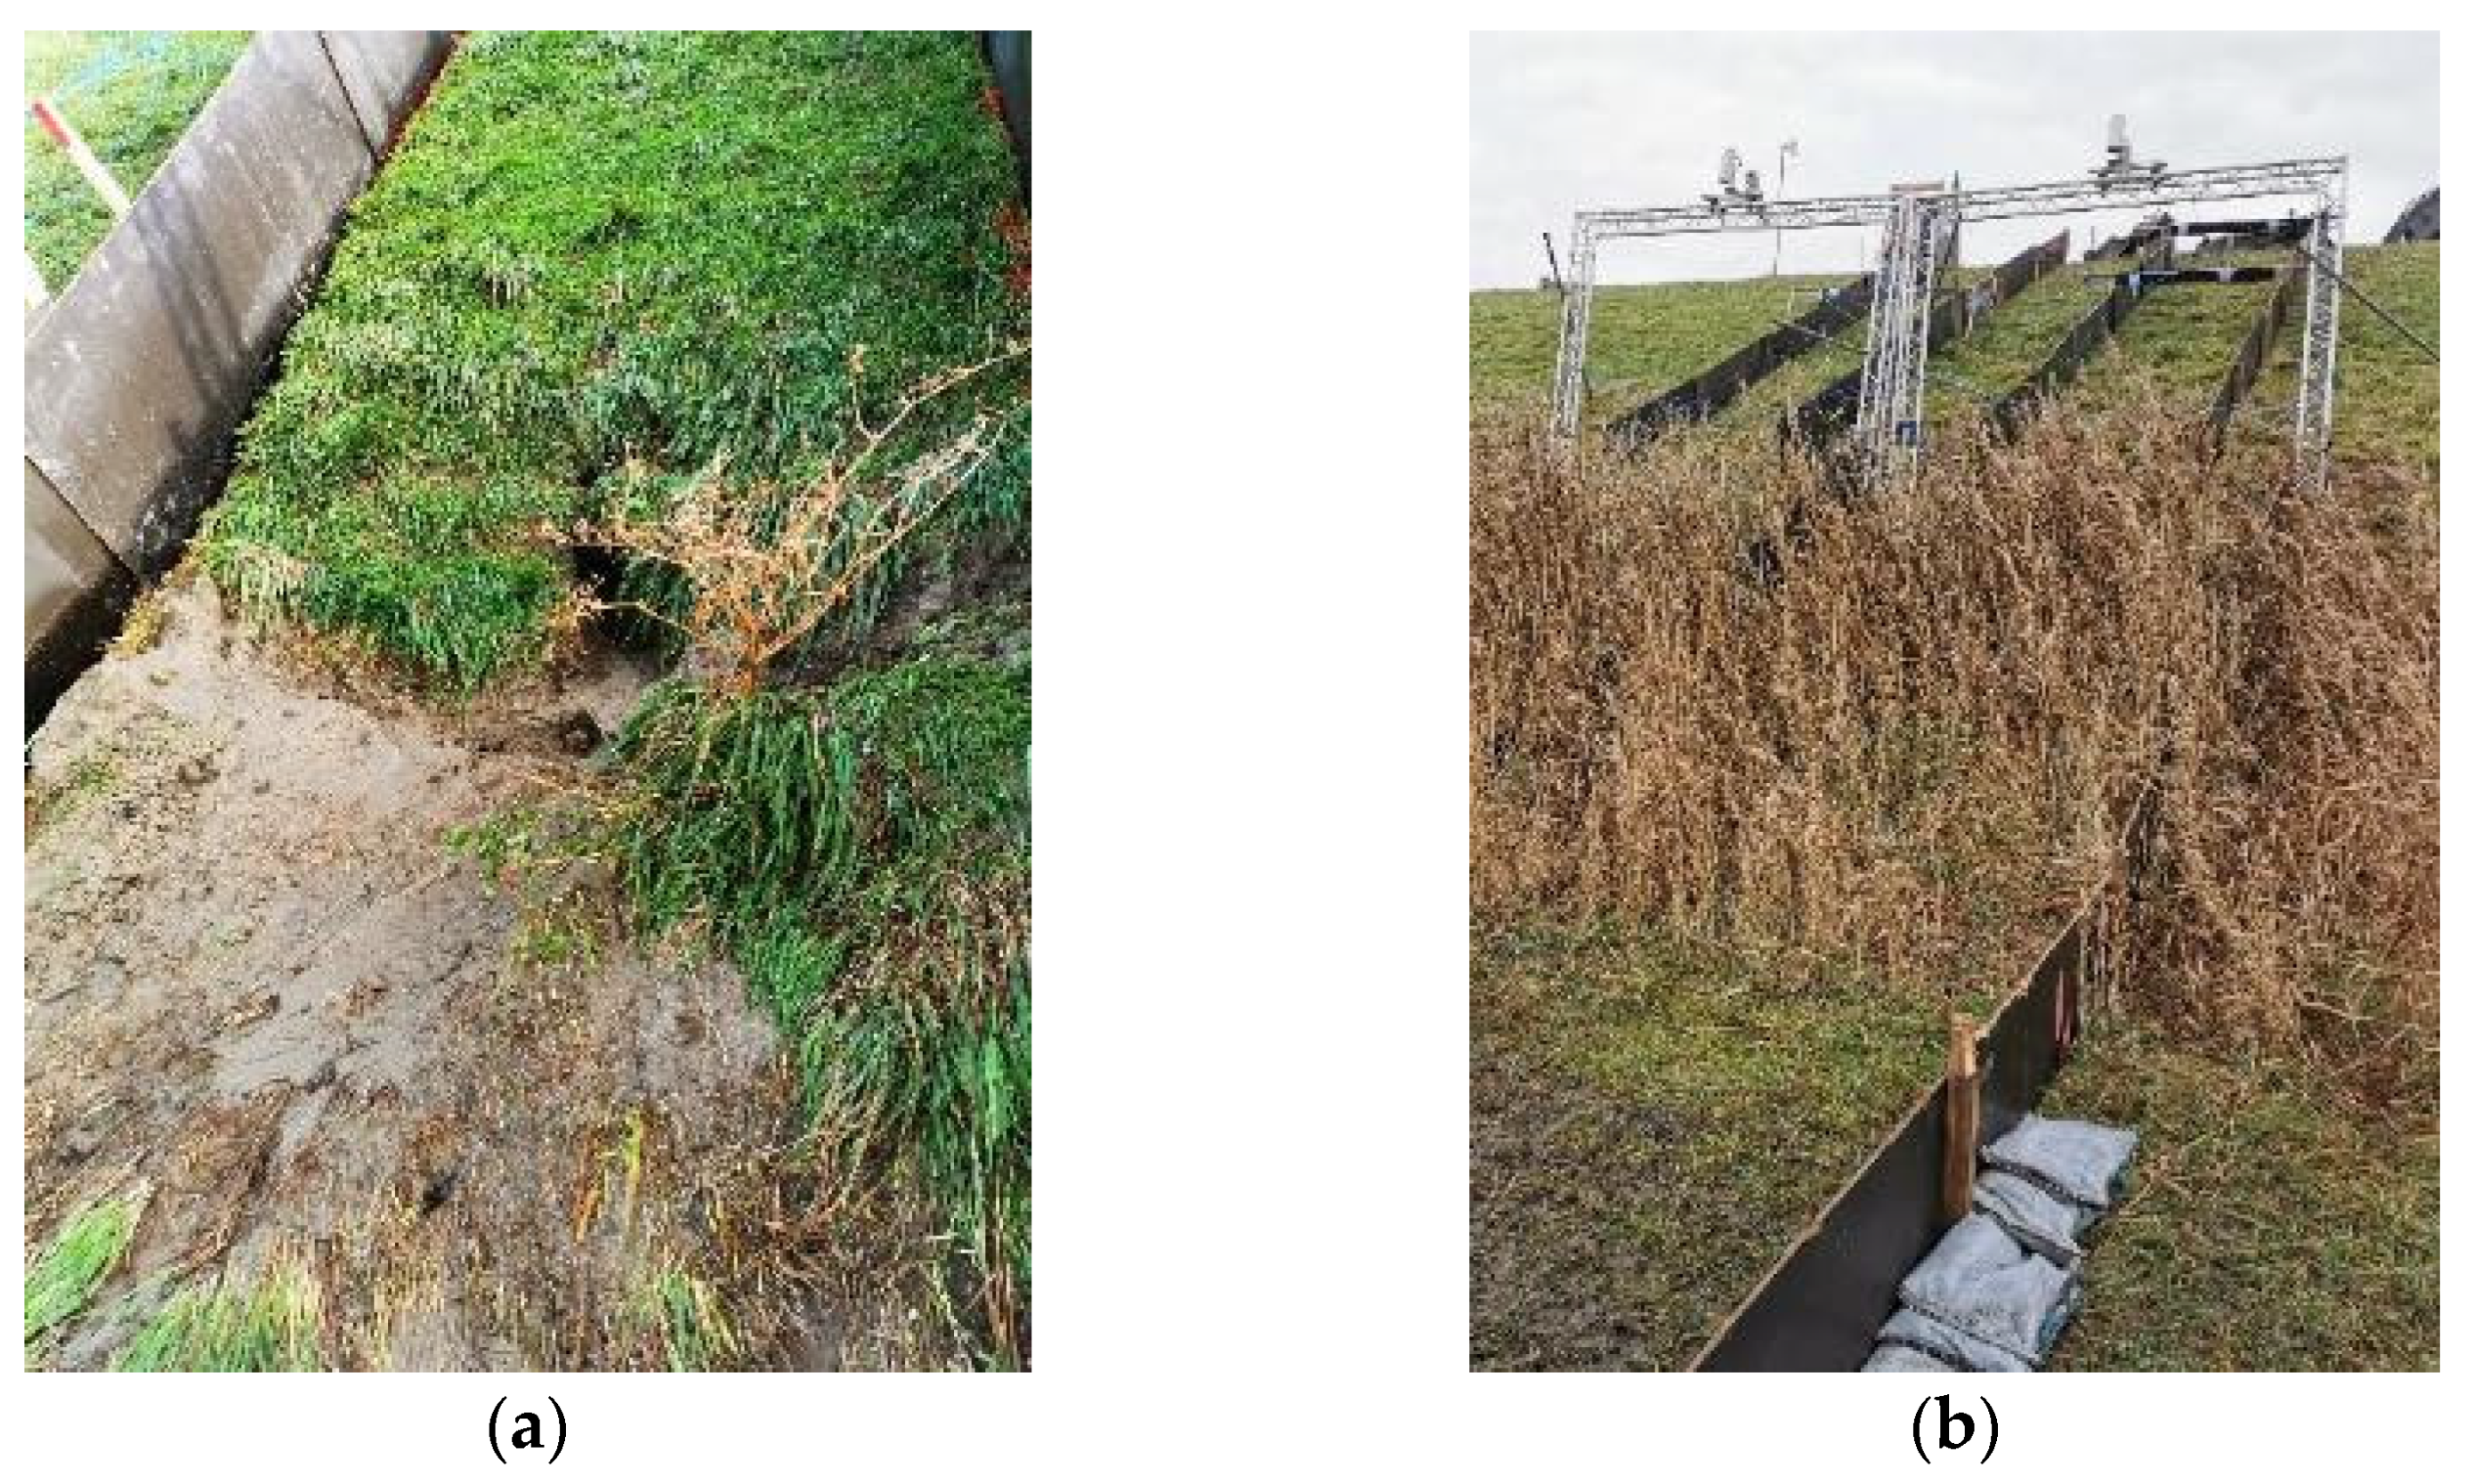
- a damaged dike profile at the toe, mimicking damage by animals like grazing sheep;
- hard structures and transitions on the dike (e.g., concrete staircase).
2.2.3. Measurement Methods and Instruments
Sensory Measurements
- Looking
- Touching
- Listening
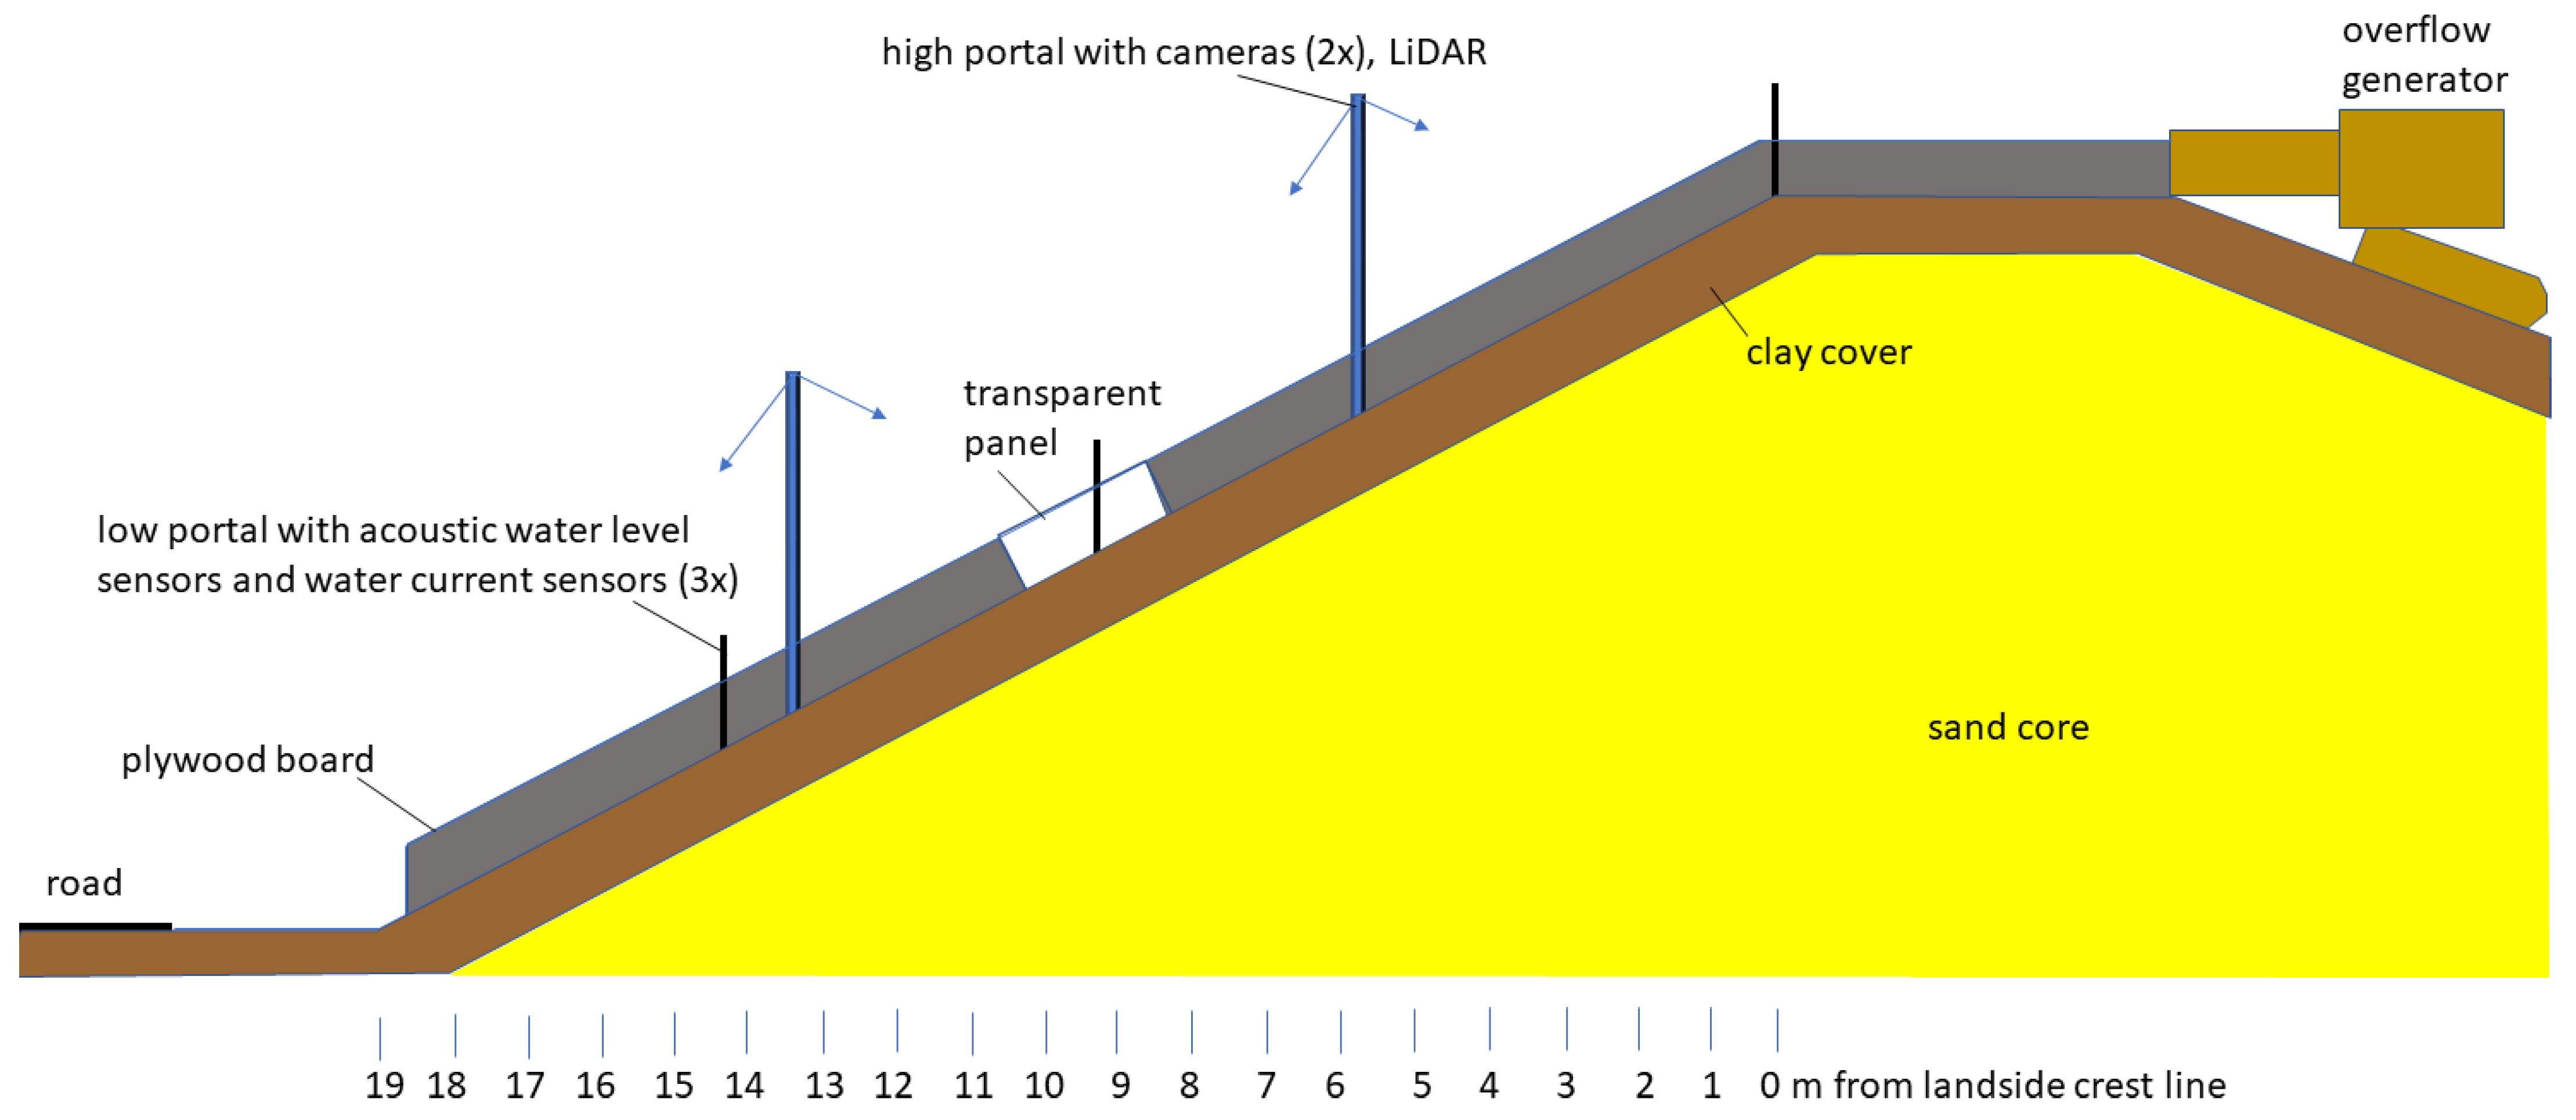
- Cameras (IDS uEye UI-5270SE-C-HQ 3,17Mpix ethernet camera) on portals (two large portals incl. Particle Tracking Video (PTV) measurements) tracked the flow along the crest and landside slope of the dike;
- Cameras for photos and video (incl. high speed camera’s, Krontech Chronos 2.1 Full HD camera and IDS uEye UI-3060CP C USB3 camera) captured the flow pattern from the top and via transparent side panels;
- Acoustic water level sensors (Banner Engineering Q45ULIU64ACRQ6) monitored the water level at several locations on the crest and the landside slope;
- Electro-magnetic water current sensors (Valeport Limited Model 802) (small portals, see Figure 2) measured flow velocities at the crest and at two locations over the dike slope;
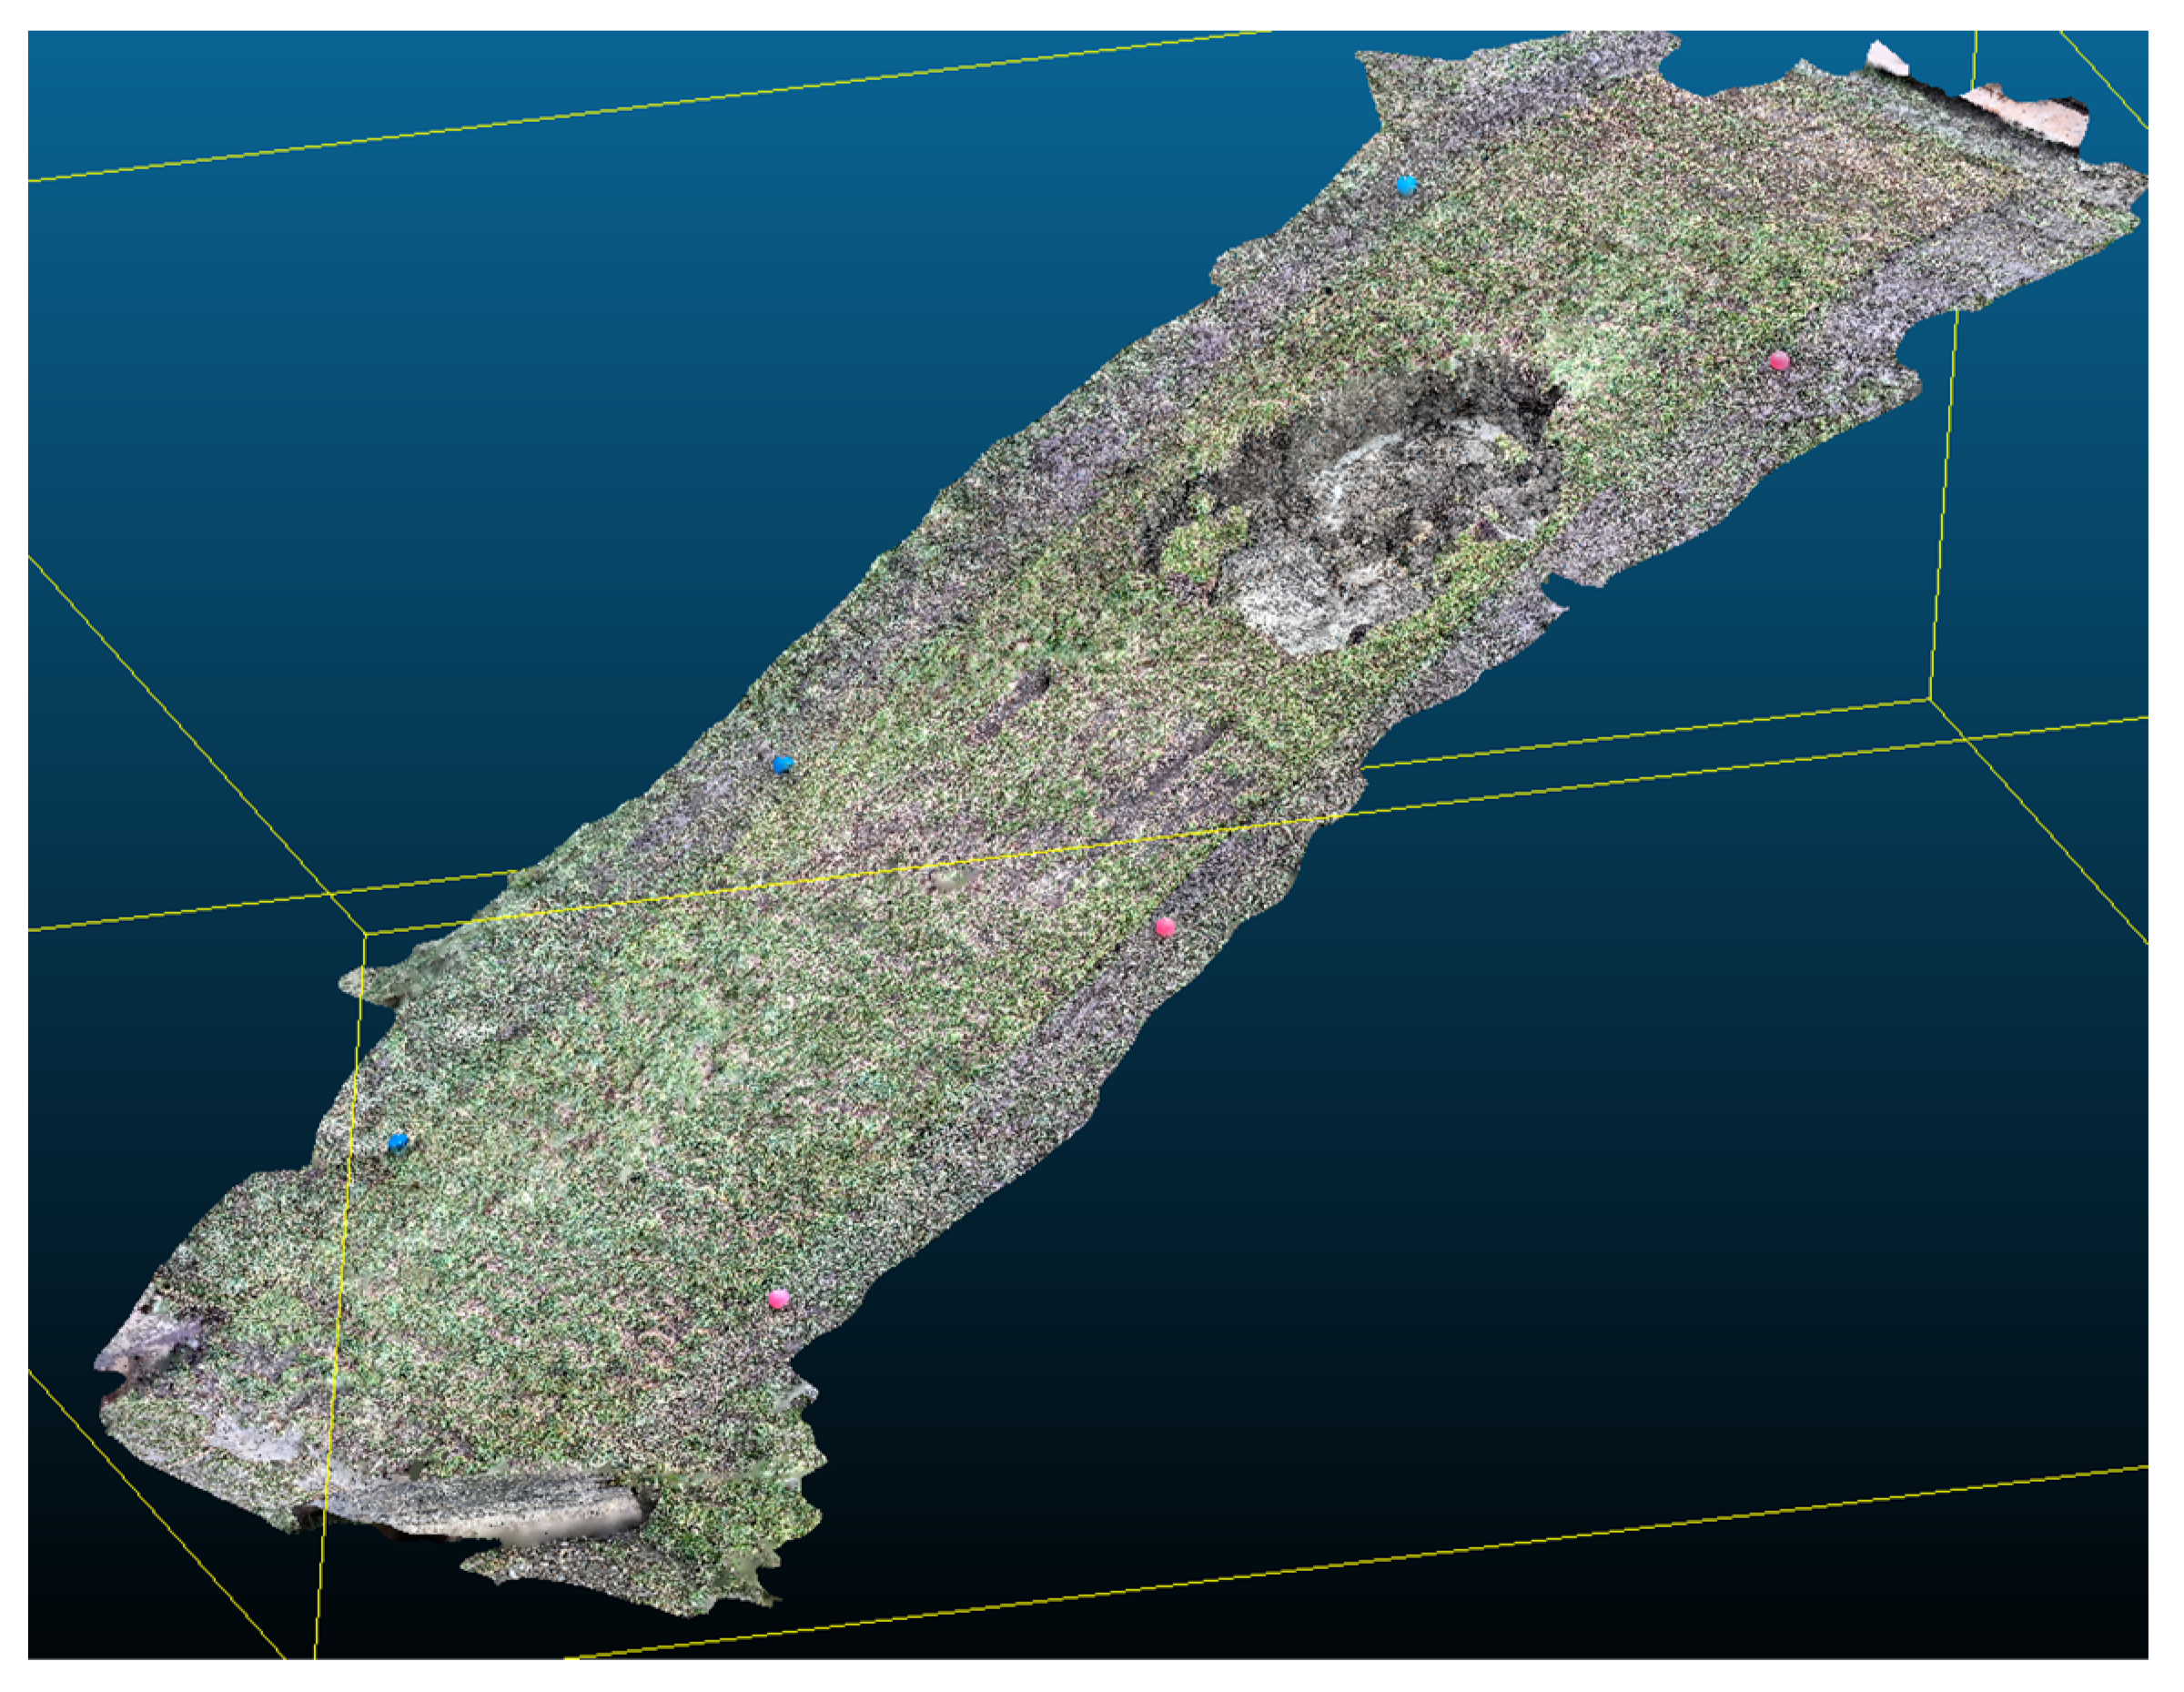
- 3D-Terrestrial LiDAR (Leica P50) to measure changes in bed profile over the full height of the dike.
- Handheld LiDAR: As an innovative experiment a handheld LiDAR (iPad Pro 12.9-inch, 5th Generation) was used during multiple field experiments. The goal was to determine whether this device could be used to determine the amount of erosion that took place. To answer this question a base line survey was performed and repeated after and in between flows. The results provided by the Hendheld LiDAR were compared against the results obtained with the 3D-Terrestrial LiDAR.
- Soil humidity sensors (Irrometer Co. Watermark monitor 900M) in selected test sections (viz sections B-OF09 and N-OF10/11) to measure the degree of saturation at various depths and distances from the flow gutter;
- RTK GPS (Leica GS14 and Leica GS15) and theodolite (Leica TS30) for topographic referencing the locations of experiments;
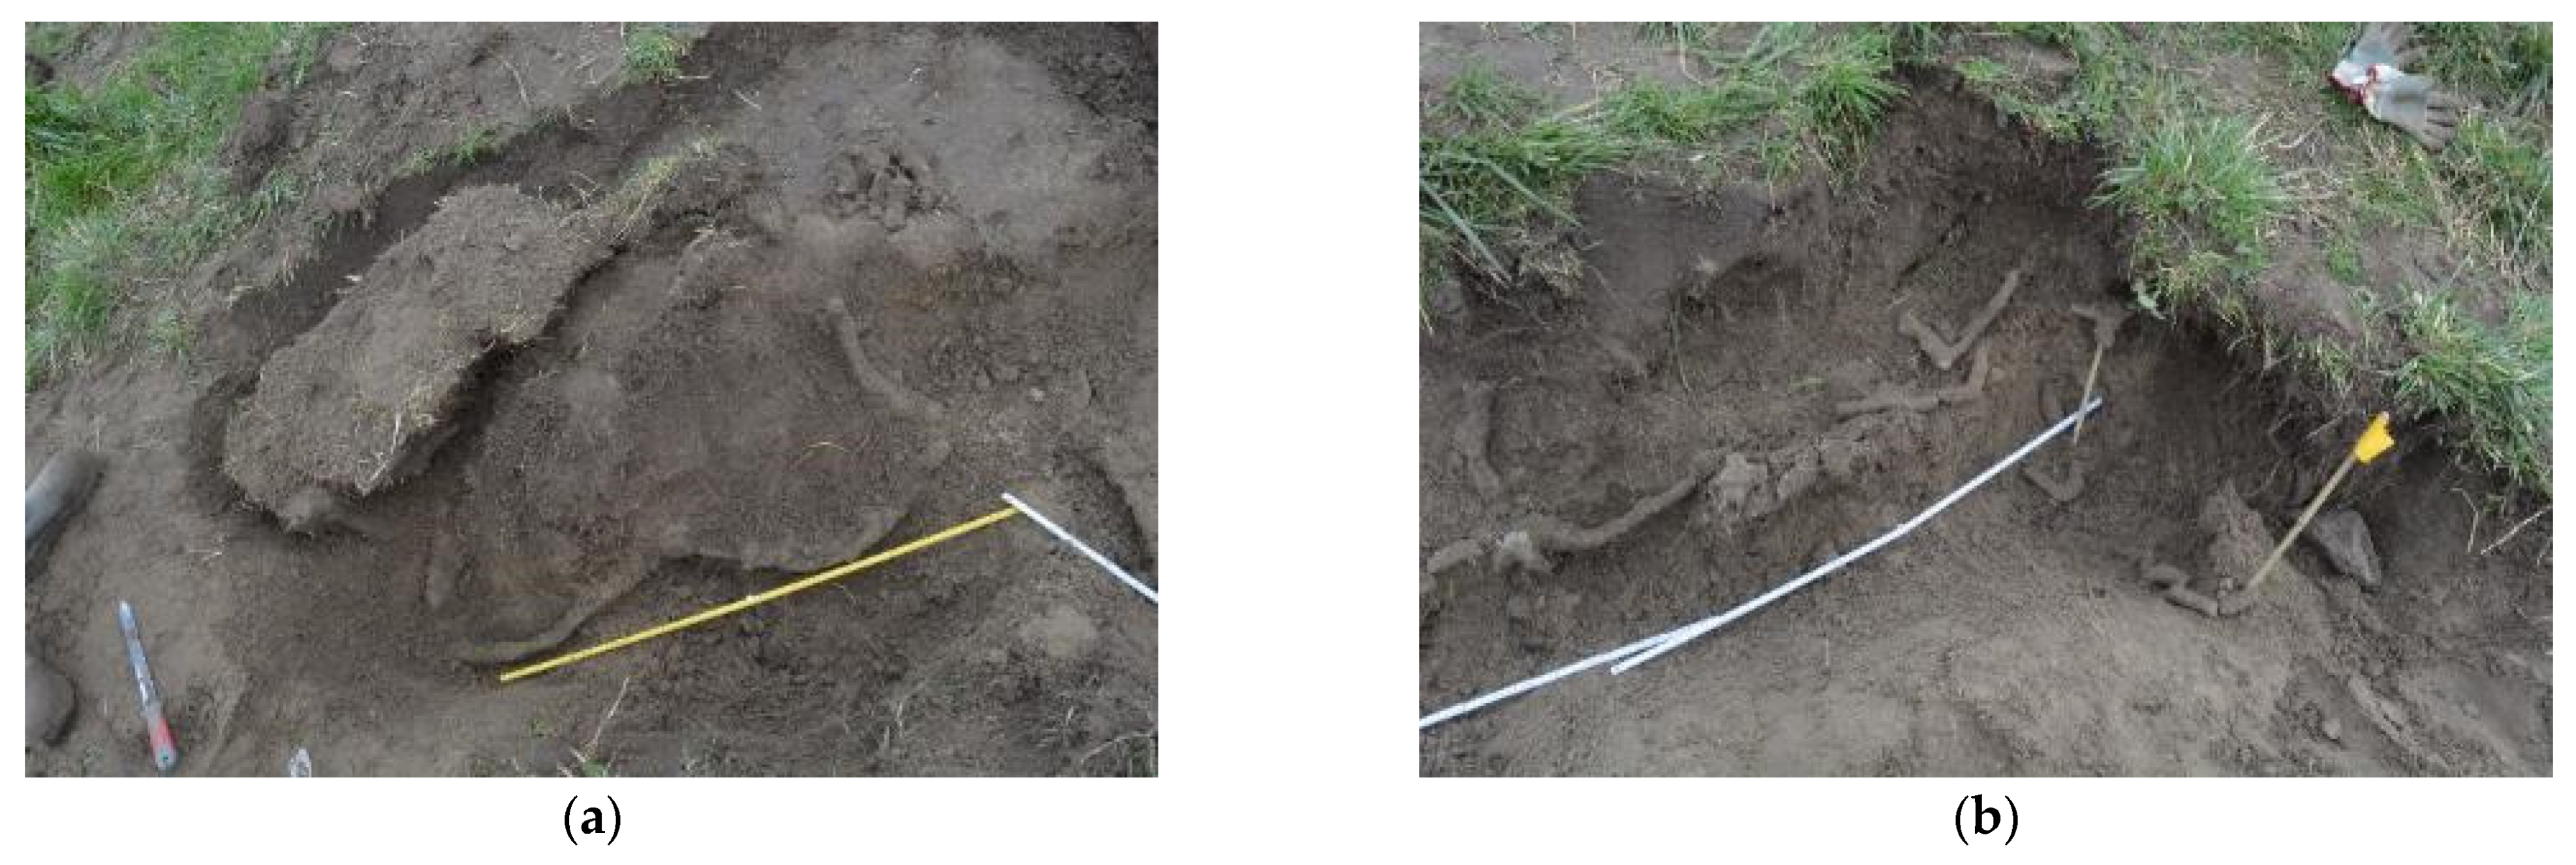
- Handheld probe and measuring tape: Above, the handheld probe was already mentioned. A measuring scale was present on the handheld probe to get a sense of scale and distance when using the probe. Both handheld probes and measuring tape were used in preparation of the test section, e.g., to determine the thickness of the clay cover, and during the field experiments themselves to keep track of the location along the slope.
- Handheld measuring rod for water level on the crest.
- Discharge meter (Krohne Optisonic 6000 with UFC300 transmitter) on the supply lines toward the overflow generator.
- Geophysical measurements under dry conditions with Ground Penetrating Radar (GPR, MALA 500 and 200 MHz models).
- Geophysical measurements under dry and overflow conditions with Electrical Resistivity Tomography (ERT). Data acquisition consisted of a combined gradient and dipole-dipole electrode configuration. On each line, 82 simple metal electrodes were placed every 10cm. The measurements were performed using the MPT DAS-1 system, with a maximum transmitted voltage, current and power of 480 V, 2500 A and 250 W respectively. During acquisition, two stacks were performed for each transmitter-receiver electrode pairing being measured in order to increase signal-to-noise ratio. A geophysical inversion was then conducted using the pyGIMLI [14] and Res2DINV [15] software packages in order to assess the impact of different inversion options (such as the application of smoothing to regulate the sharpness of transitions between different layers) and to identify common features from these results in order to confidently interpret them. After comparing the two sets of results, the pyGIMLI inversions were selected for interpretation due to their greater geological plausibility and lower misfit.
3. Results
3.1. Results during Execution
3.2. Results of Data Analyses
4. Discussion
5. Conclusions
Author Contributions
Funding
Data Availability Statement
Conflicts of Interest
References
- Rijkswaterstaat. Schematiseringshandleiding Grasbekledingen; Ministerie van Infrastructuur en Waterstaat: The Hague, The Netherlands, 2021.
- Cornish, B.A.; Yong, K.C.; Stone, D.M. Hydraulic Characteristics of Low Cost Surfaces for Farm Dam Bywash Spillways; Water Research Laboratory Report No. 93; University of New South Wales: Sydney, Australia, 1967. [Google Scholar]
- US Soil Conservation Service. Handbook of Channel Design for Soil and Water Conservation; Publication SCS-TP61; US Soil Conservation Service: Washington, DC, USA, 1954.
- Whitehead, E. A Guide to the Use of Grass in Hydraulic Engineering Practice; Technical Note 71; CIRIA: London, UK, 1976. [Google Scholar]
- Ponsioen, L.A. Overflow and Wave Overtopping Induced Failure Processes on the Landside Slope of a Dike. Master’s Thesis, Delft University of Technology, Delft, The Netherlands, 2016. [Google Scholar]
- Cantré, S.; Olschewski, J.; Saathoff, F. Full-scale flume experiments to analyse the erosion resistance of embankments made of dredged materials. J. Waterw. Port Coast. Ocean Eng. 2017, 143, 04017001. [Google Scholar] [CrossRef]
- Van der Meer, J.W. Workpackage 3: Development of Alternative Overtopping-Resistant Sea Defences, Phase 3: Design, Construction, Calibration and Use of the Wave Overtopping Simulator; EU Interreg IIIB Project ComCoast: Delft, The Netherlands, 2007. [Google Scholar]
- Hoffmans, G.; Van Hoven, A.; Steendam, G.J.; Van der Meer, J. Summary of research work about erodibility of grass revetments on dikes. In Proceedings of the Protections 2018, 3rd International Conference on Protection against Overtopping, Grange-over-Sands, UK, 6–8 June 2018. [Google Scholar]
- Van Steeg, P.; Klein Breteler, M.; Labrujere, A. Design of wave impact generator to test stability of grass slopes under wave attack. In Proceedings of the 5th International Conference on the Application of Physical Modelling to Port and Coastal Protection, Varna, Bulgaria, 29 September–2 October 2014. [Google Scholar]
- Van Steeg, P.; Klein Breteler, M.; Labrujere, A. Use of wave impact generator and wave flume to determine strength of outer slopes of grass dikes under wave loads. In Proceedings of the 34th Conference Coastal Engineering, Seoul, Korea, 15–20 June 2014. [Google Scholar]
- Flanders hydraulics research, bouw overloopgenerator voor toepassingen bij dijksterkteproeven in het kader van living lab hedwige prosperpolder. In WL Hoogtepunten 2019–2020; Depot D/2021/3241/225; Flanders Hydraulics Research: Antwerp, Belgium, 2022; Available online: www.vliz.be/imisdocs/publications/80/369580.pdf (accessed on 30 July 2022).
- Depreiter, D.; Peeters, P. Polder2C’s, Overflow Test Plan Winter 2021; EU Interreg 2 Seas Project Polder2C’s: Antwerp, Belgium, 2021. [Google Scholar]
- Het Waterschapshuis, Digigids 2019. 2019. Available online: https://digigids.hetwaterschapshuis.nl/ (accessed on 30 July 2022).
- Rücker, C.; Günther, T.; Wagner, F.M. pyGIMLi: An open-source library for modelling and inversion in geophysics. Comput. Geosci. 2017, 109, 106–123. [Google Scholar] [CrossRef]
- Loke, M.H. Res2Dinv v. 3.59 for Windows XP/Vista/7/2010, Rapid 2-D Resistivity & IP Inversion Using the Least-Squares Method; Geoelectrical Imaging 2D & 3D Geotomo Software: Cintré, France, 2010. [Google Scholar]
- Van den Berg, F. Burrowing by Animals in Flood Defenses, a Quantitative Analysis of an Overview of Current Knowledge; Report 11206793-002-ZWS-0002; Deltares: Delft, The Netherlands, 2022. (In Dutch) [Google Scholar]
- Holscher, R.; Zomer, W.S. Field Research on Burrows and Discontinuities in Embankments, Fact Finding Field Research in the Hedwige-Prosperpolder; STOWA: Amersfoort, The Netherlands, 2021. [Google Scholar]
- Idsinga, J. The Investigation of Animal Burrows in Levees, Using Experimental Data to Develop a Probabilistic Model that Aims to Improve the Efficiency of Manual Inspection of Animal Burrows on Levees. Master’s Thesis, Delft University of Technology, Delft, The Netherlands, 2022. [Google Scholar]


| ID | Goal | qmsx (L/(s.m)) | Width (m) | Duration (hh:mm) |
|---|---|---|---|---|
| B-01 | Establish reference measurements (Belgian side) | 180 | 2 | 21:00 |
| B-02 | Effect of shorter grass (10 cm instead of 15–30 cm) | 180 | 2 | 18:00 |
| B-03 | Impact of higher discharge | 360 | 1 | 10:00 |
| B-04 | Impact of tree near toe | 160 | 2 | 1:27 |
| B-05 | Impact of erosion cliff from grazing sheep near toe | 160 | 2 | 16:00 |
| B-05B | Test robustness of temporary repair measure (EPDM geotextile) | 750 L/s * | 2–6 | 7:10 |
| B-05C | Test robustness of final repair measure (rock bags) | 110 | 1 | 0:35 |
| B-06 | Test vulnerability of local patches of removed grass | 180 | 2 | 19:45 |
| B-07-I | Students’ Levee Challenge—Cocos mat as repair measure | 180 | 2 | 3:27 |
| B-07-II | Students’ Levee Challenge—geogrid with thin geotextile as repair measure | 180 | 2 | 3:30 |
| B-08 | Impact of higher discharge | 250 | 2 | 25:30 |
| B-09 | Impact of higher discharge | 375 | 2 | 18:07 |
| B-10 | Impact of higher discharge (with smaller width) | 540 | 1 | 2:04 |
| B-11 | Impact of tree, small burrows & small erosion cliff from grazing sheep near toe | 250 | 2 | 13:02 |
| N-01 | Establish reference measurements (Dutch side) | 175 | 2 | 30:30 |
| N-02 | Clay erosion measurements in step-shaped anomaly | 550 | 2 | 10:30 |
| N-03 | Reference section for detailed hydraulic measurements | 330 | 2 | 14:30 |
| N-04 | Reference section for detailed hydraulic measurements | 330 | 2 | 25:00 |
| N-05 | Impact of fox burrow halfway the landward slope | 90 | 2 | 1:19 |
| N-05B | Testing robustness of clay filling as a repair measure | 375 | 1 | 1:15 |
| N-05C | Testing a reinforced turf mat (grid structure) on repaired section | 150 | 1 | 4:30 |
| N-06 | Testing reinforced turf mat (grid structure with seed mixture) | 100 | 2 | 2:00 |
| N-07 | Testing a geotextile as protection on a barren clay slope | 200 L/s * | 2–5 | 0:30 |
| N-08 | Testing grass sods | 200 | 2 | 2:00 |
| N-09 | Testing use of flat plates to cover part of mole burrows | 500 | 2 | 10:00 |
| N-10 | Impact of soft soil and reed on lower part of slope | 200 | 2 | 1:00 |
| N-11 | Impact of soft soil and reed on lower part of slope | 200 | 2 | 0:31 |
Publisher’s Note: MDPI stays neutral with regard to jurisdictional claims in published maps and institutional affiliations. |
© 2022 by the authors. Licensee MDPI, Basel, Switzerland. This article is an open access article distributed under the terms and conditions of the Creative Commons Attribution (CC BY) license (https://creativecommons.org/licenses/by/4.0/).
Share and Cite
Koelewijn, A.R.; Rikkert, S.J.H.; Peeters, P.; Depreiter, D.; van Damme, M.; Zomer, W. Overflow Tests on Grass-Covered Embankments at the Living Lab Hedwige-Prosperpolder: An Overview. Water 2022, 14, 2859. https://doi.org/10.3390/w14182859
Koelewijn AR, Rikkert SJH, Peeters P, Depreiter D, van Damme M, Zomer W. Overflow Tests on Grass-Covered Embankments at the Living Lab Hedwige-Prosperpolder: An Overview. Water. 2022; 14(18):2859. https://doi.org/10.3390/w14182859
Chicago/Turabian StyleKoelewijn, André R., Stephan J. H. Rikkert, Patrik Peeters, Davy Depreiter, Myron van Damme, and Wouter Zomer. 2022. "Overflow Tests on Grass-Covered Embankments at the Living Lab Hedwige-Prosperpolder: An Overview" Water 14, no. 18: 2859. https://doi.org/10.3390/w14182859
APA StyleKoelewijn, A. R., Rikkert, S. J. H., Peeters, P., Depreiter, D., van Damme, M., & Zomer, W. (2022). Overflow Tests on Grass-Covered Embankments at the Living Lab Hedwige-Prosperpolder: An Overview. Water, 14(18), 2859. https://doi.org/10.3390/w14182859


