1. Introduction
When water pumps are used for high-speed rotating parts in the overflow, in the operation of unreasonable conditions, the overflow part of the local area pressure reduces the vaporization pressure. The liquid then begins to vaporize, generating a large number of bubbles. These bubbles, filled with gas or steam, quickly expand and move with the liquid flow to a higher pressure. The presence of bubbles around the higher liquid pressure causes the bubbles to shrink sharply and quickly condense and collapse, while the bubbles around the liquid mass, due to inertia, fill the bubble at high speed, creating a mutual impact, noise, and vibration, seriously affecting the performance of the pump. Therefore, it is necessary to carry out research on the distribution of cavitation and the pump performance under different degrees of cavitation.
Several scholars have conducted research on cavitation in pumps, and some of them have studied the numerical computational model of cavitation, resulting in the Rayleigh–Plesset equation [
1,
2], the Kubota equation [
3], and the Singhal equation [
4] which are better applied in the numerical computation of cavitation. Some scholars have modified the numerical calculation models of cavitation by modifying the turbulent viscosity [
5], developing a two-phase three-component cavitation numerical calculation model [
6], applying density correction to the turbulence model [
7], and modifying the Zwart cavitation model [
8], all of which have improved the accuracy of the numerical calculation to some extent. Additionally, some scholars have analyzed the applicability and accuracy of several cavitation models and have concluded that the accuracy of the prediction using the SST (
k-ω) turbulence model with the ZGB cavitation model is higher [
9,
10,
11,
12]. The research of related scholars can provide a reference for the numerical calculation of the cavitation characteristics in this paper.
Related scholars have studied the flow field under pump cavitation using the cavitation model developed by the above-mentioned scholars [
13] and have concluded that the cavitation region has a great influence on the velocity field, leading to the degradation of pump performance [
14] and revealing that the leakage vortex at the tip of the blade top induces cavitation [
15]. Furthermore, some scholars have studied the cavitation characteristics of pumps based on time and frequency domain vibration analysis techniques [
16] and acoustic analysis techniques [
17] and have investigated the vibration characteristics and pressure pulsation characteristics in pumps under cavitation [
18,
19,
20,
21]. Yet more scholars have carried out structural optimization and analysis in order to improve the cavitation performance of the pump [
22,
23]. The studies of related scholars provide references for the experimental tests in this paper.
High efficiency and poor cavitation characteristics are two relatively contradictory quantities. The high-ratio axial flow pump studied in this paper has excellent energy characteristics and cavitation characteristics, and this paper expects to reveal its energy and cavitation characteristics and cavitation flow field distribution. In this paper, firstly, the k-ω SST turbulence model and ZGB cavitation model are used to numerically calculate the cavitation performance of a high specific speed axial flow pump, which is verified by model tests and error analysis. After verifying the accuracy of the numerical calculation, the distribution law of the cavitation under cavitation, which is not easily obtained in the test, is further revealed. The research results can provide a reference for an in-depth exploration of the design and cavitation characteristics of high-specific speed axial flow pumps.
2. Numerical Calculation Models, Grids, and Methods
2.1. Numerical Calculation Model
The axial flow pump design parameters, as shown in
Table 1, include the axial pump impeller diameter
D = 300 mm, hub ratio
d/
D = 0.35, four impeller blades, seven guide vane blades, and a blade placement angle of 0°.
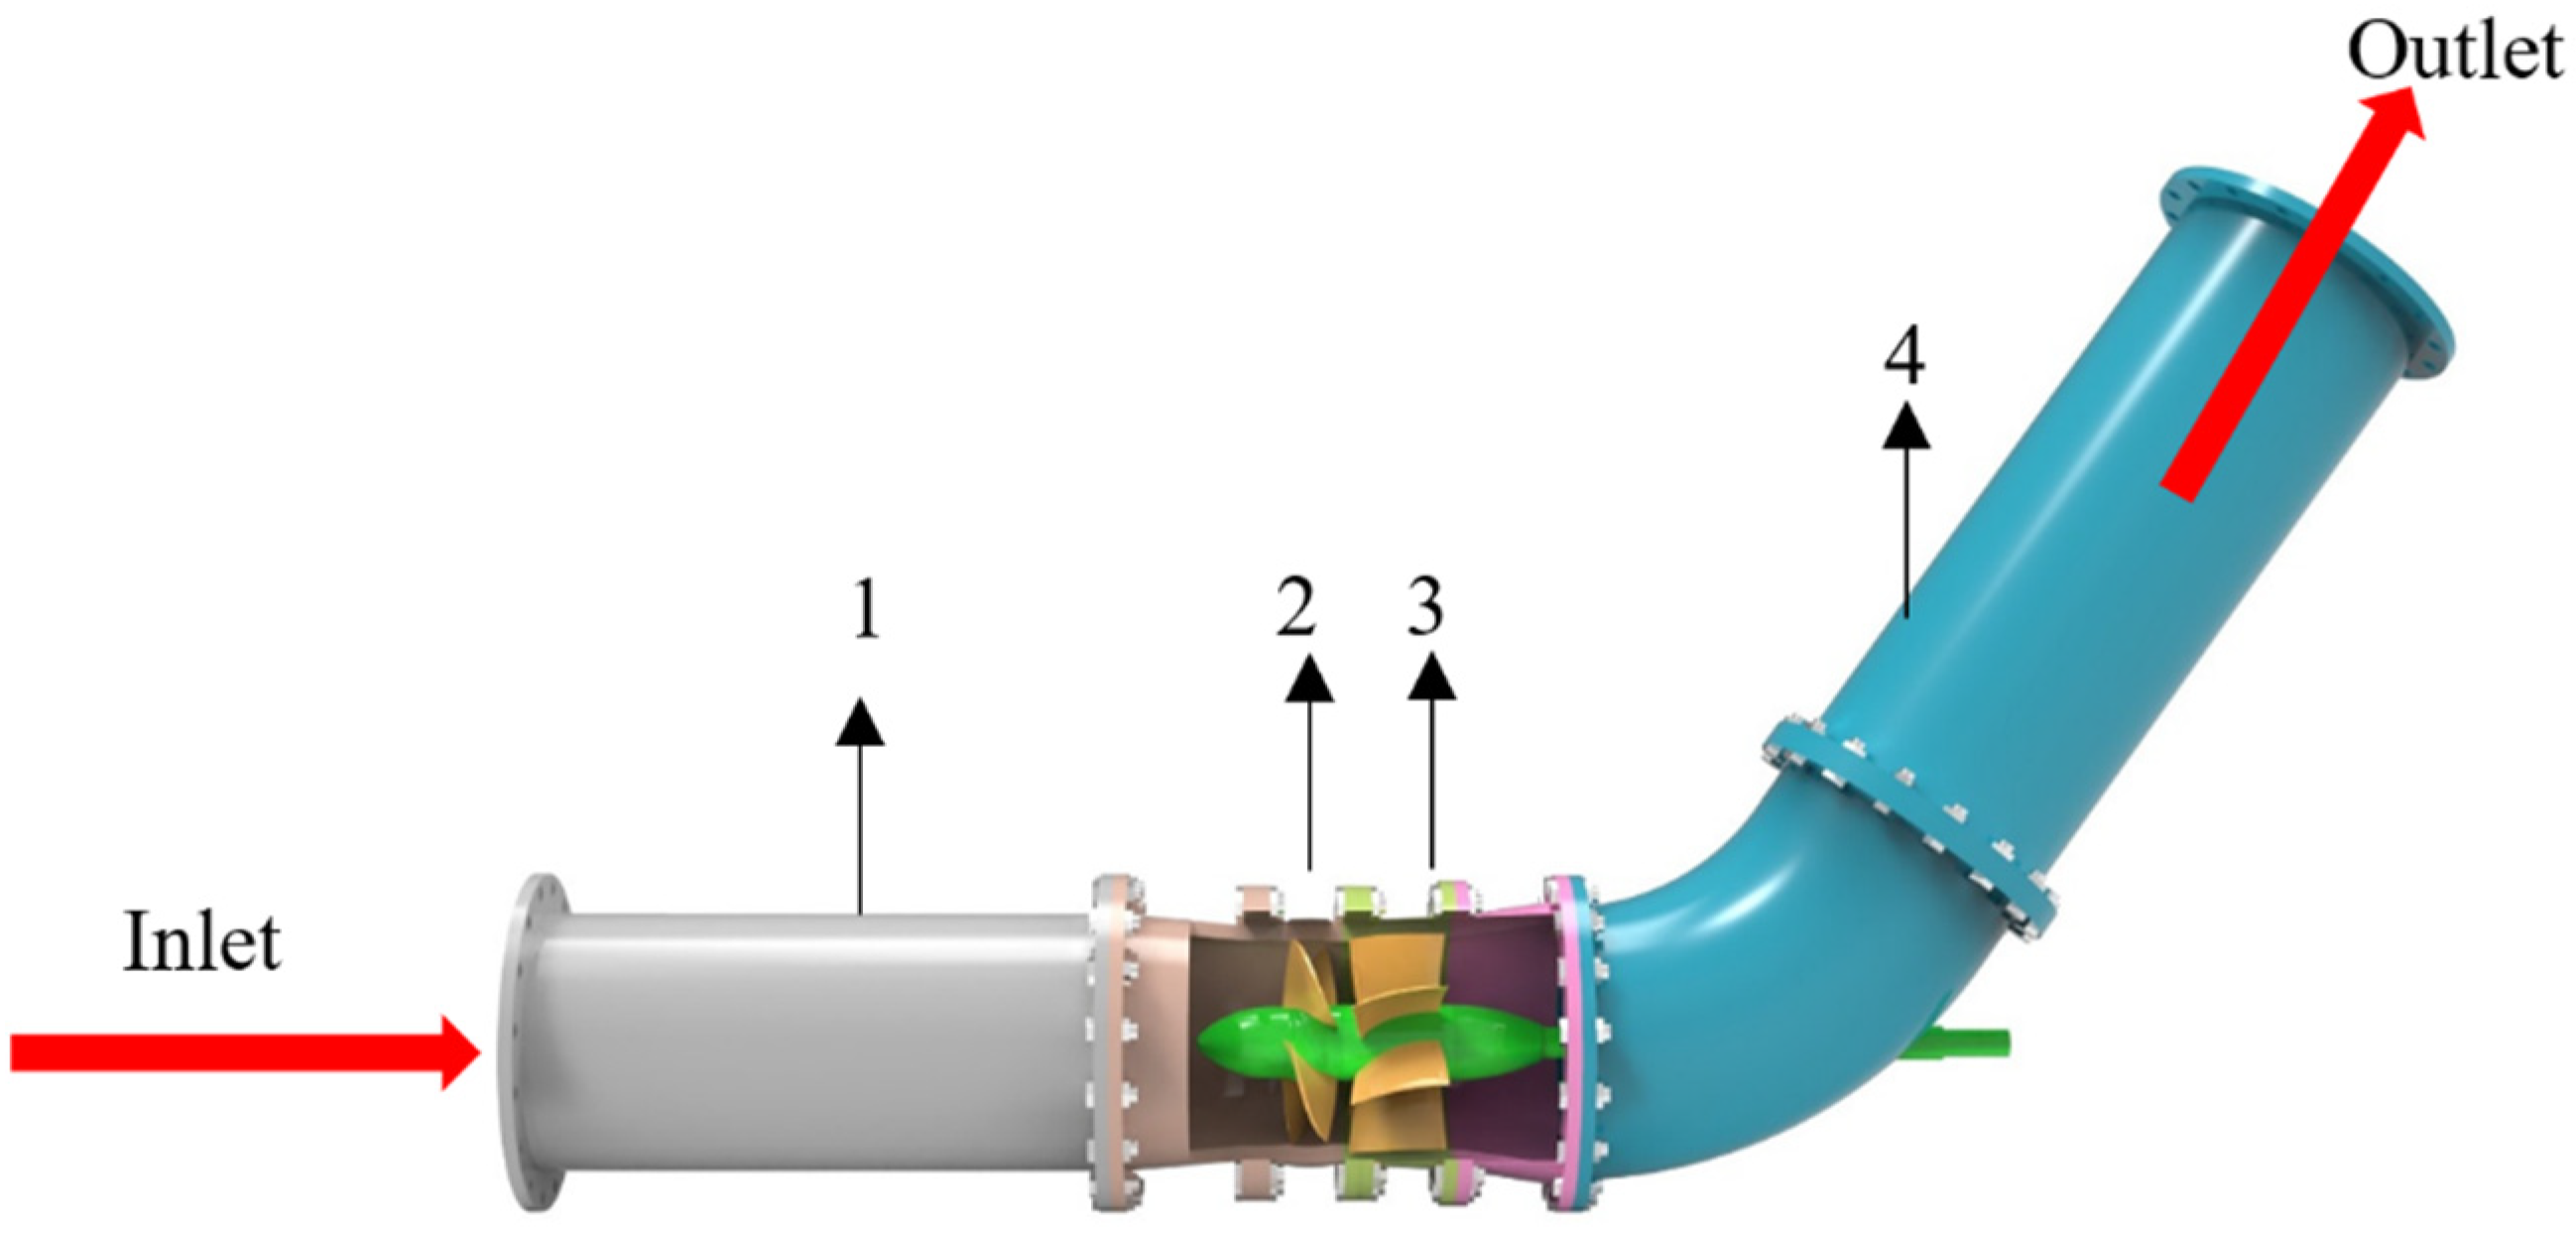
The 3D model of the inlet pipe, impeller, guide vane, and outlet pipe is established by Solidworks, and the overall structure is shown in
Figure 1.
2.2. Mesh Division
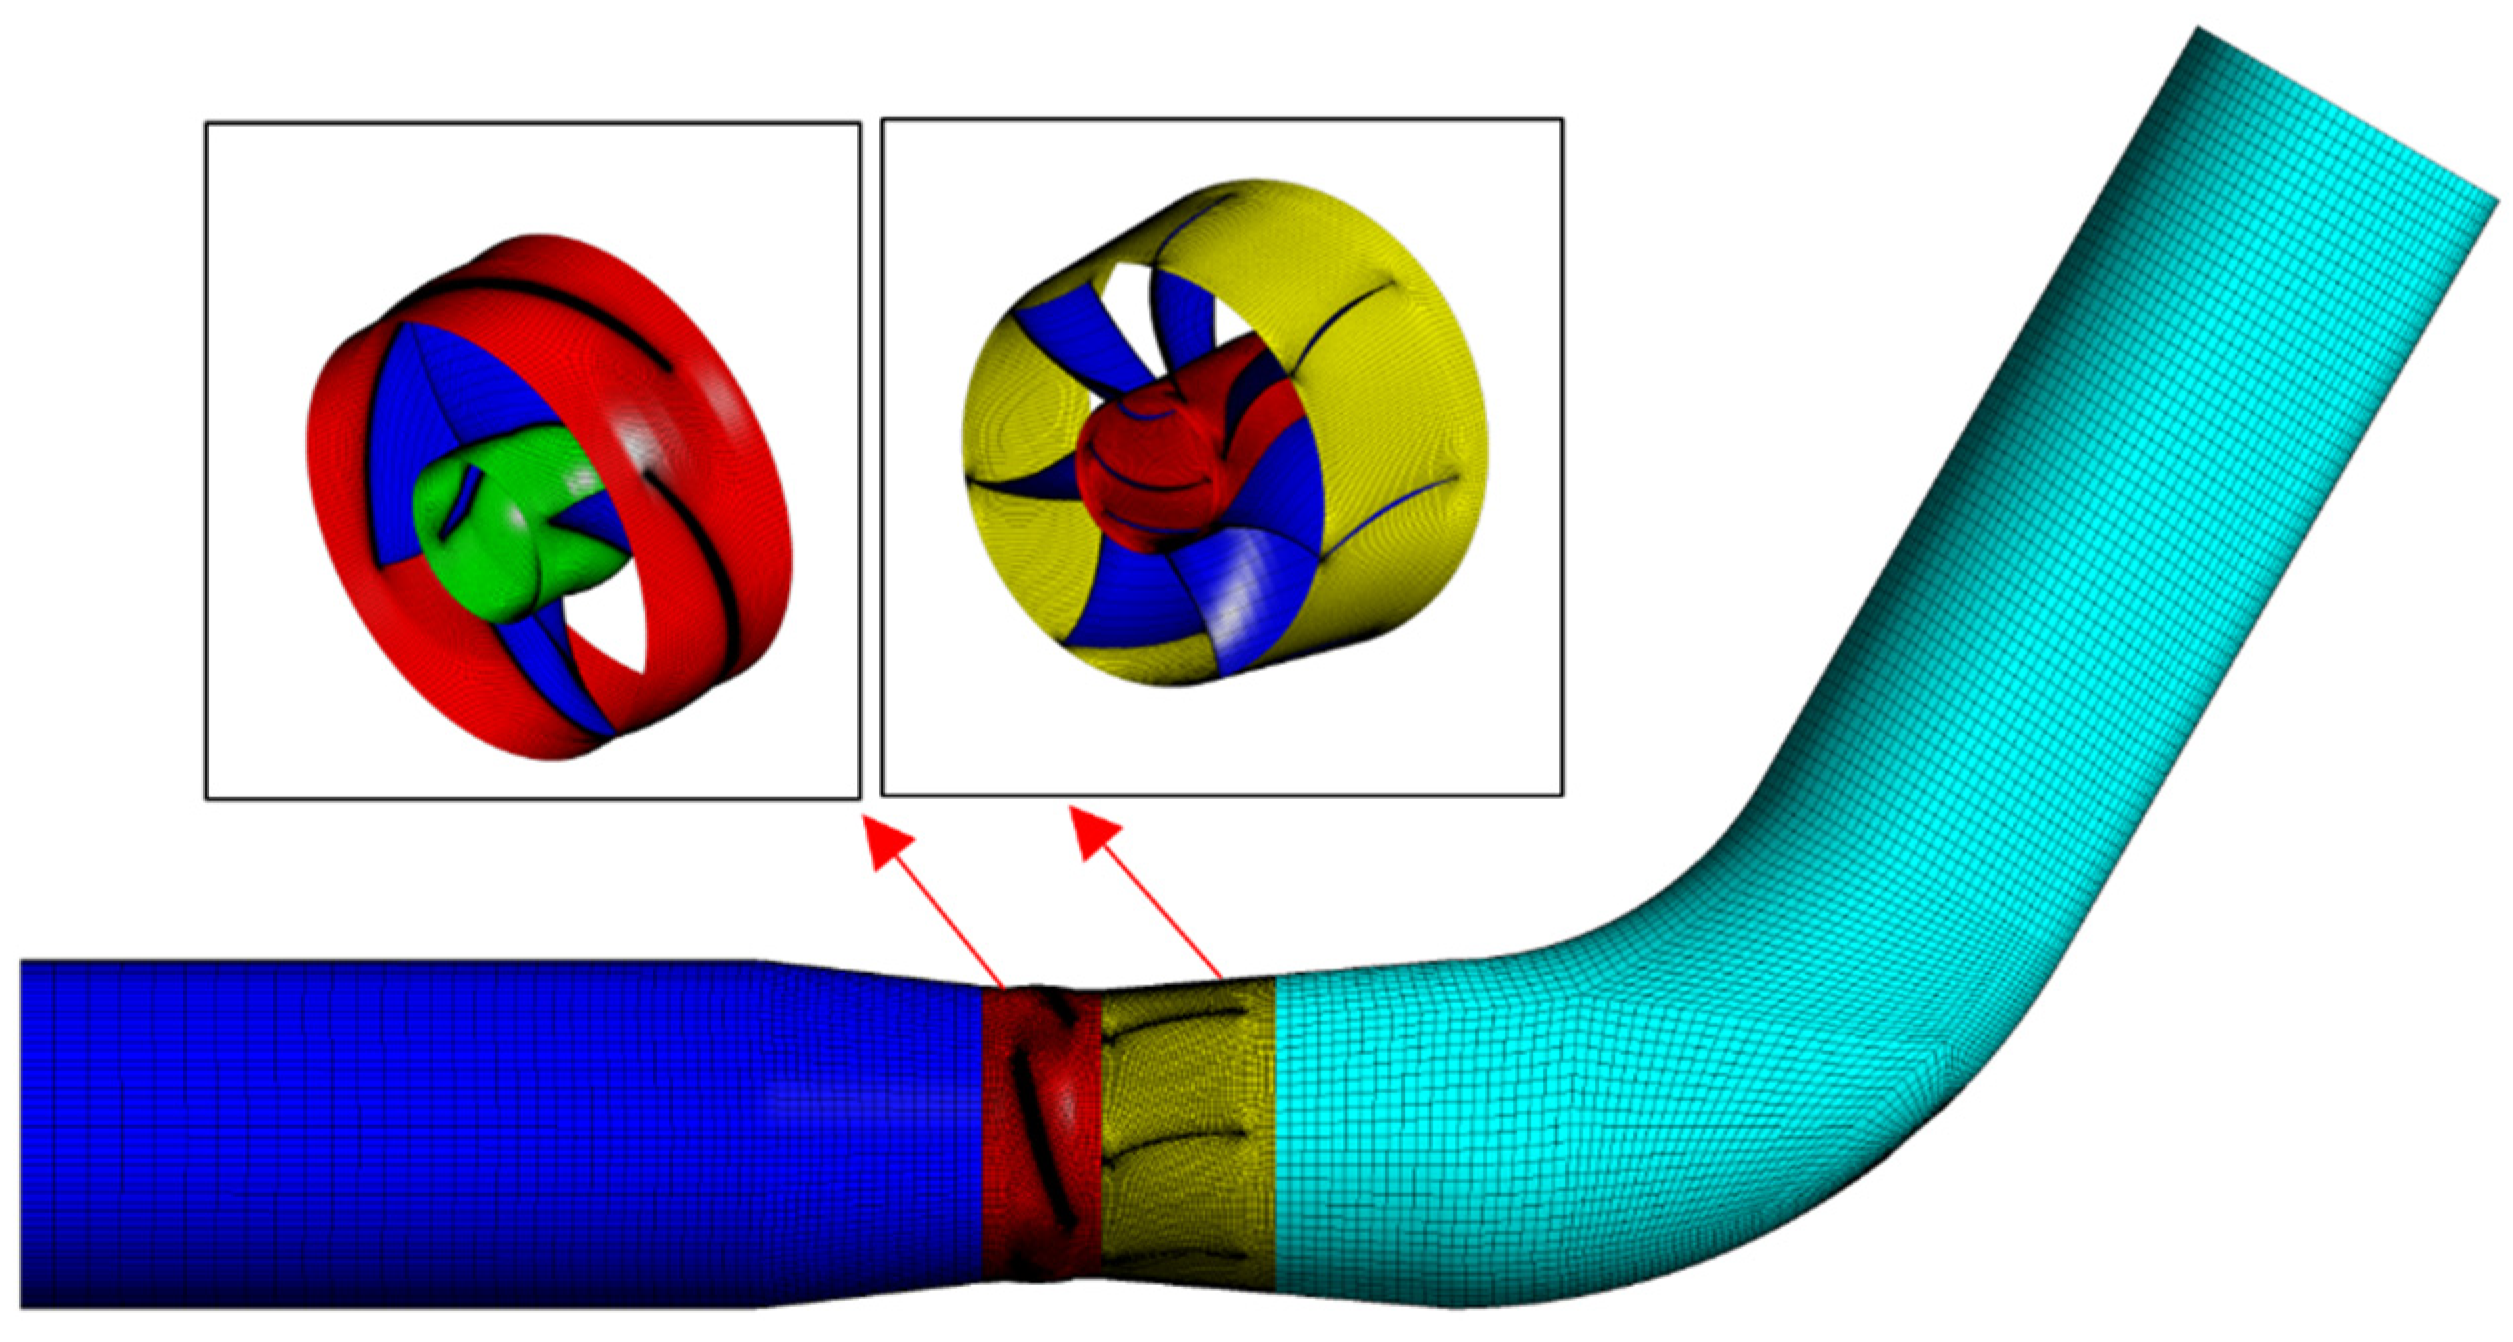
The fluid channels were extracted from the 3D model and ICEM was used to structure the meshing of the inlet and outlet pipes. The topology of the inlet and outlet pipes was established separately in the division, and the point-line surface correlation was made one by one. In order to increase the fit of the face of the circular pipe model, we created an “O” type mesh structure, then set the mesh size, considering the thickness of the boundary layer, encrypted the boundary layer locally (the change rate of the mesh from the boundary to the inside is 1.05), and, finally, performed the mesh partitioning, imported the design data files of the impeller and guide vane into TurboGrid for the modeling of the impeller and guide vane, and then used TurboGrid to structure the mesh partitioning of the impeller and guide vane. The overall mesh is shown in
Figure 2.
Each component of the computational domain is divided by structured mesh and the mesh quality is above 0.35. The mesh division method and the main parameters are shown in
Table 2 (y
+ is a dimensionless quantity of distance from the wall, which is proportional to the height of the first grid layer of the wall. In numerical calculations using SST
k-ω and RNG
k-ε turbulence models, the rotational and shear flow y
+ is taken to be 30–100). After the mesh irrelevance analysis, the total mesh number is finally selected as 2114505 for numerical calculation.
2.3. Control Equations and Boundary Conditions
In this paper, the SST
k-
ω turbulence model [
24] is used for the numerical energy performance calculation of axial flow pumps, and the SST
k-
ω turbulence model and ZGB (Zwart–Gerber–Belamri) model are used for the numerical calculation of their cavitation performance.
Turbulence control equation (N-S equation):
where
t is time (s);
ρ is fluid density (kg/m
3);
xi and
xj are spatial coordinates;
ui and
uj are the velocity components of the fluid parallel to the corresponding axes
xi and
xj, respectively;
Fi is the volume force component in the
i-direction;
μ is the fluid dynamic viscosity coefficient; and
p is the pressure (Pa).
The transport equation of the SST
k-ω turbulence model can be expressed as:
where
Gk,
Gω is the generating term of the equation;
Yk,
Yω is the generating term of the diffusive action;
Sk,
Sω is the user-defined source term;
Dω is the term generated by the orthogonal divergence;
k is the turbulent kinetic energy;
ω is the turbulent special dissipation; and
μt is turbulent dynamic viscosity coefficient.
Where the interphase mass transfer equation of the ZGB model [
25] is
where
fv is the vapor mass fraction, Γ is the diffusion coefficient,
Re is the evaporation conversion of the gas-liquid phase,
Rc is the condensation conversion of the gas-liquid phase,
RB is the bubble radius,
αnuc is the volume fraction of the nucleation site,
Fvap is the evaporation coefficient,
Fcond is the condensation coefficient,
ρv is the vapor density,
αv is the volume fraction of the vapor phase,
Pv is the pressure inside the bubble,
p is the pressure around the bubble in the liquid,
ρl is the liquid density,
is the mode of the relative velocity of liquid and vapor, and
fg is the gas mass fraction.
In the numerical calculation software, the mesh model of each component is imported into CFX-Pre, and the mesh model of each segment is assembled to form the geometric model for the numerical calculation of the axial flow pump; the calculation settings are shown in
Table 3.
The inlet condition is set to a total pressure of 11 × 104 Pa and the outlet condition is set to a flow rate of Q = 210–434 L/s when performing the energy characteristic calculation, and the inlet condition is set to a total pressure of 11 × 104 Pa, 10 × 104 Pa, 8 × 10⁴ Pa, 7 × 10⁴ Pa, 6 × 10⁴ Pa, 5 × 10⁴ Pa, and 4 × 10⁴ Pa and the outlet condition is set to a flow rate of 411 L/s, 380 L/s, 348 L/s, and 234 L/s, respectively, when performing the cavitation calculation. The diffusion term and pressure gradient are represented by finite element functions, the convective term is represented by a high-resolution format (High-Resolution Scheme), and the velocities u, v, and w, in the pressure p, x, y, and z directions of the monitored flow field are calculated; the convergence conditions of turbulent kinetic energy k and dissipation rate ε are set to 10−6, and, in principle, the smaller the residuals, the better.
2.4. Numerical Calculation Results Analysis Formula
The calculation formulas [
26,
27,
28] for the prediction of the device head,
Hnet, and efficiency,
η, of the overflow components based on the flow velocity and pressure fields obtained from numerical calculations are:
where
Hnet is the head (m),
S1,
S2 is the area of the inlet and outlet section of the axial flow pump (m
2),
P1,
P2 is the static pressure at each point of the inlet and outlet section of the axial flow pump (Pa),
ut1,
ut2 is the normal component of the flow velocity at each point of the inlet and outlet section of the axial flow pump (m/s),
ρ is the density (kg/m
3),
Q is the flow rate (m
3/s),
g is the acceleration of gravity (m/s
2),
H1,
H2 is the elevation of the inlet and outlet section of the axial flow pump (m),
u1, u2 is the flow velocity at each point of the inlet and outlet channel section of the axial flow pump (m/s),
η is the efficiency (%),
Tp is the torque (N·m), and
ω is the rotational angular velocity of the impeller (rad/s).
3. Test Device and Test Method
3.1. Test Device
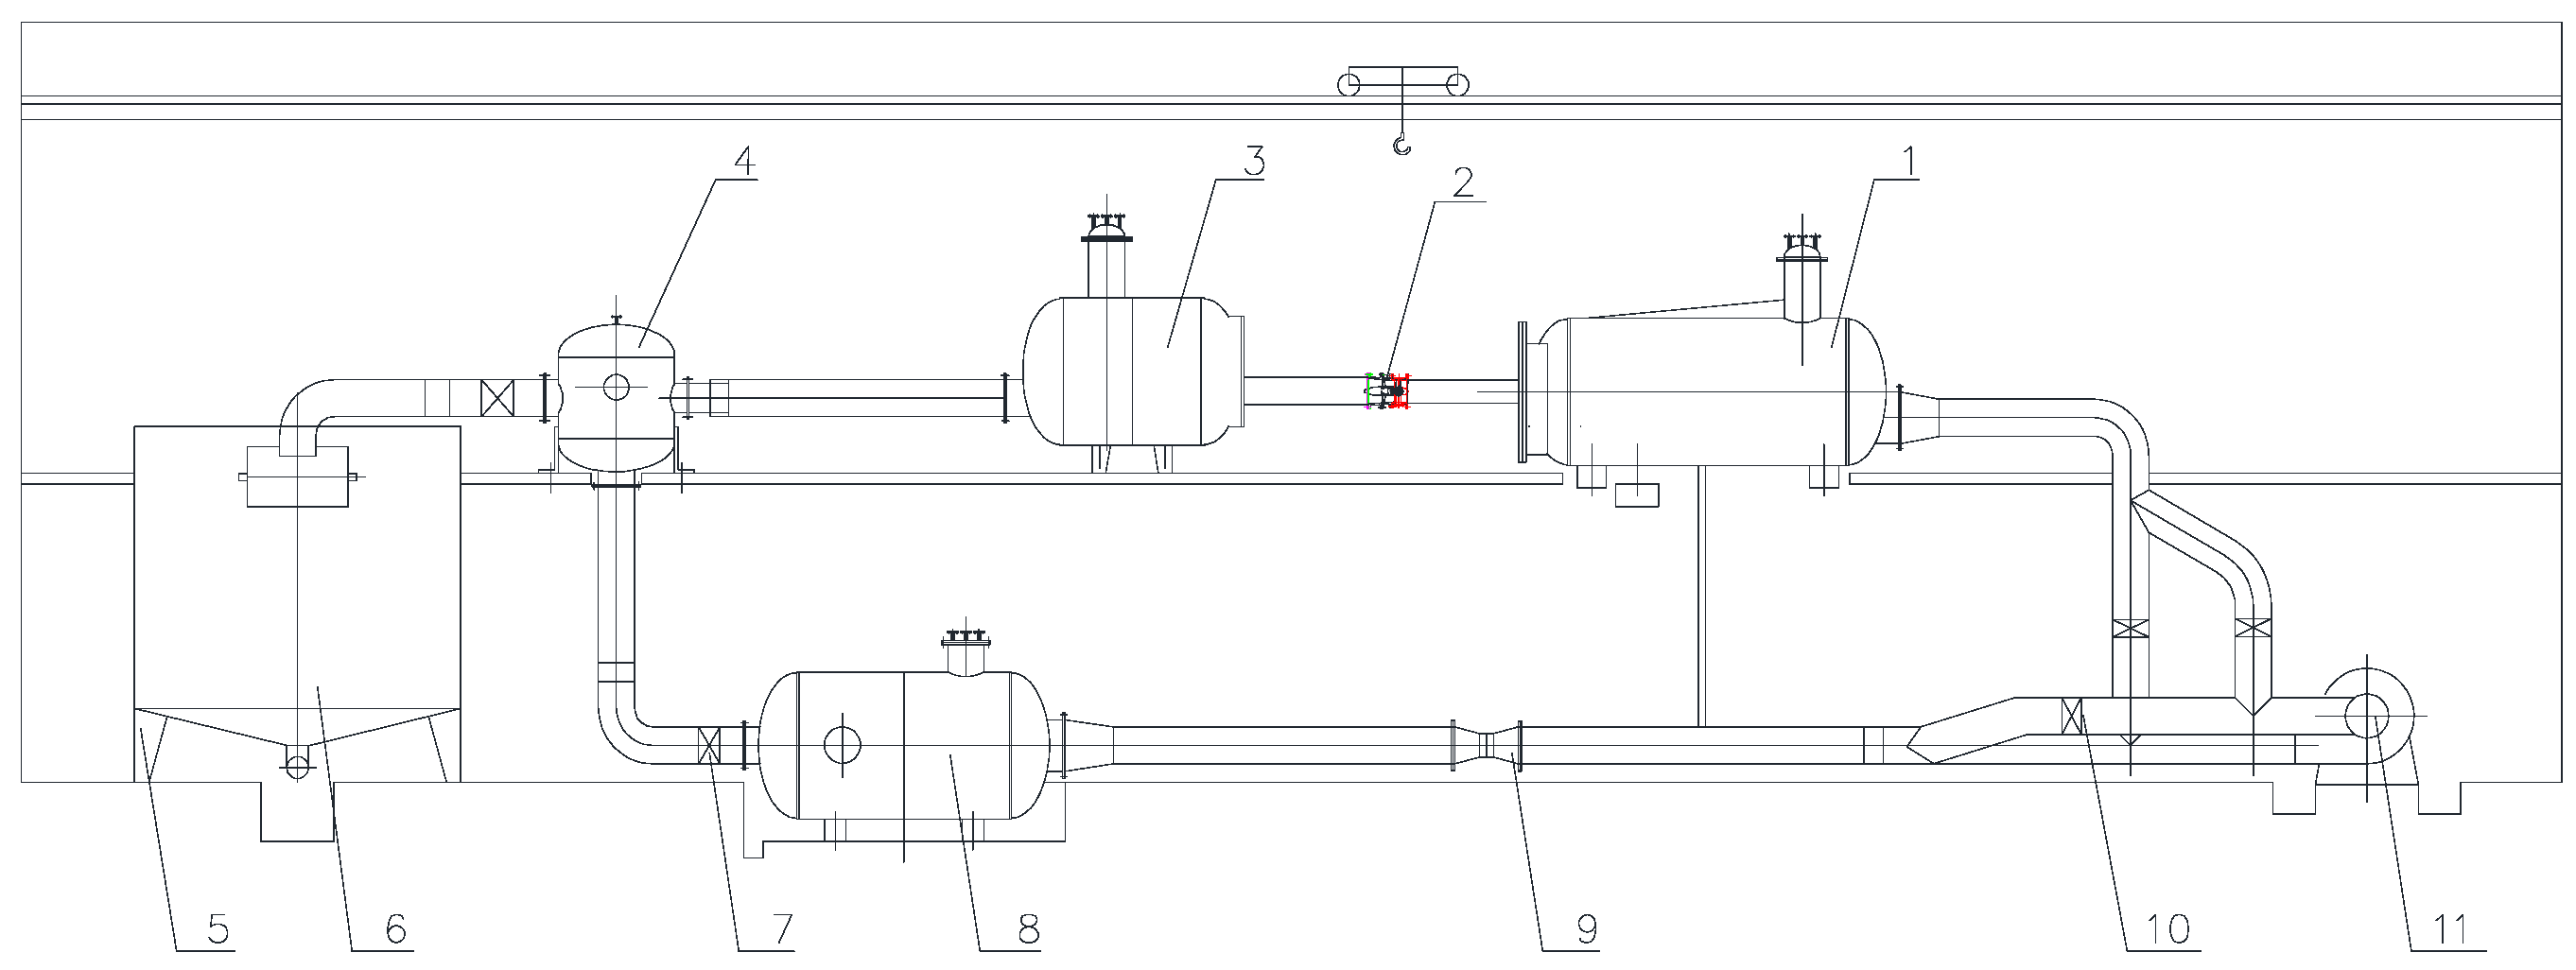
The test bench is a vertical closed circulation system as shown in
Figure 3.
The test head is measured by a differential pressure transmitter (accuracy ±0.015%), the flow rate is measured by an electromagnetic flowmeter (accuracy ±0.18%), the speed and torque are measured by a speed and torque sensor (accuracy ±0.24%), and the cavitation margin is measured by an absolute pressure transmitter (accuracy ±0.015%), with a comprehensive uncertainty of ±0.39% on the test bench.
3.2. Test Methods
The pump head,
H, is equal to the total energy head difference between the two pressure measuring sections of the pump inlet and outlet [
29].
The shaft power
N is calculated by the following Equation [
30]:
where
H is the pump head (m),
P1, P2 is the static pressure at the inlet and outlet of the flow field (Pa),
z1,
z2 is the height of the inlet and outlet of the flow field (m),
u1,
u2 is the flow velocity of the inlet and outlet of the flow field (m/s),
ρ is the density of the water in real-time of the test (kg/m
3),
g is the local acceleration of gravity (m/s
2),
N is the shaft power (w),
is the input torque of the pump (N·m),
is the mechanical loss torque of the pump (N·m), and
n is the test speed of the pump (r/min).
During the test, the effective cavitation margin (
NPSHav) corresponding to a 1% drop in efficiency is defined as the critical cavitation margin (
NPSHre) when the flow rate is kept constant. The effective cavitation margin value for the pump at different inlet pressures,
NPSHav, is calculated by the following Equation [
31]
where
NPSHav is the pump effective cavitation margin (m),
pav is the pump into the water tank pressure measurement point of the absolute pressure, measured by the absolute pressure transmitter (Pa),
ρ is the test of real-time water density (kg/m
3),
g is the local acceleration of gravity (m/s
2),
v is the pump into the tank pressure measurement section average flow rate (m/s),
Pv is the test water temperature of the water saturation vapor pressure (Pa), and
h is the absolute pressure transmitter above the pump vane rotation centerline (pump shaft) height value (m).
The pump efficiency referred to in this paper is the value after deducting the mechanical loss of torque and is calculated by the following formula [
32]:
where
η is the pump model efficiency (%),
H is the pump head (m),
Q is the pump flow (m
3/s),
ρ is the test real-time water density (kg/m
3),
g is the local gravitational acceleration (m/s
2), and
N is the shaft power (w).
4. Numerical Calculations and Analysis of Experimental Results
4.1. Numerical Calculations and Experimental Energy Analysis
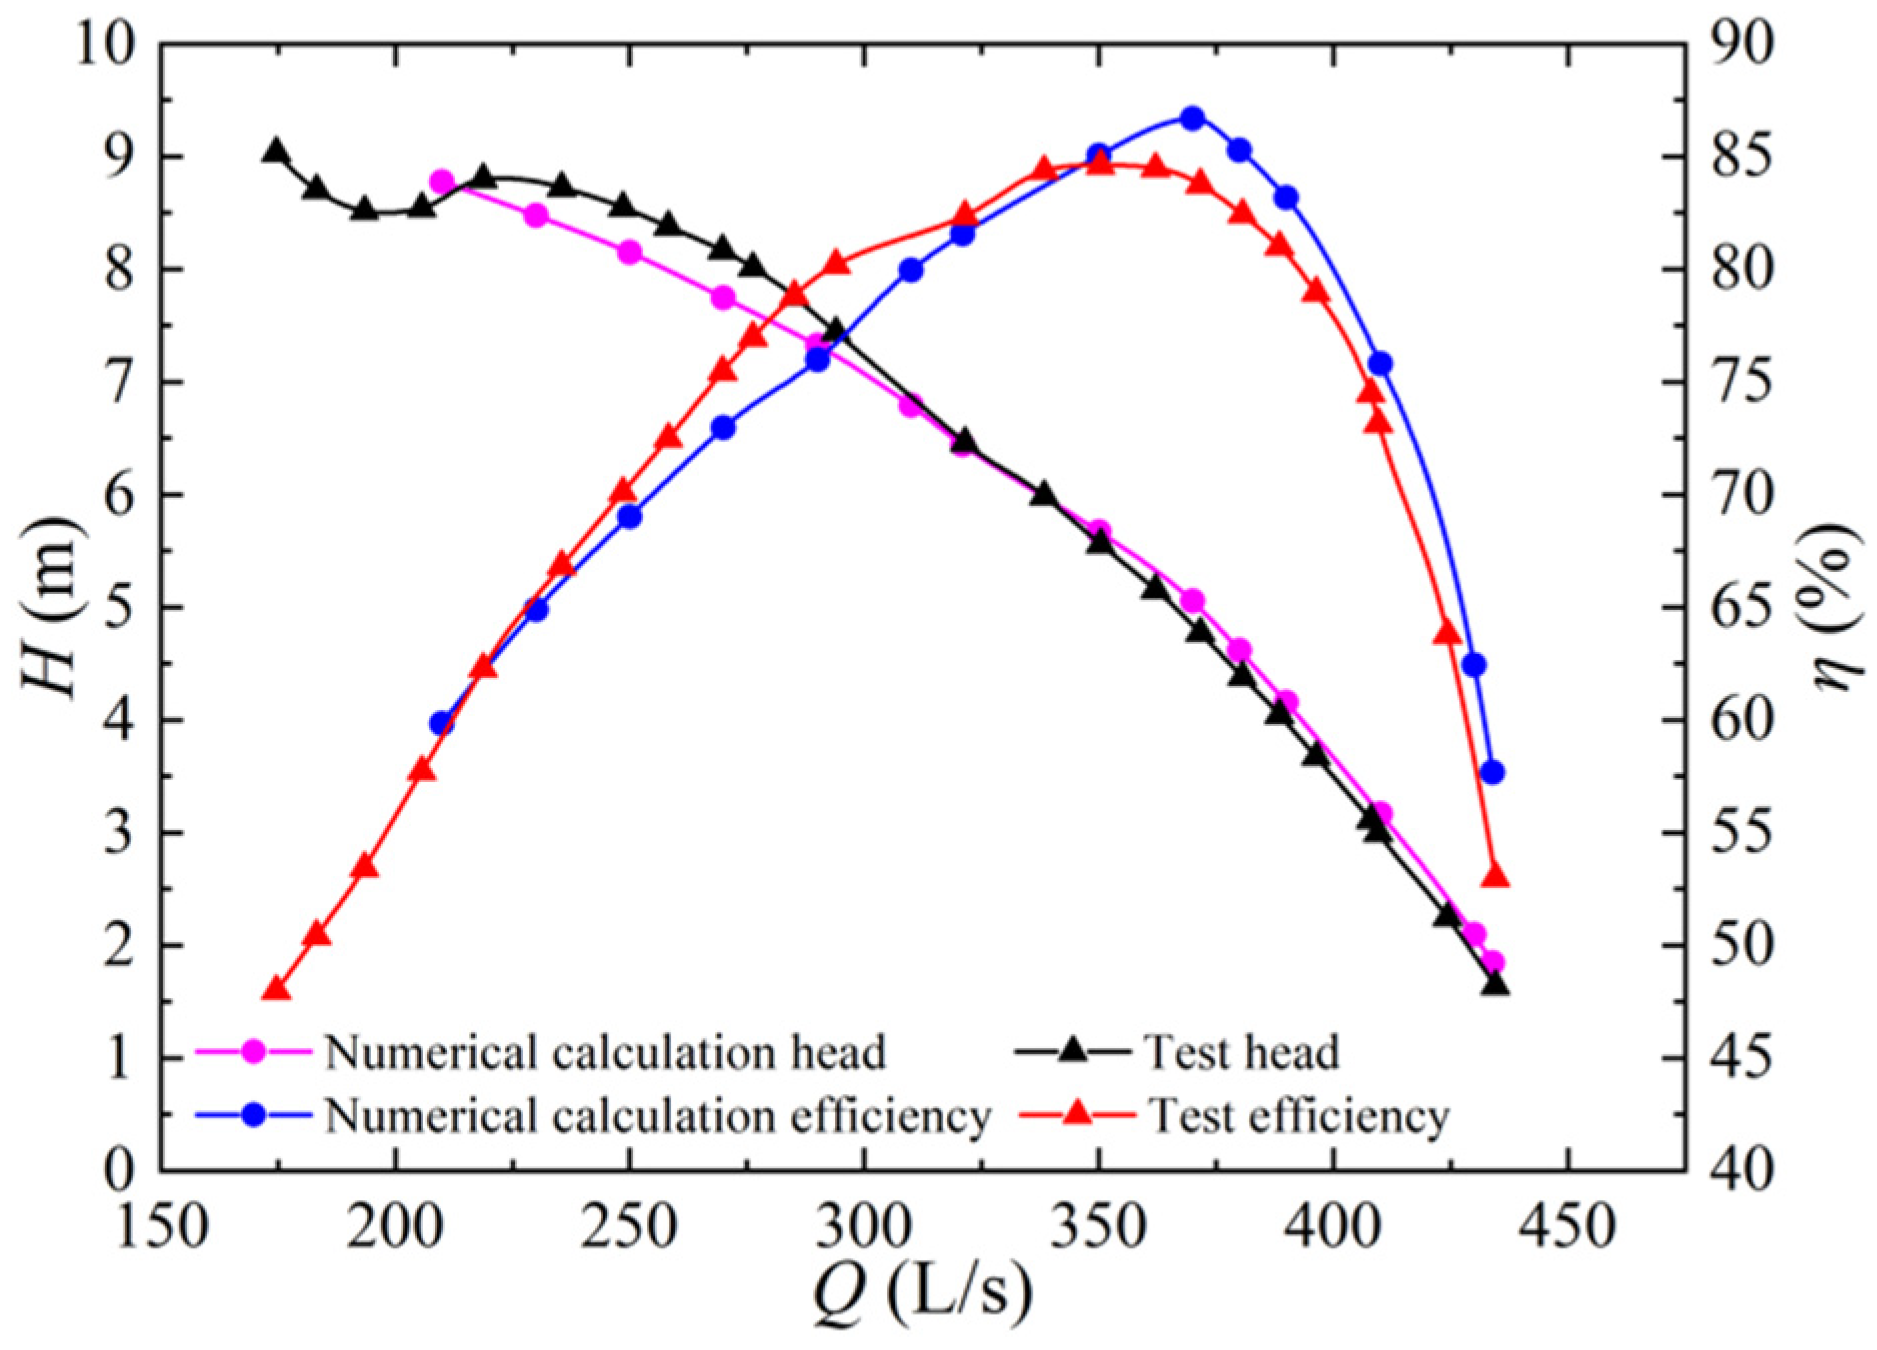
The numerical calculations and test results for the flow-head and flow-efficiency of high-specific speed axial flow pumps are collated and compared in
Figure 4.
Figure 4 shows that the head is
Hd = 5.56 m and the efficiency is
η = 84.6% when the flow rate is
Qd = 350.39 L/s. The head at the design point meets the design requirements and the efficiency is within the high-efficiency zone, which shows the reasonableness of the design. The highest operating head is
Hm = 8.80 m, 1.58 times the design head, indicating that the high specific speed axial flow pump designed in this paper can be operated in a wider range. When the head is greater than 8.80 m, the axial flow pump enters the saddle area (
Q = 174.68–218.74 L/s), and the operation becomes unstable, accompanied by an increase in bad flow patterns, vibration, and a sharp increase in noise; operation in this area should be avoided.
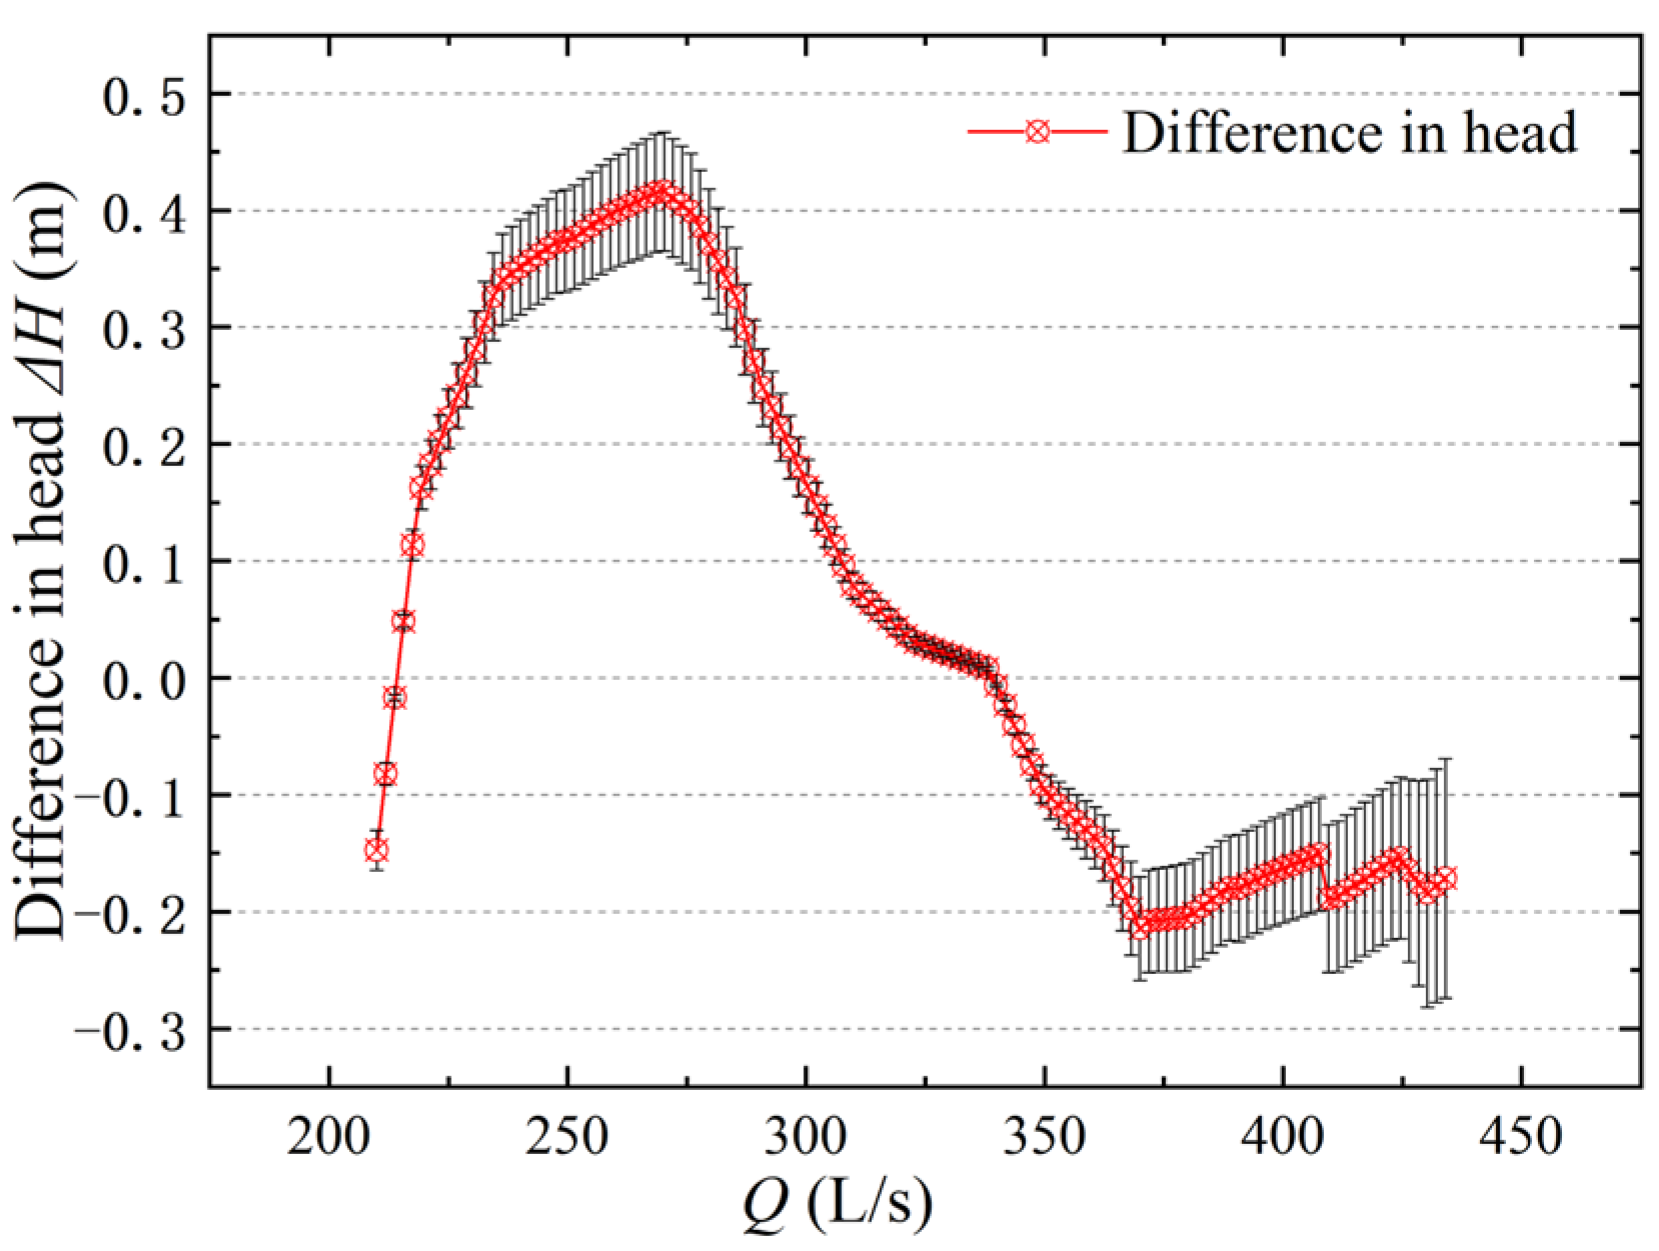
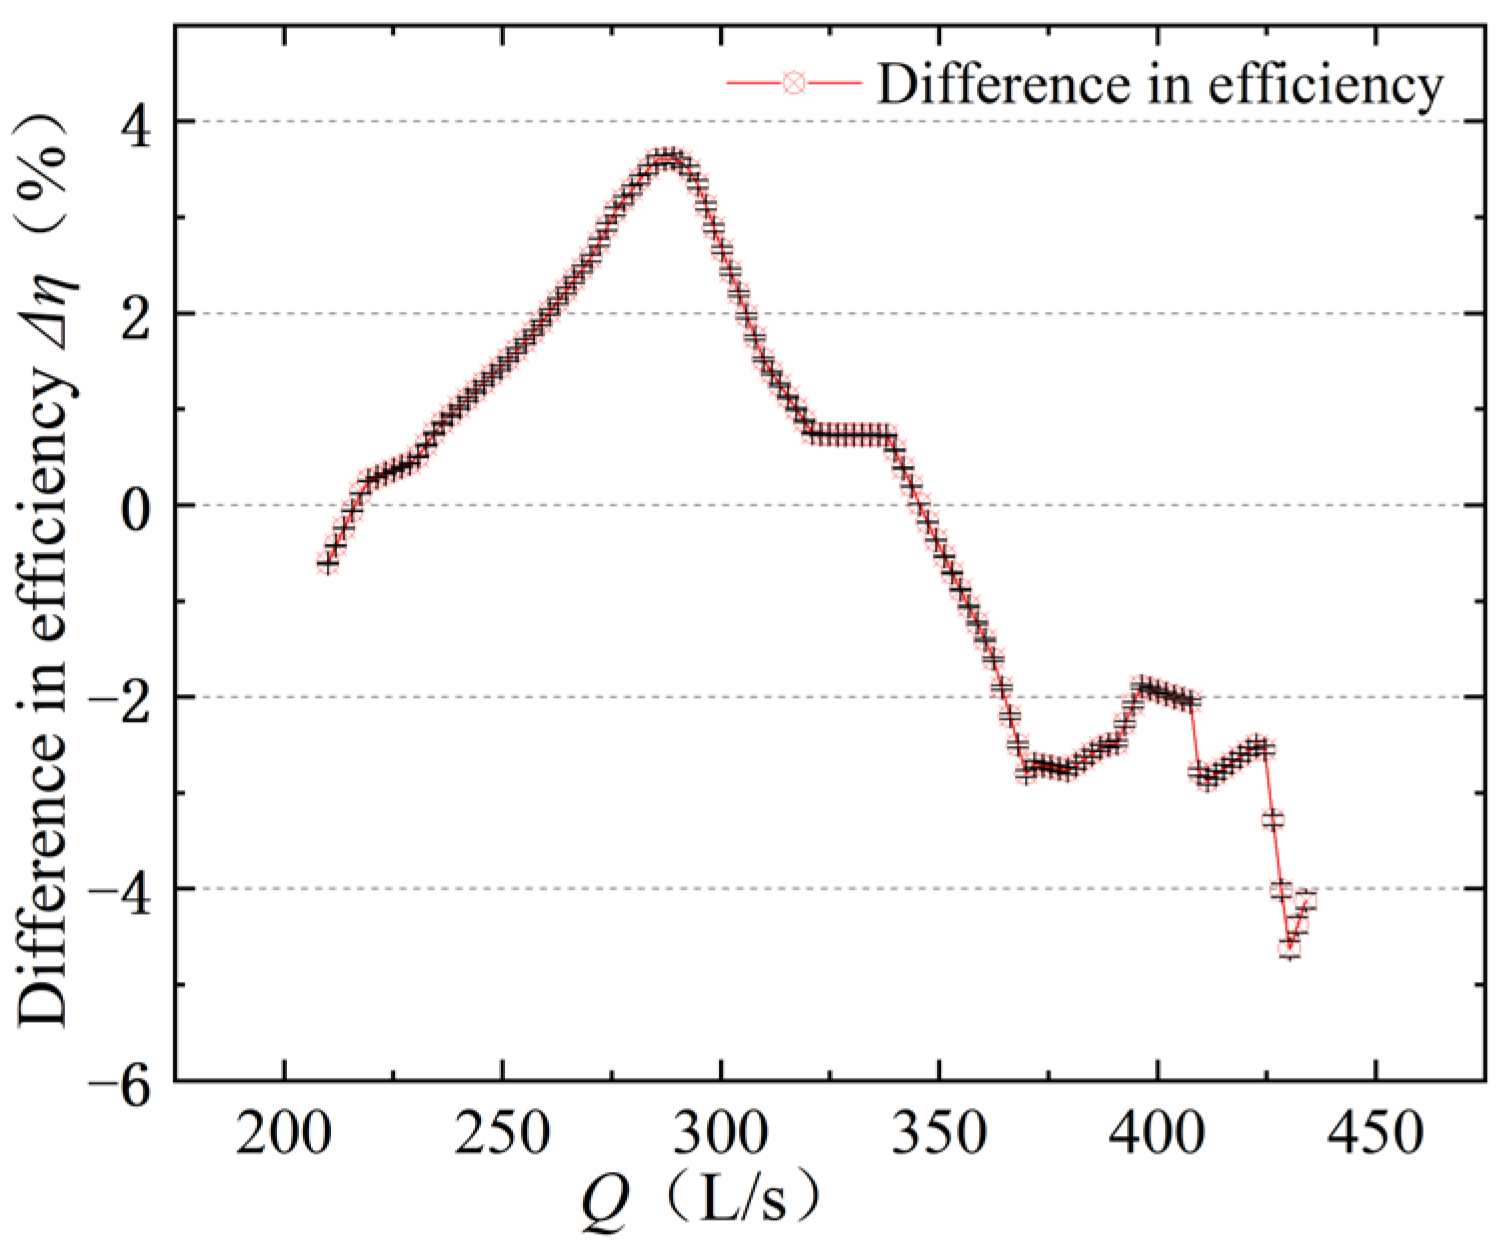
Because the test and numerical calculations are not at the same operating point, the interpolation points of the head and efficiency curves (within the range of
Q = 210–434 L/s) were found using Origin software. The difference between the tested and numerically calculated heads at the same operating conditions after interpolation was obtained in
Figure 5, and the difference between the tested and numerically calculated efficiencies at the same operating conditions was obtained in
Figure 6.
As shown in
Figure 5, the error between the numerical calculation and test results for the flow rate-head is small, with the maximum error at the high head being 0.4 m and the basic error range around 0.2 m. The prediction is more accurate in the high-efficiency zone conditions (
Q = 293.93–434.53 L/s) and slightly off in the low flow rate conditions (
Q = 174.68–293.93 L/s). As shown in
Figure 6, the maximum error between the numerical calculations and test results for flow rate efficiency is no more than 5%, with a basic error range of 3% or less. Overall, the numerical calculations have good accuracy in predicting the energy performance of the axial flow pump.
4.2. Numerical Calculations and Experimental Cavitation Properties
The results of numerical calculations and experimental tests of the 0° cavitation characteristics of the high specific speed axial flow pump are collated and compared in
Figure 7, where the horizontal coordinate is the inlet pressure and the vertical coordinate is the efficiency curve, with a 1% drop in efficiency for the critical cavitation condition during numerical calculations and tests.
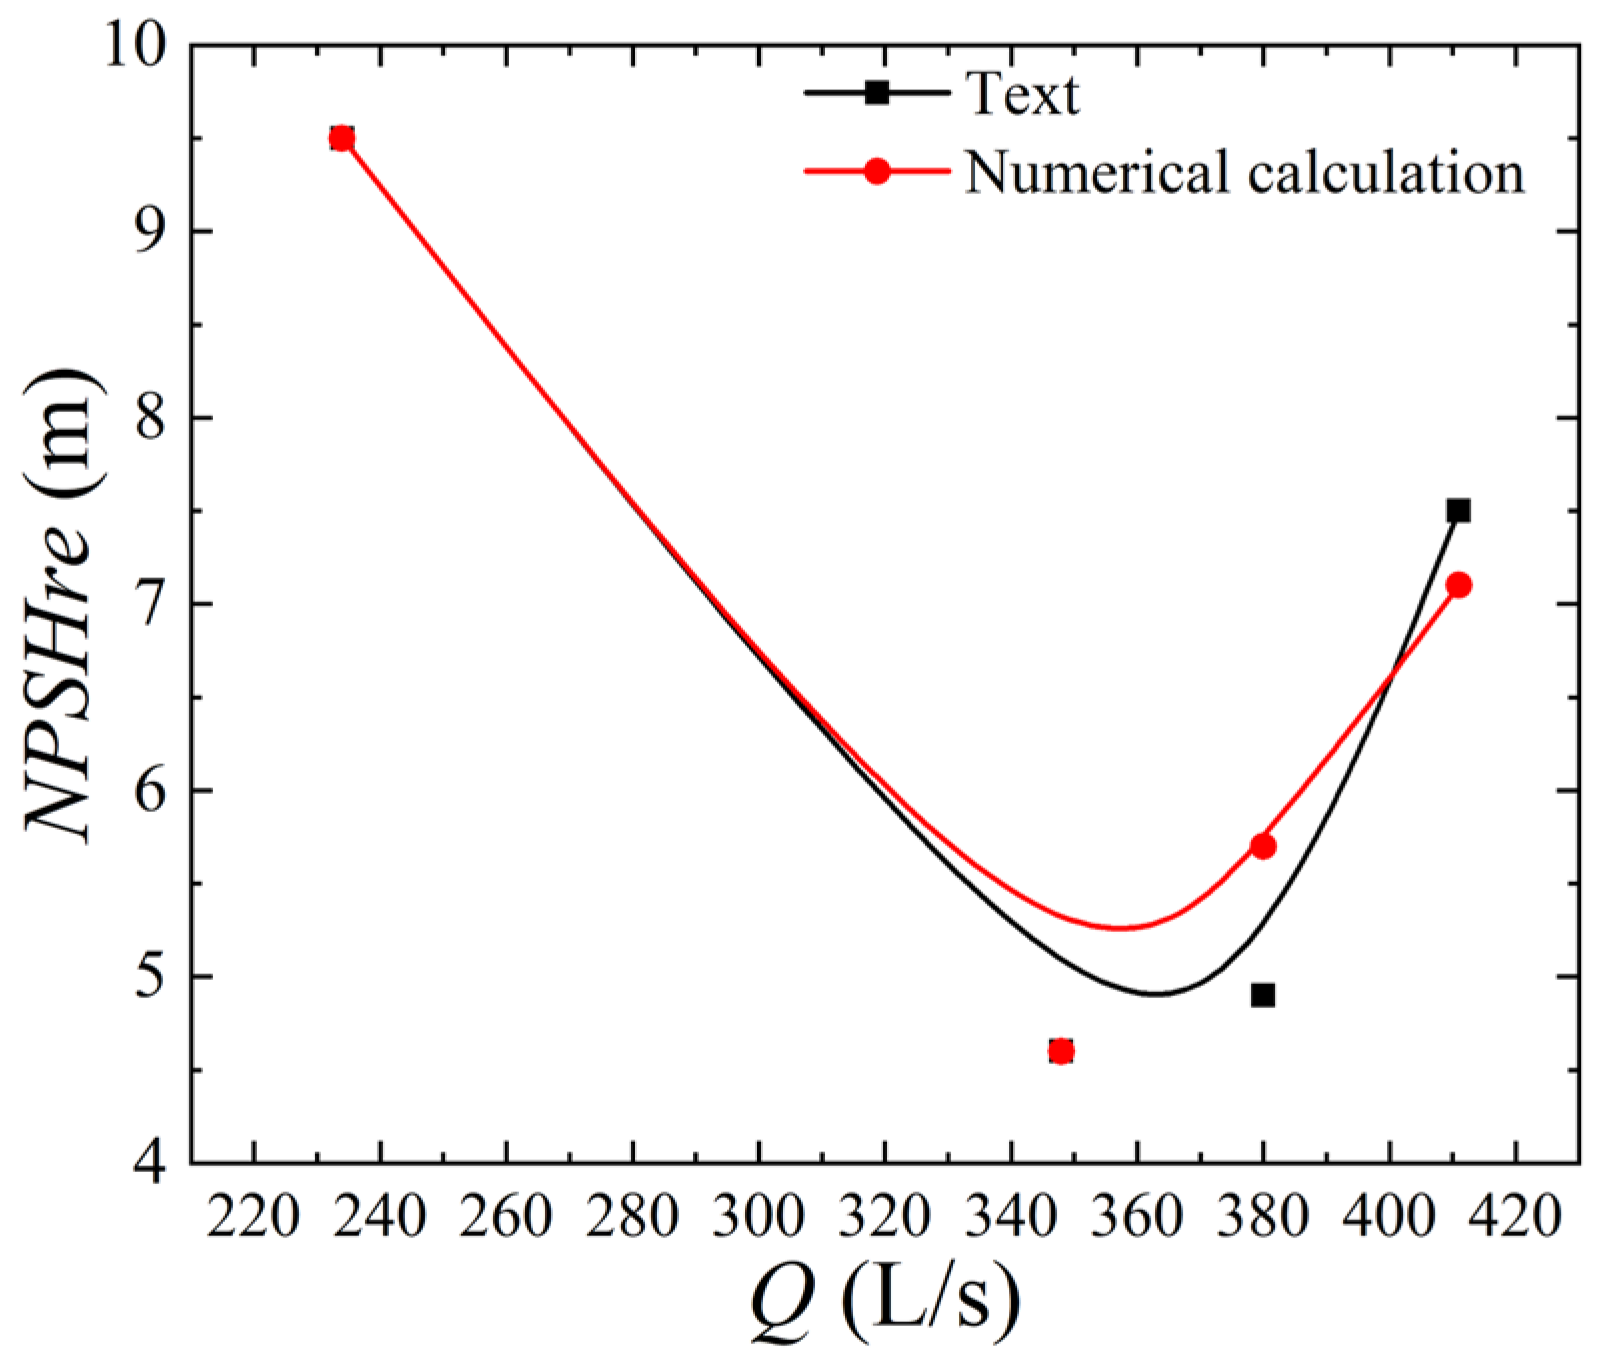
The numerical calculations of the 0° cavitation characteristics were collated with the critical cavitation margins taken out for the different operating conditions of the test to compare in
Figure 8.
According to
Figure 7 and
Figure 8 and
Table 4, the critical cavitation margin is 7.5 m and 4.9 m, respectively, under high flow conditions
Q = 411 L/s and 380 L/s in the test. When
Q = 348 L/s near the design condition, the critical cavitation margin is 4.6 m and reaches the minimum. Under low flow condition
Q = 234 L/s, the critical cavitation margin is 9.5 m. The critical cavitation margin is 7.1 m, 5.7 m, 4.6 m, and 9.5 m for
Q = 411 L/s, 380 L/s, 348 L/s, and 234 L/s, respectively, in the numerical calculation.
NPSHre is required to be less than 5.5 m for the design condition (
Q = 348 L/s), and the
NPSHre is 4.6 m for both the numerical calculation and test results, which meets the design requirement of cavitation. Both the numerical calculation and test show that with the increase in flow rate, the critical cavitation margin first decreases, and the critical cavitation margin is the smallest near the high-efficiency zone. With the increase in flow rate, the critical cavitation margin continues to increase. The numerical calculation is close to the test critical cavitation margin, with small error, and shows essentially the same trend and high reliability of the numerical calculation.
5. Analysis of Cavitation Numerical Calculation Results
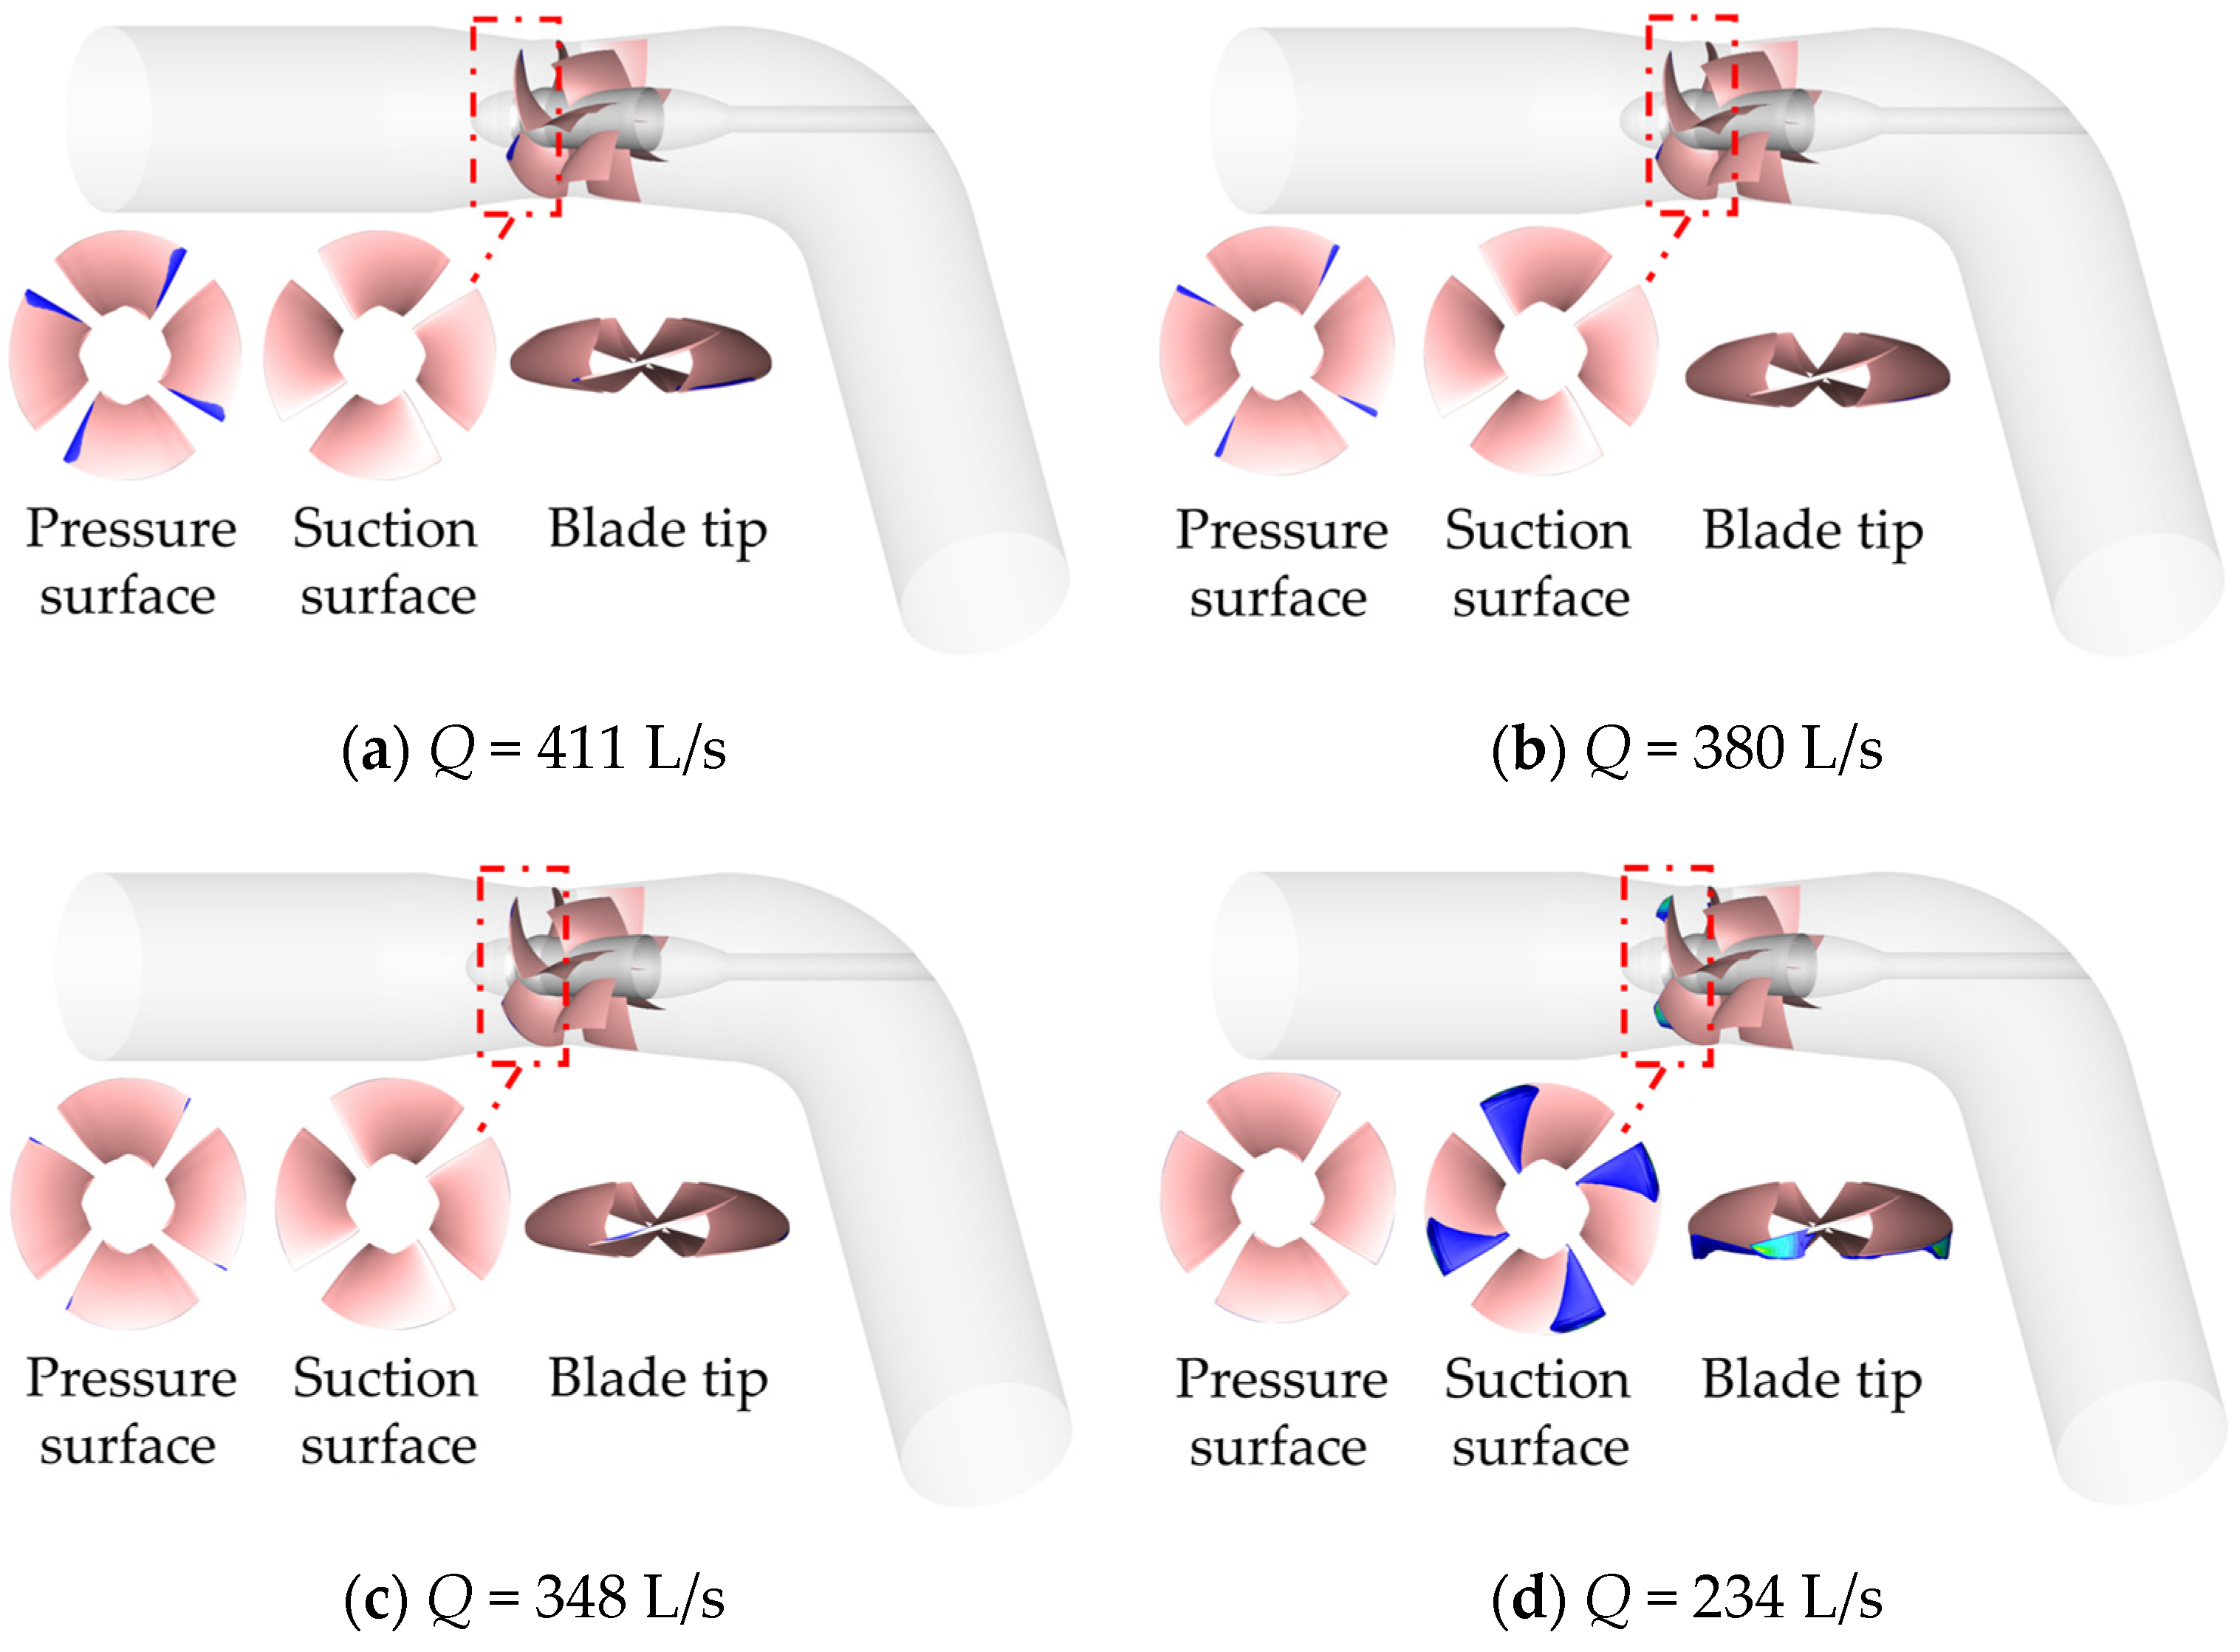
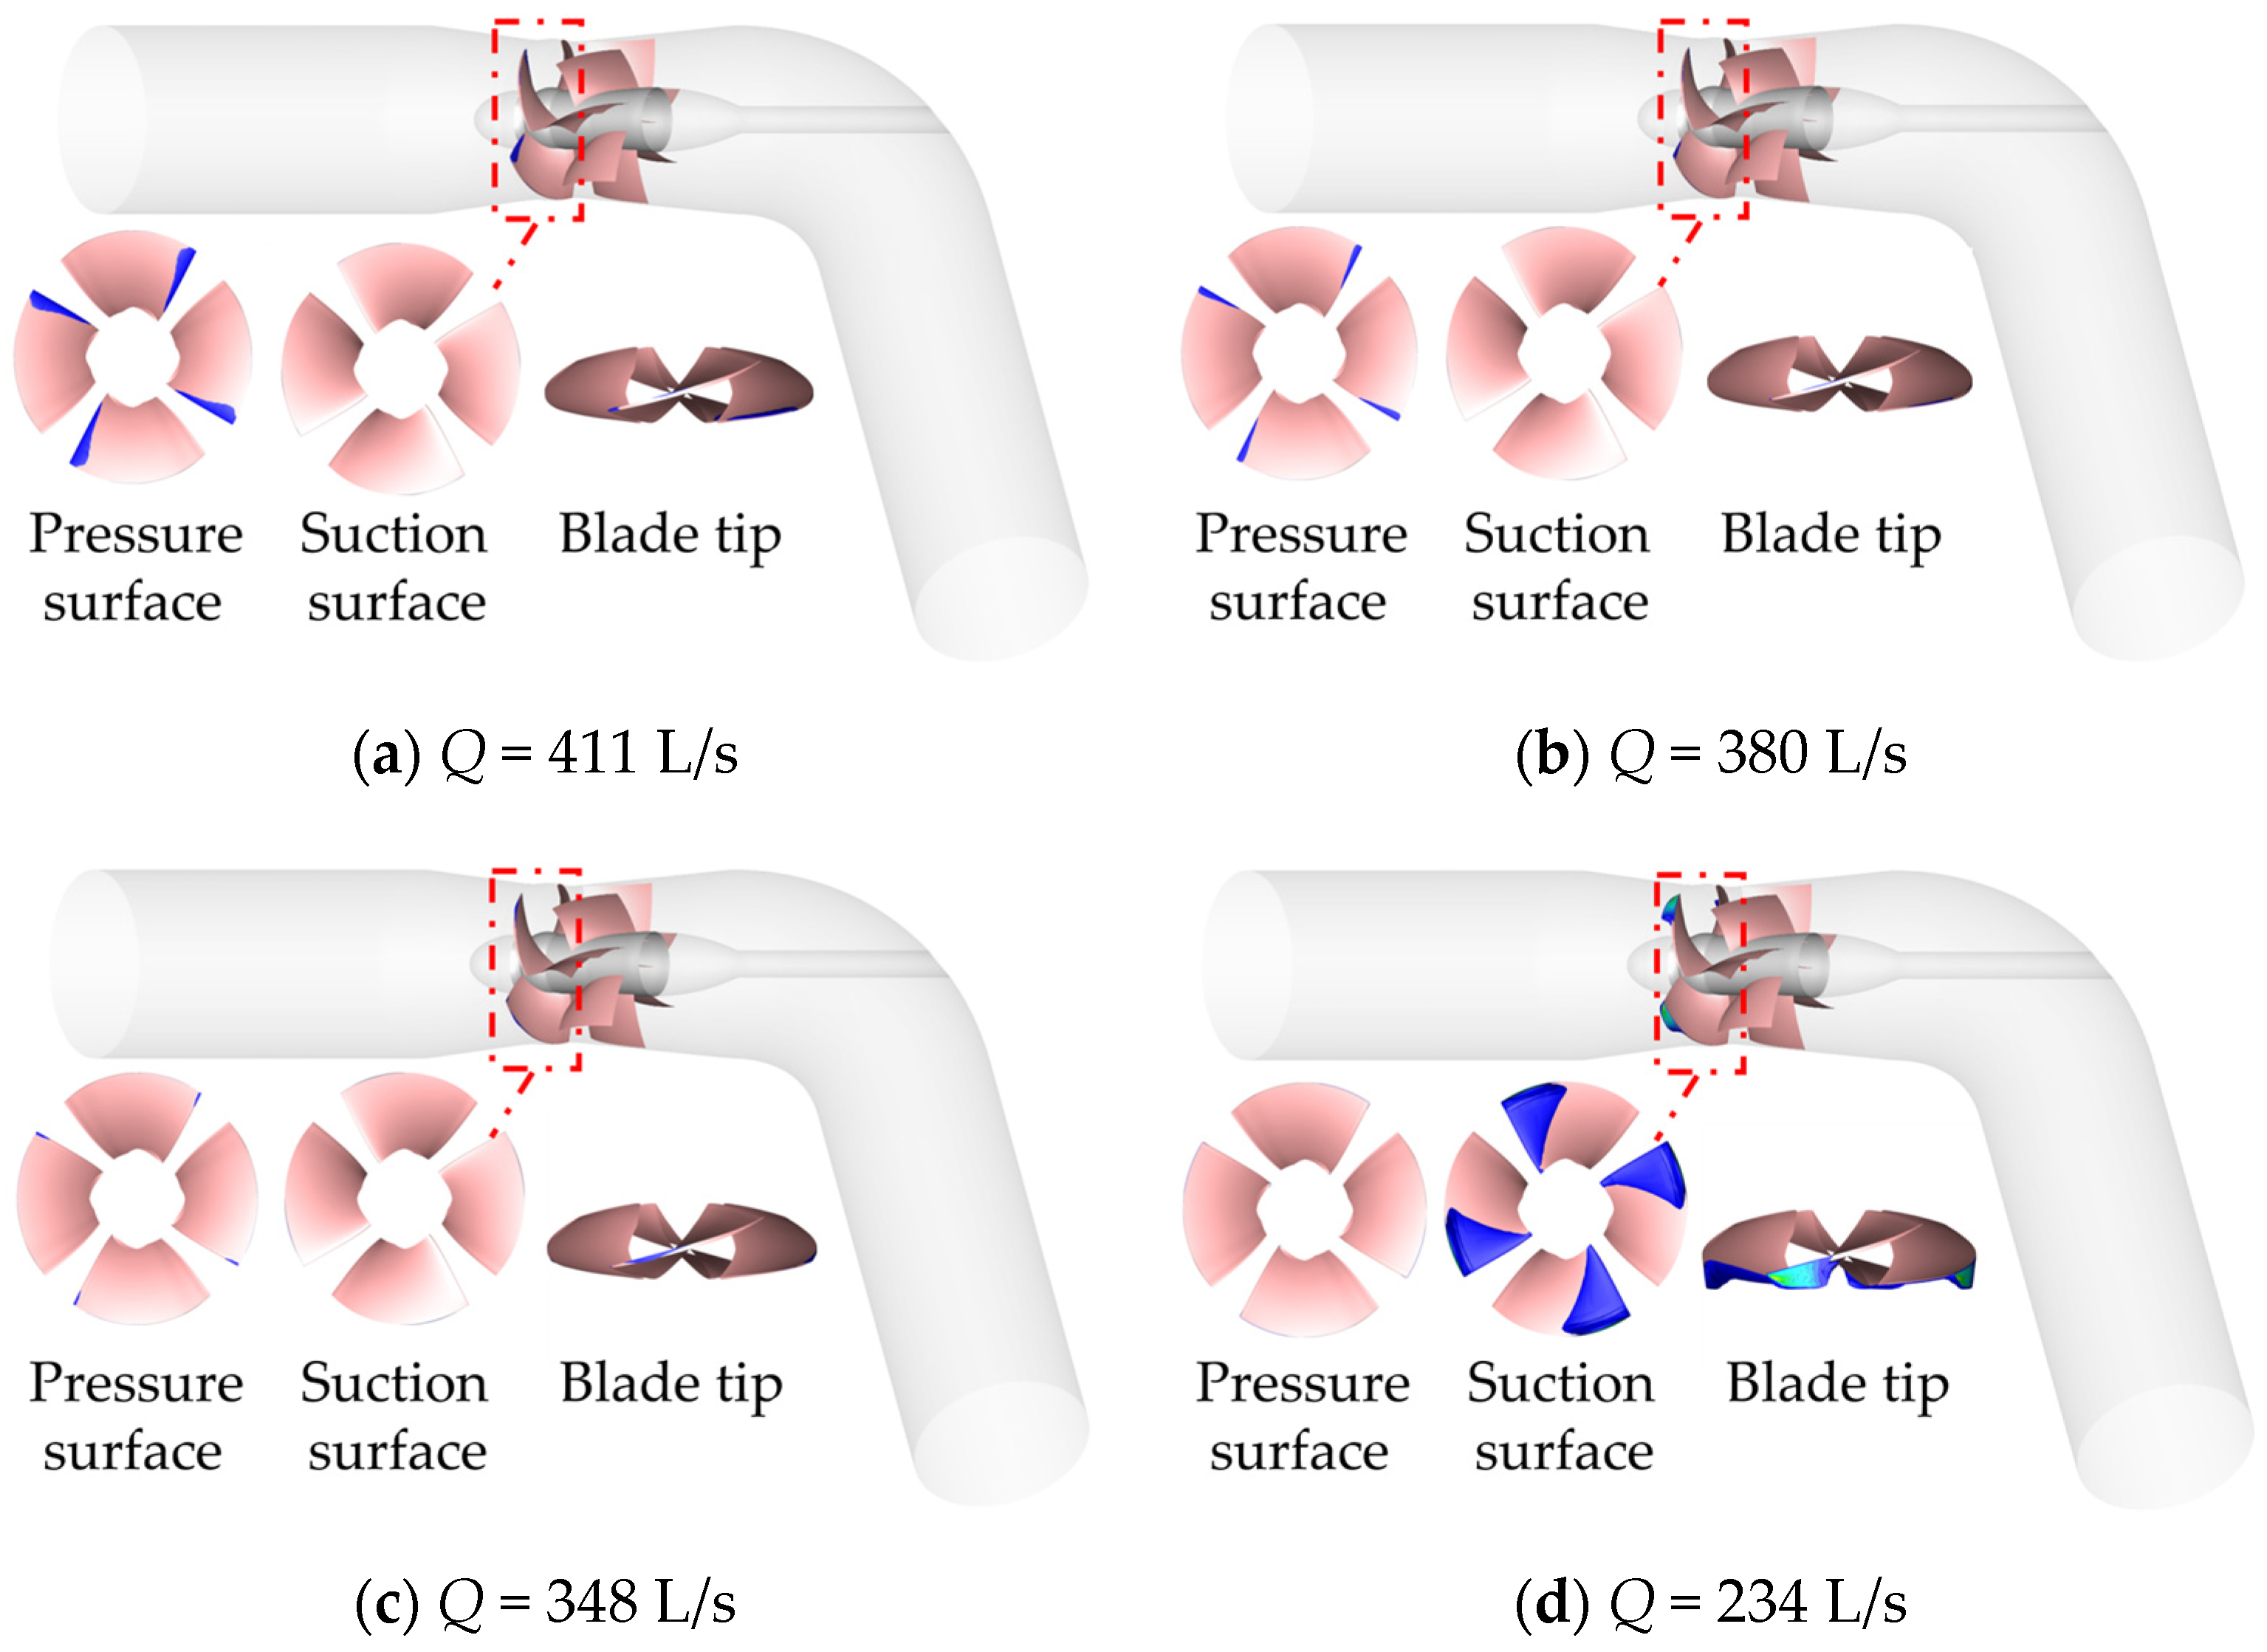
Air bubble (caused by the release of non-condensable gases dissolved in the liquid due to a drop in pressure) cloud diagrams at different flow rates with the inlet pressure
pin = 11 × 10
4 Pa are organized as shown in
Figure 9.
The comparative analysis of the cavitation at different flow rates with the same inlet pressure (pin = 11 × 104 Pa) shows that the cavitation occurs at the inlet of the pressure surface under the design condition and high flow rate (Q = 348–411 L/s), presenting a strip-like distribution, while the cavitation occurs at the suction surface under the low flow rate (Q = 234 L/s), near the inlet blade tip, presenting a sheet-like distribution. As the flow rate decreases, the cavitation area of the pressure surface gradually decreases, and the area of the cavitation at the hub toward the wheel rim also gradually decreases; no air bubble appears at the pressure surface at the flow rate of Q = 234 L/s, at the suction surface, no air bubble appears at the high flow rate and design conditions (Q = 348–411 L/s), and the area of the air bubble is larger at the small flow rate conditions (Q = 234 L/s) and exceeds the most intense occurrence of cavitation when at the pressure surface. At the top of the leaf, there are vacuoles in all operating conditions; the vacuole area is small in the high flow condition and design condition (Q = 348–411 L/s), and the cavitation at the top of the leaf is more intense in the small flow condition (Q = 234 L/s), having a larger vacuole area and showing a cloud-like distribution.
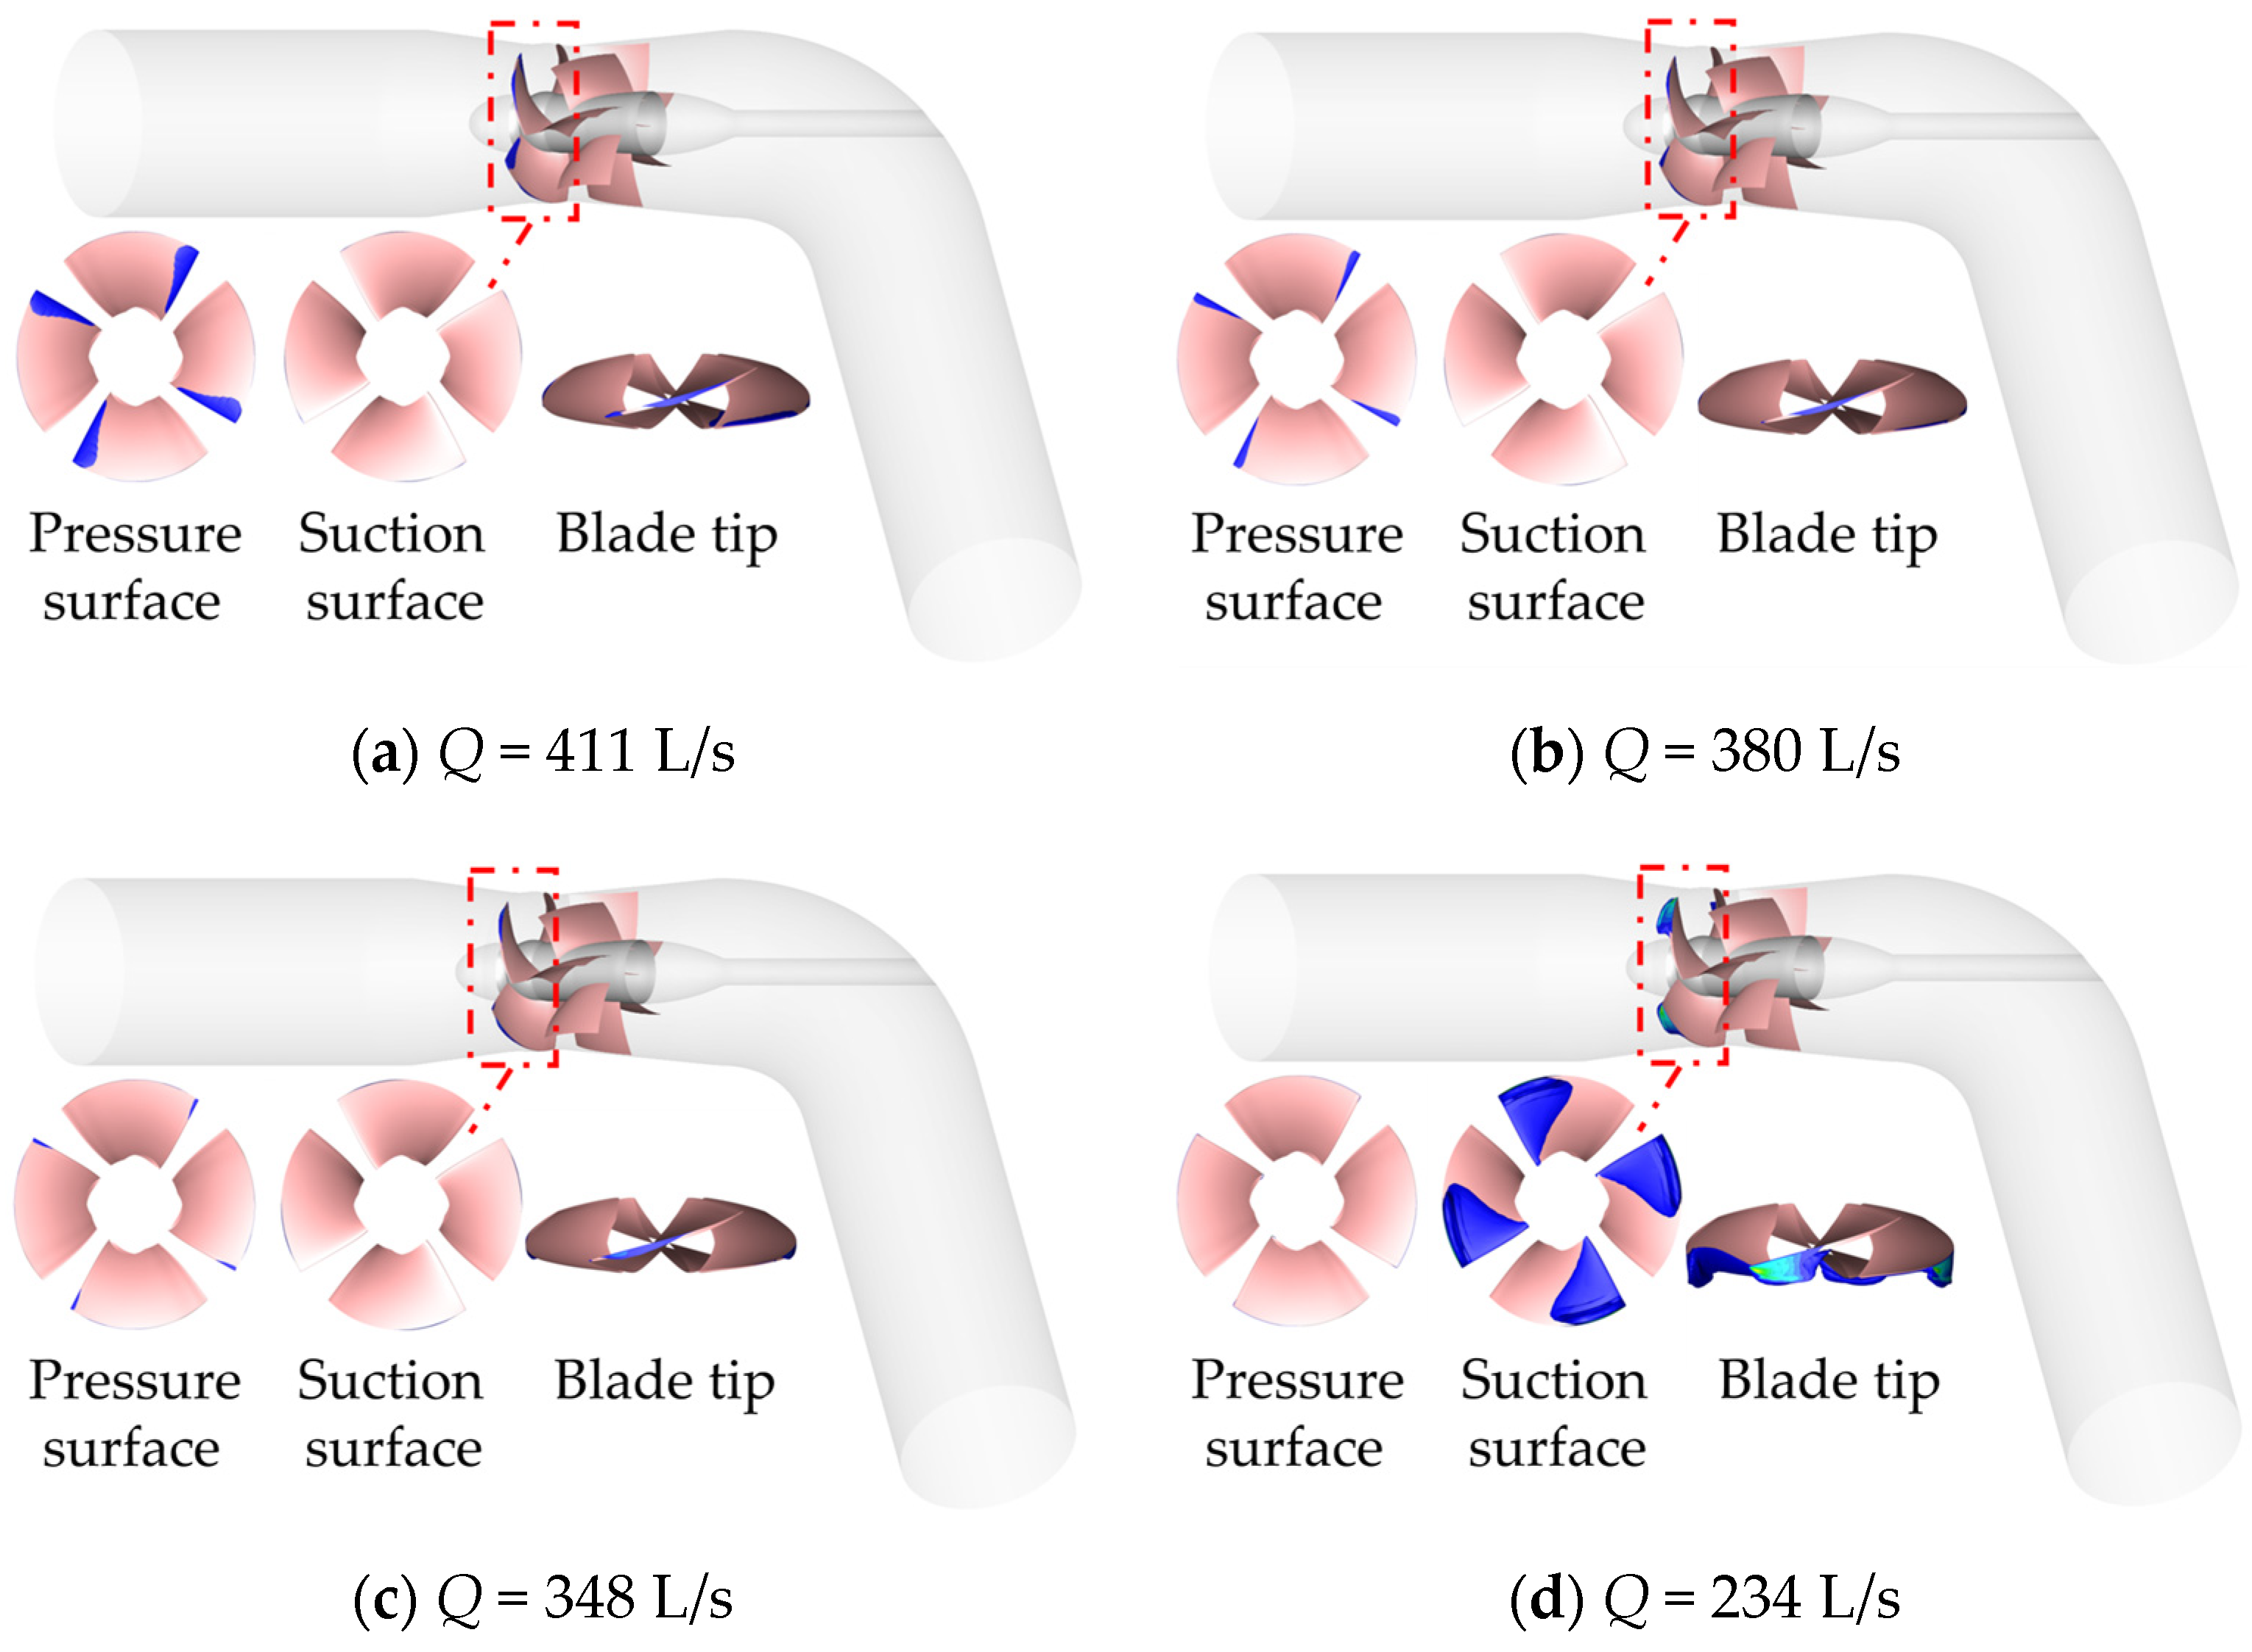
The cavitation cloud diagrams at an inlet pressure of
pin = 10 × 10
4 Pa and different flow rates are organized as shown in
Figure 10.
The inlet pressure pin = 10 × 104 Pa, compared with the inlet pressure pin = 11 × 104 Pa, shows the same law of change with the working conditions. In the same working condition with the reduction in inlet pressure (inlet pressure from pin = 11 × 104 Pa to pin = 10 × 104 Pa), the area of the cavitation bubble increased and appeared in the same position. Because the inlet pressure pin = 10 × 104 Pa and the inlet pressure pin = 11 × 104 Pa show only small changes in the inlet pressure, and are born in the cavitation stage, the development of the degree of cavitation compared to the pressure change is not significant.
The cloud diagrams of cavitation at different flow rates with an inlet pressure
pin = 8 × 10
4 Pa are organized as shown in
Figure 11.
The inlet pressure pin = 8 × 10⁴ Pa, compared with the inlet pressures pin = 10 × 104 Pa and pin = 11 × 104 Pa, shows the law of change with the working condition is similar. In the same working condition, inlet pressure decreases (from pin = 10 × 104 Pa to pin = 8 × 10⁴ Pa), the area of the air bubble further increases in comparison, and it can be seen that the area of the air bubble on the pressure surface increases significantly under the large flow rate and design working condition (Q = 348–411 L/s). Additionally, the cavitation area of the pressure surface increased noticeably, the cavitation area at the pressure surface still did not appear under the small flow condition (Q = 234 L/s), and the cavitation area at the suction surface still did not appear under the high flow and design conditions (Q = 348–411 L/s). The cavitation area at the blade tip increased obviously under the small flow condition (Q = 234 L/s), the cavitation area at the blade tip increased under each condition (Q = 234–411 L/s), and the cavitation area at the blade tip increased significantly under all operating conditions (Q = 234–411 L/s).
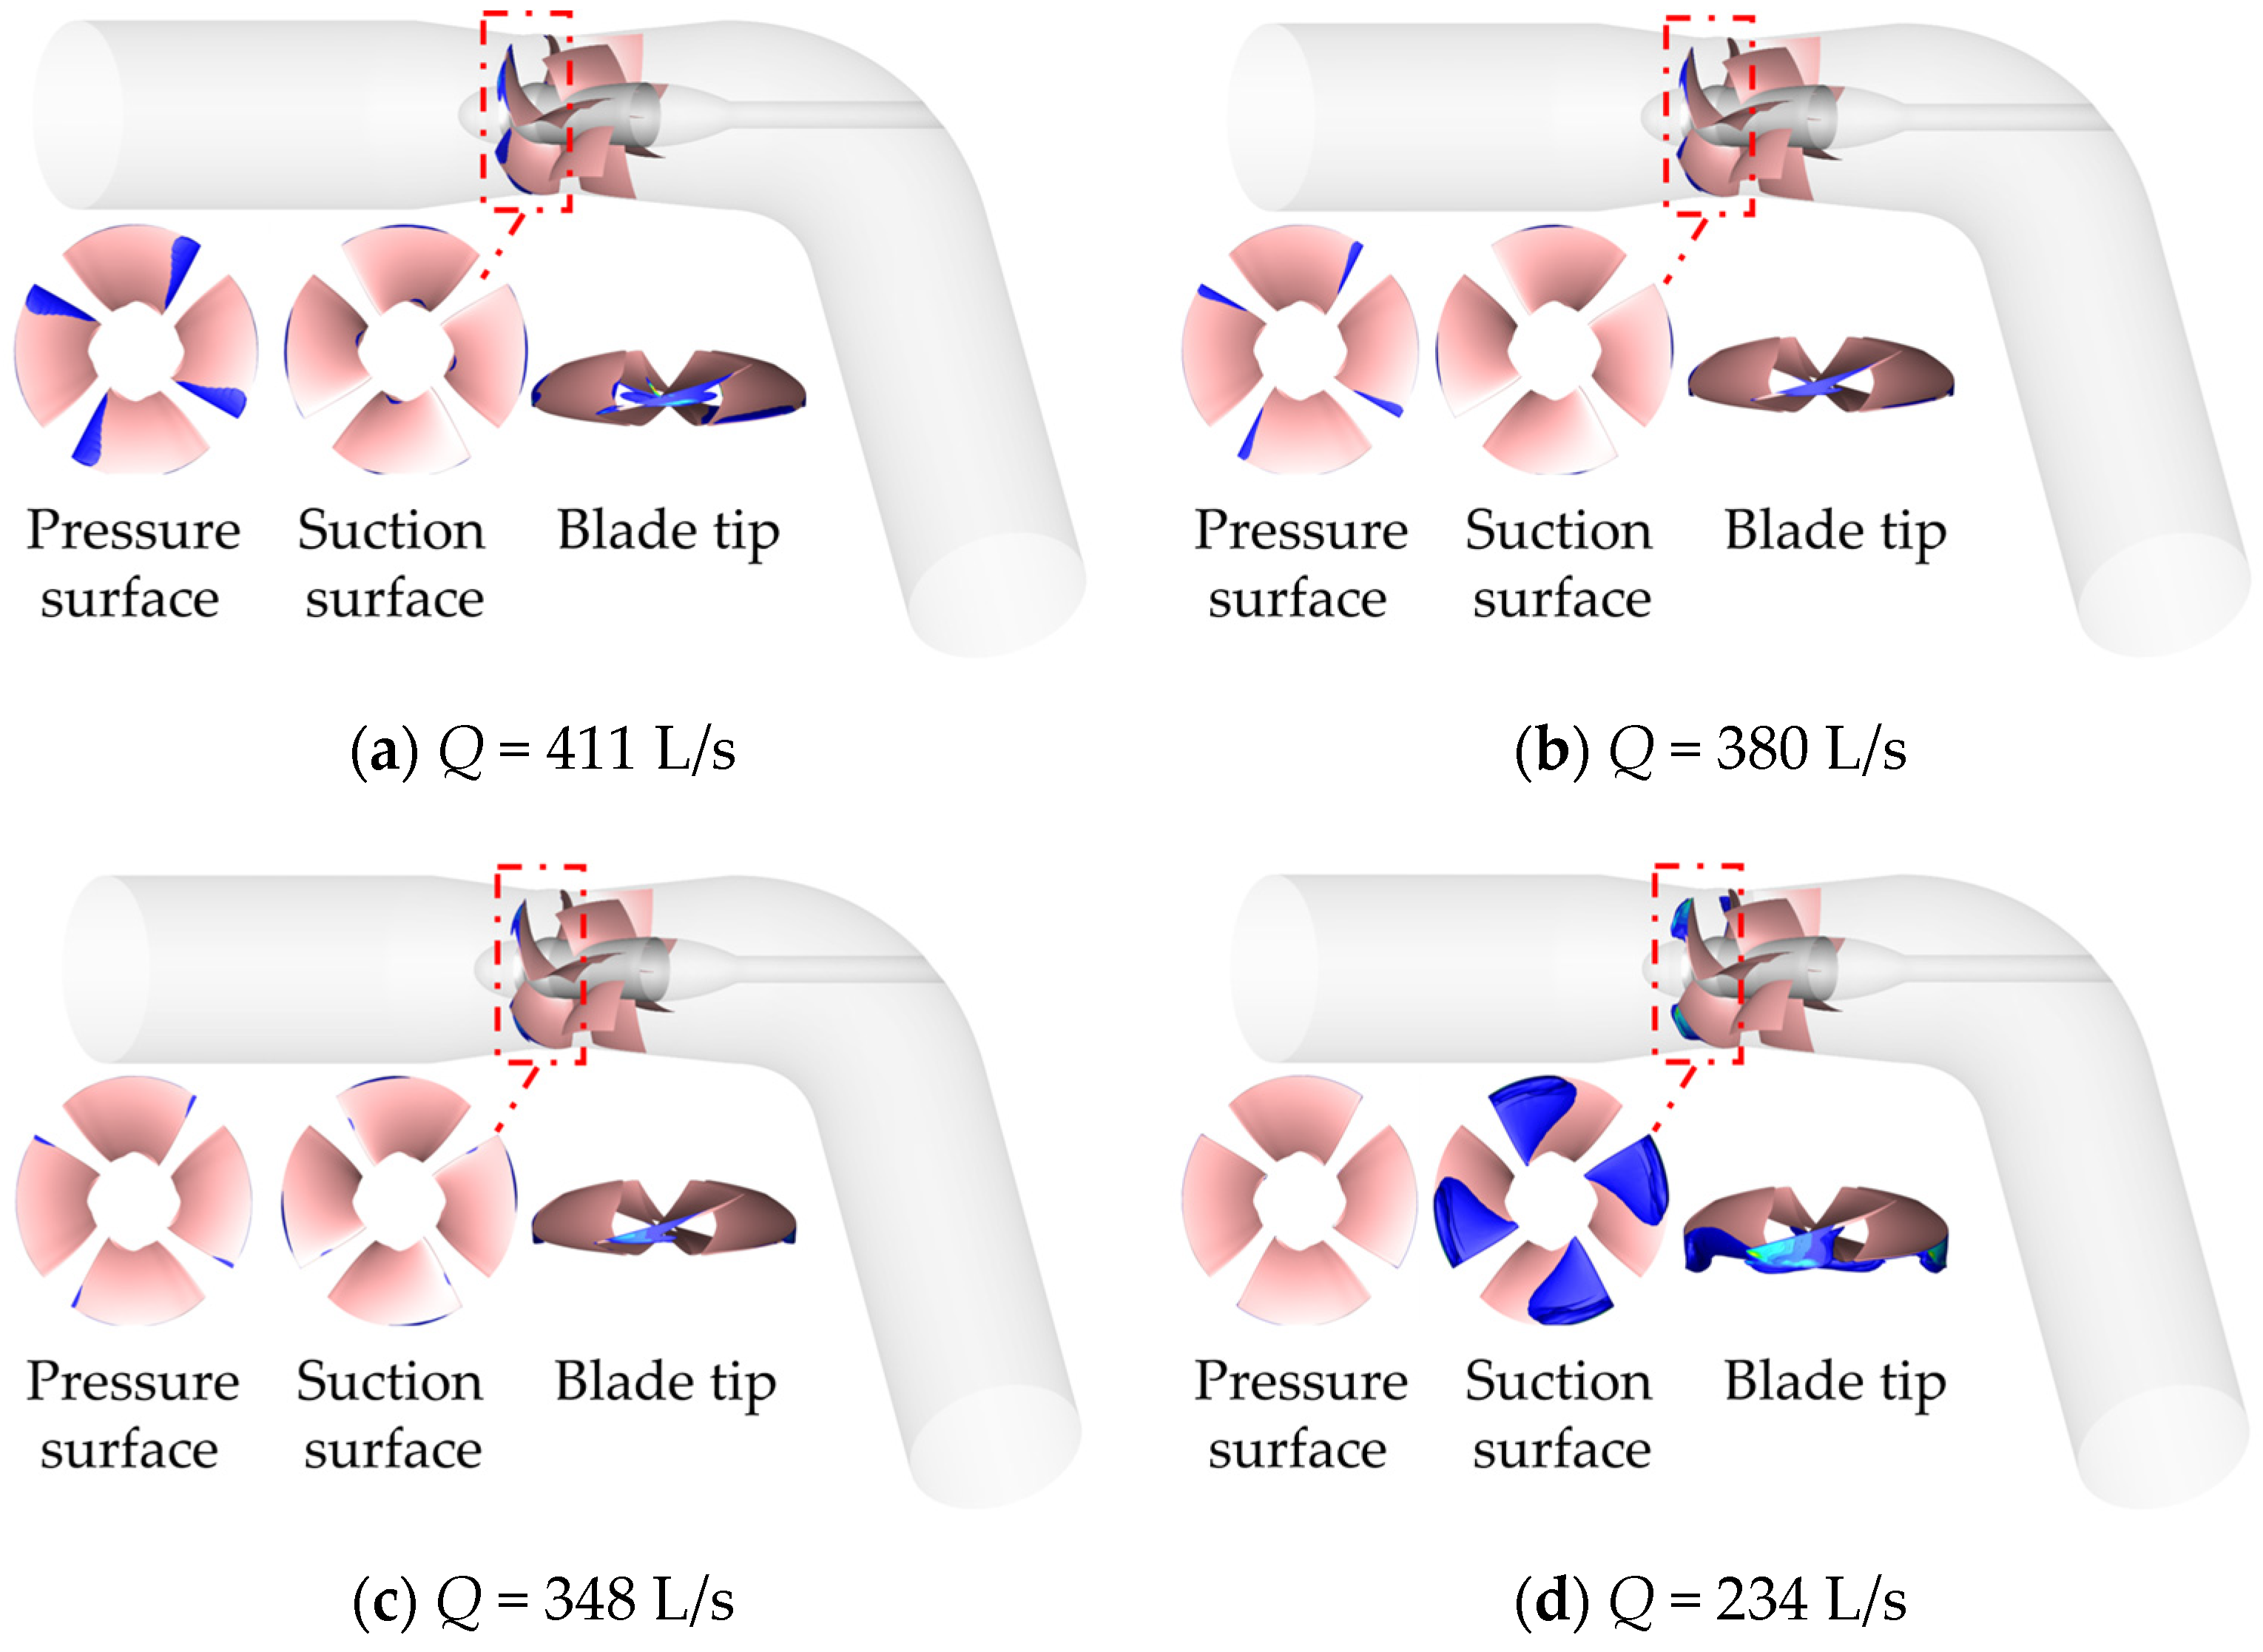
The cloud diagrams of cavitation at different flow rates with an inlet pressure of
pin = 7 × 10
4 Pa are organized as shown in
Figure 12.
The inlet pressure pin = 7 × 10⁴ Pa, compared with the inlet pressure pin = 8 × 10⁴ Pa, pin = 10 × 104 Pa, and pin = 11 × 104 Pa, shows the change law with the working condition is similar. In the same working condition with the decrease in inlet pressure (inlet pressure decreased from pin = 8 × 10⁴ Pa to pin = 7 × 10⁴ Pa), the area of the vacuole further increased in comparison, and the pressure surface change law was similar to the previous one. The vacuole appeared at the hub at the suction surface at the high flow condition (Q = 411 L/s) and the design condition (Q = 348 L/s), and the vacuole appeared at the suction surface, distributed in the middle of the blade head region. The cavitation at the blade tip at each working condition (Q = 234–411 L/s) is more obvious and starts to break away from the blade surface and develop into the fluid.
The air bubble cloud diagrams at different flow rates with an inlet pressure of
pin = 6 × 10
4 Pa are organized as shown in
Figure 13.
At an inlet pressure of pin = 6 × 10⁴ Pa, with the change of working conditions, the pressure surface of the air bubble area gradually reduced; the suction surface of the air bubble area was first reduced in the design working conditions (Q = 348 L/s) under the smallest air bubble area and then increased, but both the pressure surface or suction surface of each working conditions contained an air bubble.
In the same working condition as the inlet pressure decreases (inlet pressure decreased from pin = 7 × 10⁴ Pa to pin = 6 × 10⁴ Pa), the area of the vacuole further increases in comparison. The area of the vacuole at the hub further increases at the suction surface at the high flow condition (Q = 411 L/s), and the vacuole also exists at the suction surface at the design condition (Q = 348 L/s). The area of the vacuole distributed at the blade head in the middle region further increases, and the cavitation at the blade tip under each working condition (Q = 234–411 L/s) is more obvious as the vacuole produces obvious stripping and movement into the fluid.
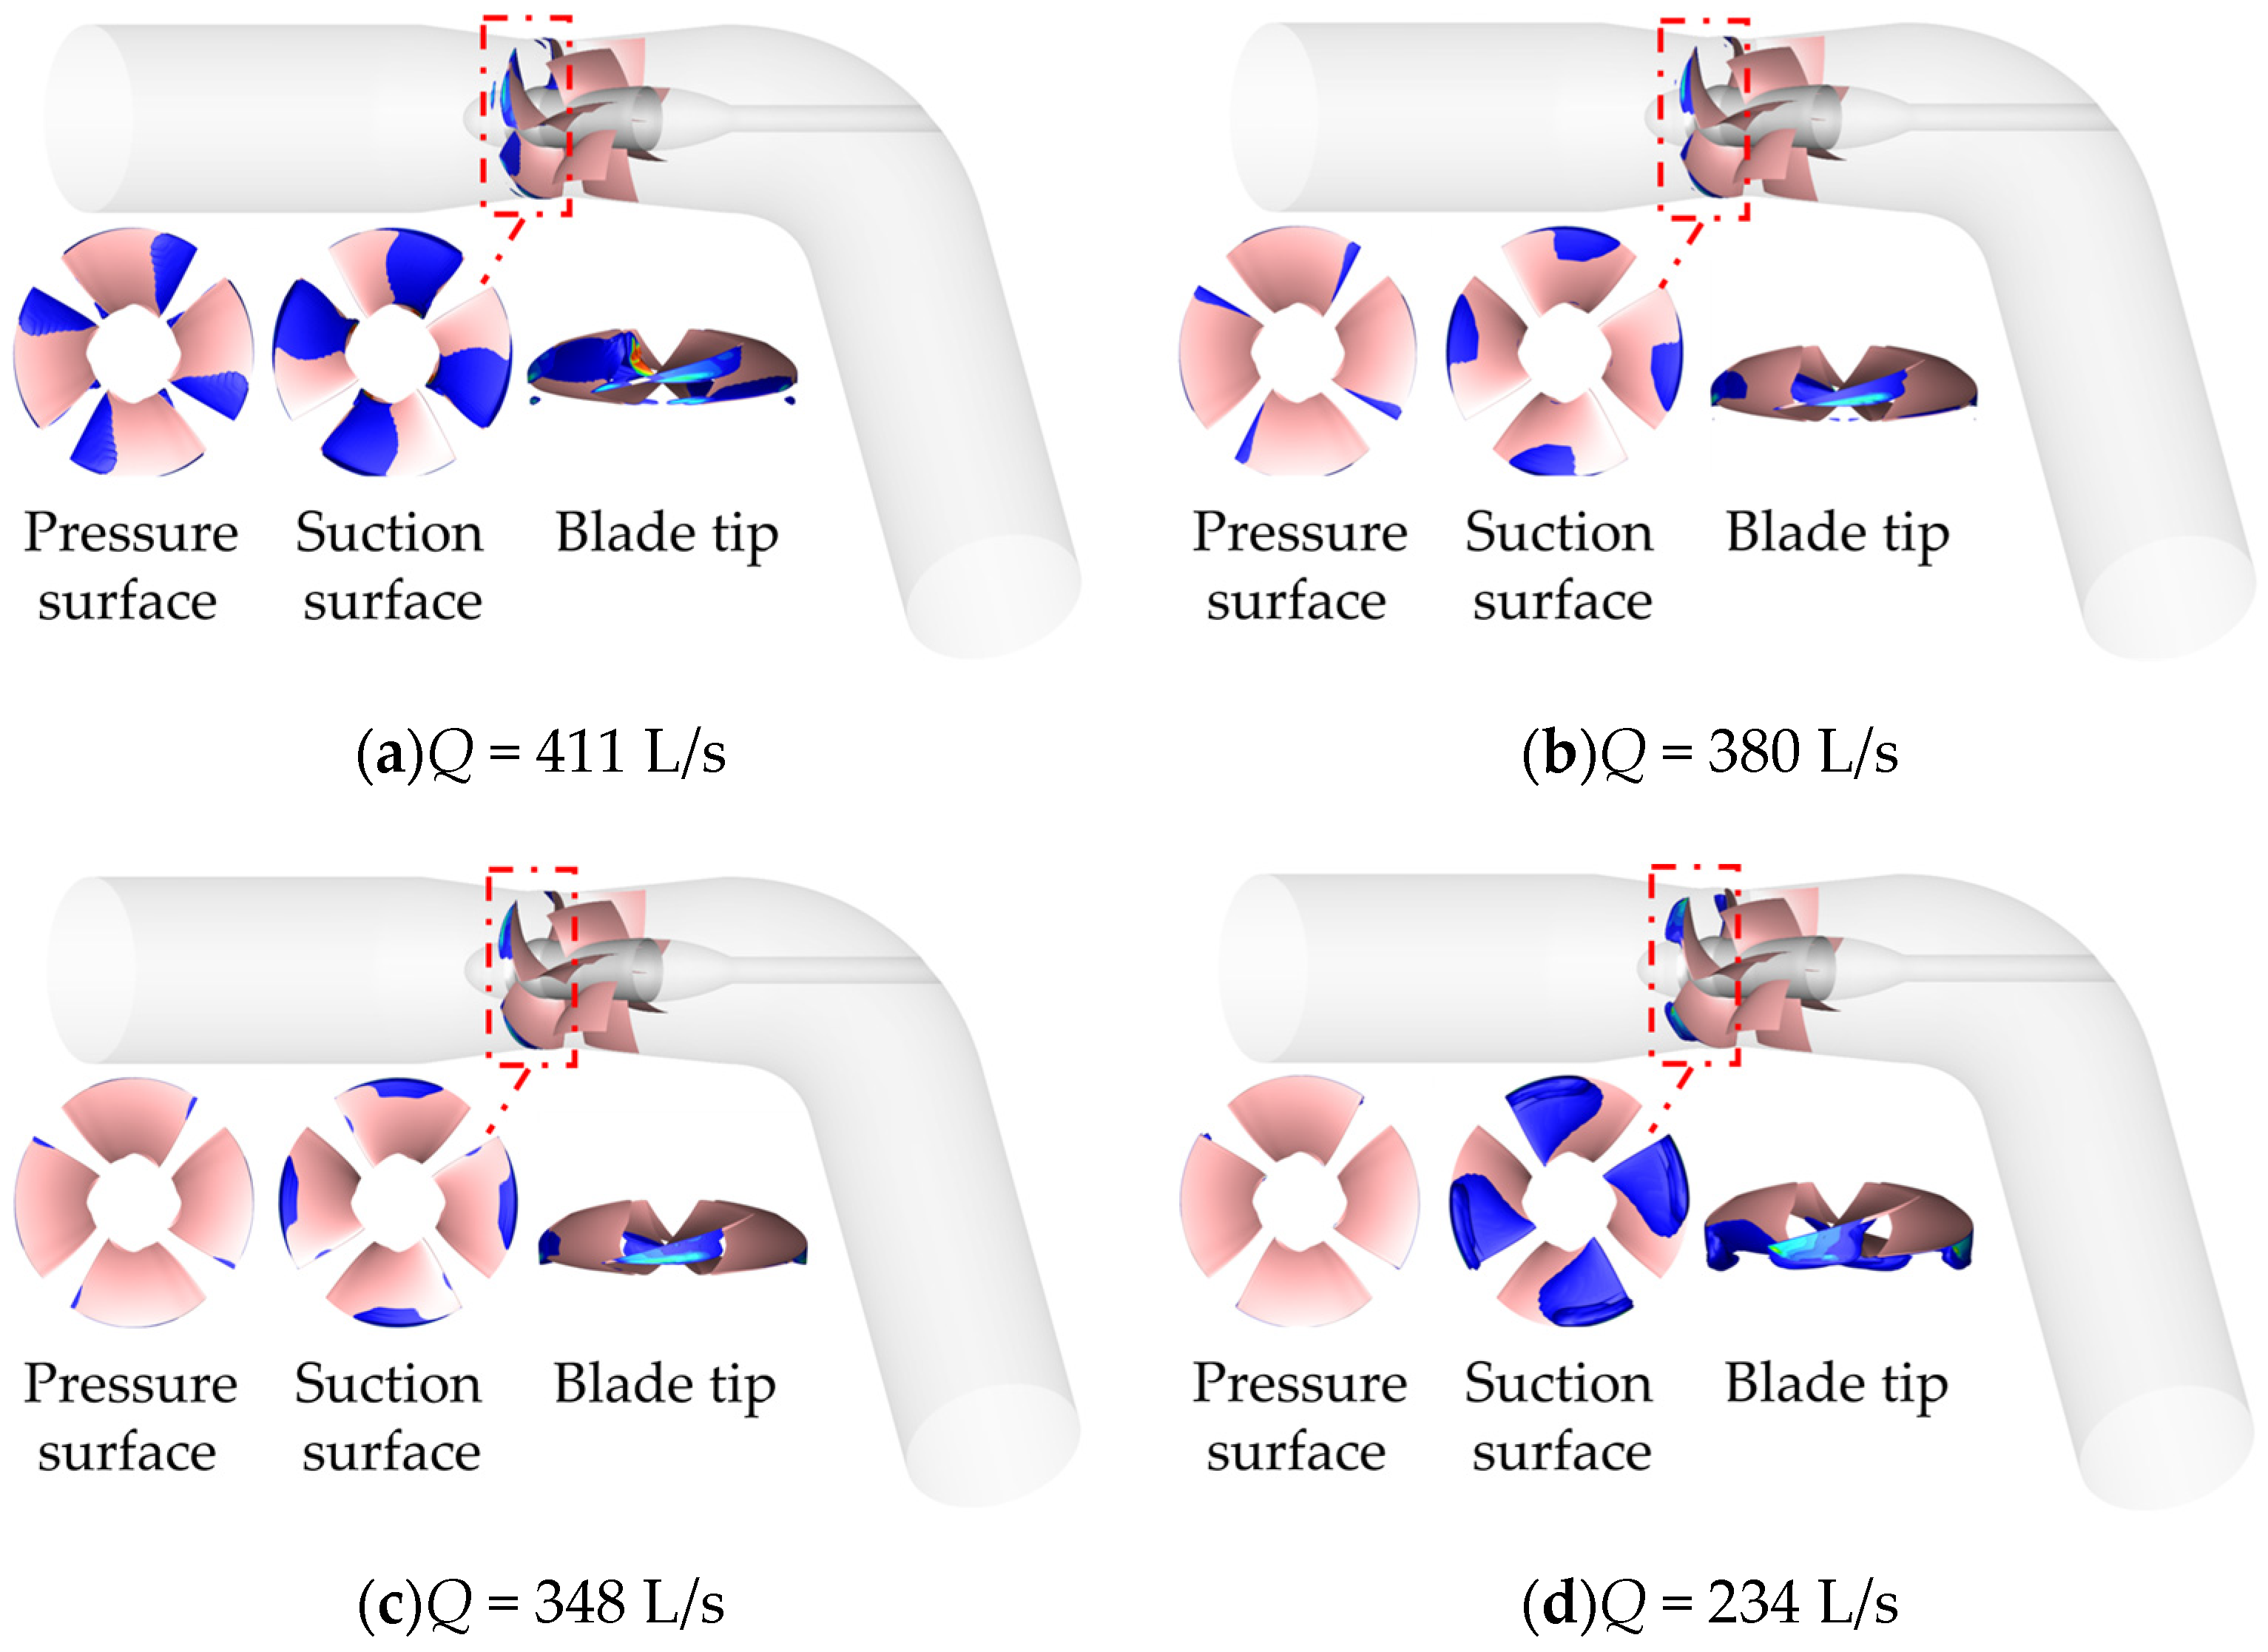
The air bubble cloud diagrams at different flow rates with an inlet pressure of
pin = 5 × 10
4 Pa are organized as shown in
Figure 14.
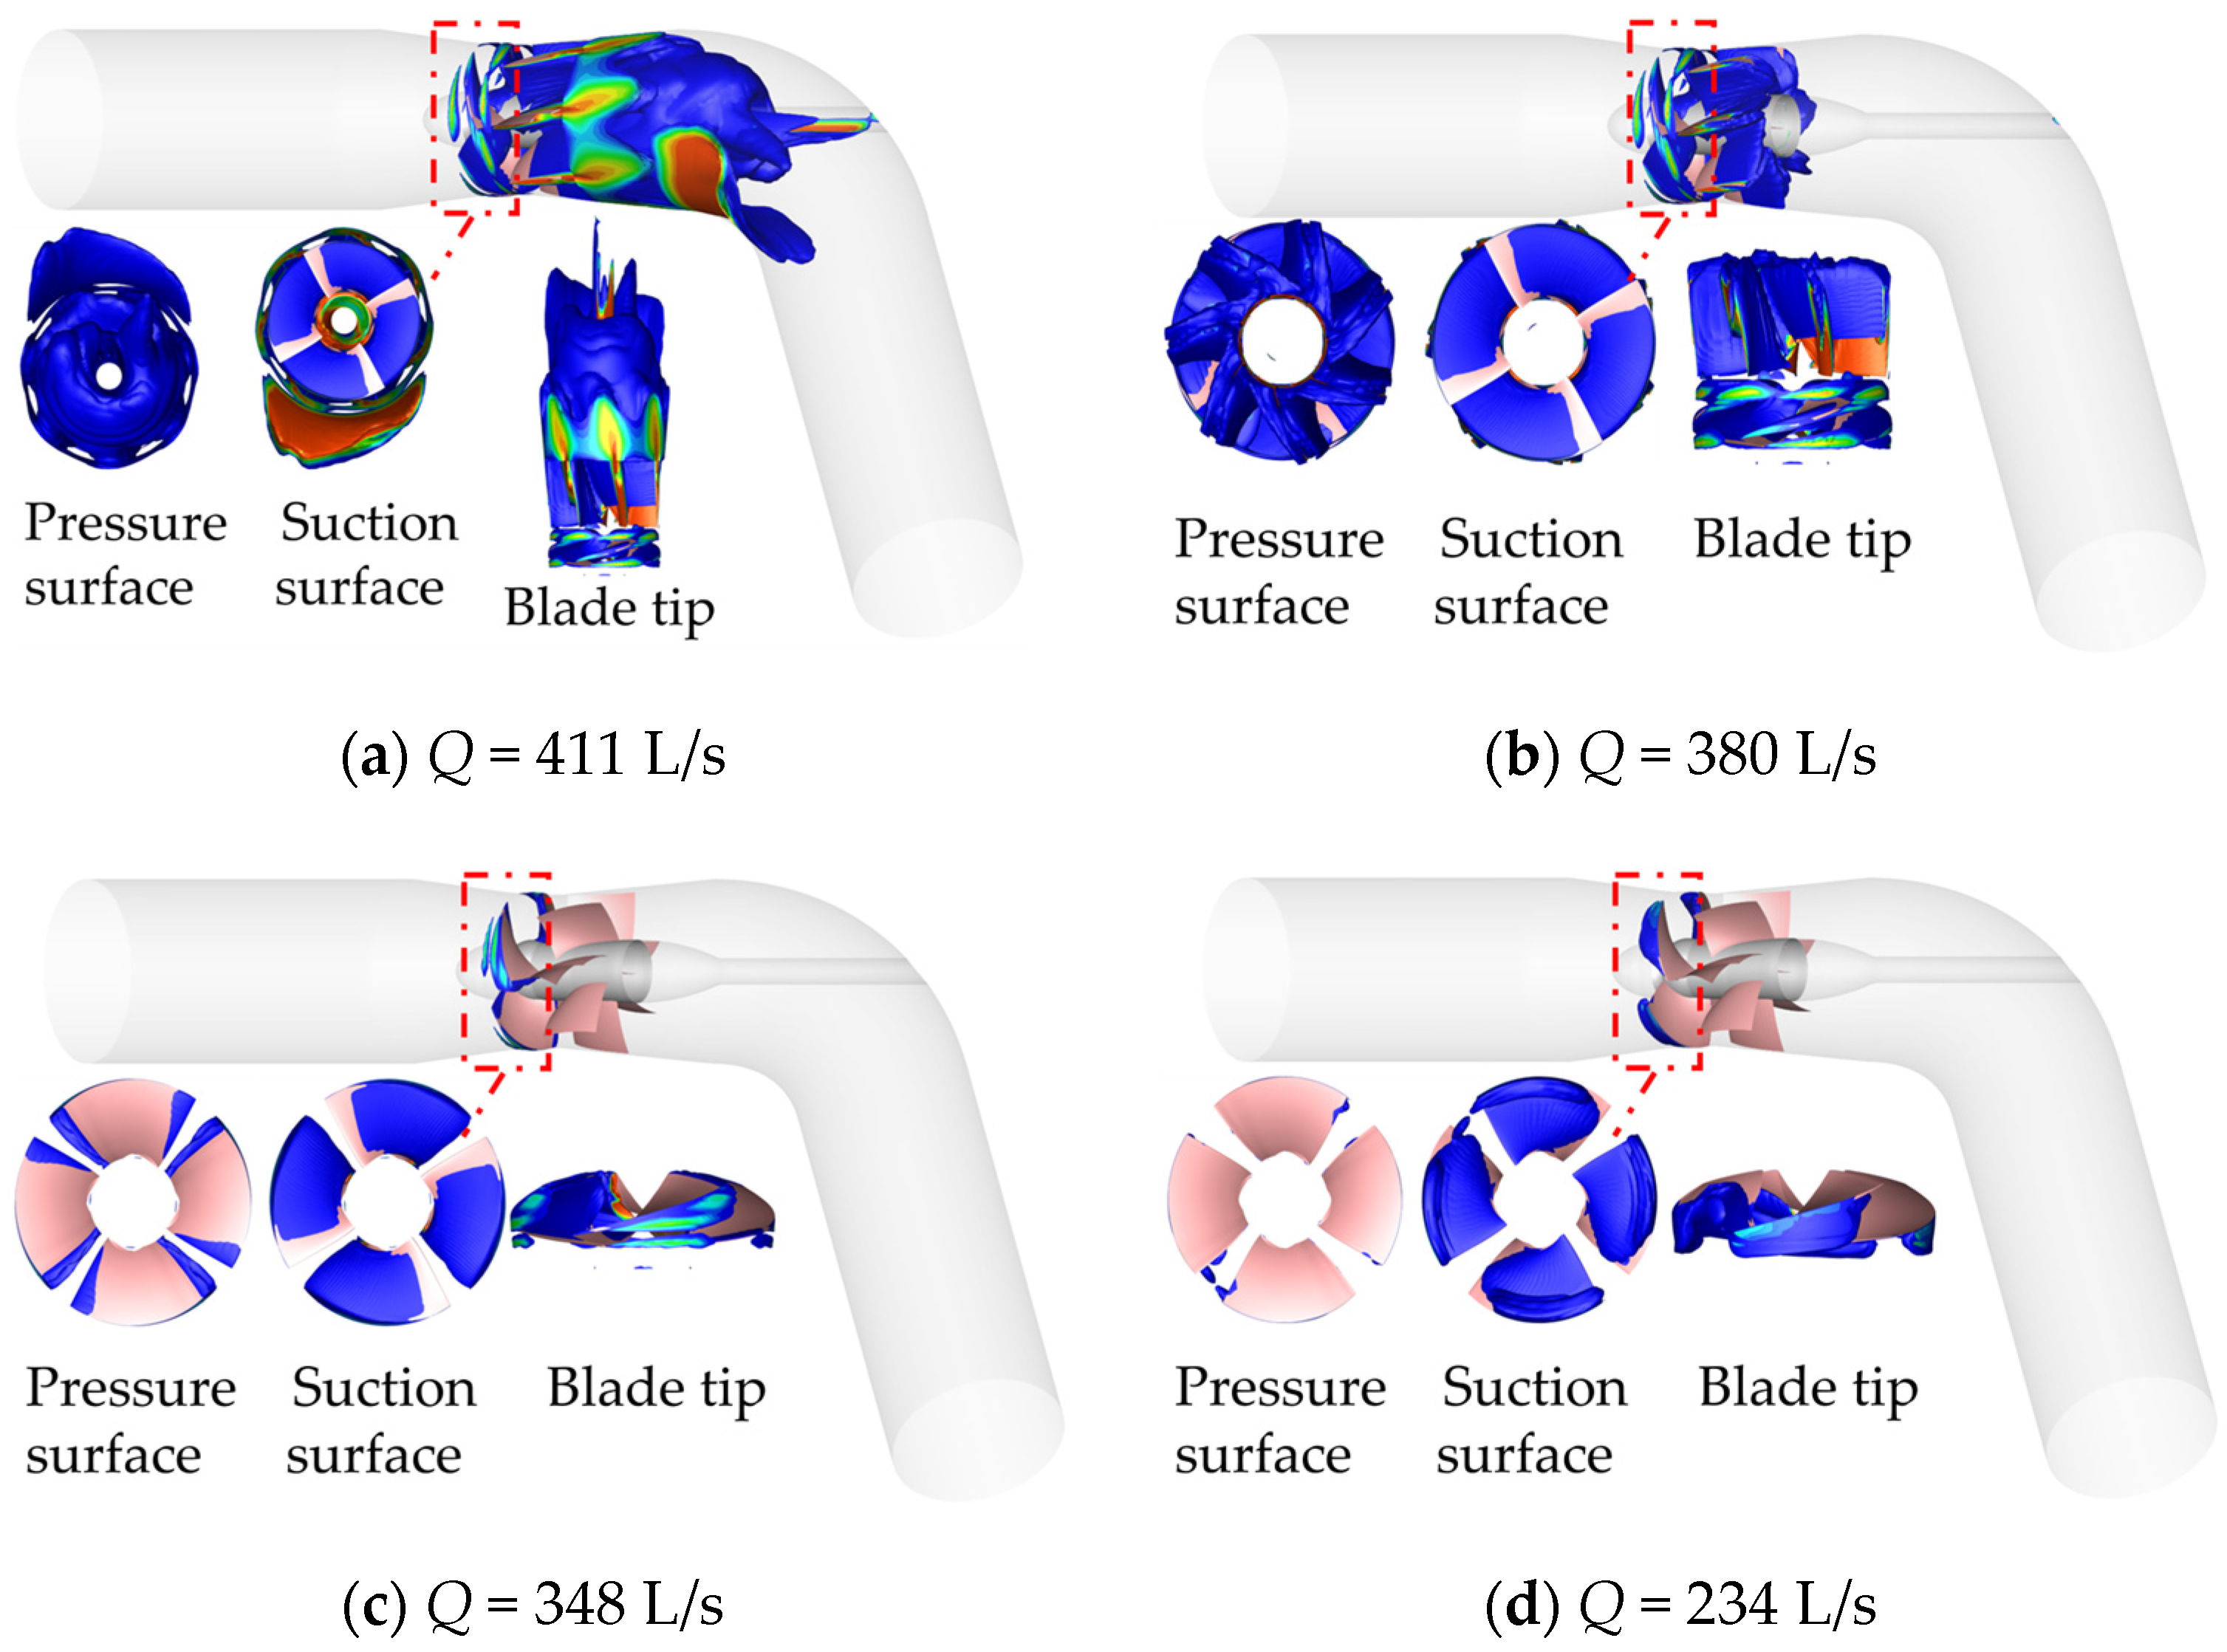
The inlet pressure pin = 5 × 10⁴ Pa, compared with the inlet pressure pin =6 × 10⁴ Pa, shows the same law of changing with the working conditions. In the same working condition, as the inlet pressure decreases (inlet pressure decreases from pin = 6 × 10⁴ Pa to pin = 5 × 10⁴ Pa), the area of the air bubbles further increases in comparison to the pressure surface in the high flow condition (Q = 411 L/s), the impeller and guide vane domain are basically full of air bubbles and the guide vane is also surrounded by air bubbles. The suction surface in the high flow condition (Q = 411 L/s) shows there is a large number of air bubbles at the hub; the air bubbles essentially wrapped 2/3 of the blade surface, in the design condition (Q = 348 L/s), the suction surface existing air bubbles essentially wrapped 1/2 of the blade surface and the cavitation at the top of the blade under each condition (Q = 234–411 L/s) is more obvious.
The air bubble cloud diagrams at different flow rates with an inlet pressure of
pin = 4 × 10
4 Pa are organized as shown in
Figure 15.
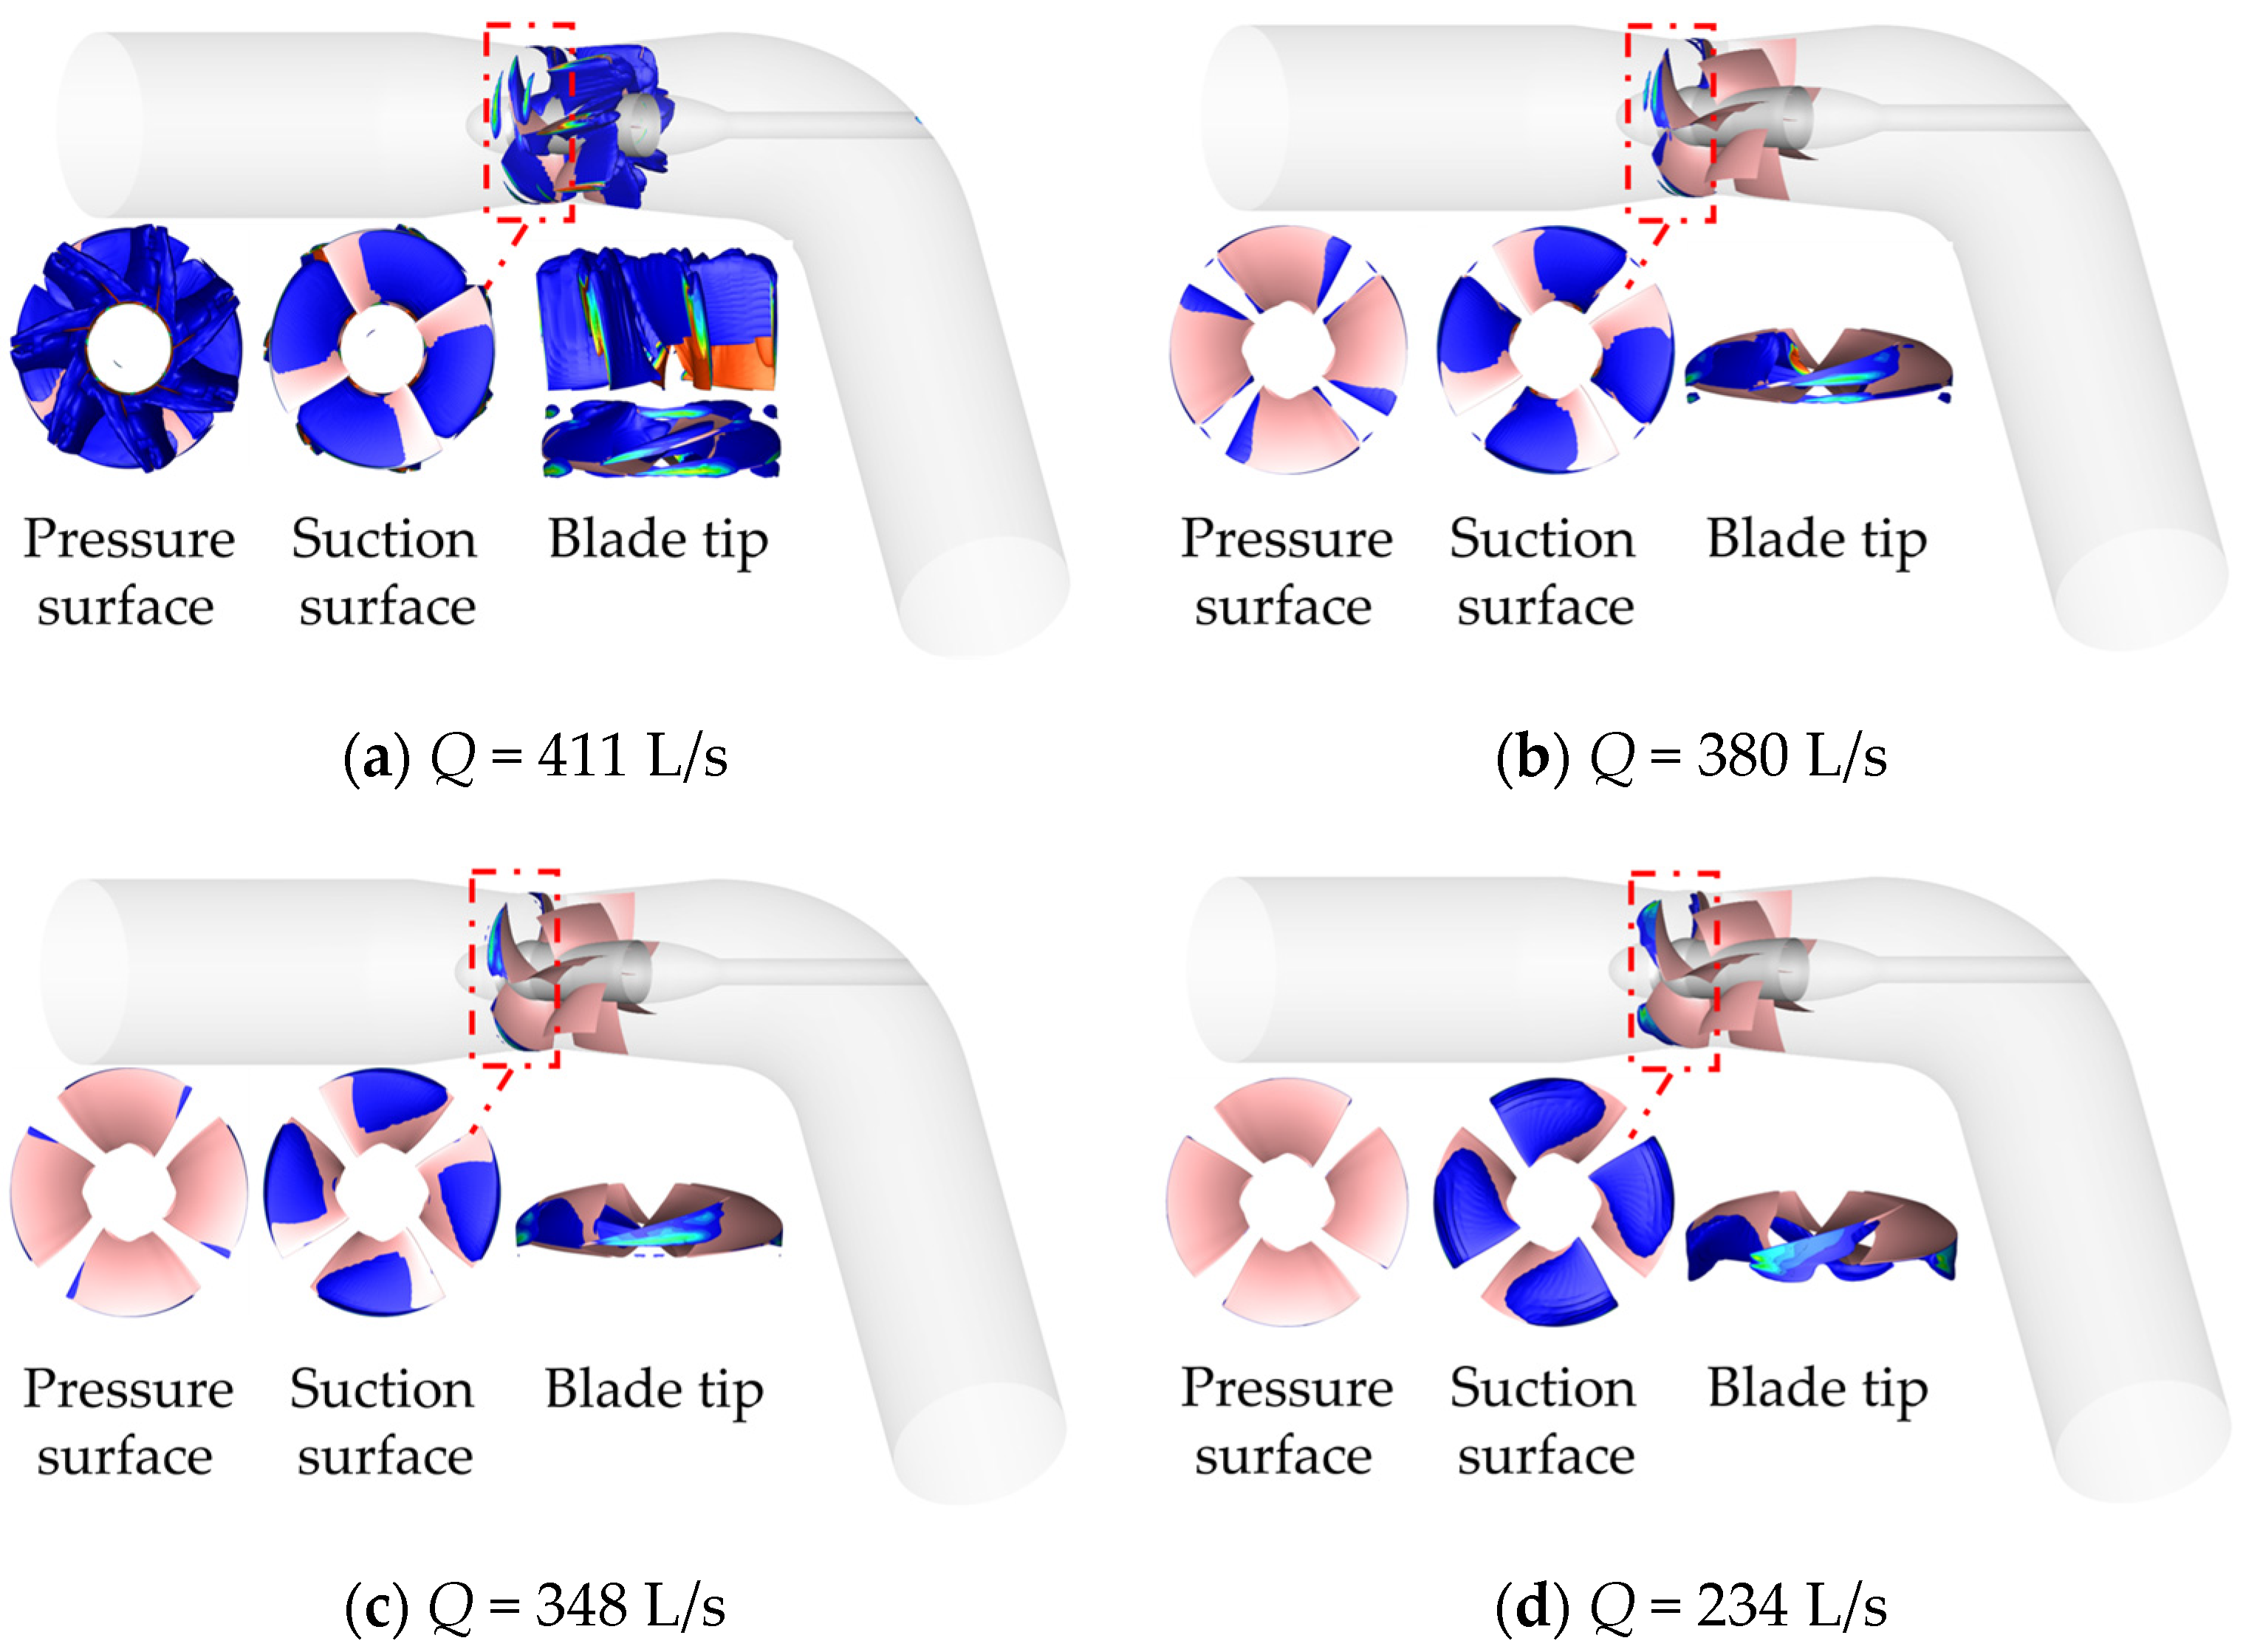
The inlet pressure pin = 4 × 10⁴ Pa, compared with the inlet pressure pin = 5 × 10⁴ Pa, shows the same law of changing with the working condition. The area of air bubbles further increases with the decrease in inlet pressure (from pin = 5 × 10⁴ Pa to pin = 4 × 10⁴ Pa) in the same working condition, and the pressure surface, suction surface, guide vane blade, and outlet bend are basically full of air bubbles under the high flow condition (Q = 411 L/s). At the design condition (Q = 348 L/s), the air bubbles existing at the suction surface basically wrap 4/5 of the blade surface. The cavitation at the top of the blade under each working condition (Q = 234–411 L/s) is more obvious.
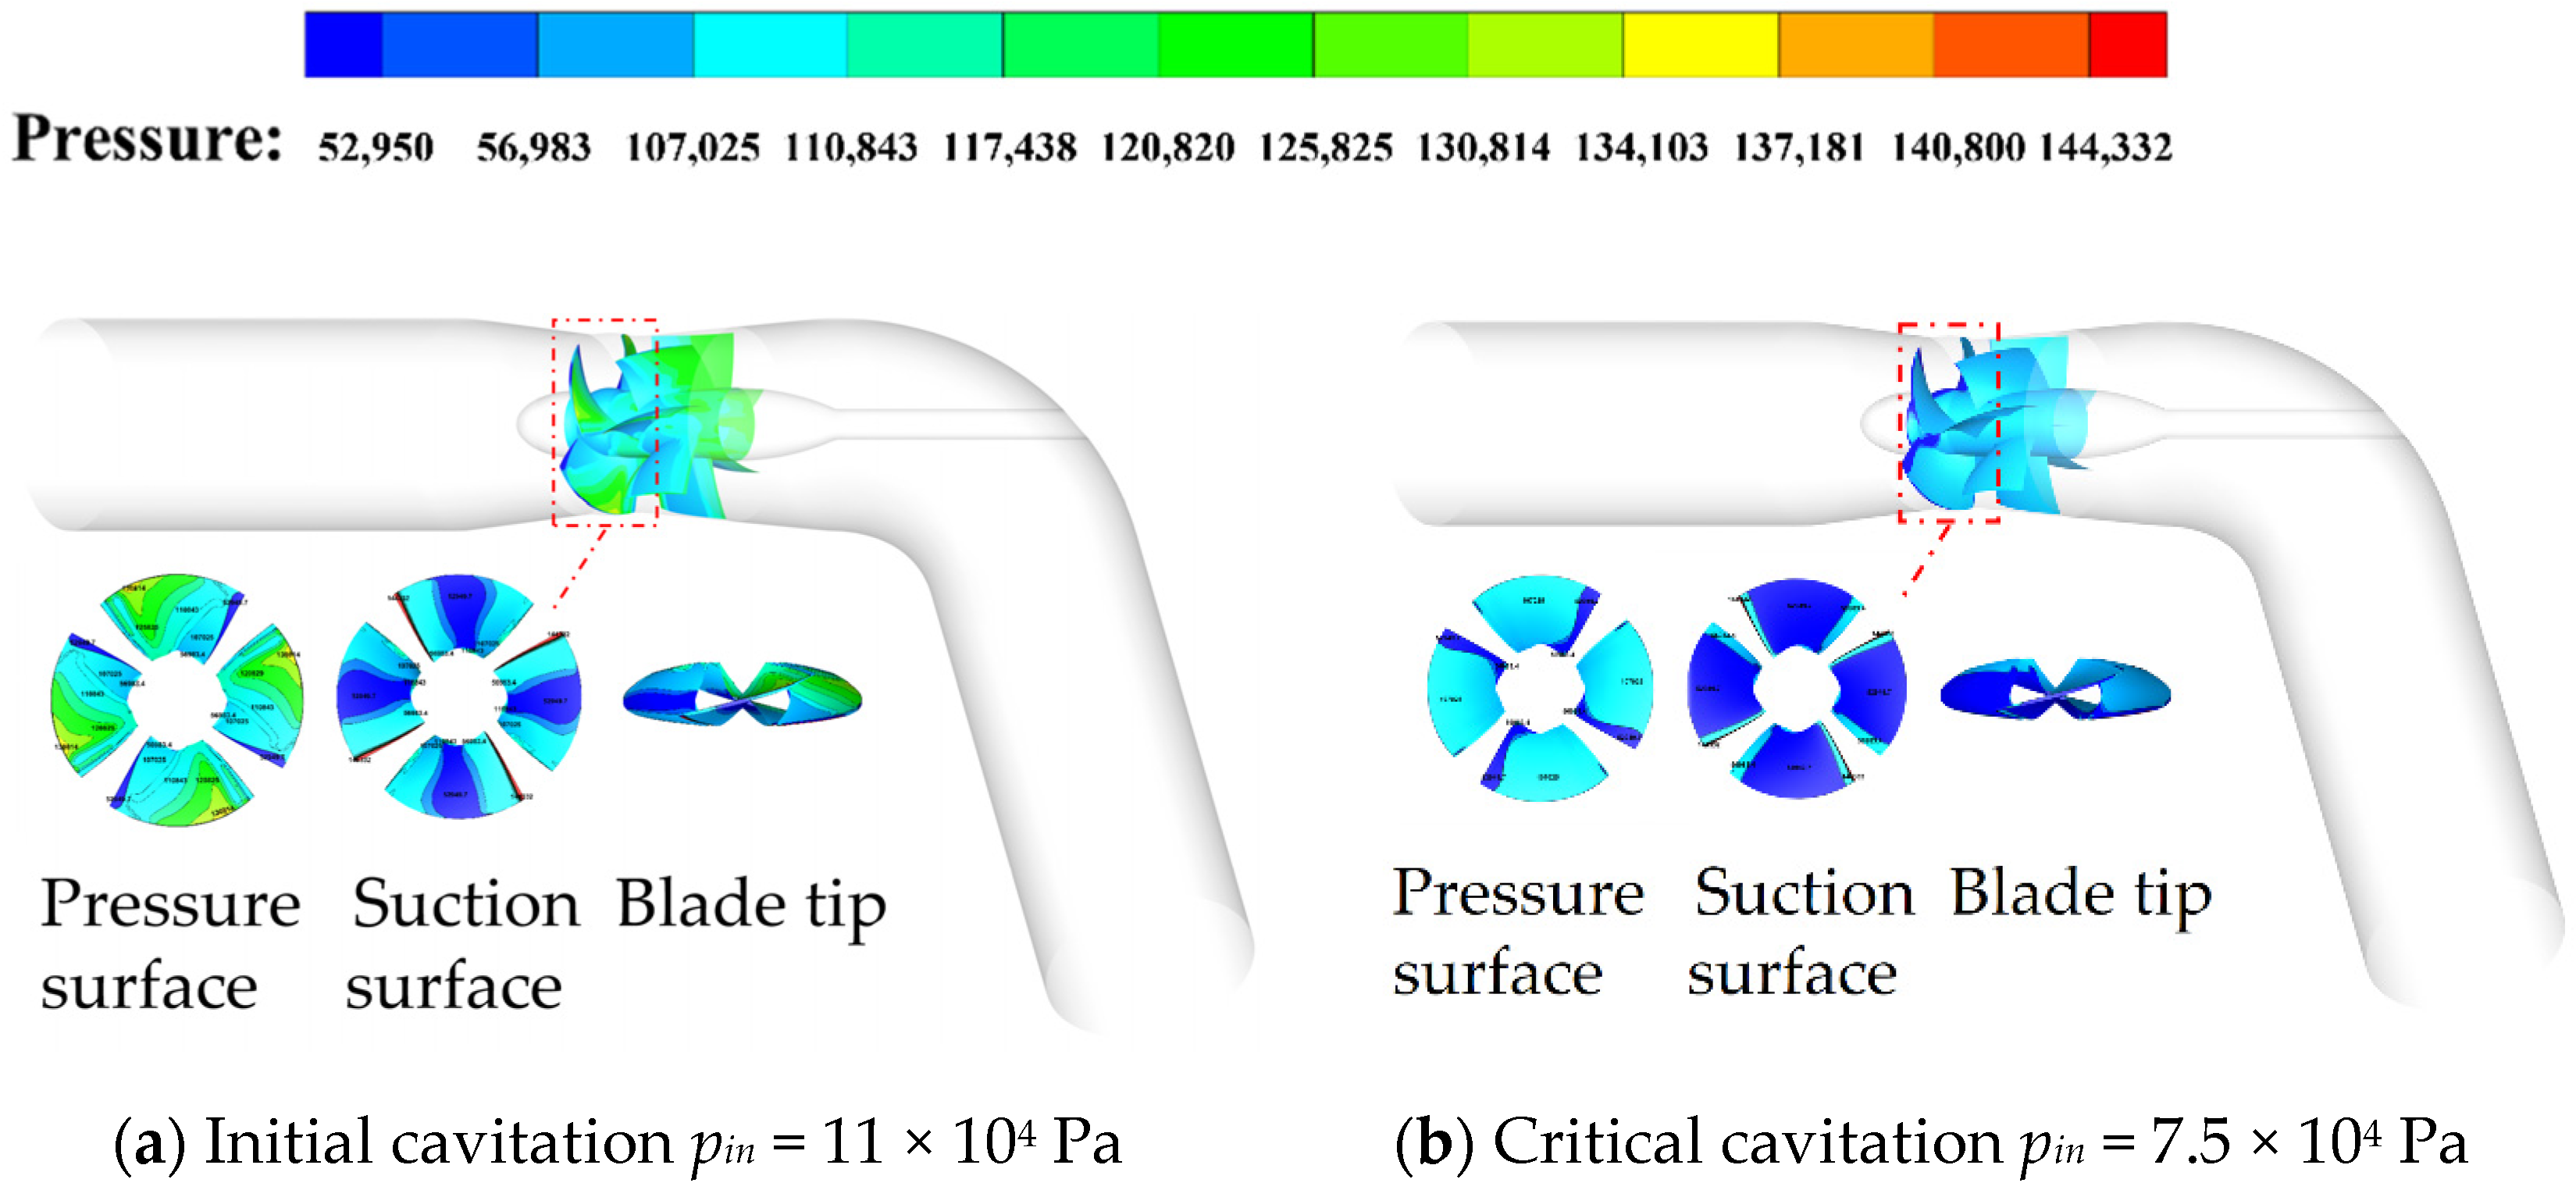
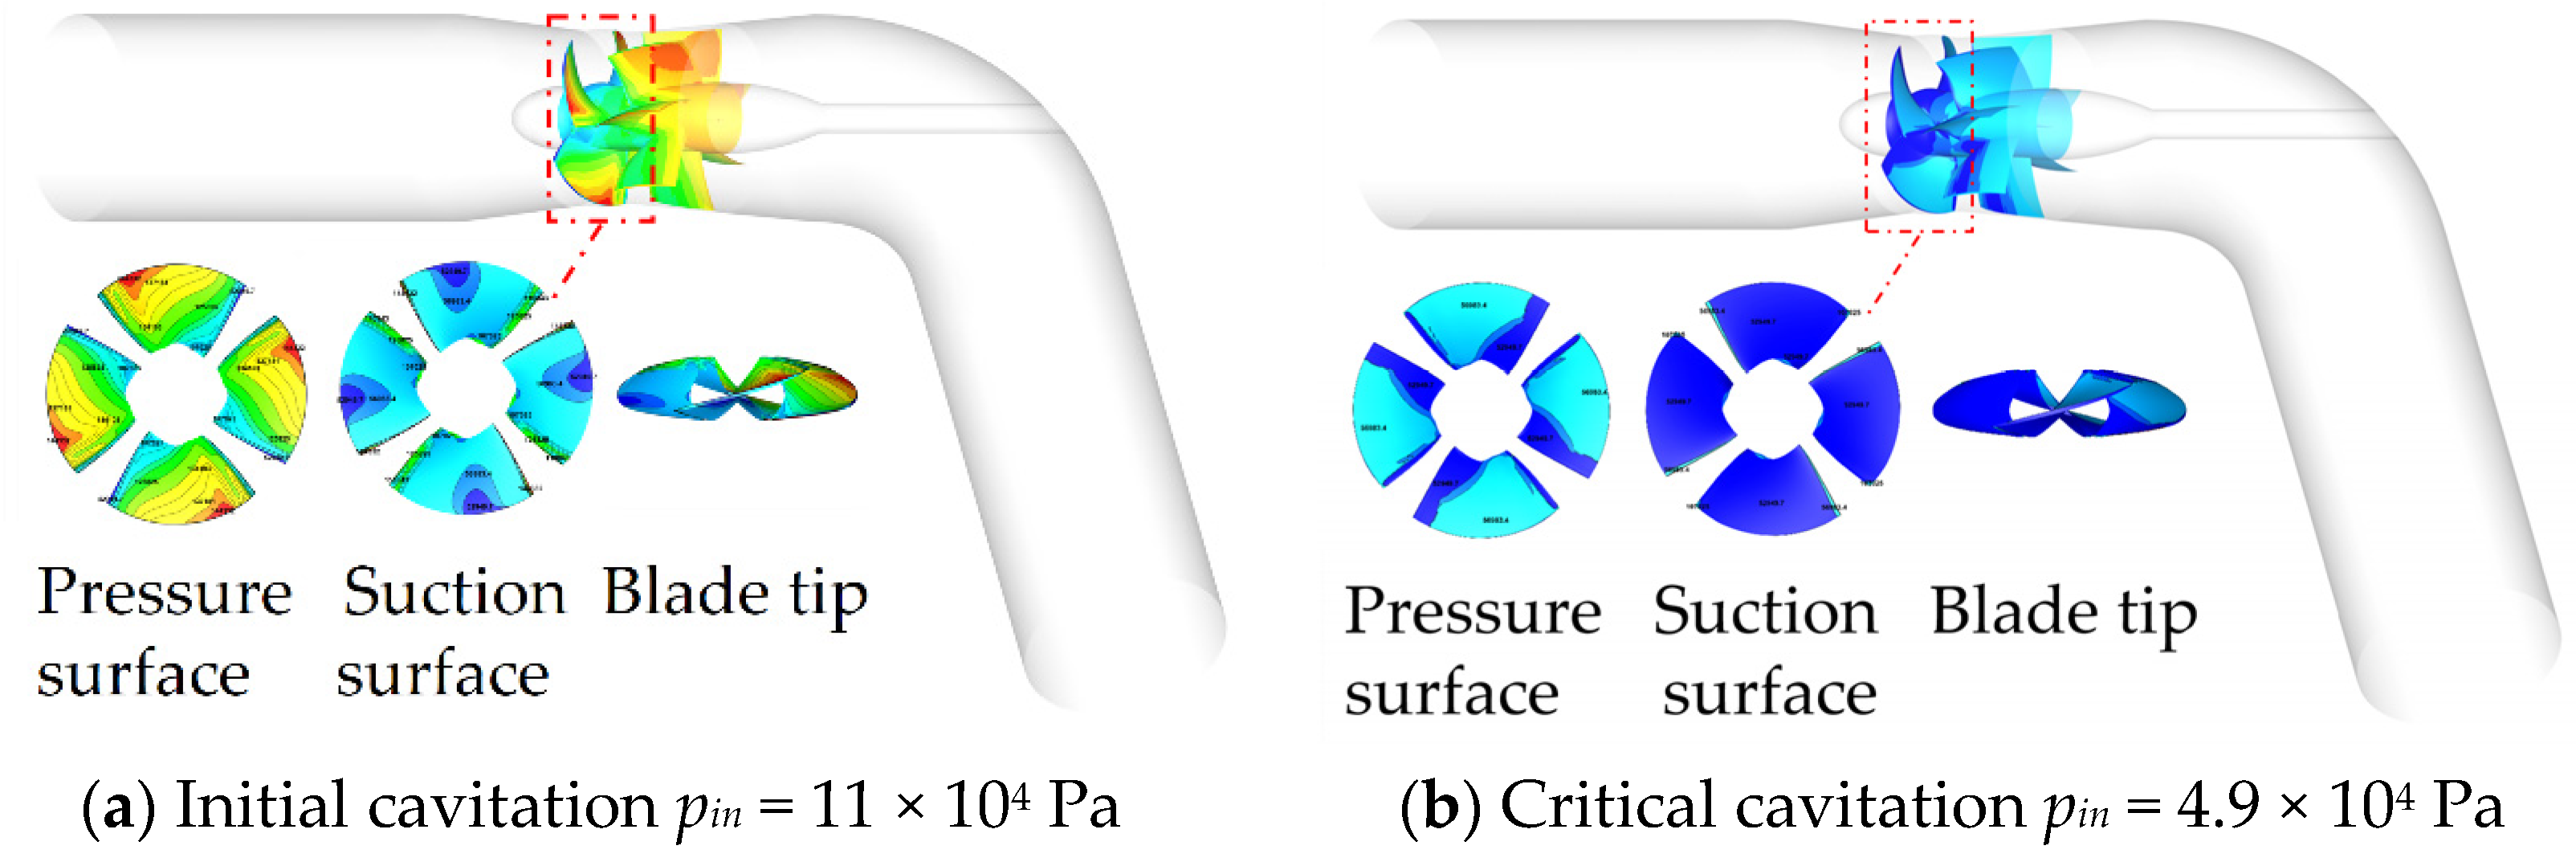
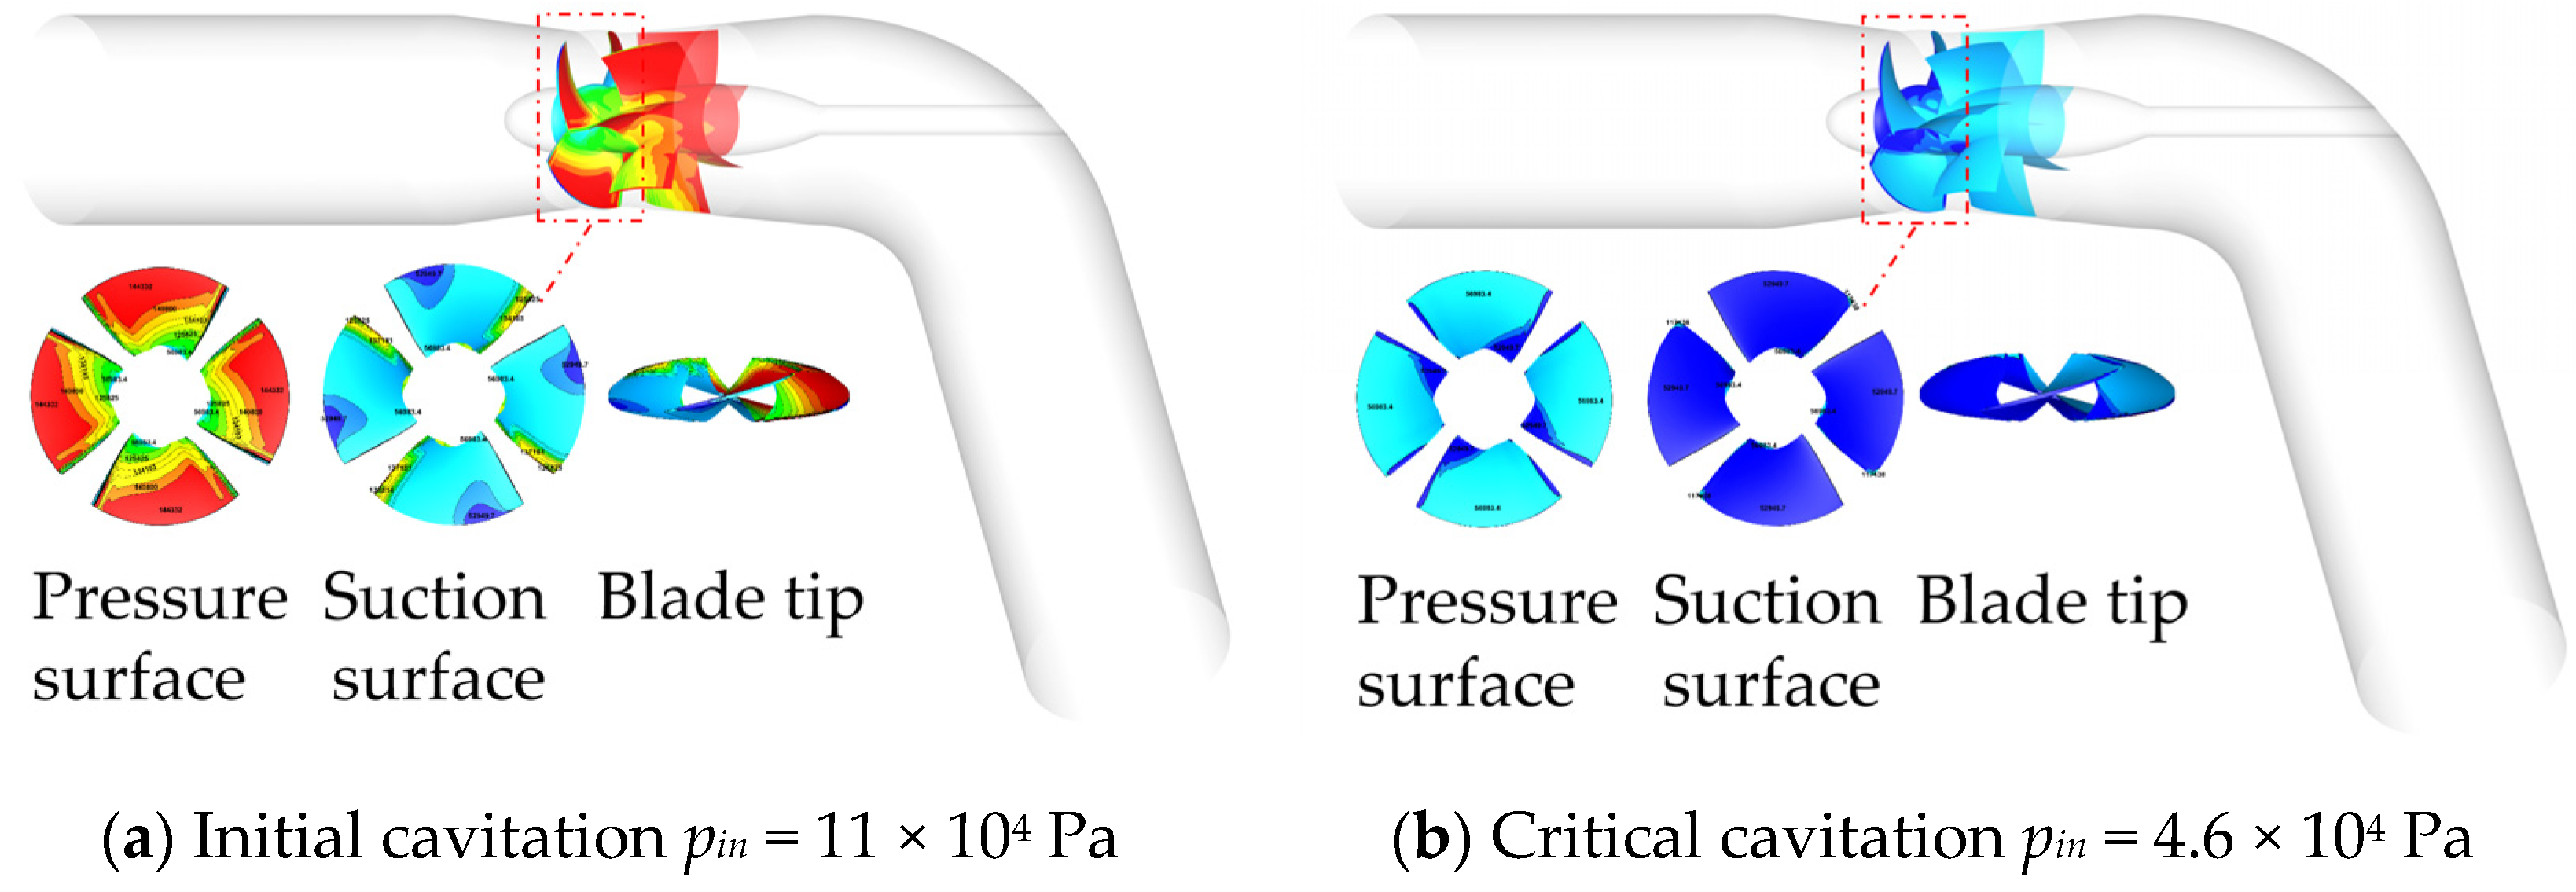
Through the comparative analysis of the pressure distribution cloud pictures at the suction surface, pressure surface, and blade tip in the same cavitation state under different flow conditions, it can be concluded that in the incipient cavitation state, with the increase in flow (Q = 234–411 L/s), the pressure on the surface gradually decreases, showing a gradient change from the hub to the rim, and the low-pressure area at the blade head gradually increases. The area of low pressure at the suction surface and the rim decreases first and then increases, the low-pressure area is then distributed at the blade head and the low-pressure area of the suction surface is distributed in a belt shape under the large flow condition (Q = 411 L/s) and in the small flow condition (Q = 234 L/s), the low-pressure area of the suction surface is distributed in a block shape near the design condition (Q = 348–380 L/s). In the critical cavitation state, with the increase in the flow (Q = 234–411 L/s), the low-pressure area on the pressure surface increases first and then decreases; the area of low pressure on the suction surface is smaller under the design condition and the small flow condition (Q = 234–348 L/s) and the area of low-pressure on the suction surface also increases first and then decreases. The low-pressure area is slightly smaller under the large flow condition (Q = 411 L/s) and the small flow condition (Q = 234 L/s), but the low-pressure area on the suction surface is also filled with more than 1/2 of the blade. This is mainly because when critical cavitation occurs, the inlet pressure under the large flow condition and small flow condition is large, while near the design condition (Q = 348–380 L/s), the cavitation performance is good, and the inlet pressure is small when cavitation occurs.
Through the comparative analysis of the pressure distribution clouds at the suction surface, pressure surface, and blade tip under different cavitation conditions under the same flow conditions, it can be concluded that the pressure at the pressure surface, suction surface, and blade tip during critical cavitation is less than that at the incipient cavitation. Near the large flow and design conditions (Q = 348–411 L/s), the low-pressure area at the blade head under critical cavitation is significantly larger than that under incipient cavitation. Under the small flow condition (Q = 234 L/s), the low-pressure area of the blade head does not increase significantly. Low pressure is the main inducing factor of cavitation, and the location of a low-pressure area can reflect the location and development of cavitation to a certain extent.
6. Conclusions
The numerical calculation and experimental analysis of the cavitation performance of the axial flow pump led to the following conclusions:
(1) In this paper, the numerical calculation of energy and cavitation performance of a high ratio speed axial flow pump based on the SST k-ω turbulence model and ZGB cavitation model is compared with the experimental analysis, the basic error of the head is within 0.2 m, the basic error range of efficiency is within 3%, and the error of critical cavitation margin is about 5%. Additionally, the numerical calculation trend is the same as the experimental, and, in general, the numerical calculation is better and more accurate at predicting the energy and cavitation performance of the axial flow pump.
(2) In the numerical simulation and experimental flow rate of about 350 L/s, the head is about 5.5 m and the efficiency is about 84.0%. The efficiency near the design point flow rate is high and the efficiency range in the high-efficiency zone is wide, which shows the reasonableness of the design. The maximum operating head is Hm = 8.80 m, which is 1.58 times the design head, giving the pump a wide operating range.
(3) In the test, the critical cavitation margin is 7.5 m and 4.9 m for the high flow conditions, Q = 411 L/s and 380 L/s, respectively, 4.6 m for Q = 348 L/s near the design condition, and 9.5 m for the low flow condition, Q = 234 L/s. In the numerical calculation, the critical cavitation margin is 7.1 m, 5.7 m, 4.6 m, and 9.5 m for Q = 411 L/s, 380 L/s, 348 L/s, and 234 L/s, respectively, and the error of critical cavitation margin is −0.4 m, 0.8 m, 0.0 m, and 0.0 m for each condition from high flow rate to low flow rate in numerical calculations and testing. The numerical calculations and experimental results follow the same trend with small errors. The NPSHre is less than 5.5 m at the design condition (Q = 348 L/s), and the numerical calculation and test result of NPSHre are 4.6 m, which meets the design requirement of cavitation. Both the numerical calculations and tests show that as the flow rate increases, the critical cavitation margin decreases first, and near the high-efficiency zone, the critical cavitation margin is minimal and continues to increase as the flow rate increases. The cavitation performance and energy of the high-ratio axial flow pump studied in this paper are excellent, which can provide a reference for the design and development of high-ratio axial flow pumps and the research of cavitation performance.
(4) According to the analysis of the numerical calculation results, with the same inlet pressure and with the reduction in flow, the first air bubbles appear in the head of the pressure surface of the large flow conditions, the pressure surface of the small flow conditions no longer have air bubbles, and air bubbles appear in the head of the suction surface. As the inlet pressure decreases, the air bubbles at the same flow rate gradually increased until there was violent cavitation, the air bubbles filled the impeller and guide vane area, and even at the outlet elbow there was a large number of air bubbles; the air bubbles moved downstream with the water flow.
7. Suggestions
This paper’s numerical calculations and test results of the critical cavitation margin are consistent with the trend derived from previous studies. The critical cavitation margin showed the best cavitation performance near the design conditions, non-design conditions are slightly worse, and the birth location of the vacuole is also similar, but the distribution of the vacuole in this paper has been fully explored and reveals its movement and change of form. This paper’s numerical calculations and test comparison have a high degree of agreement, revealing the spatial distribution characteristics of the vacuole inside the high ratio speed axial flow pump. The cavitation performance and energy performance of the axial flow pump are two contradictory quantities. The energy and cavitation characteristics of the high ratio speed axial flow pump studied in this paper are excellent, which can provide a certain basis for the development and design of the high ratio speed axial flow pump and provide a reference for the study of the cavitation mechanism of the high ratio speed axial flow pump. In the future, the authors will need to further investigate the cavitation characteristics of the axial flow pump based on acoustic analysis, time domain, and frequency domain vibration analysis, and carry out the structural optimization of the axial flow pump in the hope of further improving its cavitation performance.
