
Impact of Piping Erosion Process on the Temporal–Spatial Mechanisms of Soil
School of Civil Engineering, Southeast University, Nanjing 210096, China
Water 2022, 14(18), 2841; https://doi.org/10.3390/w14182841
Submission received: 20 July 2022
/
Revised: 9 September 2022
/
Accepted: 10 September 2022
/
Published: 12 September 2022
(This article belongs to the Special Issue Rainfall and Water Flow-Induced Soil Erosion)
Abstract
:Earthen dams with greater fines are more susceptible to failure from the piping. This study employed the coupled computational fluid dynamics (CFD)-discrete element method (DEM) to investigate the impact of the piping erosion process. Results displayed that increasing the fine contents would reduce the particle velocity and drag force for enhancing the erosion resistance. Piping would reduce the stability of the structure at different positions of the sample with various fine contents. The representative volume elements (RVE) were selected to observe the local geometry and material behavior as the erosion progressed. Severe water flows significantly reduced the peak shear strength of the eroded soils for the interactive-underfilled soil, particularly for the downstream side. However, the interactive-overfilled specimen reduced the peak shear strength on the upstream side. Results indicated that the proposed weighted clustering coefficient is a better index to capture the shear strength of the eroded soil matrix, with a high magnitude corresponding to a high peak shear strength. Different local material behavior may lead to differential settlements and associated catastrophic consequences during the piping erosion process, which should draw special attention.
1. Introduction
In nature, the hydraulic head may vary slowly or rapidly during rainfall or human activities. The change in the hydraulic gradient can trigger the detachment of particles inside porous materials, which refers to the internal erosion phenomenon. Sterpi [1] stated that the effect of gradual erosion and transport of fine particles due to a severe seepage flow could not be ignored when working in an urban area, which is one of the most common reasons for failure in dams, roads, and railways. The water-retaining structures such as dikes and dam embankments are typically constructed on complex foundations, which should draw attention to the internal erosion.
Foster et al. [2] summarized the incidents of dam failure taken from the International Commission on Large Dams (ICOLD) and found that 46% occurred due to piping through the embankment. Terzaghi [3] first performed experiments on heave-type piping failure around a sheet pile wall and proposed a safety factor formula against the hydraulic heave phenomenon. The heave phenomenon is a special case of the piping phenomenon, which occurs when the hydraulic gradient is high enough to vanish the effective mean stress. Generally, it is accepted that the onset of the piping phenomenon is highly dependent on the ratio of finer fraction and the particle size distribution [4,5,6,7]. Sato and Kuwano [8] and Xie et al. [9] observed that clay fractions preferentially migrate, resulting in a great amount of finer fractions of the eroded soil.
It is noticed that the detachment of soil particles affects both the micro and macro-structural behavior of soil [10]. Numerous works have been reported on the mechanical behavior of eroded specimens under different stress paths with the development of the experimental apparatus [7,11,12,13]. Wang et al. [14] employed a developed stress-controlled apparatus with a cut-off wall to observe the internal erosion and found the higher deviatoric stress would produce a dilatant behavior for loosening the soil sample with the phenomenon that occurred at a lower hydraulic gradient. Xiao and Shwiyhat [15] performed the undrained monotonic compression tests on internally eroded soils. They proposed that the suffusional soil would induce a higher peak deviatoric stress than the results of the soil without suffusion. Ke and Takahashi [11] found that loss of fines in the soil matrix results in a contractive volumetric strain. They proposed that the suffusion phenomenon would reduce the soil strength at the major stage of drained shearing from the monotonic compression test. Ke and Takahashi [13] found that soil-drained strength decreases after suffusion under the successive drained monotonic compression test and results in a temporary drop in stiffness at the initial stage of shearing.
In recent decades, numerical simulation has become one of the commonly used approaches to understanding the mechanisms of internal erosion. Cundall and Strack [16] first developed the discrete element method (DEM) to model granular materials’ behavior with the geometrical shape. Adopting DEM, Scholtes et al. [17] proposed an approach for progressive removing of the finest particles from a soil matrix while the sample was maintained under constant stresses. The concept could be used to simulate the process of internal erosion and investigate the impact on the soil properties at the microscopic scale [18,19]. Hicher [20] found that eroded soil masses could develop instability at a shear stress level lower than the critical state failure line. Hama et al. [21] studied the instability of granular materials after suffusion using the three-dimensional Particle Flow Code (PFC3D) software. They found that erosion alters the material behavior from dilatancy to contractility. Chen et al. [22] observed similar results and proposed that the soil matrix would produce a lower peak and critical friction angle with the loss of fine particles.
The reported works mainly examined the soil strength by removing particles. However, Aboul Hosn et al. [23] found that the soil matrix would maintain the same probability density of contact forces and mechanical coordination number as non-eroded soil if the inactive particles are removed. They proposed that post-erosion mechanical behavior cannot be described only by an increase in porosity. Moreover, most studies are devoted to the mechanical behavior of post-eroded samples subjected to a downward or upward seepage flow. However, the erosion path would be complex concerning the hydraulic structures like earth dams and embankments, which should be position-dependent and evolve with time. The reported works on the local affected zone in the hydraulic structure are still limited, which is the main cause of differential settlements and associated catastrophic consequences [24]. This study is conducted to fill this gap by investigating the impact of the piping erosion process on the internal heterogeneity of granular systems and examines the mechanical behavior of the eroded soil matrix at different locations of embankments to give some insights into the design of practical infrastructures. The paper is structured as, Section 2 elaborates on the methodology of the numerical software. The temporal–spatial observations of internal erosion on the grain transport and the geometric conditions are given in Section 3. Section 4 presents a discussion of the mechanical behavior of the eroded soil. Finally, we conclude and draw perspectives of this work.
2. Methodology
We adopt the open-sourced CFD-DEM software to perform simulations with multi-phase media. The discrete particles were mimicked by the Large-scale Atomic/Molecular Massively Parallel Simulator (LAMMPS) improved for general granular and granular heat transfer simulations (LIGGGHTS) software [25], and the fluid flow was simulated by the Open Field Operations and Manipulation (OpenFOAM) software [26].
OpenFOAM adopts the finite volume (FV) method to discretize the complex geometries into cells control volumes. The following continuity equation is assumed to hold for satisfying the conservation of mass on each control volume:
where and denote the velocity and porosity of fluid flow, respectively. is the gradient operator.
The motion of fluid flow is governed by the volume-averaged Navier–Stokes equation and solved in conjunction with Equation (1),
where refers to the averaged particle velocity. The stress tensor for the fluid phase is calculated as , in which is the fluid viscosity. denotes the momentum exchange with the particulate phase, which is calculated based on the particle–fluid interaction force for each cell.
For the particulate phase based on Lagrangian modeling, the linear and angular velocities for each particle are computed on the basis of Newton’s second law of motion. The governing equations of translational and rotational motion of a particle with mass and momentum are as follows [25]:
where and are the contact force and torque for the particle with the particle or the boundary. and refer to the particle–fluid interaction force and the gravitational force acting on particle , respectively. Details of the definitions of two-phases fluid, solvers for the simulations, and the coupling procedures can be found in Xiao and Wang [27] and Xiao [28].
3. Observations of Seepage Erosion
The mechanical or chemical action of fluid flow can cause the migration of particles through the coarse soil skeleton, while the continuous erosion and transportation of soil particles along a flow path indicate the phenomenon of piping [29]. This paper mainly concerns the influence of fine contents on the behavior of primary fabric and the development of piping erosion.
3.1. Material Properties
The materials are simulated as a mixture of fine and coarse fractions to simplify the phenomenon, with radii of 0.25 and 1 mm. Three samples are prepared by the fine contents (FC) of 30%, 40%, and 60%, with the information of particles presented in Table 1, which are denoted as FC30, FC40, and FC60, respectively. According to Frias Lopez et al. [30], the specimen of FC30, FC40, and FC60 could be defined as the interactive-underfilled, interactive-overfilled, and overfilled soil skeleton, respectively. Simulations are conducted by the Hertz contact model, with the parameters for the simulations given in Table 2.
3.2. Numerical Model Set-Up
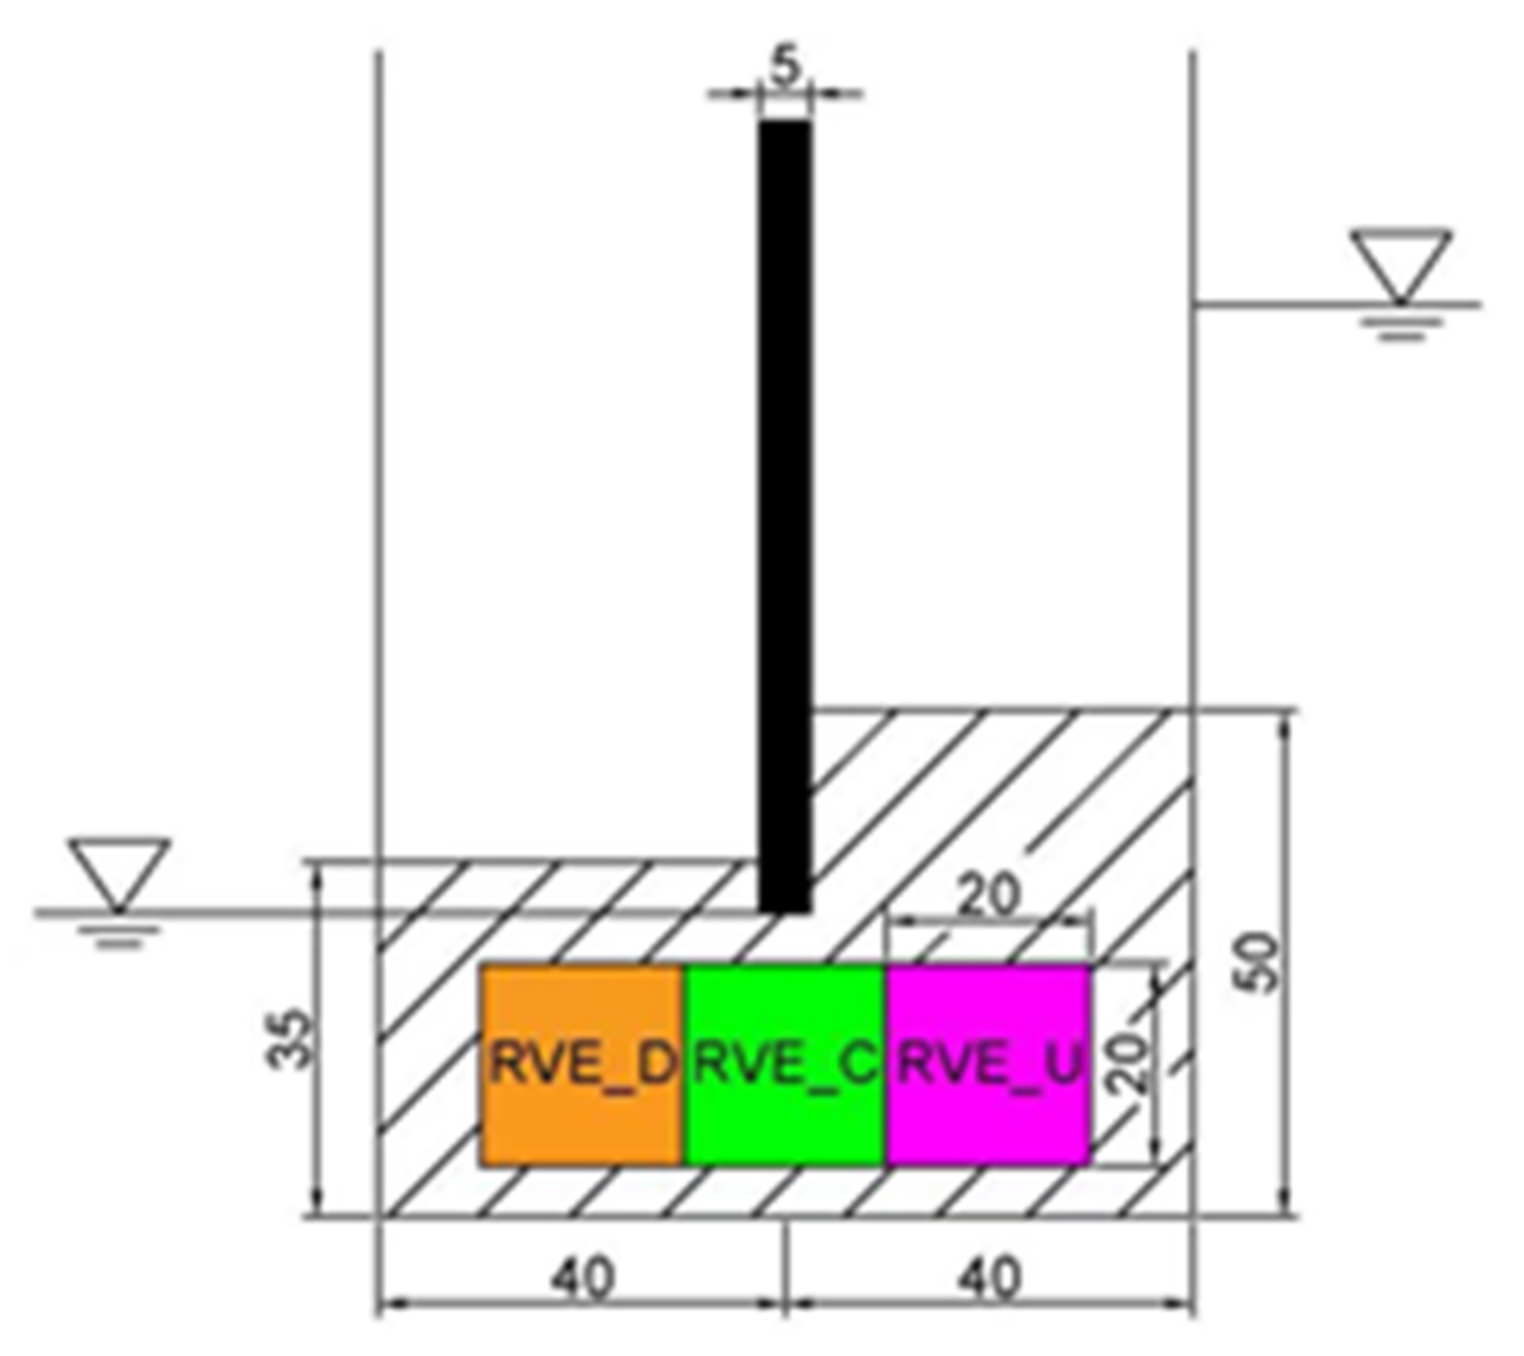
This study prepares samples with particles deposited into the container under the self-gravity condition at an acceleration of 9.81 m/s2. After the system achieves the quasi-static condition, those particles located in the region of the retaining wall are deleted to import the boundary. The wall, with a dimension of 0.08 m in the x-direction, is set in the center of the system at a height above 0.03 m. The heights of deposited layers are 0.035 and 0.05 m for the left and right sides of the boundary, respectively. Then, the sample is submerged into the fluid flow under a saturated condition to conduct the erosion test, which is performed by defining different hydraulic heads on the two sides of the boundary. Based on the work of Xiao and Wang [27], this study examines the erosion process at a high hydraulic gradient. The left and right sides of the wall are determined as the downstream and upstream sides, with the water table set at 0.03 and 0.09 m, respectively. The steps of the coupling interval are set at 100 to reduce the computational effort. Figure 1 displays the initial configuration of the specimen.
3.3. Particle Velocity
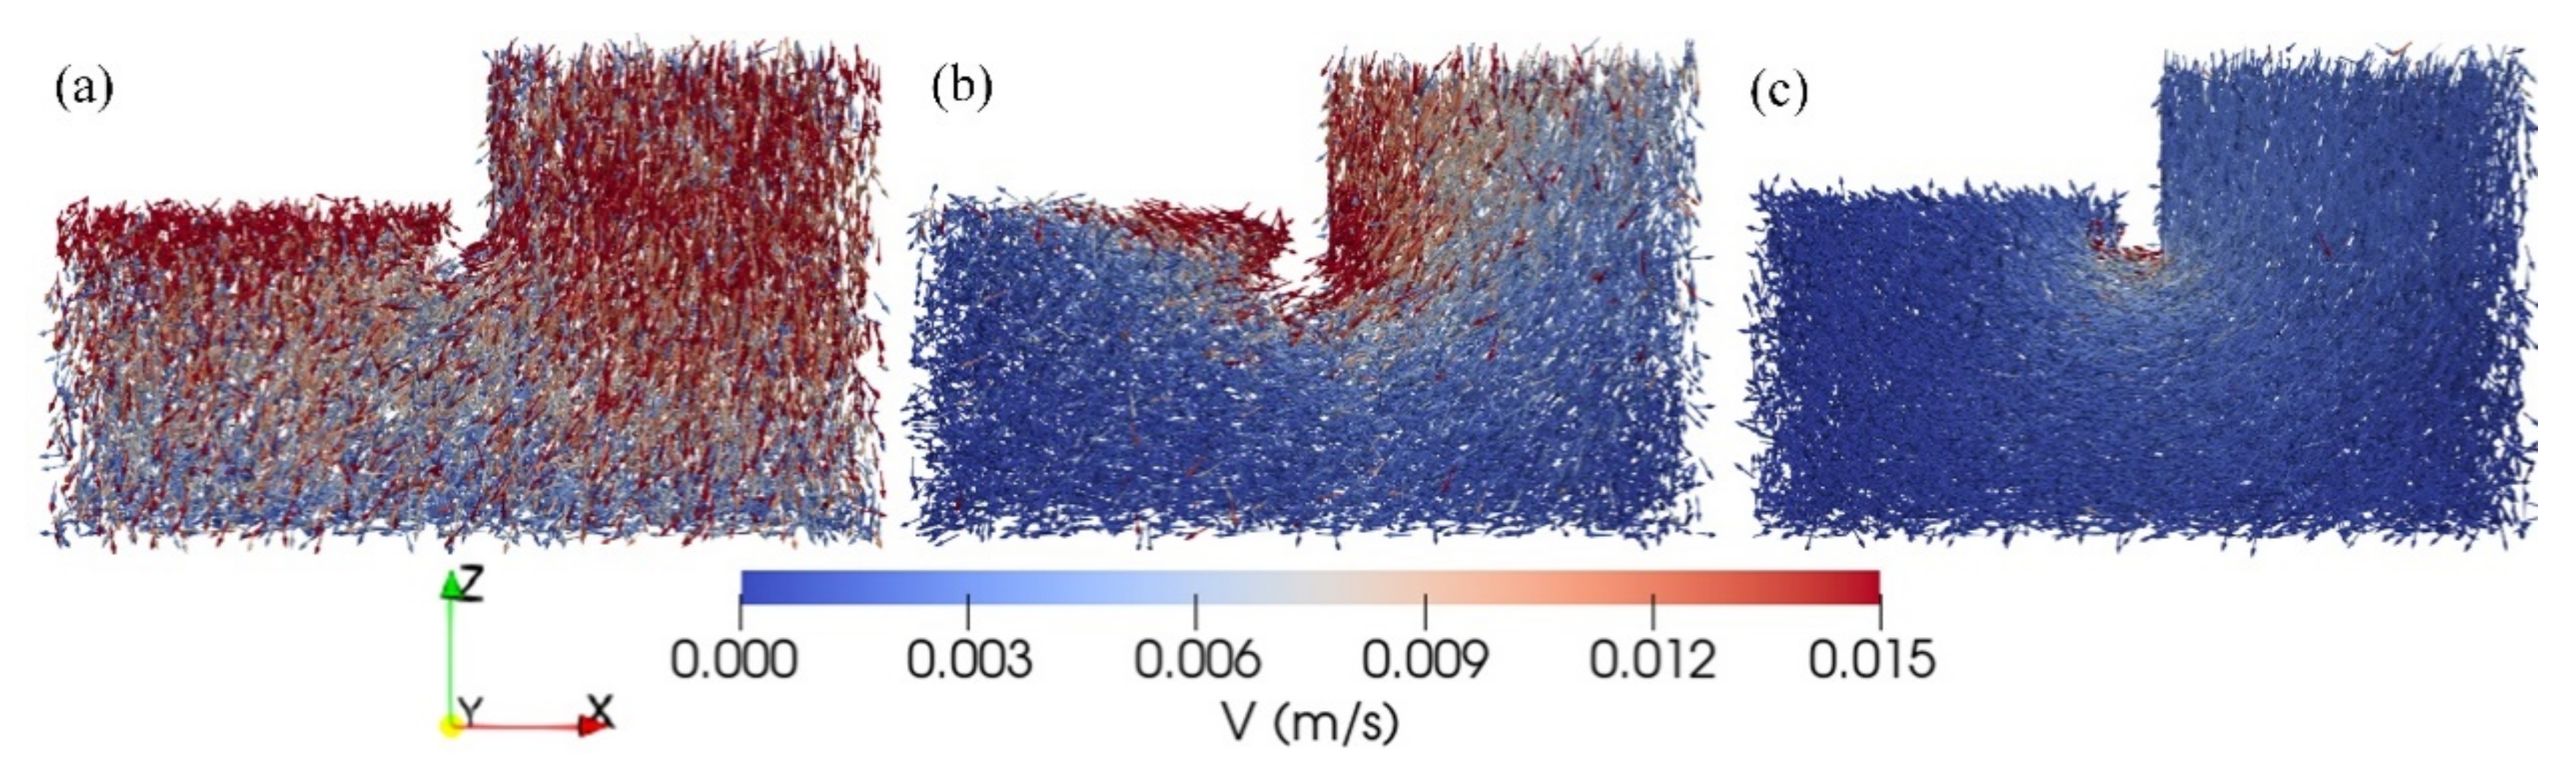
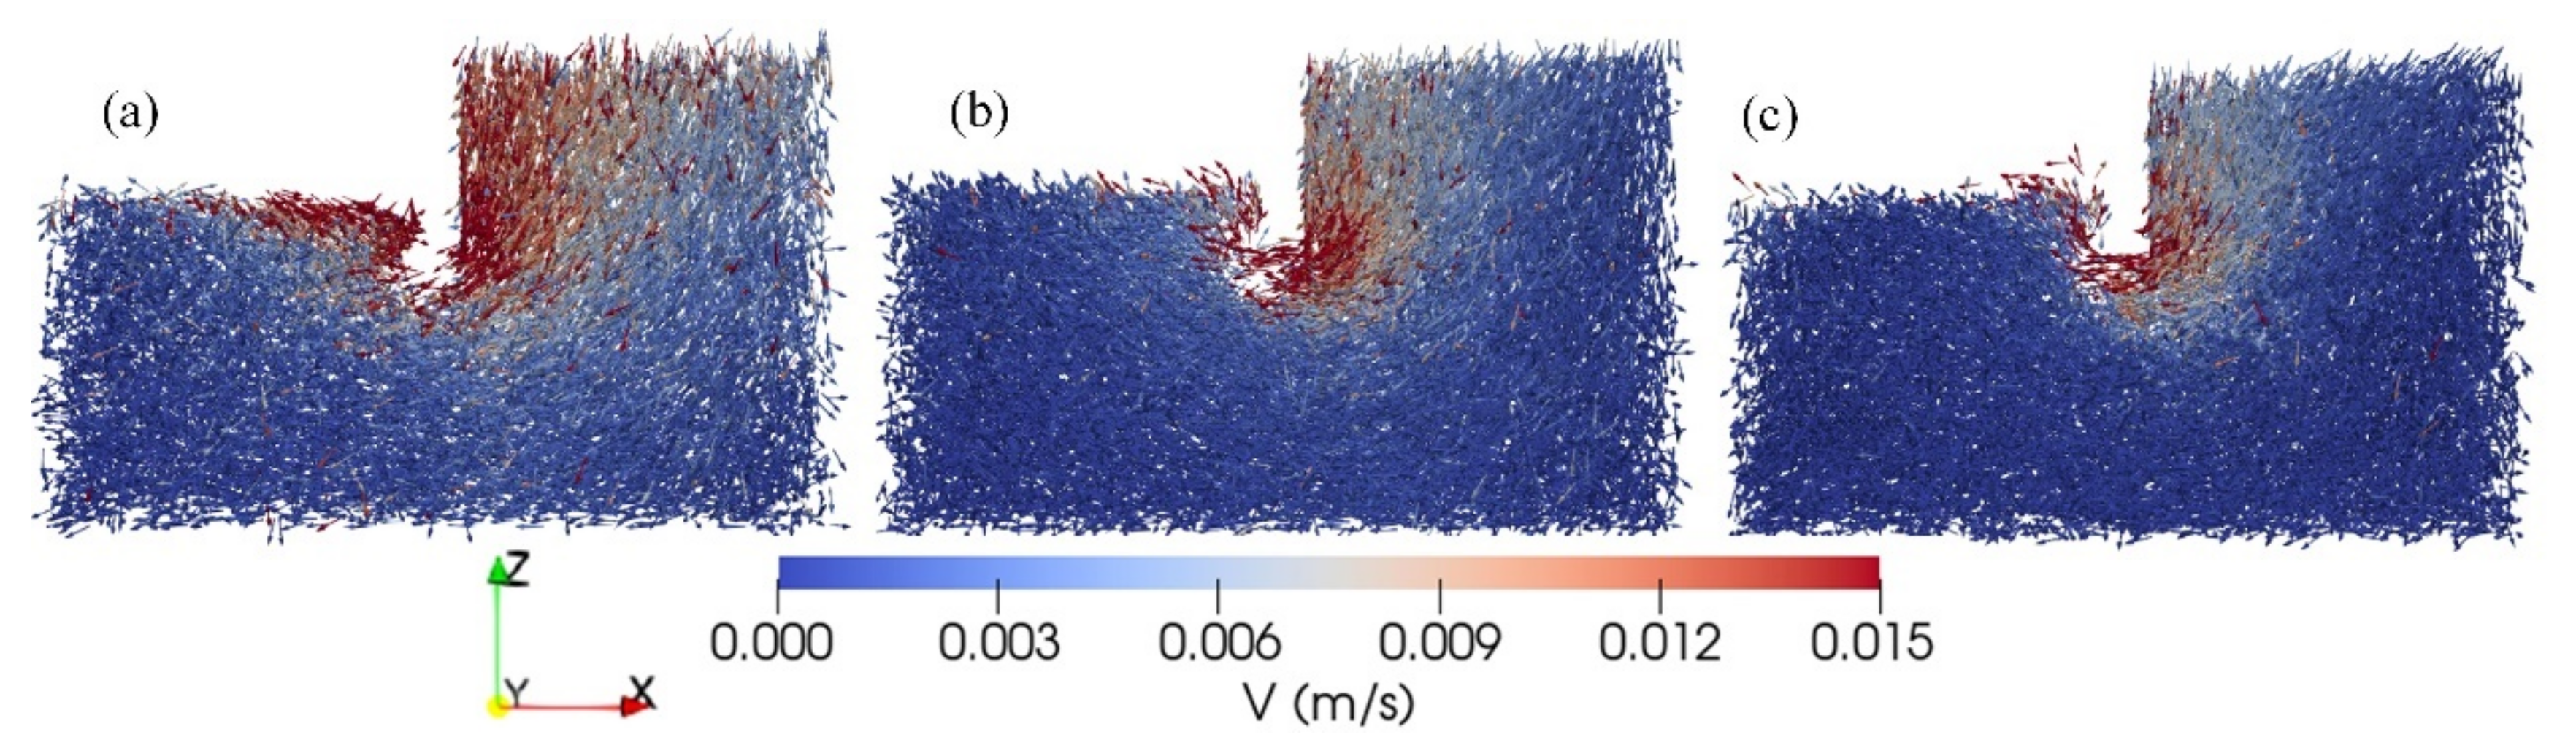
The piping erosion occurs as the water flows through the voids inside the soil skeleton from a high hydraulic head to a low hydraulic head, which results in the agitation of particles. Figure 2 depicts the behavior of particle velocity at t = 0.01 s to observe the fine contents on the influence of the onset of piping erosion. Our results agree with the previous reports that increasing the fine contents would enhance the critical hydraulic gradient of the system [6,31,32,33]. Hence, the specimen FC60 reduced the detachment of particles, with the higher particle velocity only appearing around the retaining wall.
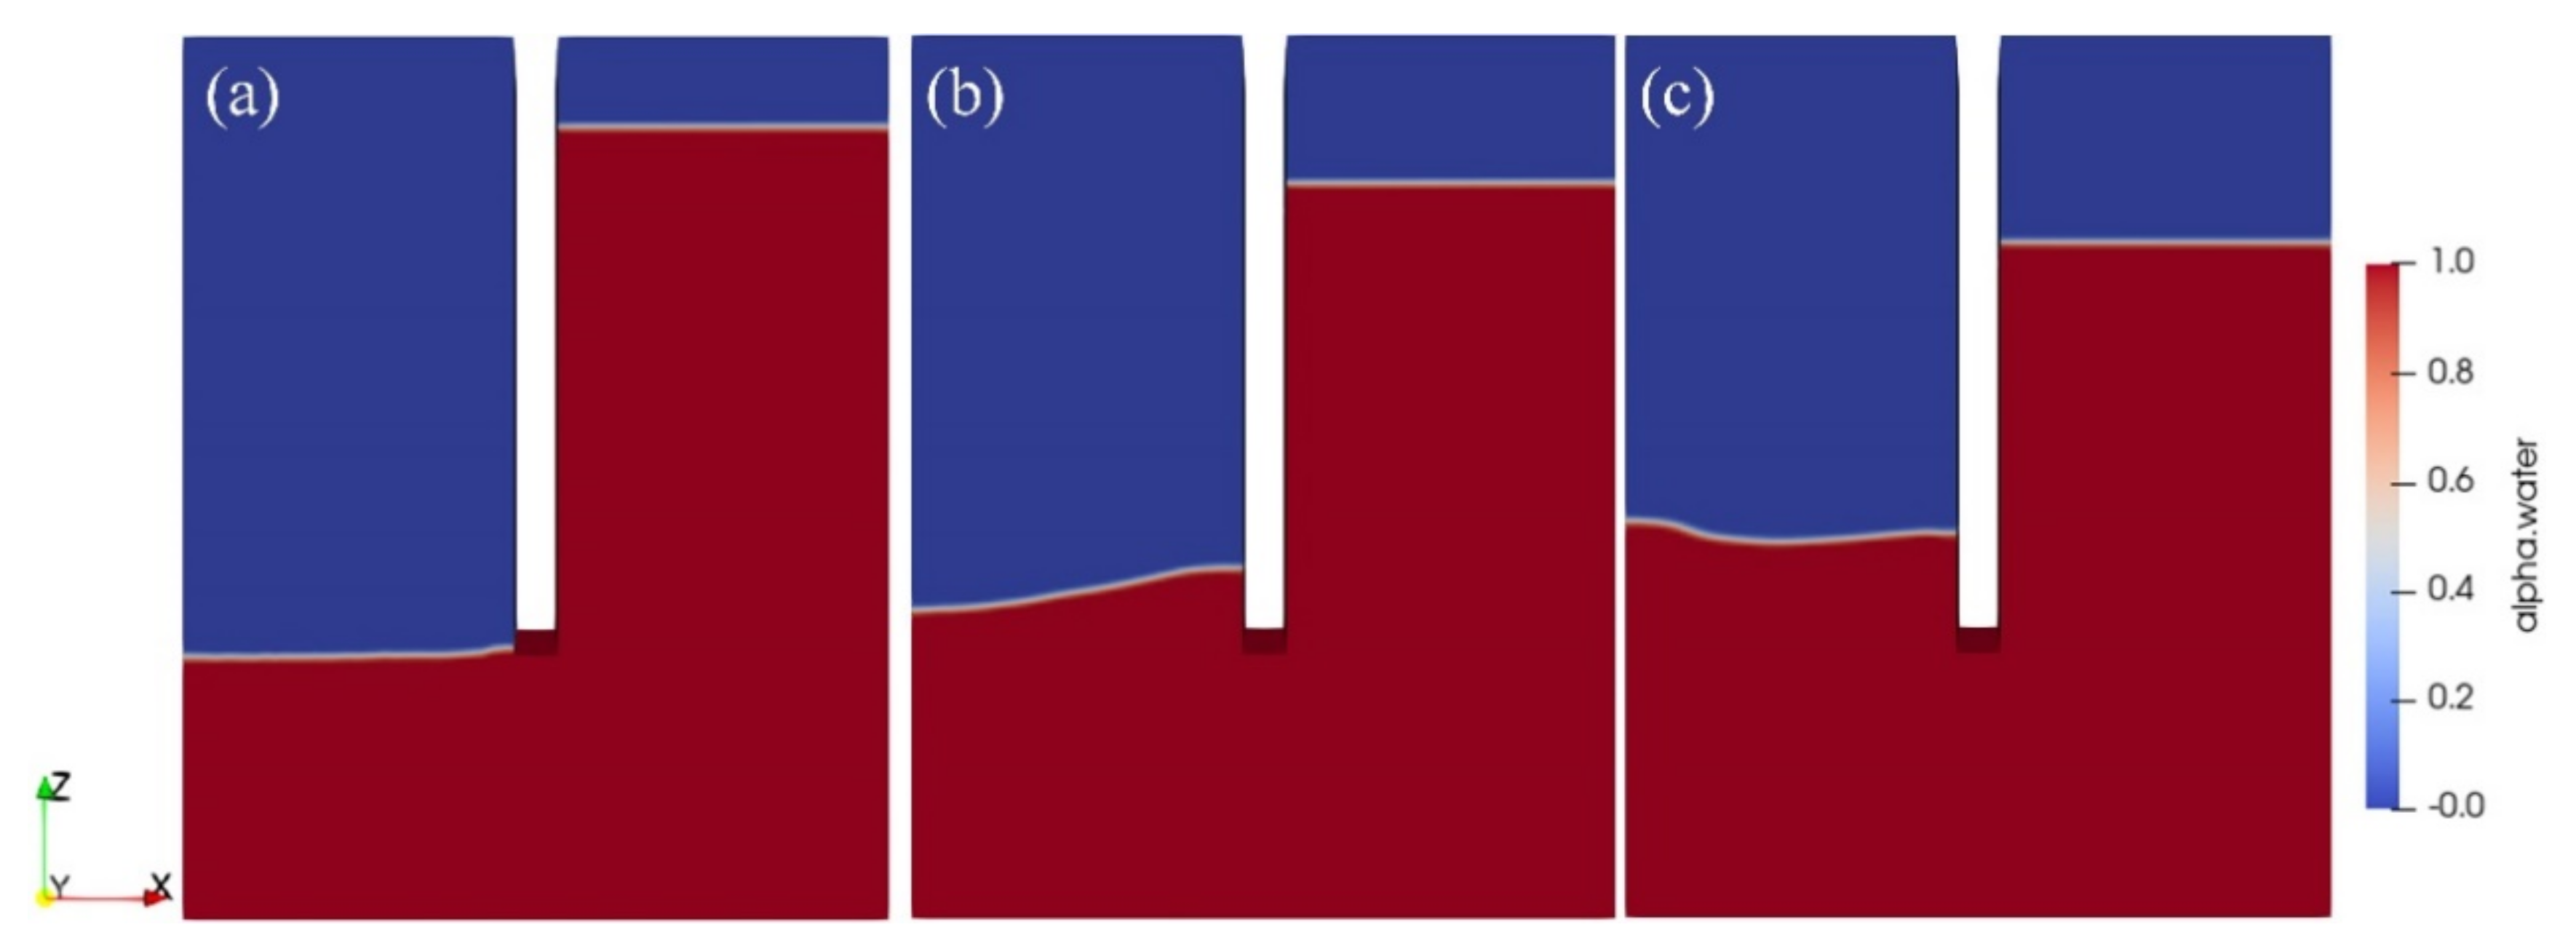
Taking the specimen FC40 as an example, Figure 3 and Figure 4 portray the temporal–spatial distribution of water flow and particle velocity during piping, respectively. In Figure 3, the blue color refers to the air phase and the red color denotes the water phase. It is noticed that the water flows would reduce the hydraulic gradient during the modeling, which thus observes a peak particle velocity at t = 0.01 s in Figure 4.
3.4. Drag Force
Concerning the piping erosion process, the water flows would exert a drag on the soil properties in the direction of its motion. This study concerns the Di Felice drag force as the particle–fluid interaction force, with the expressions as [33]:
in which , . is the volume of a particle, denotes the drag coefficient, estimated as . refers to the Reynolds number with the expression as .
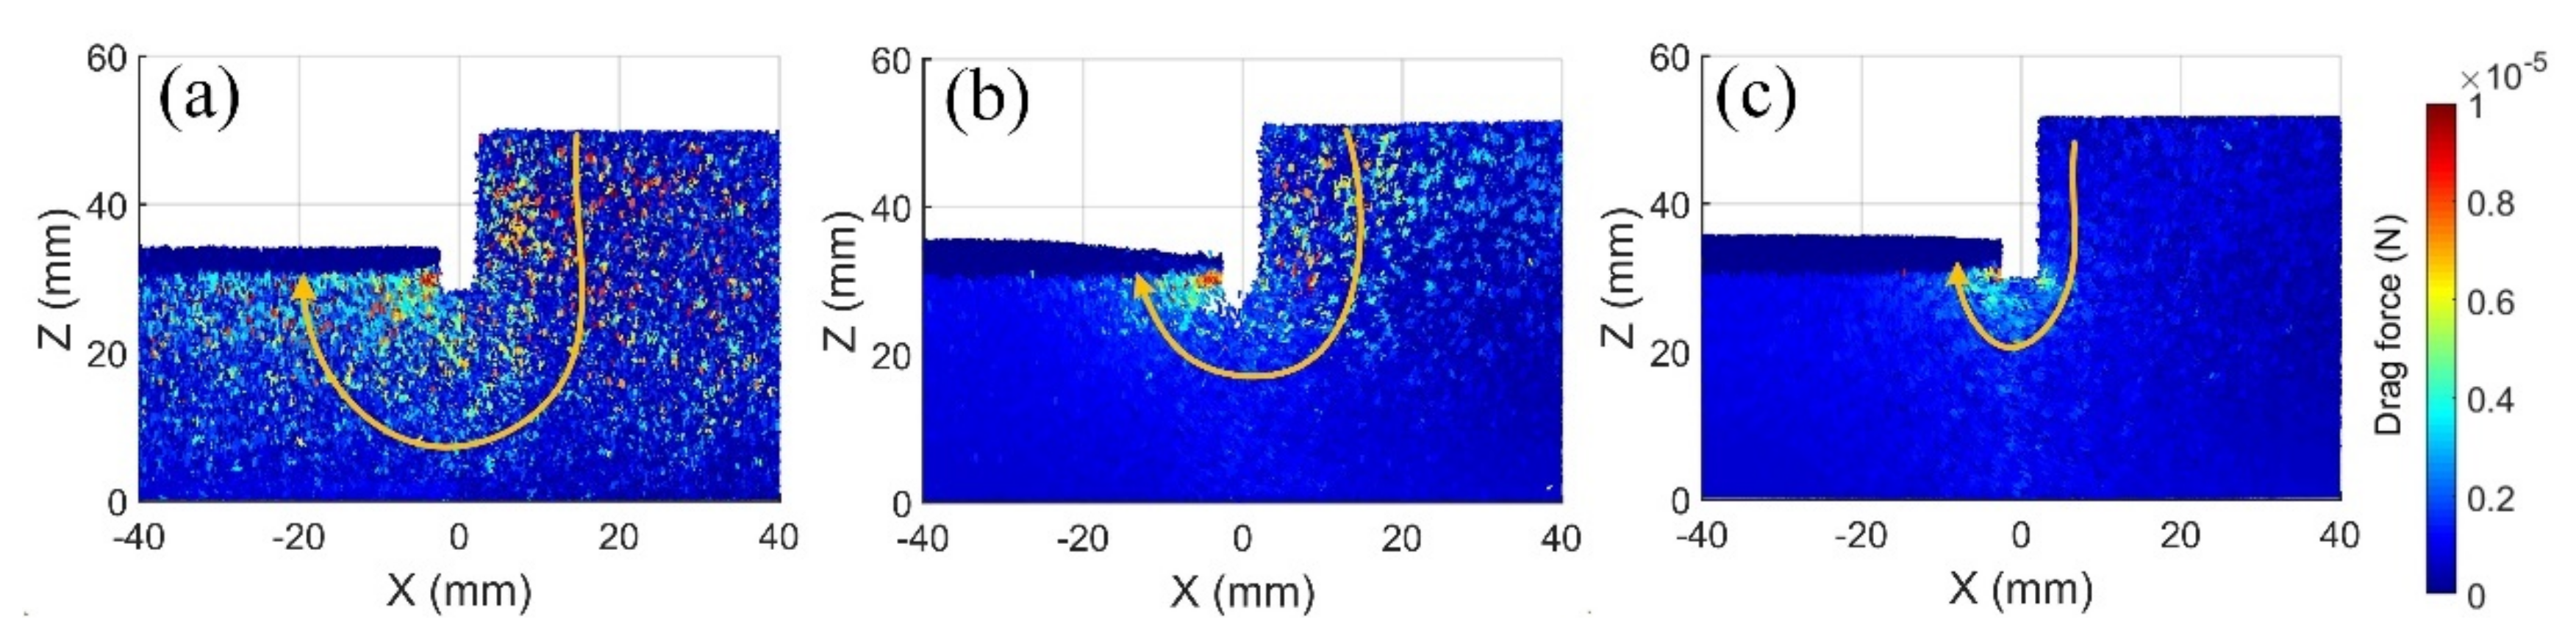
Taking t = 0.01 s as an example, Figure 5 displays the spatial distribution of drag force. It can be seen that the higher drag force is located adjacent to the boundary for each specimen. The yellow line in the graph represents the flow path inside the soil matrix. In an analogy to the behavior of particle velocity, the results indicated that increasing the fine contents would reduce the magnitude of drag force and narrow the flow path. The specimen FC30 produces a wide flow path to the bottom of the system. However, the specimen FC60 only forms the flow path around the retaining wall.
3.5. Local Observations of Piping Erosion
The spatial distribution of particle velocity and drag force implies that the water flow would induce different flow paths and different heterogeneous conditions at different positions, which may influence the soil behavior during piping. Hence, we selected three representative elementary boundaries (RVE) with the size of 0.02 m to observe the characteristics of the local geometry, as shown in Figure 1. The position of elementary boundaries is located in the intermediate foundations to reduce the boundary effect, with the bottom at 0.005 m.
3.5.1. Rattler Contents
It is believed that inactive fine particles (sitting loose in the voids with minor participation in the force chains) are the most vulnerable to suffusion [34]. Hence, rattlers in a state with zero or one contact should be easily eroded during the piping erosion process. Figure 6 depicts the evolution of rattler contents for the three specimens. The water flow would transfer the eroded particles out of the soil skeleton, which reduces the rattler contents during piping for each sample. The specimen FC30 has a lower erosion resistance, which induces a significant change of rattlers and contains the highest proportion at the initial stage. However, the overfilled specimen FC60 enhances the connectivity between particles and involves the lowest number of rattlers, with a higher content appearing in the element RVE_C. The results indicated that the region adjacent to the boundary highly relates to the onset of piping erosion.
3.5.2. Erodible Particles
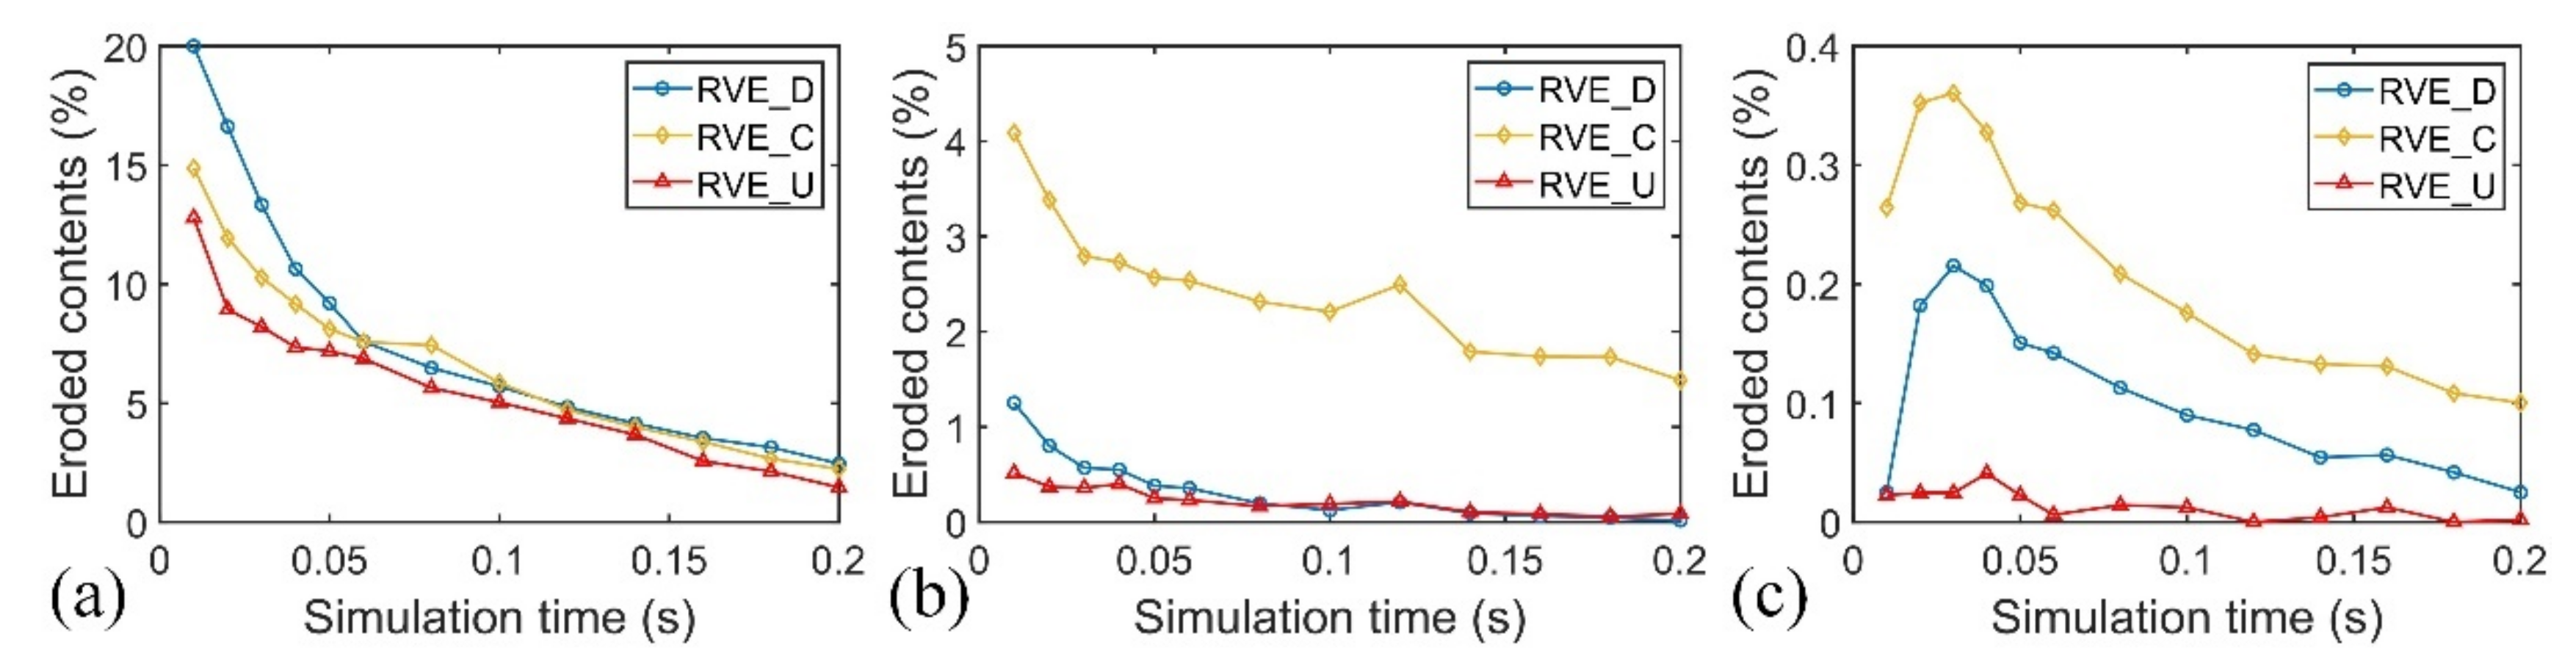
The erodible particles refer to the particles that experience a higher particle–fluid interaction force than the body force and internal-particle contact force. Hence, we estimate the content of erodible particles inside the elementary boundary to better understand the seepage impact, as shown in Figure 7. Due to the reduction of hydraulic gradient, the number of erodible particles is also reduced. As expected, the specimen FC60 shows the lowest content of erodible particles. The onset of detected particles mainly occurs around the boundary and on the downstream side, in particular for the element RVE_C according to the results of the specimen FC40 and FC60. For the specimen FC30, the high hydraulic gradient would transfer particles out of the system on the downstream side. In such a case, the element RVE_D shows higher eroded contents at the initial stage of piping erosion.
3.5.3. Coordination Number
The coordination number (CN) is a basic index for illustrating particle connectivity and investigating the contact network, indicating the average number of contacts a particle has. Thornton [35] defines the mechanism average coordination number without the consideration of rattlers. The expression of mechanism average coordination number is as,
where refers to the number of contacts, is the number of particles. and denote the number of particles with one and zero contacts, respectively.
Figure 8 displays the evolution of the mechanism and average coordination number for each specimen. The results are consistent with the characteristics of rattler contents. A higher proportion of higher rattlers corresponds to a lower mechanism average coordination number. Specimen FC60 shows the highest magnitude among the samples, while the lowest magnitude occurs for specimen FC30. The results indicated that the water flows would enhance the connectivity between particles, especially for the interactive-underfilled soil matrix.
3.5.4. Geometry
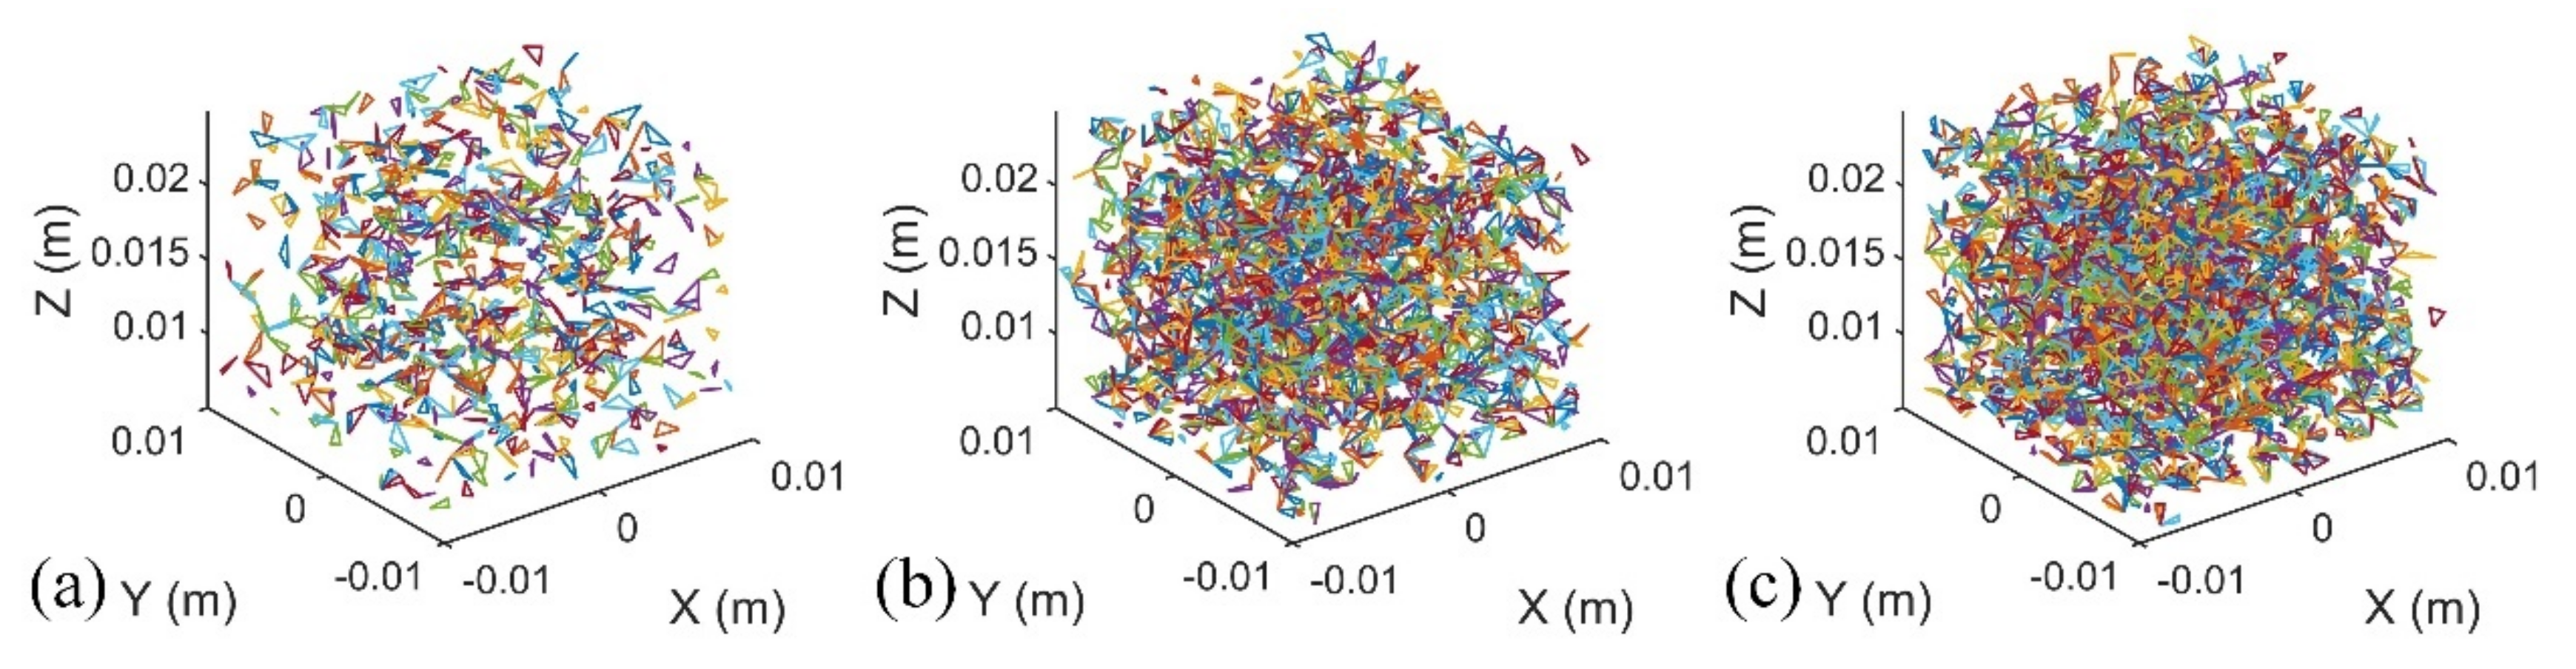
Changes in the erodible particles and particle connectivity would lead to a different particle contact network. A detailed study of the complex networks could give a quantitative understanding of the geometry condition of the granular system. Papadopoulos et al. [36] reviewed different methods for characterizing and quantifying the topological and geometrical organization of the granular network, such as the node degree, walks, and paths. In this study, we focused on the network concept of the cycle to understand the structural organization. The 3-cycles of particles arranged in the form of a triangle are the simplest motifs in complex networks, which would result in frustrating rotations and a stable condition. Taking the element RVE_C as an example, Figure 9, Figure 10 and Figure 11 depict the distribution of the 3-cycles connections inside the soil skeleton at the initial state. The color in the graphs represents the id of the formed triangles, which has no physical meaning. It can be seen that the number of triangles increased with the increase of the initial fine contents, implying a more stable condition and a higher internal erosion resistance. The triangles are similar during piping for specimen FC60, which are increased for specimen FC30 and FC40. Moreover, according to Figure 7, the piping erosion induces a higher number of floaters around the retaining wall for the specimen FC40, which thus produces a sparse contact network near the top of the RVE boundary.
For a given contact network, Newman [37] proposed a fundamental quantity named the clustering coefficient to measure the density of triangles. Watts and Strogatz [38] gave the definition of the clustering coefficient at a vertex ,
where is the number of triangles attached to the vertex and is the degree of the vertex.
The connectivity between internal-particles contains the information of the contact force. Hence, the weighted clustering coefficient, obtained by the vertex strength, could provide more significant information on the complex networks. The quantity of the weighted clustering coefficient at a vertex is measured as,
where . From the vertex to the vertex , equals to 1 if the connect exists, otherwise the coefficient equals to 0. refers to the weight of the edge connect, which refers to the normal contact force in this study. The clustering coefficient ranges from 0 to 1. A higher quantity of means a closely packed structure with more 3-cycles, whereas a lower value corresponds to the system in a loose condition with less connectivity. In the entire network, the average weighted clustering coefficient is estimated as,
in which is the number of particles.
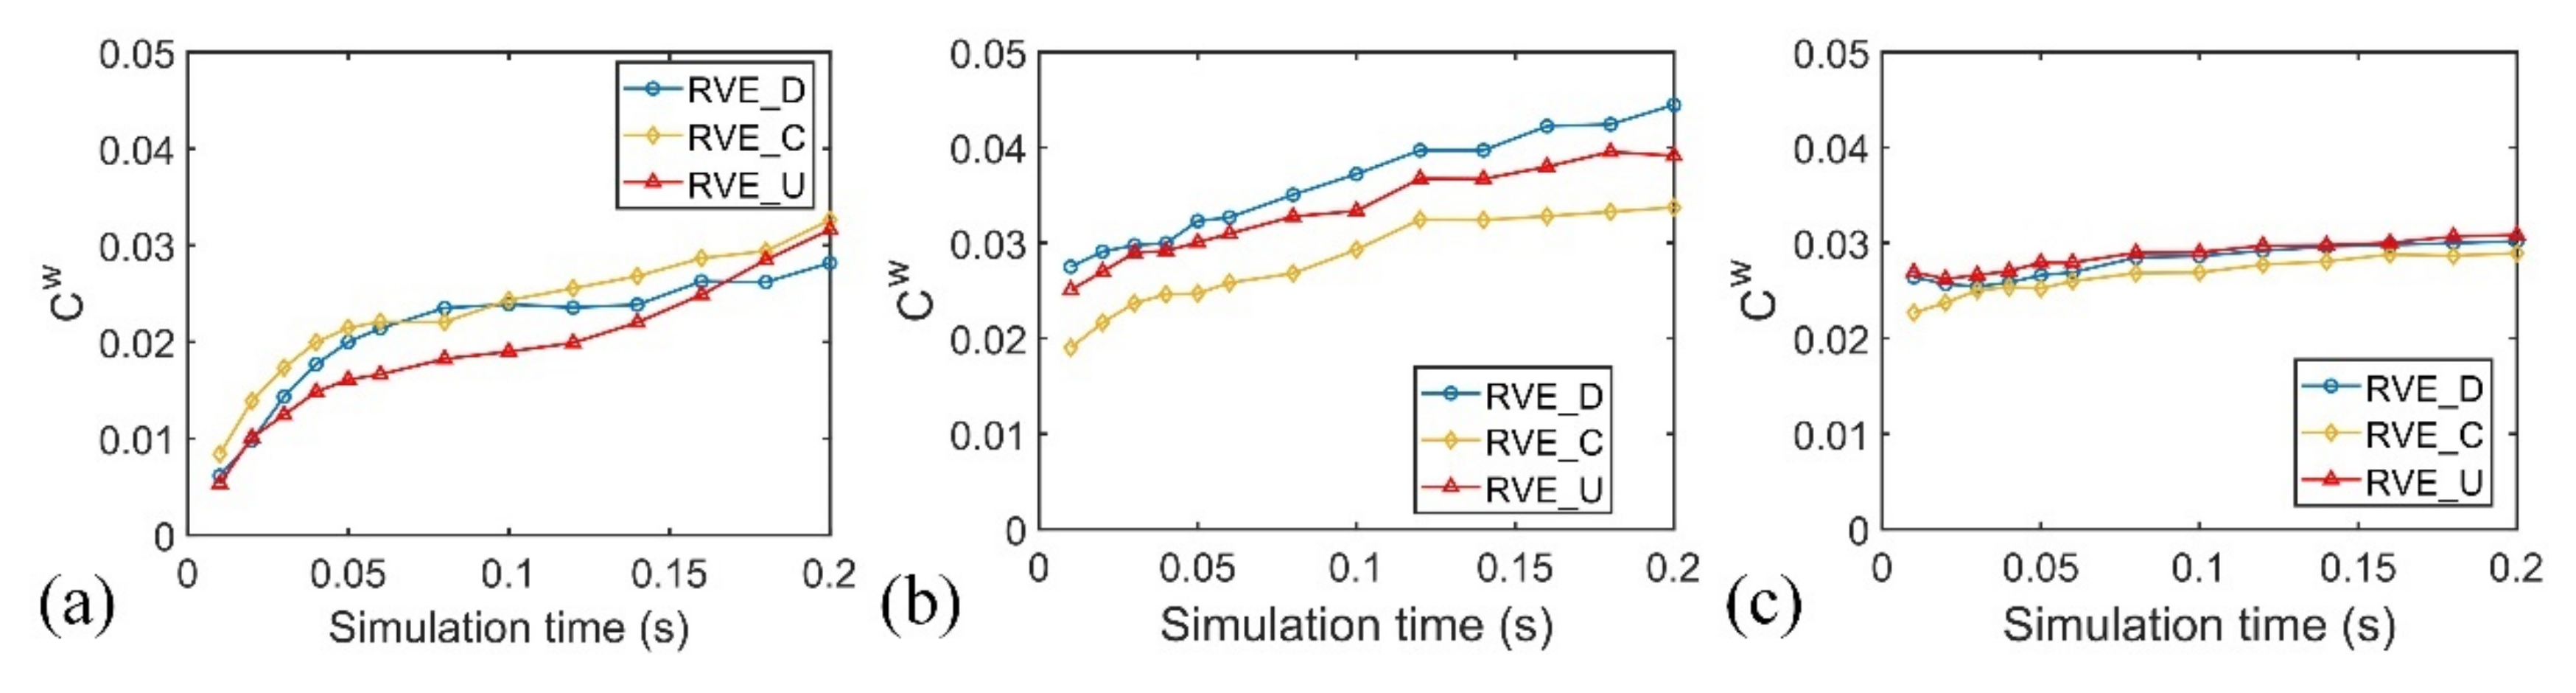
Figure 12 portrays the evolution of during piping for different specimens. As expected, the interactive-underfilled specimen FC30 shows the lowest value of among the three samples. The seepage impact transmitted the fine particles and enhanced the particle connectivity during the seepage process, which increases the clustering coefficient. It is interesting to observe that the specimen FC40 generates a higher clustering coefficient than the specimen FC60, which may depend on the work of the contact force. Desu and Annabattula [39] found that the larger particles have a higher probability of experiencing stronger contact forces than the smaller particles. Hence, though the specimen FC60 forms an intensive contact network, the high proportion of interactions of fine particles would carry a lower contact force, which reduces the weighted clustering coefficient. The graphs indicate that the element boundaries at different positions experience different heterogeneous conditions, which may impact the constitutive material behavior.
4. Constitutive Material Behavior and Discussion
The progressive observations of internal structure indicate that the water flows would alter the particle arrangement and the network of the system, which may impact the strength behavior of the system. It is thus necessary to investigate how the seepage process affects the local constitutive behavior of soils inside the specimen. In this section, we conduct the triaxial shear simulations with the three RVE boundaries for the non-eroded specimen and the temporal eroded specimen at t = 0.1 s and t = 0.2 s to characterize the seepage impact on the constitutive mechanical behavior.
4.1. Numerical Model Set-Up
Before the triaxial shear test, samples are isotropically consolidated to the confining pressure of 500 kPa. Similar to the DEM modeling of the soil matrix reported in the literature [40], the gravity acceleration of the solid particles is removed in the consolidation stage to avoid the initial heterogeneous condition. During simulation, the granular media should be under a quasi-static condition. A dimensionless parameter , called the inertial number, is adopted to identify the equilibrium condition in this study, with the expression as follows,
where is the strain rate, is the mean size of grains in the assembly. and refer to the material density and the mean effective stress, respectively. The parameter has been widely used to describe the state of granular materials in a steady flow, with the quasi-static condition identified as [41]. For the 3D DEM simulation, Lopera Perez et al. [42] found the quasi-static regime of geotechnical element testing achieved . This study controls the equilibrium condition rigorous with the inertial number maintained less than .
4.2. Material Behavior
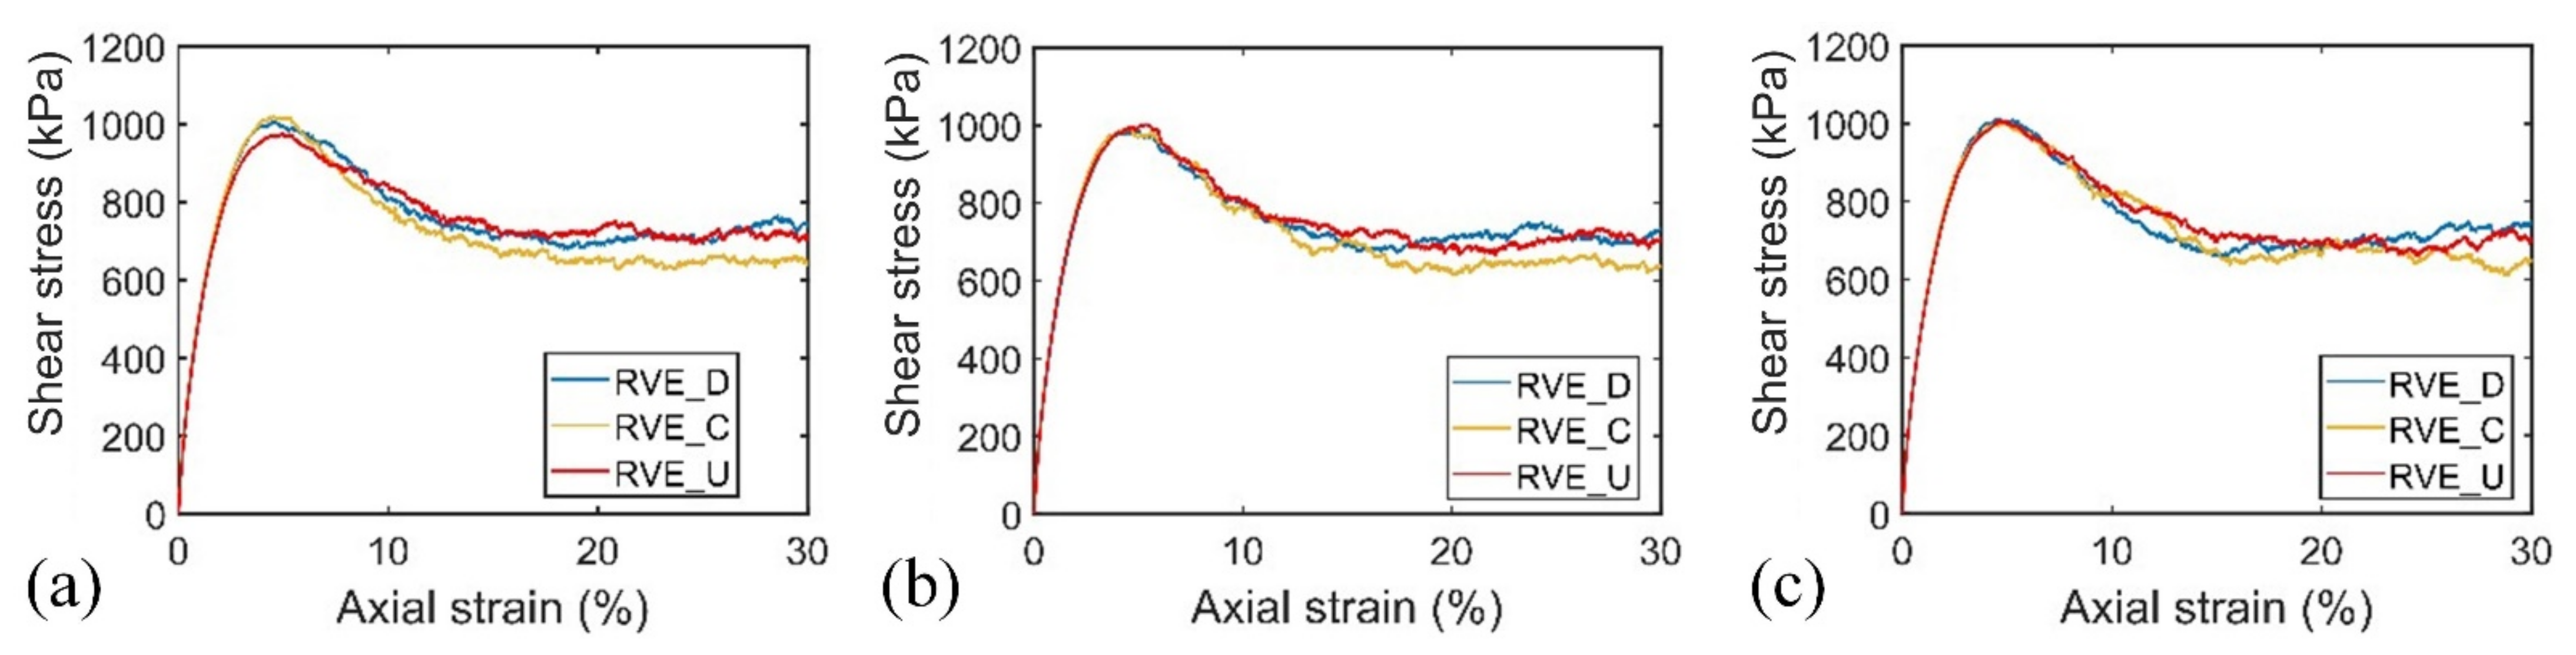
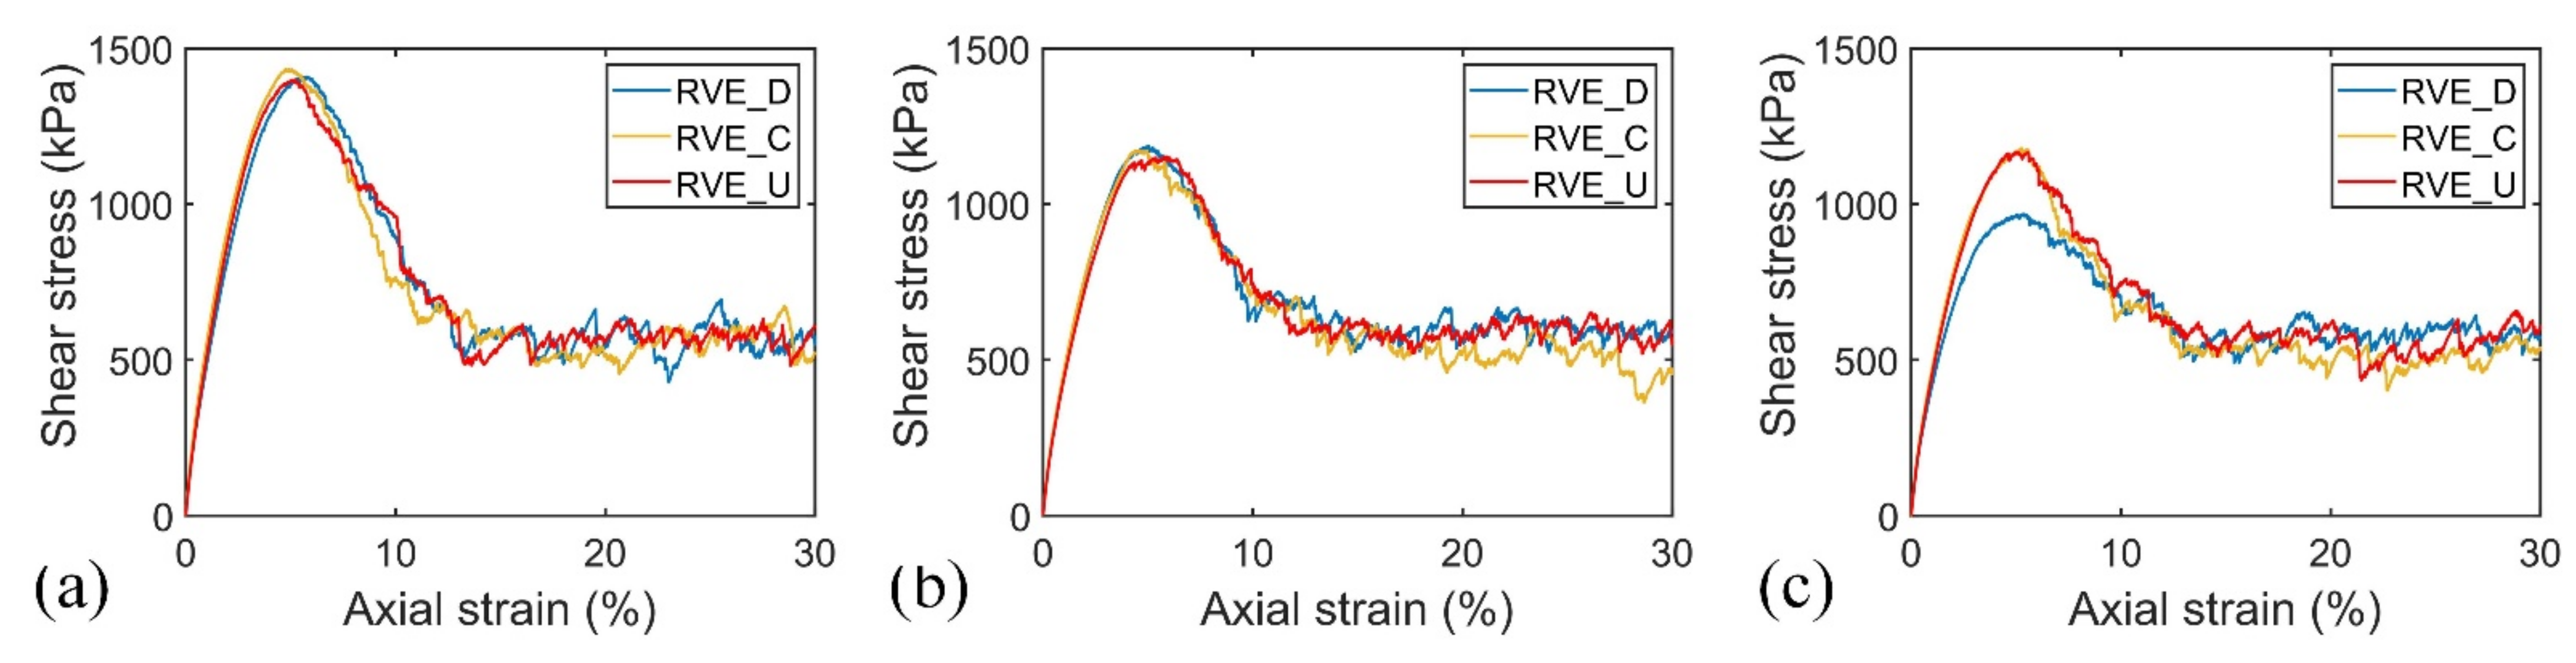
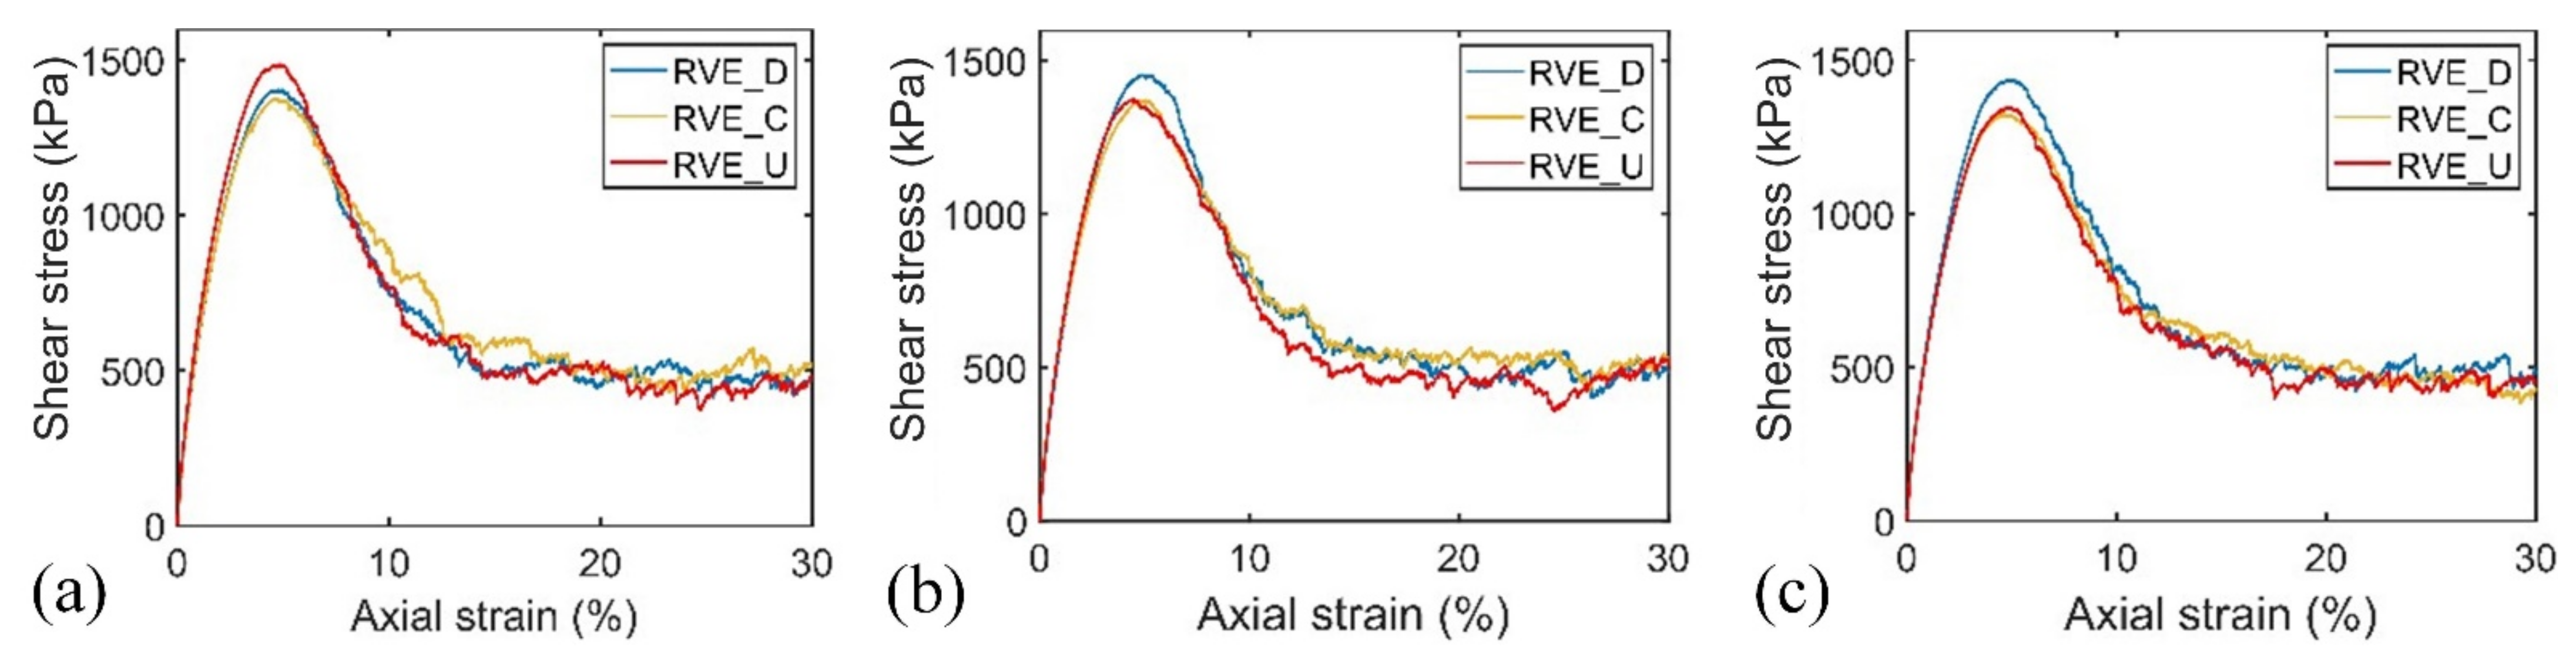
Figure 13, Figure 14 and Figure 15 portray the stress–strain behavior for the three specimens, respectively. Similar to the work of Frias Lopez et al. [30], the overfilled soil skeleton produces a lower peak and higher critical shear strength. Concerning the water flow impact, a slight content of eroded particles for the specimen FC60 induces a similar stress–strain response for the non-eroded and temporal eroded soil matrix. However, the high hydraulic gradient causes a great proportion of eroded particles for the specimen FC30, which reduces the peak shear strength of eroded soils compared with non-eroded soils. Regarding the local affected zone, the specimen FC40 induces a lower peak shear strength on the upstream side during the progressive piping erosion. However, the piping erosion process reduces the peak shear strength on the downstream side for the specimen FC30. The results indicated that the weighted clustering coefficient is a better index to determine the mechanical behavior of the eroded soil matrix. A high magnitude of corresponds to a higher peak shear strength.
5. Conclusions
This paper examines the influence of fine content on the onset and development of piping erosion using the coupled CFD-DEM software, mainly concerning the local affected zone in the hydraulic structure. Numerical simulations can capture the spatial and temporal changes of the structure to characterize the development of piping erosion. The spatial distribution of particle velocity and drag force showed the soil matrix with a high content of fine particles would enhance the erosion resistance with a small displacement of particles. Three representative volume element boundaries were adopted to examine the impact of the piping erosion process on the characteristics of local geometry and the constitutive material behavior. The rattlers and erodible particles were reduced as the erosion progressed. We adopted the simplest motifs in complex networks, the 3-cycles connections, to examine the local geometry of the internally unstable soil. The seepage failure started at the region adjacent to the retaining wall, which observes a sparse contact network. A fundamental quantity named the weighted clustering coefficient was proposed in this study to measure the density of the complex networks based on the information of the normal contact force. Results displayed that the specimen FC40 has the highest magnitude of the weighted clustering coefficient. The material behavior indicated the weighted clustering coefficient is a better index to determine the mechanical behavior of the eroded soil matrix, with a higher magnitude corresponding to a higher peak shear strength. For the interactive-underfilled specimen, the high hydraulic gradient significantly reduced the shear strength, in particular for the downstream side. However, the piping erosion reduced the peak shear strength on the upstream side for the interactive-overfilled specimen. The results indicated that the piping erosion would reduce the stability of the structure at different positions for the sample prepared with various fine contents. It is necessary to examine a large-scale and long-term simulation in future work for a better understanding.
Funding
This research received no external funding.
Acknowledgments
The author acknowledges the research group of Xia Li, which makes the work feasible.
Conflicts of Interest
The authors declare no conflict of interest.
References
- Sterpi, D. Effects of the erosion and transport of fine particles due to seepage flow. Int. J. Geomech. 2003, 3, 111–122. [Google Scholar] [CrossRef]
- Foster, M.; Fell, R.; Spannagle, M. The statistics of embankment dam failures and accidents. Can. Geotech. J. 2000, 37, 1000–1024. [Google Scholar] [CrossRef]
- Terzaghi, K. Der Grundbruch an Stauwerken und seine Verhutung. In From Theory to Practice in Soil Mechanics; John Wiley & Sons (in German): New York, NY, USA, 1960; pp. 445–449. [Google Scholar]
- Terzaghi, K. Theoretical Soil Mechanics; Wiley: Hoboken, NJ, USA, 1943. [Google Scholar]
- Kenney, T.C.; Lau, D. Internal stability of granular filters. Can. Geotech. J. 1985, 22, 215–225. [Google Scholar] [CrossRef]
- Wan, C.F.; Fell, R. Investigation of rate of erosion of soils in embankment dams. J. Geotech. Geoenviron. Eng. 2004, 130, 373–380. [Google Scholar] [CrossRef]
- Chang, D.S.; Zhang, L.M. Critical Hydraulic Gradients of Internal Erosion under Complex Stress States. J. Geotech. Geoenviron. Eng. 2013, 139, 1454–1467. [Google Scholar] [CrossRef]
- Sato, M.; Kuwano, R. Laboratory testing for evaluation of the influence of a small degree of internal erosion on deformation and stiffness. Soils Found. 2018, 58, 547–562. [Google Scholar] [CrossRef]
- Xie, Q.; Liu, J.; Han, B.; Li, H.; Li, Y.; Li, X. Critical Hydraulic Gradient of Internal Erosion at the Soil–Structure Interface. Processes 2018, 6, 92. [Google Scholar] [CrossRef]
- Nguyen, C.D.; Benahmed, N.; Andò, E.; Sibille, L.; Phillippe, P. Experimental investigation of microstructural changes in soils eroded by suffusion using X-ray tomography. Acta Geotech. 2019, 14, 749–765. [Google Scholar] [CrossRef]
- Ke, L.; Takahashi, A. Experimental investigations on suffusion characteristics and its mechanical consequences on saturated cohesionless soil. Soils Found. 2014, 54, 713–730. [Google Scholar] [CrossRef]
- Ke, L.; Takahashi, A. Triaxial erosion test for evaluation of mechanical consequences of internal erosion. Geotech. Test. J. 2014, 37, 347–364. [Google Scholar] [CrossRef] [Green Version]
- Ke, L.; Takahashi, A. Drained monotonic responses of suffusional cohesionless soils. J. Geotech. Geoenviron. Eng. 2015, 141, 04015033. [Google Scholar] [CrossRef]
- Wang, S.; Chen, J.; Sheng, J.; Luo, Y. Laboratory investigation of stress state and grain composition affecting internal erosion in soils containing a suspended cut-off wall. KSCE J. Civ. Eng. 2015, 20, 1283–1293. [Google Scholar] [CrossRef]
- Xiao, M.; Shwiyhat, N. Experimental investigation of the effects of suffusion on physical and geomechanic characteristics of sandy soils. Geotech. Test. J. 2012, 35, 1–11. [Google Scholar] [CrossRef]
- Cundall, P.A.; Strack, O.D.L. A Discrete Numerical Model for Granular Assemblies. Geotechnique 1979, 29, 47–65. [Google Scholar] [CrossRef]
- Scholtes, L.; Hicher, P.Y.; Sibille, L. Multiscale approaches to describe mechanical responses induced by particle removal in granular materials. Comptes Rendus Mec. 2010, 338, 627–638. [Google Scholar] [CrossRef]
- Muir Wood, D.; Maeda, K.; Nukudani, E. Modeling mechanical consequences of erosion. Geotechnique 2010, 60, 447–457. [Google Scholar] [CrossRef]
- Kawano, K.; O’Sullivan, C.; Shire, T. Using DEM to assess the influence of stress and fabric inhomogeneity and anisotropy on susceptibility to suffusion. In Proceedings of the ICSE 2016 (8th International Conference on Scour and Erosion), Oxford, UK, 12–15 September 2016. [Google Scholar]
- Hicher, P.Y. Modelling the impact of particle removal on granular material behavior. Geotechnique 2013, 63, 118–128. [Google Scholar] [CrossRef]
- Hama, N.A.; Ouahbi, T.; Taibi, S.; Souli, H.; Fleureau, J.M.; Pantet, A. Analysis of mechanical behaviour and internal stability of granular materials using discrete element method. Int. J. Numer. Anal. Methods Geomech. 2016, 40, 1712–1729. [Google Scholar] [CrossRef]
- Chen, C.; Zhang, L.M.; Chang, D.S. Stress-strain behaviour of granular soils subjected to internal erosion. J. Geotech. Geoenviron. Eng. 2016, 142, 06016014. [Google Scholar] [CrossRef]
- Aboul Hosn, R.; Sibille, L.; Benahmed, N.; Chareyre, B. A discrete numerical model involving partial fluid-solid coupling to describe suffusion effects in soils. Comput. Geotech. 2018, 95, 30–39. [Google Scholar] [CrossRef] [Green Version]
- Mehizadeh, A.; Disfani, M.M.; Evans, R.P.; Arulrajah, A. Progressive internal erosion in a gap-graded internally unstable soil-mechanical and geometrical effects. Int. J. Geomech. 2017, 18, 04017160. [Google Scholar] [CrossRef]
- LIGGGHTS. LIGGGHTS (R)-Public Documentation, Version 3.X. Available online: http://www.cfdem.com (accessed on 18 February 2015).
- OpenFOAM. OpenFOAM—The Open Source CFD Toolbox. The OpenFOAM Foundation. 2015. Available online: http://www.openfoam.org (accessed on 22 May 2015).
- Xiao, Q.; Wang, J.-P. CFD–DEM simulations of seepage-induced erosion. Water 2020, 12, 678. [Google Scholar] [CrossRef]
- Xiao, Q. Simulating the hydraulic heave phenomenon with multiphase fluid flows using CFD-DEM. Water 2020, 12, 1077. [Google Scholar] [CrossRef]
- Ke, L.; Takahashi, A. Strength reduction of cohesionless soil due to internal erosion induced by one-dimensional upward seepage flow. Soil Found. 2012, 52, 698–711. [Google Scholar] [CrossRef]
- De Frias Lopez, R.; Silfwerbrand, J.; Jelagin, D.; Birgisson, B. Force transmission and soil fabric of binary granular mixtures. Geotechnique 2016, 66, 578–583. [Google Scholar] [CrossRef]
- Prasomsri, J.; Takahashi, A. The role of fines on internal instability and its impact on undrained mechanical response of gap-graded soils. Soils Found. 2020, 60, 1468–1488. [Google Scholar] [CrossRef]
- Rosenberry, D.O.; Pitlick, J. Effects of sediment transport and seepage direction on hydraulic properties at the sediment–water interface of hyporheic settings. J. Hydrol. 2009, 373, 377–391. [Google Scholar] [CrossRef]
- Di Felice, R. The voidage function for fluid-particle interaction systems. Int. J. Multiph. Flow 1994, 20, 153–159. [Google Scholar] [CrossRef]
- Mehizadeh, A.; Disfani, M.M.; Shire, T. Post-erosion mechanical response of internally unstable soil of varying size and flow regime. Can. Geotech. J. 2021, 58, 531–539. [Google Scholar] [CrossRef]
- Thornton, C. Numerical simulation of deviatoric shear deformation of granular media. Géotechnique 2000, 50, 43–53. [Google Scholar] [CrossRef]
- Papadopoulos, L.; Porter, M.A.; Daniels, K.E.; Bassett, D.S. Network analysis of particles and grains. J. Complex Netw. 2018, 6, 4850565. [Google Scholar] [CrossRef]
- Newman, M.E.J. The structure and function of complex networks. SIAM Rev. 2003, 45, 167–256. [Google Scholar] [CrossRef]
- Watts, D.J.; Strogatz, S.H. Collective dynamics of ‘small-world’ networks. Nature 1998, 393, 440–442. [Google Scholar] [CrossRef] [PubMed]
- Desu, R.K.; Annabattula, R.K. Particle size effects on the contact force distribution in compacted polydisperse granular assemblies. Granul. Matter 2019, 21, 29. [Google Scholar] [CrossRef]
- Shire, T.; O’Sullivan, C. Micromechanical assessment of an internal stability criterion. Acta Geotech. 2013, 8, 81–90. [Google Scholar] [CrossRef]
- Lee, K.-L.; Yang, F.-L. Relaxation-type nonlocal inertial-number rheology for dry granular flows. Phys. Rev. E 2017, 96, 062909. [Google Scholar] [CrossRef] [PubMed]
- Lopera Perez, J.C.; Kwok, C.Y.; O’Sullivan, C.; Huang, X.; Hanley, K.J. Assessing the quasi-static conditions for shearing in granular media within the critical state soil mechanics framework. Soils Found. 2016, 56, 152–159. [Google Scholar] [CrossRef] [Green Version]
Figure 1.
Initial configuration of the specimen.

Figure 2.
Spatial distribution of particle velocity for specimen (a) FC30; (b) FC40; and (c) FC60.

Figure 3.
Evolution of water flow at t = (a) 0.01 s; (b) 0.1 s; and (c) 0.2 s.

Figure 4.
Evolution of particle velocity of specimen FC40 at t = (a) 0.01 s; (b) 0.1 s; and (c) 0.2 s.
Figure 4.
Evolution of particle velocity of specimen FC40 at t = (a) 0.01 s; (b) 0.1 s; and (c) 0.2 s.

Figure 5.
Distribution of drag force at t = 0.01 s for specimen (a) FC30; (b) FC40; and (c) FC60.

Figure 6.
Evolution of rattler contents for specimen (a) FC30; (b) FC40; and (c) FC60.
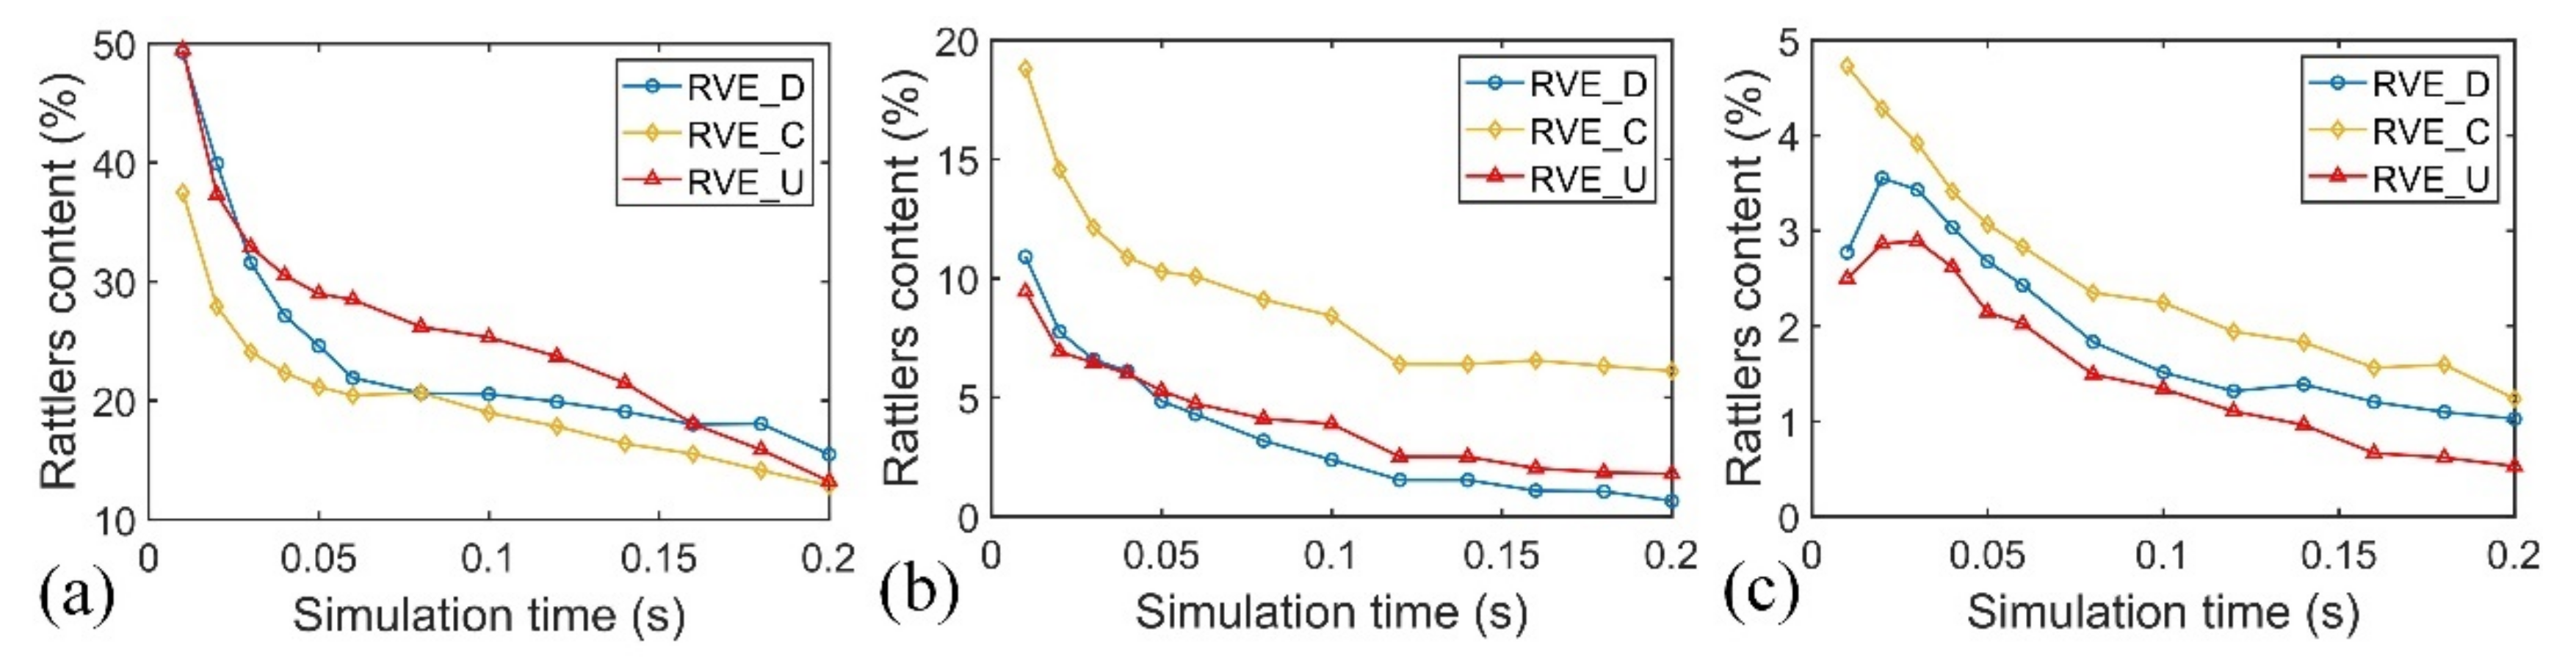
Figure 7.
Evolution of eroded contents for specimen (a) FC30; (b) FC40; and (c) FC60.

Figure 8.
Evolution of for specimen (a) FC30; (b) FC40; and (c) FC60.
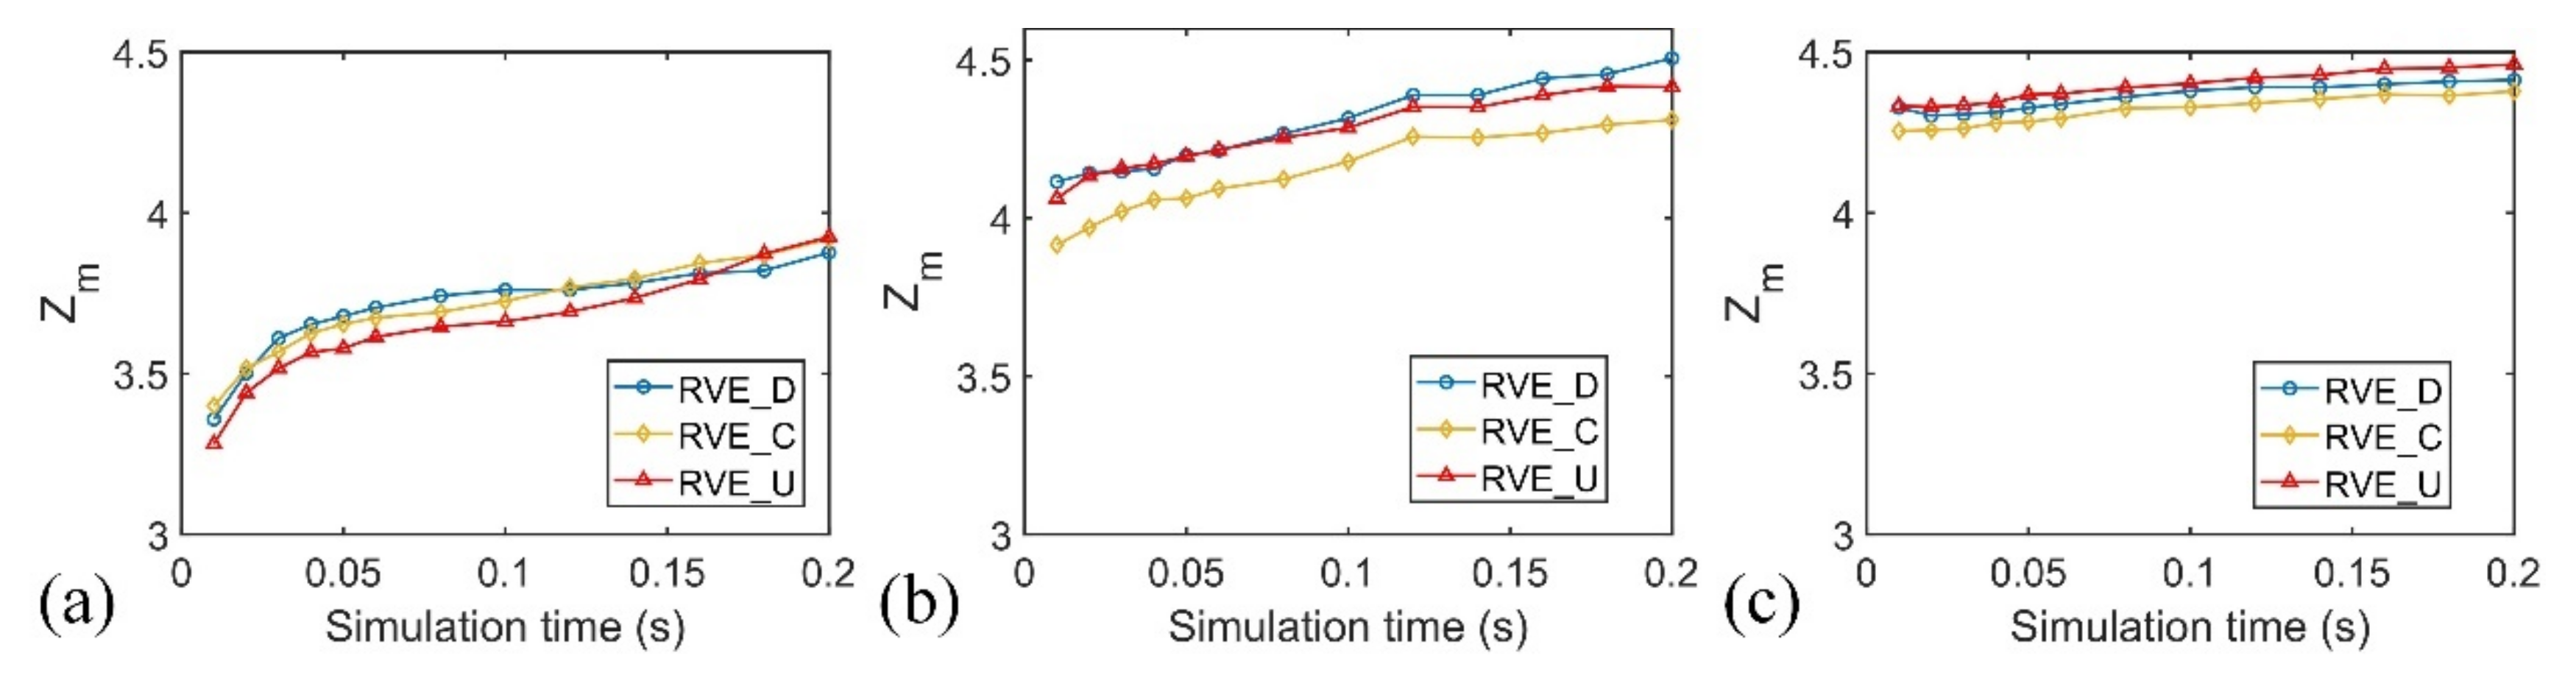
Figure 9.
3-cylces connection for the specimen FC30 at t = (a) 0.01 s; (b) 0.1 s; and (c) 0.2 s.

Figure 10.
3-cylces connection for the specimen FC40 at t = (a) 0.01 s; (b) 0.1 s; and (c) 0.2 s.
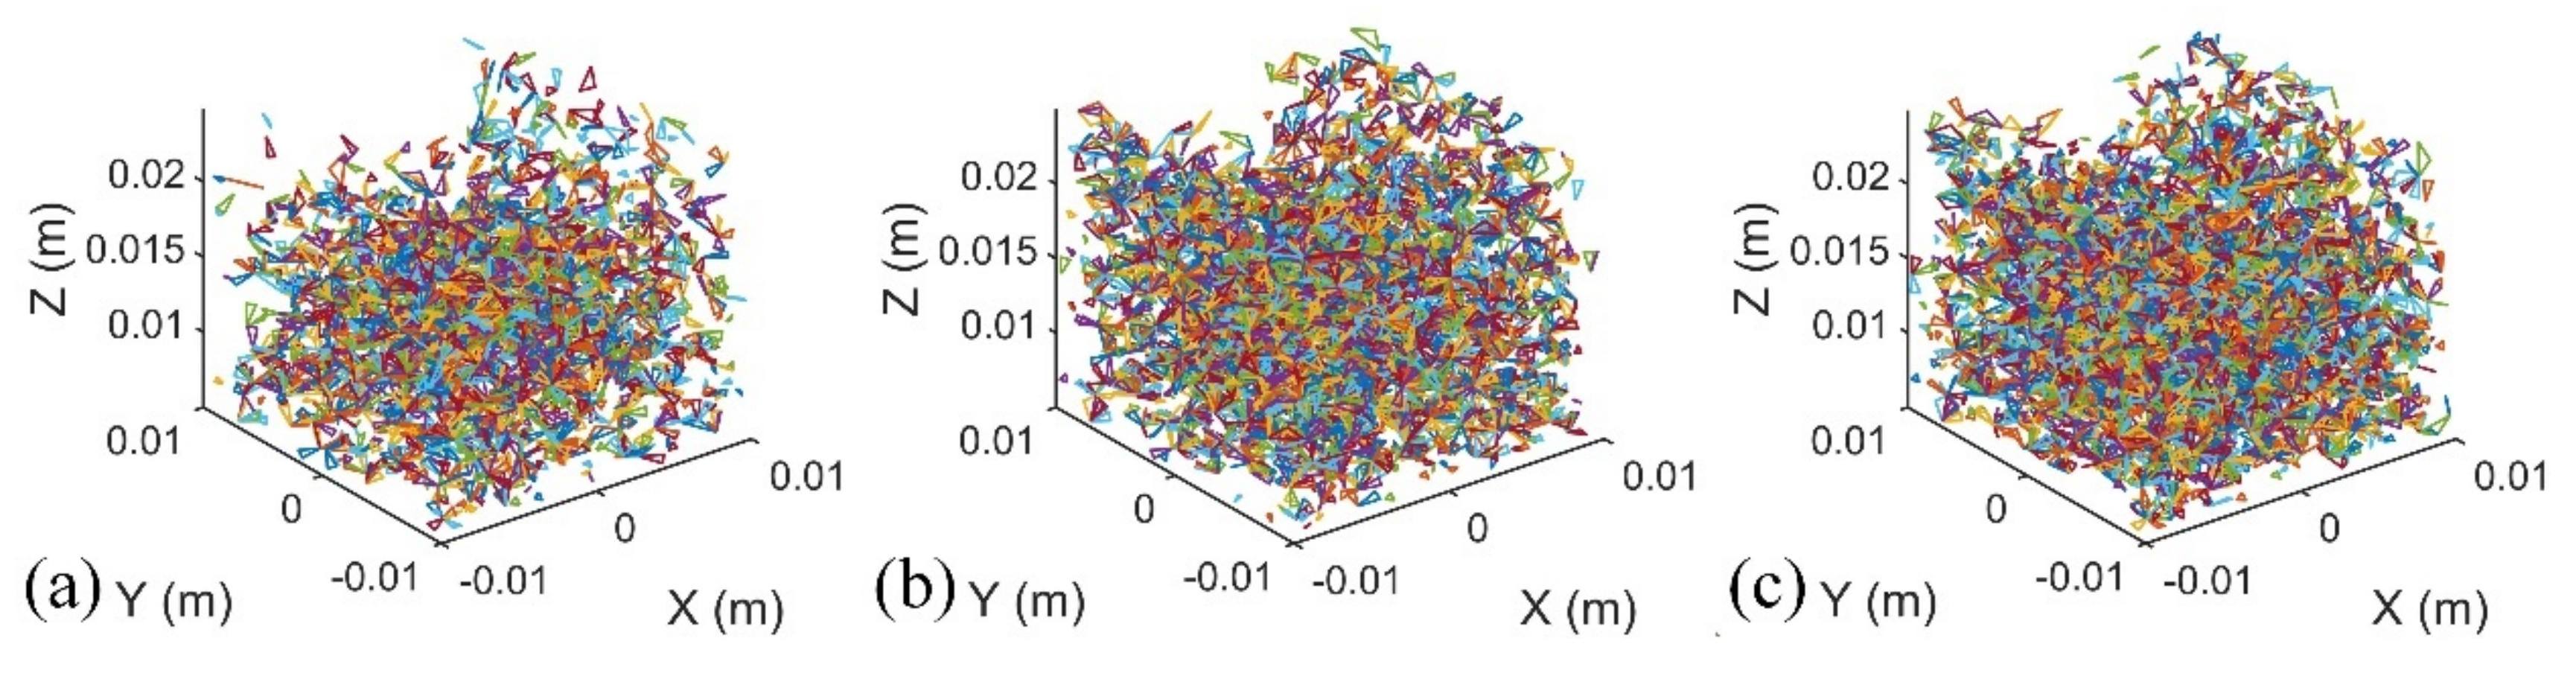
Figure 11.
3-cylces connection for the specimen FC60 at t = (a) 0.01 s; (b) 0.1 s; and (c) 0.2 s.
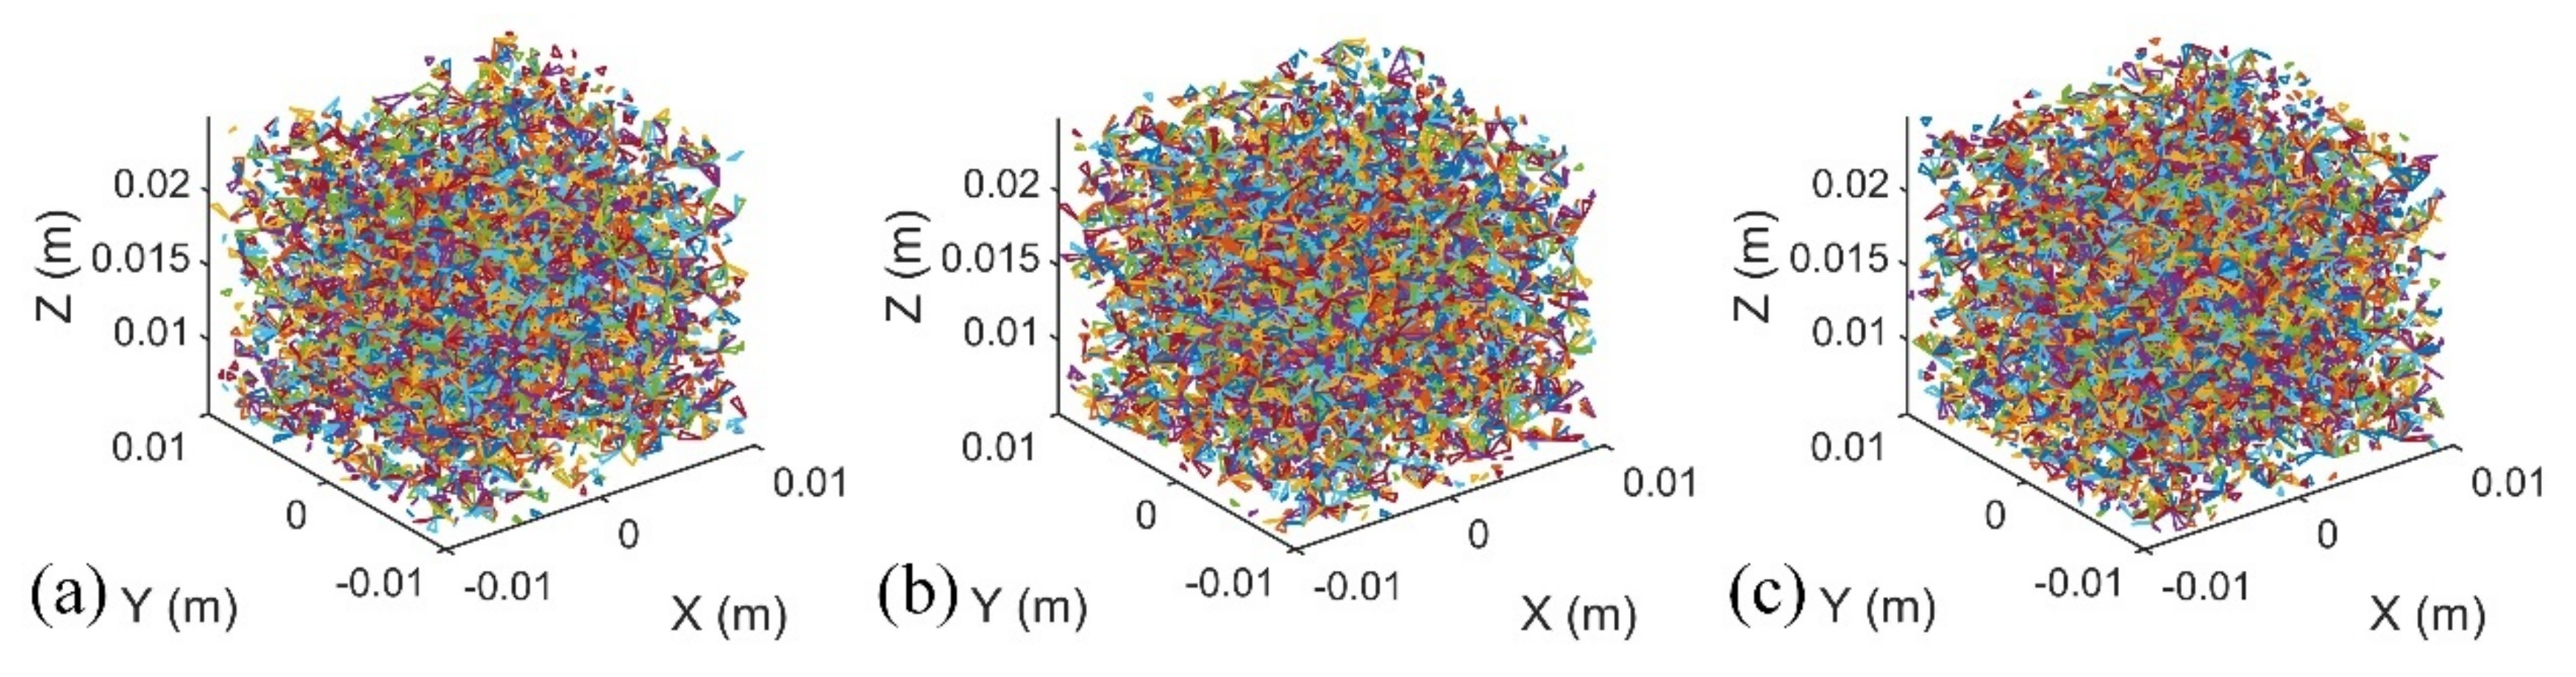
Figure 12.
Evolution of for the specimen (a) FC30; (b) FC40; and (c) FC60.

Figure 13.
Stress–strain behavior for the specimen FC30 at t = (a) 0.0 s; (b) 0.1 s; and (c) 0.2 s.

Figure 14.
Stress–strain behavior for the specimen FC40 at t = (a) 0.0 s; (b) 0.1 s; and (c) 0.2 s.

Figure 15.
Stress–strain behavior for the specimen FC60 at t = (a) 0.0 s; (b) 0.1 s; and (c) 0.2 s.

Table 1.
The information of specimens.
| FC30 | FC40 | FC60 | |
|---|---|---|---|
| Mass ratio (fine/coarse) | 3:7 | 4:6 | 6:4 |
| Solid volume (m3) |
Table 2.
Properties of particles.
| Young’s Modulus | Radii of Particles | Friction Coefficient | Poission’s Ratio | Restitution Coefficient |
|---|---|---|---|---|
| 600 MPa | 0.25 mm 1 mm | 0.5 | 0.45 | 0.1 |
Publisher’s Note: MDPI stays neutral with regard to jurisdictional claims in published maps and institutional affiliations. |
© 2022 by the author. Licensee MDPI, Basel, Switzerland. This article is an open access article distributed under the terms and conditions of the Creative Commons Attribution (CC BY) license (https://creativecommons.org/licenses/by/4.0/).
Share and Cite
MDPI and ACS Style
Xiao, Q. Impact of Piping Erosion Process on the Temporal–Spatial Mechanisms of Soil. Water 2022, 14, 2841. https://doi.org/10.3390/w14182841
AMA Style
Xiao Q. Impact of Piping Erosion Process on the Temporal–Spatial Mechanisms of Soil. Water. 2022; 14(18):2841. https://doi.org/10.3390/w14182841
Chicago/Turabian StyleXiao, Qiong. 2022. "Impact of Piping Erosion Process on the Temporal–Spatial Mechanisms of Soil" Water 14, no. 18: 2841. https://doi.org/10.3390/w14182841
Note that from the first issue of 2016, this journal uses article numbers instead of page numbers. See further details here.