A Tree-Based Machine Learning Method for Pipeline Leakage Detection

College of Civil Engineering and Architecture, Zhejiang University, Hangzhou 310058, China
*
Author to whom correspondence should be addressed.
Water 2022, 14(18), 2833; https://doi.org/10.3390/w14182833
Submission received: 6 September 2022
/
Revised: 8 September 2022
/
Accepted: 9 September 2022
/
Published: 12 September 2022
(This article belongs to the Section Urban Water Management)
Abstract
:Leak detection techniques based on Machine Learning (ML) models can assist or even replace manual work in leak detection operations in water distribution systems (WDSs). However, studies on leakage detection based on on-site leak signals are limited compared to studies on lab-scale leak detection. The on-site leak signals have stronger interference and randomness, while leak signals in the laboratory are relatively simpler. To better assist on-site leak detection operations, the present paper develops and compares three ML-based models. For this purpose, many on-site tests were carried out, and tens of thousands of sets of on-site leak detection signals were collected. More than 6000 sets of these signals were marked and the signal features were extracted and analyzed from a statistical point of view. It was found that features such as the main frequency, the spectral roll-off rate, the spectral flatness, and one-dimensional (1-D) Mel Frequency Cepstrum Coefficient (MFCC) could well distinguish the leakage signals from non-leakage signals. After training the decision tree model, the performances of the random forest and Adaboost models were thoroughly compared. It was found that the false positive rates of the three models were 9.80%, 8.27% and 7.35%, all lower than 10%. In particular, the Adaboost model had the lowest false positive rate of 7.35%. The recall rate of the random forest and Adaboost models were 100% and 99.52%.
1. Introduction
The water distribution system (WDS) plays a pivotal role in the municipal facilities in modern cities. Acute leakage incidents in the WDS usually cause serious social panic and economic losses [1,2]. A key issue in WDS maintenance is to detect and make up the leakage in a timely and accurate manner [3]. The traditional leak detection operation mainly relies on manual work, which needs to be carried out in a quiet environment, usually in the dead of night. This working mode will damage the health of workers and affect the accuracy of leak detection [4]. With the development of computer technology, using programs to assist or even replace manual leak detection has received widespread attention [5]. Thus, the present paper aims to use machine learning (ML) models for leak detection in the WDS.
Theoretically, intelligent leak detection is mainly based on the acoustic emission signals of the WDS leakage, which is the same as in manual work [6]. The wide adoption of ML models greatly improves the accuracy of the WDS leakage detection. In the support vector machine (SVM) model, the feature set of standard deviation (SD), root mean square (RMS), energy, and average frequency describe the signal characteristics well [7]. Qu et al. [6] developed a WDS leakage-warning system based on SVM. The system can obtain vibration signals along the pipeline in real time, extract feature vectors of the signals using the wavelet-based energy mode method, and classify signals with SVM to judge whether leakage events occurred or not. The system achieved an accuracy of 90% in tests. Samer et al. [8] proposed a method to improve the leak identification results with multiple data analysis and classification techniques. In their study, the Fourier transform was used to analyze the leakage acoustic signals and to determine multiple frequency bandwidths. Three models of naïve Bayes (NB), Deep Learning (DL), and Decision Tree (DT) algorithms were developed to identify the leaks. The accuracy of these models ranged from 84% to 89%. It was shown that the ensemble method can increase the accuracy of leak detection from 89% to 100%. It should be noted that small leak signals have features of unclear characteristics and large background noise. Yu and Li [9] carried out experiments and proposed a pattern recognition method for the radial basis function(RBF)-based SVM with a maximum false alarm rate of 1.9%. Fan et al. [10] used the depth automatic decoder to detect small leakages of 0.25 L/s under laboratory conditions when there was a lack of on-site leakage data. They achieved an accuracy of 97.2%. Xiao et al. [11] presented an adaptive optimization method based on the entropic value. The method used three features to determine the leak state and non-leak state with an accuracy of 99.4% and used five features to classify the leaks of different severities with an accuracy of 95.6%. Quy and Kim [12] used a Hanning window to segment the acoustic emission signals and to maintain the characteristic stability of the original acoustic signals. Then, in their study, a Korean New Network (KNN) classifier was trained with a combination feature of RMS, SD, and average frequency to identify whether leaks occurred or not. Quy and Kim achieved an accuracy of 93%. Banjara et al. [13] compared the classification effects of SVM and the relevance vector machine (RVM) in WDS leakage detection. They indicated that the SVM algorithm can be extended for a multiple classification with better accuracy, while the RVM algorithm can only be used for binary classification. Rahimi et al. [14] applied fast Fourier transform (FFT) to convert the signal into a one-dimensional image and then into a one-dimensional chaotic neural network(CNN). They showed that this method can run in real-time and achieve a recognition accuracy of 85%. Song and Li [15] carried out an experimental study on leak detection of the WDS with failed joints. They established a classifier based on the artificial neural network (ANN). In the network, the feature set of peak, average, and peak frequency achieved an accuracy of 97.2%, and the feature set of average and peak frequency achieved an accuracy of 96.9%. Kampelopoulos et al. [16] emphasized that the role of the recall rate rather than accuracy is an important issue in evaluating the results of ML models in practical applications. In Tariq’s research [17], the AdaBoost model was used to classify the leakage of metal and non-metal pipes, and the overall accuracy for metal pipes was 100%, and that of non-metal pipes was 94.93%.
Even though great progress has been made in the WDS leakage detection with the ML models in theory and in the laboratory, there are still some obstacles in practical applications as follows: (1) The causes of leakage are complex and changeable, and the leakage acoustic emission signals are strongly random. In the lack of on-site data, the single working condition simulated in the laboratory cannot make the identification algorithm universal. (2) At present, the performance of the models is generally evaluated by the indicator of accuracy, which cannot meet the requirements of accuracy and cost in actual operations.
In the present study, an experiment was carried out to analyze the small leak detection in the WDS caused by a loose joint. The study starts with the feature extraction and analysis of leak signals. An SVM classifier is established to judge whether there is a leak or not. It will be shown that the SVM model based on kernel functions can achieve a classification accuracy of up to 98%. Note that the Kullback–Leibler (KL) kernel function’s result is the best. In the present paper, tens of thousands of groups of on-site data were collected, and more than 6000 groups of them were marked. With a feature set of dominant frequency, spectral flatness, spectral roll-off rate, and 1-D MFCC, the classifiers based on ML models such as decision tree, random forest, and boosting were developed. These classifiers achieved a recall rate of up to 100% and a negative–positive rate as low as 7.35%. The major contributions of the present study are to have 6000 groups of marked on-site data to train the models for leakage detection and to jointly use the recall rate and the false positive rate to evaluate the classifier in the balance of the needs for accuracy and cost in practical operations.
2. Methodology
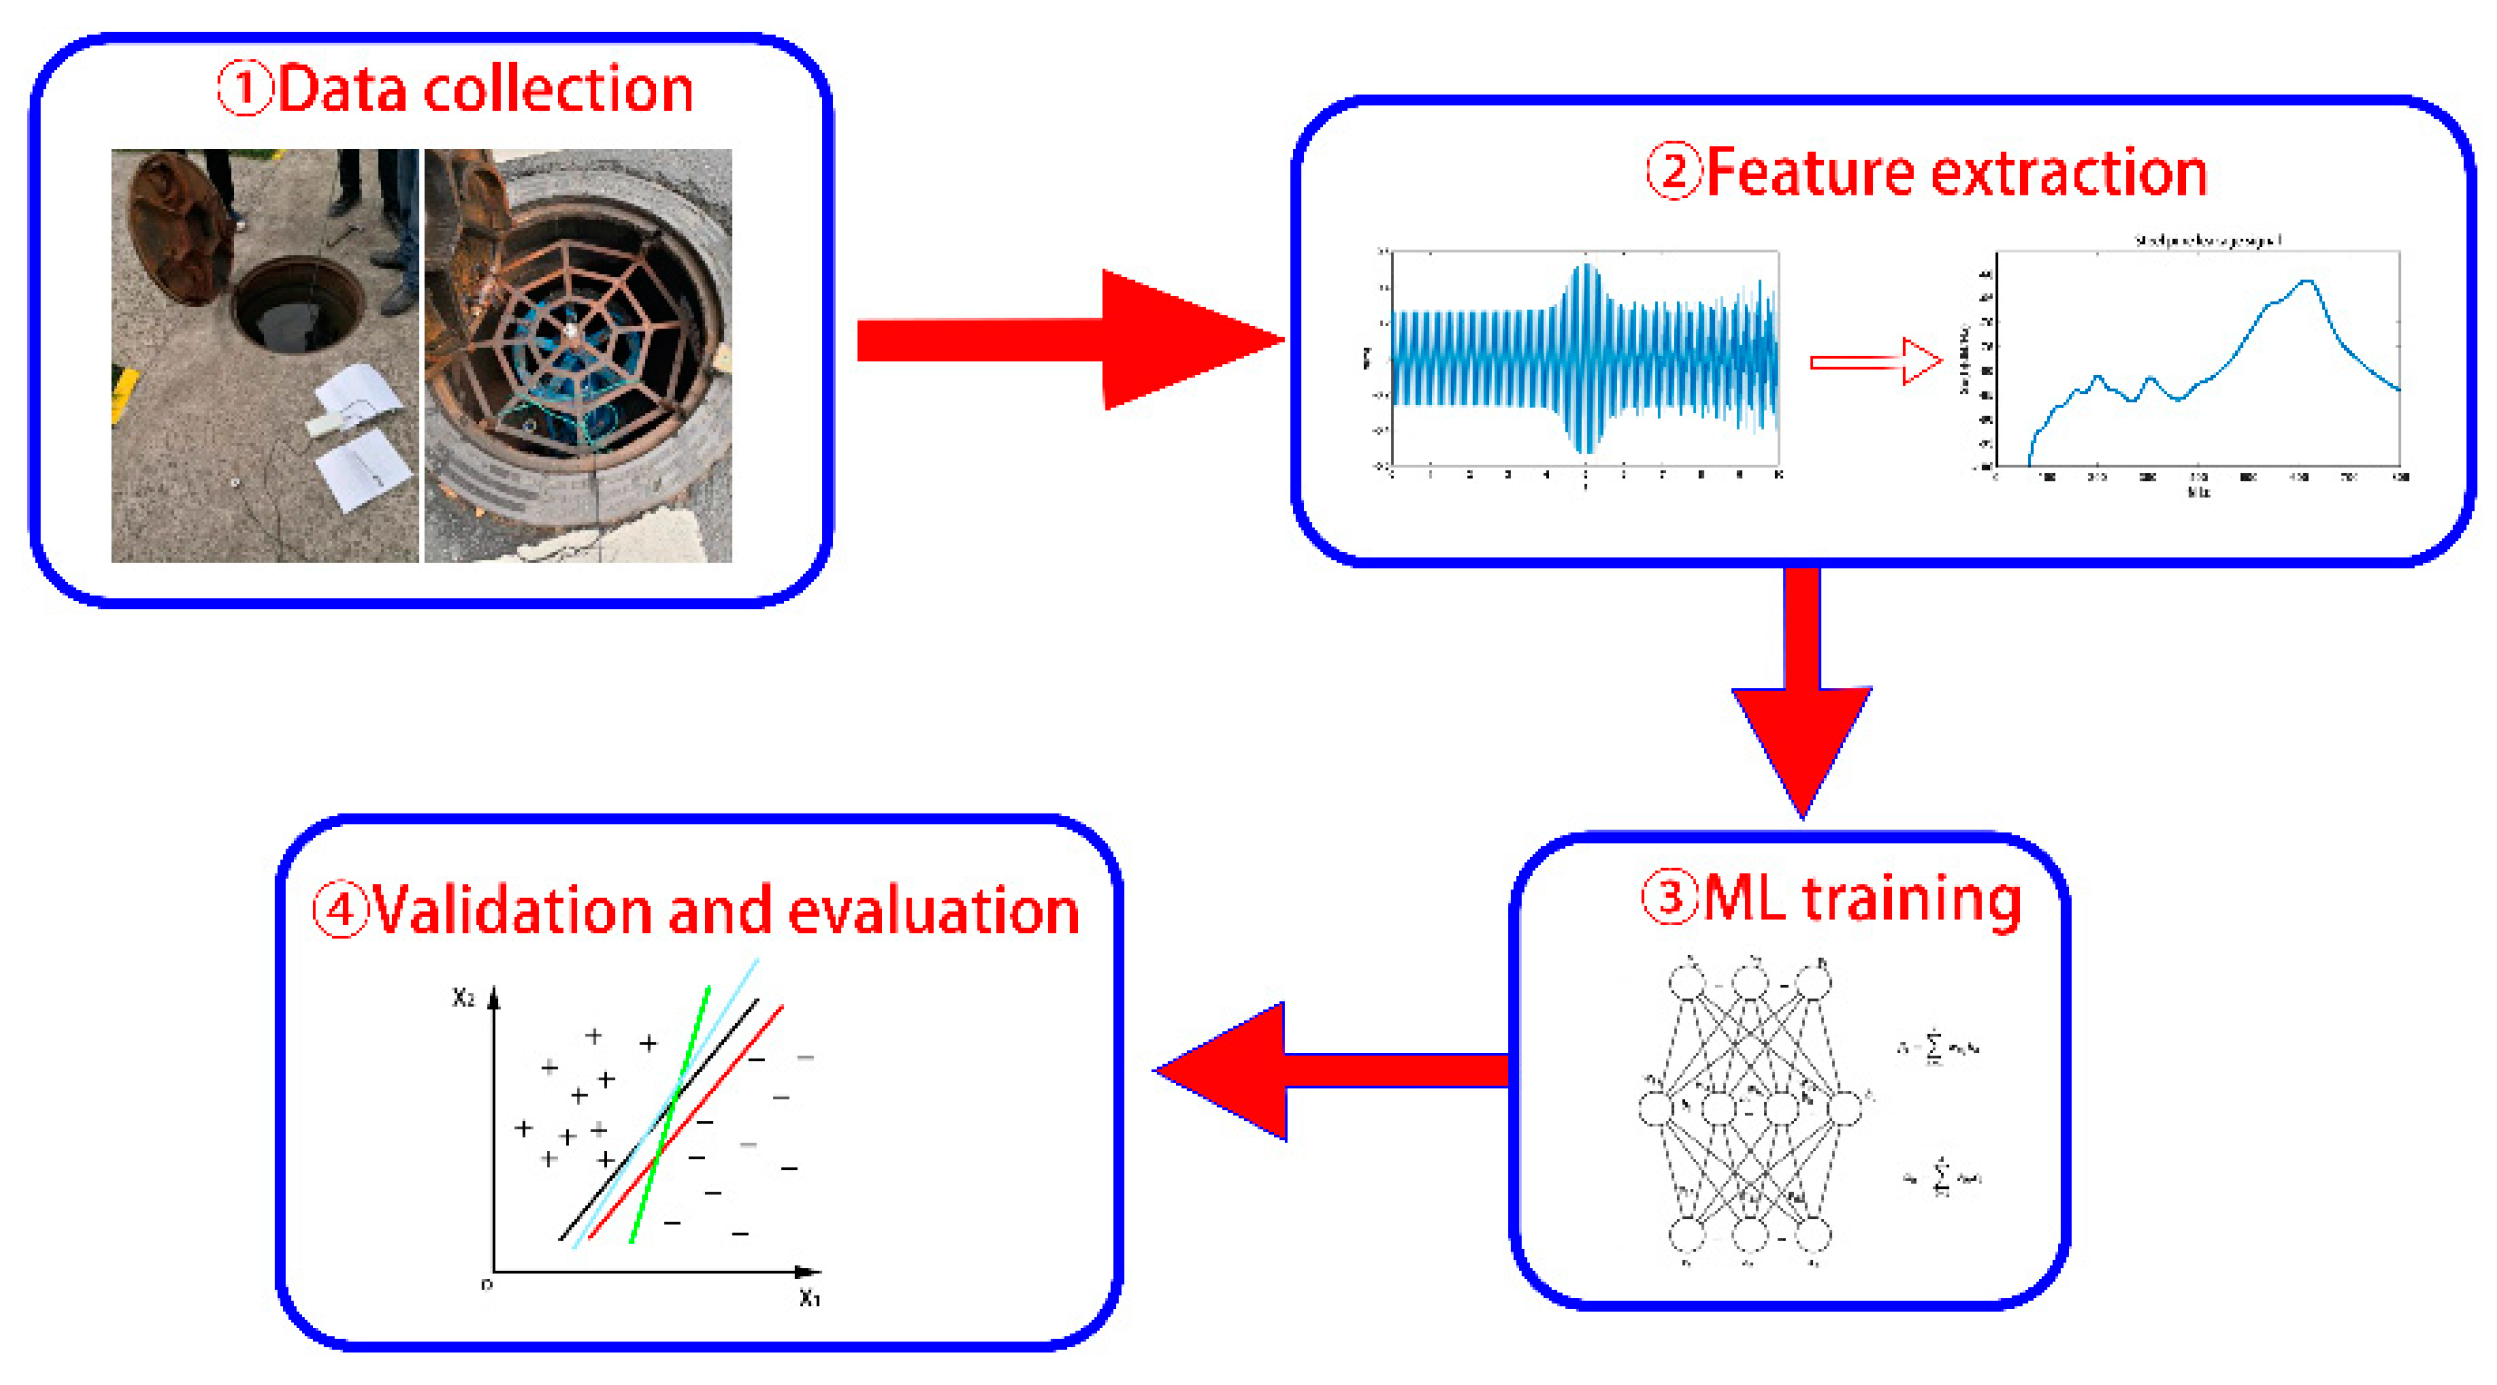
The main aspects of this paper based on ML models for leakage detection include data collection, feature extraction, machine models’ training, and validation and evaluation. The exploration procedure of this study is shown in Figure 1.
2.1. Data Collection
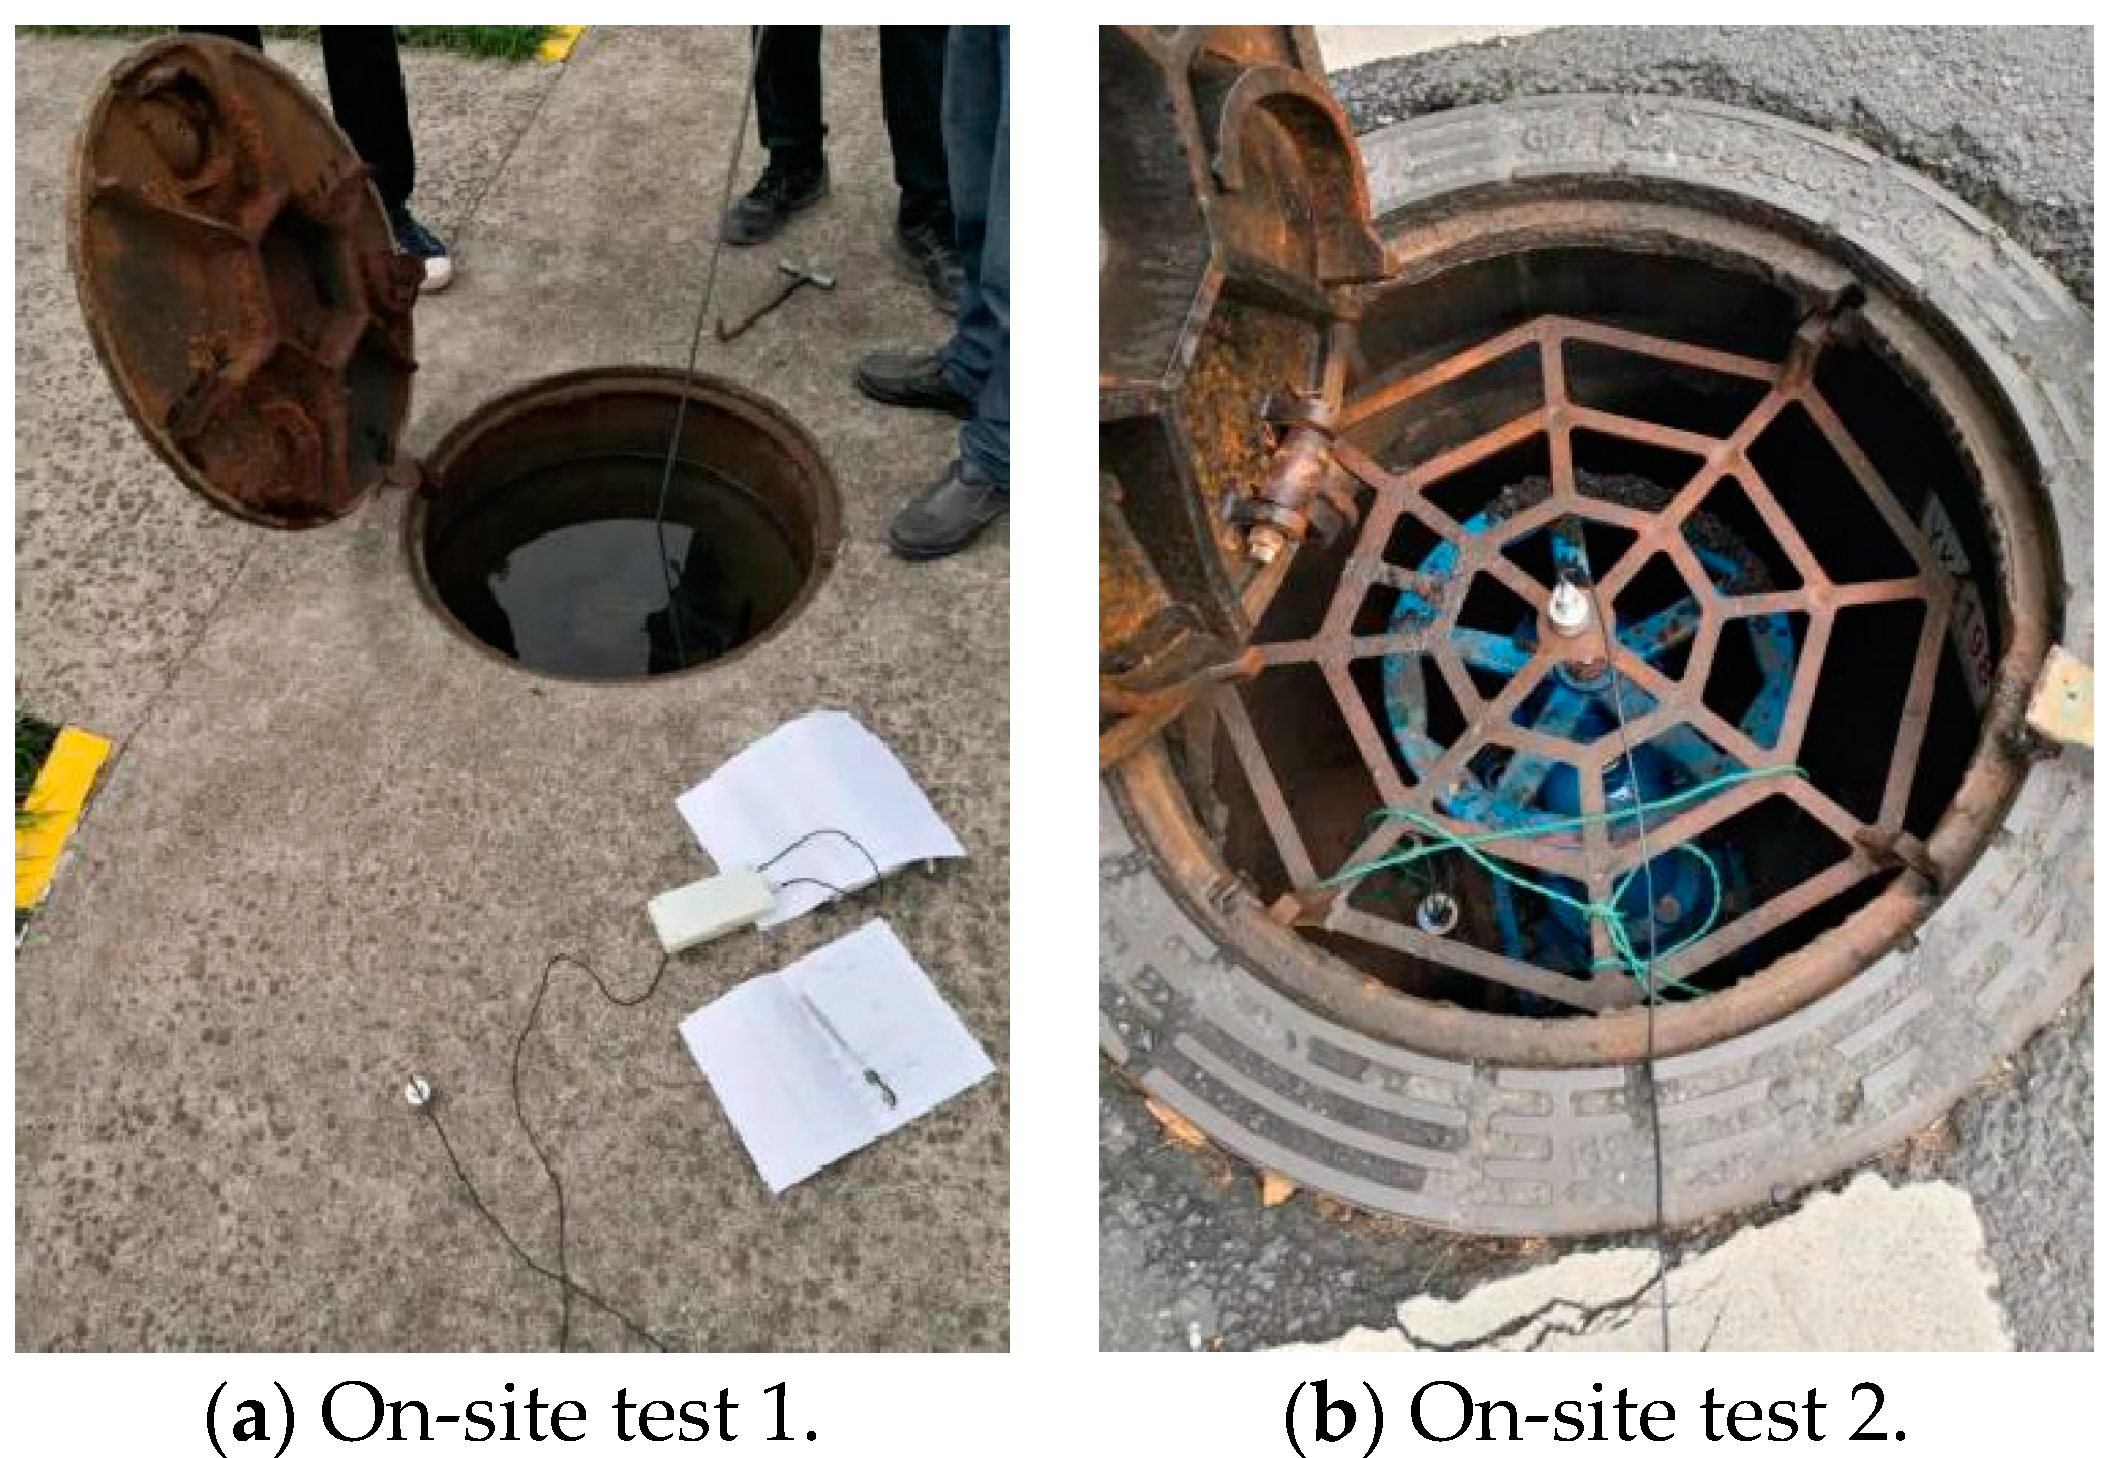
It should be noted that there is a lack of on-site data in the field of leak detection of the WDS. Thus, in the present study, tens of thousands of sets of first-hand on-site leak detection signals were collected. These data are more adequate than ever for training the ML models for leak detection. From 2019 to 2021, the leak signals of cast iron pipes, copper pipes, and steel pipes were accumulated by various leak detection equipment such as DNR-18, LXP1500, and online leak tester. These pipes were used in WDS leak detection tests, residential main pipes, residential branch pipes, urban water supply main pipelines, and fire hydrants in parks with various diameters including 20, 80, and 300 mm. The collection was carried out in Hangzhou, Shaoxing, Shanghai, and many other cities and regions in Jiangsu, Zhejiang, and Shanghai. In addition to collecting the leakage detection signals along the pipeline, various typical background noise signals, such as the sounds of the pump room, the electric drill, vehicles passing, the whistle, and the air conditioner, were collected. Some field measurements are shown in Figure 2.
2.2. Feature Set
Analyzing the characteristics of the collected signals showed that the main frequency, the spectral flatness, the spectral roll-off rate, and 1-D MFCC can statistically well distinguish the leakage and non-leakage signals from the metal tubes. Thus, the present paper adopts the feature set of dominant frequency, spectral flatness, spectral roll-off rate, and 1-D MFCC as the input data for the ML models.
2.2.1. Dominant Frequency
The leak detection signal of the WDS can be regarded as a random signal with “weak periodicity”, which can be recorded as . In addition, its autocorrelation function is as [18]:
where E|·| is the mathematical expectation operator and is the time step.The power spectral density function can accurately describe the statistical characteristics of the stationary random signals in the frequency domain, and can be defined as the Fourier transform of the autocorrelation function of a signal as:
where is the autocorrelation of the signal and is the frequency. Since the leak detection signal has the “weak periodicity”, a peak can be found on the power spectrum estimate plot. The frequency of the peak is the dominant frequency.
2.2.2. Spectral Flatness
Spectral flatness measurement (SFM) is the ratio of the geometric mean (GM) of the spectrum to its arithmetic mean (AM). It is utilized to quantify the flatness of the spectrum with a unit of dB. An SFM closer to zero indicates that the signal is highly similar to the sinusoidal curve or that there is a meaningful signal. An SFM closer to one implies that the higher the SFM is, the lower the correlation of the signal becomes. An SFM equal to one denotes a white noise, no meaningful signal, or a meaningful signal submerged by the higher intensity of the white noise. The below formula calculates the spectral flatness [19]:
where is the signal and N is the length.
2.2.3. Spectral Roll-Off Rate
The spectral roll-off (SR) rate is the rate at which the spectrum falls physically. It is generally believed that the sound signal of a ship in operation decreases at a rate of 6 dB in the high-frequency range, and the actual spectral roll-off rates are different for different sound sources. The main reason for the different roll-off rates of the acoustic signals is the different degrees of fluid cavitation. For example, commercial ships sailing on the surface and submarines sailing underwater have obvious differences in the spectral roll-off rate. The spectral roll-off rate formula is [20]:
where F is the local domain frequency; n is the frequency step; and P is the decibel.
2.2.4. One-D MFCC
The Mel-Frequency Cepstrum Coefficient (MFCC) is representative of a sound’s short-term power spectrum. This coefficient is obtained by taking the logarithm of the power spectrum on the nonlinear Mel frequency scale and then performing discrete cosine changes [21]. The analysis process of the MFCC is as follows: First, the square value of the amplitude of the acoustic signal is obtained, and the Mel filter is used to filter the acoustic signal. Second, the logarithm operation is performed on the output signal of the first step. Third, the discrete cosine transform is performed on the result to obtain the feature matrix of the MFCC. Note that, in the present paper, the 1-D MFCC is used with other features.
2.3. ML Models
2.3.1. Data Balance
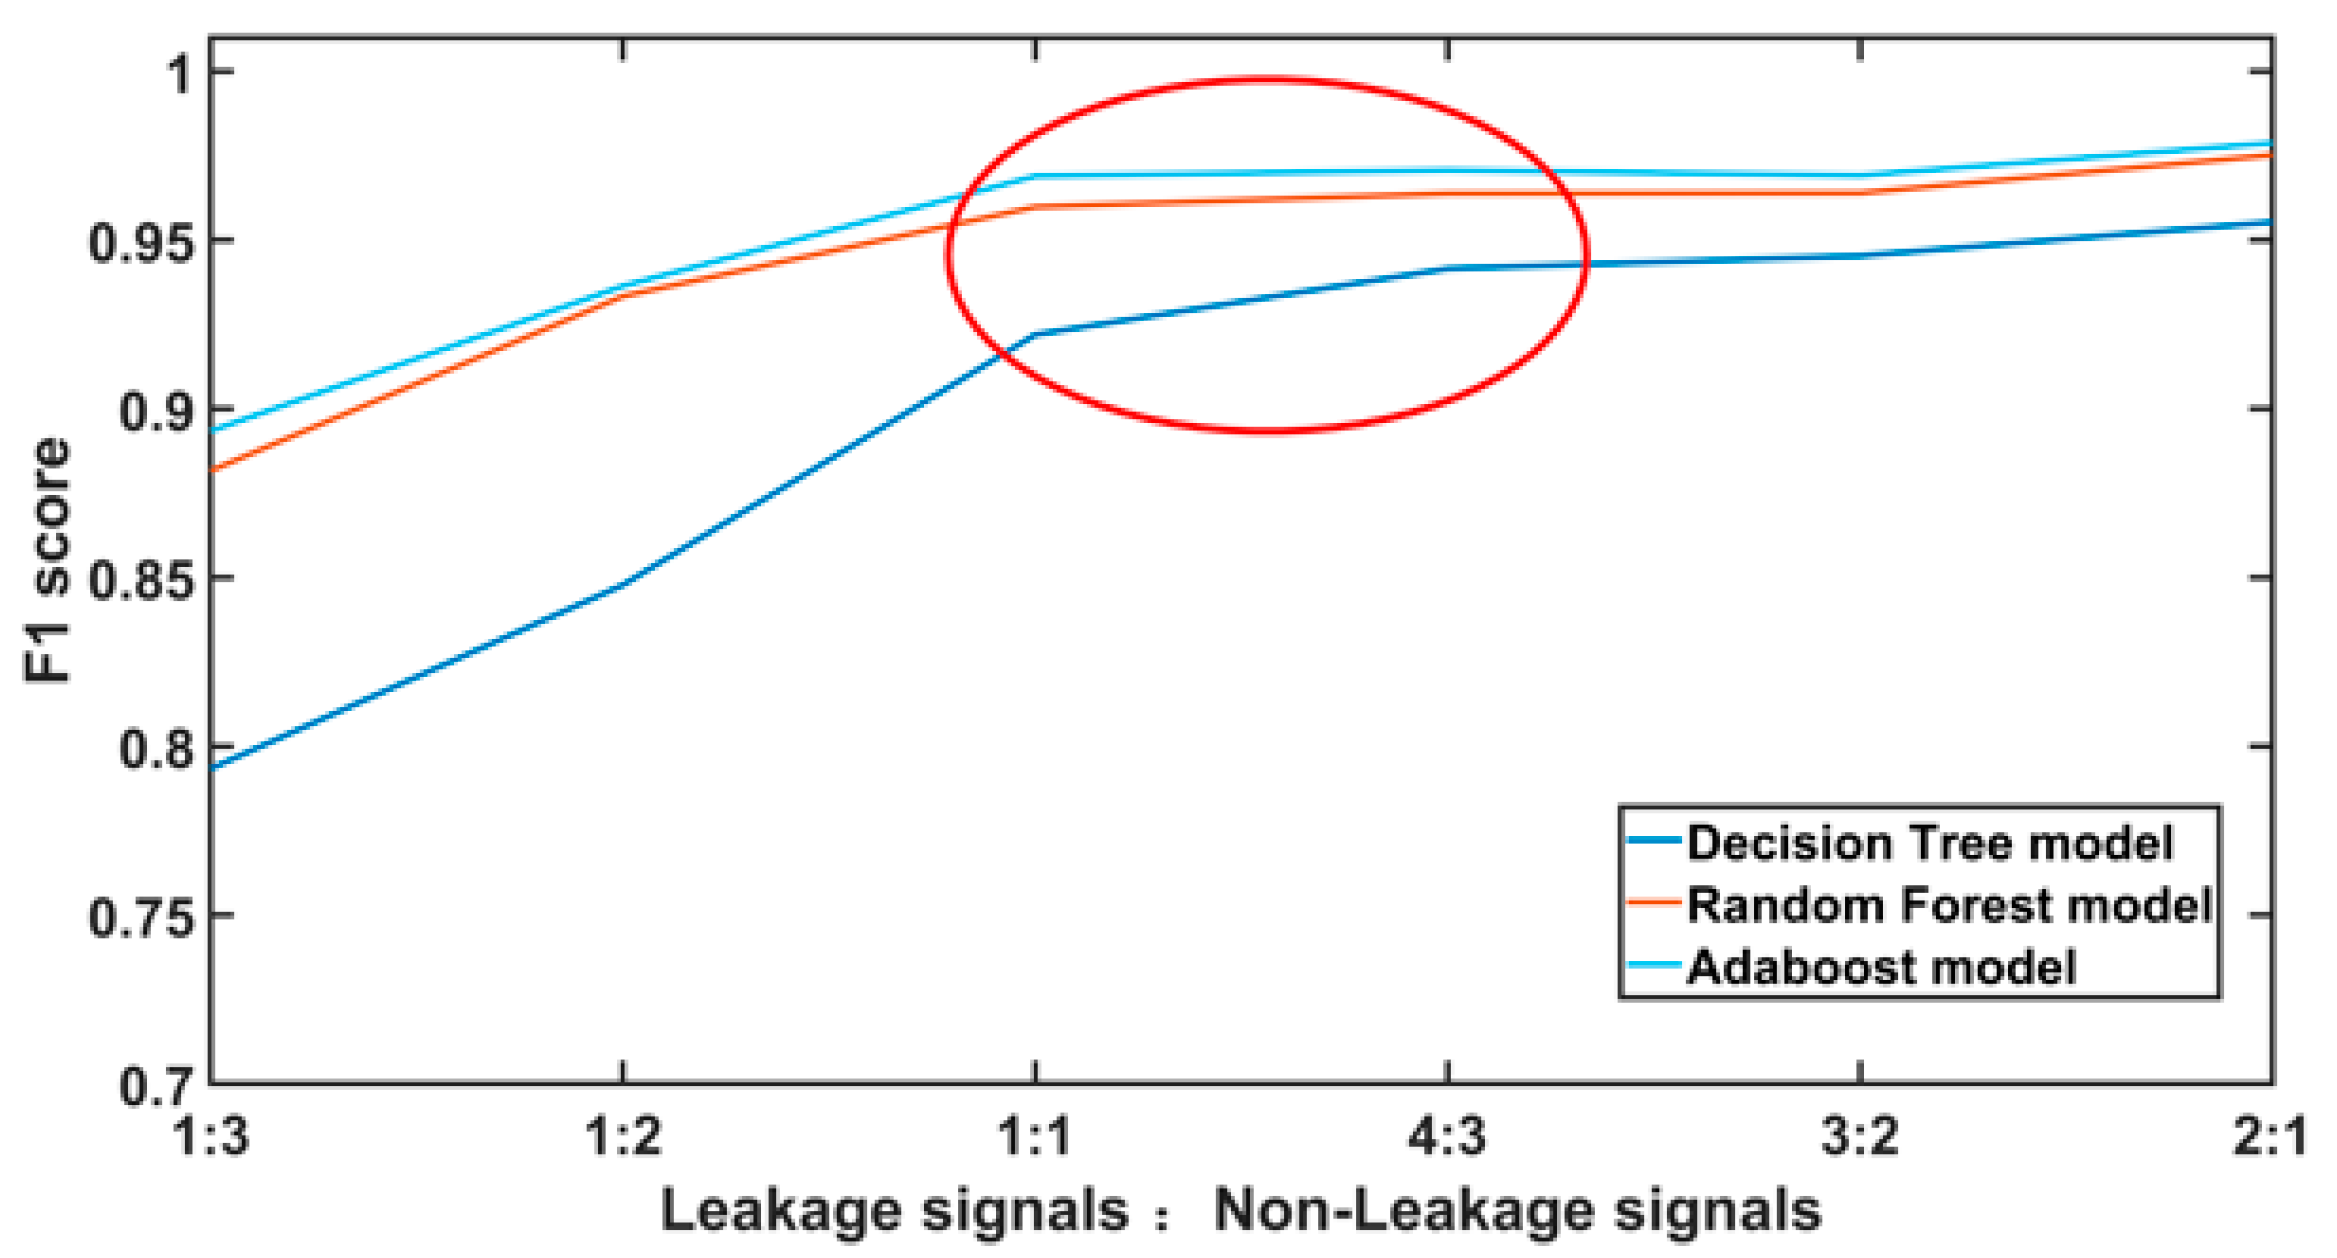
Since the balanced class principle is the basis of most of the ML models, unbalanced input data are usually challenging because they cause the ML models to ignore fewer classes [21]. Note that, in the leak detection operation, the leakage signals are far fewer than the non-leakage signals. Thus, the present paper analyzed the proportion of leakage and non-leakage signals in the training set. The models were trained and evaluated with ratios of leakage to non-leakage signals of 1:3, 1:2, 1:1, 4:3, 3:2, and 2:1. The evaluation results are shown in Figure 3 and Figure 4.
Both Figure 3 and Figure 4 show that the indicators of ML model evaluation have a similar trend with respect to the variation of the data proportion. In the proportion range of 1–4/3, the variations of the evaluation indicators begin to slow down. When the proportion of the leakage and non-leakage signals is less than one, the evaluation indicators of the recall rate and the F1 value decrease rapidly as the proportion decreases, and the classification effect of the ML models deteriorates rapidly. When the proportion is greater than 4/3, the evaluation indicators do not have a significant improvement as the ratio increases. However, the collection of more leakage data will increase the cost of the data acquisition. Thus, the present paper sets the proportion of the input data to one in the training process of the ML models.
2.3.2. Decision Tree
The decision tree model is one of the most widely used ML models and has good interpretability. Its basic judgment process is based on concise and clear logical strategies and is the same as the decision-making process of the human brain. However, decision tree models are prone to overfitting [8]. In the present paper, the parameters are set as follows: Criterion = gain ration; maximal depth = 20; apply pruning = Y; confidence = 0.05; minimal gain = 0.05; minimal leaf size = 3; and minimal size for split = 5.
Random forest is composed of many decision trees, and there is no relationship between the different decision trees. When the classification task is executed, each decision tree in the random forest runs judgment and classification separately, and each one obtains its own classification result. The voting method is used to determine the result. In the present paper, the model depth and the number of decision trees are set to 60 and 300.
Unlike random forests, Adaboost does not treat the underlying model consistently. It picks out good models, gives them more weight, and aggregates to obtain the result. In the process, an additive model is used to linearly combine the base models. At each round of training, the weights of the base models with lower error rates are boosted, while those with higher error rates are reduced. Eventually, the model will obtain a result with better accuracy.
3. Performance of the ML Models
In the present paper, a data ratio of 60/20/20 is used in the training, validation and test of the model. The number of input datasets is 6375, from which 3110 are for leakage signals. After the models have been trained, the performances will be evaluated with the indicators shown in Table 1.
The confusion matrix in the validation of the decision tree model is shown in Figure 5. The evaluation indicators of the ML model are as follows: Precision = 90.2%; Training accuracy = 99.96%; Validation accuracy = 90.91%; Recall rate = 94.69%; F1_score = 0.9239; and False Positive Rate = 9.8%. Overall, the decision tree model can achieve a good classification performance. The recall rate represents the ability of the model to pick out the leakage signals, while the false positive rate refers to the degree to which non-leakage signals are misjudged as leakage signals. When the non-leakage signal is misjudged, it is likely to bring about unnecessary excavation expenses and manpower losses. Therefore, in view of the leak detection operations of the WDS, the recall rate is more suitable for measuring the accuracy of leak detection. Meanwhile, the false positive rate is more suitable for measuring the loss caused by the misjudgment of the model. A high recall rate and a low false positive rate are required.
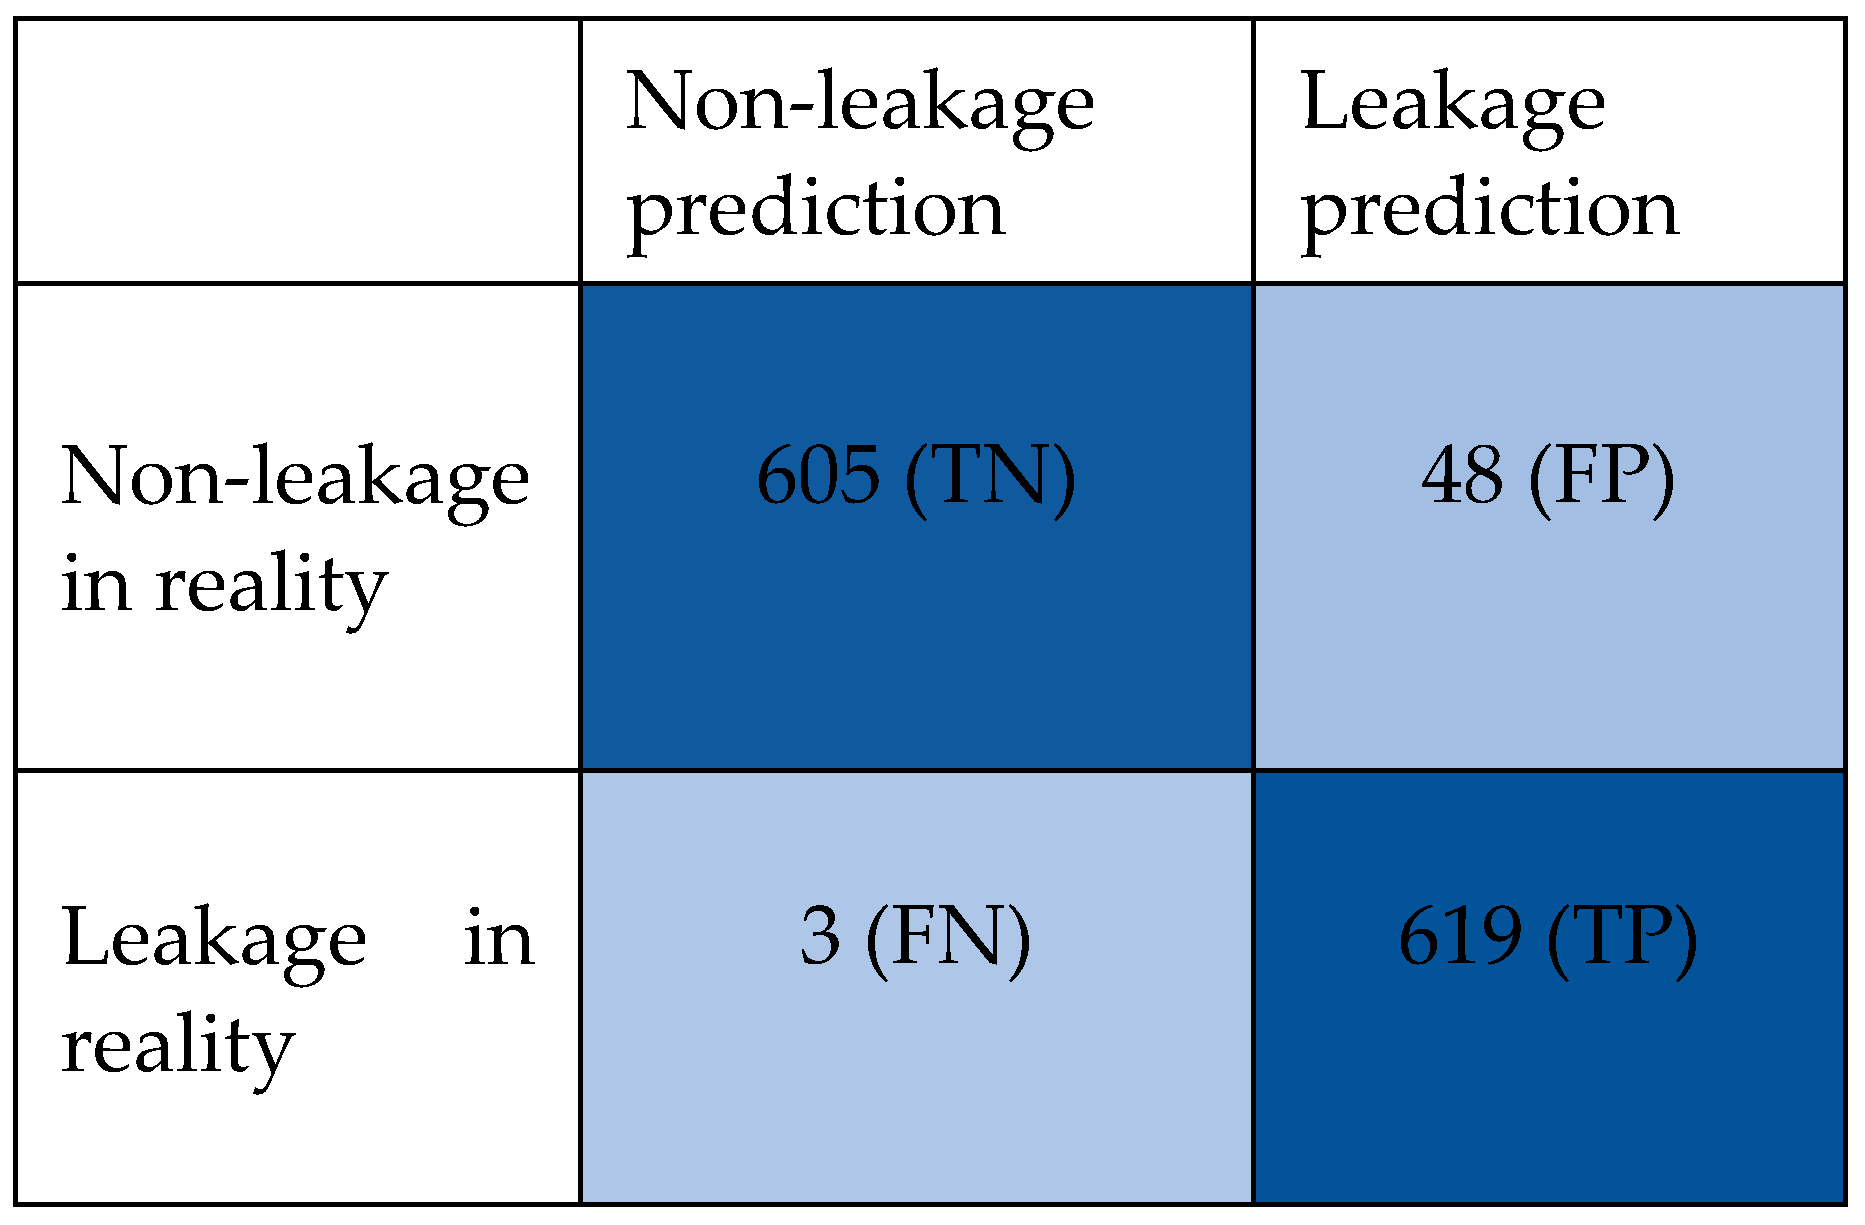
Figure 6 shows the confusion matrix in the validation of the random forest model. The obtained evaluation indicators are: Precision = 92.01%; Training accuracy = 99.82%; Validation accuracy = 95.27%; Recall rate = 100%; F1_score = 0.9584; and False Positive Rate = 8.27%. In general, the random forest has a higher precision of 92.01% than the decision tree model, implying that the overall classification accuracy of the random forest is better. An F1_score closer to one shows a higher robustness, which illustrates a better ML model. The most important feature is that the random forest model has a high recall rate of 100% and a low false positive rate of 8.27%.
Figure 7 shows the confusion matrix in the validation of the Adaboost model. The evaluation indicators are calculated as: Precision = 92.8%; Training accuracy = 99.96%; Validation accuracy = 95.8%; Recall rate = 99.52%; F1_score = 0.9604; and False Positive Rate = 7.35%. Note that, among the three models, the Adaboost model has the highest Precision, Validation accuracy, and F1_score, and the lowest False Positive Rate. Therefore, the Adaboost model has the best performance and robustness. Although the recall rate of the Adaboost model is lower than that of the random forest model, both rates are very close.
The evaluation indicators of the three ML models are compared in Table 2.
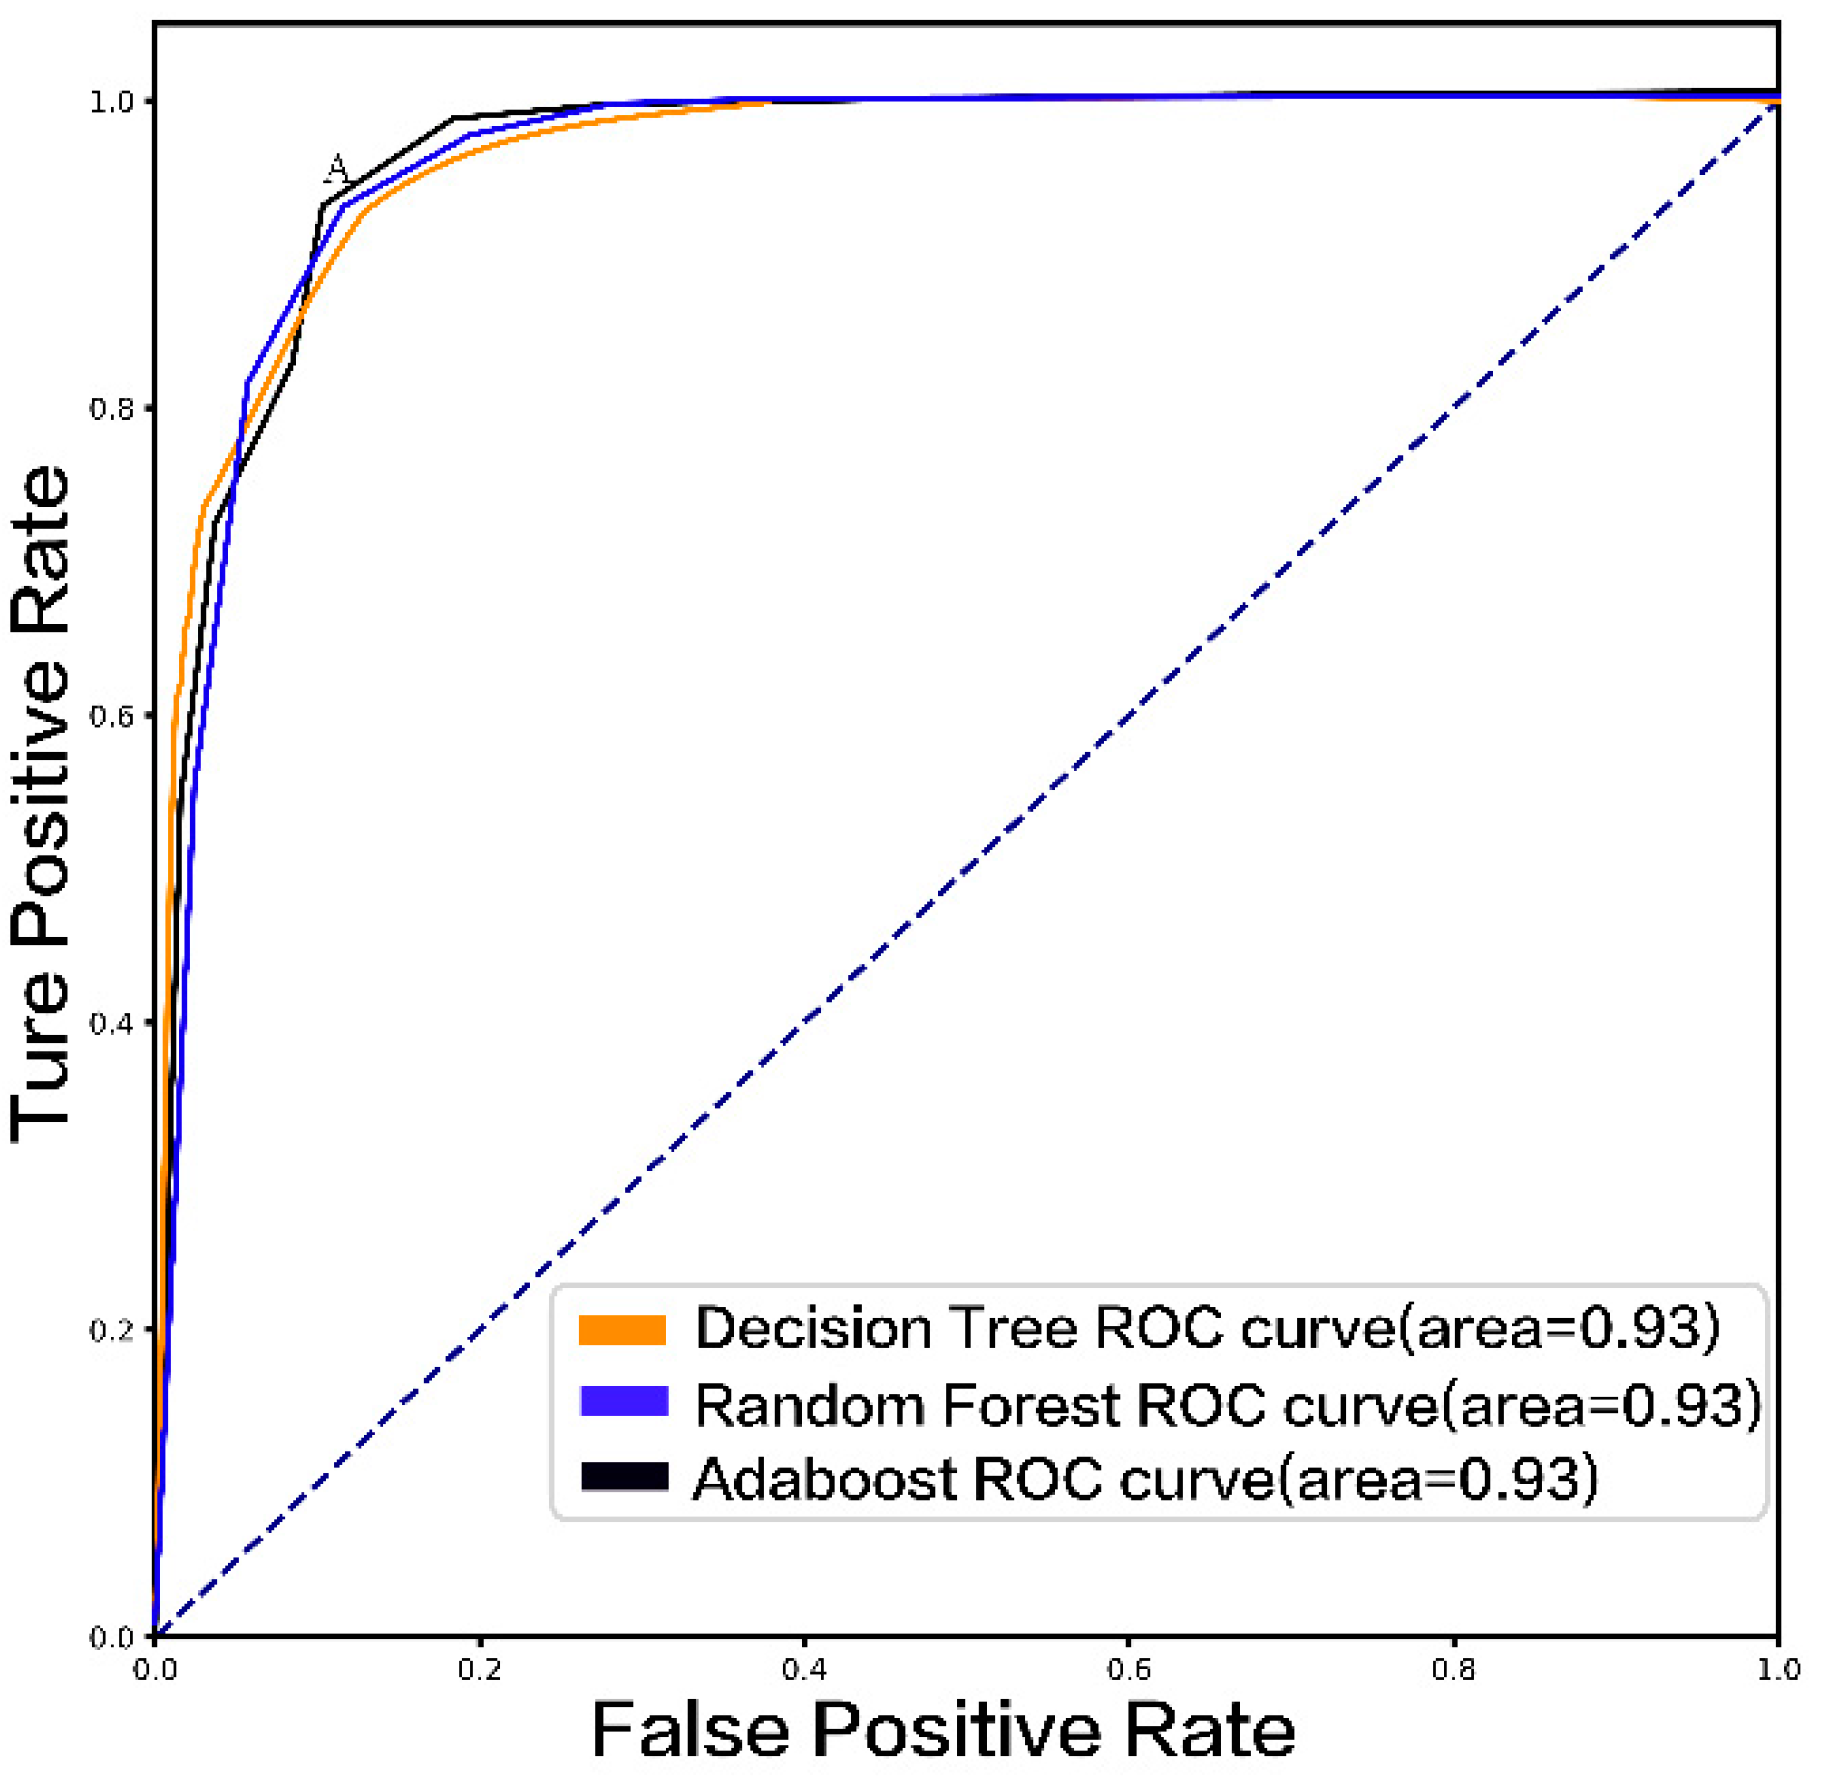
The ROC curves of the three ML models are illustrated in Figure 8. As shown, all of the areas enclosed by the ROC curves of the three models are 0.93. It is clear that all three of the classifiers are very good.
4. Conclusions
An intelligent identification method is developed for the WDS leakage detection based on ML models such as the decision tree, the random forest, and the Adaboost. During the process, on-site acoustic emission signals in Hangzhou, Shaoxing, Shanghai, and many other cities and regions in Jiangsu, Zhejiang, and Shanghai were used to extract feature sets. Extensive on-site work was carried out, and tens of thousands of detection signals were collected. More than 6000 groups of these data were marked. In this paper, 3110 sets of leakage signals and 3270 sets of non-leakage signals were used in the model training. Based on a statistical analysis of the signal characteristics, features such as the dominant frequency, the spectral flatness, the spectral roll-off rate, and 1-D MFCC are considered to be able to effectively discriminate between leakage and non-leakage signals. After careful analysis of the leak detection requirements, the indicators of the recall rate and false positive rate were selected to evaluate the performance of the models. A higher recall rate and a lower false positive rate are always required. These rates imply that the most leak signals were picked out, and the fewest non-leak signals were misjudged. Overall, the performances of the random forest and the Adaboost models are better than the decision tree. The recall rates of the random forest and the Adaboost models are 100% and 99.52%, which are higher than the recall rate of the decision tree model of 94.69%. The false positive rates of the three models are all lower than 10%, while the Adaboost model has the lowest false positive rate of 7.35%. Based on the results of this paper, all three models can assist and even replace manual work in leak detection operations, among which the Adaboost model has the best performance.
Author Contributions
Conceptualization, W.C. and Y.S.; Methodology, Y.S.; Software, Y.S.; Validation, Y.S.; Formal Analysis, Y.S.; Investigation, Y.S.; Resources, W.C.; Data Curation, W.C.; Writing—Original Draft Preparation, Y.S.; Writing—Review and Editing, W.C. All authors have read and agreed to the published version of the manuscript.
Funding
This study has been financially supported by Zhejiang Key Research and Development Program (2021C03017).
Institutional Review Board Statement
Not applicable.
Informed Consent Statement
Not applicable.
Data Availability Statement
Not applicable.
Conflicts of Interest
The authors declare no conflict of interest.
References
- Hongwei, L.; Mou, L.; Song, Y. The application of water quality safety evaluation for urban water supply system. In Proceedings of the World Automation Congress, Puerto Vallarta, Mexico, 24–28 June 2012; pp. 1–3. [Google Scholar]
- Kanakoudis, V.; Tsitsifli, S. Potable water security assessment—A review on monitoring, modelling and optimization techniques, applied to water distribution networks. Desalination Water Treat. 2017, 99, 18–26. [Google Scholar] [CrossRef]
- Zhou, Z.-J.; Hu, C.-H.; Yang, J.-B.; Xu, D.-L.; Zhou, D.-H. Online updating belief rule based system for pipeline leak detection under expert intervention. Expert Syst. Appl. 2009, 36, 7700–7709. [Google Scholar] [CrossRef]
- Mandal, S.K.; Chan, T.S.; Tiwari, M.K. Leak detection of pipeline: An integrated approach of rough set theory and artificial bee colony trained SVM. Expert Syst. Appl. 2012, 39, 3071–3080. [Google Scholar] [CrossRef]
- Liu, Y.; Ma, X.; Li, Y.; Tie, Y.; Zhang, Y.; Gao, J. Water Pipeline Leakage Detection Based on Machine Learning and Wireless Sensor Networks. Sensors 2019, 19, 5086. [Google Scholar] [CrossRef] [PubMed]
- Qu, Z.; Feng, H.; Zeng, Z.; Zhuge, J.; Jin, S. A SVM-based pipeline leakage detection and pre-warning system. Measurement 2010, 43, 513–519. [Google Scholar] [CrossRef]
- Gao, Y.; Brennan, M.; Joseph, P.; Muggleton, J.; Hunaidi, O. On the selection of acoustic/vibration sensors for leak detection in plastic water pipes. J. Sound Vib. 2005, 283, 927–941. [Google Scholar] [CrossRef]
- El-Zahab, S.; Asaad, A.; Abdelkader, E.M.; Zayed, T. Collective thinking approach for improving leak detection systems. Smart Water 2017, 2, 3. [Google Scholar] [CrossRef]
- Yu, L.; Li, S. Acoustic emission (AE) based small leak detection of galvanized steel pipe due to loosening of screw thread connection. Appl. Acoust. 2017, 120, 85–89. [Google Scholar] [CrossRef]
- Fan, H.; Tariq, S.; Zayed, T. Acoustic leak detection approaches for water pipelines. Autom. Constr. 2022, 138, 104226. [Google Scholar] [CrossRef]
- Xiao, R.; Hu, Q.; Li, J. Leak detection of gas pipelines using acoustic signals based on wavelet transform and Support Vector Machine. Measurement 2019, 146, 479–489. [Google Scholar] [CrossRef]
- Quy, T.B.; Kim, J.-M. Leak detection in a gas pipeline using spectral portrait of acoustic emission signals. Measurement 2020, 152, 107403. [Google Scholar] [CrossRef]
- Banjara, N.K.; Sasmal, S.; Voggu, S. Machine learning supported acoustic emission technique for leakage detection in pipelines. Int. J. Press. Vessel. Pip. 2020, 188, 104243. [Google Scholar] [CrossRef]
- Rahimi, M.; Alghassi, A.; Ahsan, M.; Haider, J. Deep Learning Model for Industrial Leakage Detection Using Acoustic Emission Signal. Informatics 2020, 7, 49. [Google Scholar] [CrossRef]
- Song, Y.; Li, S. Gas leak detection in galvanised steel pipe with internal flow noise using convolutional neural network. Process Saf. Environ. Prot. 2021, 146, 736–744. [Google Scholar] [CrossRef]
- Kampelopoulos, D.; Papastavrou, G.N.; Kousiopoulos, G.P.; Karagiorgos, N.; Goudos, S.K.; Nikolaidis, S. Machine Learning Model Comparison for Leak Detection in Noisy Industrial Pipelines. In Proceedings of the 2020 9th International Conference on Modern Circuits and Systems Technologies (Mocast), Bremen, Germany, 7–9 September 2020. [Google Scholar]
- Tariq, S.; Bakhtawar, B.; Zayed, T. Data-driven application of MEMS-based accelerometers for leak detection in water distribution networks. Sci. Total Environ. 2022, 809, 151110. [Google Scholar] [CrossRef] [PubMed]
- Herre, J.; Allamanche, E.; Hellmuth, O. Robust matching of audio signals using spectral flatness features. In Proceedings of the 2001 IEEE Workshop on the Applications of Signal Processing to Audio and Acoustics (Cat. No. 01TH8575), New Platz, NY, USA, 24 October 2001. [Google Scholar]
- Kos, M.; Kai, Z.; Vlaj, D. Acoustic classification and segmentation using modified spectral roll-off and variance-based features. Digit. Signal Process. 2013, 23, 659–674. [Google Scholar] [CrossRef]
- Muda, L.; Begam, M.; Elamvazuthi, I. Voice Recognition Algorithms using Mel Frequency Cepstral Coefficient (MFCC) and Dynamic Time Warping (DTW) Techniques. arXiv 2010, arXiv:1003.4083. [Google Scholar]
- Choi, J.; Gu, B.; Chin, S.; Lee, J.-S. Machine learning predictive model based on national data for fatal accidents of construction workers. Autom. Constr. 2020, 110, 102974. [Google Scholar] [CrossRef]
Figure 1.
The procedure of leak data analysis.

Figure 2.
The picture of on-site tests.

Figure 3.
Evaluation with recall rate.

Figure 4.
Evaluation with F1 value.

Figure 5.
The confusion matrix of the decision tree model.

Figure 6.
The confusion matrix of the random forest model.
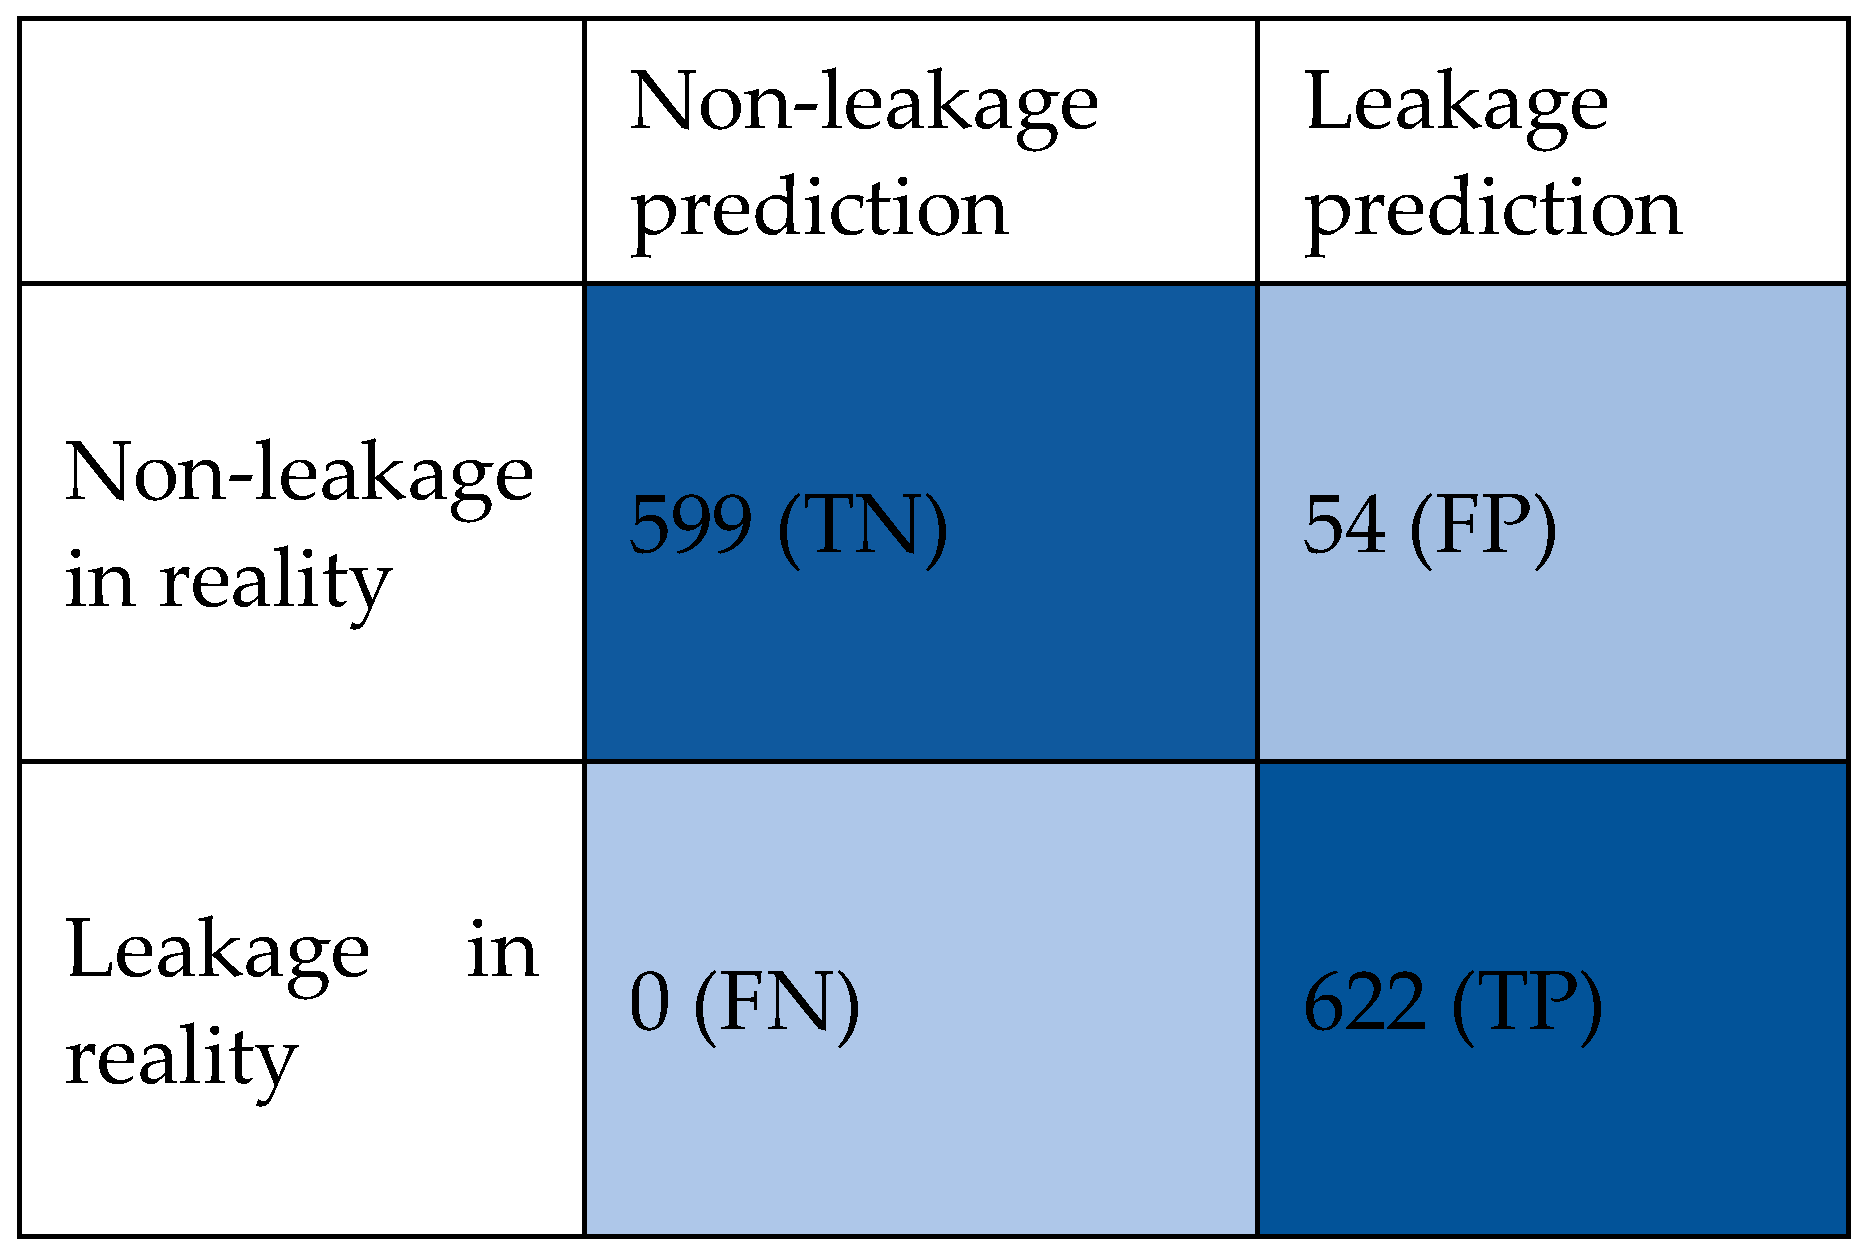
Figure 7.
The confusion matrix of the Adaboost model.

Figure 8.
The ROC curves of the three ML models.


Table 1.
Index meanings in model performance evaluation.
| Name | Meaning |
|---|---|
| TN | Non-leakage both in reality and in prediction |
| FP | Non-leakage in reality but leakage in prediction |
| FN | Leakage in reality but non-leakage in prediction |
| TP | Leakage both in reality and in prediction |
| Precision | |
| Training accuracy | in training |
| Validation accuracy | in validation |
| Recall rate | |
| F1_score | |
| False Positive Rate |
Table 2.
Comparison of the three ML models for leak detection of the WDS.
| Training Accuracy | Validation Accuracy | Precision | Recall Rate | False Positive Rate | F1_Score | |
|---|---|---|---|---|---|---|
| Decision Tree | 99.96% | 90.91% | 90.20% | 94.69% | 9.80% | 0.9239 |
| Random Forest | 99.82% | 95.27% | 92.01% | 100% | 8.27% | 0.9584 |
| Adaboost | 99.96% | 95.80% | 92.80% | 99.52% | 7.35% | 0.9604 |
Publisher’s Note: MDPI stays neutral with regard to jurisdictional claims in published maps and institutional affiliations. |
© 2022 by the authors. Licensee MDPI, Basel, Switzerland. This article is an open access article distributed under the terms and conditions of the Creative Commons Attribution (CC BY) license (https://creativecommons.org/licenses/by/4.0/).
Share and Cite
MDPI and ACS Style
Shen, Y.; Cheng, W. A Tree-Based Machine Learning Method for Pipeline Leakage Detection. Water 2022, 14, 2833. https://doi.org/10.3390/w14182833
AMA Style
Shen Y, Cheng W. A Tree-Based Machine Learning Method for Pipeline Leakage Detection. Water. 2022; 14(18):2833. https://doi.org/10.3390/w14182833
Chicago/Turabian StyleShen, Yongxin, and Weiping Cheng. 2022. "A Tree-Based Machine Learning Method for Pipeline Leakage Detection" Water 14, no. 18: 2833. https://doi.org/10.3390/w14182833
Note that from the first issue of 2016, this journal uses article numbers instead of page numbers. See further details here.