Article

Numerical Investigation of Wave Run-Up and Load on Fixed Truncated Cylinder Subjected to Regular Waves Using OpenFOAM

1
Key Laboratory of Far-Shore Wind Power Technology of Zhejiang Province, Hangzhou 311122, China
2
Powerchina Huadong Engineering Corporation Limited, Hangzhou 311122, China
3
Lu Xun Academy of Fine Arts, Dalian 116650, China
4
State Key Laboratory of Coastal and Offshore Engineering, Dalian University of Technology, Dalian 116024, China
*
Author to whom correspondence should be addressed.
Water 2022, 14(18), 2830; https://doi.org/10.3390/w14182830
Submission received: 19 July 2022 / Revised: 29 August 2022 / Accepted: 8 September 2022 / Published: 11 September 2022
(This article belongs to the Special Issue Wave–Structure Interaction)

Abstract

:
In the interaction between waves and structures, the maximum wave run-up height on the surface of the structure and the wave field distribution around the cylinder are important factors to be considered in the design of marine structures. In this paper, the open source software OpenFOAM is used to simulate the wave run-up phenomenon of a truncated cylinder under regular waves by solving the Reynolds-averaged Navier–Stokes equation. The established numerical model is verified with the experimental data, and the good consistency demonstrates the accuracy in simulating the interaction between waves and fixed truncated cylinders. The numerical results show that the draft of the cylinder under regular waves has little effect on its maximum wave run-up height, but has a significant effect on the horizontal wave force. At the same wave steepness, the radial dimensionless run-up height increases with the increase of scattering parameters ka, where k is the wave number and a is the cylinder radius. The radial run-up height decreases gradually along the radial direction in the upstream, and increases gradually along the radial direction in the downstream.

1. Introduction

Wave run-up and wave load of offshore structures are important factors that need to be considered in the design of offshore structures. For example, regarding offshore oil platforms and wind turbines, it is necessary to accurately evaluate the wave run-up amplification height around the structure caused by incident waves, so as to avoid the impact of waves on deck or wind turbine appendages, and thus prevent structural failure. Past works have revealed that amplification of incident waves (regular or irregular) may cause the water body to slap the structure, generating large horizontal forces, uplift forces, and overturning moments [1,2,3]. Especially for the platform supported by the column, the wave run-up effect along the wave facing surface of the column will greatly increase the risk of strong nonlinear slamming or even green water. In order to avoid potential damage, a variety of load conditions should be considered in the design of the structure. For the floating structure, both horizontal and vertical wave forces should be paid attention. For the fixed cylinder, the horizontal wave force is much larger than the vertical wave force, which shows an order of magnitude difference [4,5]. Therefore, only the horizontal wave force of the fixed cylinder structure is studied in this paper.
Interaction between waves and simple structures can be solved by analytical or semi-analytical solutions. Based on the linear diffraction theory, McCamy and Fuchs [6] investigated the wave field around the vertical monopile, but the linear diffraction theory is only highly effective for little wave steepness. Kim and Hue [7], Kriebel [8], and Martin et al. [9] extended the theory of linear diffraction to second order, increasing the accuracy of the model. Model tests and numerical simulations are needed to analyze the interaction between waves and complex structures, such as high order problems. Hallermeier [10] assumed that the water particle was forced to rise above the wave crest about u 2 / 2 g along the surface of the cylinder (wherein u is the maximum horizontal velocity of the water quality point at the wave crest, and g is the acceleration of gravity), and the kinetic energy was converted into potential energy. Based on this, a semi-empirical formula for the velocity stagnation head was proposed to estimate the maximum wave run-up height of the cylinder. This formula was then corrected by a series of wave run-up tests for a fixed vertical cylinder [11]. Bonakdar et al. [12] used relative water depth, relative wave height, and slenderness ratio as the control parameters of relative wave run-up ratio, integrated multiple sets of experimental data, and used an M5 model tree and nonlinear regressive technique to fit the single pile run-up formula under wide range wave conditions (shallow water, medium water depth, and deep water). Limited by experimental conditions, the numerical model of the wave–structure interaction based on potential flow theory has been widely used in ocean engineering. Through frequency domain and time domain analysis, the time series of wave surface elevation and wave force of wave–structure interaction can be quickly obtained. Liu et al. [13] used the three-dimensional high order boundary element method to simulate the interaction between second order wave flow and a three-dimensional floating body. Wang and Wu [14] investigated the second order wave diffraction of wave and cylindrical array by the finite element method in the time domain. Ohl et al. [15] analyzed the diffraction problem of regular wave and cylindrical array, and compared the experimental, theoretical, and numerical simulation results. Abbasnia and Ghiasi [16] established the two-dimensional fully nonlinear numerical wave flume based on the NURBS (non-uniform rational B-spline) high-order finite element method to simulate the interaction between regular waves and multiple horizontal fixed cylinders. Bai et al. [17] investigated the nonlinear properties of the near-trapping phenomenon caused by regular waves interacting with cylindrical arrays using a fully nonlinear time domain model.
An important factor to be considered in the simulation of wave–structure interaction is the viscous effect. Potential flow theory ignores the existence of a fluid viscous effect, but the viscous effect cannot be ignored in some cases. For example, the potential flow solver overpredicts the local free surface height in the near collapse problem of multiple cylinders [18]. For the potential flow solver, the simulation of the highly nonlinear wave-structure interaction and the large deformation motion of the free surface have always been a great challenge, but the computational fluid dynamics (CFD) solver can well solve the above problems and obtain more accurate predictions. Xiang et al. [19] investigated the assessment of extreme wave impact on coastal decks with different geometries via the arbitrary Lagrangian–Eulerian method, and the results revealed that the ratio of the wavelength-to-deck width governs the loads on a deck, and the loads do not change after a certain value of this ratio is exceeded. Istrati et al. [20] presented a simplified methodology for the tsunami design of skewed bridges, and the performance criteria for bridges in tsunami-prone areas via the finite element method. Westphalen et al. [21] simulated interaction between a regular wave and a fixed horizontal cylinder via particle-based methods, and the numerical results showed good agreement with physical experiments. Hasanpour et al. [22] investigated the impact of Tsunami-Borne large debris flow on coastal structures via coupled particle-mesh methods (SPH-FEM). In recent years, the CFD software package OpenFOAM has become more and more popular in ocean engineering due to its open source and optional expansion, although the solving may require considerable computational resources [23]. Lara et al. [24] used OpenFOAM software and IHFOAM to simulate the interaction of a single pile, multi-pile, and a wave. The wave run-up height and force of the multi-pile and single pile were compared, and the difference in hydrodynamic force of the incident wave and the nonlinear interaction between the wave and structure were pointed out. Sun et al. [18] investigated the nonlinear interaction between regular waves and a single truncated cylinder by using the second-order frequency domain solver and CFD software OpenFOAM. The free surface elevation around the cylinder and wave force were compared with the experimental data. The accuracy and computational efficiency of the potential flow solver and the CFD solver were evaluated and compared. It is pointed out that the potential flow solver has the problem of inaccurate prediction of wave height at large wave steepness. Mohseni et al. [25] established a three-dimensional numerical wave flume based on OpenFOAM, and investigated the importance of Type-1 and Type-2 scattering waves in nonlinear amplification of wave height around a vertical fixed cylinder under different wave steepness and wave fields. Cao and Wan [26] established the viscous numerical wave flume based on OpenFOAM to simulate the wave run-up of a fixed vertical cylinder under solitary waves.
In view of the above research, this paper establishes a refined numerical wave flume based on OpenFOAM to simulate the interaction between regular waves and a fixed truncated cylinder, and investigates the variation of the maximum run-up height of a fixed truncated cylinder under regular waves and its difference with the estimation formula, the distribution of thee wave field around the cylinder, and the variation of horizontal wave force. The organization of this paper is as follows. The literature review is shown in Section 1. Numerical theory, CFD model establishment, and model validation are presented in Section 2. Section 3 presents the analysis and discussion of simulation results. The main conclusions are presented in Section 4. The future works are presented in Section 5.

2. Numerical Model and Its Validation

2.1. Governing Equation

In this paper, the open source software OpenFOAM is used to establish a numerical wave flume to simulate the interaction between waves and structures. The numerical model uses the Reynolds-averaged Navier–Stokes (RANS) equation to represent the motion of the fluid, including the mass conservation equation and the momentum conservation equation, as follows:
u i x i = 0
ρ u i t + ρ u j u i x j x j μ e f f u i x j = p * x i + F b , i + f σ , i
where ρ is the density of the mixed fluid; u i i = x , y , z is the fluid velocity component in cartesian coordinates; t is the time; p * is the excess hydrostatic pressure obtained by subtracting static pressure from total pressure; μ e f f is the effective dynamic viscosity; F b is the volume force (including the gravity); and f σ is the surface tension term. In order to close the RANS equation and avoid wave height attenuation, the stable SST turbulence equation [26] of multiphase flow modified by Larsen et al. [27,28] was used.
The volume of fluid (VOF) method is used to solve the free surface motion, and the volume fraction constant α is defined to identify the fluid volume of each element in the computational domain. The volume fraction α can be solved by the following convection equation:
α t + u i α x i + u c , i α ( 1 α ) x i = 0
where the last item on the left is the artificial compression term that limits the numerical diffusion, u c , i = m i n [ c α u i , m a x ( u i ) ] , c α is 1 in this paper.
The density of fluid ρ in the computational unit is calculated based on weighted volume fraction α . The effective dynamic viscosity μ e f f is based on the weighted volume fraction α and the additional turbulent dynamic viscosity ρ v t :
ρ = α ρ w a t e r + ( 1 α ) ρ a i r
μ e f f = α μ w a t e r + ( 1 α ) μ a i r + ρ ν t
In this paper, the wave2Foam toolbox is used for wave simulation. The velocity inlet wave generation method is used to generate waves at the inlet, and the relaxation zone is set at both ends of the flume to eliminate waves at the inlet and outlet boundaries, so as to eliminate the secondary reflection waves at the end of the flume and the structure [29].

2.2. Model Validation

2.2.1. Mesh Convergence Validation

As shown in Figure 1, a CFD model for simulating the interaction between the wave and the fixed cylinder is established. The length of the flume changes with the change of wave conditions. The overall length remains 4.5 times of the wavelength, the flume width W is 2 m ( D / W = 0.16 < 0.167 , avoiding the influence of side walls on the measurement results [30]) and the water depth d is 1.7 m. The cylinder radius a is 0.16 m, the cylinder height h is 1.28 m and the cylinder draft b is 0.64m ( b = 2 D , D is the diameter of the cylinder). The centroid of the cylinder is set at the static water surface, and the particle coordinates are x , y , z = 0 , 0 , 0 . The cylinder is located in the center of two sidewalls, which is 2.5 times the wavelength from the entrance boundary.
The left side of the numerical model calculation domain is the inlet, the right side is the outlet, the left and right walls are the slip walls, the top is the pressure outlet boundary condition, and the bottom is the fixed wall. The cylinder wall is set as the fixed wall for the fixed cylinder. The wall functions k and ω are used to control the wall region, and the dimensionless wall distance y + should be kept between 1 and 300; in this paper it is 40. On the wall, the velocity is set as the Dirichlet boundary condition ( 0   m / s in three directions), and the pressure and volume fraction are set as the Neumann boundary condition. The atmosphere conditions at the top of the computational domain are mixed Dirichlet–Newman boundary conditions for velocity, pressure, and volume fraction. The Wave2Foam toolbox is used to set boundary conditions in the inlet and outlet. Firstly, the grid convergence of the empty wave flume is verified to reduce the calculation amount under the premise of ensuring sufficient accuracy. The length of the wave flume is 20.5 m. In order to eliminate the secondary reflection at the end of the flume and the structure, the relaxation regions at the front and rear ends are set to 1 times of the wavelength (4.5 m) and 1.5 times of the wavelength (7 m), respectively. The typical wave condition ( T = 1.7   s , H = 0.071   m , d = 1.7   m ) is simulated under four different mesh schemes given in Table 1, where the time step is T / 1000 .
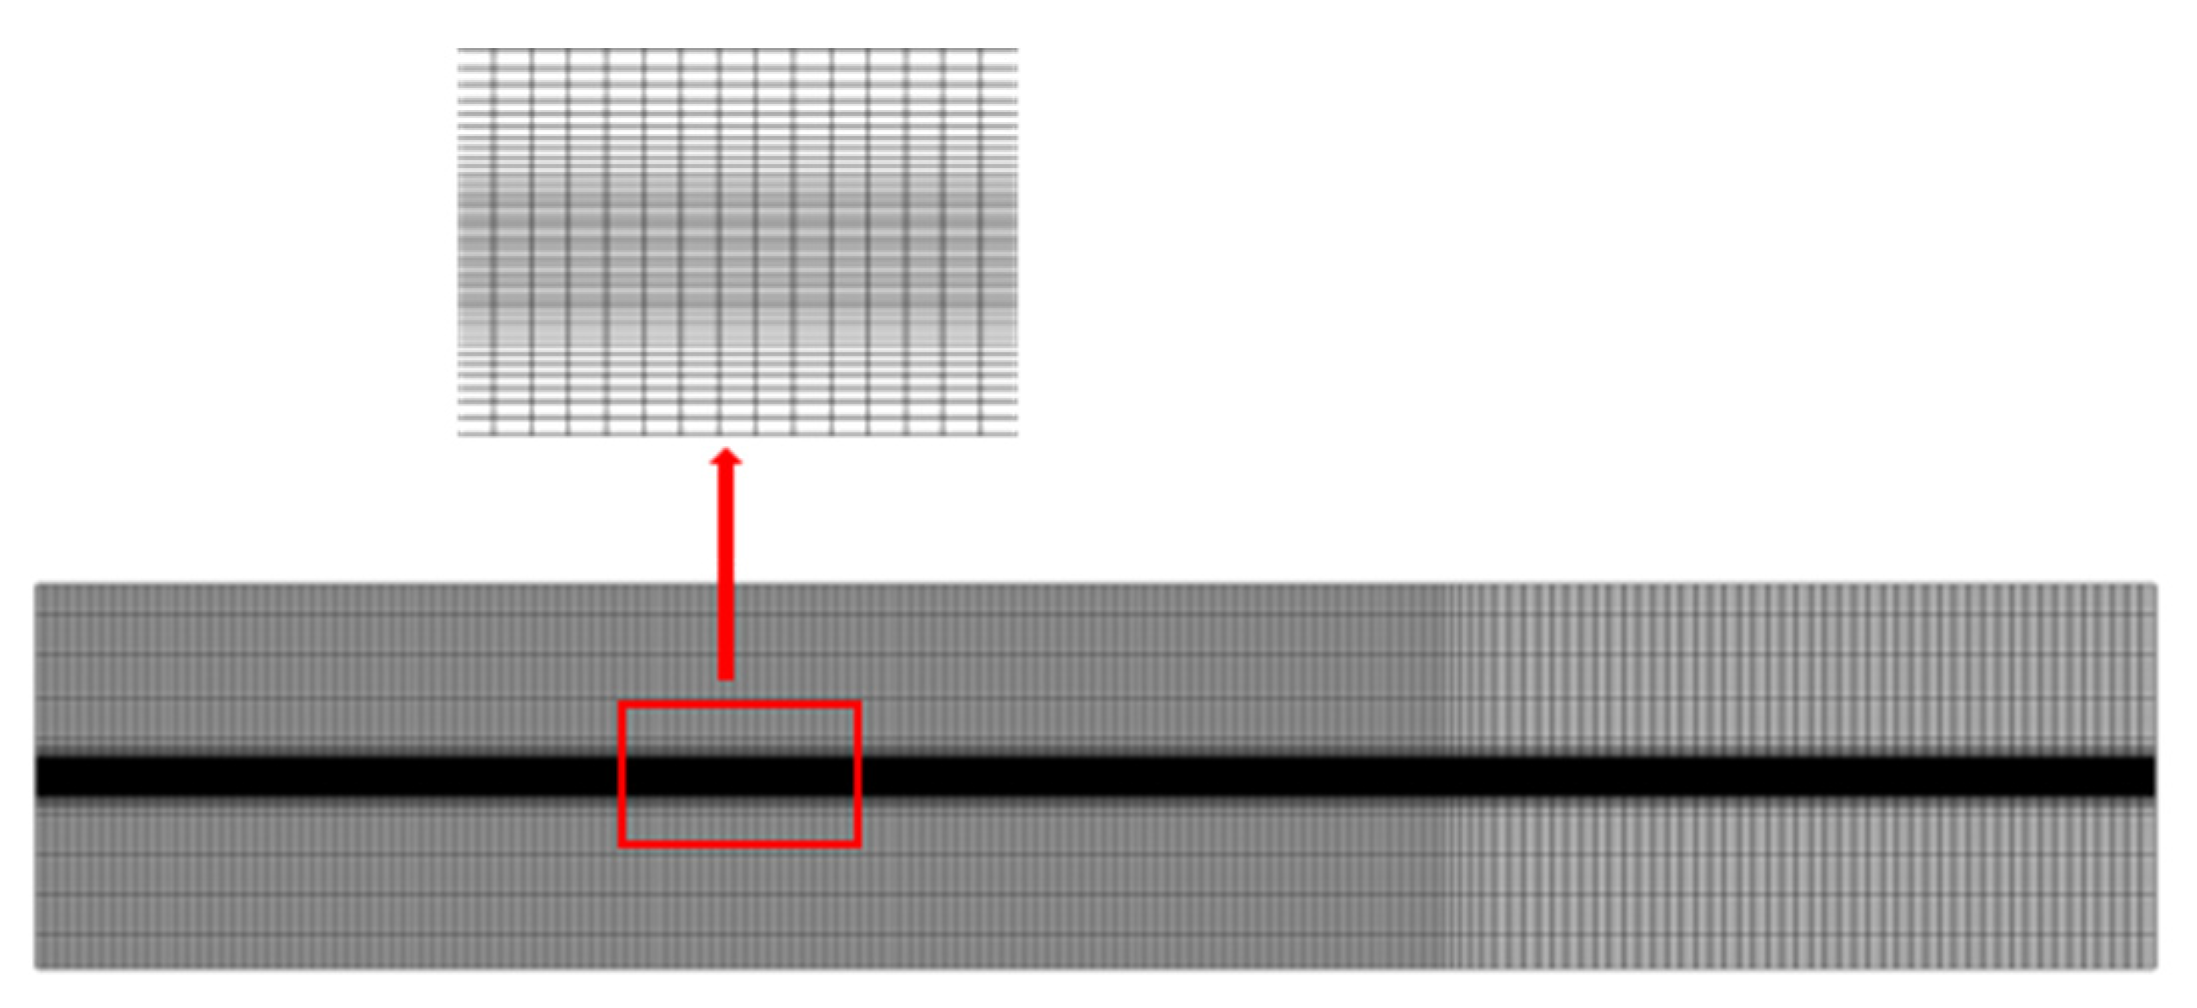
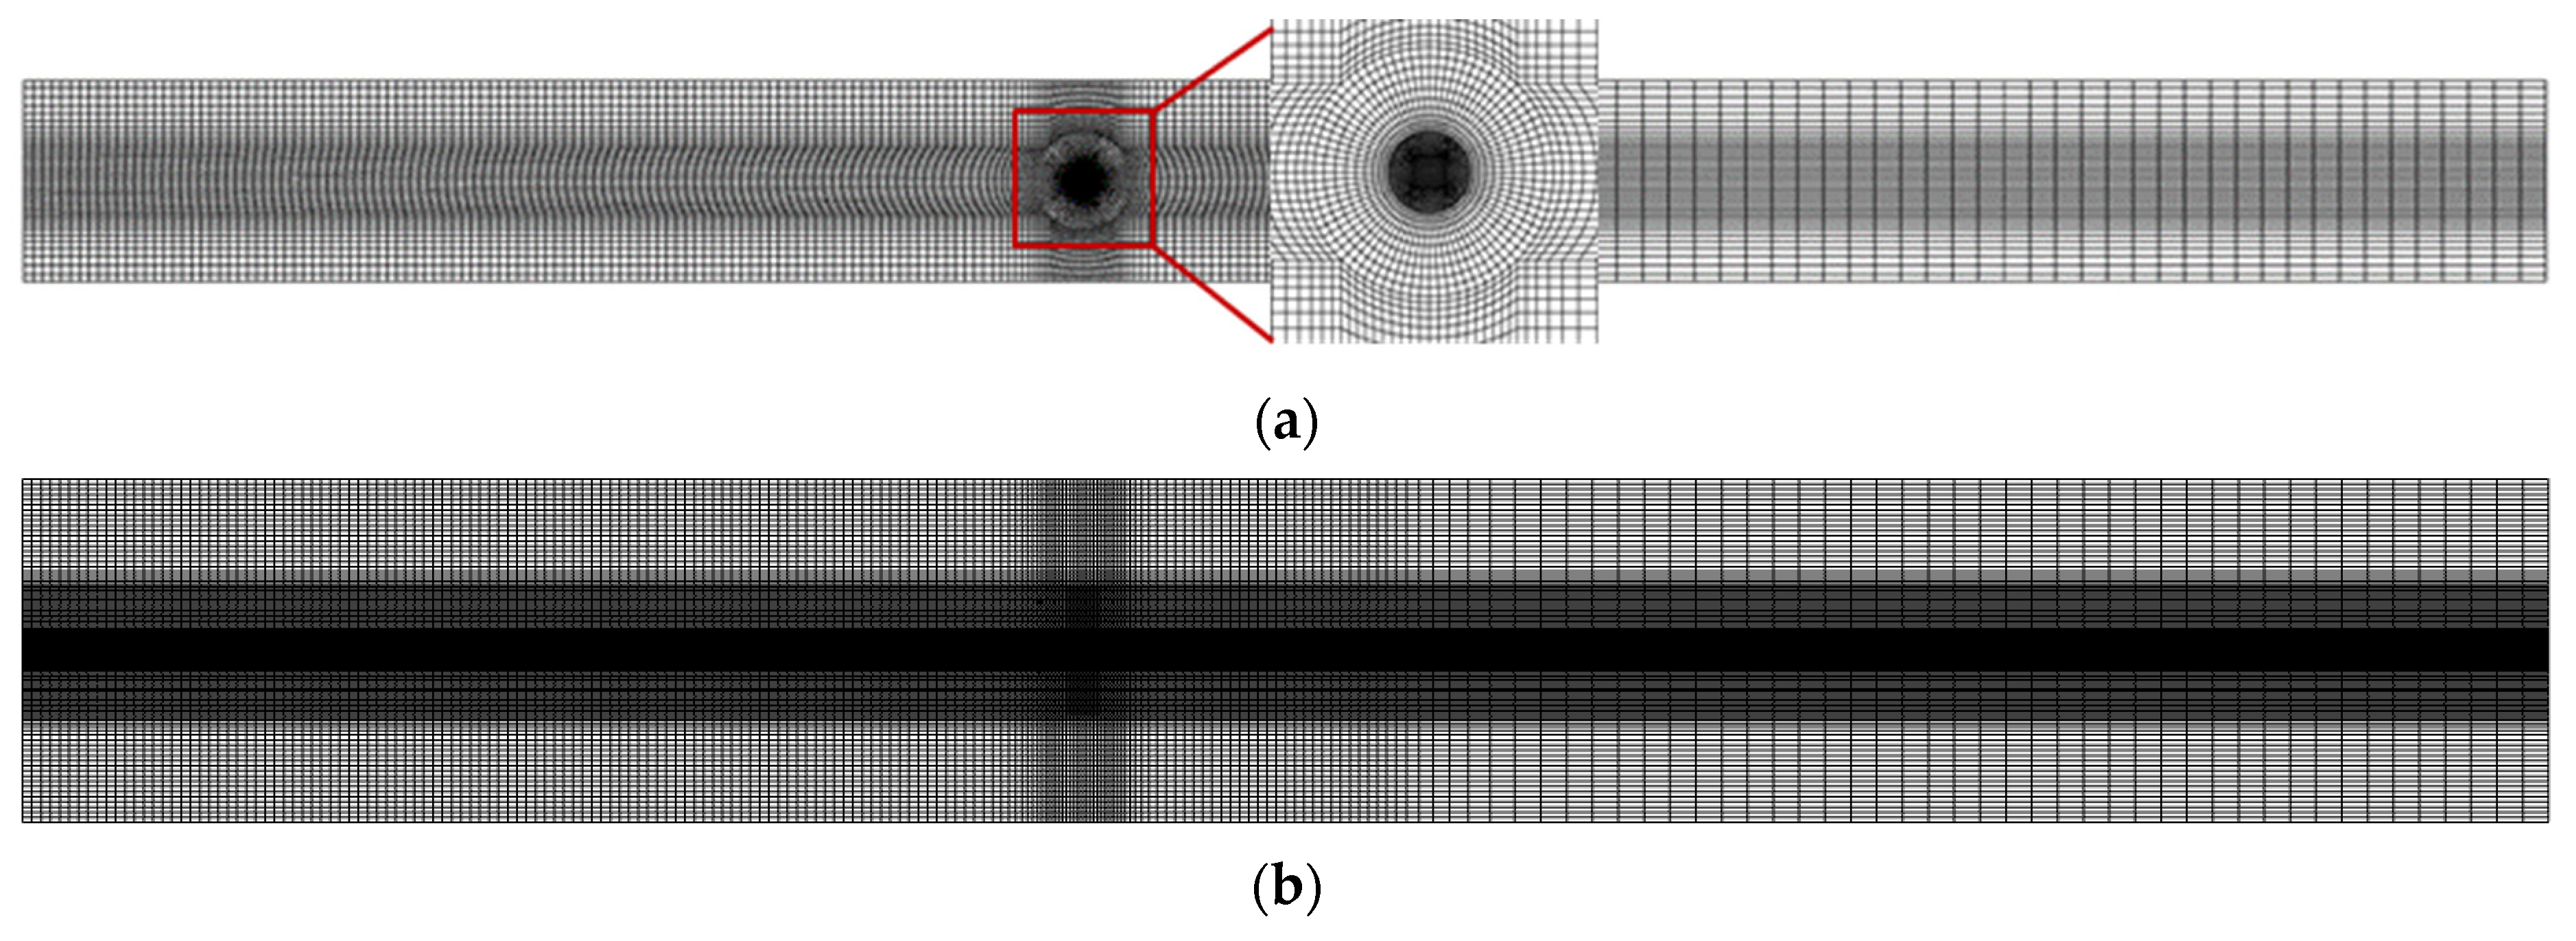
The grid division of the numerical wave flume is shown in Figure 2. In the horizontal direction, the stable wave propagation region is evenly divided into Δ x , and the growth rate is gradually sparse in the relaxation region at 1 : 1.2 . In the vertical direction, in order to accurately capture the free surface, the grid elements in the range of double wave height above and below the free surface are evenly divided into Δ z , and the grids far from the free surface are gradually sparse at the growth rate of 1 : 1.15 .
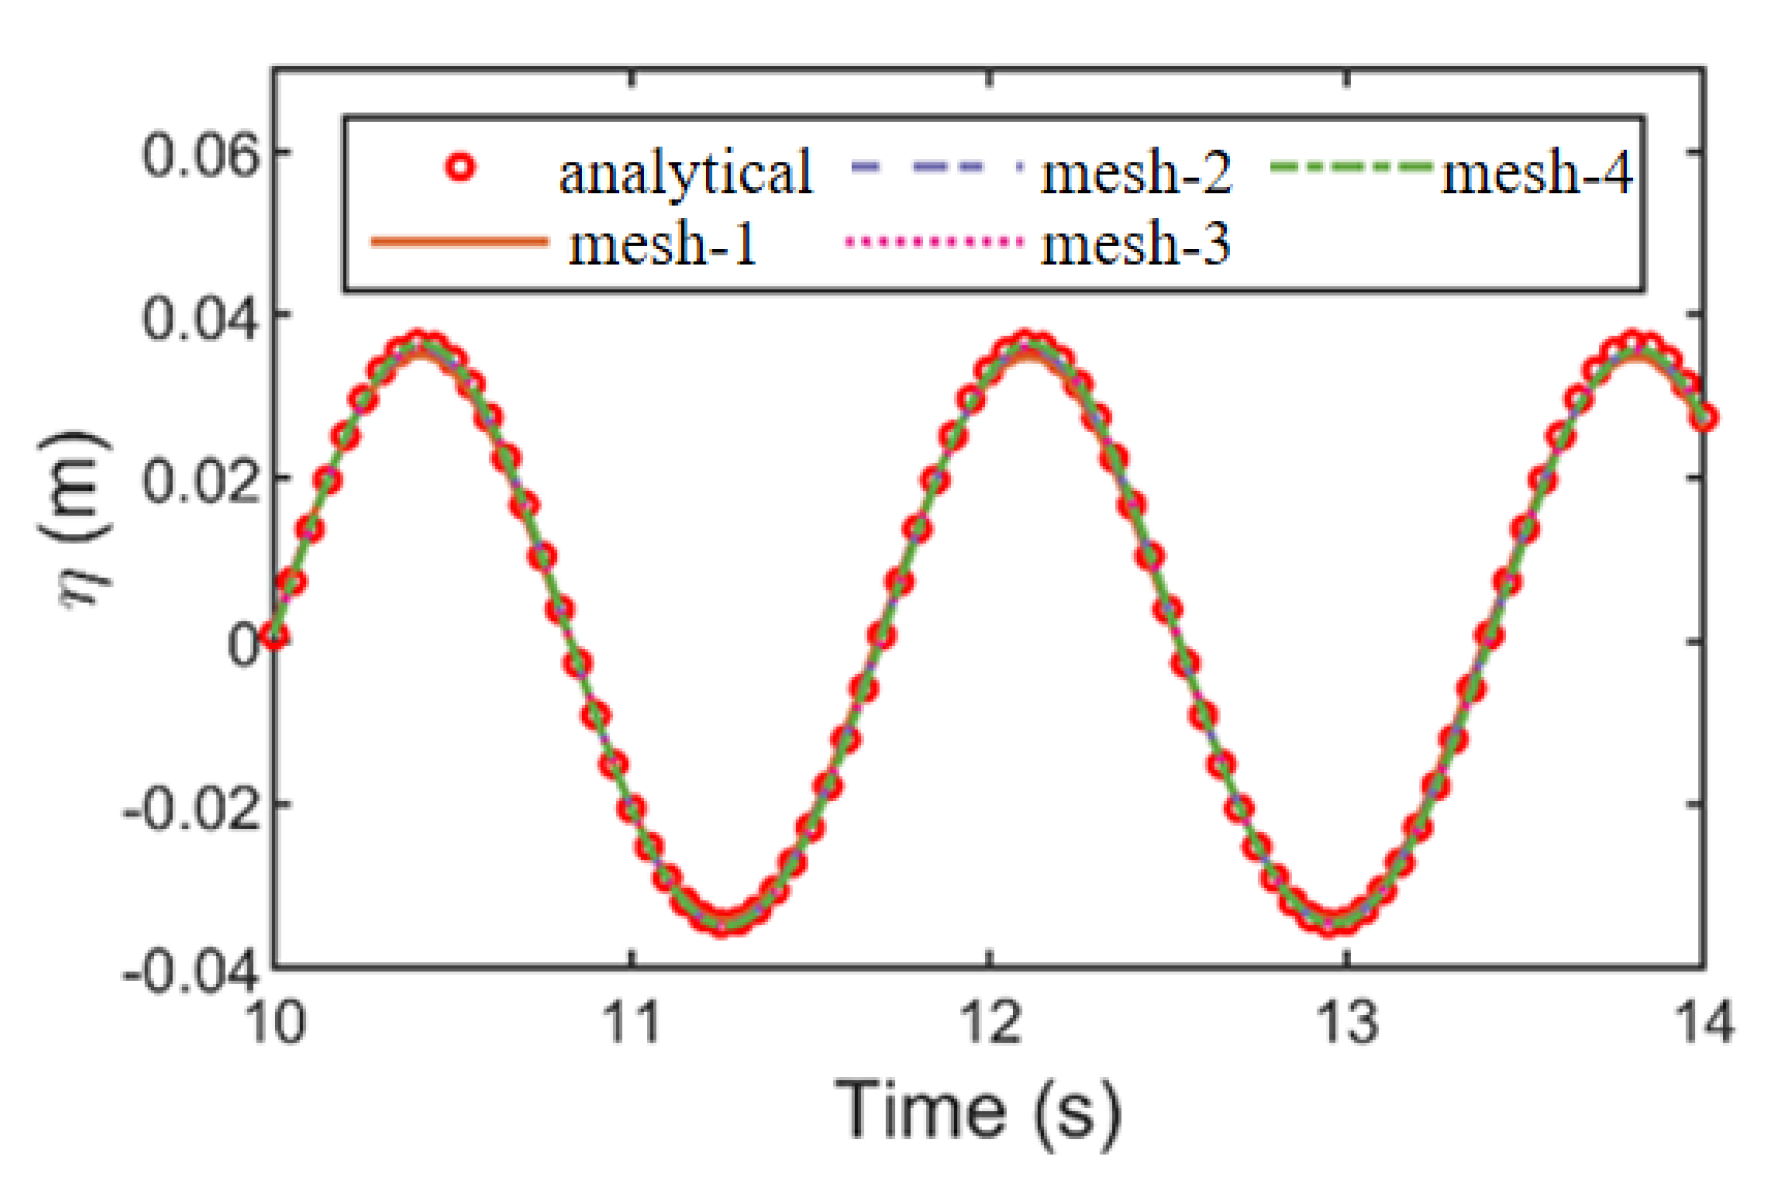
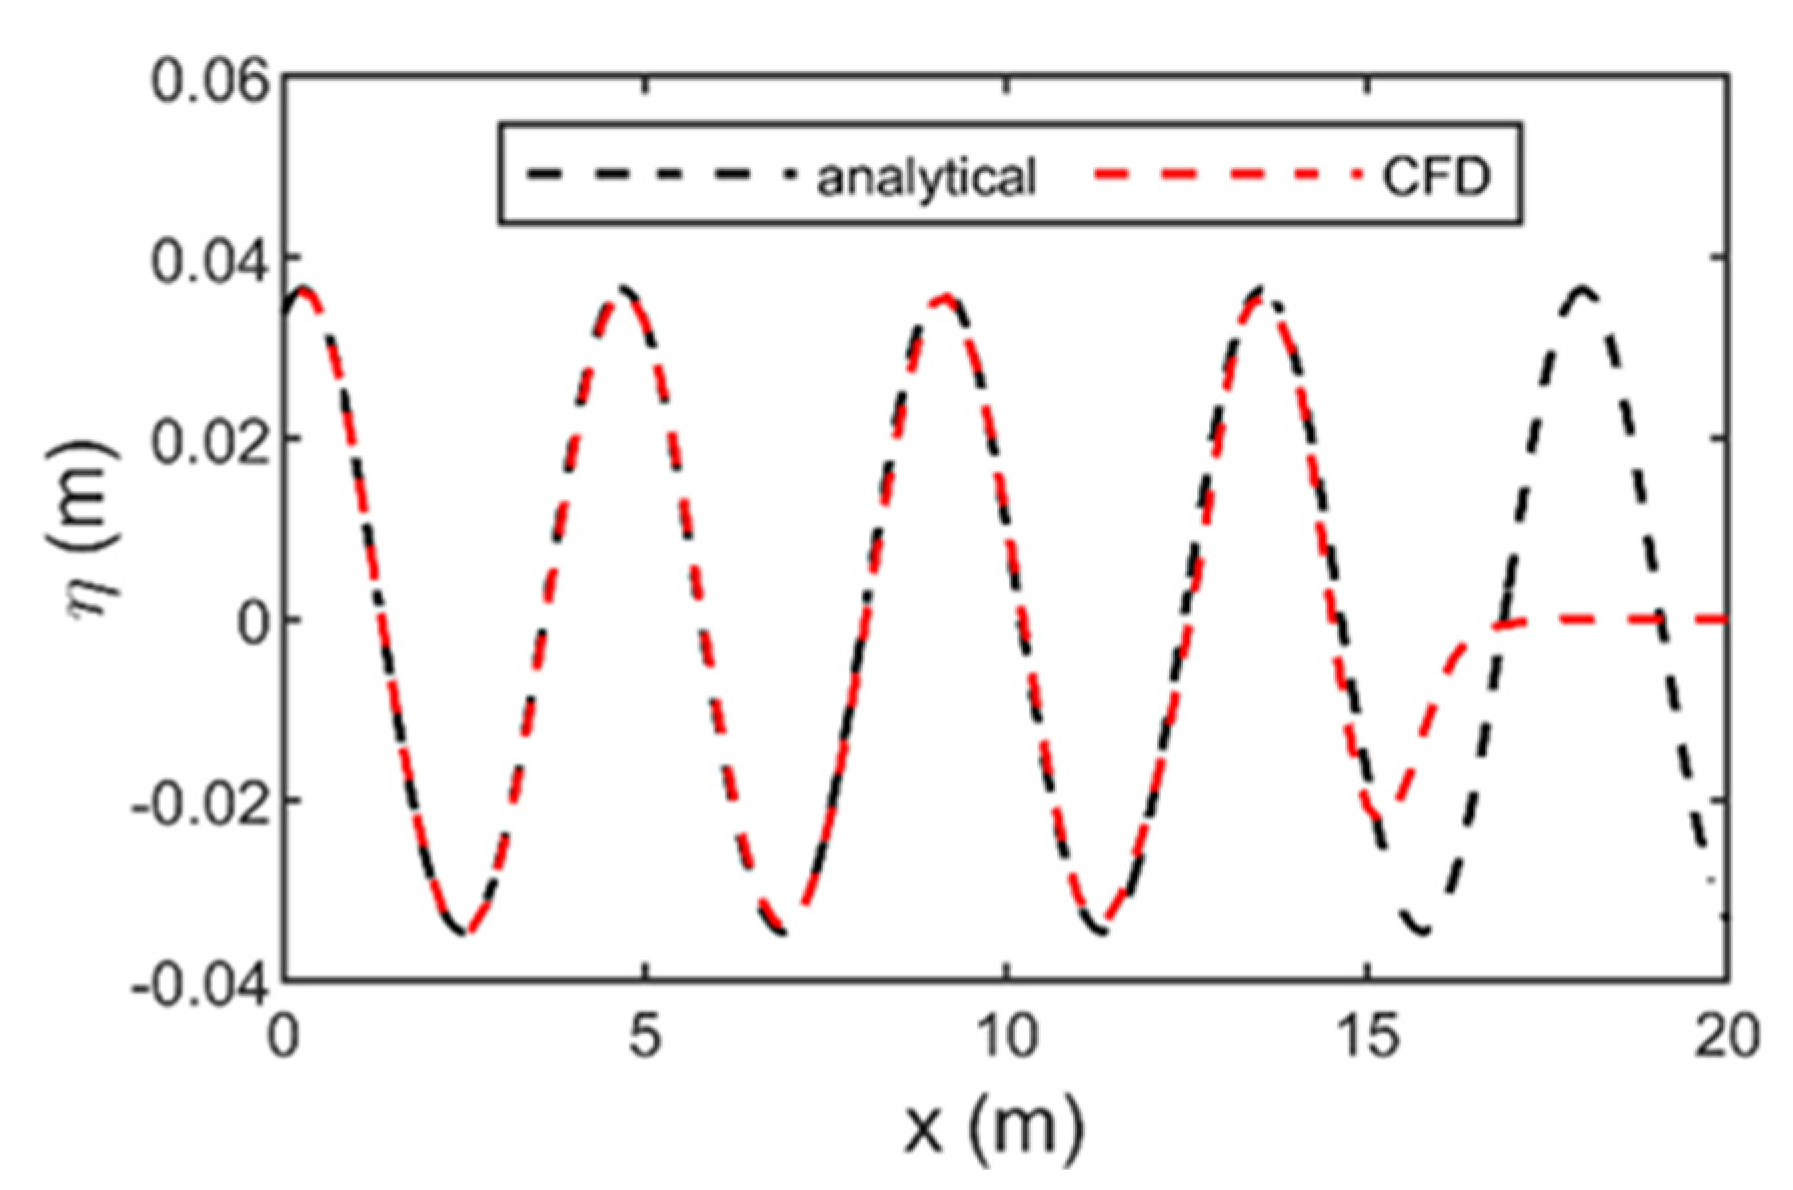
The simulation results are compared with the theoretical results. The time series of wave surface elevation is shown in Figure 3, and the wave height comparison is shown in Table 2. The results show that the wave height simulated by the second grid division scheme can achieve high accuracy. Figure 4 shows the comparison between the simulated instantaneous wave surface and the theoretical wave surface under Scheme 2. It can be seen that the simulated wave surface is basically consistent with the theoretical wave surface, and the wave absorption effect of the wave relaxation zone at the end of the flume is good. The grid division of the subsequent numerical simulation in this paper will be based on Scheme 2.

2.2.2. Validation of the Established Model

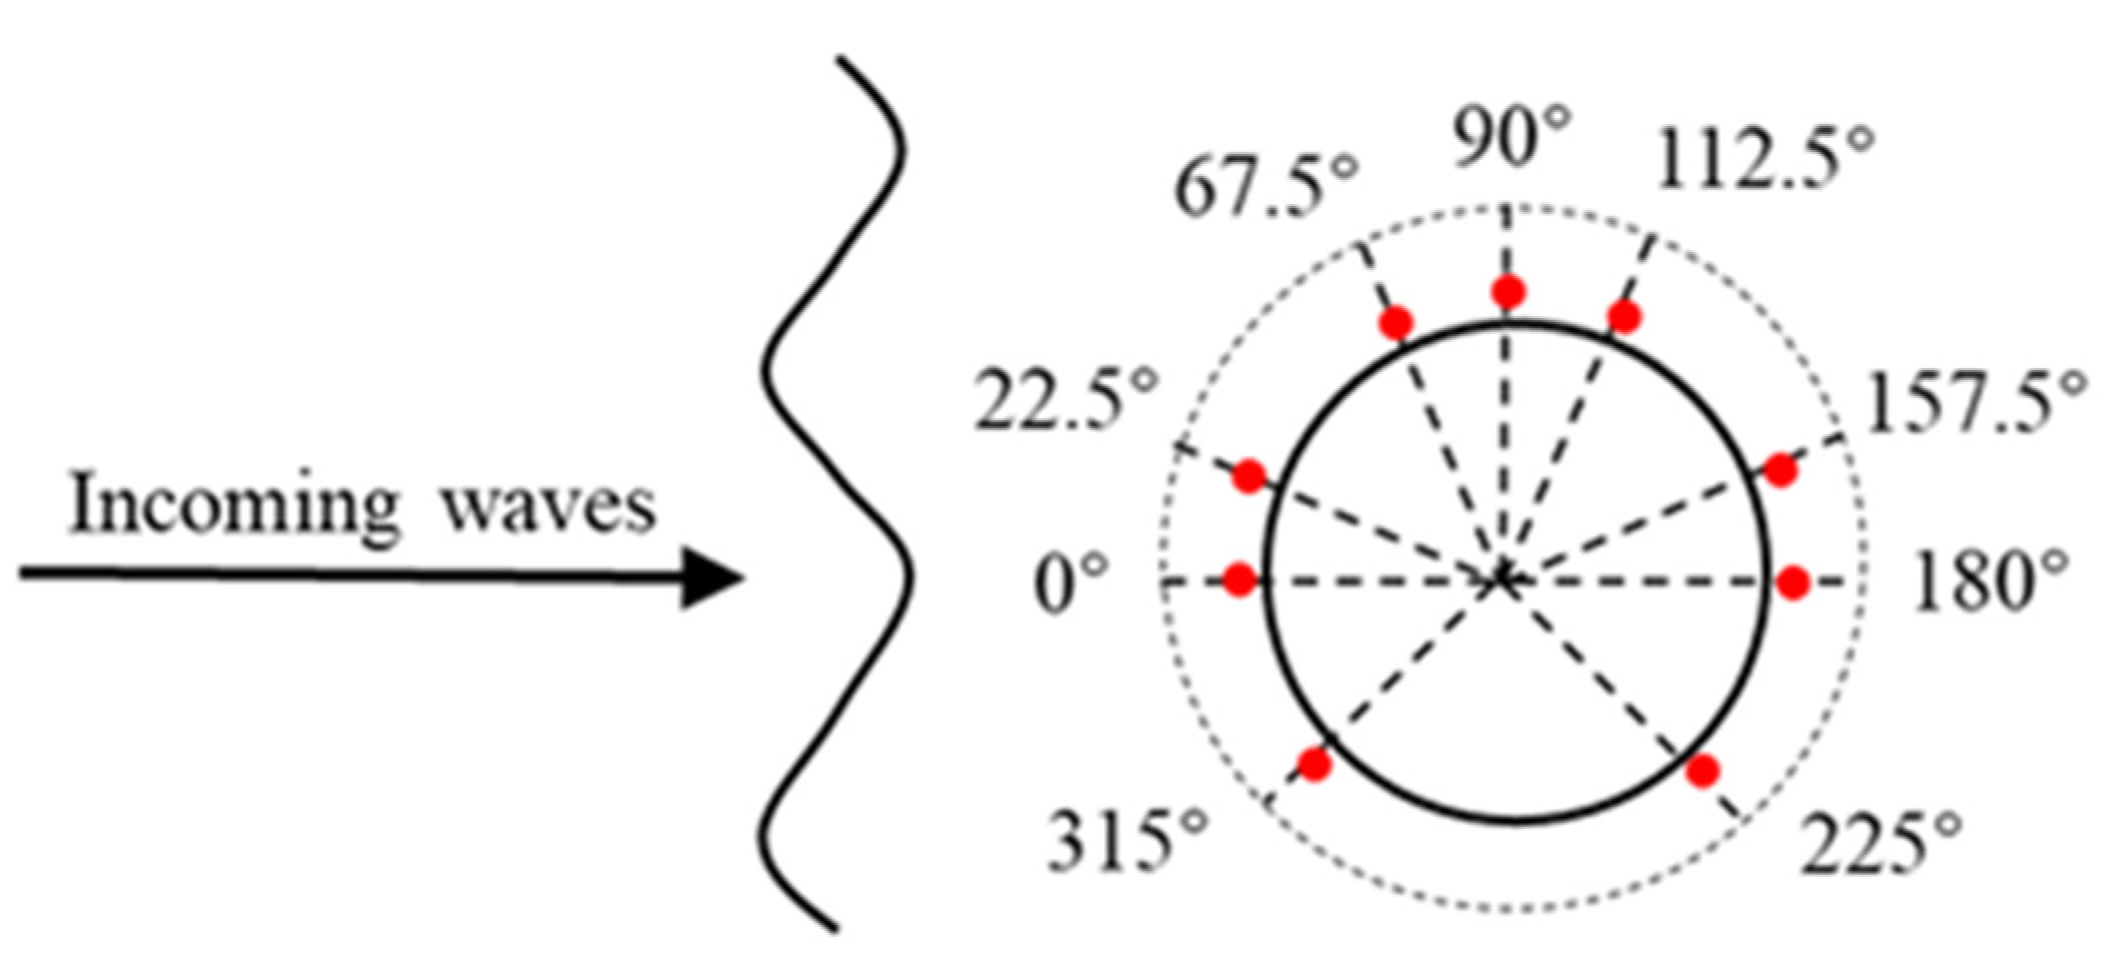
Based on the appropriate meshing scheme determined in Section 2.2.1, the interaction between wave and fixed cylinder is simulated in this section, and the results are compared with the experimental results to verify the accuracy of the CFD model to simulate the wave run-up phenomenon. As shown in Figure 5, the wave run-up of a fixed vertical cylinder was experimentally investigated by Vos et al. [11], which was conducted in a wave flume at Aalborg University, Denmark. In order to be consistent with the experiment, the dimension of the established numerical flume in Section 2.2.1 is modified, while the others are kept the same. Meanwhile, aiming to reduce the computation time, the length of the numerical flume ( L = 10   m = 4 . 5 λ ) is also reduced compared with that of the experimental flume ( L = 30   m ). The size of the numerical wave flume is: 10   m × 1.5   m × 0.8   m , and the water depth is 0.5m. The diameter and height of the cylinder are 0.12   m and 0.8   m , respectively, located at the center of the two sidewalls, and the cylinder is fixed at the bottom of water. The wave conditions used in the simulation is the fifth-order Stokes wave with wave height H = 0.12   m , period T = 1.05   s , and wave steepness k A = 0.07 ( k = 2 π / λ is the wave number, A = H / 2 is the wave amplitude). Euler discretization is used for the time term, center discretization is used for the pressure gradient and dissipation terms, and the maximum Courant number is set to 1. Figure 6 shows the arrangement of numerical wave height measuring points, and nine measuring points are set on the surface of the cylinder to monitor the time series of wave run-up around the cylinder.
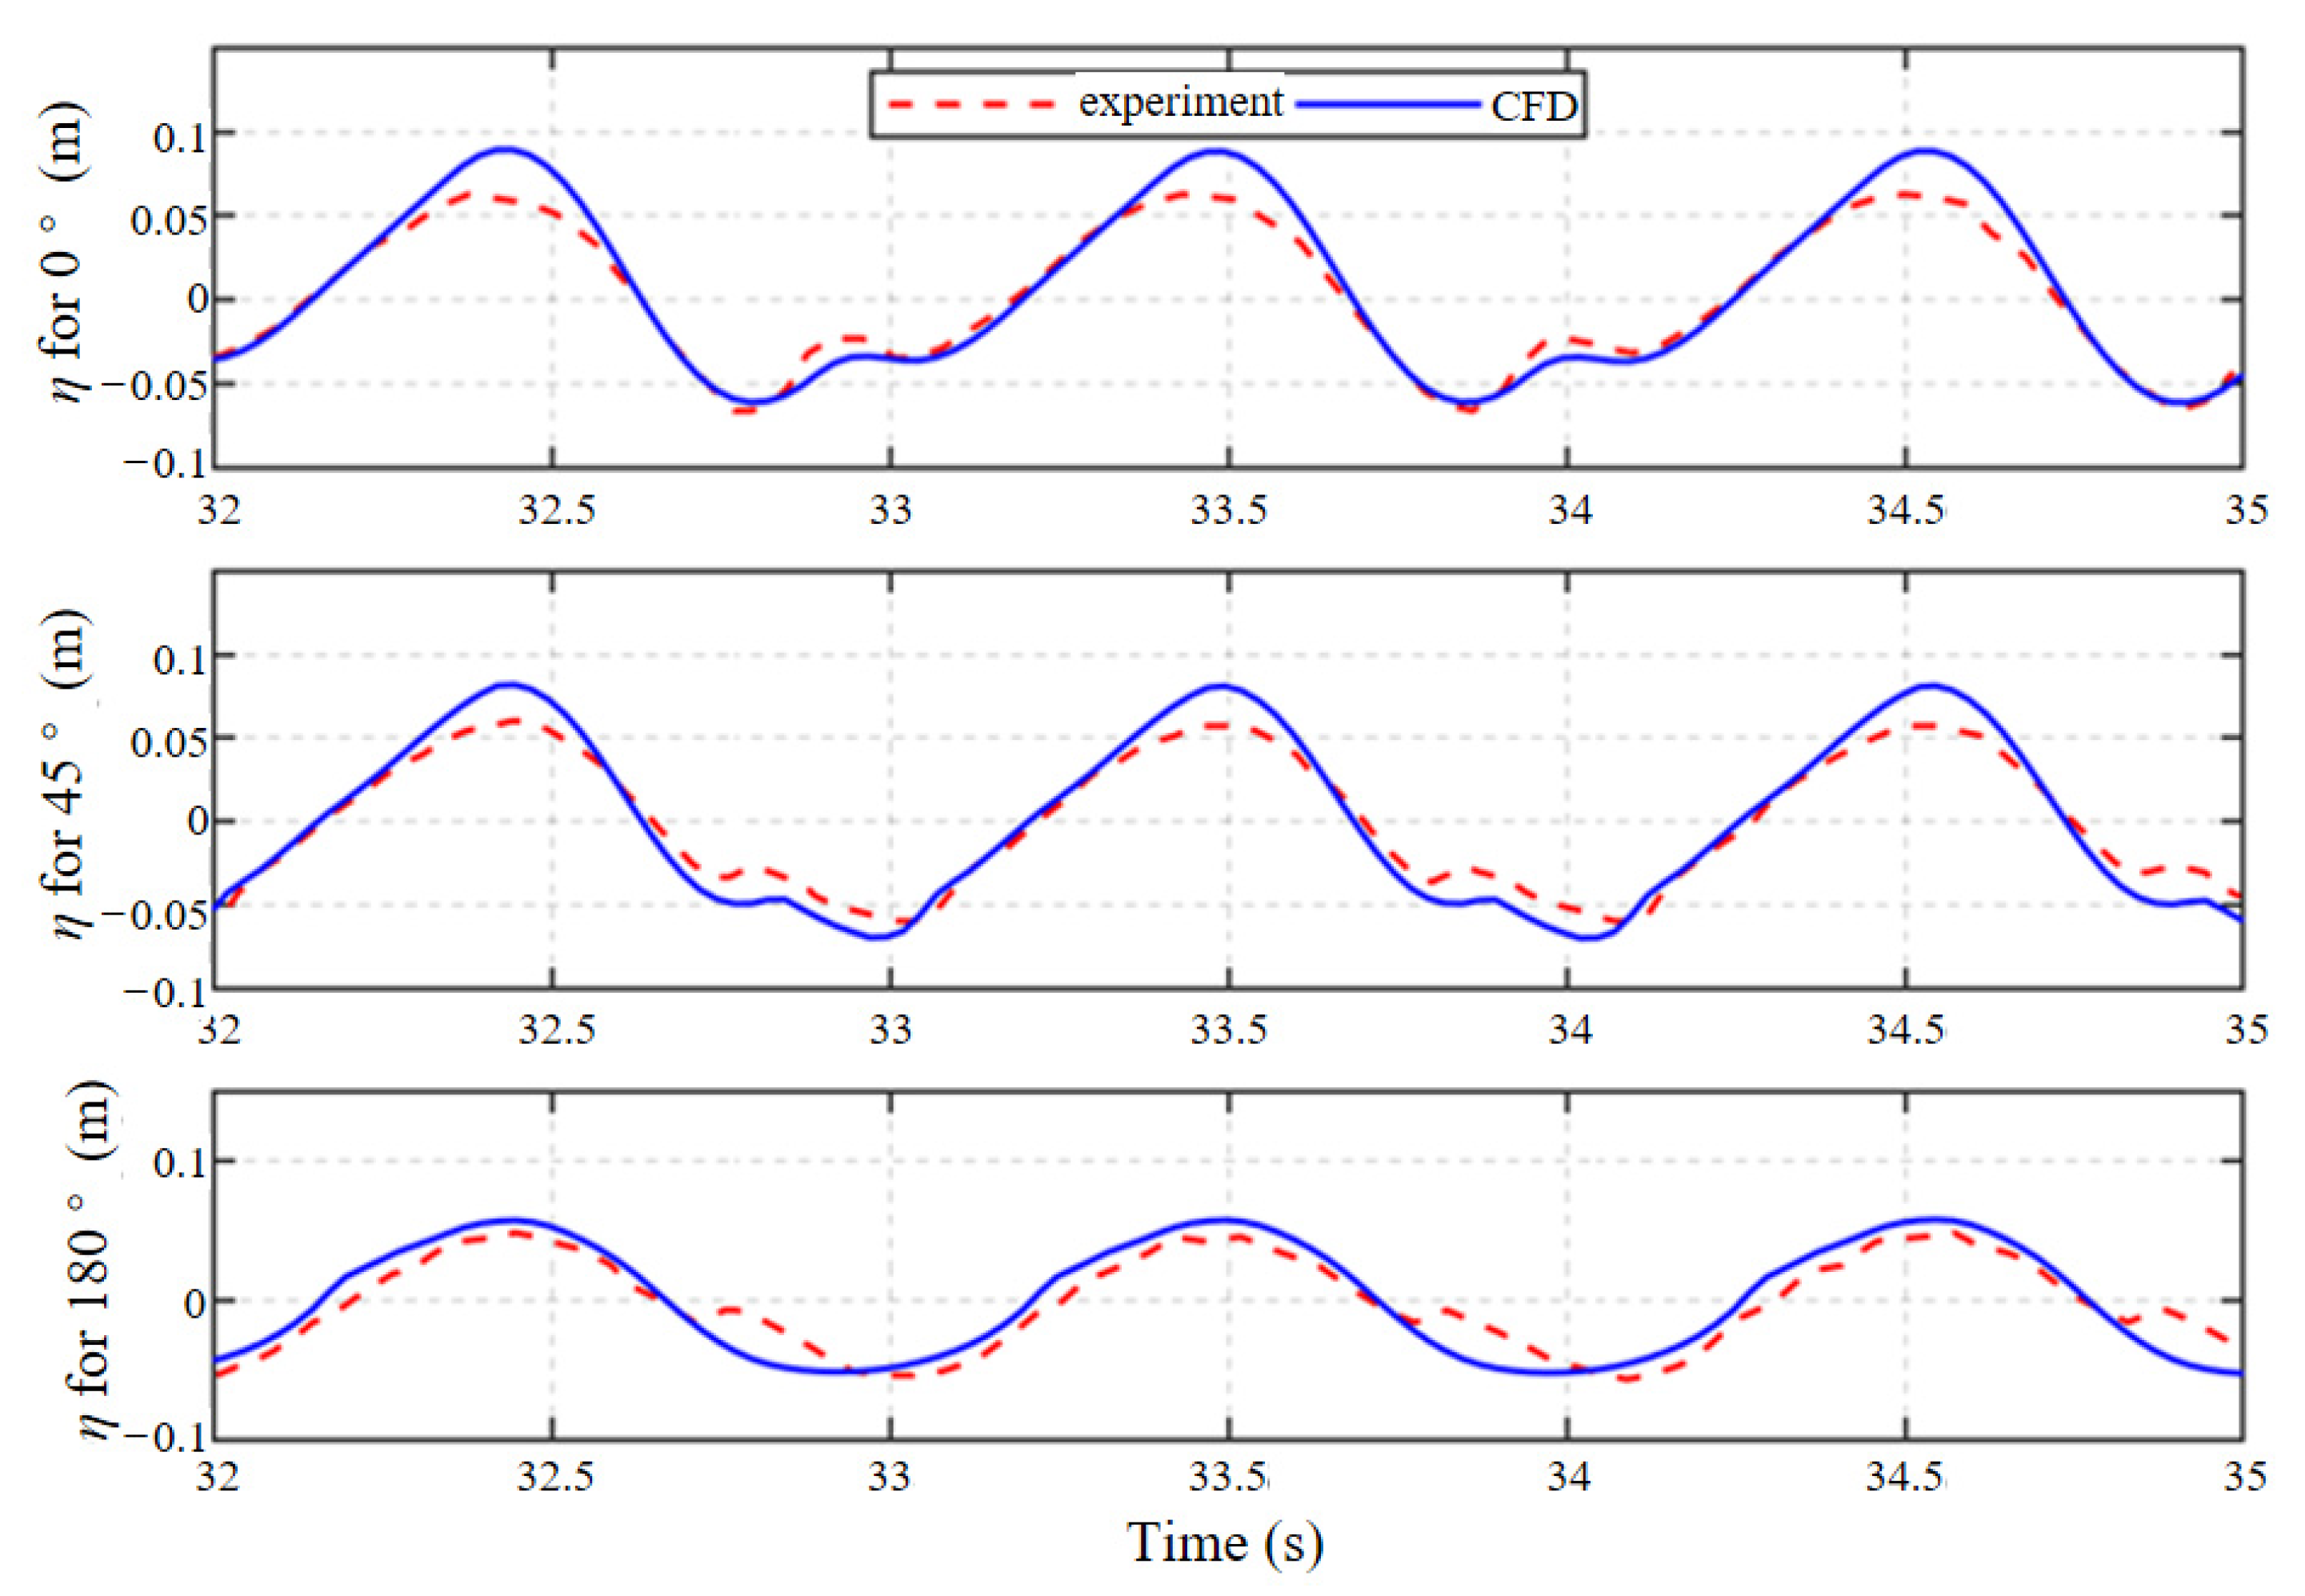
Figure 7 shows the comparison of wave run-up between the simulation and experiment at three measuring points at 0°, 45°, and 180° around the cylinder. The ordinate represents the wave surface elevation relative to the mean water level ( z = 0   m ), and the abscissa is time. The results show that the numerical simulation results are in good agreement with the experimental data. The maximum error of wave height is 15.2%, and the wave run-up height is consistent with the overall trend. The simulation results can also observe the quadratic peak phenomenon as the experimental results, which proves the accuracy of the model and lays the foundation for subsequent simulation. Numerical results sometimes overestimate the peak value of wave run-up. Devolder et al. [28] pointed out that this may be related to the reflection difference between numerical and experimental results, as well as the measurement technique of wave run-up height.

2.3. Model Setup

Based on the numerical model validated in Section 2, the interaction between thee wave and thee fixed truncated cylinder is numerically simulated to analyze the spatial distribution of wave run-up of truncated cylinders. Wave height measuring points are arranged in circumferential and radial directions, respectively, and the arrangement of circumferential measuring points is consistent with Figure 6. Distribution of radial measuring points are shown in Figure 8b. Sixteen numerical wave height measuring points are set up to monitor the variation and spatial distribution of waves along different radial directions of the cylinder. The distance r and angle α between radial measuring points are shown in Table 3. All incident waves propagate along the positive direction x (i.e., the position of 0° measuring point).
The numerical model is meshed by hexahedral structured grids, as shown in Figure 9. The boundary layer is divided at the boundary of the cylinder, and the surrounding is refined to meet the accuracy requirements of the simulation wave surface and force. The different mesh sizes have been used to verify the mesh convergence for wave–cylinder interaction, and the results presented in this paper are the verified results.
A series of regular wave conditions (Stokes second-order wave) are set as the incident wave, and three wave steepness values were also set ( k A = 0.05 , 0.1 , 0.15 , where k is the wave number and A is the wave amplitude). Wave periods and wave heights at each wave steepness are different. The wavelength range includes short-wave to long-wave. The wave numbers and scattering parameters remain the same under the same wave period. The incident wave height range is 0.042~0.398 m. The incident wave period range is 1.3~2.5 s. The specific wave conditions are shown in Table 4, which is from the scaled value of the Class 2–6 sea conditions in the Chinese sea area, and also refer to the setting of experimental conditions in Qiao et al. [31].

3. Results Analysis

3.1. Analysis of Maximum Wave Run-Up Height

3.1.1. Maximum Run-Up Height Change

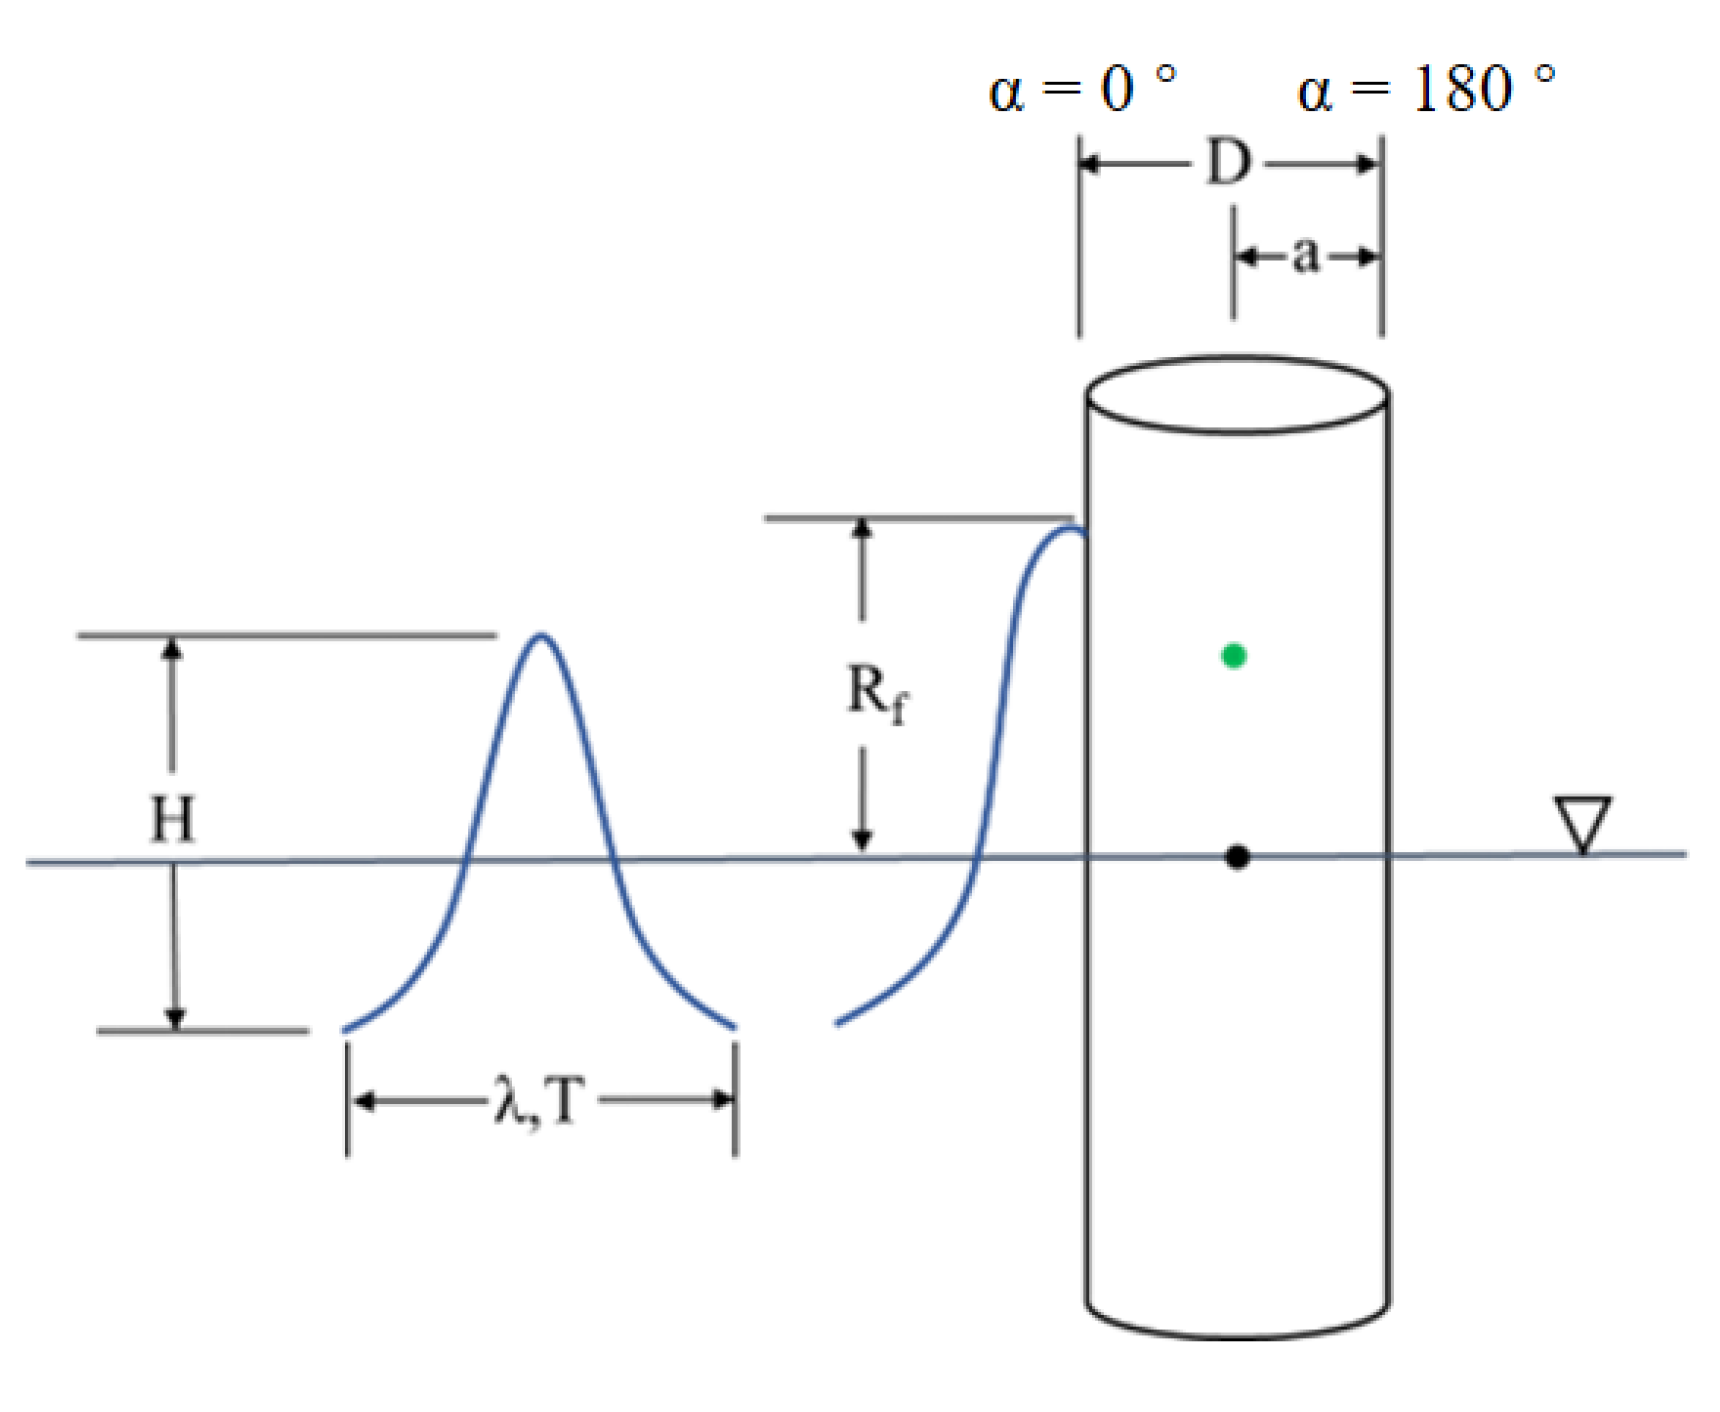
Wave run-up height along a cylinder is the maximum vertical distance of wave run-up upward along the cylinder surface during the interaction between the wave and the cylinder. As shown in Figure 10, R f is the maximum height of the wave surface time series at each wave height measuring point (the average value of the five stable periods). R f * is the maximum wave run-up height (the maximum run-up height of nine circumferential measuring points). The maximum run-up height mentioned in this section is that the maximum run-up height of the fixed case appears at the position of the 0° measuring point, so the maximum run-up height of the fixed case is the maximum wave height of the 0° measuring point.
As mentioned in the introduction, in recent years, according to theoretical and experimental studies, some scholars have proposed several estimation formulas for the maximum wave run-up height of a fixed vertical cylinder under regular waves [6,7,8,9,10,11,12]. In this paper, the empirical formulas proposed by Vos et al. [11] and Bonakdar et al. [12] are selected for analysis. The reason for this selection is that the velocity value of the water particle in the formula proposed by Vos et al. [11] is calculated by the Stokes second-order wave, which is consistent with the incident wave working condition used in this paper. The empirical formula proposed by Bonakdar et al. [12] covers all water depths and is a relatively comprehensive formula at present.
Vos et al. [11] modified the velocity head formula proposed by Hallermeier et al. [10] through experimental data, and obtained the calculation formula of the maximum run-up height of the upright cylinder (the cylinder touches the bottom) under regular waves:
R f = η max + m u 2 2 g
η max = H 2 + k H 2 H 8 cosh ( k d ) sinh 3 ( k d ) ( 2 + cosh ( 2 k d ) )
u t o p = H 2 g k w cosh ( k ( η max + d ) ) cosh ( k d ) + 3 4 k H 2 4 w cosh ( 2 k ( η max + d ) ) sinh 4 ( k d )
where η max is the maximum peak height, which is calculated by Stokes second-order wave theory formula (consistent with the simulated condition); u t o p is the maximum horizontal velocity at the peak water particle; H is wave height; k is wave number; ω is incident wave frequency; d is water depth; and m is adjustment coefficient, being 1, as suggested by Vos et al. [11].
Bonakdar et al. [10] took the relative wave height H / d , relative water depth d / λ , and slenderness ratio D / λ as the control parameters of the maximum run-up height, and obtained the formula for predicting the maximum wave run-up height of a fixed vertical cylinder under regular waves:
R f H = 0.863 ( 1 + 0.15 M ) H d 0.117 d λ 0.206 D λ 0.108 H d 0.41
R f H = ( 1 + 0.17 M ) 0.777 d λ 0.206 D λ 0.108 + 0.138 H d 0.41 0.316 d λ 2.6 D λ 1.16 H d > 0.41
where M is related to the expected or acceptable risk level. The specific value is described in Bonakdar et al. [12], and it is taken as 0 in this paper.
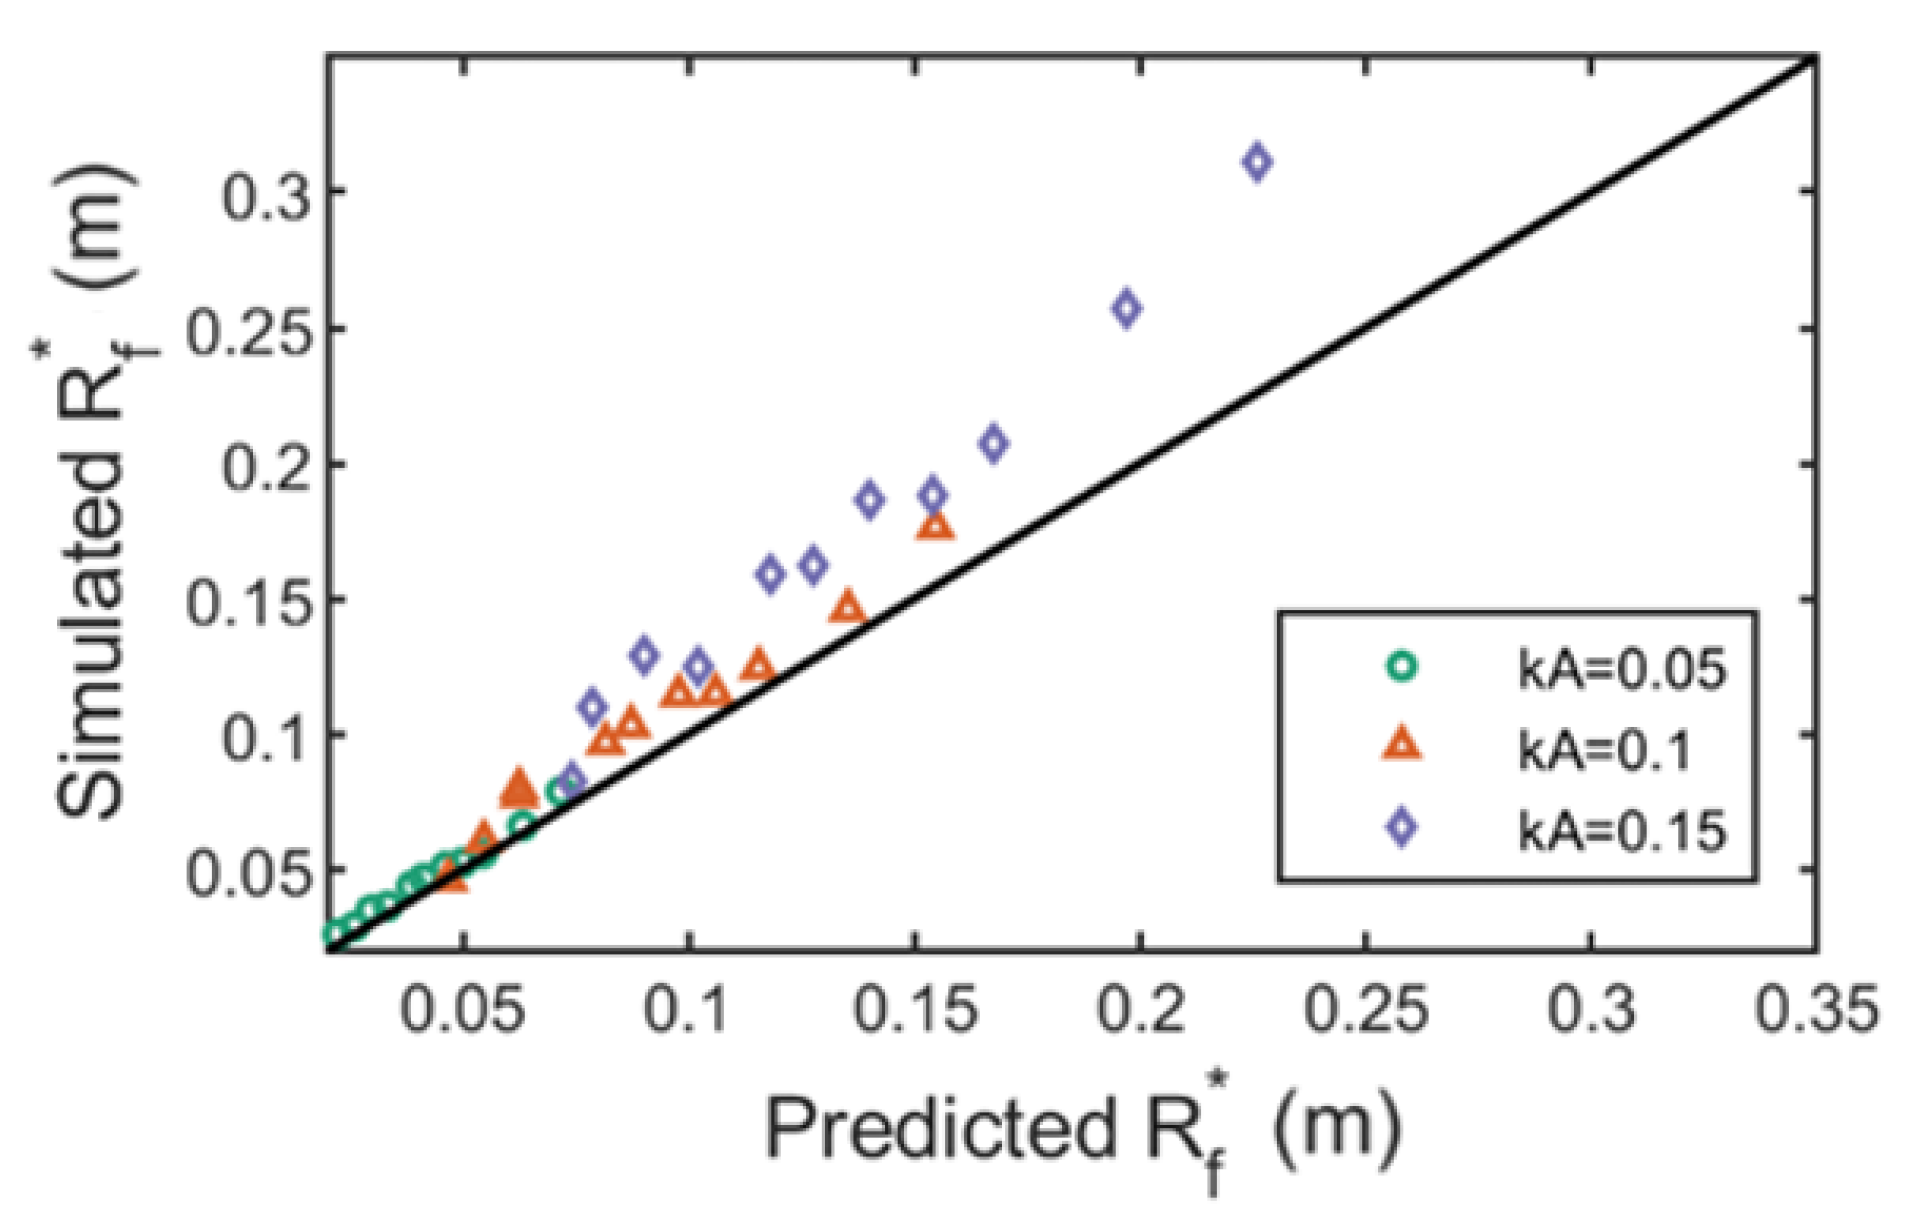
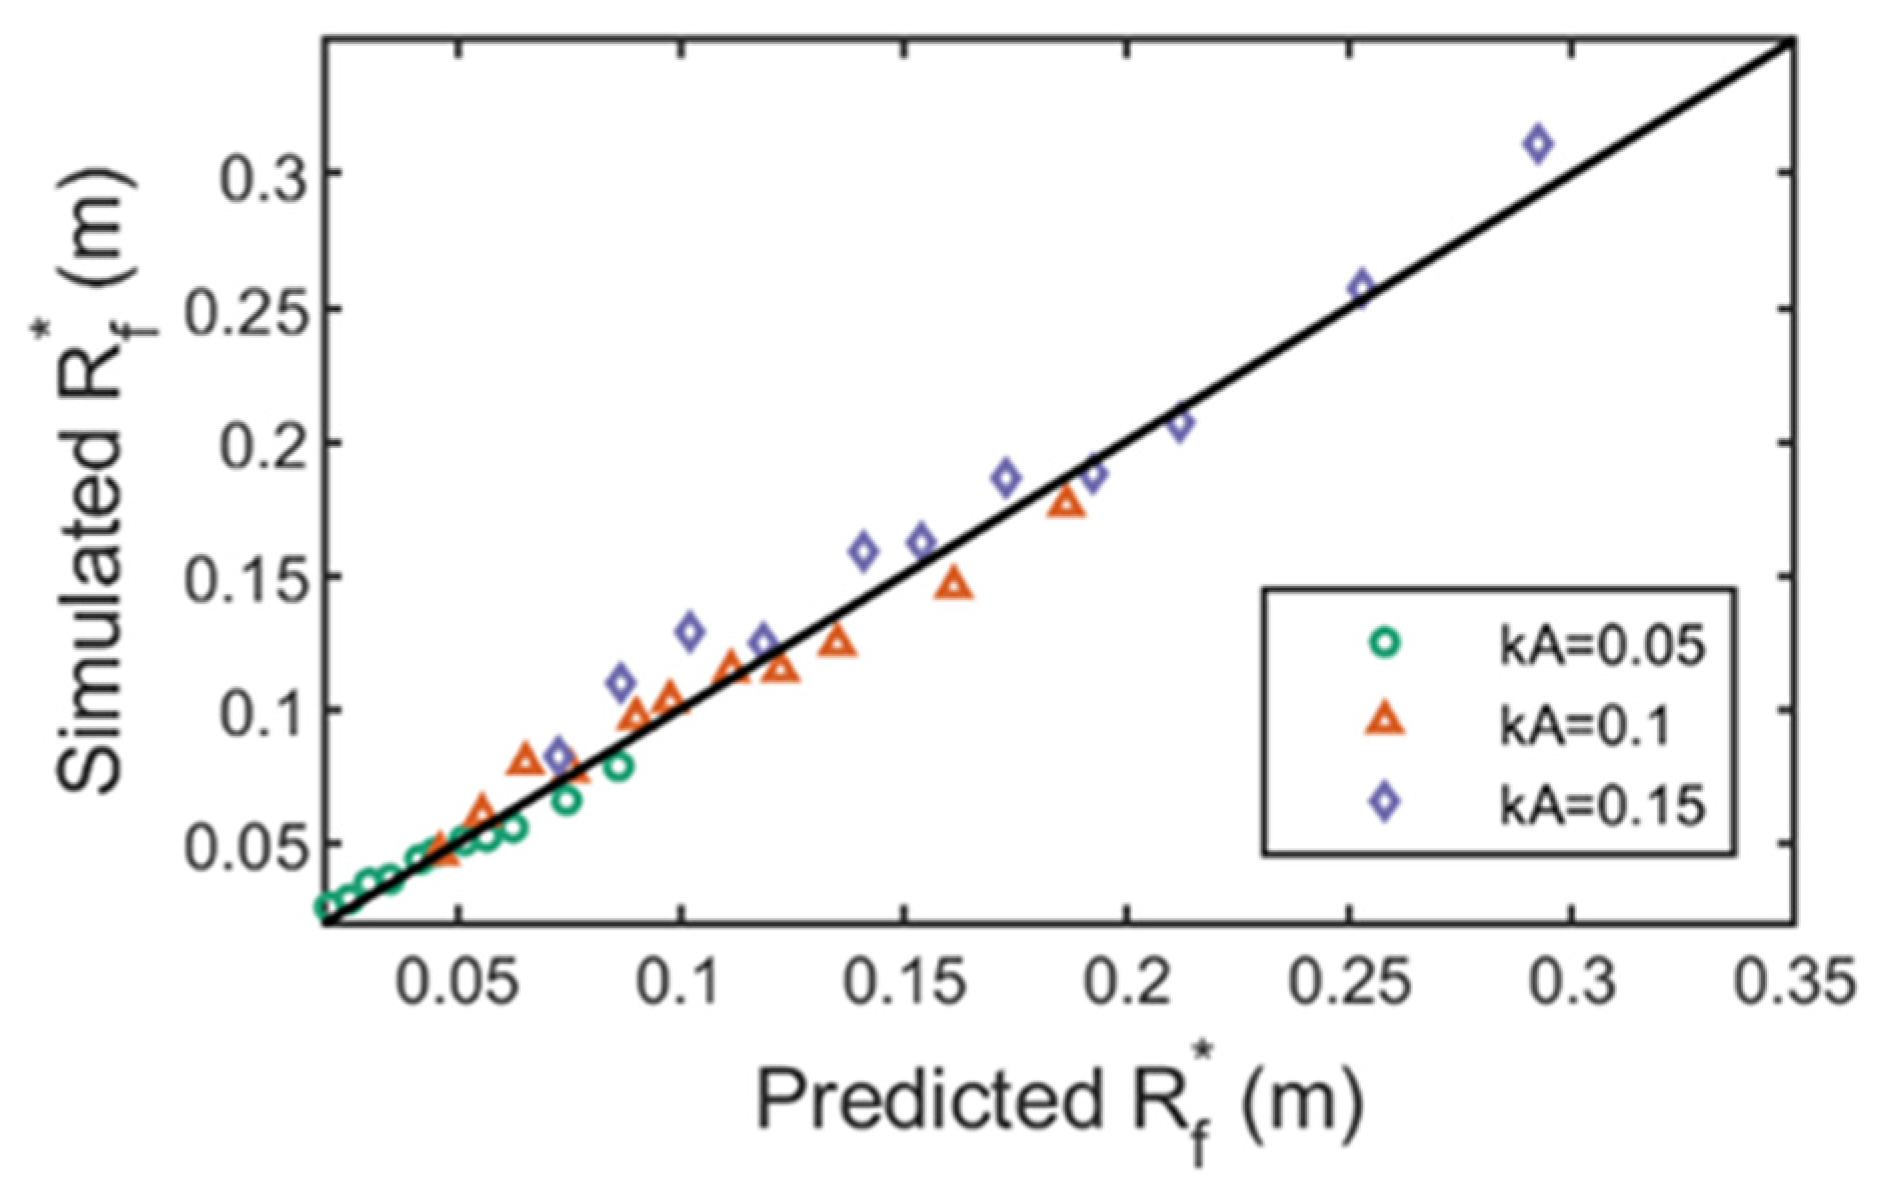
Figure 11 and Figure 12 show the comparison between the two estimation formulae and the maximum wave run-up height obtained by numerical simulation. The abscissa is the maximum run-up height predicted by the estimation formula, and the ordinate is the maximum run-up height obtained by numerical simulation. The difference between the maximum run-up height predicted by the estimation formula and the simulation results is assessed using statistical indicators such as bias, consistency index ( I a ), squared correlation coefficient ( R 2 ), and dispersion index ( S I ), which are calculated as follows:
B i a s = y ¯ x ¯
I a = 1 i = 1 N ( x i y i ) 2 ( x i x ¯ + y i y ¯ ) 2
R 2 = i = 1 N x i x ¯ y i y ¯ 2 i = 1 N x i x ¯ 2 i = 1 N y i y ¯ 2
S I = 1 / N y i x i 2 x ¯
where x i and y i are the predicted and simulated values of the estimation formula, respectively; N is the number of data; x ¯ and y ¯ are the average values of predicted and simulated values, respectively. Table 5 shows the statistical index results between the predicted values of the two estimation formulas and the simulation results.
It can be seen from Figure 11 that the numerical simulation results are consistent with the prediction results of the estimation formula proposed by Vos et al. [11] when the wave steepness is small ( k A = 0.05 ). However, with the increase of wave steepness, the numerical simulation results gradually deviate and become larger than the estimation formula results, and with the increase of wave steepness, the deviation between the two also become larger. The deviation and dispersion indexes of the two groups of data are 0.0188 and 30.13%, respectively. It can be seen from the deviation that the estimation formula underestimates the wave run-up height, especially when the wave run-up height is large. The reason for this phenomenon is that the maximum horizontal velocity of the peak water particle used in the formula to calculate the maximum peak height is calculated according to the corresponding wave theory in advance. In practice, due to the interaction between waves and cylinders, the velocity on the surface of the cylinder is different from the theoretical formula.
It can be seen from Figure 12 that the numerical simulation results are in good agreement with the estimation formula proposed by Bonakdar at al. [12]. The dispersion between the predicted value and the simulated value can be ignored, and the data points are basically concentrated on the 45° correlation line, indicating a good correlation. The consistency index 0.9941 and dispersion index 9.76% also show that the formula can accurately predict the wave run-up of a fixed truncated cylinder under regular waves. The reason is that the relative wave height, relative water depth, and slenderness ratio used as the control parameters of the maximum run-up height are of physical significance. They can represent the characteristics of incident waves, such as nonlinearity ( H / λ ), dispersion ( d / λ ), and diffraction region ( D / λ ). Figure 11 proves the accuracy of the numerical model and the numerical results; on the other hand, it also shows that, for the truncated cylinder with the draft reaching half of its height, its maximum wave run-up height is consistent with that of the fully bottom fixed cylinder. The draft has little effect on the maximum wave run-up height of the cylinder, and its maximum run-up height can also be predicted by the fixed vertical cylinder estimation formula. At the same time, for the estimation of the maximum run-up height of the vertical cylinder under the action of nonlinear waves, the formula proposed by Bonakdar et al. [12] is more accurate and close to the reality than the formula proposed by Vos et al. [11].

3.1.2. Wave Surface Time Series Curve and Fourier Analysis

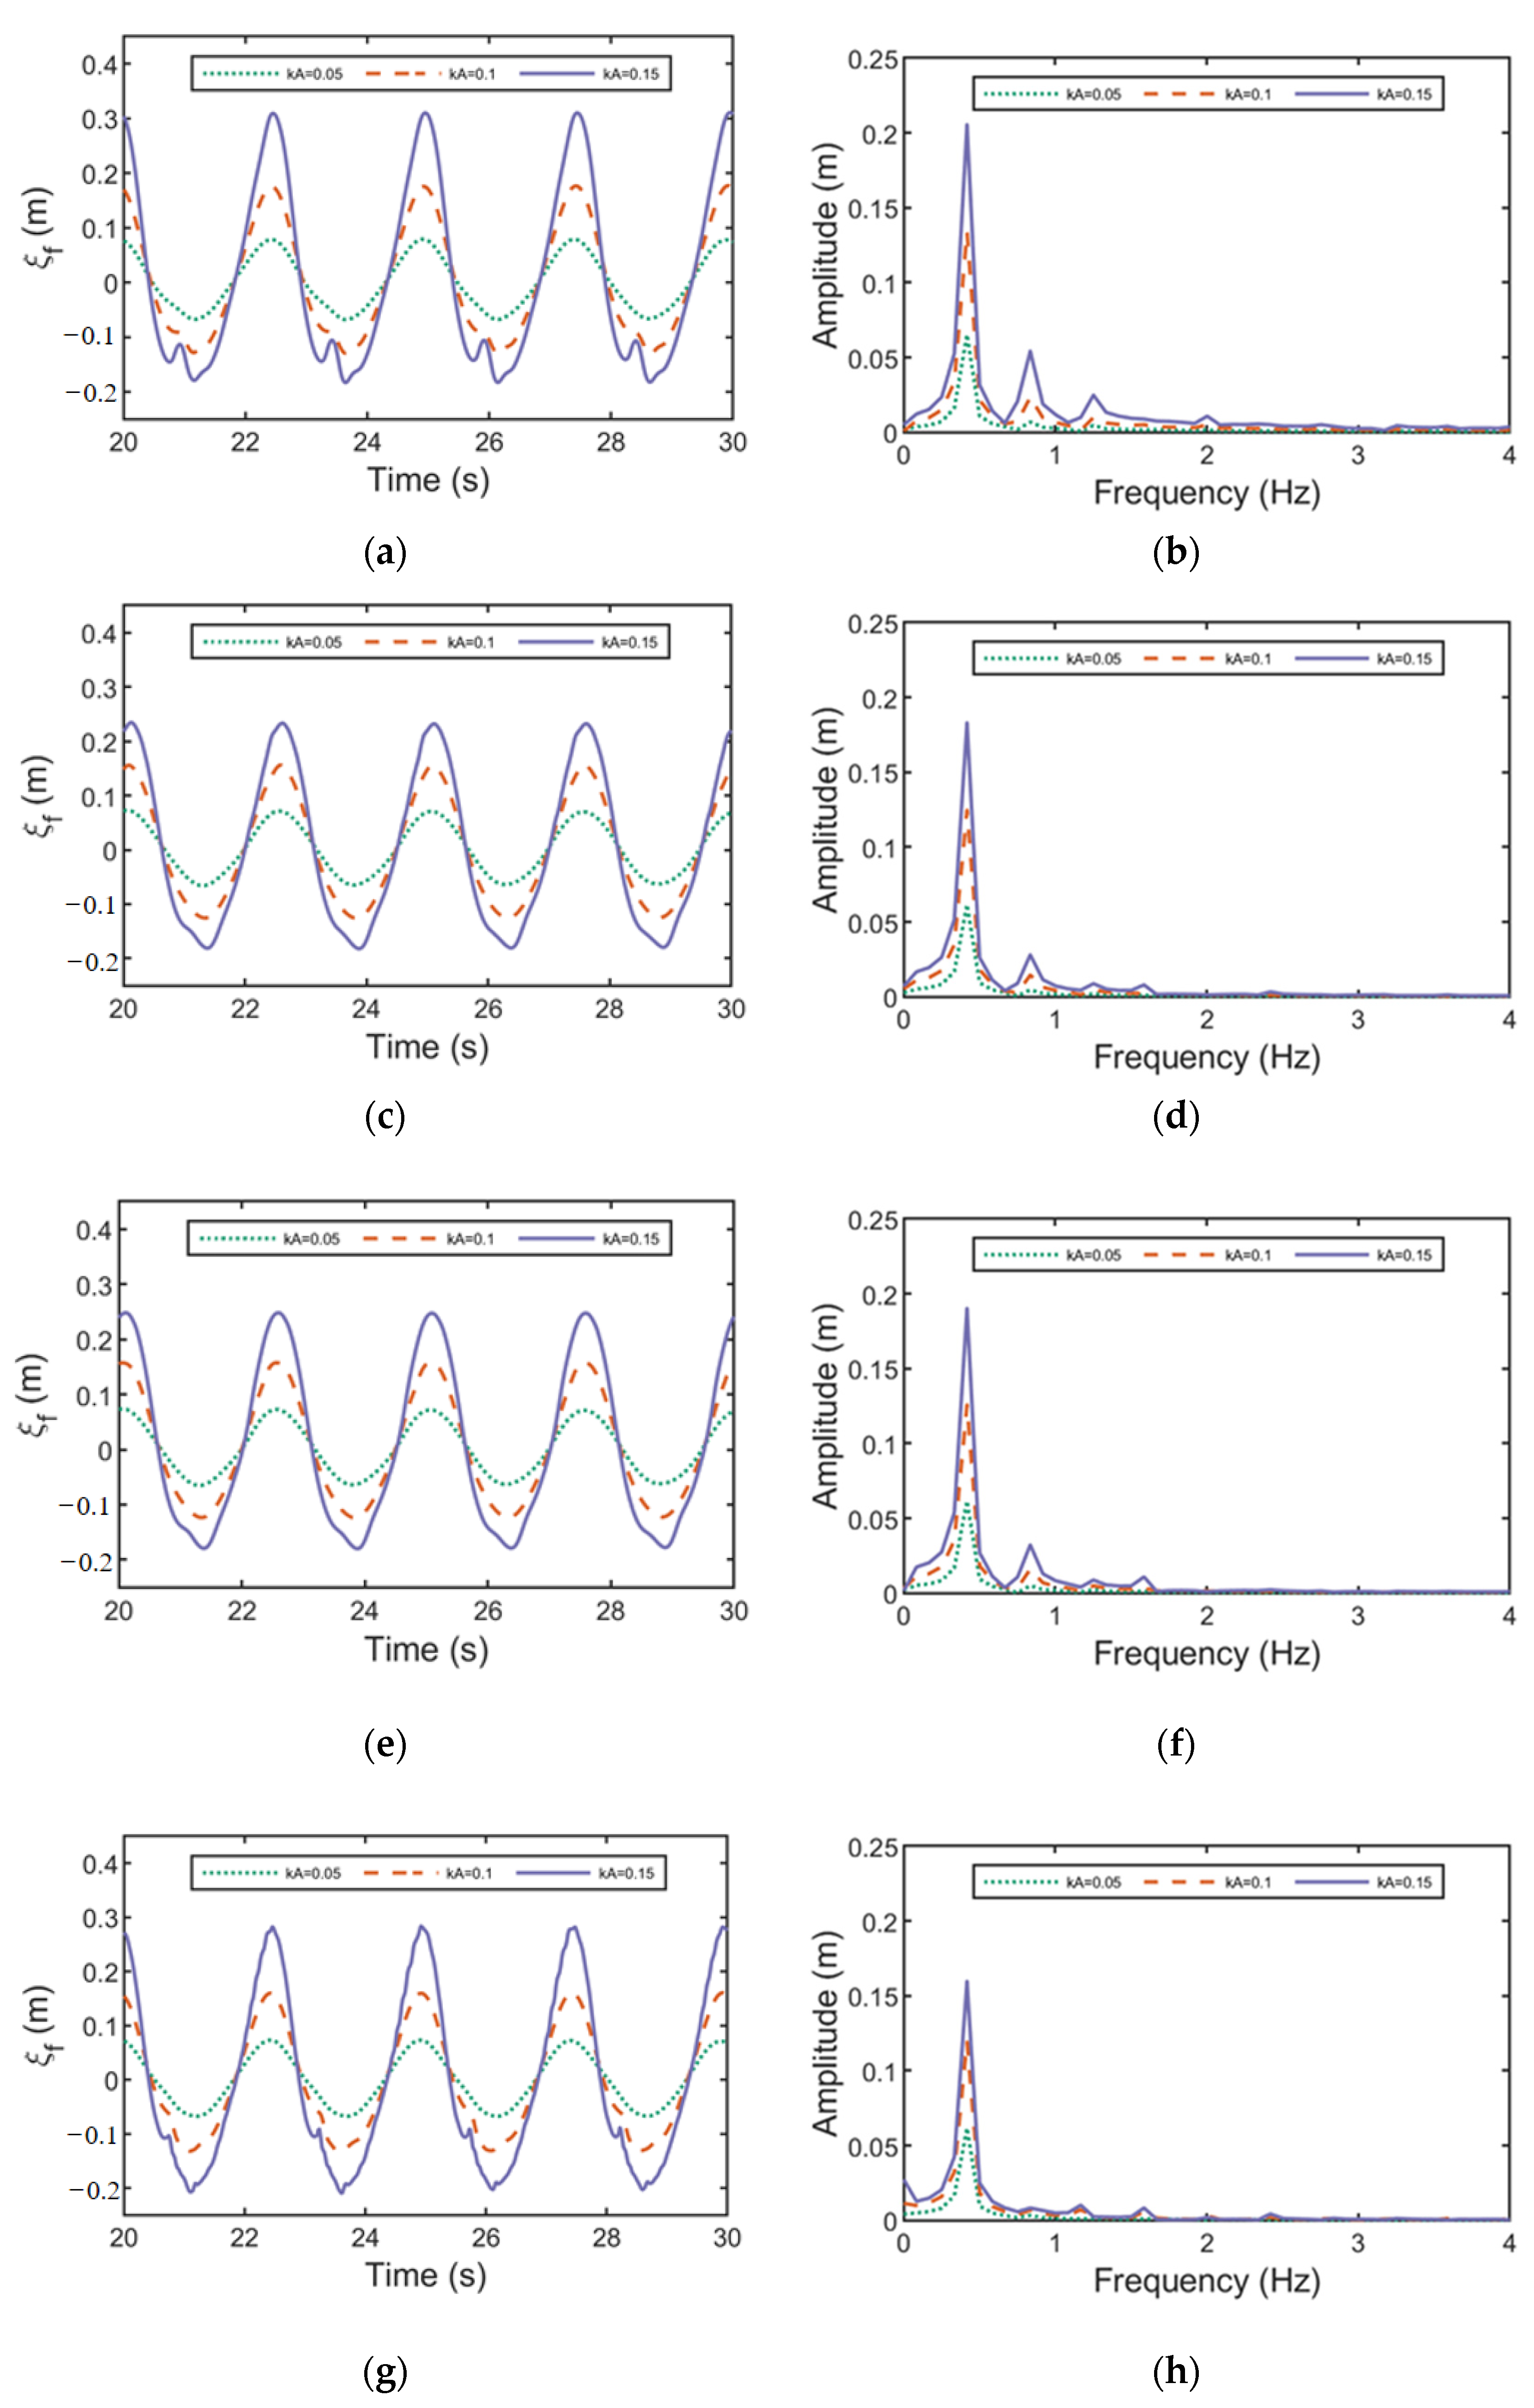
This paper mainly selects four different wave periods under three wave steepnesses as representative working conditions to analyze the wave surface changes of each wave height measuring point, and analyze the time series curve of the wave surface by Fourier transform. The four wave periods are 1.4 s, 1.73 s, 2.1 s, and 2.5 s, respectively. The selected measuring points were 0°, 157.5°, 180°, and 225°.
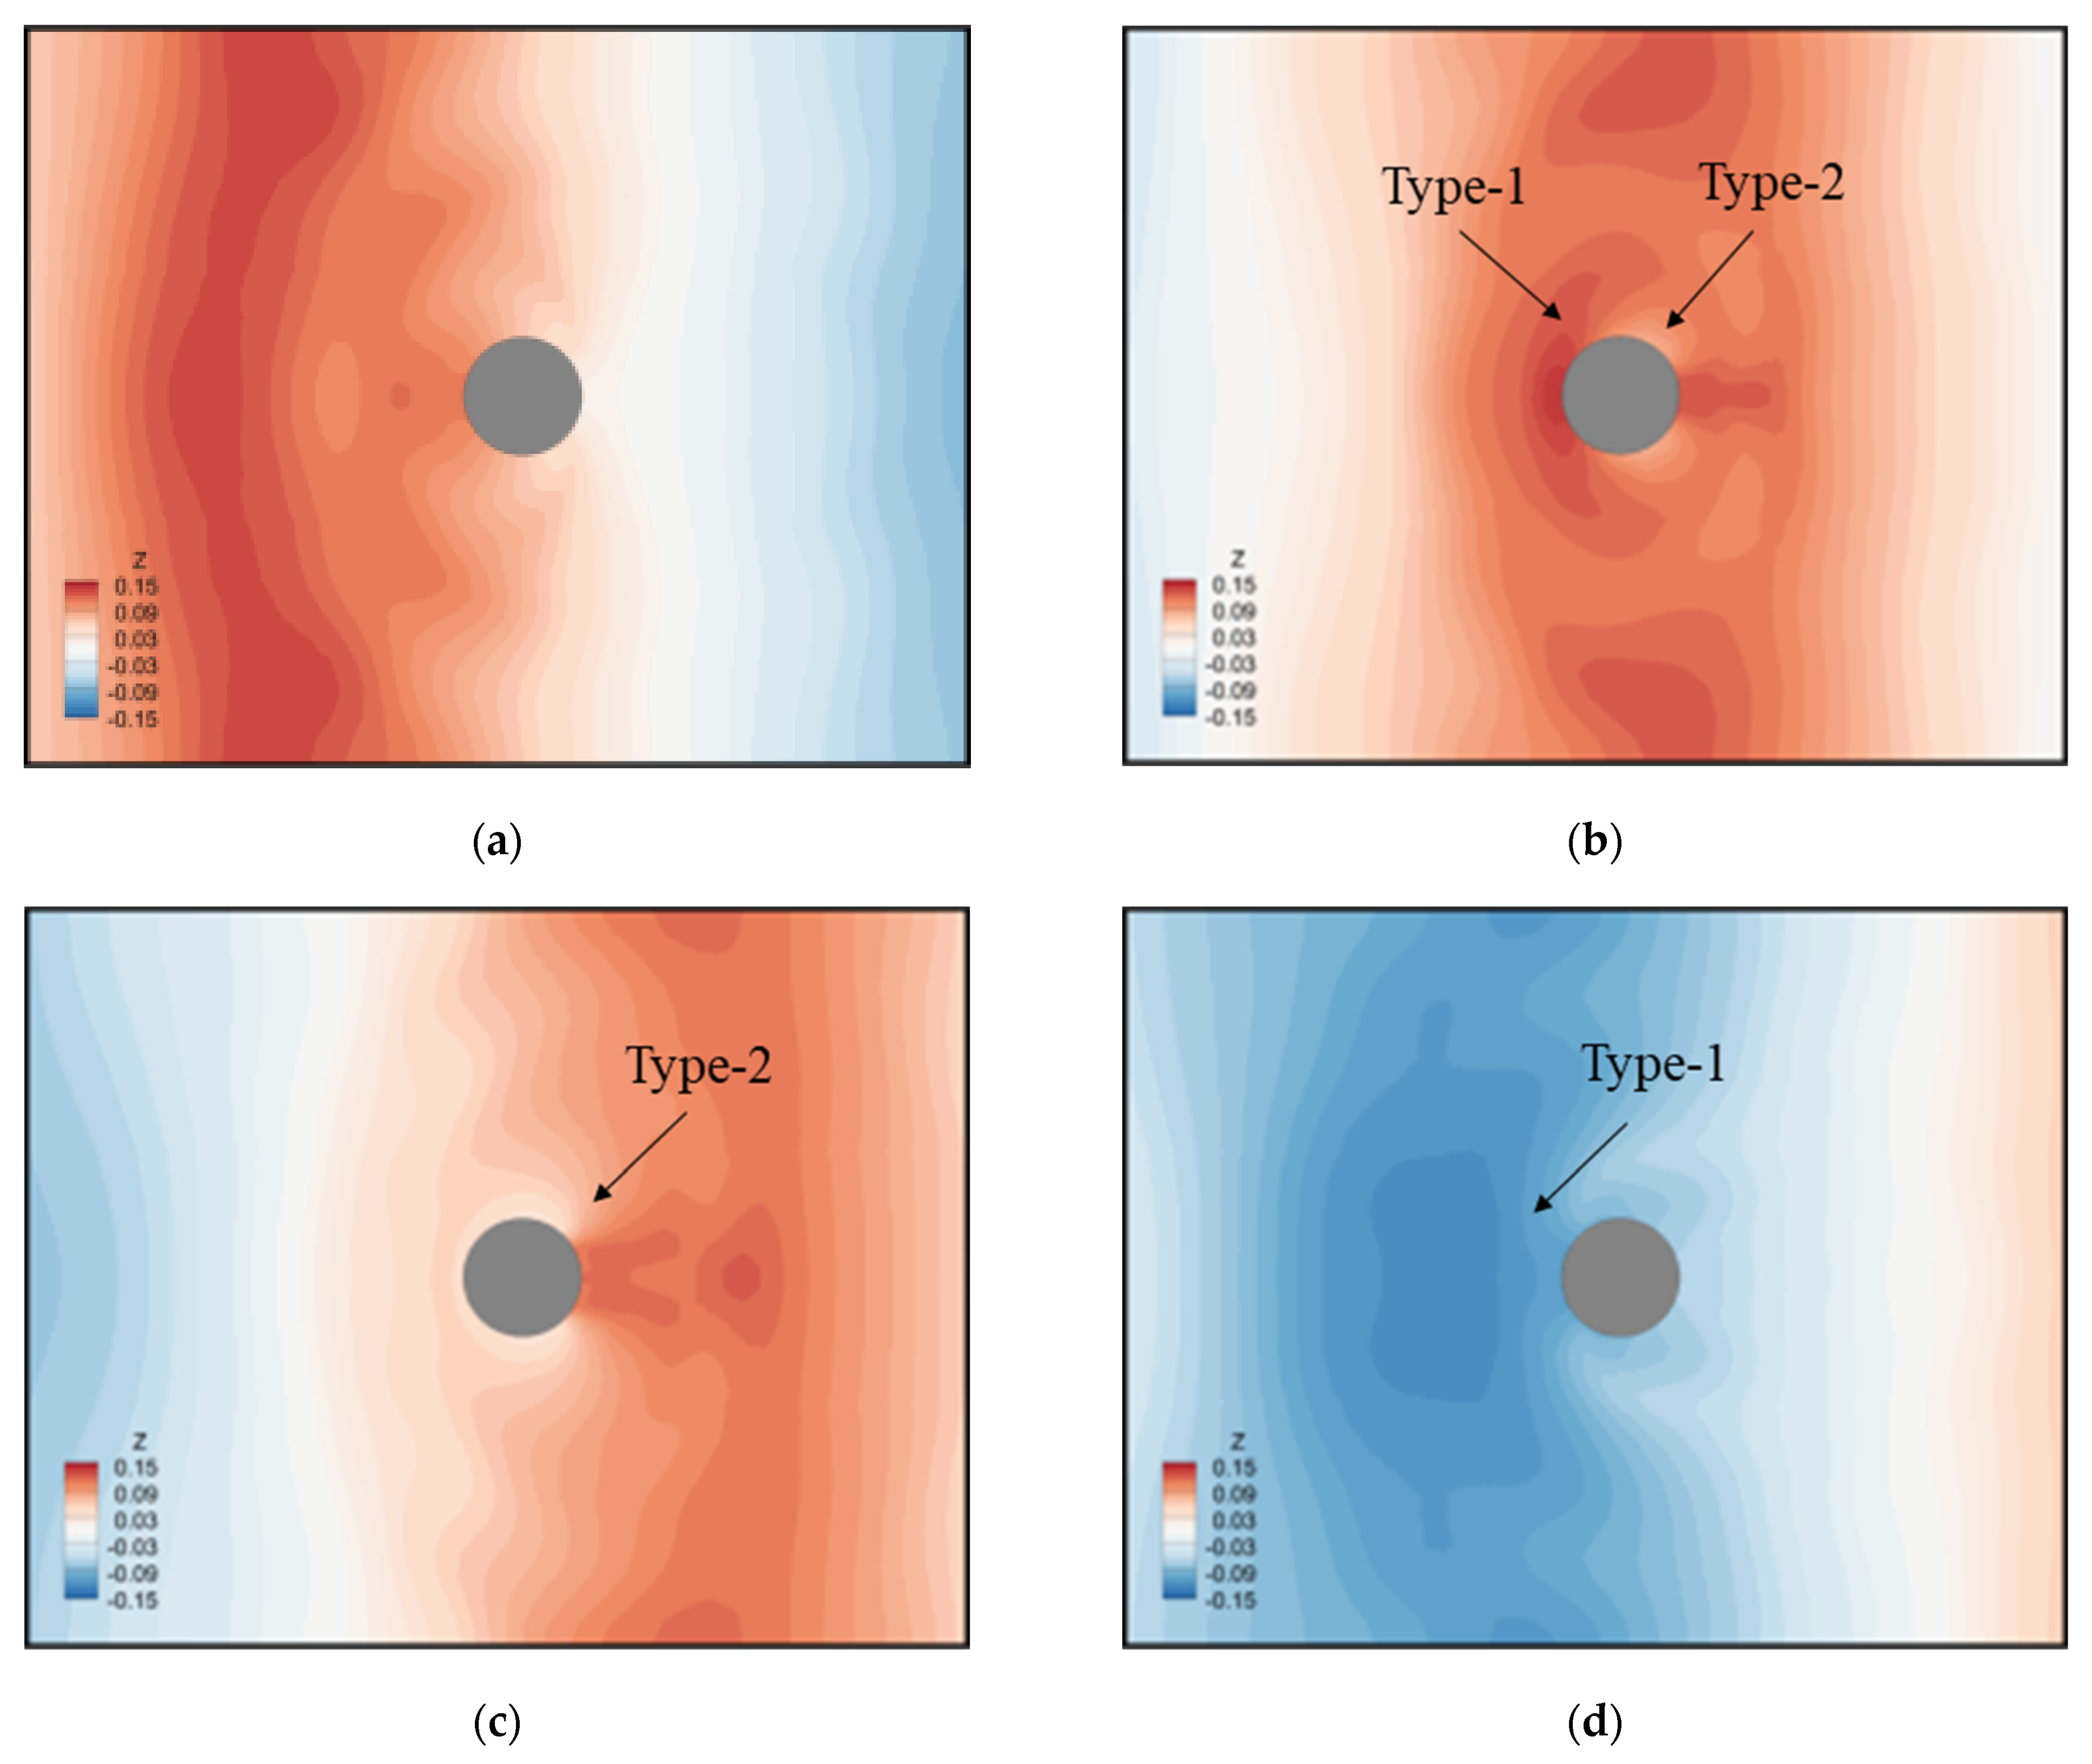
Figure 13 shows the time series curves of the wave surface and the corresponding Fourier transform results of the four wave height measuring points in the condition T = 2.5   s . In order to facilitate comparative observation, the phase of the time series curve results is adjusted. It can be observed that, with the increase of wave steepness, the time series curves of the wave surface present obvious nonlinear characteristics, and multiple peaks appear. By analyzing the wave surface time series curves at different measuring points under the same wave steepness, it can be found that the nonlinear characteristics of the wave surface time series curves at the 180° measuring point are weak, while the nonlinear characteristics of the wave surface time series curves at the 0°, 157.5°, and 225° measuring points are strong. There are obvious multiple peaks at the wave peak and trough, which reflects the strong nonlinear characteristics. The wave heights at the 157.5° and 225° measuring points are smaller than those at other measuring points. From the wave composition analysis, the second-order wave influence at the 0° measuring point is greater than that at the 157.5° and 225° measuring points. The reason for this phenomenon can be explained as follows: when the regular wave peak is close to the front of the cylinder, the water body in front of the cylinder is blocked by the cylinder, and part of the water body exchanges kinetic energy and potential energy, resulting in the rise of the water body, and the maximum wave run-up height also appears in this area; the 0 ° measuring point will have strong nonlinear characteristics, while the other part of the water body continues to propagate forward around the two sides of the cylinder and meets behind the cylinder; one part will return upstream and interact with the incident wave (the velocity of the return part of the water body is not as fast as that of the unhindered part), and there will be a strong nonlinear phenomenon in the shoulder of the cylinder, as shown in Figure 14.
In order to analyze the influence of high-order wave components, the spectrum analysis results of time series curves of the wave surface are quantitatively conducted. The wave amplitude (second-order, third-order, etc.) corresponding to each order wave frequency is compared with the wave amplitude corresponding to the first-order wave frequency, and this ratio is defined as the corresponding wave influence coefficient of each order (second-order, third-order, etc.).
ζ n = A n A 1
where ζ n is the wave influence coefficient; n is the wave frequency order number; A n is the nth order wave amplitude (second-order n = 2 , third-order n = 3 , etc.) corresponding to each order wave frequency; and A 1 is the wave amplitude corresponding to the first-order wave frequency.
The results are shown in Table 5. In all spectrums, the maximum wave frequency can reach the sixth order, but after the third order wave frequency, the corresponding wave influence coefficient of each order wave frequency is small, which is between 0.005 and 0.027, and the proportion of the first order wave amplitude is small. The second and third order coefficients are mainly affected. At the same time, in order to facilitate data collation, only the second and third order wave influence coefficients are shown in Table 6. It can be seen that when the wave steepness is small, the spectrum analysis of the time series curves of the wave surface at each measuring point has only a second-order value. With the increase of wave steepness, the wave frequency order of each measuring point increases, and the wave influence coefficient of each order increases. The second-order wave influence coefficient under the short-wave condition is larger than that under other conditions, which may be due to the strong scattering effect of the cylinder on the short-wave, and the interaction between the incident wave and the cylinder scattering wave leads to a more complex wave field. At the same wave steepness, the second-order influence coefficient of the 0° measuring point is the largest, and the wave run-up height is also the largest.
Figure 14 shows the variation of the wave diffraction field around the cylinder in a period (wave incident vertically to the left side of the Figure) during the wave run-up process. It can be seen that the simulation results are consistent with the experimental results of Swan and Sheikh [32] (Type-1 and Type-2).

3.2. Spatial Distribution of Wave Run-Up

3.2.1. Circumferential Run-Up Height Distribution

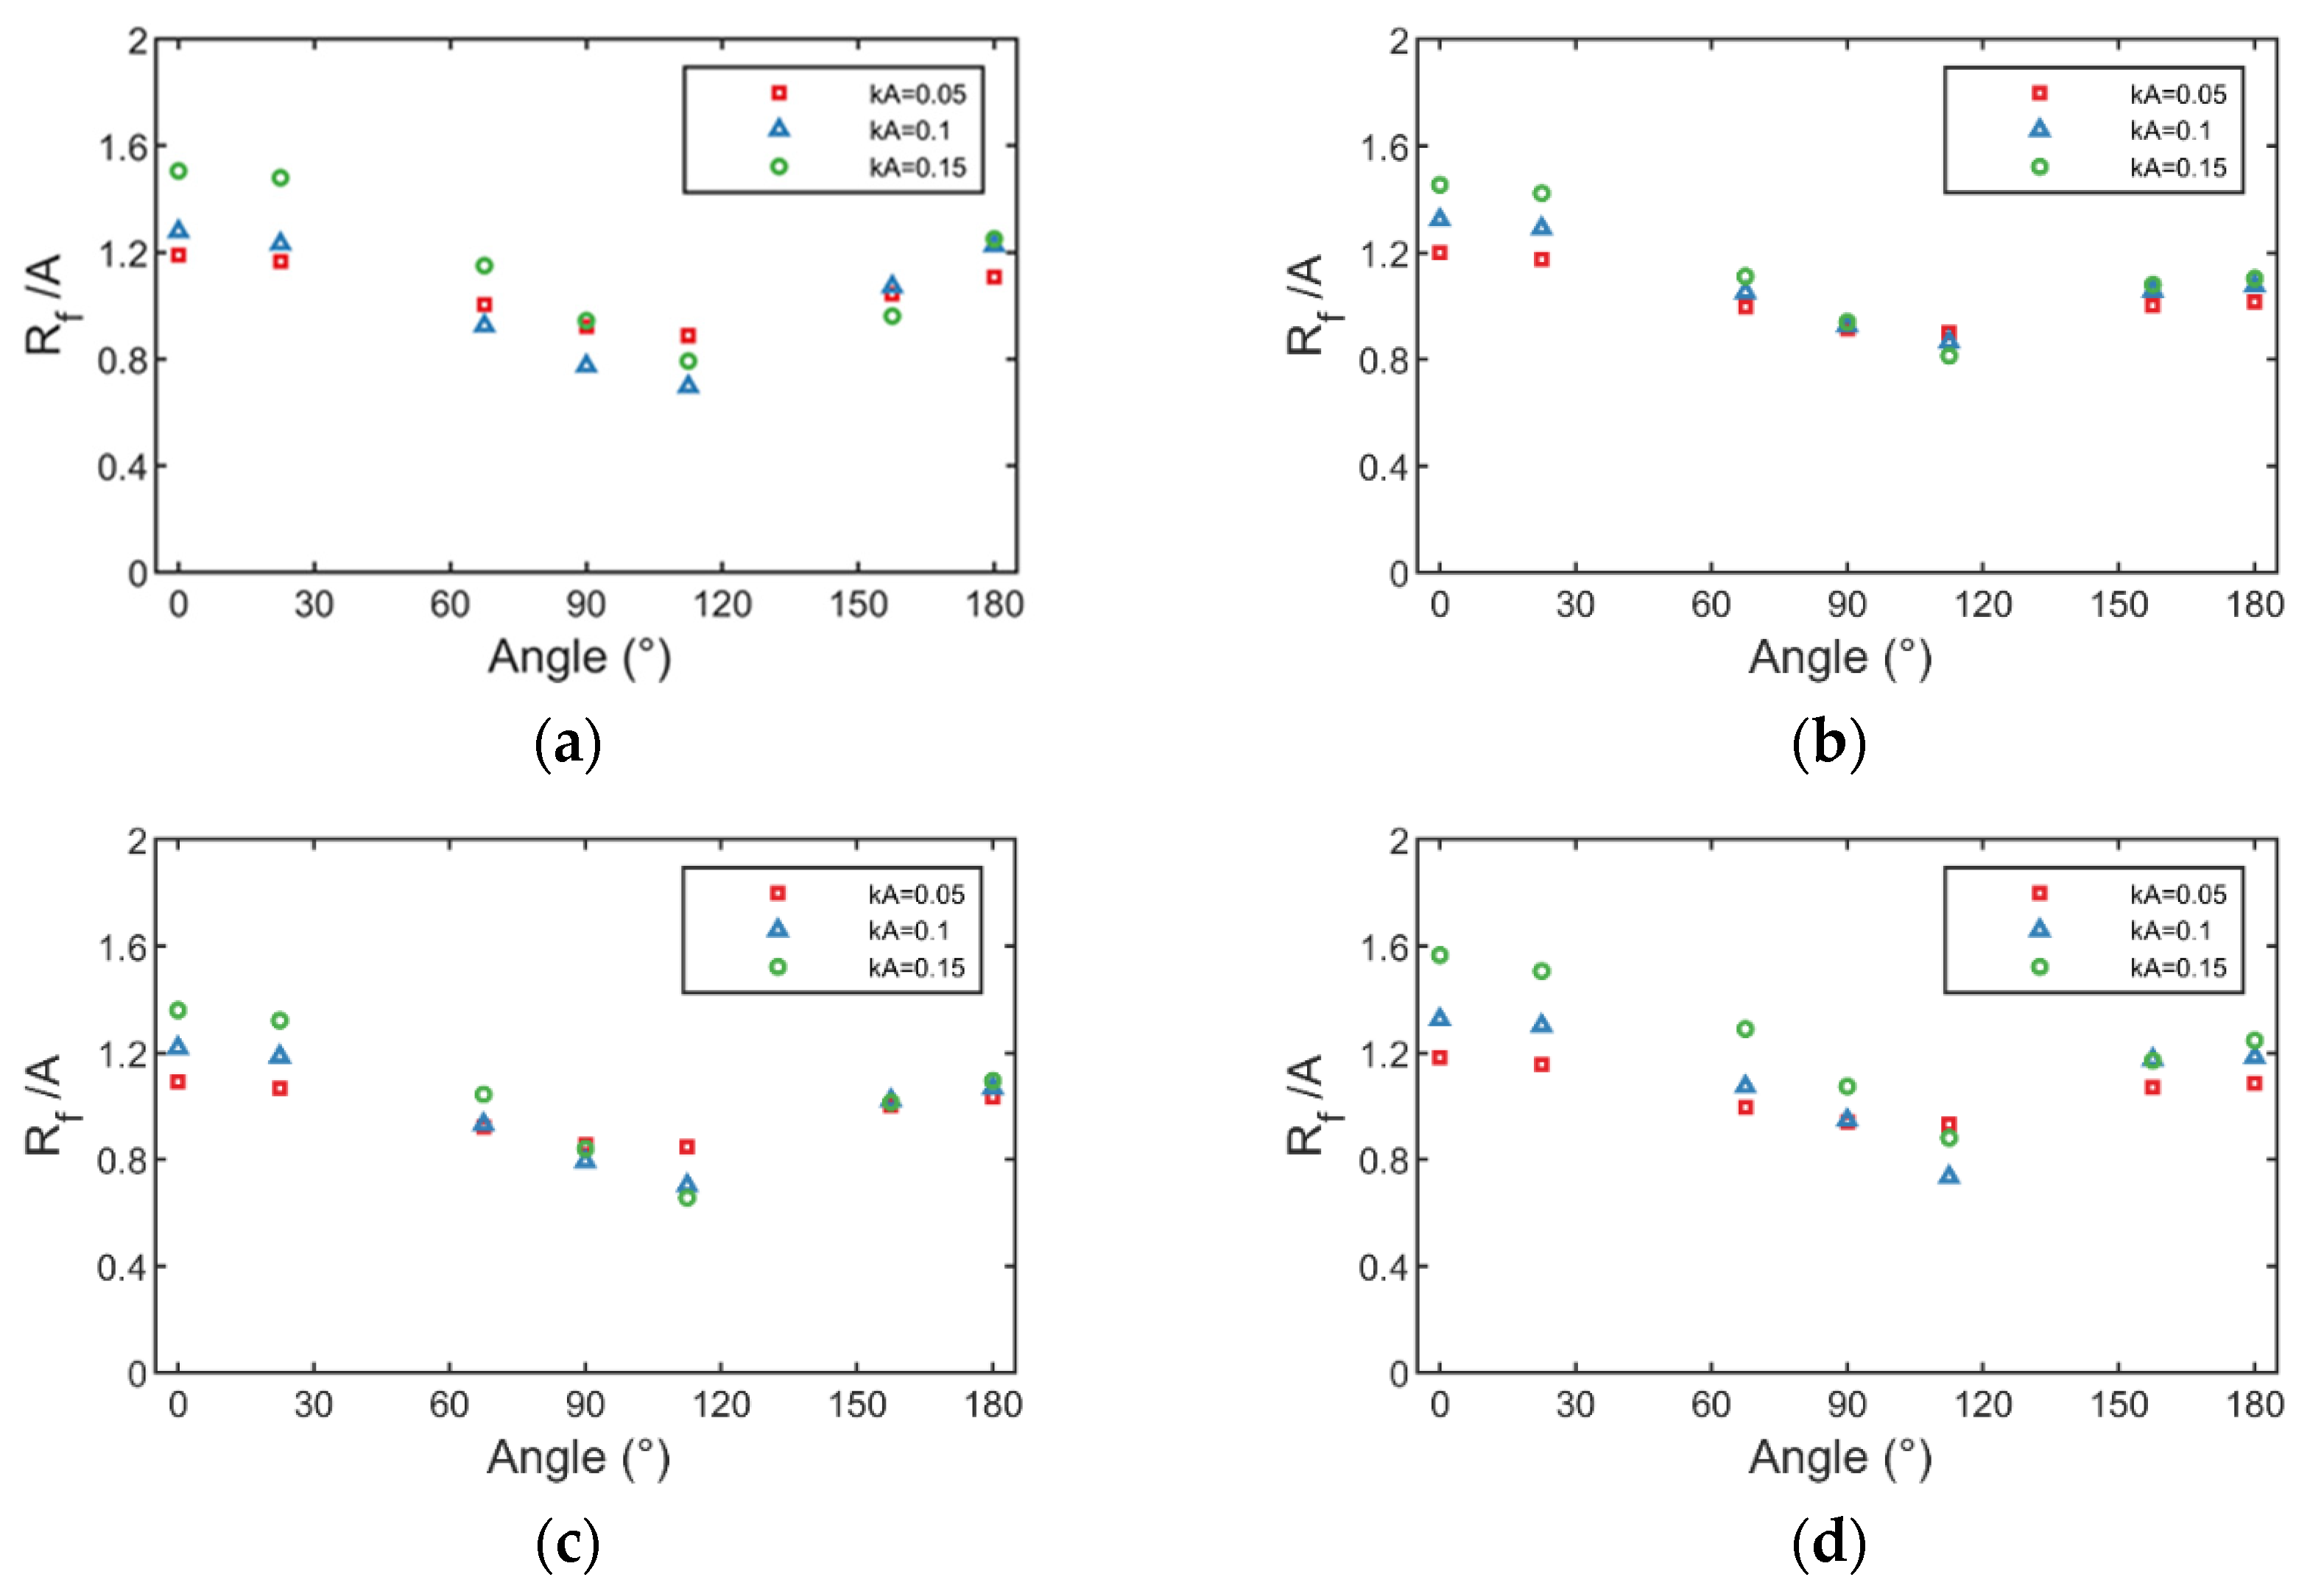
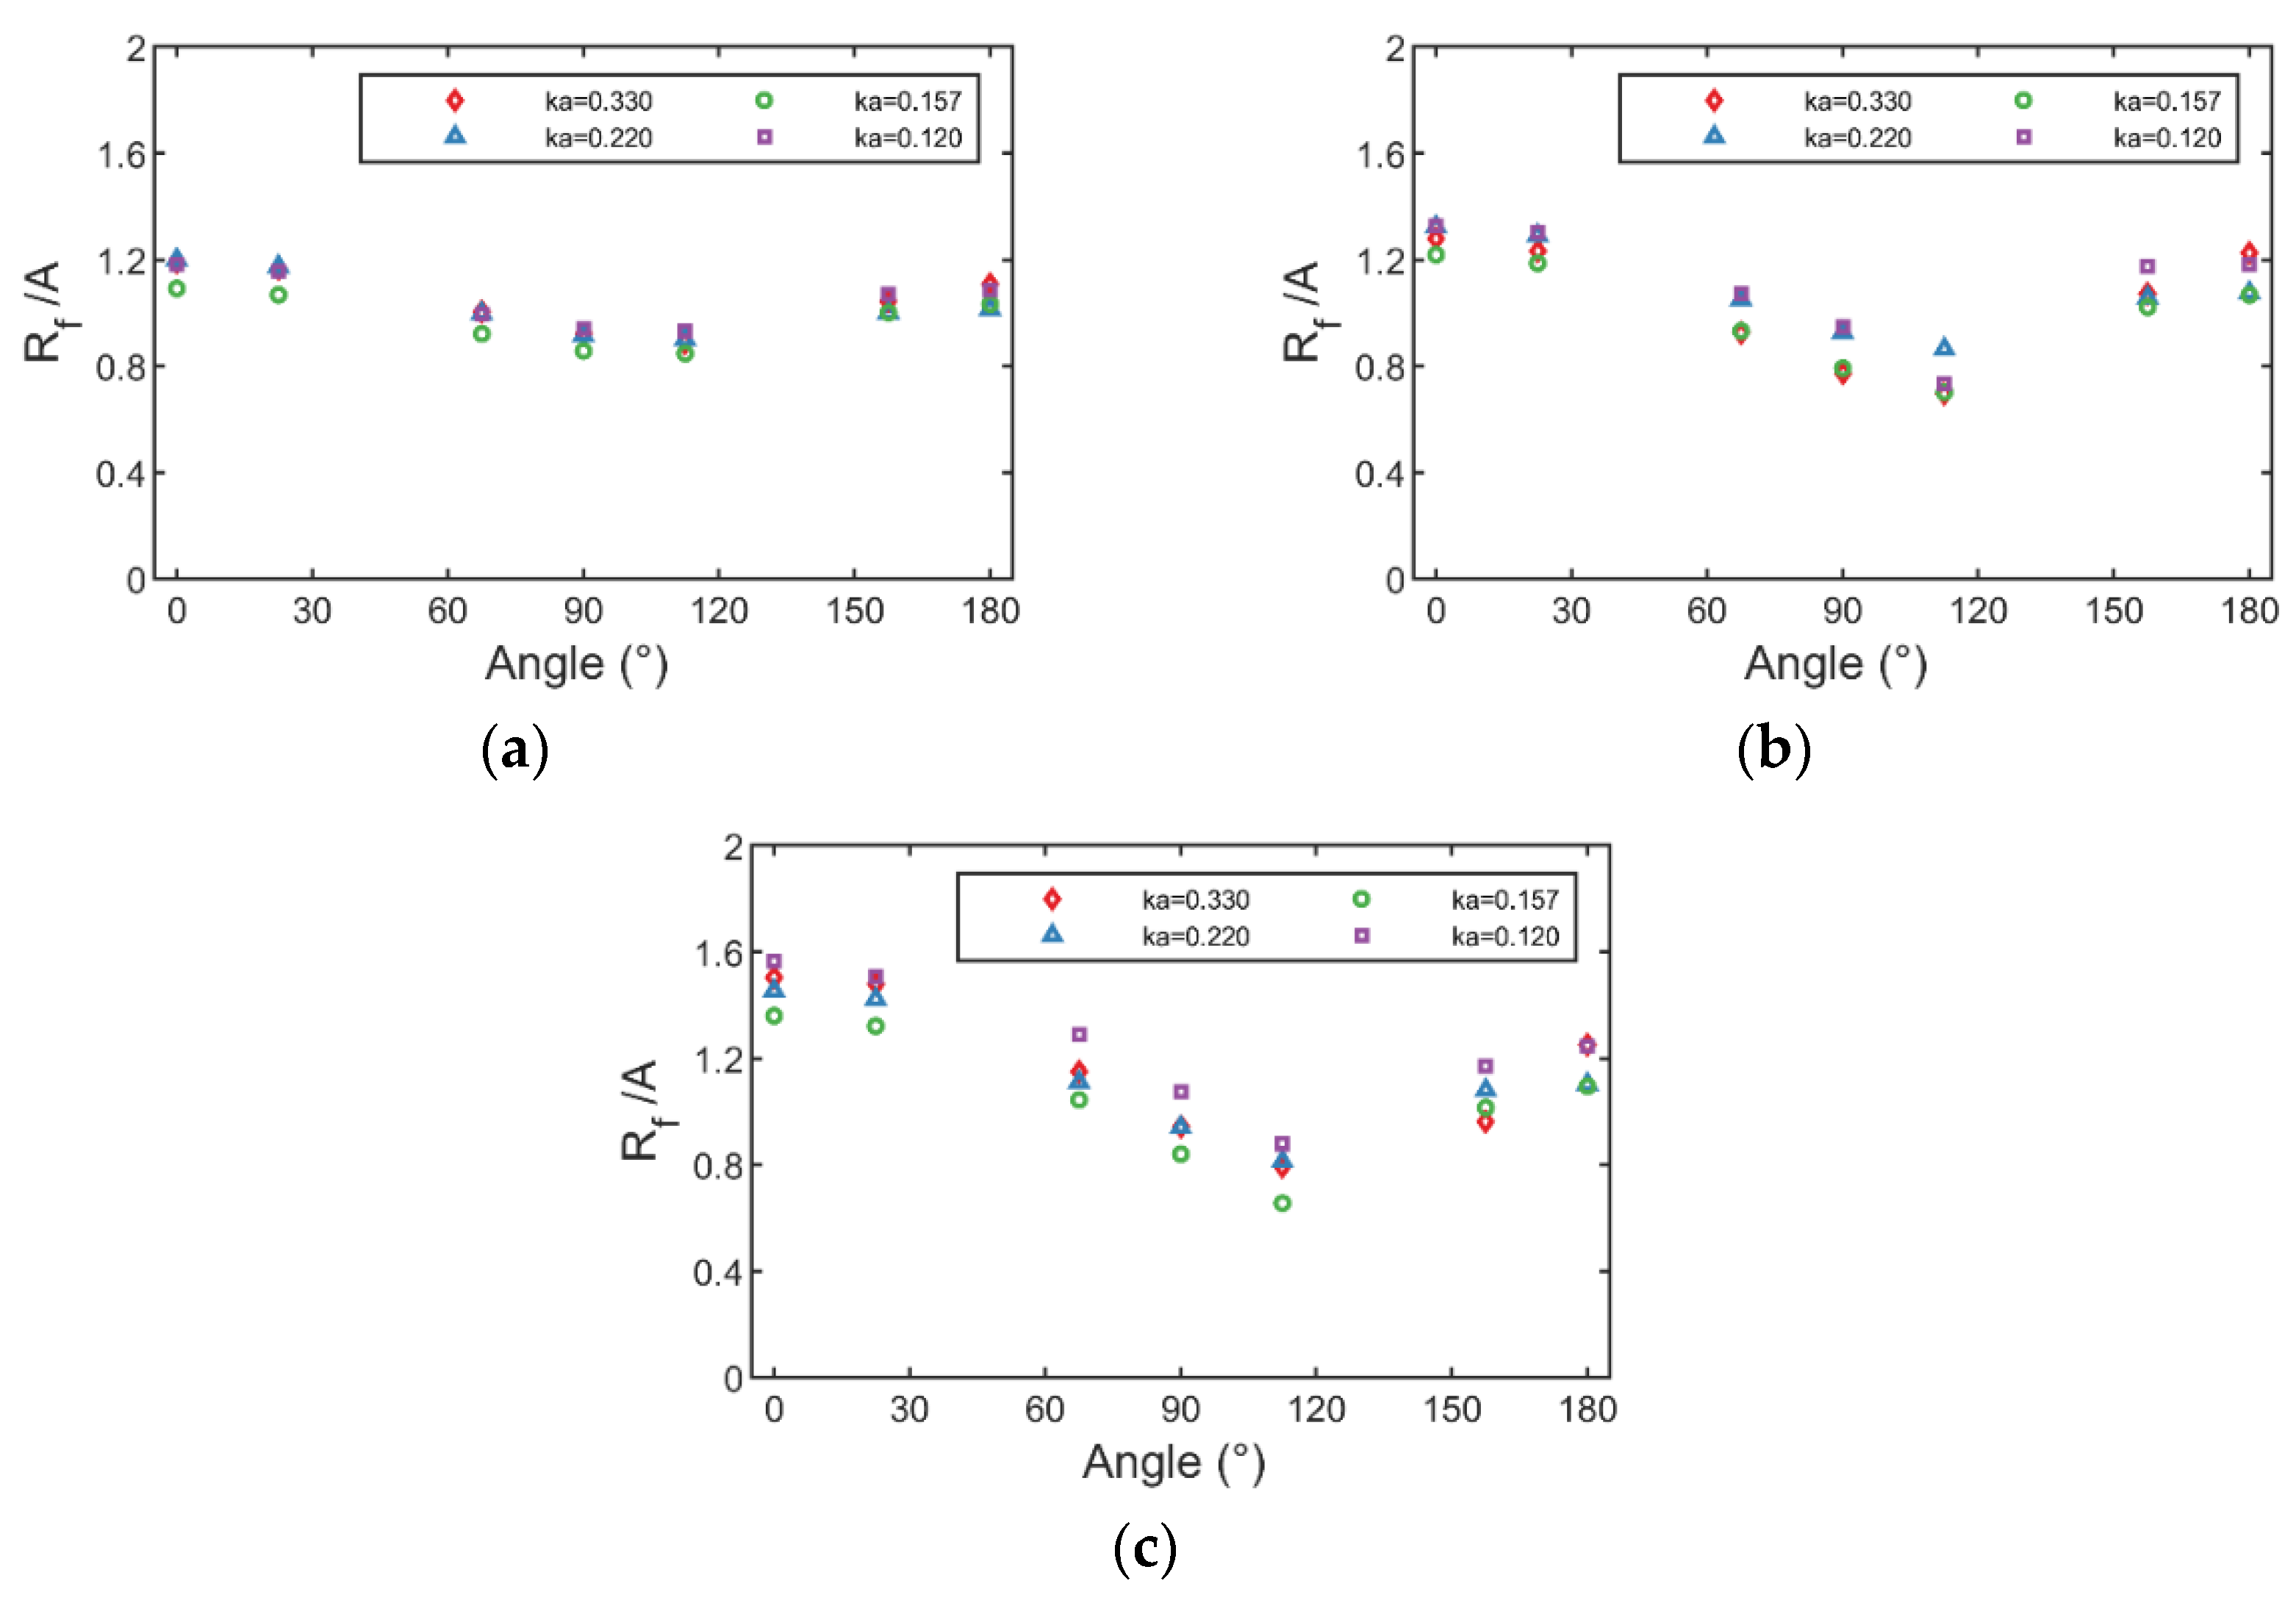
For the representative working conditions selected in the previous section, the dimensionless maximum run-up height R f / A of each wave surface of the nine circumferential wave measuring points ( R f is the mean value of the maximum wave surface height in five periods after the wave surface time series curve of each measuring point is stable) is calculated, and the dimensionless maximum run-up height distribution results (the maximum run-up appreciation of each measuring point) around the cylinder under each working condition are obtained. Figure 15 shows the distribution of dimensionless maximum run-up height with different wave steepness under the same scattering parameter (the scattering parameters are the same under the same period). It can be seen that the wave run-up height of the fixed truncated cylinder under regular waves is W-shaped distribution and is symmetrical about the x o z plane. The maximum wave run-up height appears at 0°, and the maximum run-up height can reach 1.57 times the wave amplitude, where the conversion of wave kinetic energy to potential energy is the largest. The minimum run-up height appears between 90° and 150°, and the run-up height is about 0.8 times the wave amplitude. The wave run-up is lower than the incident wave height, and the wave height decreases because of the dissipation of energy caused by the nonlinearity of the cylindrical shoulder. The maximum run-up height at 180° is only smaller than the 0° case, which is close to 1 times the incident wave amplitude. This is because the two wave diffraction fields generated in the shoulder of the cylinder will converge here, resulting in local elevation of the wave surface in this area.
In addition, with the increase of wave steepness, the discreteness of the wave run-up height distribution curve (half w type) becomes larger, and the concaveness also increases; that is, the increase of wave steepness will lead to the increase and decrease of run-up. The possible reason for this phenomenon is that the increase of wave steepness causes the increase of wave nonlinearity, resulting in the increase of average water level. The run-up height of the cylinder near 0° (wave-front side) increases with the increase of wave steepness, and decreases at the shoulder. The run-up height near 180° has little change with wave steepness, which is close to the incident wave height.
Figure 16 shows the distribution of dimensionless maximum run-up height under different scattering parameters at the same wave steepness. It can be seen that the distribution curves of dimensionless maximum run-up height under different scattering parameters have little difference at low wave steepness, and the overall trend is relatively flat. With the increase of wave steepness, the differences of dimensionless maximum run-up distribution curves of different scattering parameters increase gradually, the dimensionless run-up height in the 0° region increases gradually, the 90° region decreases continuously, the 180° region remains basically unchanged, and the distribution curve is concave. In addition, it is also found that under the same wave steepness, the dimensionless maximum run-up height distribution curve under k a = 0.157 is basically lower than that under other scattering parameters.

3.2.2. Radial Run-Up Height Distribution

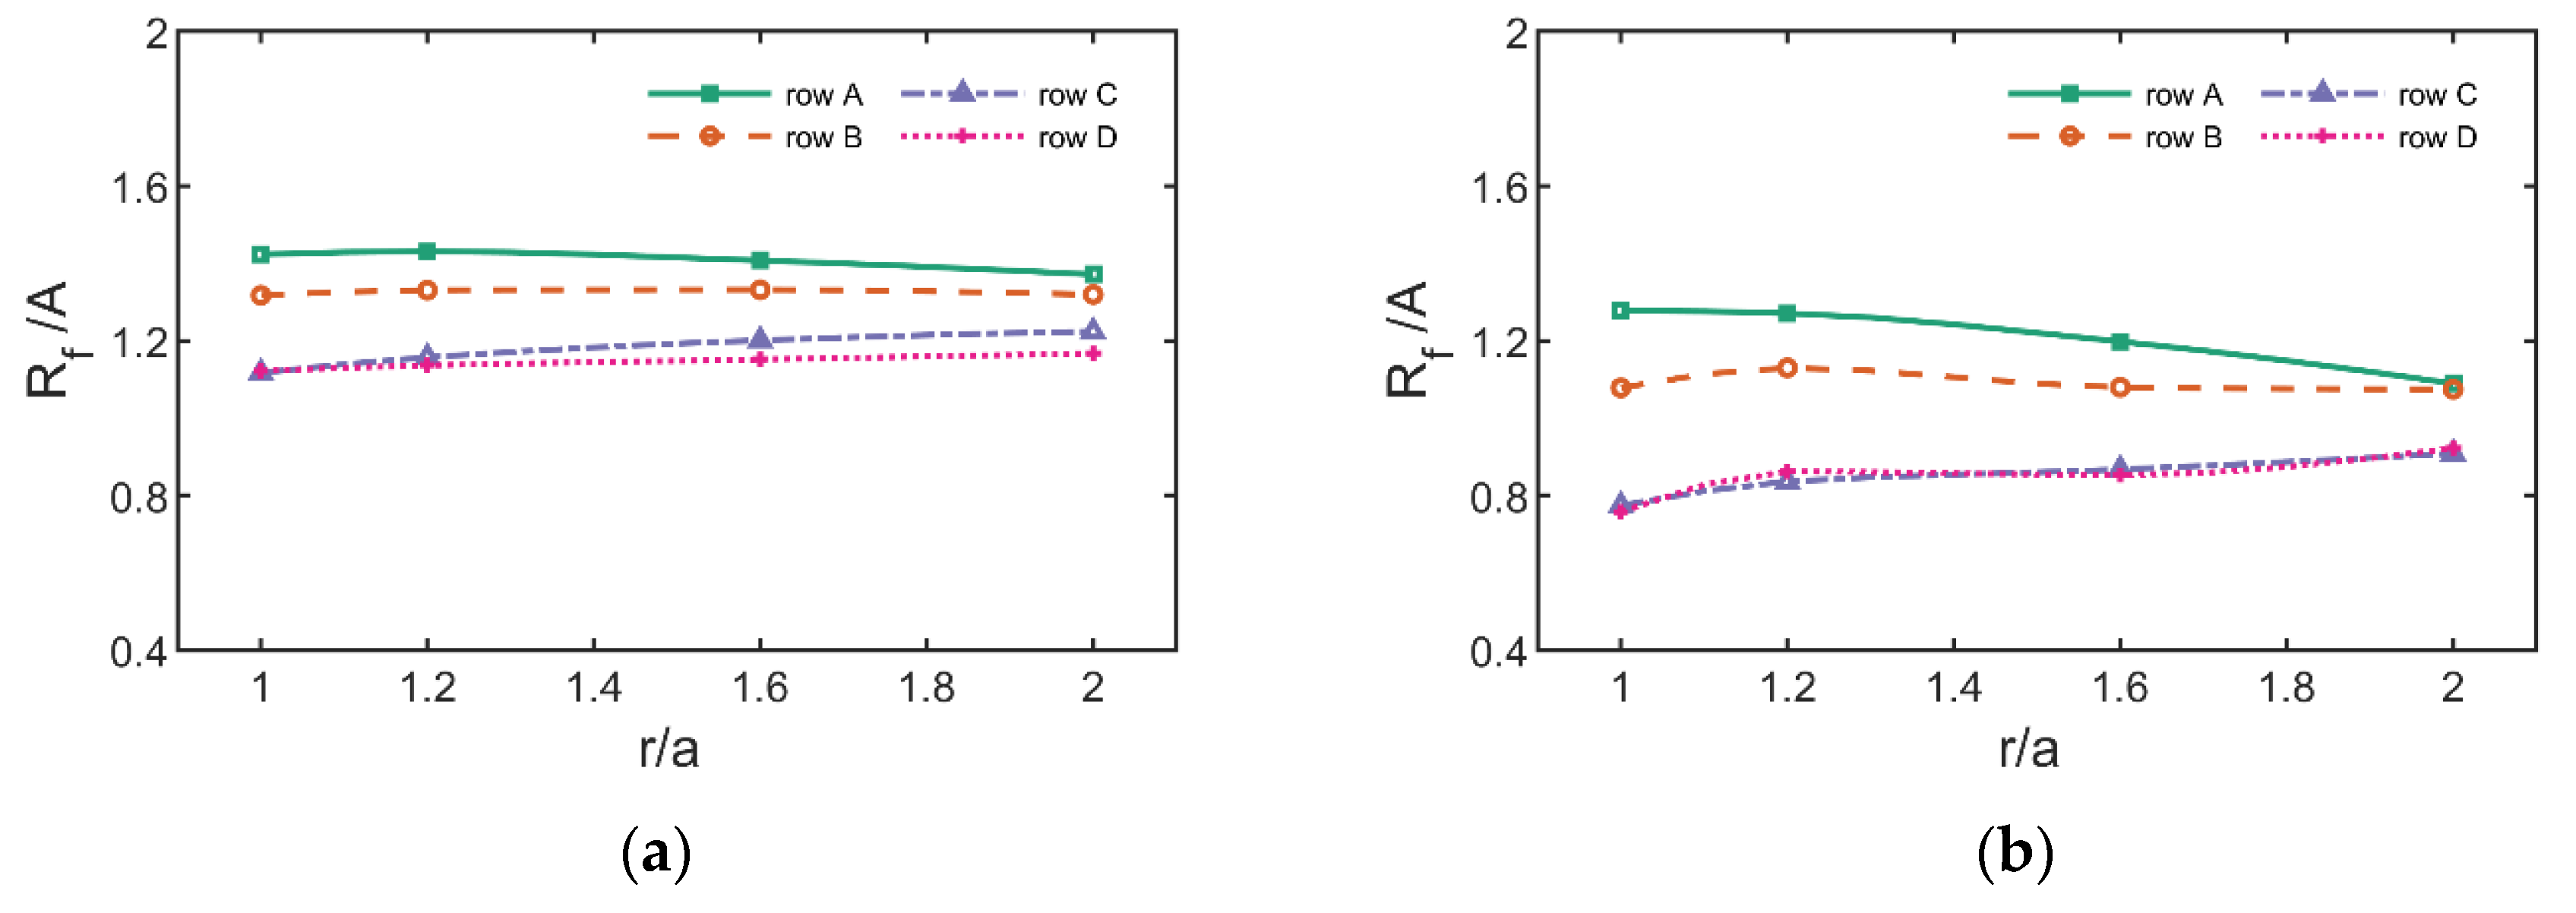
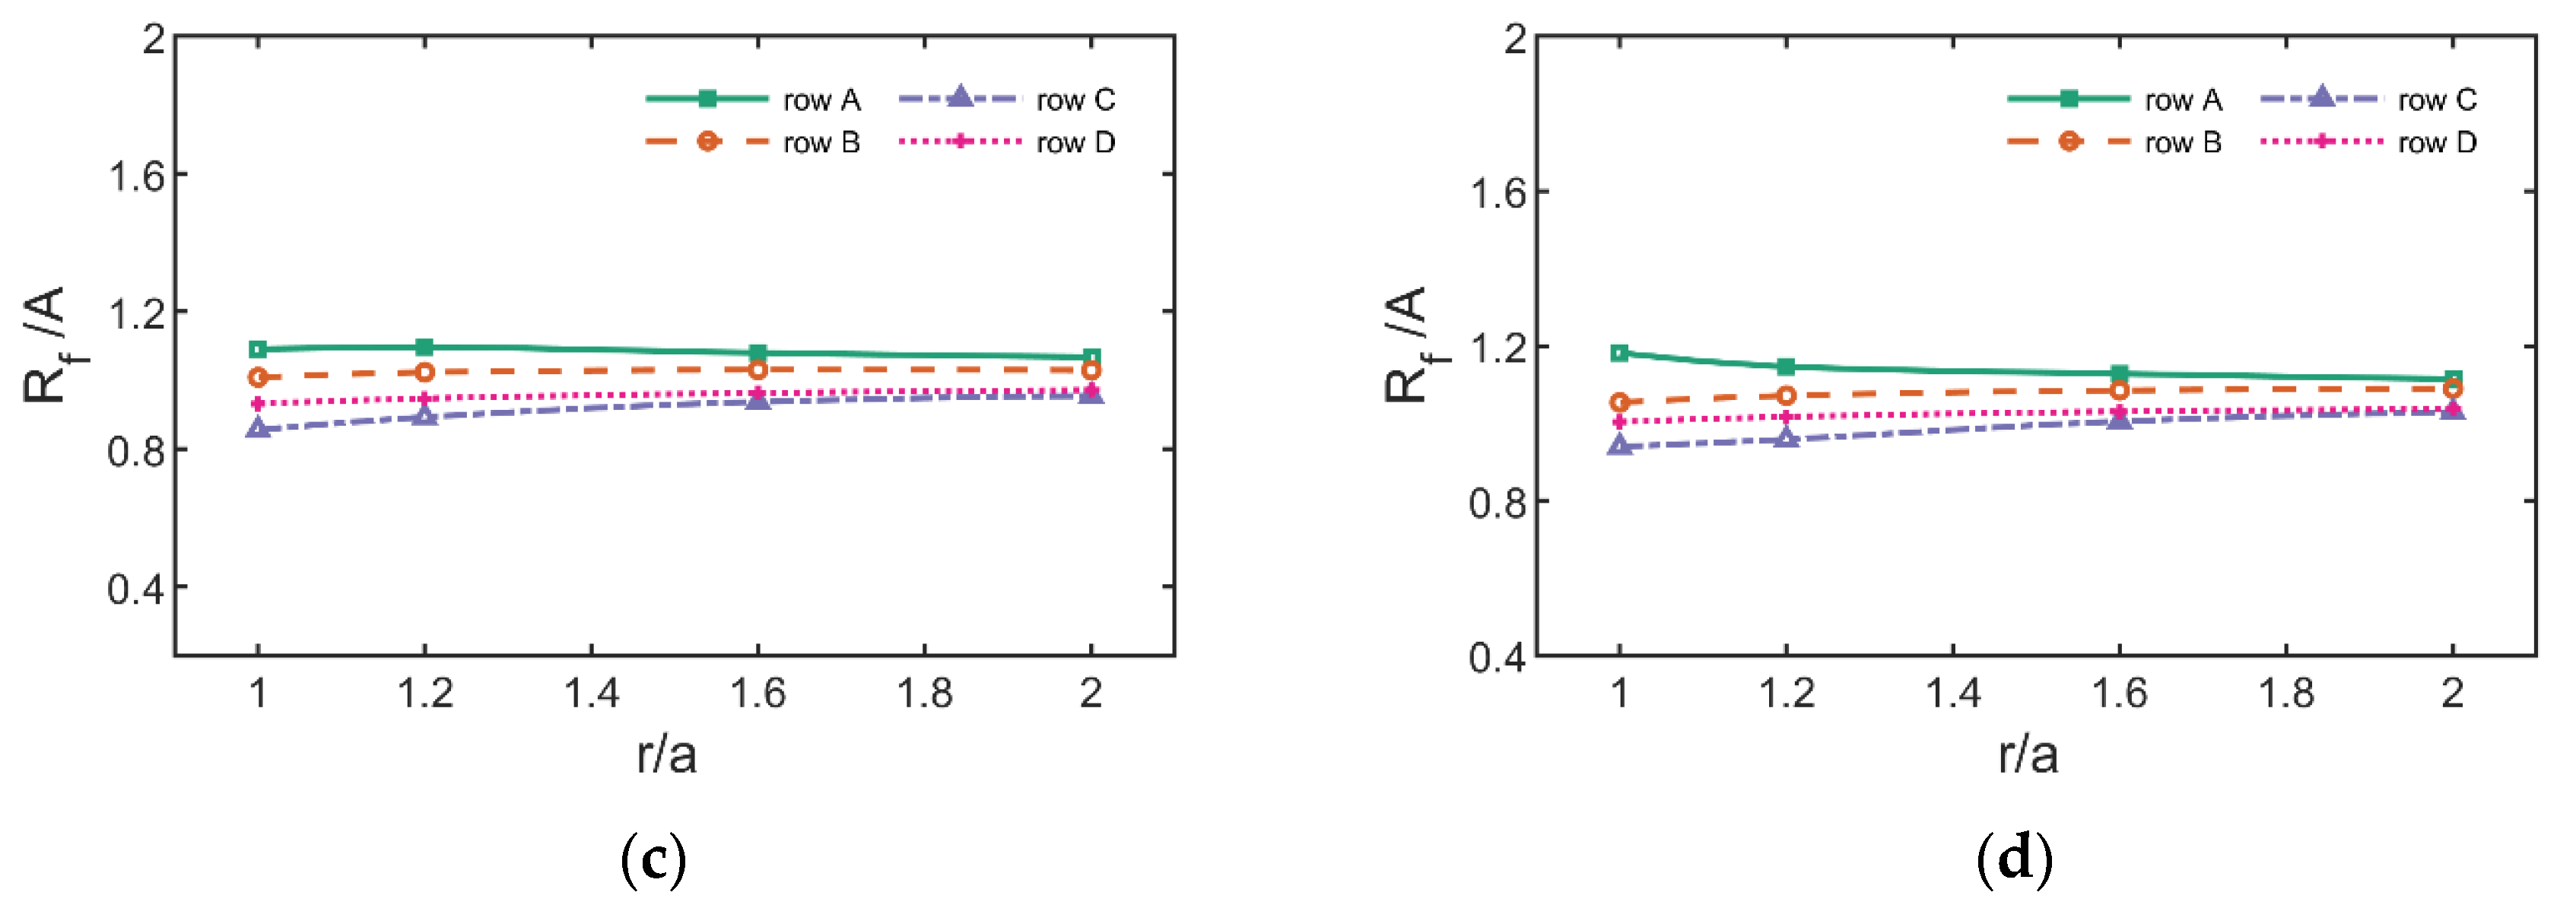
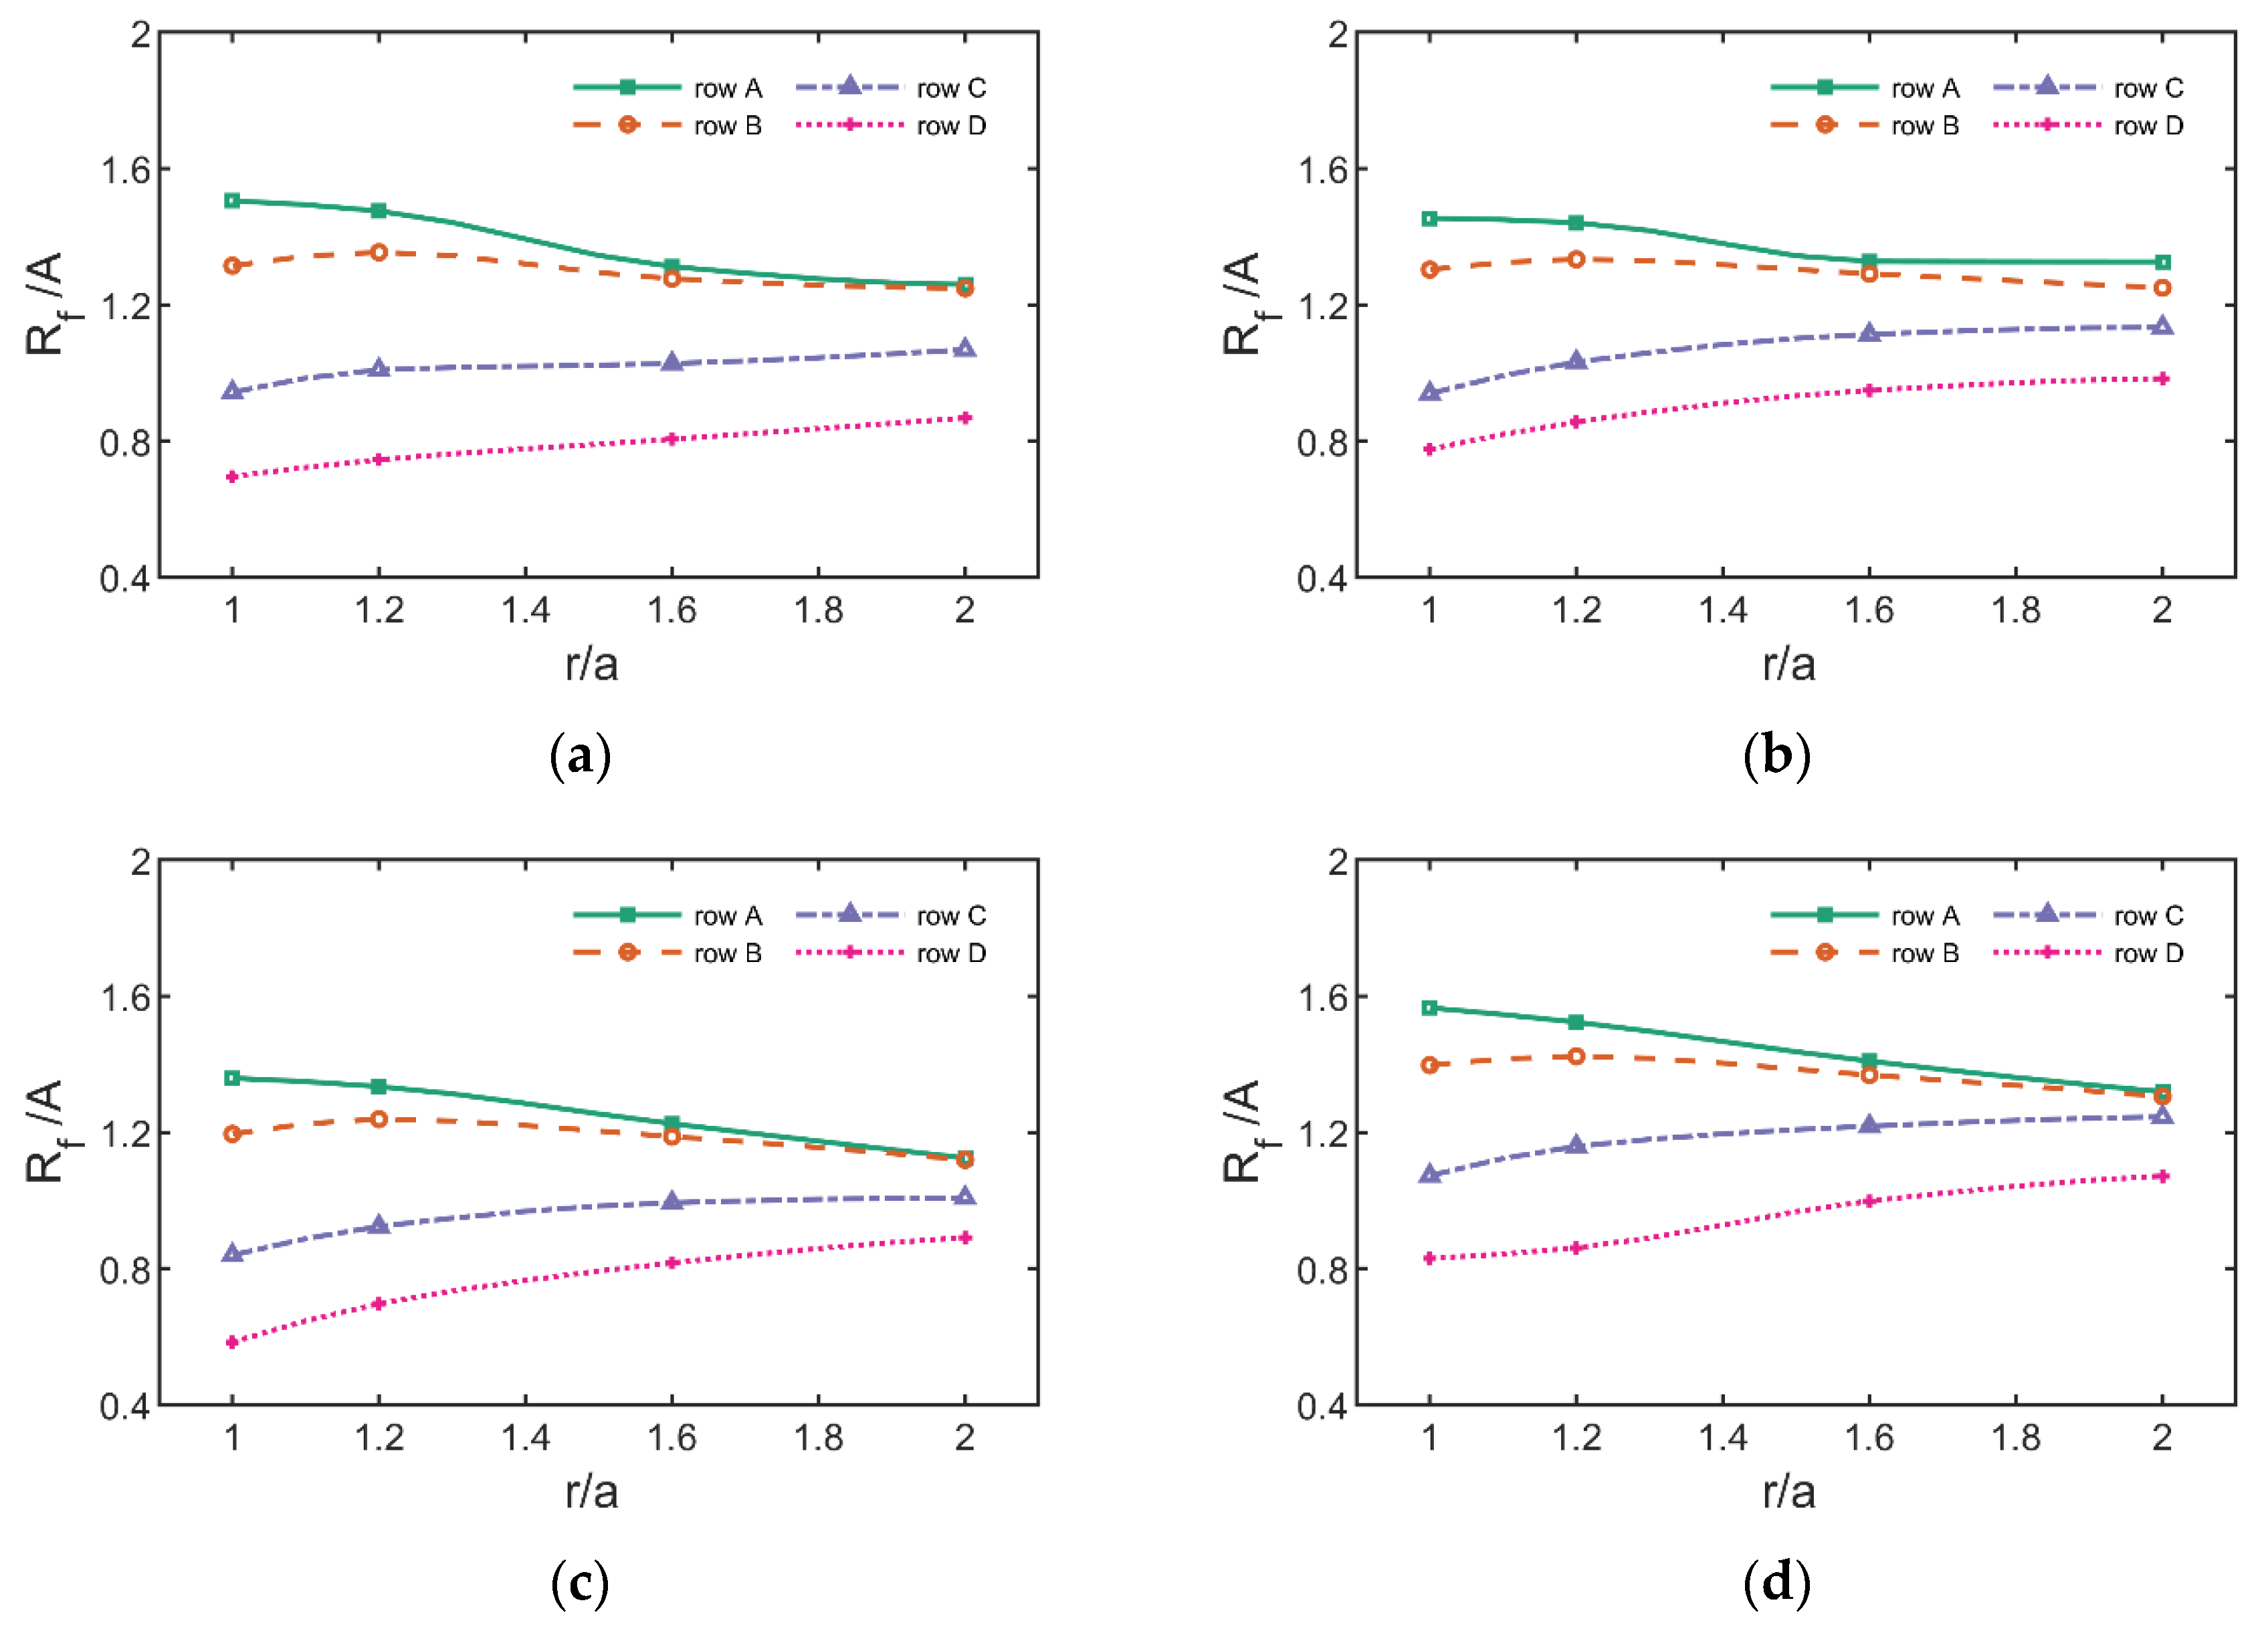
Figure 17 and Figure 18 show the distribution of dimensionless maximum wave run-up height at each radial measuring point representing the working condition (A–D column, representing 0°, 45°, 90°, and 135° directions, respectively). It can be seen that when the wave steepness is small, the dimensionless maximum run-up height around the cylinder changes little in each radial direction, and the curve is relatively flat. The distribution curve of each column is close. With the increase of the wave steepness, the nonlinearity of the wave increases, and the dispersion of each data point on the same radial distribution curve becomes larger. The deviation between the dimensionless maximum run-up height curves of each radial becomes larger, and the radial values of columns A and B decrease gradually. The values of columns C and D gradually increase along the radial direction, and the two sides form a conjugate relationship.
In the front of the cylinder (column A, B), the dimensionless maximum run-up height gradually decreases along the radial direction. This indicates that a large wave surface uplift has occurred upstream before the wave propagates to the cylinder, which is consistent with the time t 0 in Figure 14. In addition, the above phenomena also show that the increase in wave steepness will lead to the increase of run-up in the upstream region of the cylinder and the decrease of run-up in the corresponding downstream region.

3.3. The Variation of Horizontal Wave Force with Scattering Parameters

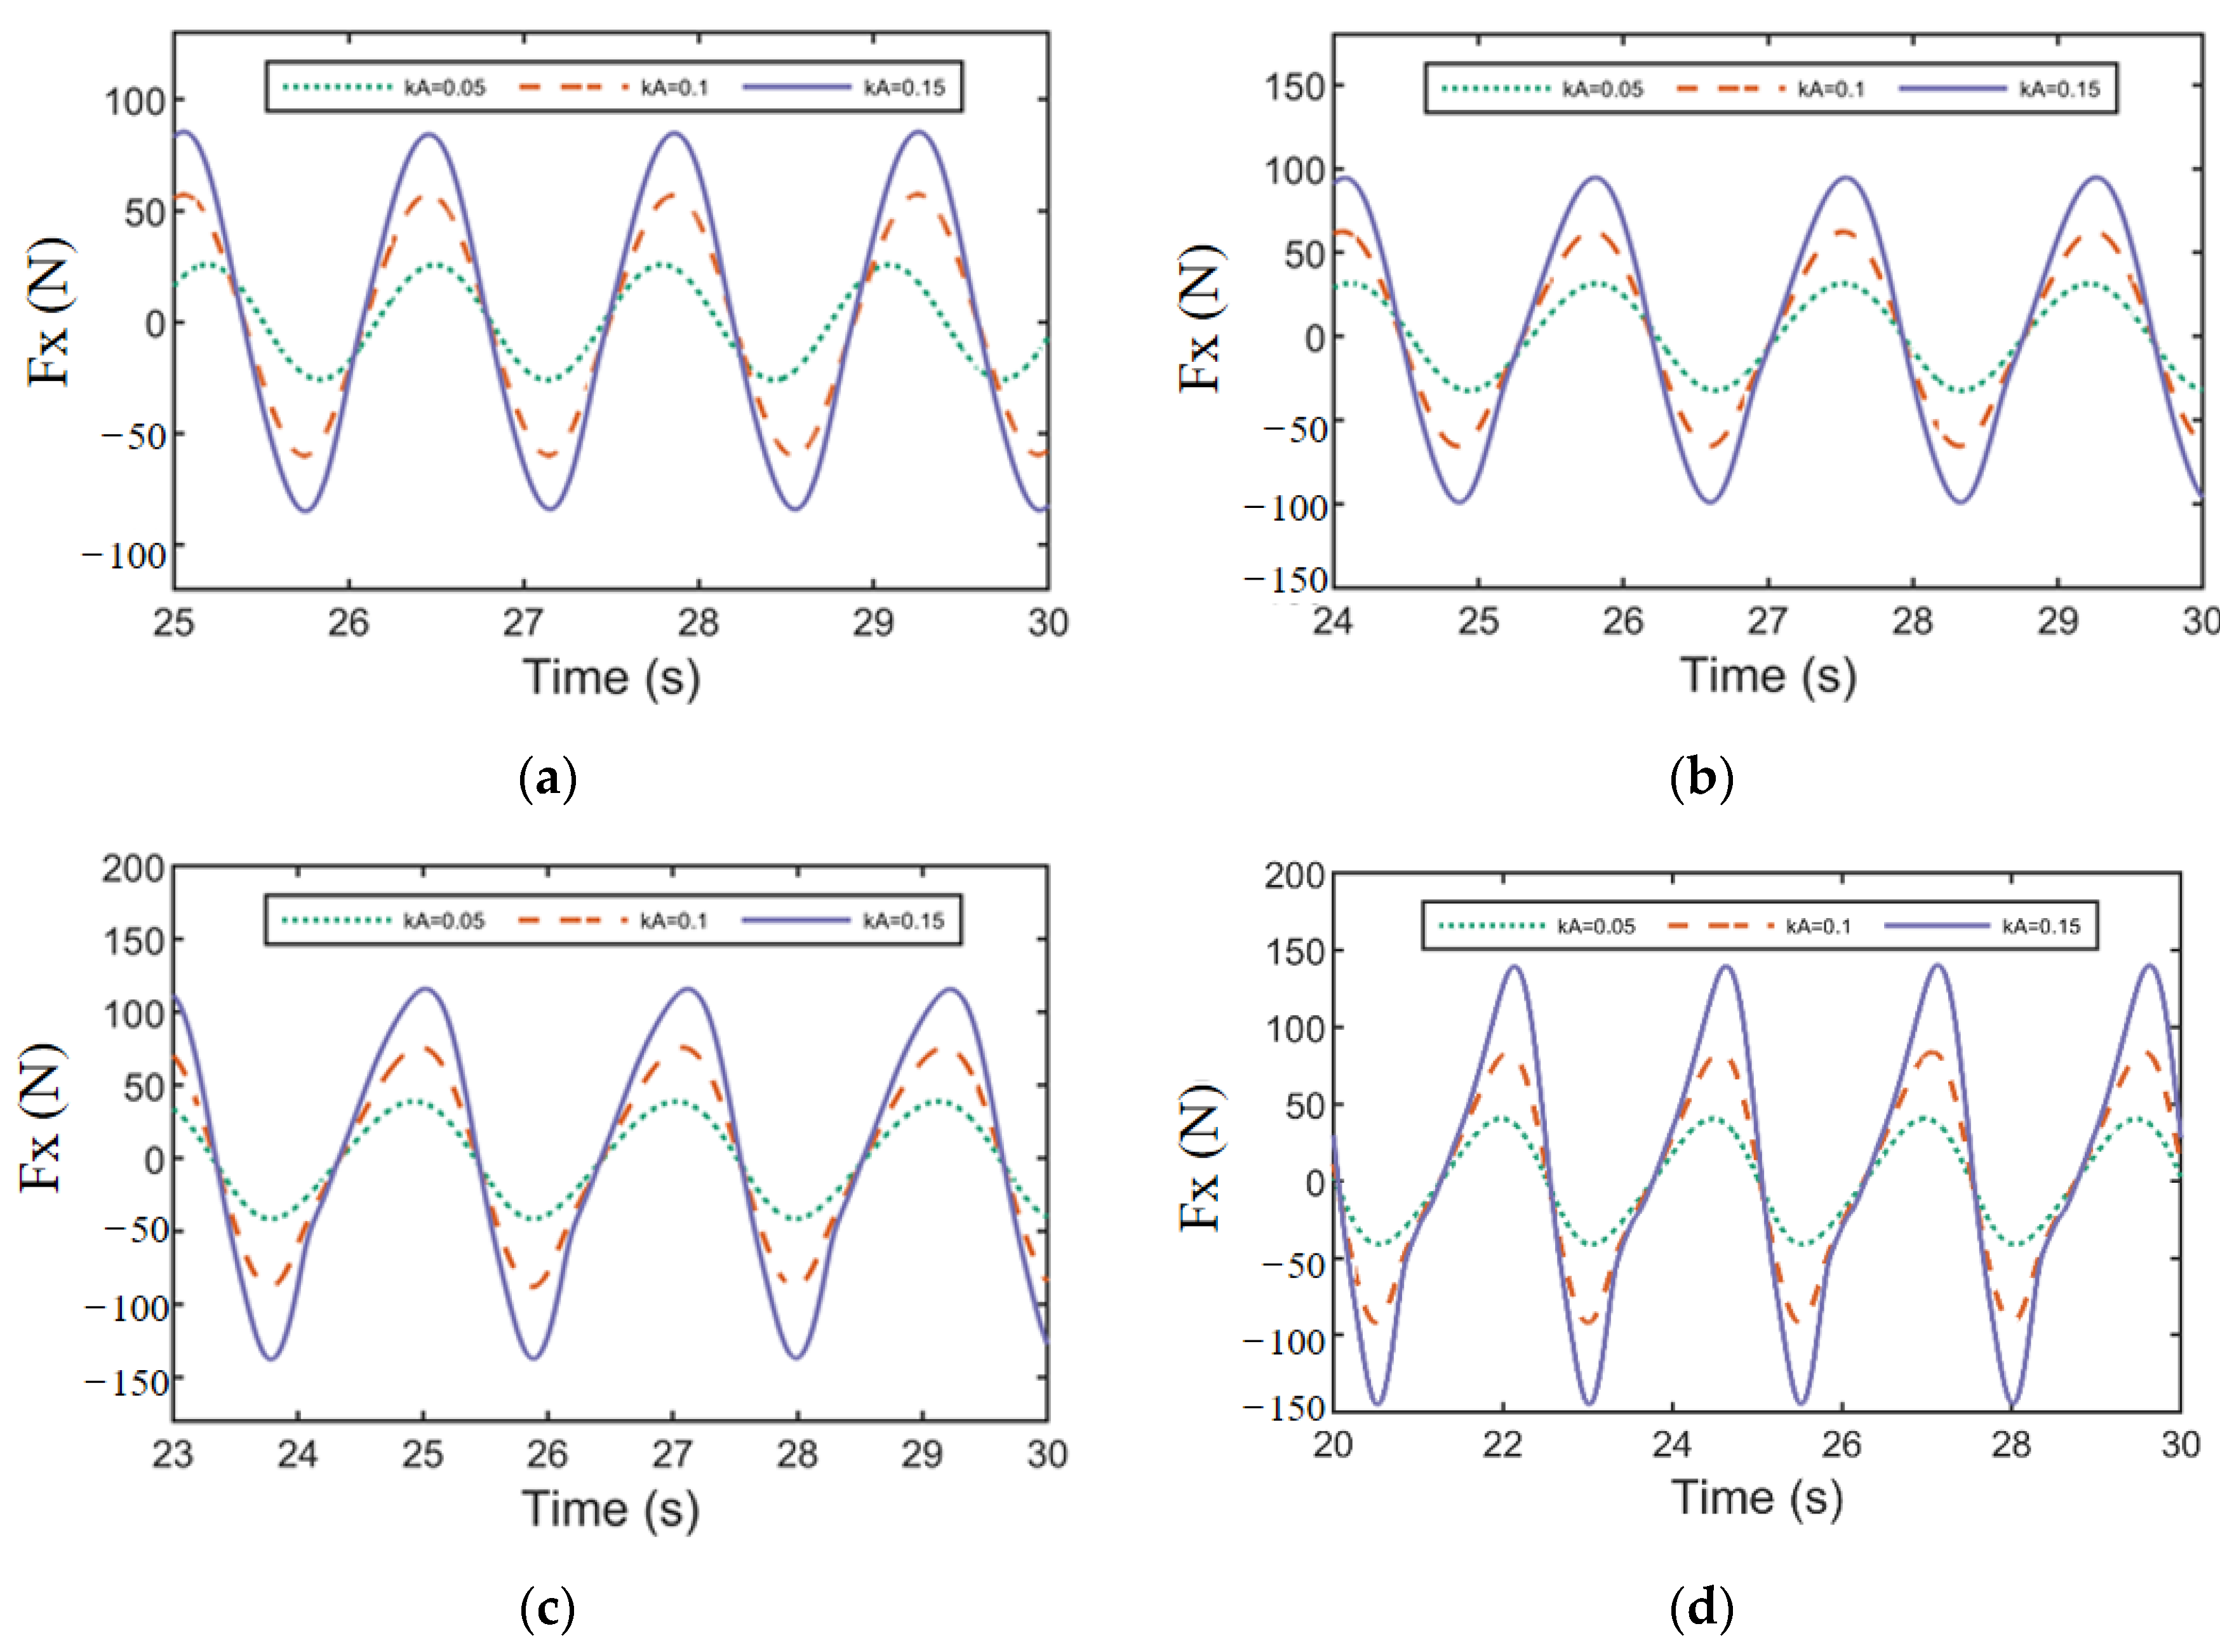
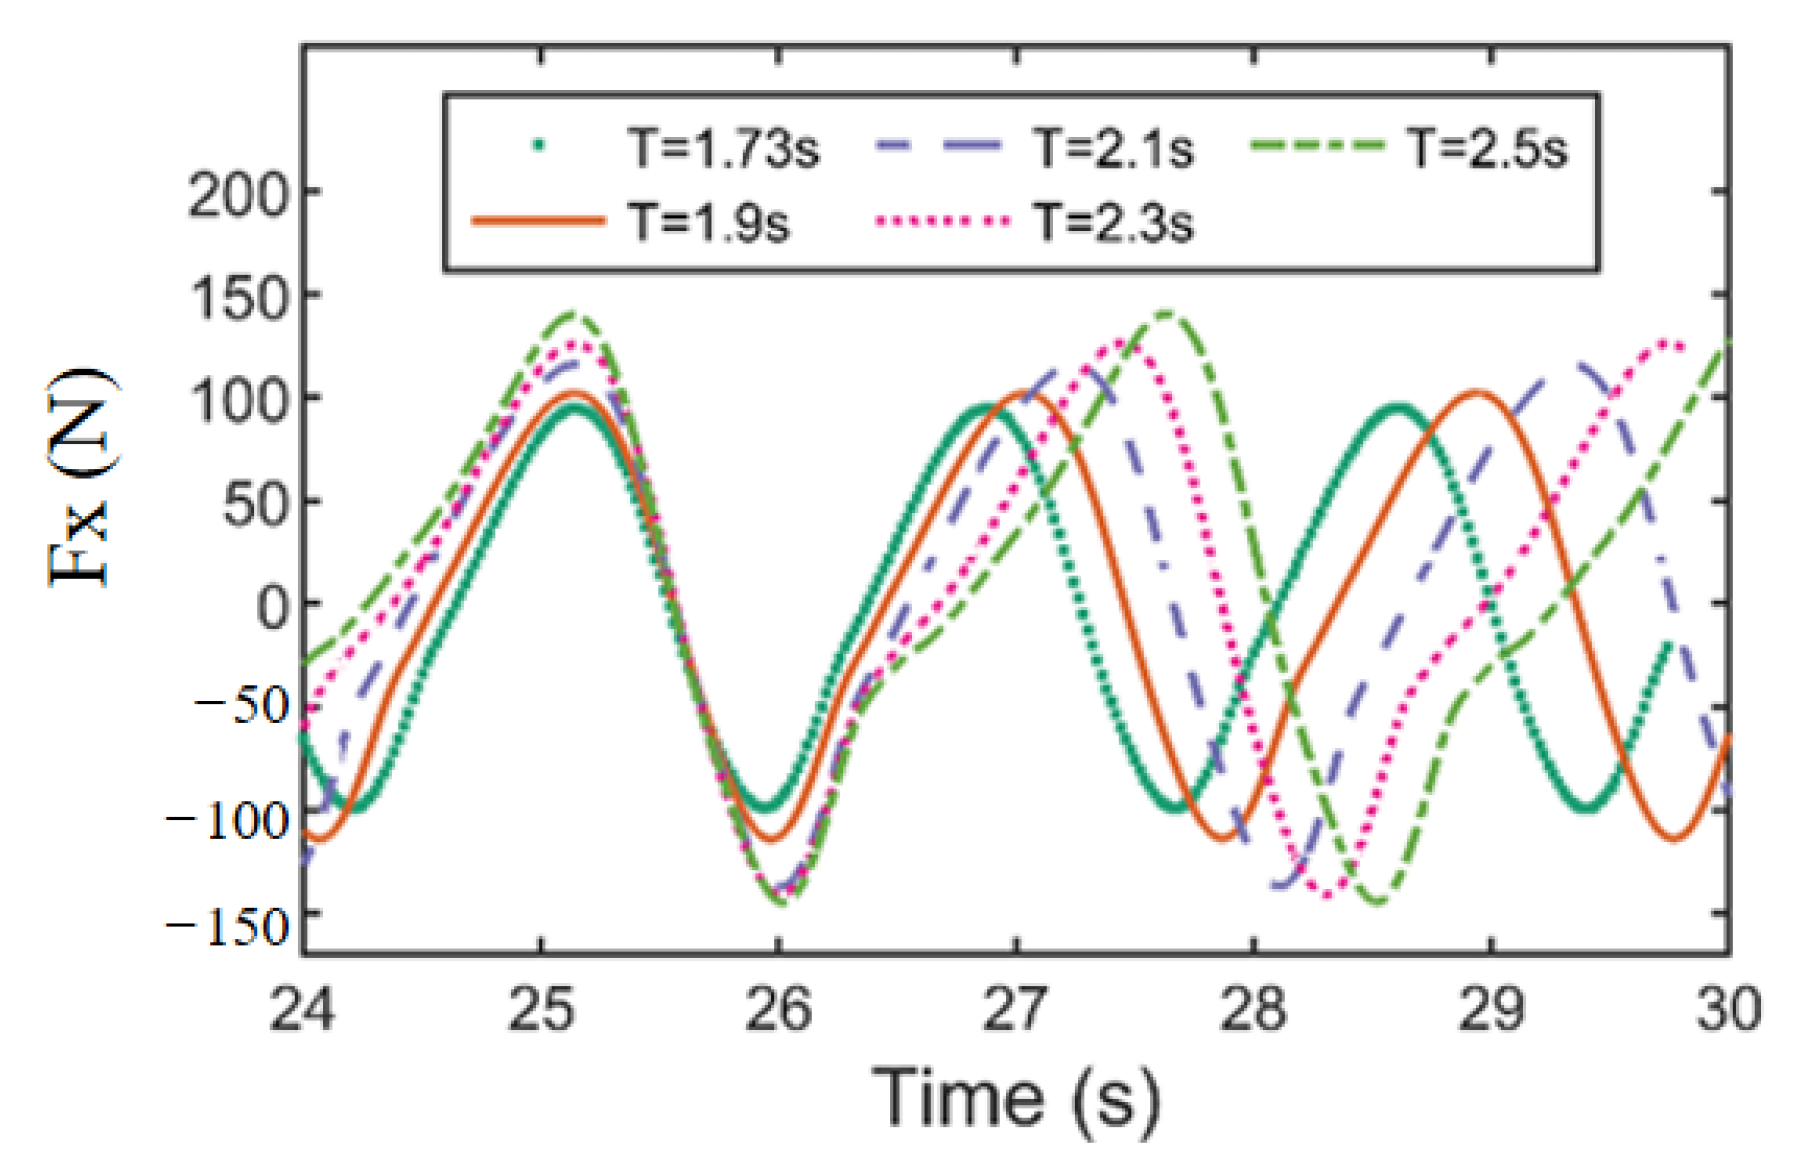
Figure 19 shows the time series curves of horizontal wave force under different wave steepnesses for each representative working condition. It can be observed that the nonlinearity of the time series curve of the horizontal wave force increases with the increase of wave steepness. Under the same wave steepness, the larger the period is, the larger the amplitude of incident wave is, the stronger the nonlinearity of the time series curve is, and the greater the wave force is. At the same time, it is also found that, with the increase of the period (wave amplitude increases), the absolute value of the peak of the horizontal wave force is less than the absolute value of the trough, and the amplitude is asymmetric, that is, the mean value of the wave force moves downward, as shown in Figure 20. It can also be seen from Figure 20 that the time series curves of wave forces in different periods are similar before the peak passes through the cylinder, but they are different after the peak passes through the cylinder. The greater the period, the stronger the nonlinearity of the time series curve, and there is a trend of secondary peaks (the second wave peak only appears when k A > 0.3 and when it is a long-wave). Rainey et al. [33] considered that the reason for the secondary loading cycle was due to the cylinder’ s obstruction of the wave peak, which caused the filling of the downstream cavity behind the cylinder.
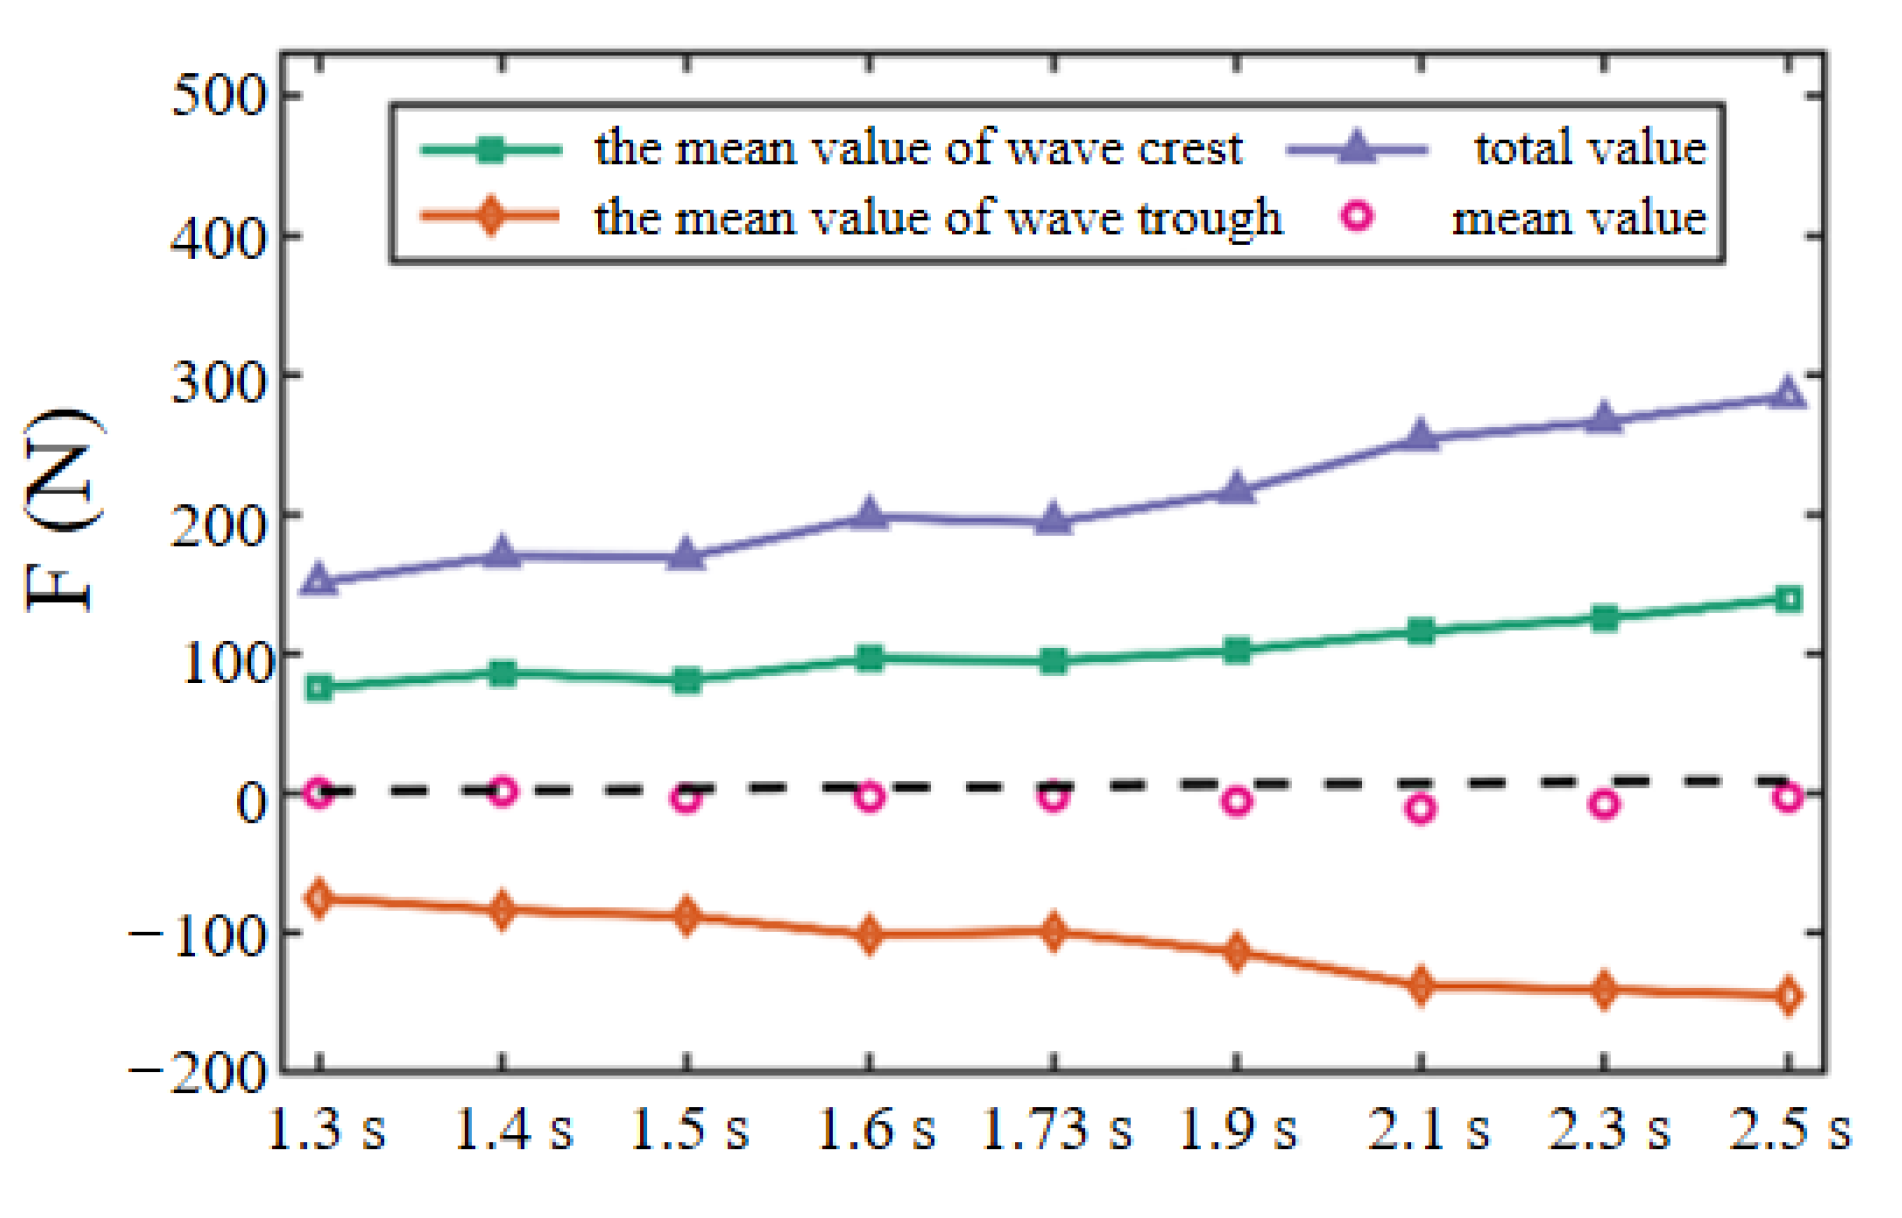
In order to further analyze this phenomenon, nine periods with wave steepnesses of 0.15 were selected to decompose the wave force, and the mean value of the wave crest, the mean value of the wave trough, the total value (the difference between the wave crest and the wave trough value) and the mean value of the time series curve are investigated, respectively. As shown in Figure 21, it can be seen that the mean value of the horizontal wave force is 0 in the short-wave cases, but with the increase of the period, in the long-wave cases, the absolute value of the wave trough is greater than the absolute value of the wave, and the horizontal wave force moves down. The reason for the above amplitude asymmetry is that, under the same wave steepness, the nonlinearity of the wave force time series curve increases with the decrease of scattering parameters, and the nonlinearity is more obvious in long-wave cases.
For further analysis of the horizontal wave force, the dimensionless horizontal wave force is defined:
f x = F x ρ g H a h k h tanh ( k h )
where f x is the dimensionless horizontal wave force; and F x is the average wave force amplitude, which is obtained by calculating the standard deviation (STD) of the stable wave force time series results of five periods:
F x = 2 S T D ( F x ( t ) )
where F x t represents the horizontal wave force time series result; and S T D is the standard deviation calculation.
For the fixed vertical cylinder and the truncated cylinder under linear waves, the horizontal wave force on them can be obtained, respectively, according to the linear diffraction theory, as follows:
F F ( t ) = 2 ρ g H k 2 A ( k a ) ( tanh k d ) cos ( ω t α )
F T ( t ) = 2 ρ g H k 2 A ( k a ) sinh k ( b d ) cosh k d + tanh k d cos ( ω t α )
A ( k a ) = 1 J 1 2 ( k a ) + Y 1 2 ( k a ) , α = tan 1 J 1 ( k a ) Y 1 ( k a )
where ω is the angular frequency of the incident wave; b is the cylinder draft; and J 1 2 k a and Y 1 2 k a are the first-order derivatives of the first-order and second-class Bessel functions, respectively.
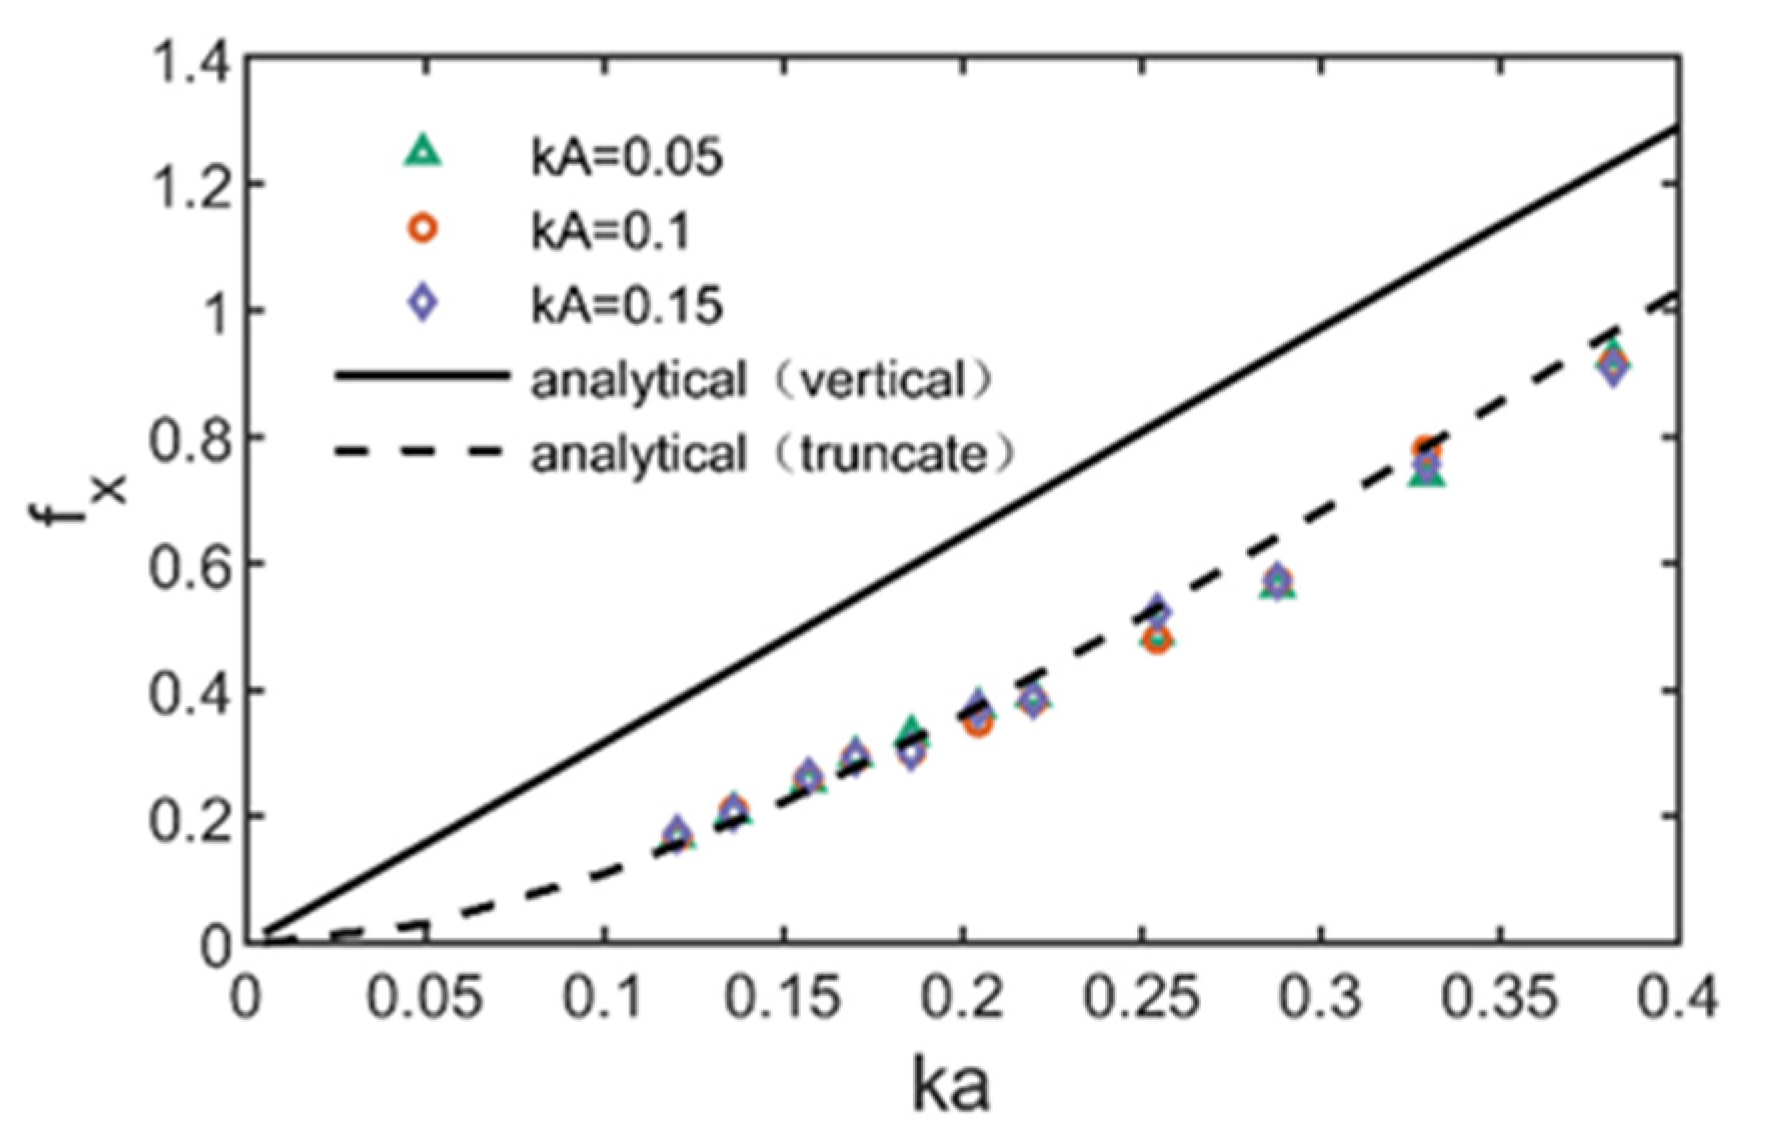
Figure 22 shows the variation of the dimensionless horizontal wave force f x with the scattering parameter k a under all conditions and the comparison results with the linear diffraction theory formula. It can be observed that, in the range of k a 0.1 0.4 , the dimensionless horizontal wave force is between 0.17 0.986 , the dimensionless horizontal wave force increases nonlinearly with the increase of k a , and the dimensionless horizontal wave force does not change with the change of wave steepness parameter; that is, in the range of small scattering parameters, the wave steepness parameter is not a significant indigenous influencing parameter of the horizontal wave force. By comparing the simulation value with the theoretical value, it can also be found that the draft has little effect on the maximum run-up height of the fixed truncated cylinder under regular waves, but it has a great influence on the horizontal wave force. The horizontal wave force of the vertical cylinder (upright) and the truncated cylinder is very different. The simulation value is in good agreement with the theoretical value of the fixed truncated cylinder when the scattering parameters are small (long-wave), but with the increase of the scattering parameters( k a > 0.25 ), there is a deviation between the two, indicating that the linear diffraction theory hypothesis overestimates the wave force at high frequencies, which is related to the limitation of the small amplitude hypothesis of the linear diffraction theory.

4. Conclusions

Based on OpenFOAM, a three-dimensional numerical wave flume is established to simulate the interaction between regular waves and fixed truncated cylinders. The wave run-up and wave load results of fixed truncated cylinders are compared. The main results of this study can be summarized as follows:
(1)
The fixed cylinder draft has little effect on the maximum wave run-up height, but has a significant effect on the horizontal wave force. The maximum wave run-up height of a fixed truncated cylinder can be predicted theoretically by a fixed vertical cylinder run-up height estimation formula. The estimation formula proposed by Vos et al. [11] has good prediction at low wave steepness, but it will be underestimated with the increase of wave steepness, while the estimation formula proposed by Bonakdar et al. [12] can predict the wave run-up height well.
(2)
At the same wave steepness, the radial dimensionless run-up height increases with the increase of scattering parameters. The radial run-up height distribution gradually decreases in the upstream along the radial direction of the cylinder, and increases in the downstream, indicating that before the wave propagates to the cylinder, there is a large wave surface uplift in the upstream due to the scattering of the cylinder. At the same time, the increase of wave steepness will also lead to the increase of run-up height in the upstream region of the cylinder, and the decrease of run-up height in the corresponding downstream region.
(3)
Under the same wave number, the average amplitude of horizontal wave force increases linearly with the increase of incident wave radiation. Under the wave parameters and structural parameters simulated in this paper, the dimensionless horizontal wave force increases nonlinearly with the increase of scattering parameters, and the wave steepness parameter is not the significant influence parameter. When the scattering parameter is small, the theoretical value is consistent with the simulation results. With the increase of scattering parameters, the linear diffraction theory will overestimate the horizontal wave force.

5. Future Work

In this paper, only the 2nd order Stokes regular waves are introduced to investigate the interaction between waves and fixed truncated cylinders, and there is still further work to be carried out:
(1)
The effects of larger wave steepness on the wave run-up and wave load could be considered.
(2)
The wave conditions in practical engineering applications are irregular, such as solitary waves, extreme waves, etc., and wave breaking occurs when waves interact with structures. When the extreme waves break, water and air will react violently, and there will be an obvious turbulence effect, which will have a strong impact on structures, and are different from the effects caused by unbroken waves [34]. Therefore, the effects of extreme waves on the wave run-up and wave load could be considered.
(3)
There are many factors that affect the wave run-up, such as the scattering parameters, the wave steepness, the wavelength to diameter ratio, the water depth, etc. This paper mainly focuses on the effects of scattering parameters and wave steepness on the wave run-up and wave load; the effects of other parameters could be studied in further investigations.

Author Contributions

Conceptualization, B.W.; methodology, Y.L.; writing—original draft preparation, F.W. and S.G.; writing—review and editing, J.Y. All authors have read and agreed to the published version of the manuscript.

Funding

This work was supported by the National Natural Science Foundation of China [Grant NOs. 52071301; 52101333; 52201311], the Natural Science Foundation of Liaoning Province [Grant No. 2021-KF-16-01], and the Fundamental Research Funds for the Central Universities.

Institutional Review Board Statement

Not applicable.

Informed Consent Statement

Not applicable.

Data Availability Statement

Not applicable.

Conflicts of Interest

No potential conflict of interest was reported by the authors.

References

  1. Allsop, W.; Cuomo, G.; Tirindelli, M. New prediction method for wave-in-deck loads on exposed piers/jetties/bridges. In Proceedings of the 30th International Conference, San Diego, CA, USA, 3–8 September 2006. [Google Scholar] [CrossRef]
  2. Xiang, T.; Istrati, D.; Yim, S.C.; Buckle, I.G.; Lomonaco, P. Tsunami Loads on a Representative Coastal Bridge Deck: Experimental Study and Validation of Design Equations. J. Waterw. Port Coastal Ocean Eng. 2020, 146, 04020022. [Google Scholar] [CrossRef]
  3. Istrati, D.; Buckle, I.; Lomonaco, P.; Yim, S. Deciphering the Tsunami Wave Impact and Associated Connection Forces in Open-Girder Coastal Bridges. J. Mar. Sci. Eng. 2018, 6, 148. [Google Scholar] [CrossRef]
  4. Zhao, H.; Teng, B.; Li, G.; Lin, Y. An experimental study of first—harmonic wave force on vertical truncated cylinder. China Offshore Platf. 2003, 18, 12–17. [Google Scholar]
  5. Boo, S. Measurements of higher harmonic wave forces on a vertical truncated circular cylinder. Ocean Eng. 2006, 33, 219–233. [Google Scholar] [CrossRef]
  6. MacCamy, R.; Fuchs, R. Wave Forces on Piles: A Diffraction Theory; US Beach Erosion Board: New York, NY, USA, 1954. [Google Scholar]
  7. Kim, M.-H.; Yue, D.K.P. The complete second-order diffraction solution for an axisymmetric body Part 1. Monochromatic incident waves. J. Fluid Mech. 1989, 200, 235–264. [Google Scholar] [CrossRef]
  8. Kriebel, D. Nonlinear wave interaction with a vertical circular cylinder. Part I: Diffraction theory. J. Waterw. Port Coast. Ocean. Eng. 1990, 17, 345–377. [Google Scholar] [CrossRef]
  9. Martin, A.; Easson, W.; Bruce, T. Runup on columns in steep, deep water regular waves. J. Waterw. Port Coast. Ocean. Eng. 2001, 127, 26–32. [Google Scholar] [CrossRef]
  10. Hallermeier, R.J. Nonlinear Flow of Wave Crests Past a Thin Pile. J. Waterw. Harb. Coast. Eng. Div. 1976, 102, 365–377. [Google Scholar] [CrossRef]
  11. De Vos, L.; Frigaard, P.; De Rouck, J. Wave run-up on cylindrical and cone shaped foundations for offshore wind turbines. Coast. Eng. 2007, 54, 17–29. [Google Scholar] [CrossRef]
  12. Bonakdar, L.; Oumeraci, H.; Etemad-Shahidi, A. Run-up on vertical piles due to regular waves: Small-scale model tests and prediction formulae. Coast. Eng. 2016, 118, 1–11. [Google Scholar] [CrossRef] [Green Version]
  13. Liu, Z.; Teng, B.; Ning, D.-Z.; Gou, Y. Wave-Current Interactions with Three-Dimensional Floating Bodies. J. Hydrodyn. 2010, 22, 229–241. [Google Scholar] [CrossRef]
  14. Wang, C.; Wu, G. Time domain analysis of second-order wave diffraction by an array of vertical cylinders. J. Fluids Struct. 2007, 23, 605–631. [Google Scholar] [CrossRef]
  15. Ohl, C.O.G.; Taylor, R.E.; Taylor, P.H.; Borthwick, A.G.L. Water wave diffraction by a cylinder array. Part 1. Regular waves. J. Fluid Mech. 2001, 442, 1–32. [Google Scholar] [CrossRef]
  16. Abbasnia, A.; Ghiasi, M. A fully nonlinear wave interaction with an array of submerged cylinders by NURBS numerical wave tank and acceleration potential. Ships Offshore Struct. 2014, 9, 404–417. [Google Scholar] [CrossRef]
  17. Bai, W.; Feng, X.; Taylor, R.E.; Ang, K. Fully nonlinear analysis of near-trapping phenomenon around an array of cylinders. Appl. Ocean Res. 2013, 44, 71–81. [Google Scholar] [CrossRef]
  18. Sun, L.; Zang, J.; Chen, L.; Taylor, R.E.; Taylor, P. Regular waves onto a truncated circular column: A comparison of experiments and simulations. Appl. Ocean Res. 2016, 59, 650–662. [Google Scholar] [CrossRef]
  19. Xiang, T.; Istrati, D. Assessment of extreme wave impact on coastal decks with different geometries via the arbitrary lagran-gian-eulerian method. J. Mar. Sci. Eng. 2021, 9, 1342. [Google Scholar] [CrossRef]
  20. Istrati, D.; Buckle, I.G. Tsunami Loads on Straight and Skewed Bridges–Part 2: Numerical Investigation and Design Recom-Mendations. Oregon. Dept. of Transportation. Research Section. 2021. Available online: https://trid.trb.org/view/1778885 (accessed on 7 September 2022).
  21. Westphalen, J.; Greaves, D.M.; Raby, A.; Hu, Z.Z.; Causon, D.M.; Mingham, C.G.; Omidvar, P.; Stansby, P.K.; Rogers, B.D. Investigation of Wave-Structure Interaction Using State of the Art CFD Techniques. Open J. Fluid Dyn. 2014, 04, 18–43. [Google Scholar] [CrossRef]
  22. Hasanpour, A.; Istrati, D.; Buckle, I. Coupled SPH–FEM Modeling of Tsunami-Borne Large Debris Flow and Impact on Coastal Structures. J. Mar. Sci. Eng. 2021, 9, 1068. [Google Scholar] [CrossRef]
  23. Higuera, P.; Lara, J.L.; Losada, I.J. Simulating coastal engineering processes with OpenFOAM®. Coast. Eng. 2013, 71, 119–134. [Google Scholar] [CrossRef]
  24. Lara, J.; Higuera, P.; Guanche, R.; Losada, I.J. Wave interaction with piled structures: Application with IH-FOAM. In Proceedings of the 32nd International Conference on Offshore Mechanics and Arctic Engineering, Nantes, France, 9–14 September 2013. [Google Scholar]
  25. Mohseni, M.; Esperanca, P.T.; Sphaier, S.H. Numerical study of wave run-up on a fixed and vertical surface-piercing cylinder subjected to regular, non-breaking waves using OpenFOAM. Appl. Ocean. Res. 2018, 79, 228–252. [Google Scholar] [CrossRef]
  26. Cao, H.-J.; Wan, D.-C. RANS-VOF solver for solitary wave run-up on a circular cylinder. China Ocean Eng. 2015, 29, 183–196. [Google Scholar] [CrossRef]
  27. Larsen, B.E.; Fuhrman, D.R. On the over-production of turbulence beneath surface waves in Reynolds-averaged Navier–Stokes models. J. Fluid Mech. 2018, 853, 419–460. [Google Scholar] [CrossRef]
  28. Larsen, B.E.; Fuhrman, D.R. Tutorial for "multiphaseStabilizedTurbulence" in OpenFOAM®—v1912. 27 April 2020. Available online: https://doi.org/10.11583/DTU.12154713 (accessed on 27 April 2020).
  29. Jacobsen, N.G.; Fuhrman, D.R.; Fredsøe, J. A wave generation toolbox for the open-source CFD library: OpenFoam®. Int. J. Numer. Methods Fluids 2012, 70, 1073–1088. [Google Scholar] [CrossRef]
  30. Devolder, B.; Rauwoens, P.; Troch, P. Application of a buoyancy-modified k-ω SST turbulence model to simulate wave run-up around a monopile subjected to regular waves using OpenFOAM ®. Coast. Eng. 2017, 125, 81–94. [Google Scholar] [CrossRef]
  31. Qiao, D.; Feng, C.; Yan, J.; Liang, H.; Ning, D.; Li, B. Numerical simulation and experimental analysis of wave interaction with a porous plate. Ocean Eng. 2020, 218, 108106. [Google Scholar] [CrossRef]
  32. Swan, C.; Sheikh, R. The interaction between steep waves and a surface-piercing column. Philos. Trans. R. Soc. Lond. Ser. A Math. Phys. Eng. Sci. 2015, 373, 20140114. [Google Scholar] [CrossRef]
  33. Rainey, R.C.T. Weak or strong nonlinearity: The vital issue. J. Eng. Math. 2007, 58, 229–249. [Google Scholar] [CrossRef]
  34. Istrati, D.; Buckle, I. Role of Trapped Air on the Tsunami-Induced Transient Loads and Response of Coastal Bridges. Geosciences 2019, 9, 191. [Google Scholar] [CrossRef] [Green Version]
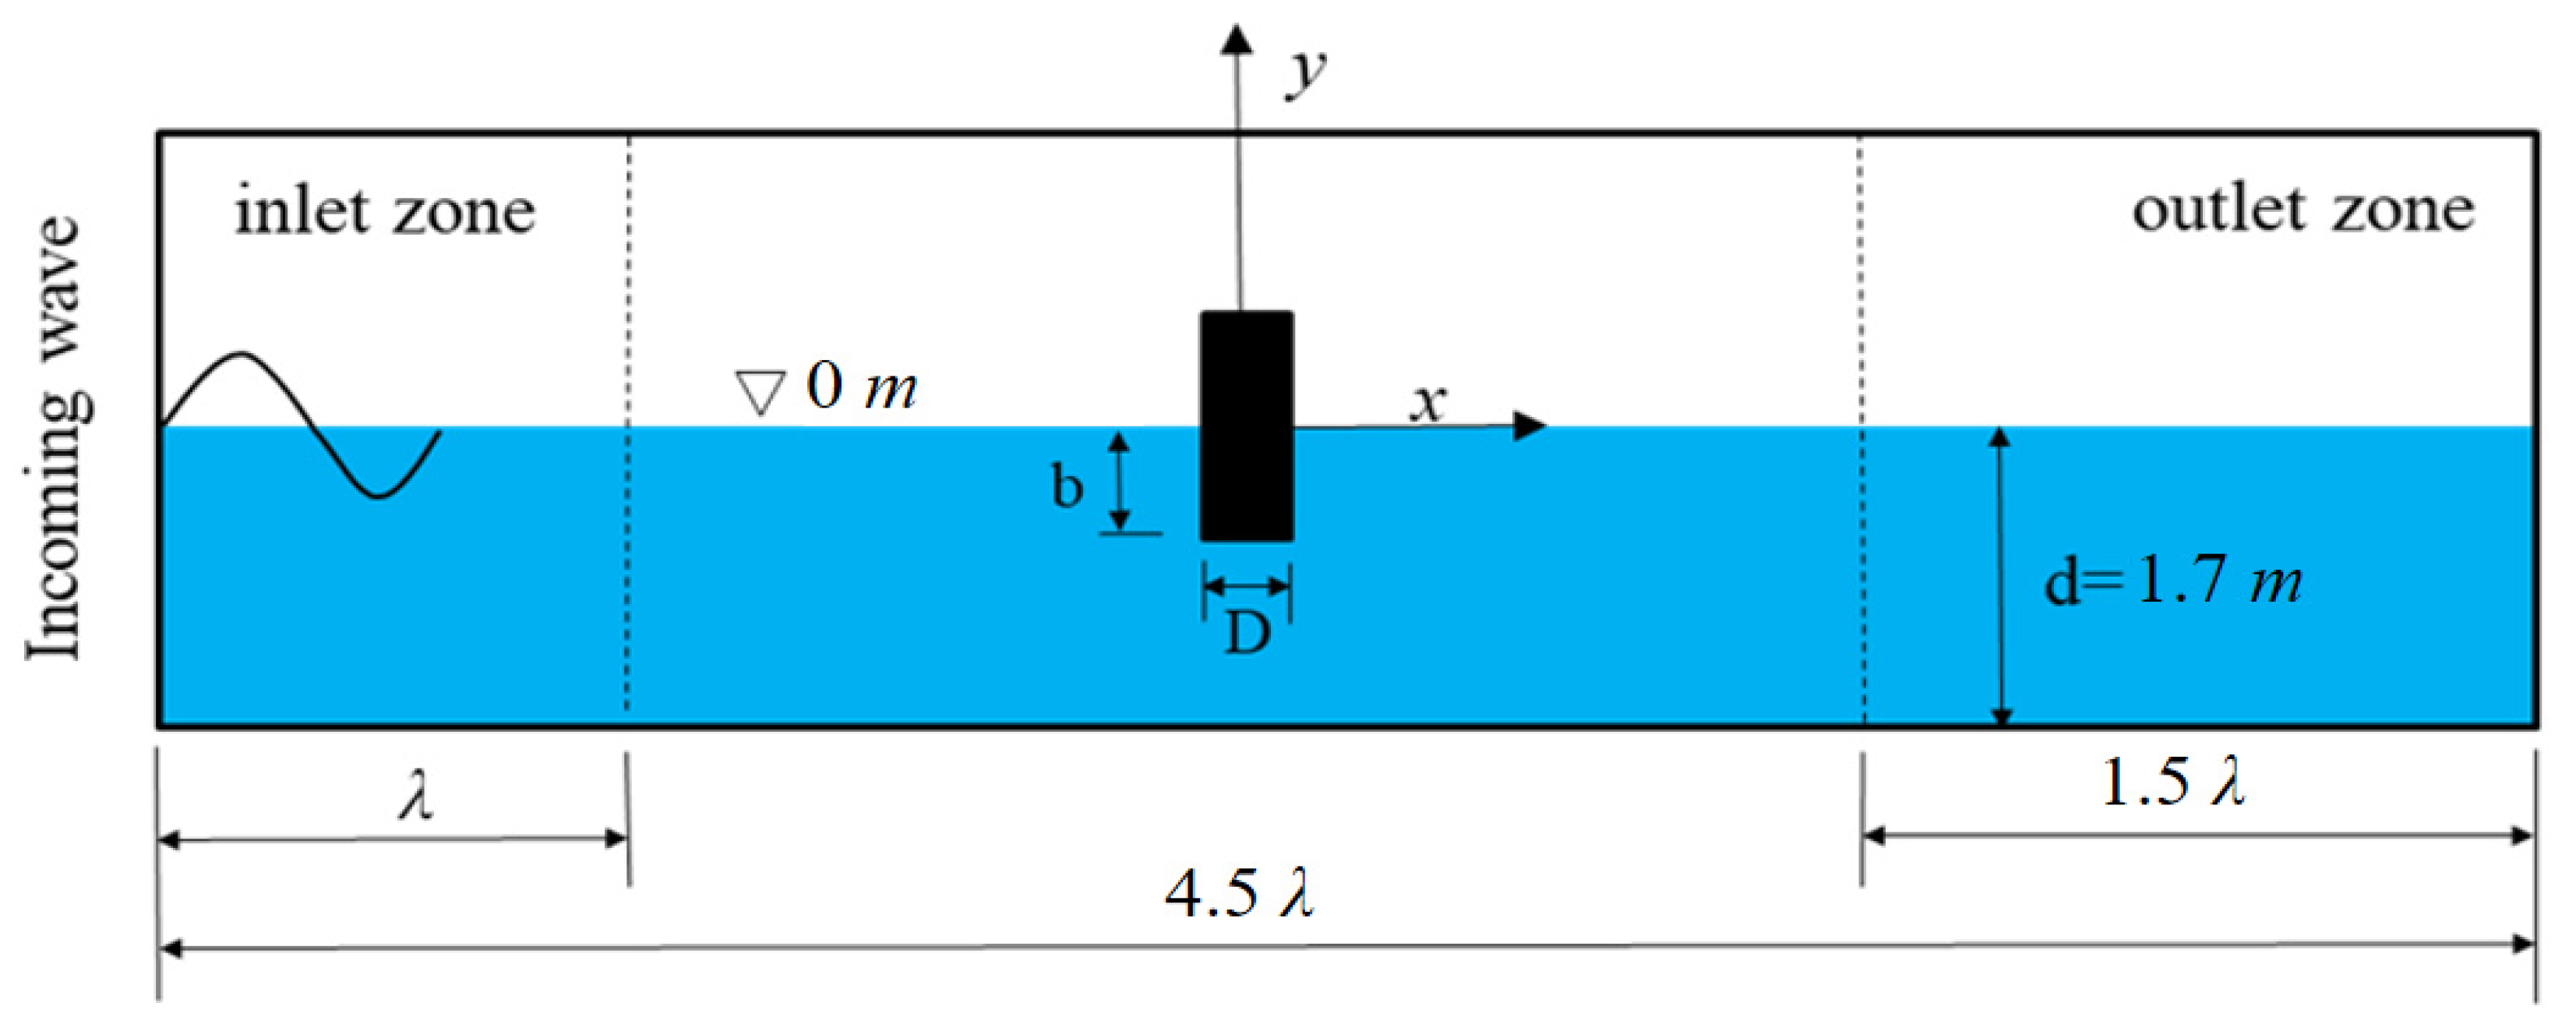
Figure 1. Schematic of numerical wave flume.
Water 14 02830 g001
Figure 2. Mesh refinement.
Water 14 02830 g002
Figure 3. Time series of wave surface elevation of different mesh refinement schemes at x = 9   m .
Water 14 02830 g003
Figure 4. Comparison of instantaneous wave surface shape and theoretical wave surface shape at t = 15   s .
Water 14 02830 g004
Figure 5. Schematic of experimental model (Vos et al. [6]).
Water 14 02830 g005
Figure 6. Layout of wave gauges around cylinder ( x o y plane).
Water 14 02830 g006
Figure 7. Comparisons of time series results of wave elevation between numerical simulation and experiments at different measuring points.
Water 14 02830 g007
Figure 8. Circumferential and radial wave probes distribution: (a) distribution of circumferential wave probes; (b) distribution of radial wave probes.
Water 14 02830 g008
Figure 9. General mesh for NWT and heaving cylinder: (a) top view; (b) side view.
Water 14 02830 g009
Figure 10. Definition sketch of wave run-up on fixed cylinder.
Water 14 02830 g010
Figure 11. Comparison of numerical simulation results and estimation formulas by Vos et al. [11].
Water 14 02830 g011
Figure 12. Comparison of numerical simulation results and estimation formulas by Bonakdar et al. [12].
Water 14 02830 g012
Figure 13. Time series of wave surface elevation and frequency spectrum at different wave steepness parameters ( T = 2.5   s ): (a) 0° time series of wave surface elevation; (b) 0° frequency spectrum; (c) 157.5° time series of wave surface elevation; (d) 157.5° frequency spectrum; (e) 180° time series of wave surface elevation; (f) 180° frequency spectrum; (g) 225° time series of wave surface elevation; (h) 225° frequency spectrum.
Water 14 02830 g013
Figure 14. The process of wave field change around a cylinder during a wave period(plane): (a) t 0 ; (b) t 0 + T / 4 ; (c) t 0 + 2 T / 4 ; (d) t 0 + 3 T / 4 .
Water 14 02830 g014
Figure 15. Comparison of dimensionless maximum run-up height distribution of different scatter parameters under the same wave steepness parameter: (a) k a = 0.33 ; (b) k a = 0.22 ; (c) k a = 0.1157 ; (d) k a = 0.12 .
Water 14 02830 g015
Figure 16. Comparison of dimensionless maximum run-up height distribution of different scatter parameters under the same wave steepness parameter: (a) k a = 0.05 ; (b) k a = 0.1 ; (c) k a = 0.15 .
Water 14 02830 g016
Figure 17. Distributions off dimensionless maximum run-up height along rows A, B, C, and D ( k A = 0.05 ): (a) T = 1.4   s ,   H = 0.049   m ; (b) T = 1.73   s ,   H = 0.073   m ; (c) T = 2.1   s ,   H = 0.102   m ; (d) T = 2.5   s ,   H = 0.133   m .
Water 14 02830 g017aWater 14 02830 g017b
Figure 18. Distributions off dimensionless maximum run-up height along rows A, B, C and D ( k A = 0.15 ): (a) T = 1.4   s ,   H = 0.146   m ; (b) T = 1.73   s ,   H = 0.218   m ; (c) T = 2.1   s ,   H = 0.305   m ; (d) T = 2.5   s ,   H = 0.398   m .
Water 14 02830 g018
Figure 19. Time series of horizontal wave force on fixed cylinder under various wave conditions: (a) T = 1.4   s ; (b) T = 1.73   s ; (c) T = 2.1   s ; (d) T = 2.5   s .
Water 14 02830 g019
Figure 20. Comparison of the time series of horizontal wave forces in different periods, k A = 0.15 .
Water 14 02830 g020
Figure 21. Wave force crest mean, through mean, total value, and mean changes with different periods ( k A = 0.15 ).
Water 14 02830 g021
Figure 22. Dimensionless horizontal wave force against k a .
Water 14 02830 g022
Table 1. Mesh refinement schemes (4 examples).
Mesh Type1234
H/Δy5101520
λ/Δx4080120160
Δy (m)0.01420.00710.00470.0036
Δx (m)0.11080.05540.03690.0277
Δx/Δy7.87.87.87.8
Table 2. Mesh refinement schemes.
Mesh Type1234
height(m)0.06900.07060.07060.0708
relative error−2.86%−0.89%−0.61%−0.28%
Table 3. Positions of wave probes.
Name of Wave Probes α 0 ° r
A1–A40a,1.2a,1.6a,2a
B1–B445a,1.2a,1.6a,2a
C1–C490a,1.2a,1.6a,2a
D1–D4135a,1.2a,1.6a,2a
Table 4. Incident wave conditions.
Number Period   T s k A = 0.05 H m k A = 0.1 H m k A = 0.15 H m k a
F11.30.0420.0840.1260.3815
F21.40.0490.0980.1460.3295
F31.50.0560.1120.1670.2879
F41.60.0630.1260.1890.2543
F51.70.0730.1460.2180.2197
F61.80.0780.1560.2350.2044
F71.90.0870.1740.2580.1857
F82.00.0940.1880.2820.1701
F92.10.1020.2040.3050.1570
F102.30.1180.2360.3530.1361
F112.50.1330.2660.3980.1204
Table 5. Statistical indicators for differences between predicted and simulated values.
Estimation Formula B i a s m I a R 2 S I % Estimation Formula
Vos0.01880.94740.977130.13Vos
Bonakdar0.00310.99410.9799.76Bonakdar
Table 6. High-order (2nd order, 3rd order) wave influence coefficient.
Wave Probes 157.5°180°225°
Second OrderThird OrderSecond OrderThird OrderSecond OrderThird OrderSecond OrderThird Order
T = 1.4 skA = 0.050.1070.0480.0710.028
kA = 0.10.3100.1180.1890.077
kA = 0.150.3200.1420.2650.210
T = 1.73 skA = 0.05
kA = 0.10.1440.0270.0520.0770.0290.047
kA = 0.150.2110.0290.0750.0140.1120.020.0720.089
T = 2.1 skA = 0.05
kA = 0.10.1780.060.0970.1050.0310.070.075
kA = 0.150.2520.1120.1110.120.0350.1240.121
T = 2.5 skA = 0.050.1040.0740.080.053
kA = 0.10.1760.0740.1160.1270.0570.058
ka = 0.150.2640.1210.1530.0480.1690.0460.0520.063
Publisher’s Note: MDPI stays neutral with regard to jurisdictional claims in published maps and institutional affiliations.