Topographical Characteristics of Frequent Urban Pluvial Flooding Areas in Osaka and Nagoya Cities, Japan
Abstract
:1. Introduction
2. Materials and Methods
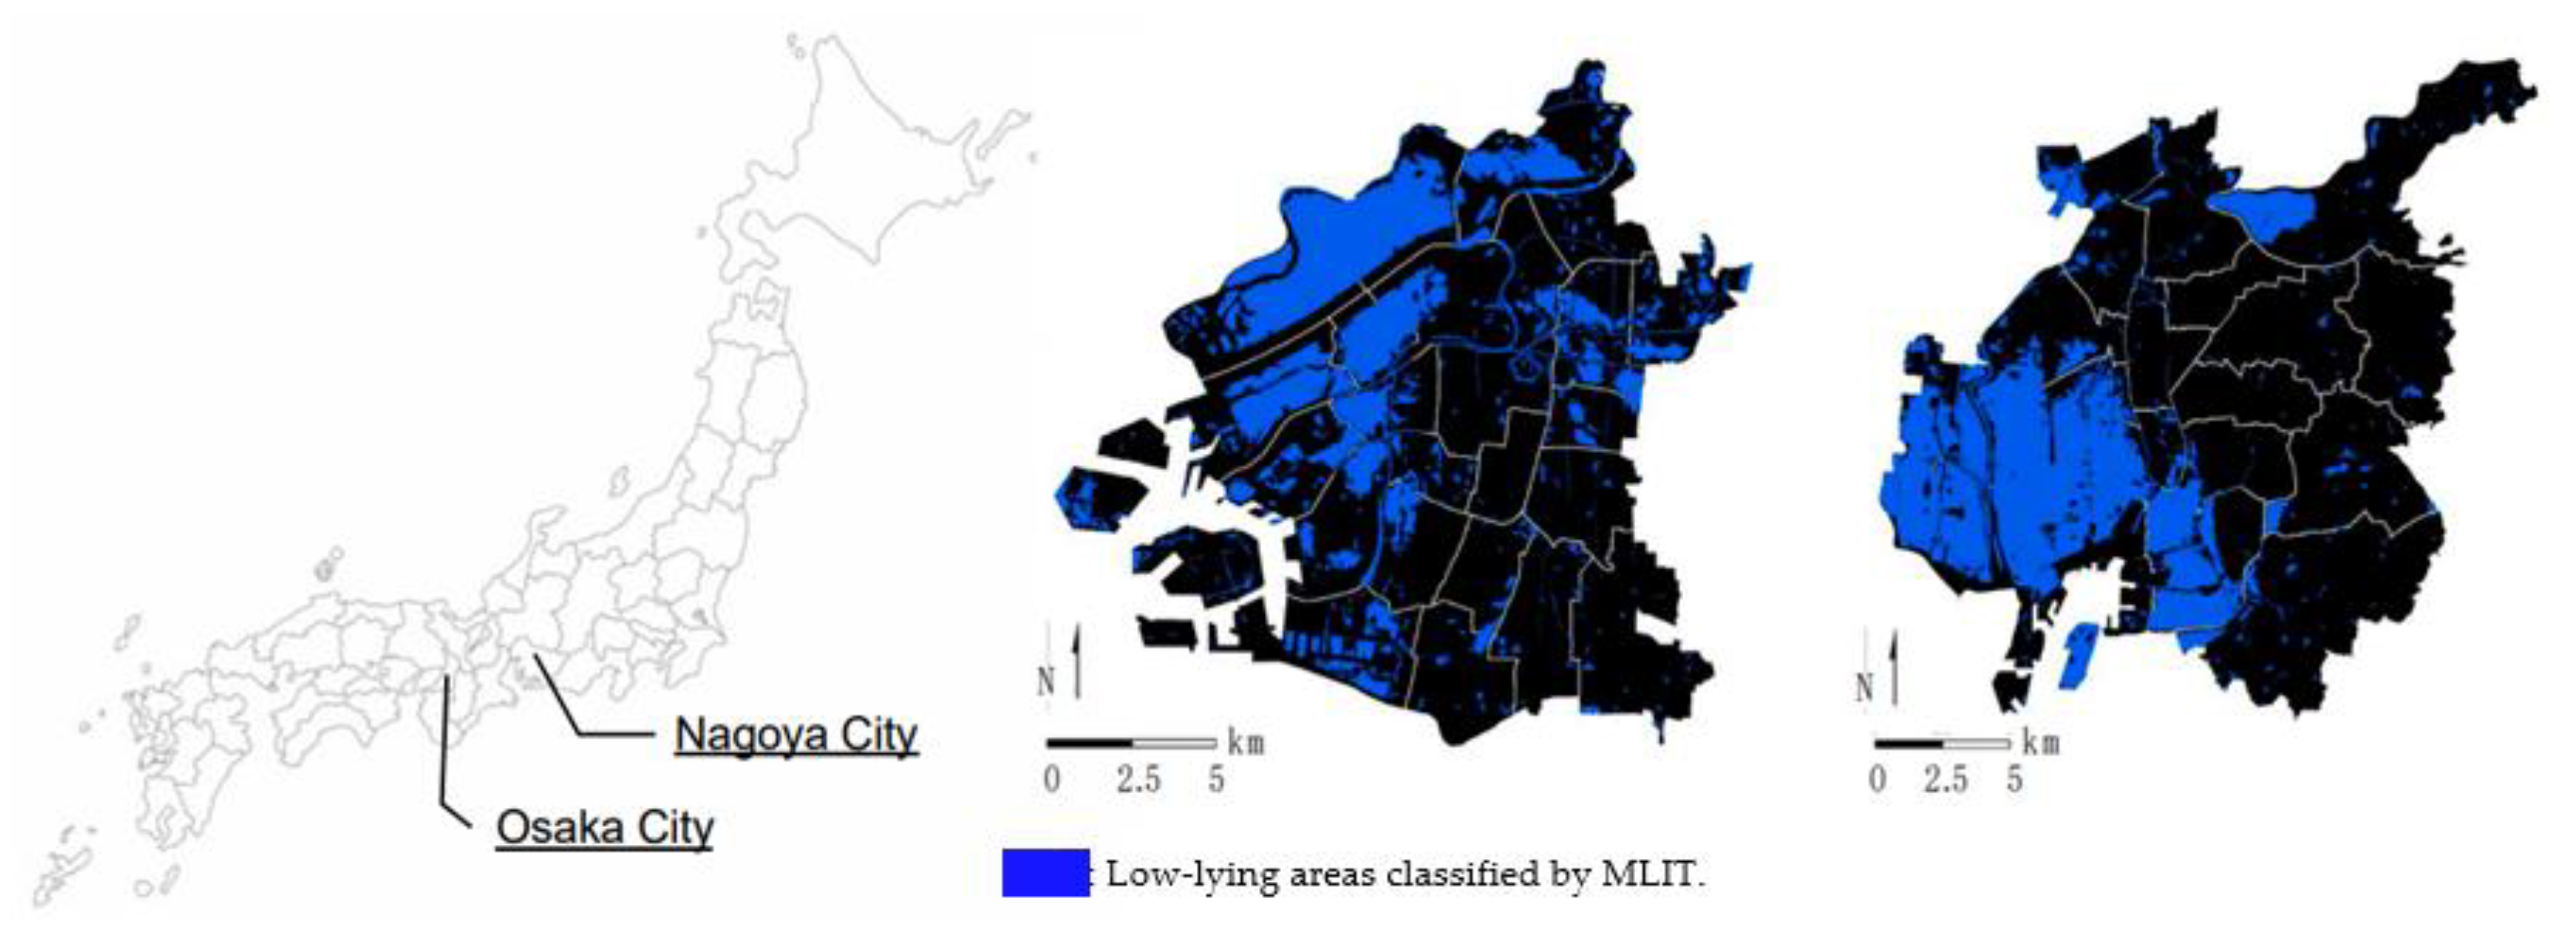
2.1. Study Area
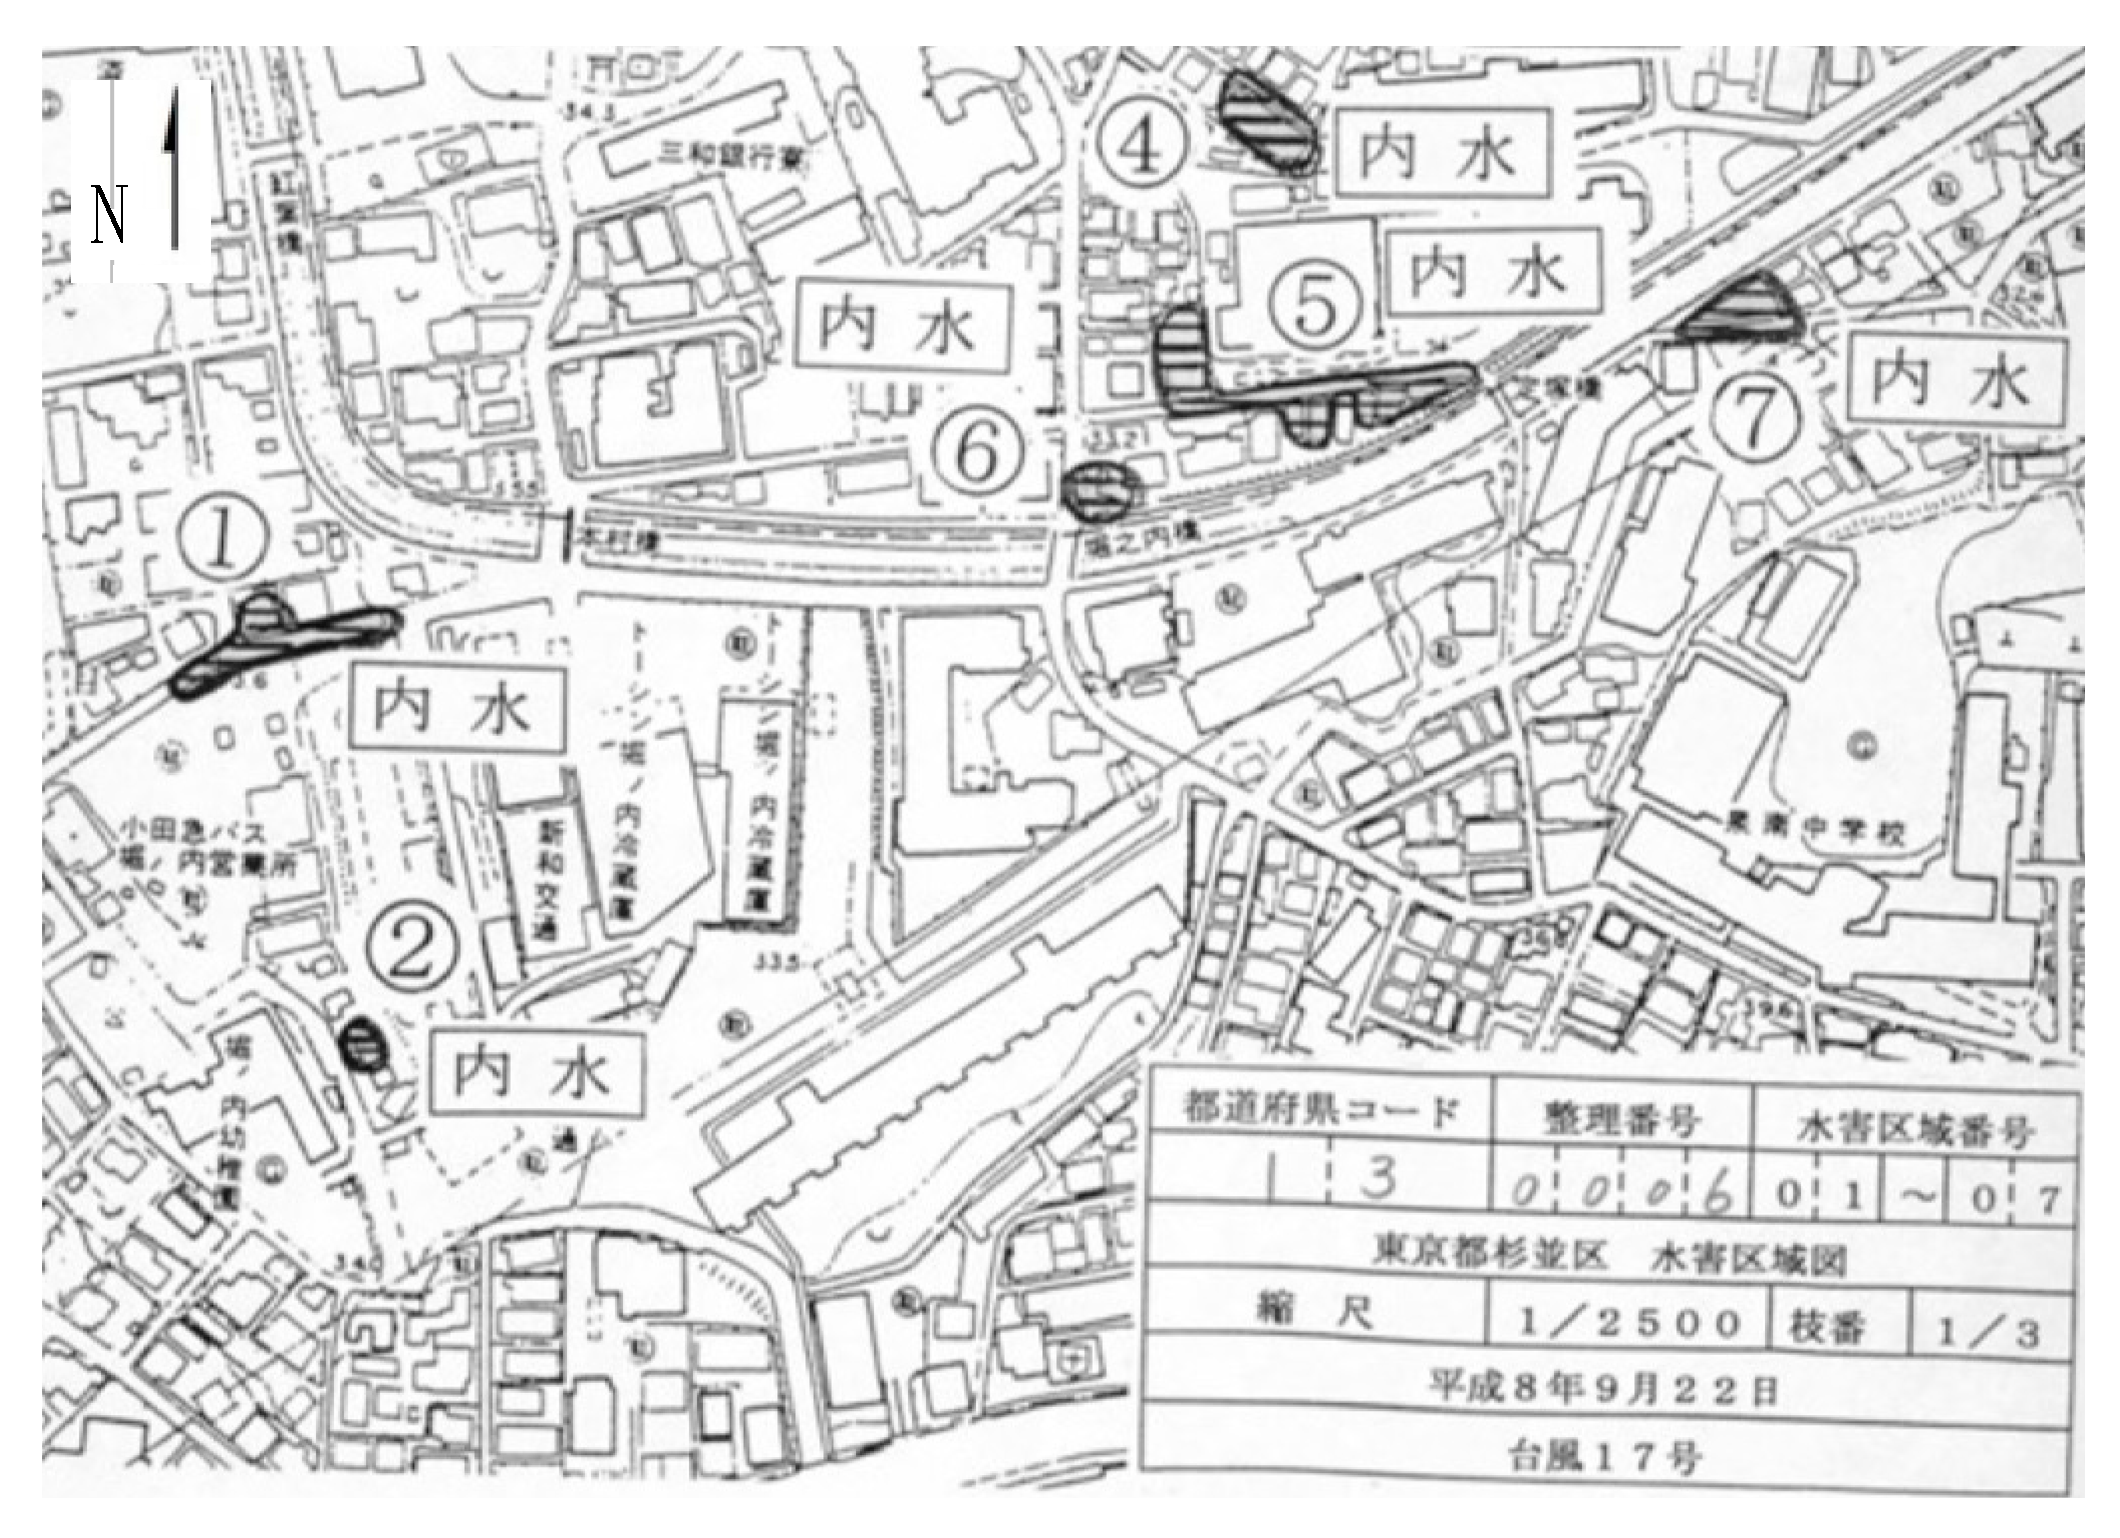
2.2. Identification of Frequent Urban Pluvial Flooding Areas
2.3. Topographical Characteristics of Frequent Urban Pluvial Flooding Area
2.3.1. Topographical Factors
2.3.2. Visualisation of the Topographical Characteristics of Urban Pluvial Flooding
3. Results
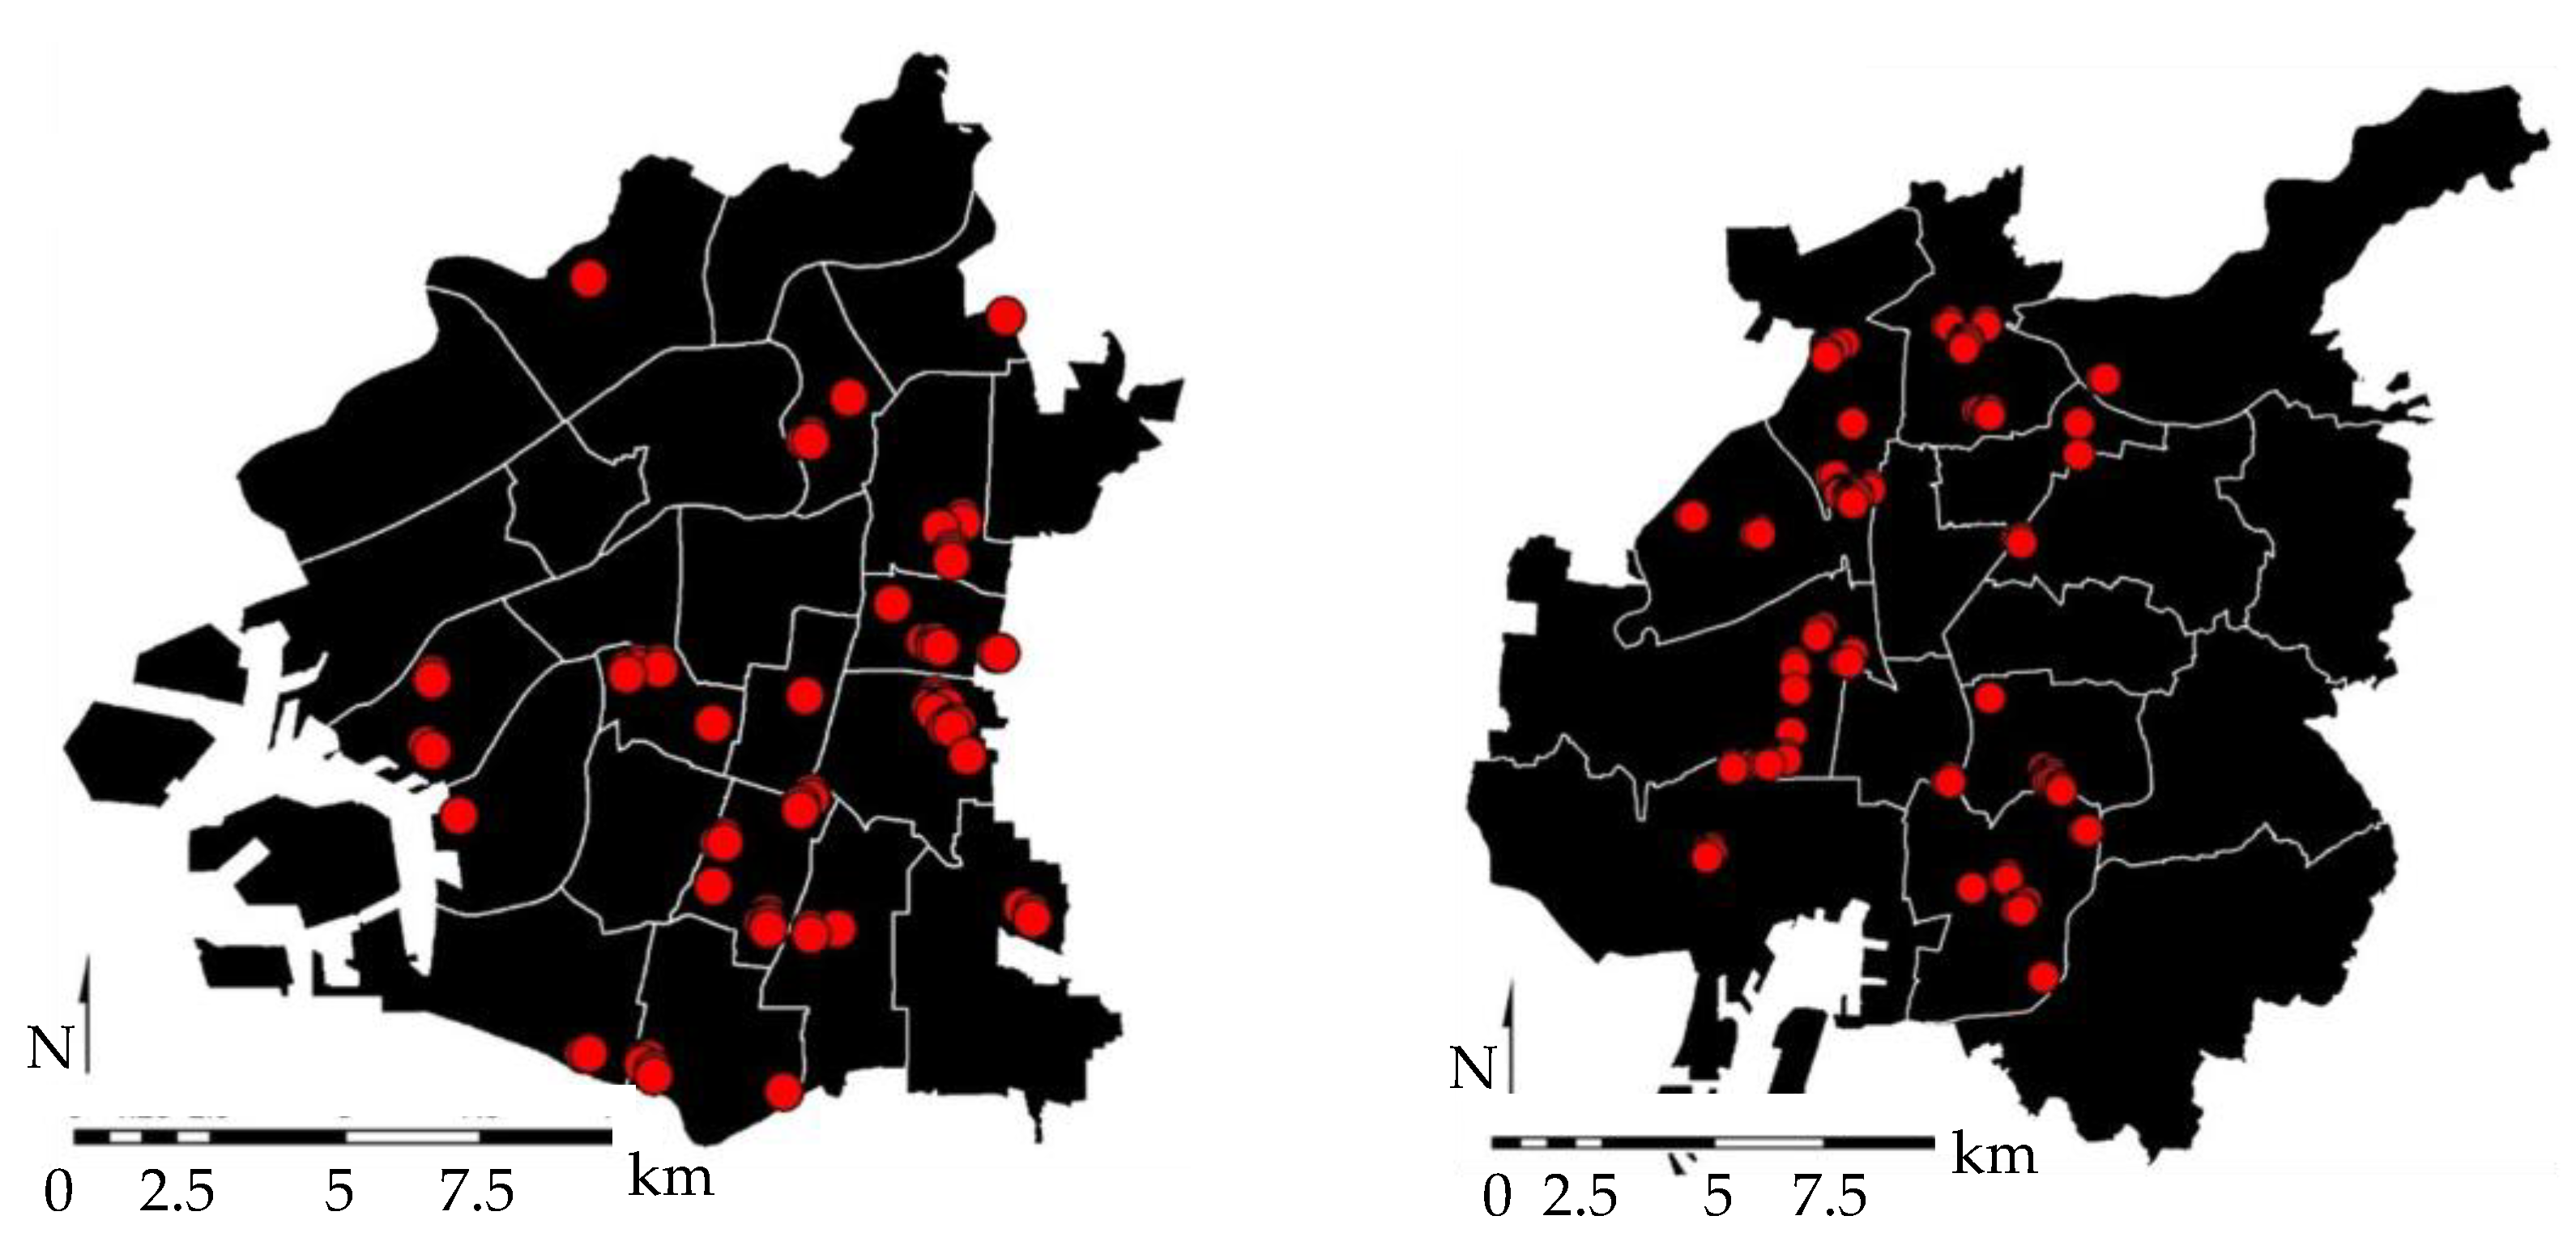
3.1. Identification of Frequent Urban Pluvial Flooding Areas
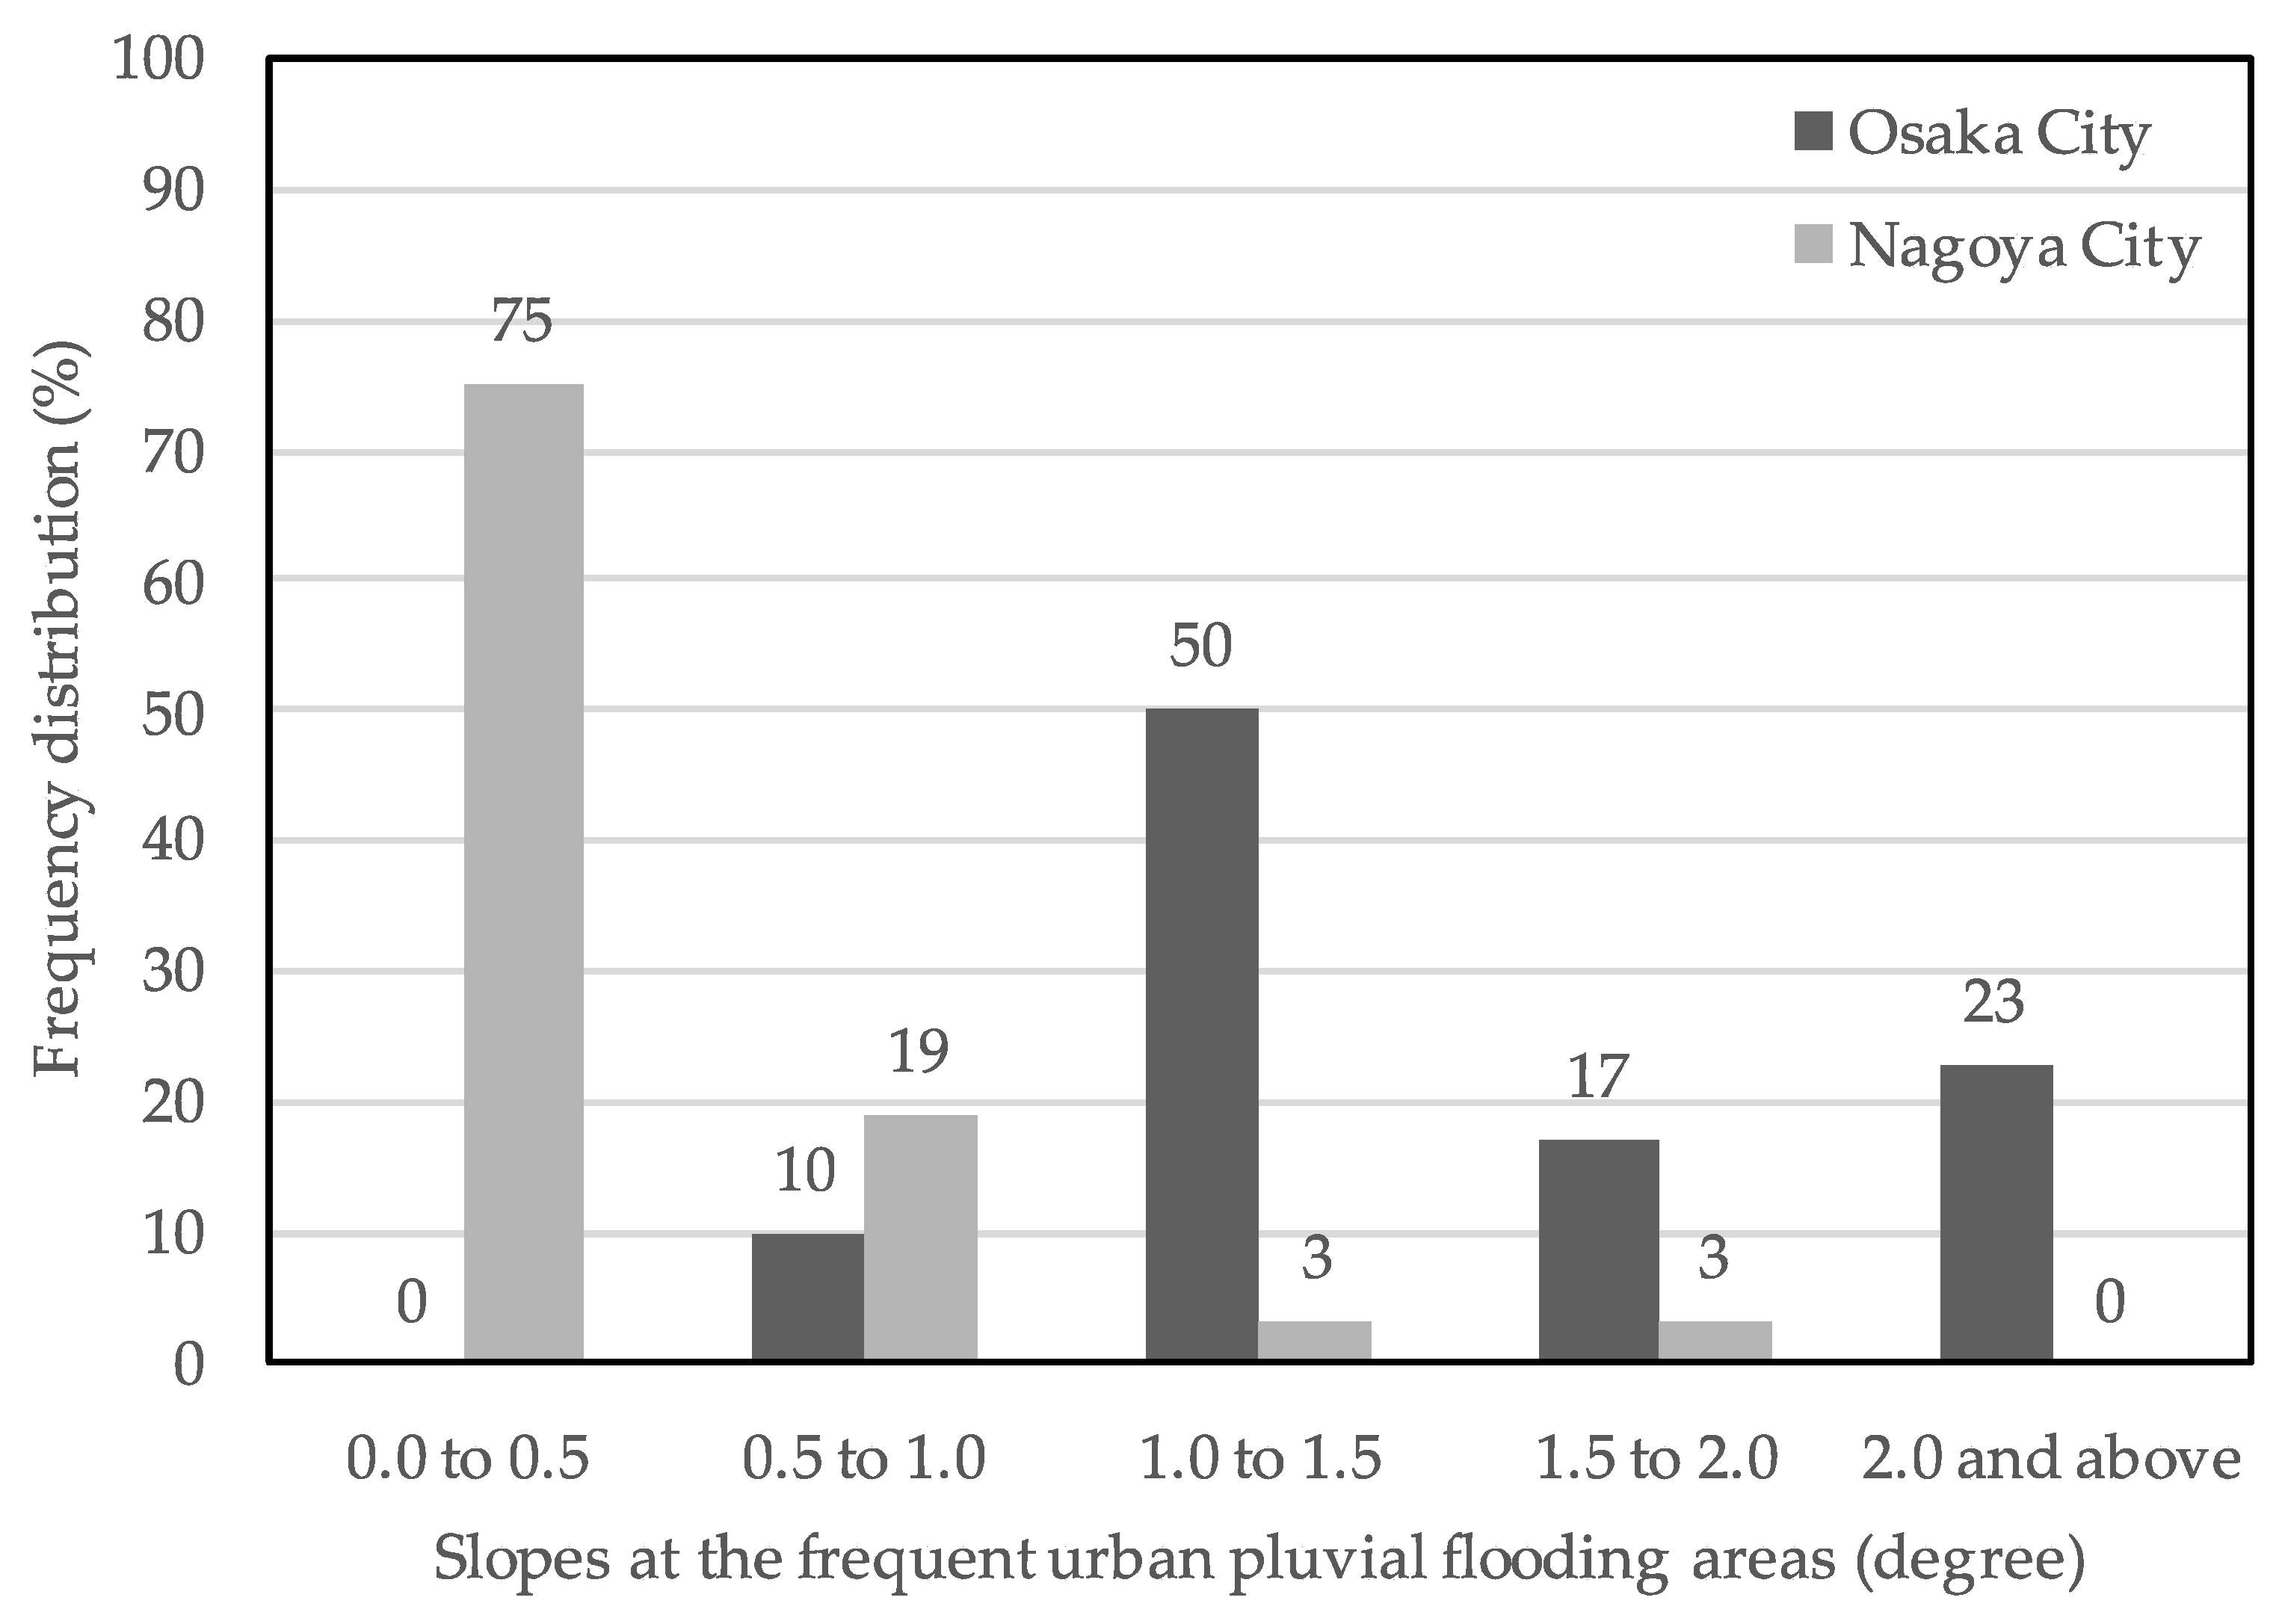
3.2. Topographical Characteristics of Frequent Urban Pluvial Flooding Areas
Principle Component Analysis (PCA) of Topographical Characteristics
3.3. Other Characteristics of Frequent Urban Pluvial Flooding Areas
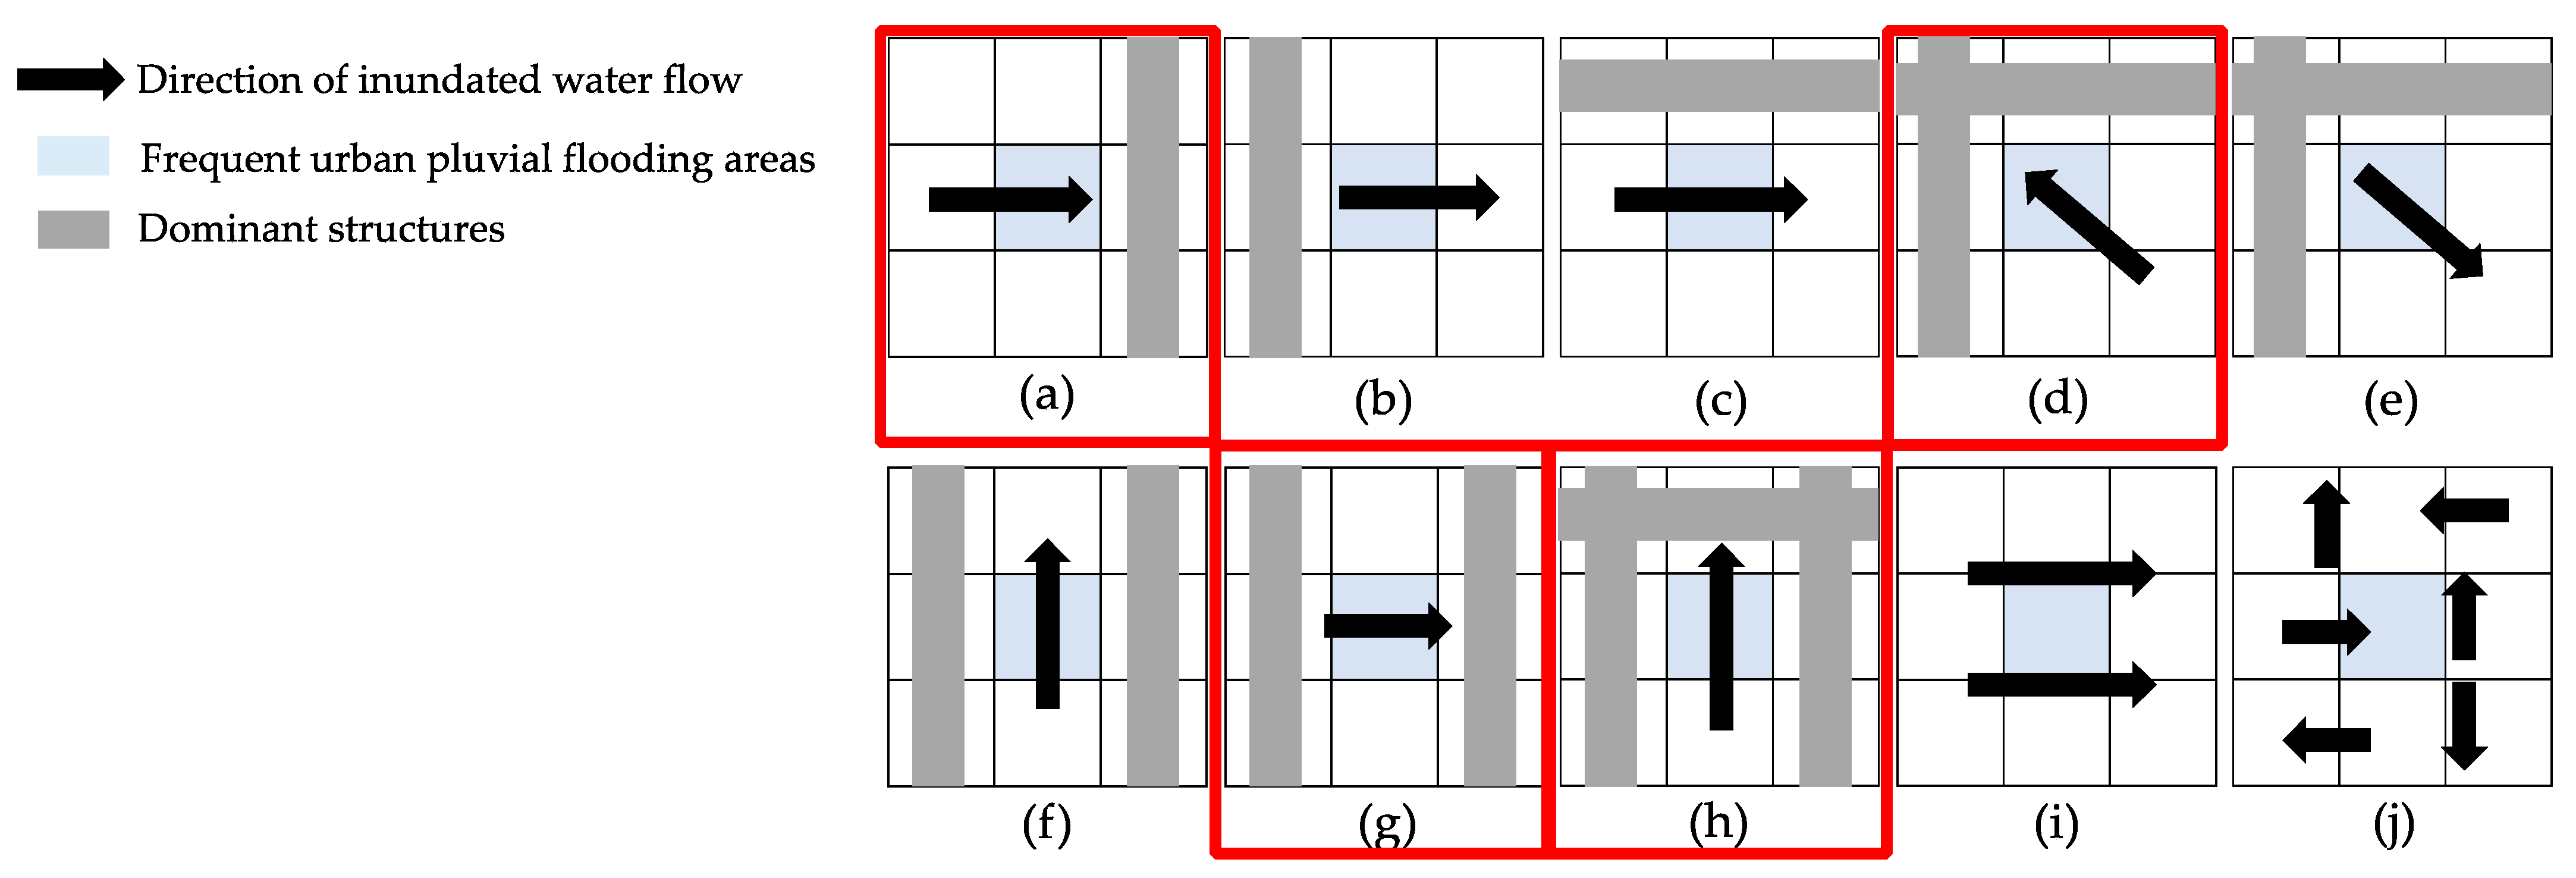
3.3.1. Impact of Structures in Frequent Urban Pluvial Flooding Areas
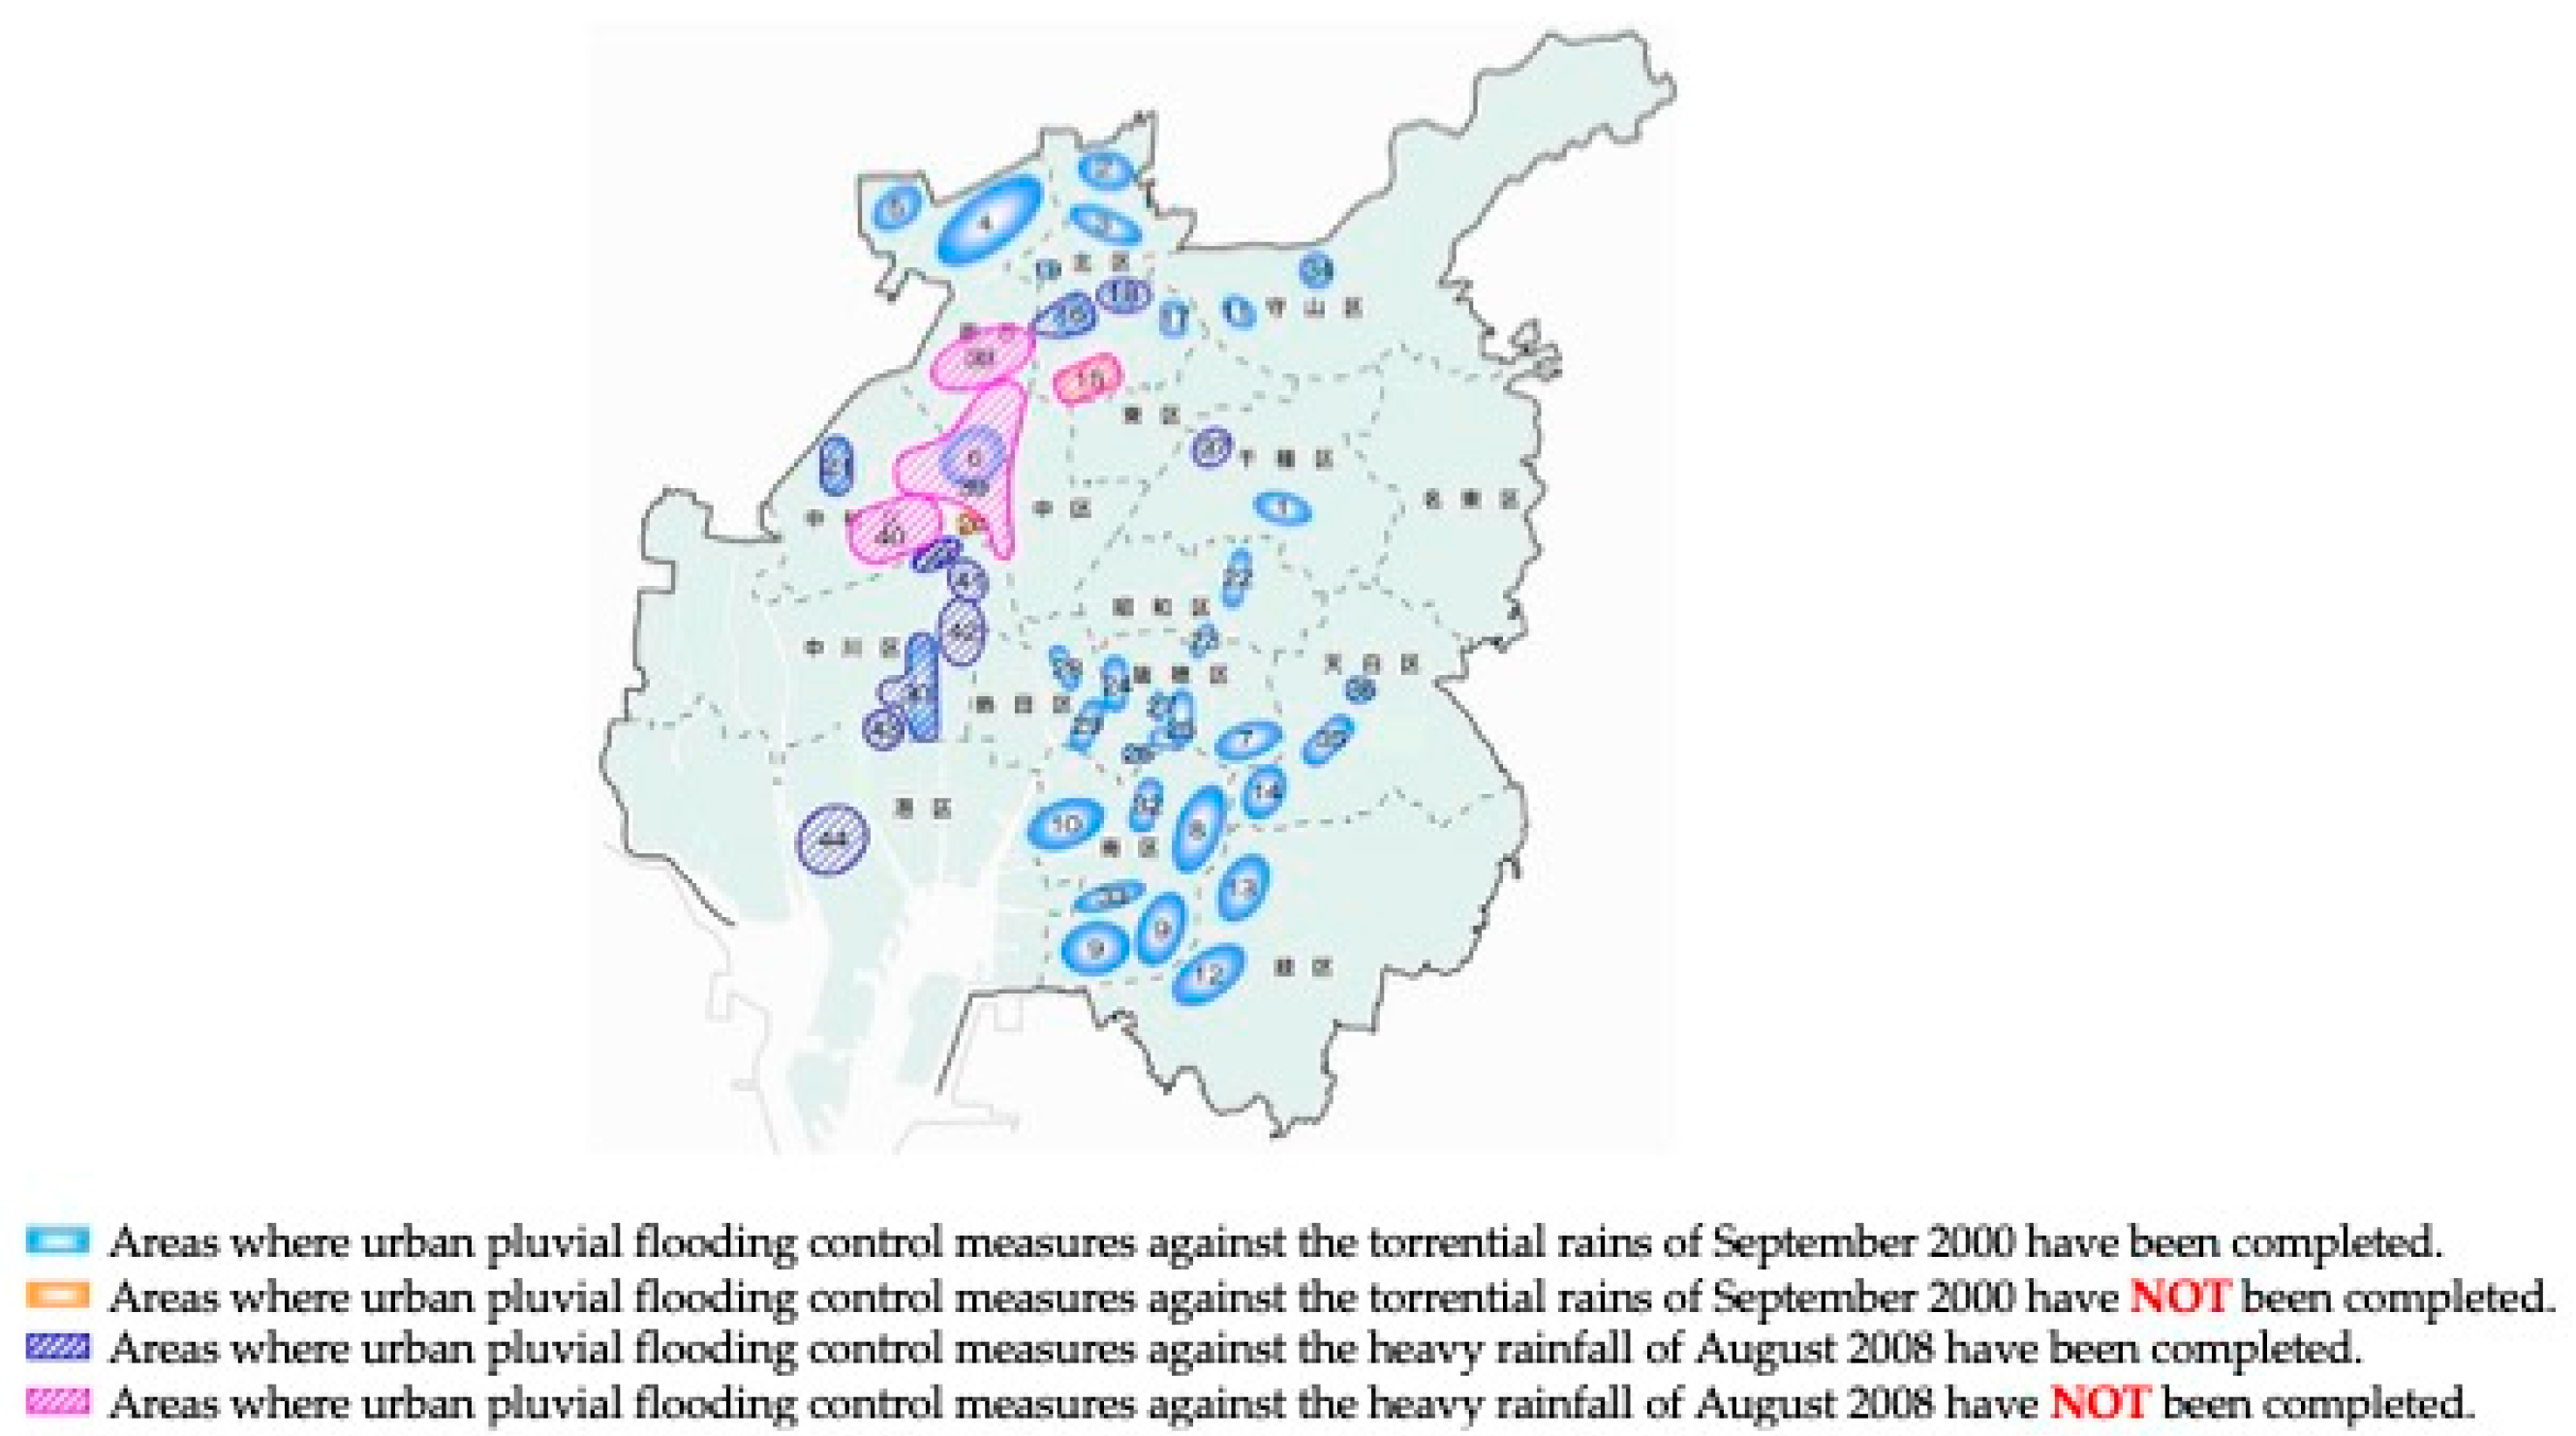
3.3.2. Impact of Drainage System Improvements in Frequent Urban Pluvial Flooding Areas
4. Discussion and Summary
- The PCA of frequent urban pluvial flooding areas using the eleven topographical factors showed high cumulative contribution rates for Osaka and Nagoya Cities, which indicated that the topographical factors used in this study were appropriate for describing frequent urban pluvial flooding areas. The results of the PCA quantitively showed that the topographical characteristics of the frequent urban pluvial flooding areas in both cities were different.
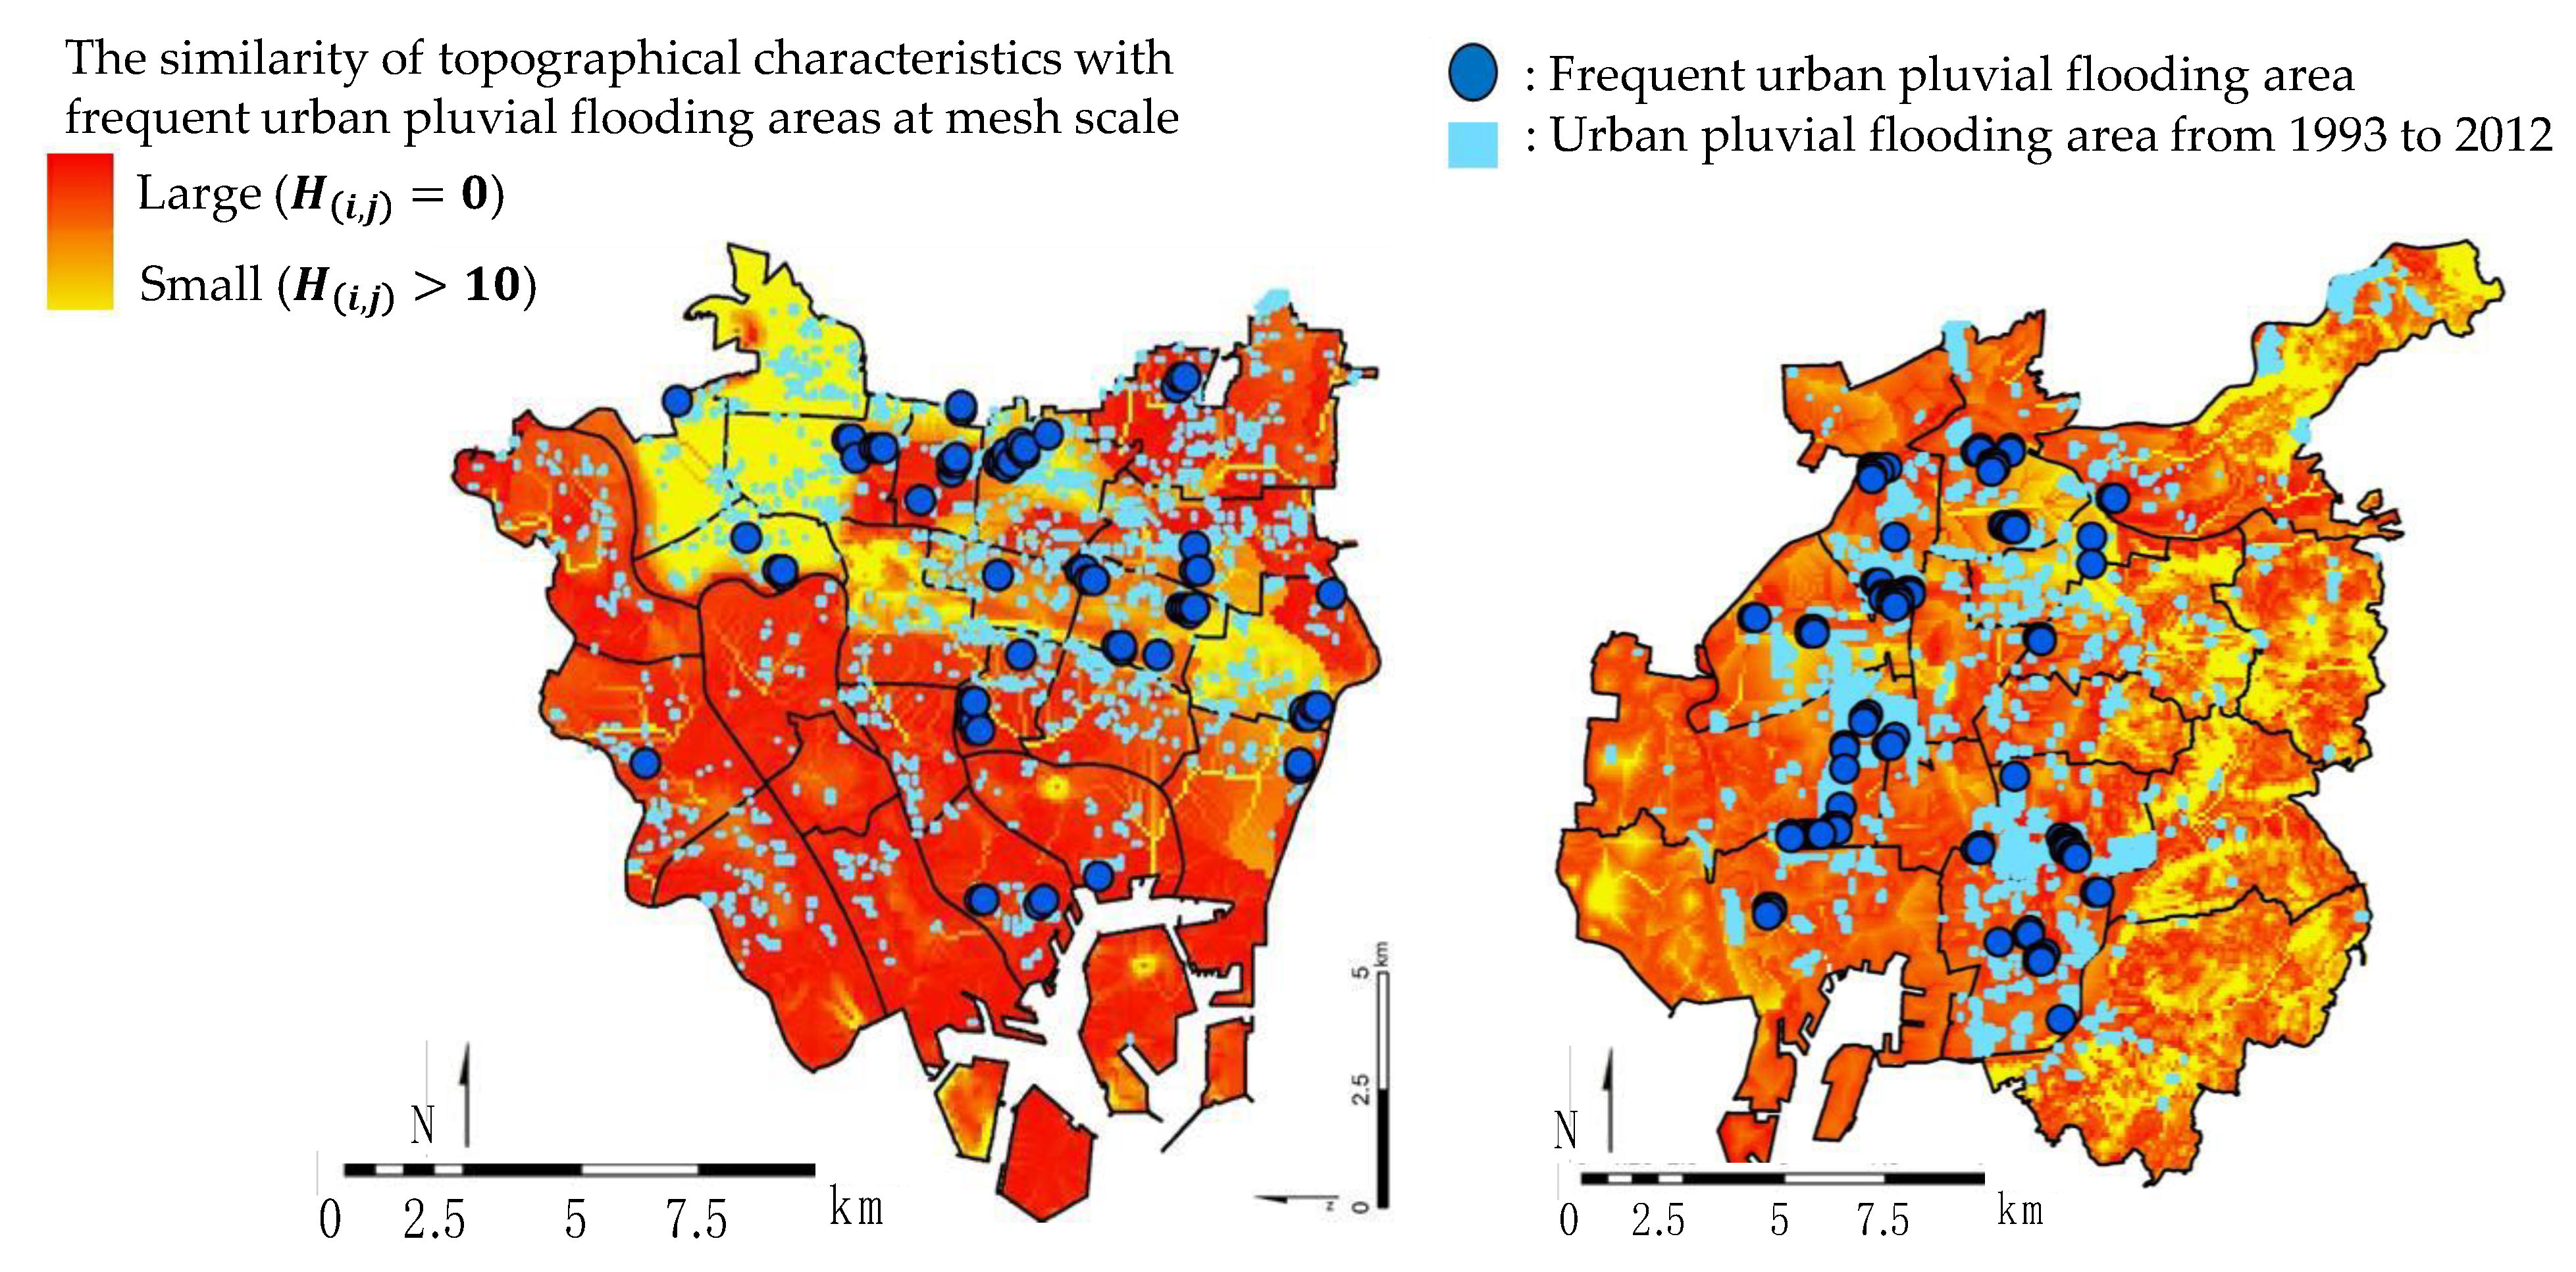
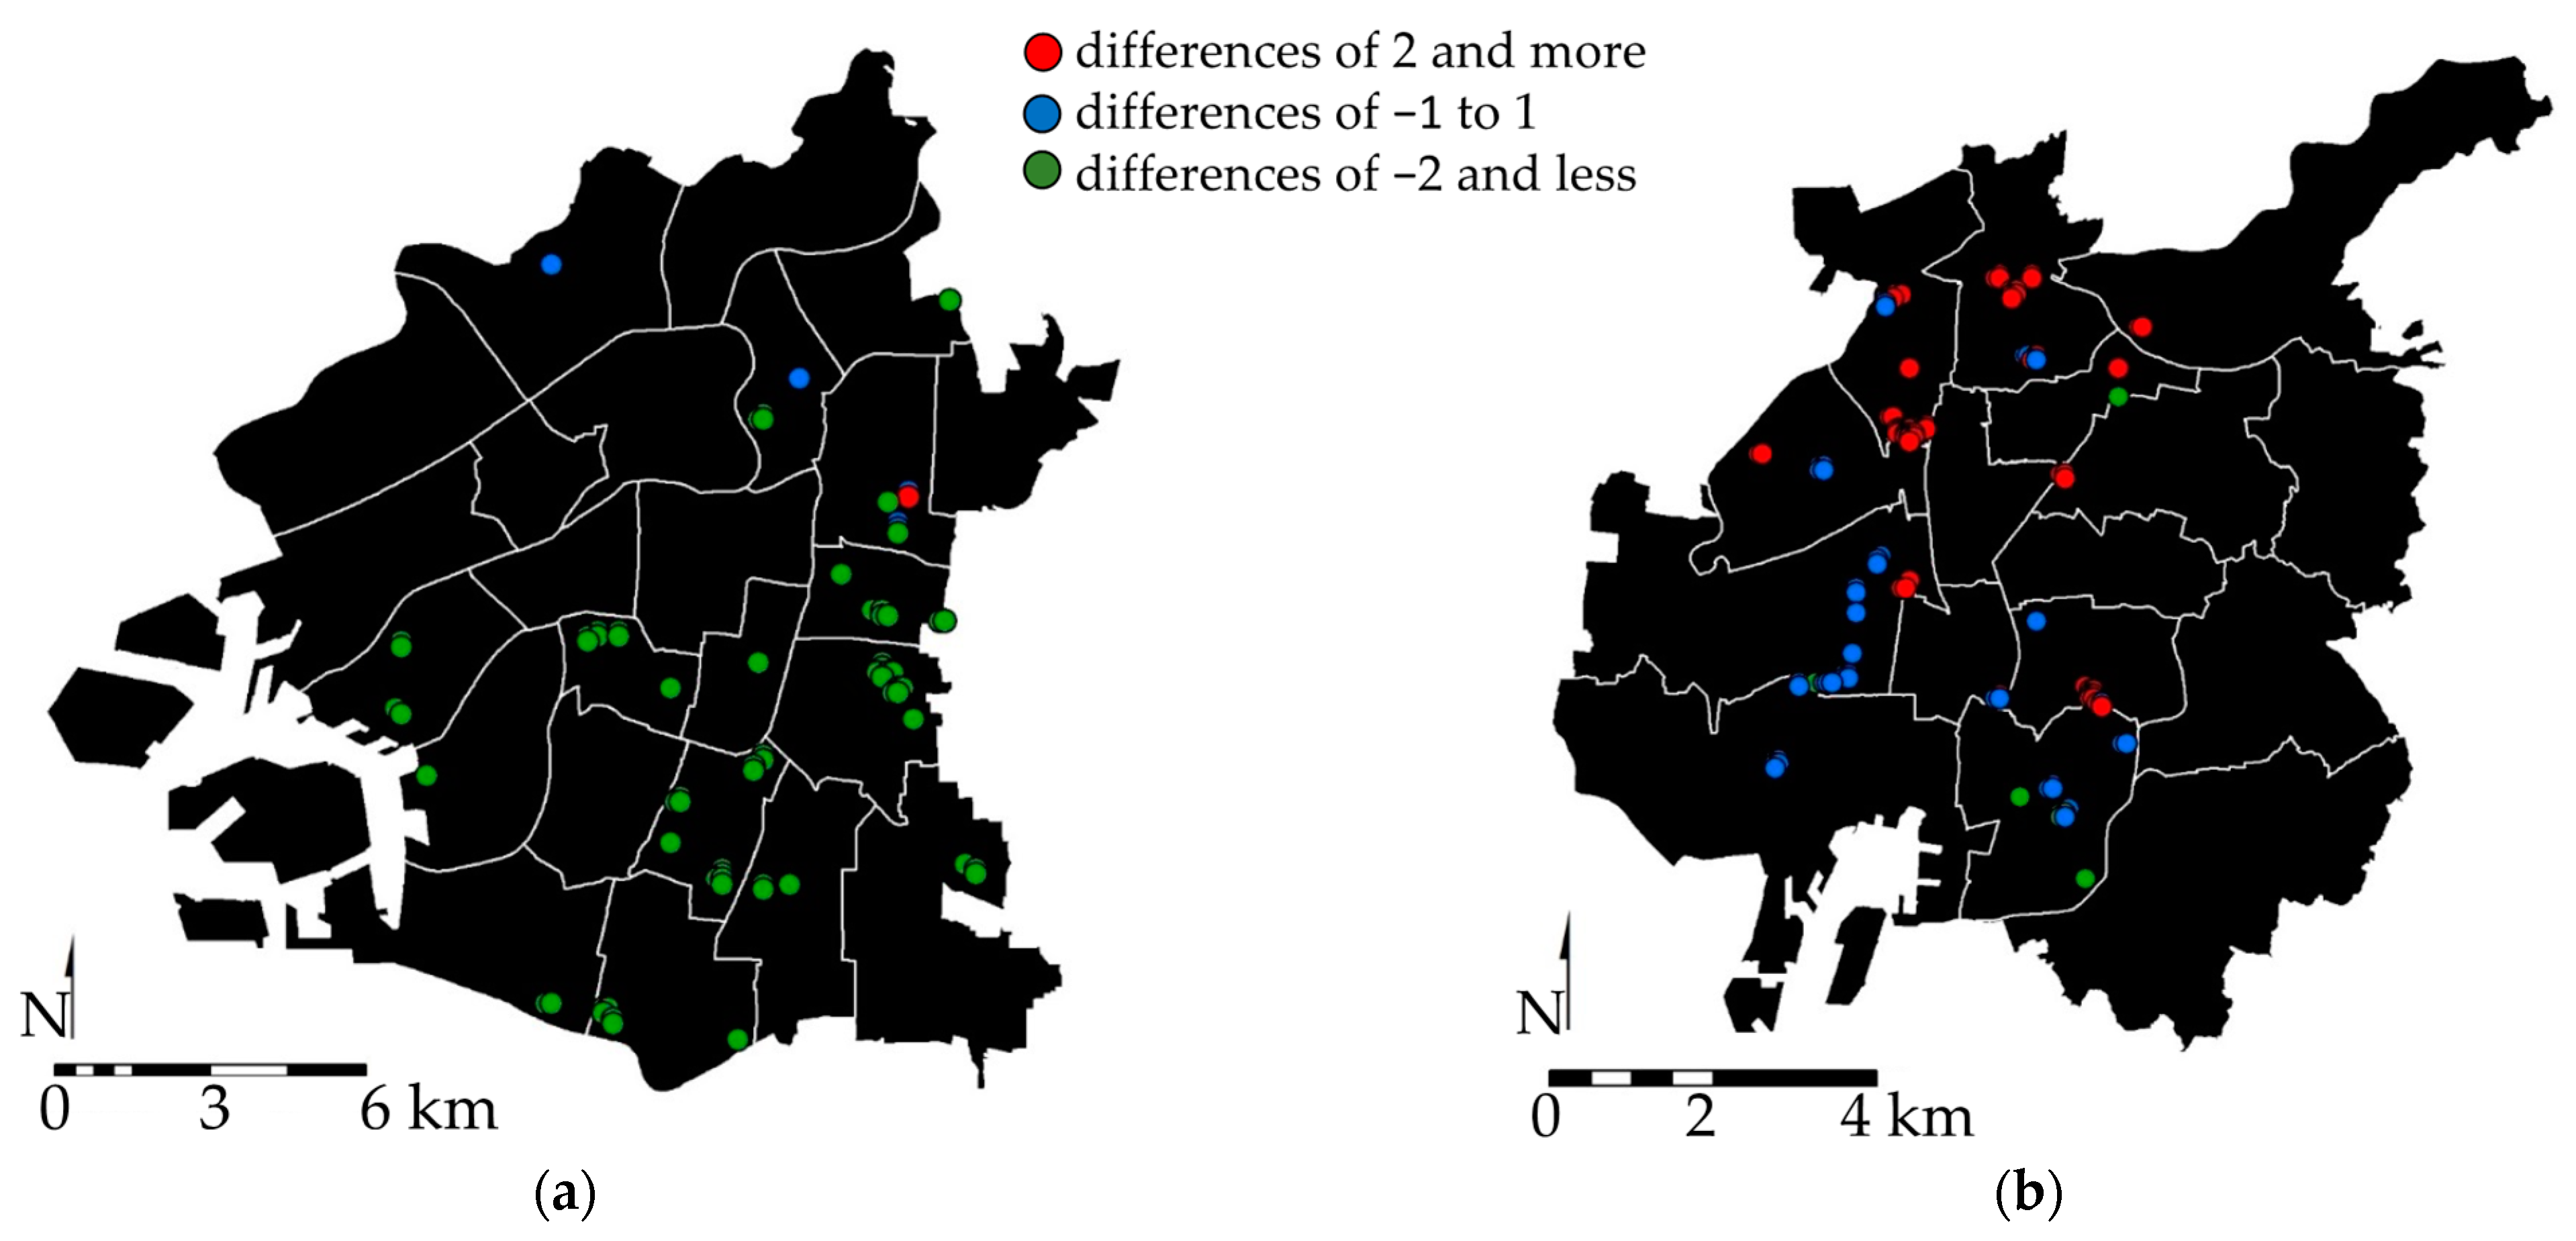
- Using the results of PCA of topographical characteristics in the frequent urban pluvial flooding area, the similarity with these topographical characteristics at a 100 m mesh scale in both cities was quantified. Although many urban pluvial flooding areas were located in areas with similar topographical characteristics, especially in Osaka City, the urban pluvial flooding areas were also distributed in areas without similar topographical characteristics. This suggested that factors other than topographical characteristics that caused urban pluvial flooding were largely responsible for such areas in many parts of Osaka City and some parts of Nagoya City.
- Anthropogenic factors such as “dominant structures” and drainage system improvements as characteristics other than topographical characteristics on the occurrence of urban pluvial flooding were shown to be influential. The results also showed that the impact of anthropogenic factors was greater in Osaka City, which is on a larger urban scale than Nagoya City.
Author Contributions
Funding
Institutional Review Board Statement
Informed Consent Statement
Data Availability Statement
Acknowledgments
Conflicts of Interest
References
- Hammond, M.J.; Chen, A.S.; Djordjević, S.; Butler, D.; Mark, O. Urban flood impact assessment: A state-of-the-art review. Urban Water J. 2015, 12, 14–29. [Google Scholar] [CrossRef]
- Lowe, R.; Urich, C.; Domingo, N.S.; Mark, O.; Deletic, A.; Arnbjerg-Nielsen, K. Assessment of urban pluvial flood risk and efficiency of adaptation options through simulationse a new generation of urban planning tools. J. Hydrol. 2017, 550, 355–367. [Google Scholar] [CrossRef]
- Wang, Y.; Chen, A.S.; Fu, G.; Djordjević, S.; Zhang, C.; Savić, D.A. An integrated framework for high-resolution urban flood modelling considering multiple information sources and urban features. Environ. Model. Softw. 2018, 107, 85–95. [Google Scholar] [CrossRef]
- Economic Lossess from Climate-Related Extremes in Europe. Available online: https://www.eea.europa.eu/data-and-maps/indicators/river-floods-3/assessment (accessed on 5 August 2022).
- Hirabayashi, Y.; Mahendran, R.; Koirala, S.; Konoshima, L.; Yamazaki, D.; Watanabe, S.; Kanae, S. Global flood risk under climate change. Nat. Clim. Chang. 2013, 3, 816–821. [Google Scholar] [CrossRef]
- National Academies of Sciences, Engineering, and Medicine. Framing the Challenge of Urban Flooding in the United States; National Academies Press: Washington, DC, USA, 2019. [Google Scholar]
- Statistics of Flood Damage. Available online: https://www.mlit.go.jp/river/toukei_chousa/kasen/suigaitoukei/index.html (accessed on 5 August 2022).
- The Fifth Assessment Report (AR5) WG2-Climate Change 2014: Impacts, Adaptation, and Vulnerability. Available online: https://www.ipcc.ch/report/ar5/wg2/ (accessed on 5 August 2022).
- Mignot, E.; Dewals, B. Hydraulic modelling of inland urban flooding: Recent advances. J. Hydrol. 2022, 609, 127763. [Google Scholar] [CrossRef]
- Jacobson, C.R. Identification and quantification of the hydrological impacts of imperviousness in urban catchments: A review. J. Environ. Manag. 2011, 92, 1438–1448. [Google Scholar] [CrossRef] [PubMed]
- Zhang, W.; Villarini, G.; Vecchi, G.A.; Smith, J.A. Urbanization exacerbated the rainfall and flooding caused by hurricane Harvey in Houston. Nature 2018, 563, 384–388. [Google Scholar] [CrossRef] [PubMed]
- Shuster, W.D.; Bonta, J.; Thurston, H.; Warnemuende, E.; Smith, D. Impacts of impervious surface on watershed hydrology: A review. Urban Water J. 2005, 2, 263–275. [Google Scholar] [CrossRef]
- Wang, X.; Kinsland, G.; Poudel, D.; Fenech, A. Urban flood prediction under heavy precipitation. J. Hydrol. 2019, 577, 123984. [Google Scholar] [CrossRef]
- Djamres, E.K.D.; Komori, D.; Kazama, S. Topographical Characteristics of Frequent Inland Water Flooding Areas in Tangerang City, Indonesia. Front. Water 2021, 3, 661299. [Google Scholar] [CrossRef]
- Fariza, A.; Basofi, A.; Prasetyaningrum, I.; Pratiwi, V.I. Urban flood risk assessment in sidoarjo, indonesia, using fuzzy multi-criteria decision making. J. Phys. Conf. Ser. 2019, 1444, 012027. [Google Scholar] [CrossRef]
- Sato, R.; Hayashi, T. Topographical and topographical characteristics of flooded areas and visualization of potential for pluvial flooding. J. Jpn. Soc. Hydrol. Water Resour. 2014, 27, 158–169. [Google Scholar] [CrossRef]
- Guidelines for Statistics of Flood Damage. Available online: http://www.mlit.go.jp/river/toukei_chousa/kasen/suigaitoukei/shiryou.html (accessed on 5 August 2022).
- National Land Information Division. Available online: https://nlftp.mlit.go.jp/ksj/index.html (accessed on 25 August 2022).
- Japan Meteorological Agency AMeDAS. Available online: https://www.jma.go.jp/jp/amedas/ (accessed on 25 August 2022).
- Geospatial Information Authority of Japan. Available online: https://fgd.gsi.go.jp/download/menu.php (accessed on 5 August 2022).
- Nagoya City Water and Sewerage Bureau: Countermeasures in Response to the Torrential Rains in Tokai, Japan. Available online: https://www.water.city.nagoya.jp/category/saigaisonae/2174.html (accessed on 5 August 2022).
- de Almeida, G.A.; Bates, P.; Ozdemir, H. Modelling urban floods at submetre resolution: Challenges or opportunities for flood risk management? J. Flood Risk Manag. 2018, 11, S855–S865. [Google Scholar] [CrossRef]
- Le Coz, J.; Patalano, A.; Collins, D.; Guillén, N.F.; García, C.M.; Smart, G.M.; Braud, I. Crowdsourced data for flood hydrology: Feedback from recent citizen science projects in Argentina, France and New Zealand. J. Hydrol. 2016, 541, 766–777. [Google Scholar] [CrossRef]
- Kankanamge, N.; Yigitcanlar, T.; Goonetilleke, A.; Kamruzzaman, M. Determining disaster severity through social media analysis: Testing the methodology with South East Queensland Flood tweets. Int. J. Disaster Risk Reduct. 2020, 42, 101360. [Google Scholar] [CrossRef]
- Zhang, Y.; Chen, Z.; Zheng, X.; Chen, N.; Wang, Y. Extracting the location of flooding events in urban systems and analyzing the semantic risk using social sensing data. J. Hydrol. 2021, 603, 127053. [Google Scholar] [CrossRef]
- Sivapalan, M.; Savenjie, H.H.G.; Blöschl, G. Sociohydrology: A new science of people and water. Hydrol. Process. 2012, 26, 1270–1276. [Google Scholar] [CrossRef]
- Di Baldassarre, G.; Sivapalan, M.; Rusca, M.; Cudennec, C.; Garcia, M.; Kreibich, H.; Konar, M.; Mondino, E.; Mård, J.; Pande, S.; et al. Sociohydrology: Scientific challenges in addressing the sustainable development goals. Water Resour. Res. 2019, 55, 6327–6355. [Google Scholar] [CrossRef] [PubMed]
- Kreibich, H.; Schröter, K.; Di Baldassarre, G.; Van Loon, A.; Mazzoleni, M.; Abeshu, G.W.; Agafonova, S.; AghaKouchak, A.; Aksoy, H.; Alvarez-Garreton, C.; et al. Panta Rhei benchmark dataset: Socio-hydrological data of paired events of floods and droughts. GFZ Data Serv. 2022. [Google Scholar] [CrossRef]
| Osaka City | Nagoya City | |
|---|---|---|
| Population (person) | 2,717,000 | 2,311,000 |
| Population density (person/km2) | 12,000 | 7000 |
| Urbanised area ratio (%) | 93.9 | 92.6 |
| Gross domestic product (trillion yen) | 20.0 | 14.4 |
| Urban pluvial flooding area records | 155 1 | 302 1 |
| Rank | Osaka City | Nagoya City | ||
|---|---|---|---|---|
| Date | Annual Maximum One-Hour Rainfall (mm) | Date | Annual Maximum One-Hour Rainfall (mm) | |
| 1 | 16:00 27 Aug. 2011 | 73 | 19:00 18 Sep. 2000 | 93 |
| 2 | 15:00 18 Aug. 2012 | 52 | 6:00 08 Oct. 2009 | 67 |
| 3 | 1:00 29 Aug. 1996 | 49.5 | 0:00 29 Aug. 2008 | 55 |
| 4 | 11:00 03 July 1995 | 45.5 | 0:00 28 July 1998 | 49.5 |
| 5 | 15:00 05 Aug. 1977 | 45.5 | 15:00 05 Sep. 2004 | 49.5 |
| 6 | 18:00 20 Oct. 2004 | 38 | 23:00 21 Aug. 1999 | 49 |
| 7 | 2:00 11 Aug. 1999 | 36 | 21:00 17 Sep. 1994 | 46.5 |
| 8 | 15:00 24 Sep. 2003 | 31 | 16:00 20 Sep. 2011 | 43.5 |
| 9 | 15:00 28 July 2008 | 30.5 | 18:00 25 July 1993 | 40.5 |
| 10 | 2:00 16 June 2010 | 29.5 | 14:00 20 July 2012 | 37 |
| 11 | 3:00 05 July 1993 | 28.5 | 5:00 23 Aug. 2007 | 33.5 |
| 12 | 15:00 30 Aug. 2005 | 27 | 5:00 11 July 1997 | 33 |
| 13 | 8:00 08 Sep. 1994 | 26.5 | 9:00 21 July 1995 | 28.5 |
| 14 | 5:00 13 July 2002 | 26.5 | 18:00 26 Aug. 2003 | 27 |
| 15 | 0:00 17 July 2007 | 26 | 9:00 06 Sep. 2002 | 26 |
| 16 | 22:00 16 May 1998 | 23 | 9:00 20 Aug. 2005 | 24.5 |
| 17 | 18:00 11 Sep. 2000 | 22 | 20:00 30 Aug. 2001 | 23.5 |
| 18 | 8:00 01 Oct. 2001 | 21 | 1:00 16 June 2006 | 23.5 |
| 19 | 6:00 19 July 2006 | 19 | 11:00 08 Sep. 2010 | 21.5 |
| 20 | 1:00 30 July 2009 | 13.5 | 6:00 09 May 1996 | 17 |
| Topographical Factor | Unit | Methodology for Creating Dataset |
|---|---|---|
| Elevation | m | DEM is converted to raster data. |
| Slope | % | The slope at each mesh is calculated from “Elevation”. |
| Depth of concave | m | The area where the elevation is lower than the surrounding area and the contour lines are closed is extracted as a concave area, and the depth and volume of the concave area are calculated. |
| Capacity of concave | m3 | |
| Catchment area | m2 | Flow direction data are created from “Elevation”, and the area is calculated from the number of meshes upstream of each mesh. |
| Slope of upstream | % | The average of the slope in the catchment area of each mesh is calculated. |
| Slope of downstream | % | The average of the slopes in the downstream channel of each mesh is calculated. |
| Difference of slope | % | The difference between “Slope of upstream” and “Slope of downstream” at each mesh is calculated. |
| Flow length of upstream | m | The length of longest upstream channel in each mesh is extracted from the flow direction data. |
| Flow length of downstream | m | The length of the downstream channel to a sink or outlet of the catchment area in each mesh is extracted from the flow direction data. |
| Difference of flow length | m | The difference between “Flow length of upstream” and “Flow length of downstream” at each mesh is calculated. |
| (a) | ||||||
| Osaka City | ||||||
| Total Years of Urban Pluvial Flooding (Year) | Mesh Size | |||||
| 10 m | 30 m | 50 m | 100 m | 200 m | 400 m | |
| 1 | 38,687 | 7648 | 4089 | 1879 | 898 | 337 |
| 2 | 3820 | 1082 | 692 | 462 | 323 | 210 |
| 3 | 645 | 261 | 189 | 138 | 116 | 99 |
| 4 | 70 | 36 | 45 | 49 | 42 | 45 |
| 5 | 4 | 8 | 10 | 20 | 23 | 18 |
| 6 | 1 | 1 | 4 | 5 | ||
| 7 | 2 | |||||
| More than 4 | 74 | 45 | 55 | 70 | 69 | 70 |
| (b) | ||||||
| Nagoya City | ||||||
| Total Years of Urban Pluvial Flooding (Year) | Mesh Size | |||||
| 10 m | 30 m | 50 m | 100 m | 200 m | 400 m | |
| 1 | 632,915 | 73,366 | 27,436 | 7406 | 2093 | 542 |
| 2 | 102,193 | 13,330 | 5540 | 1920 | 743 | 303 |
| 3 | 11,737 | 1931 | 929 | 435 | 261 | 161 |
| 4 | 1243 | 256 | 153 | 83 | 54 | 51 |
| 5 | 172 | 35 | 22 | 16 | 17 | 19 |
| 6 | 39 | 16 | 12 | 9 | 5 | 6 |
| 7 | 1 | 2 | ||||
| More than 4 | 1454 | 307 | 187 | 108 | 77 | 78 |
| (a) | ||||
| Factor Loading | PC1 | PC2 | PC3 | PC4 |
| Standard deviation (eigenvalue) | 1.94 | 1.63 | 1.39 | 1.04 |
| Contribution ratio | 0.343 | 0.241 | 0.176 | 0.098 |
| Cumulative contribution ratio | 0.343 | 0.584 | 0.759 | 0.857 |
| Elevation | 0.373 | −0.017 | −0.016 | 0.162 |
| Slope | 0.354 | −0.387 | - | 0.008 |
| Depth of concave | −0.278 | −0.311 | −0.051 | −0.539 |
| Capacity of concave | −0.308 | −0.331 | −0.049 | −0.401 |
| Catchment area | −0.027 | 0.060 | 0.683 | 0.018 |
| Slope of upstream | 0.404 | −0.295 | 0.102 | −0.212 |
| Slope of downstream | 0.213 | −0.435 | −0.043 | 0.391 |
| Difference of slope | 0.390 | −0.210 | 0.125 | −0.337 |
| Flow length of upstream | −0.070 | 0.014 | 0.687 | −0.018 |
| Flow length of downstream | 0.310 | 0.409 | 0.045 | −0.333 |
| Difference of flow length | −0.319 | −0.389 | 0.163 | 0.315 |
| (b) | ||||
| Factor Loading | PC1 | PC2 | PC3 | PC4 |
| Standard deviation (eigenvalue) | 1.93 | 1.77 | 1.34 | 1.05 |
| Contribution ratio | 0.338 | 0.285 | 0.164 | 0.100 |
| Cumulative contribution ratio | 0.338 | 0.623 | 0.786 | 0.886 |
| Elevation | −0.387 | 0.193 | 0.078 | −0.249 |
| Slope | −0.366 | 0.195 | −0.297 | −0.322 |
| Depth of concave | 0.352 | −0.172 | −0.126 | −0.581 |
| Capacity of concave | 0.383 | −0.120 | −0.131 | −0.547 |
| Catchment area | −0.147 | −0.463 | 0.201 | −0.073 |
| Slope of upstream | −0.434 | −0.217 | −0.025 | −0.172 |
| Slope of downstream | −0.317 | 0.200 | −0.416 | −0.180 |
| Difference of slope | −0.349 | −0.309 | 0.128 | −0.118 |
| Flow length of upstream | −0.104 | −0.495 | 0.212 | −0.040 |
| Flow length of downstream | −0.054 | 0.206 | 0.647 | −0.271 |
| Difference of flow length | −0.012 | −0.443 | −0.422 | 0.204 |
| Classified Frequent Urban Pluvial Flooding Areas in Figure 5 | Osaka City | Nagoya City |
|---|---|---|
| (a) | 29% | 14% |
| (b) | 7% | 21% |
| (c) | 3% | 19% |
| (d) | 20% | 4% |
| (e) | 9% | 6% |
| (f) | 4% | 2% |
| (g) | 1% | 1% |
| (h) | 17% | 0% |
| (i) | 9% | 22% |
| (j) | 1% | 11% |
| Total | 100% | 100% |
Publisher’s Note: MDPI stays neutral with regard to jurisdictional claims in published maps and institutional affiliations. |
© 2022 by the authors. Licensee MDPI, Basel, Switzerland. This article is an open access article distributed under the terms and conditions of the Creative Commons Attribution (CC BY) license (https://creativecommons.org/licenses/by/4.0/).
Share and Cite
Komori, D.; Nakaguchi, K.; Inomata, R.; Oyatsu, Y.; Tachikawa, R.; Kazama, S. Topographical Characteristics of Frequent Urban Pluvial Flooding Areas in Osaka and Nagoya Cities, Japan. Water 2022, 14, 2795. https://doi.org/10.3390/w14182795
Komori D, Nakaguchi K, Inomata R, Oyatsu Y, Tachikawa R, Kazama S. Topographical Characteristics of Frequent Urban Pluvial Flooding Areas in Osaka and Nagoya Cities, Japan. Water. 2022; 14(18):2795. https://doi.org/10.3390/w14182795
Chicago/Turabian StyleKomori, Daisuke, Kota Nakaguchi, Ryosuke Inomata, Yuika Oyatsu, Ryohei Tachikawa, and So Kazama. 2022. "Topographical Characteristics of Frequent Urban Pluvial Flooding Areas in Osaka and Nagoya Cities, Japan" Water 14, no. 18: 2795. https://doi.org/10.3390/w14182795
APA StyleKomori, D., Nakaguchi, K., Inomata, R., Oyatsu, Y., Tachikawa, R., & Kazama, S. (2022). Topographical Characteristics of Frequent Urban Pluvial Flooding Areas in Osaka and Nagoya Cities, Japan. Water, 14(18), 2795. https://doi.org/10.3390/w14182795


