1. Introduction
Groundwater is the primary source of drinking water in the Erbil region in Kurdistan, Iraq. As the population continues to rise, more water is required for industrial, domestic, environmental, recreational, and agricultural purposes. When water resources are limited, rising demand for water necessitates efficient water resource management and assessment, particularly when the water is to be used for human consumption [
1] and crop production. Water management improvements are required to enhance and diversify food production to fulfil the needs of a growing population, while minimizing crop vulnerability to droughts, floods, and climate change [
2]. Water management in climate smart agriculture includes techniques such as drip irrigation and hydroponics, which are more dependent on good water quality. Water quality can have a negative influence on the performance of an irrigation system due to the plugging of emitters and sprinklers. These problems can be caused by inorganic solids (silt and sand), organic solids (algae, bacteria and slime) and dissolved solids (calcium, iron and manganese) [
3].
Therefore, groundwater chemistry based on hydro-chemical data is necessary for obtaining basic information on water types, categorizing water for various applications, identifying distinct groundwater aquifers, and studying various chemical processes.
The physical and chemical characteristics that impact groundwater quality in a given area are substantially influenced by geological formations and anthropogenic activity [
4]. Electrical conductivity levels reflected by salinity damage to plants are highly important considerations in evaluating the quality of water used for irrigation because of its impact on the osmotic pressure of the soil solution and the capacity of plants to absorb water via their roots [
5].
Groundwater chemical characteristics play an important role in identifying and assessing water quality, and chemical classification shown by the concentration of various predominant cations, anions and their interrelationships. Ion dissolution in groundwater occurs more frequently as a result of interactions between groundwater and rock or soil, and the evaporation process, than as a result of precipitation or other sources. The composition of rainwater, mineralogy of the watershed and aquifers, topography, and climate controls the chemical composition of surface- and groundwater [
6].
Groundwater fluctuation analysis estimated the variations in stored water, renewable storage water quantity, and investment of groundwater uses [
7]. Fluctuation is affected by many factors such as rainfall intensity and quantity, Infiltration capacity of the soil and bed rocks, groundwater depth above sea level, topography, evapotranspiration, and water well discharge [
8].
Climate change, in the form of longer and more severe droughts or more intense rainfall events leading to flooding, can affect both the quality and quantity of water, necessitating planning and management to mitigate its negative effects on drinking water supplies.
The main objectives of this study were to investigate the possible sources of ions in the groundwater, and to understand the hydrogeological processes and the hydro-chemical characteristics of the groundwater by analyzing irrigation water parameters such as major cations and anions. This will allow for a discussion of the possibility of using groundwater for different purposes. The spatial distribution of hydro-chemical constituents of groundwater related to its suitability for different purposes, groundwater classification, water (quality) type, hypothetical salts and the groundwater level fluctuation were identified for the selected monitoring wells in the study area.
2. Materials and Methods
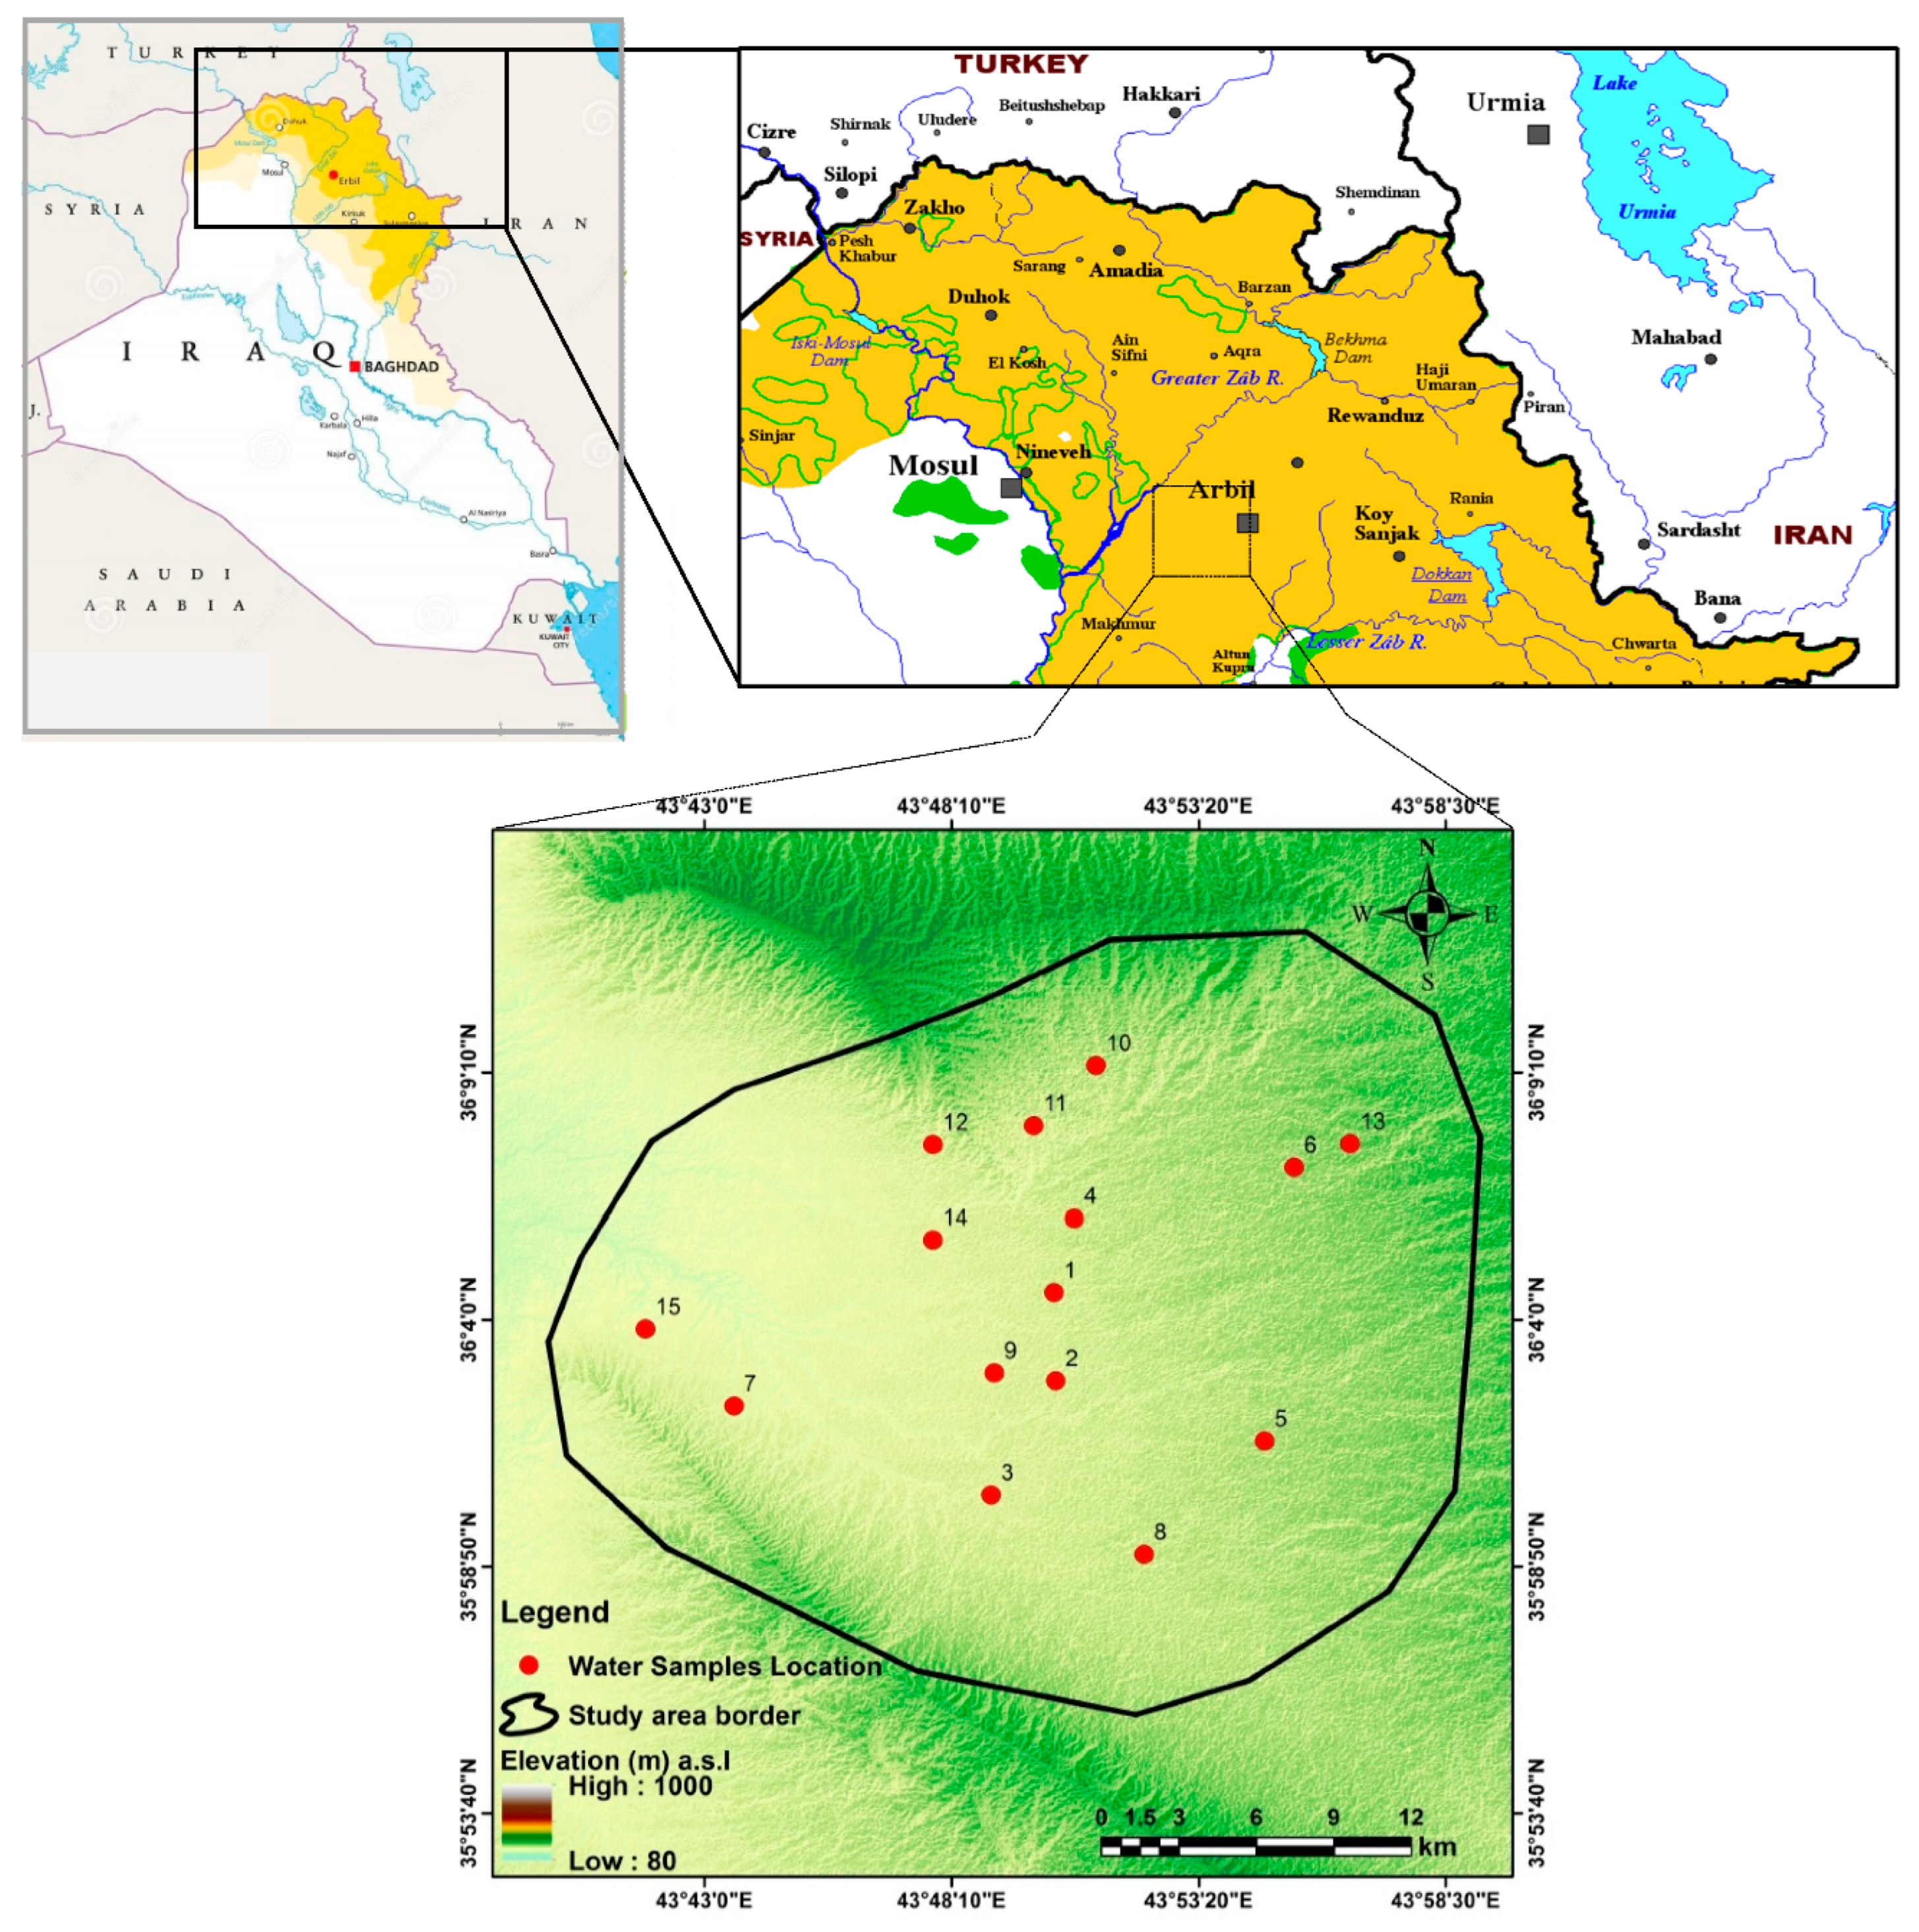
2.1. Study Area Description
The area of interest is located in the southwestern part of Erbil City and north of Gwer district, which situated in Shamamek district, extending between (43°39′17″–44°0′11″ E) and (35°55′10″–36°12′24″ N). The area covers about 663 km
2, the elevation ranging from 300 m to 500 m above sea level within the foothill zone (
Figure 1). The area is bordered by the Zurga Zraw Dagh anticline in the south and southwest and Erbil City in the northeast. The crops in the area are mainly wheat and barley, and the irrigation system is surface irrigation.
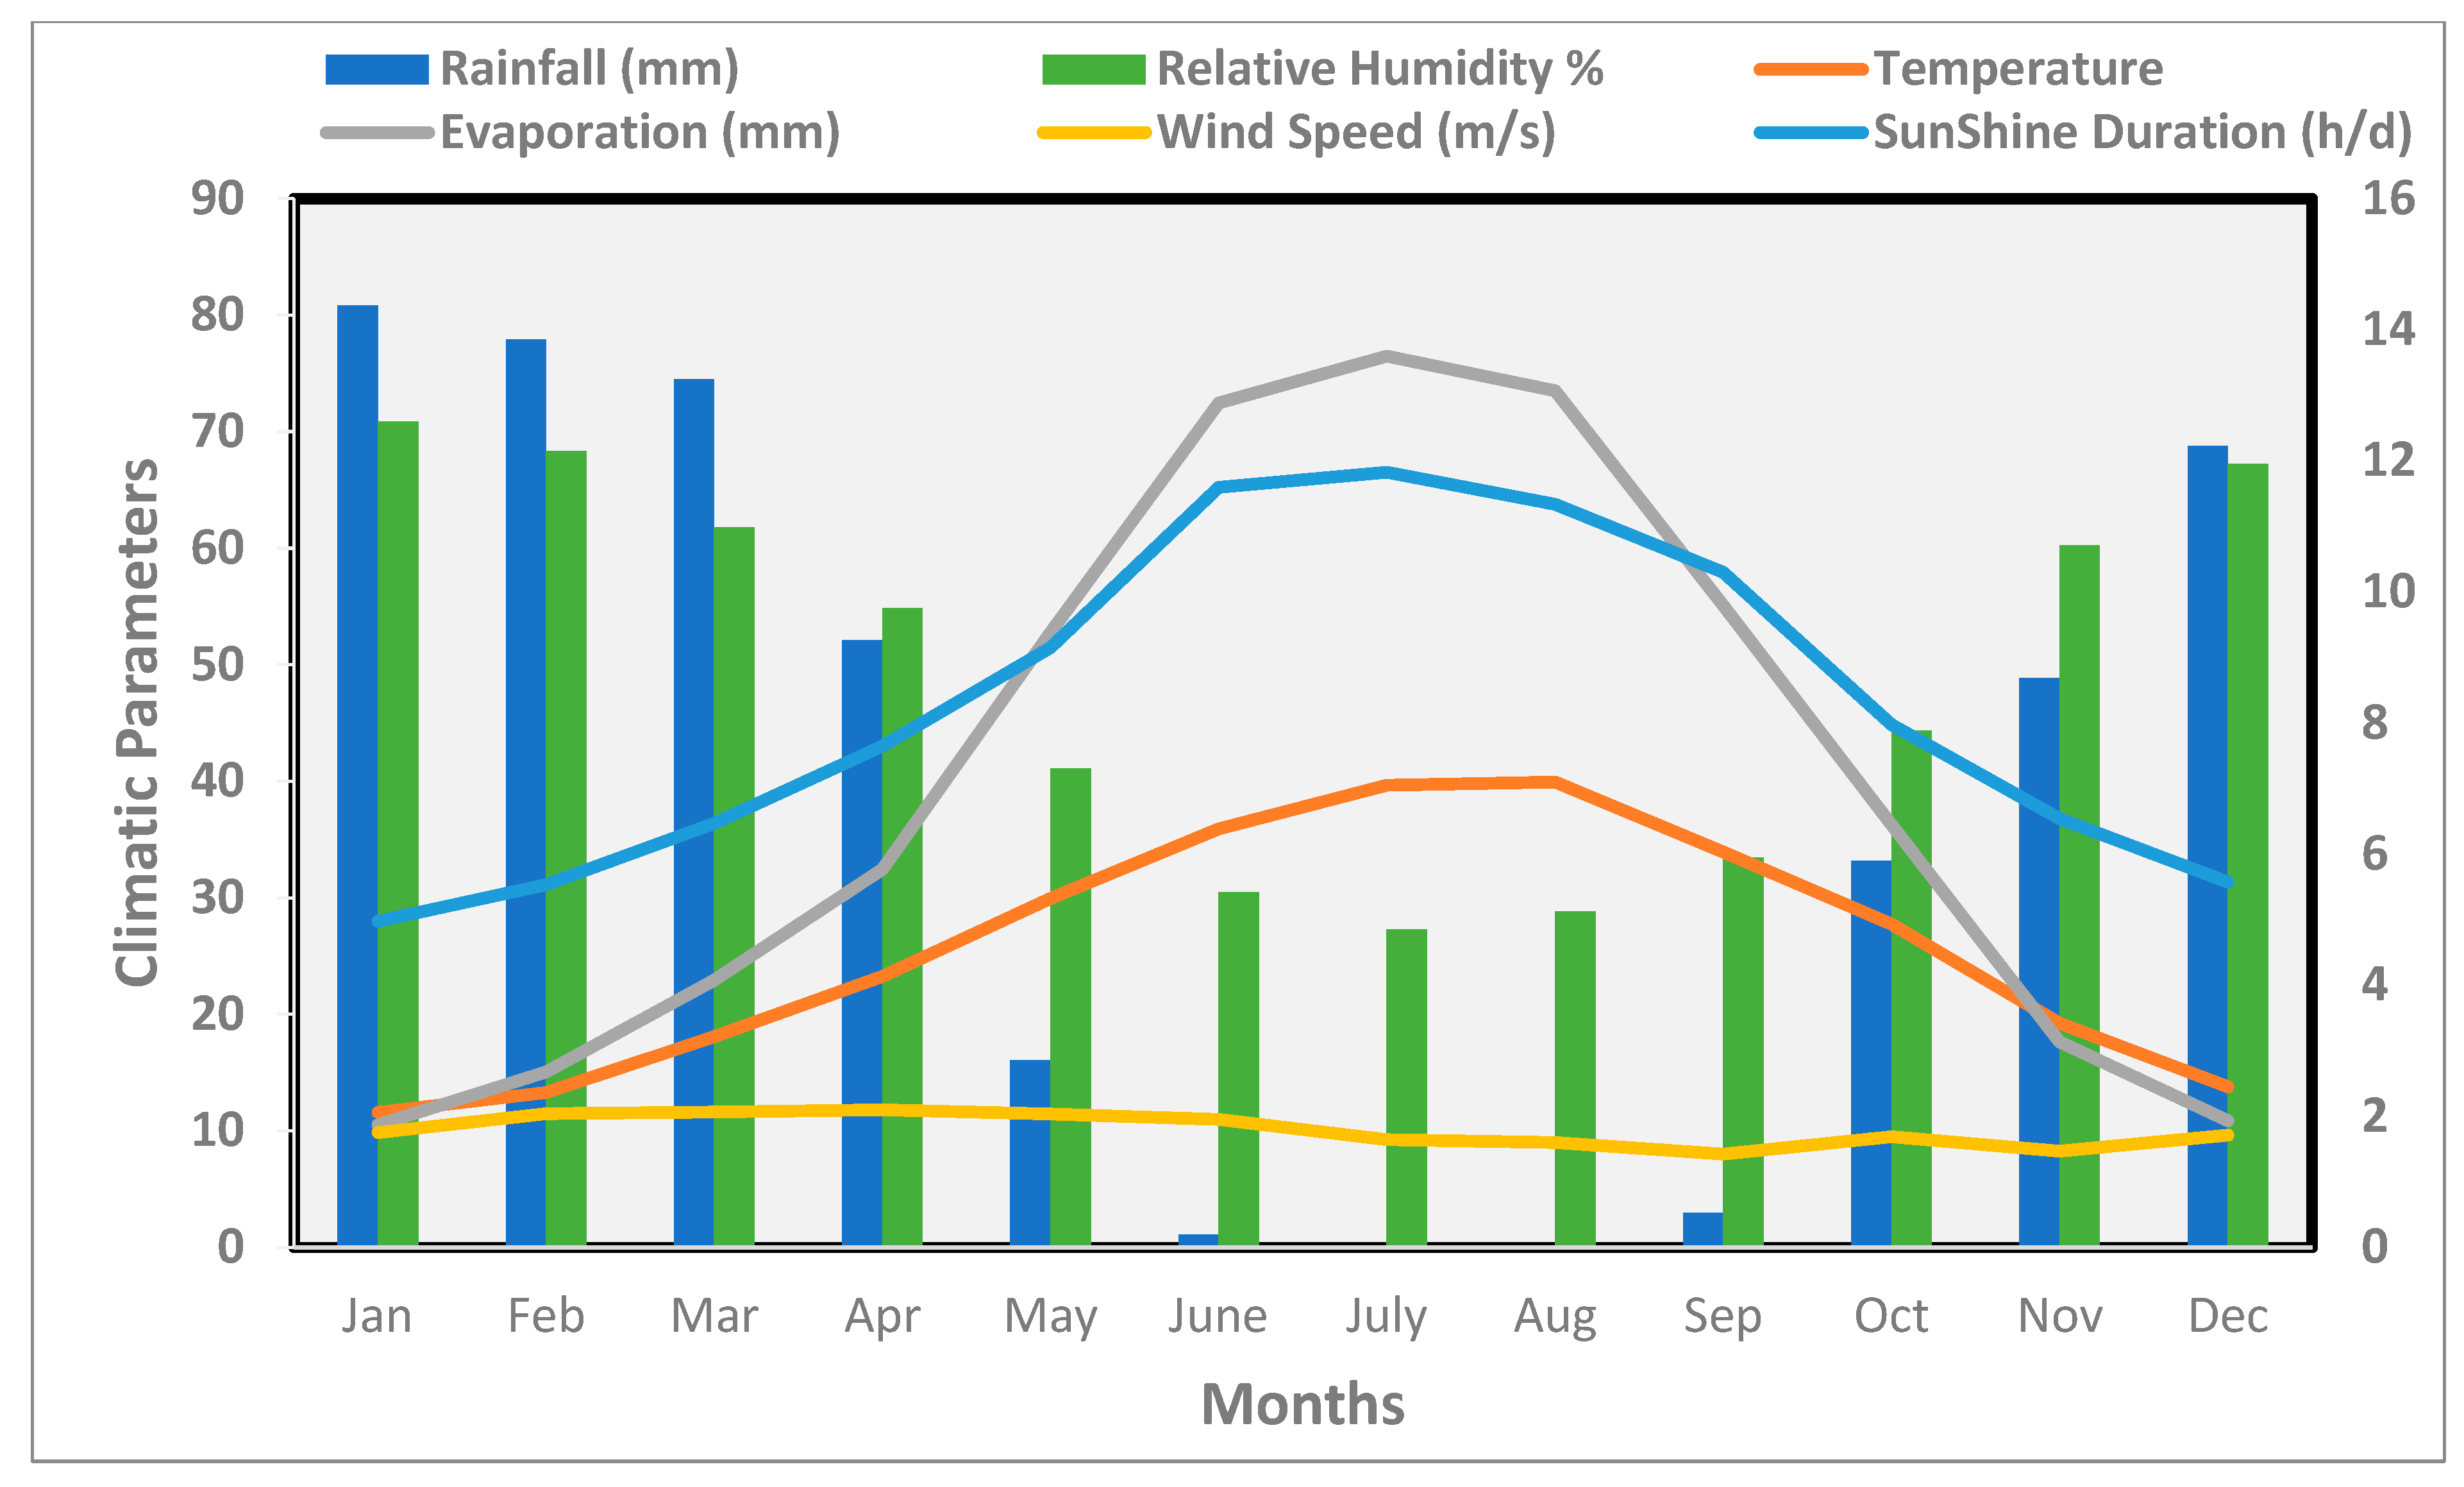
2.2. Climate
The climate in the study area belongs to the semi-arid Mediterranean type. It is characterized by cold and rainy winters, and long, hot, and dry summers. Meteorological data obtained from the Erbil meteorological station for the period from 2003 to 2020 (
Figure 2) shows that annual precipitation is about 456.2 mm, maximum and minimum mean monthly relative humidity is 70.9% in January and 27.3% in July, respectively. Maximum monthly temperature is about 39.9 °C in August and the minimum is about 11.6 °C in January. Maximum evaporation is 136 mm in July and the minimum is 18.7 mm in January. The mean annual sunshine duration is 8.2 h/day, and wind speed is between 1.4 and 2.1 m/s with an annual mean wind speed of 1.8 m/s.
2.3. Lithological and Tectonic Framework
The main outcrops in the study area are Pleistocene and Holocene deposits represented by residual and older terraces consists of conglomerate, gravel, sand, clay, silt; Pliocene deposits represented by the Bai Hassan formation consist of molasses sediment represented by alternating claystone and conglomerate with some sandstone and siltstone, and the Muqdadiya formation, which was laid down in a fluvial environment in a strongly sinking fore deep, and might be considered as typical fresh water molasses with mostly Pliocene age. The aquifer in the study area is porous aquifer.
Tectonically, the study area is a part of the Unstable Shelf Zone that was affected by the Alpine orogeny in the Mesozoic in the Chamchamal-Butma sub-zone of the Foothill Zone. The unstable shelf is characterized by structural trends and faces changes that are parallel to the Zagros-Taurus suture belts [
9].
2.4. Water Sampling and Analysis
Sixteen water well samples were collected in the study area in February 2022 to investigate quality, suitability, uses and classification of the water in the study area. Garmin eTrex 20 GPS device was used for field data collection and determining the coordination of the deep well locations, which generally showed a spatial accuracy of ±4 m (
Table 1).
Physical parameters for the samples such as temperature, pH and electrical conductivity (EC) were measured in the field using portable EC, T and pH meters. Chemical parameters such as major cations (Ca
2+, Mg
2+, Na
+, K
+) and major anions (SO
42−, HCO
3−, Cl
−, CO
3−) were analyzed in the laboratory of the University of Mosul using ion chromatography instruments. Total hardness results from the presence of divalent metallic cations of calcium and magnesium, which are very abundant in water. The total hardness (TH) was calculated using the equation given by Hem, 1985 [
10]:
2.5. Groundwater Quality Assessment
The concentration of cations and anions was interrelated, and the irrigation indexes were calculated including the sodium adsorption ratio (SAR) [
11], sodium percentage (Na%) [
12], residual sodium carbonate (RSC) [
11], magnesium hazard (MH) [
13], potential salinity (Ps) [
14], permeability index (PI) [
15], and monovalent cation adsorption ration (MCAR) [
16] were used to assess groundwater quality.
The indexes were calculated using the equations below:
The interpolation for the parameter’s concentration was carried out in ArcGIS 10.1 using the Kriging method to plot the parameter distribution for the well samples in the study area.
2.6. Cation Ratio of Structural Stability (CROSS)
The Cation ratio of structural stability CROSS was used to assess the soil permeability hazard.
The major cations commonly occur in irrigation water in soil solutions, and on soil cations exchange sites, with concentrations and relative distributions influenced by both natural and anthropogenic factors [
17].
Rengasamy and Marchuk [
18] proposed that CROSS should be more predictive than SAR in assessing irrigation water quality for soil permeability hazard because it includes the dispersive effect of K in addition to that of Na and differentiates the flocculating effect of Mg from that of Ca.
2.7. Hydrochemical Formula and Water Type
Water type is always represented by account of major cations and anions in (epm%) it exceeds than (15%) in the hydro-chemical formula, and the formula are determined according to Ivanov (1968) formula [
19]:
2.8. Groundwater Uses for Irrigation Purposes
The irrigation of cropland has become a widely used practice and has greatly increased the productivity of farmland. It has made it possible to farm in regions that would not be farmable without irrigation. A problem with irrigated cropland is the possibility of groundwater contamination and the stricter restrictions that are going to have to be implemented on the quantity of fertilizers and pesticides used to reduce the risk of contamination [
20].
The classification of irrigation water depends on variables such as: Total Dissolved Solids (TDS); Sodium Adsorption Ratio; Residual Sodium Carbonate; and Chloride.
2.8.1. Total Dissolved Solids
The suitability of irrigation water is dependent on the effect of the mineral constituent of water on both the plant and soil, and the effect of salts on soil causing changes in soil structure. Infiltration is increased with increase in (TDS), and is then used for evaluating soil permeability [
21].
Train classification (1979) [
22] was used to assess the suitability of the water for irrigation, comparing this classification with water samples in the study area (
Table 2).
2.8.2. Sodium Adsorption Ratio
General classification of water sodium hazard based on SAR according to Bauder et al. (2004) [
23] were used to determine the suitable water uses for irrigation (
Table 3).
2.8.3. Residual Sodium Carbonate
Higher RSC values suggest that a significant amount of calcium and some magnesium ions precipitate from the solution, increasing the percentage of sodium in water and soil particles and thus increasing the risk of a sodium hazard [
24].
The relation between RSC and suitability of water for irrigation purposes is as in the table below (
Table 4):
2.8.4. Chloride
Chloride is not adsorbed by soils but readily moves with the soil water; it is taken up by plant roots and moves upward to accumulate in the leaves [
25]. Chloride is essential to plants in very small amounts; it can cause toxicity to sensitive crops at high concentration. The Bauder [
23] classification was used to determine the suitability of water uses for irrigation (
Table 5).
2.9. Groundwater Classification
Classification of groundwater according to chemical indicators depends on hydro-chemical parameters. Different types of classification were applied in this research to classify the water such as: Piper Diagram Classification; Sholler Classification; Chadha Classification; and Gibbs diagram classification.
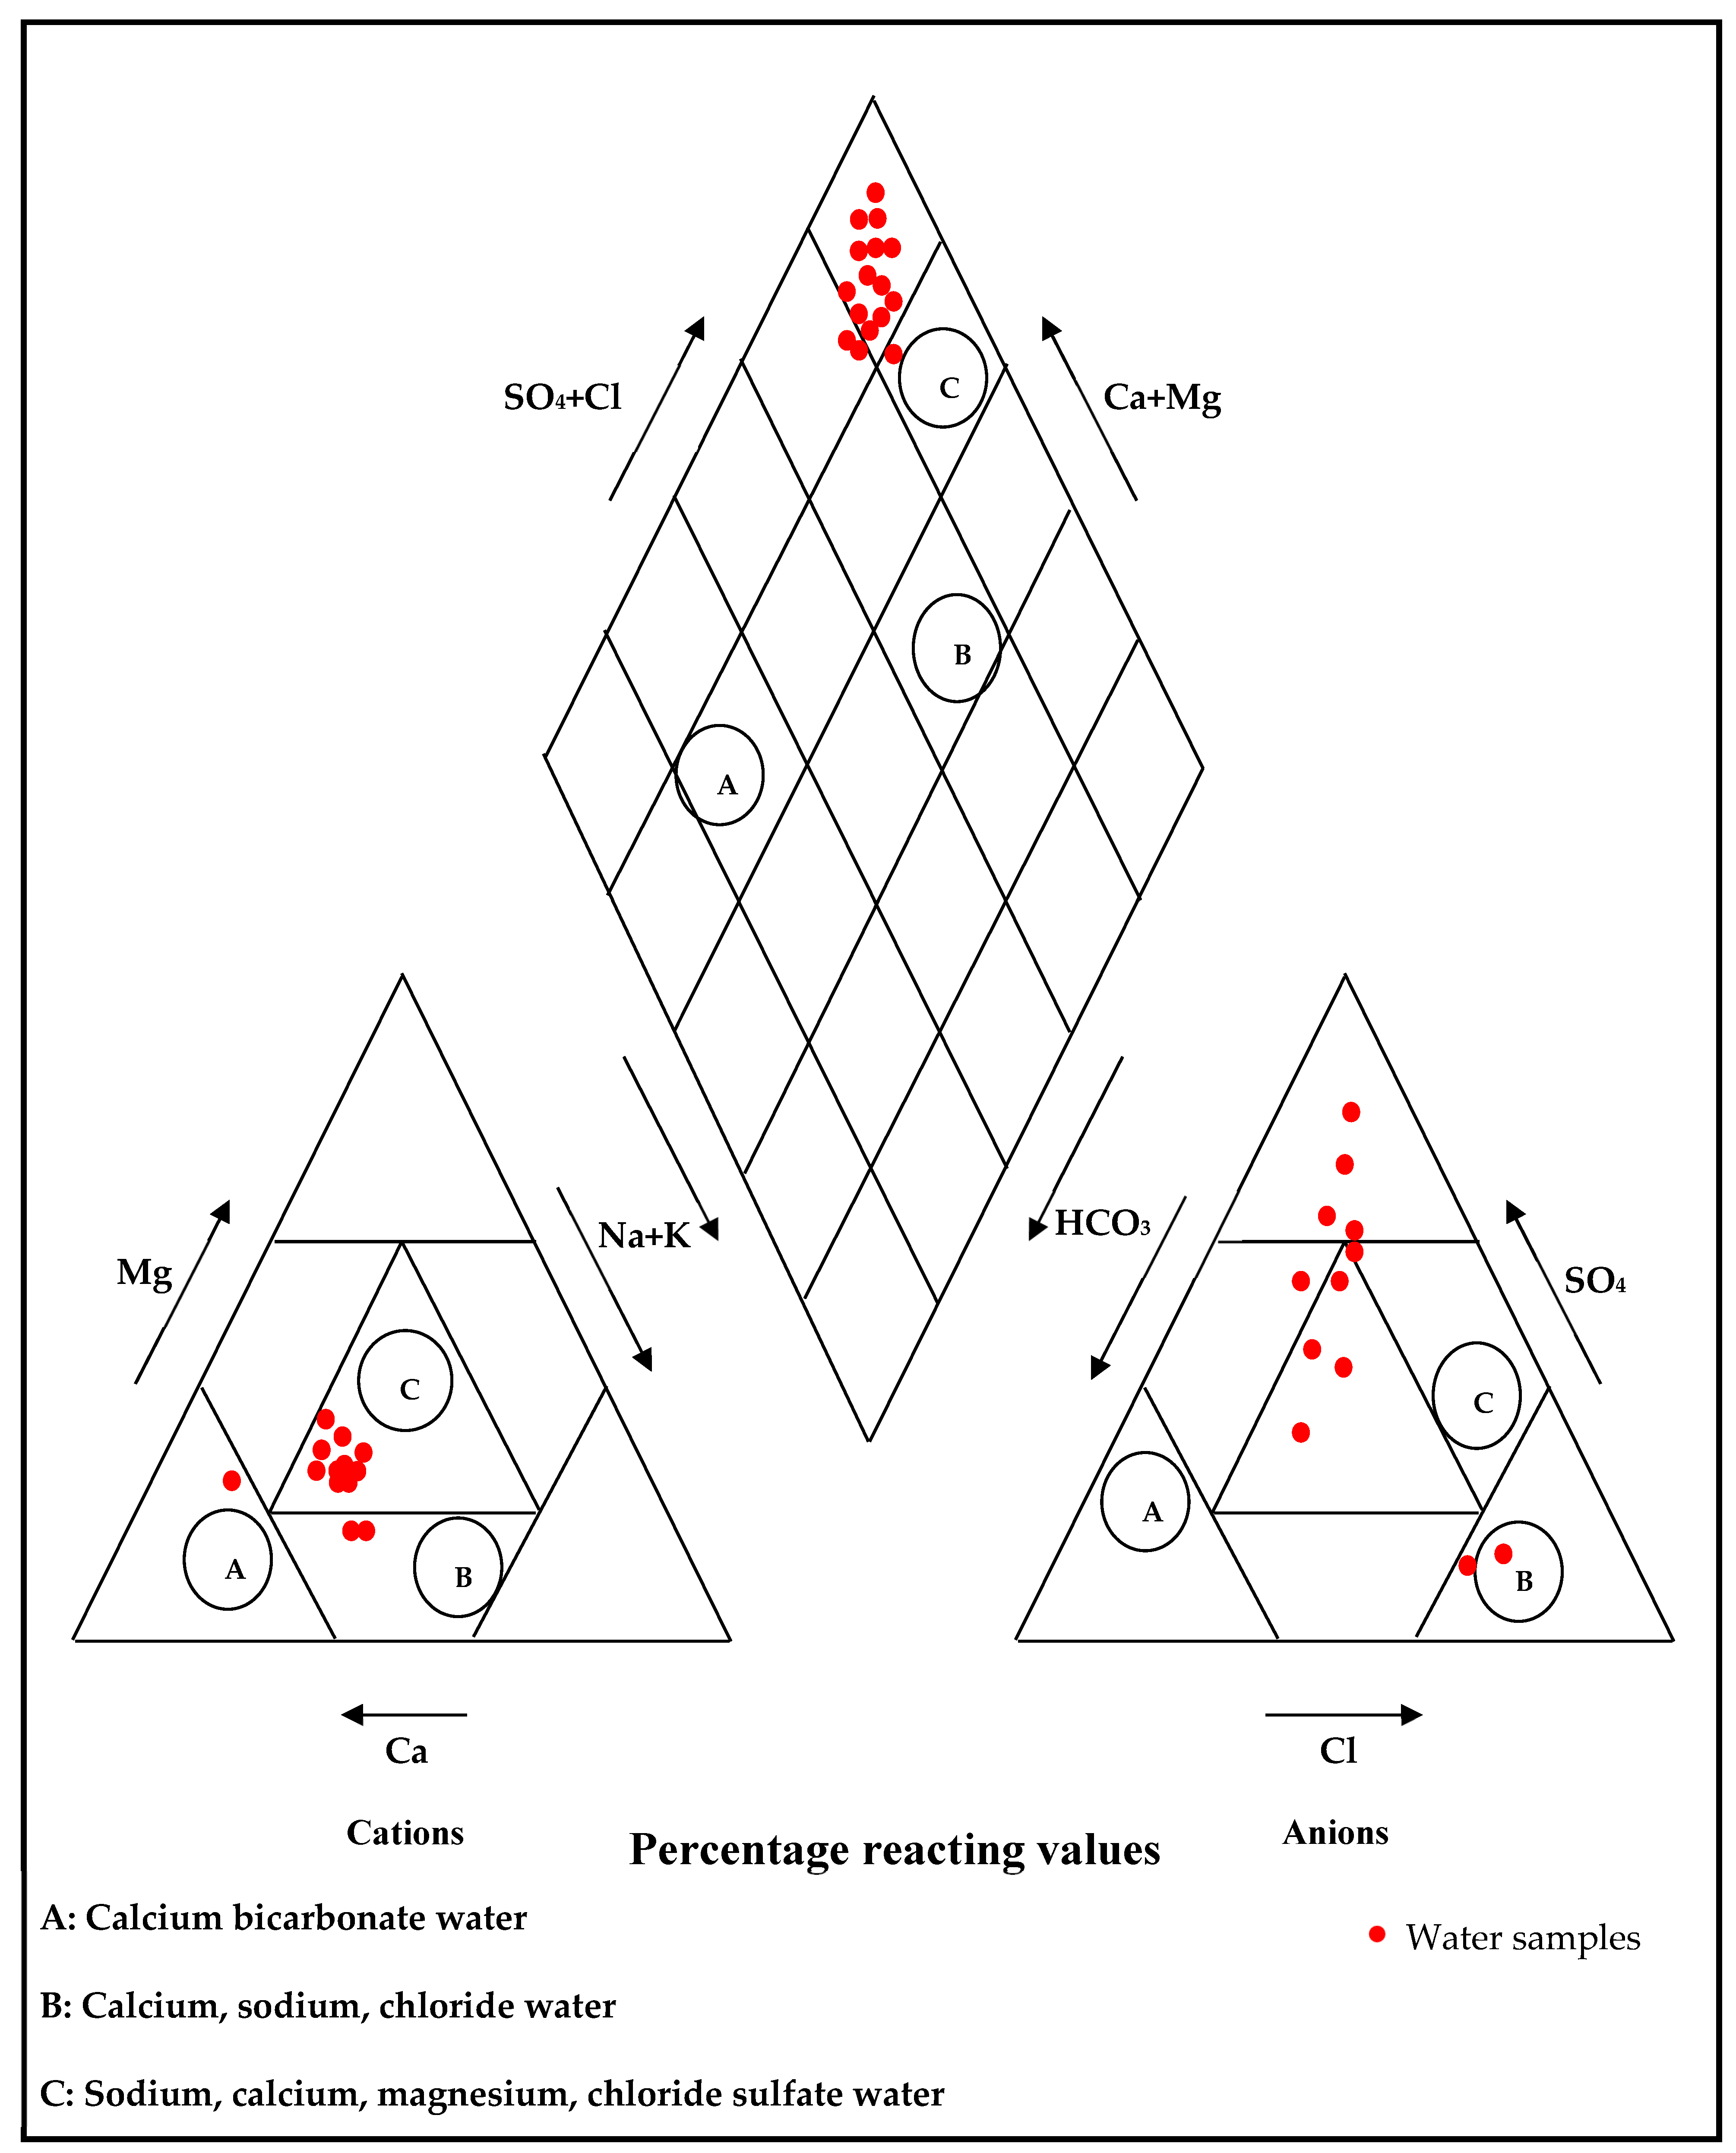
2.9.1. Piper Diagram Classification (1944) [26]
This classification can be combined with the classification based on the dominant ions present in the water. Most classifications of this type use a percentage of anion and cation equivalents per million [
27].
2.9.2. Sholler Classification (1972) [28]
In this classification, the ion concentration in (epm) units is plotted on semi-logarithm paper. This type of diagram facilitates a visual comparison of the composition of different water types in descending order, shown in
Table 6 [
29].
According to this classification, parallel relationships in the hydro-chemical composition for the water reflect the effect of dissolution processes or weathering of rocks by the water, otherwise the water composition is from another source [
30].
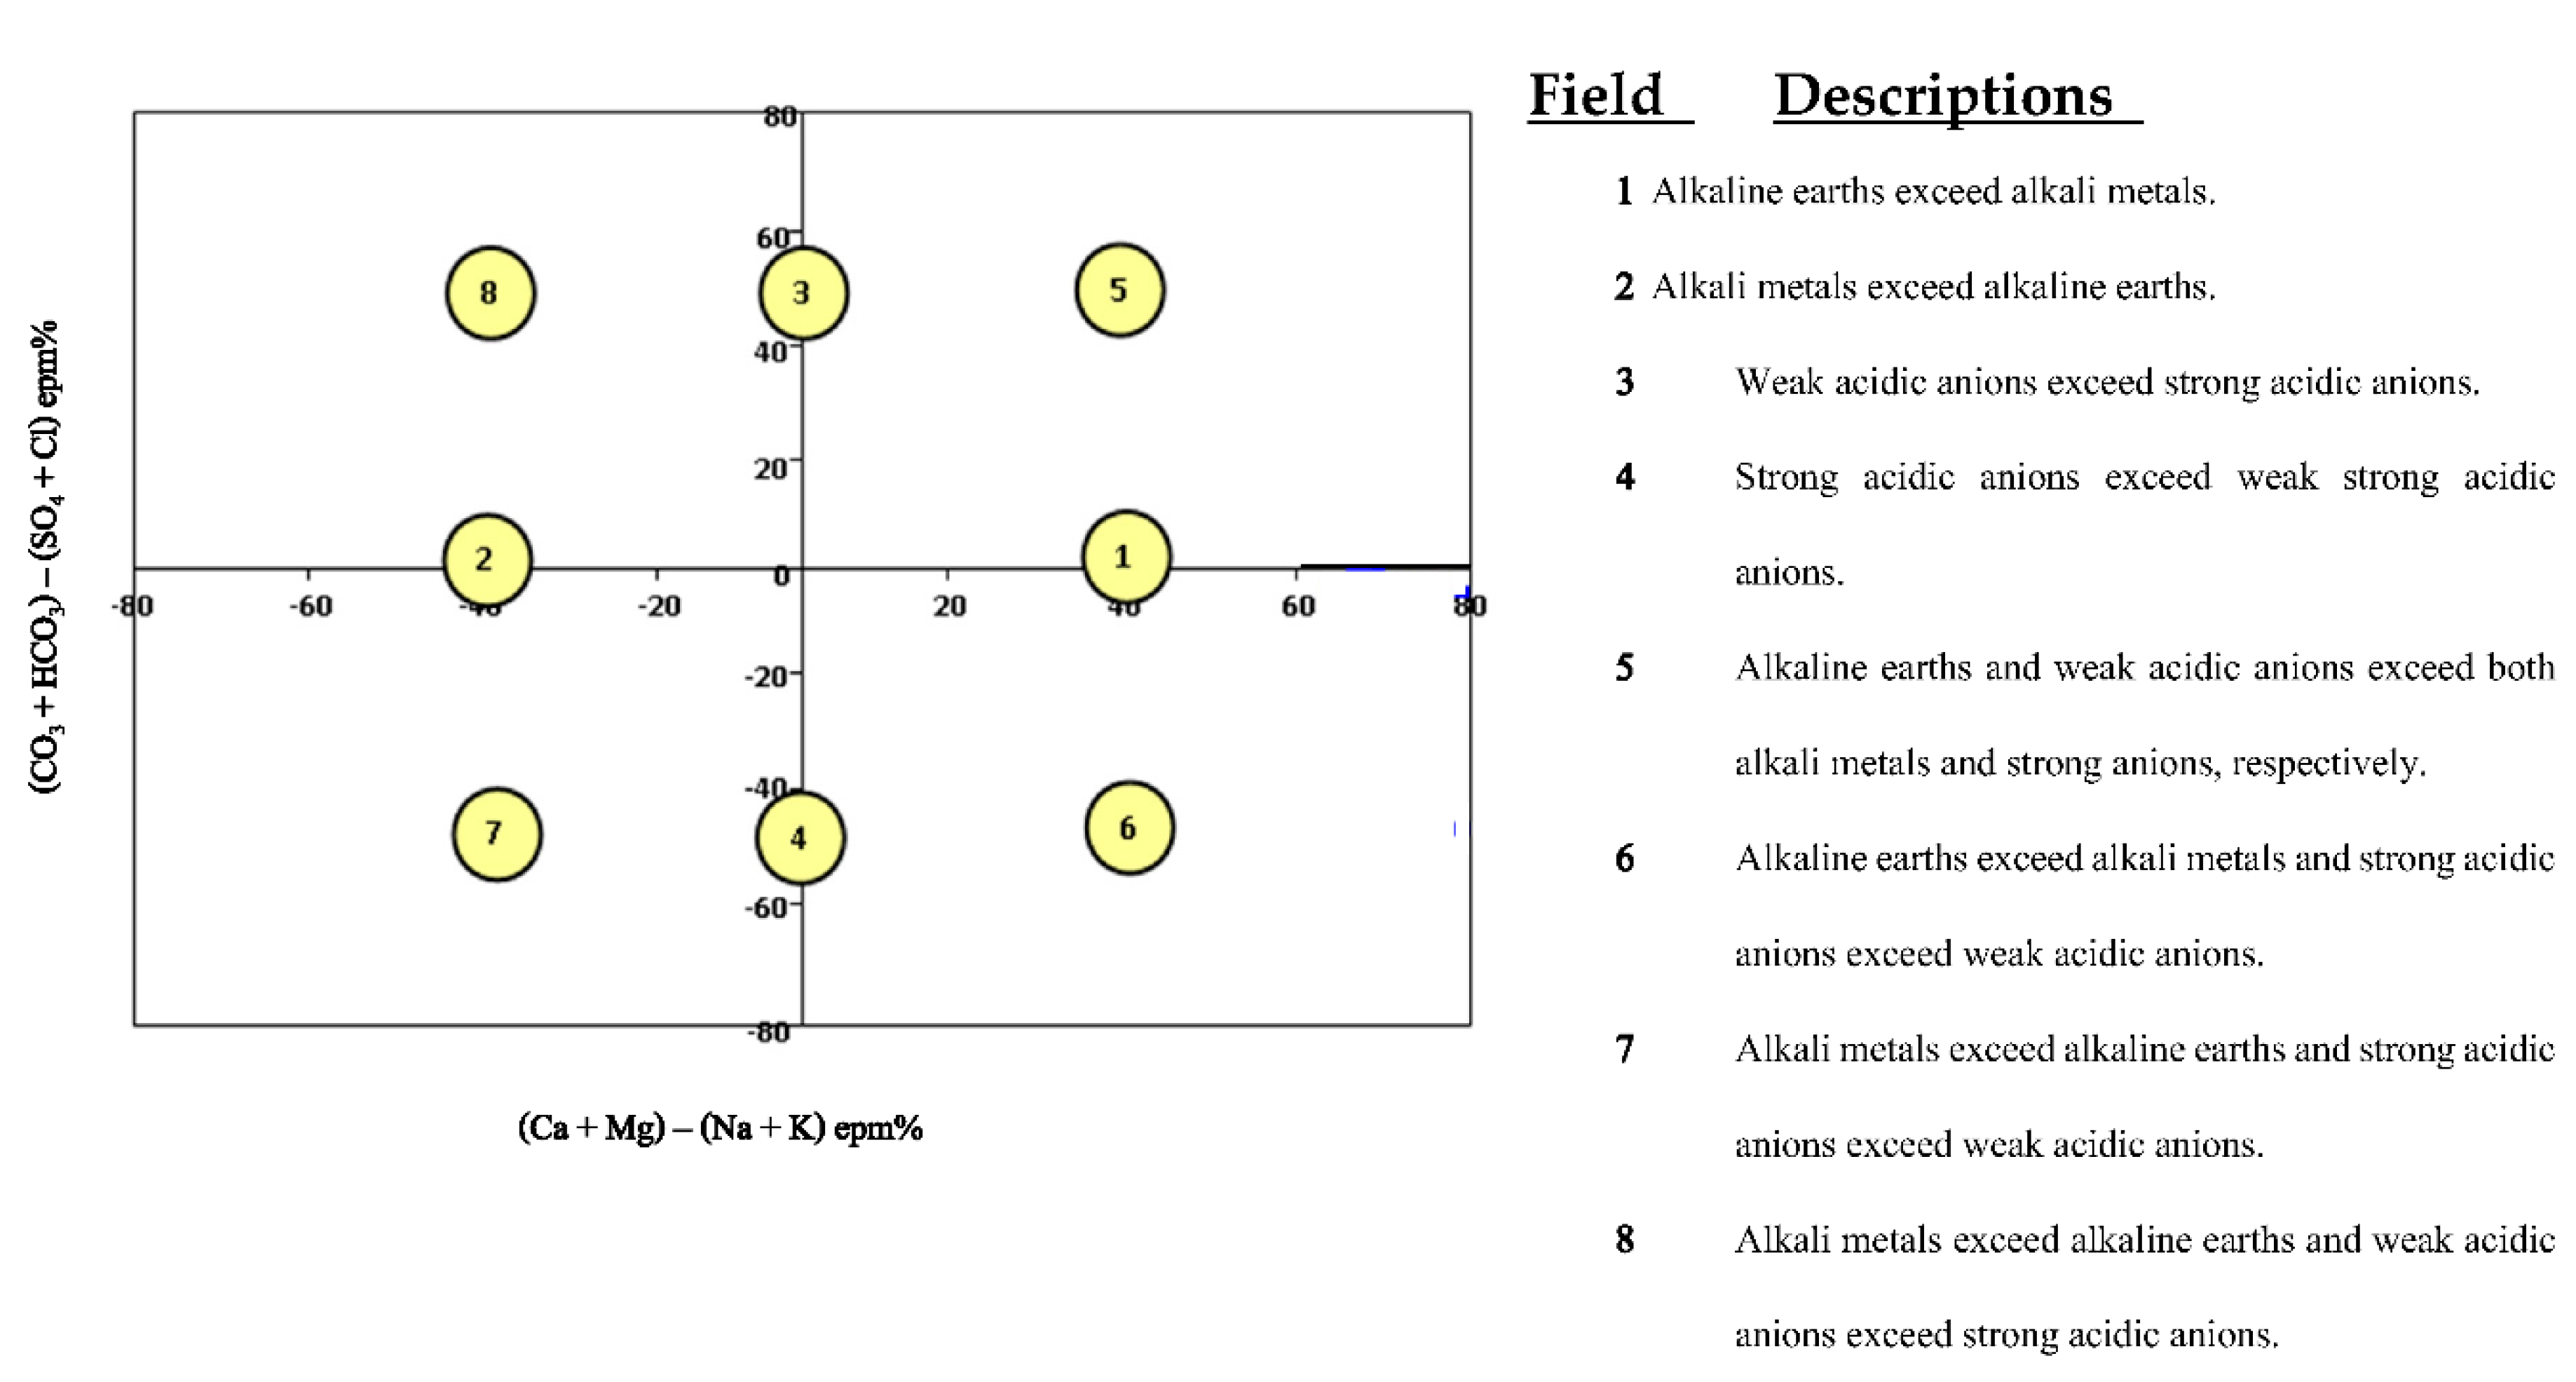
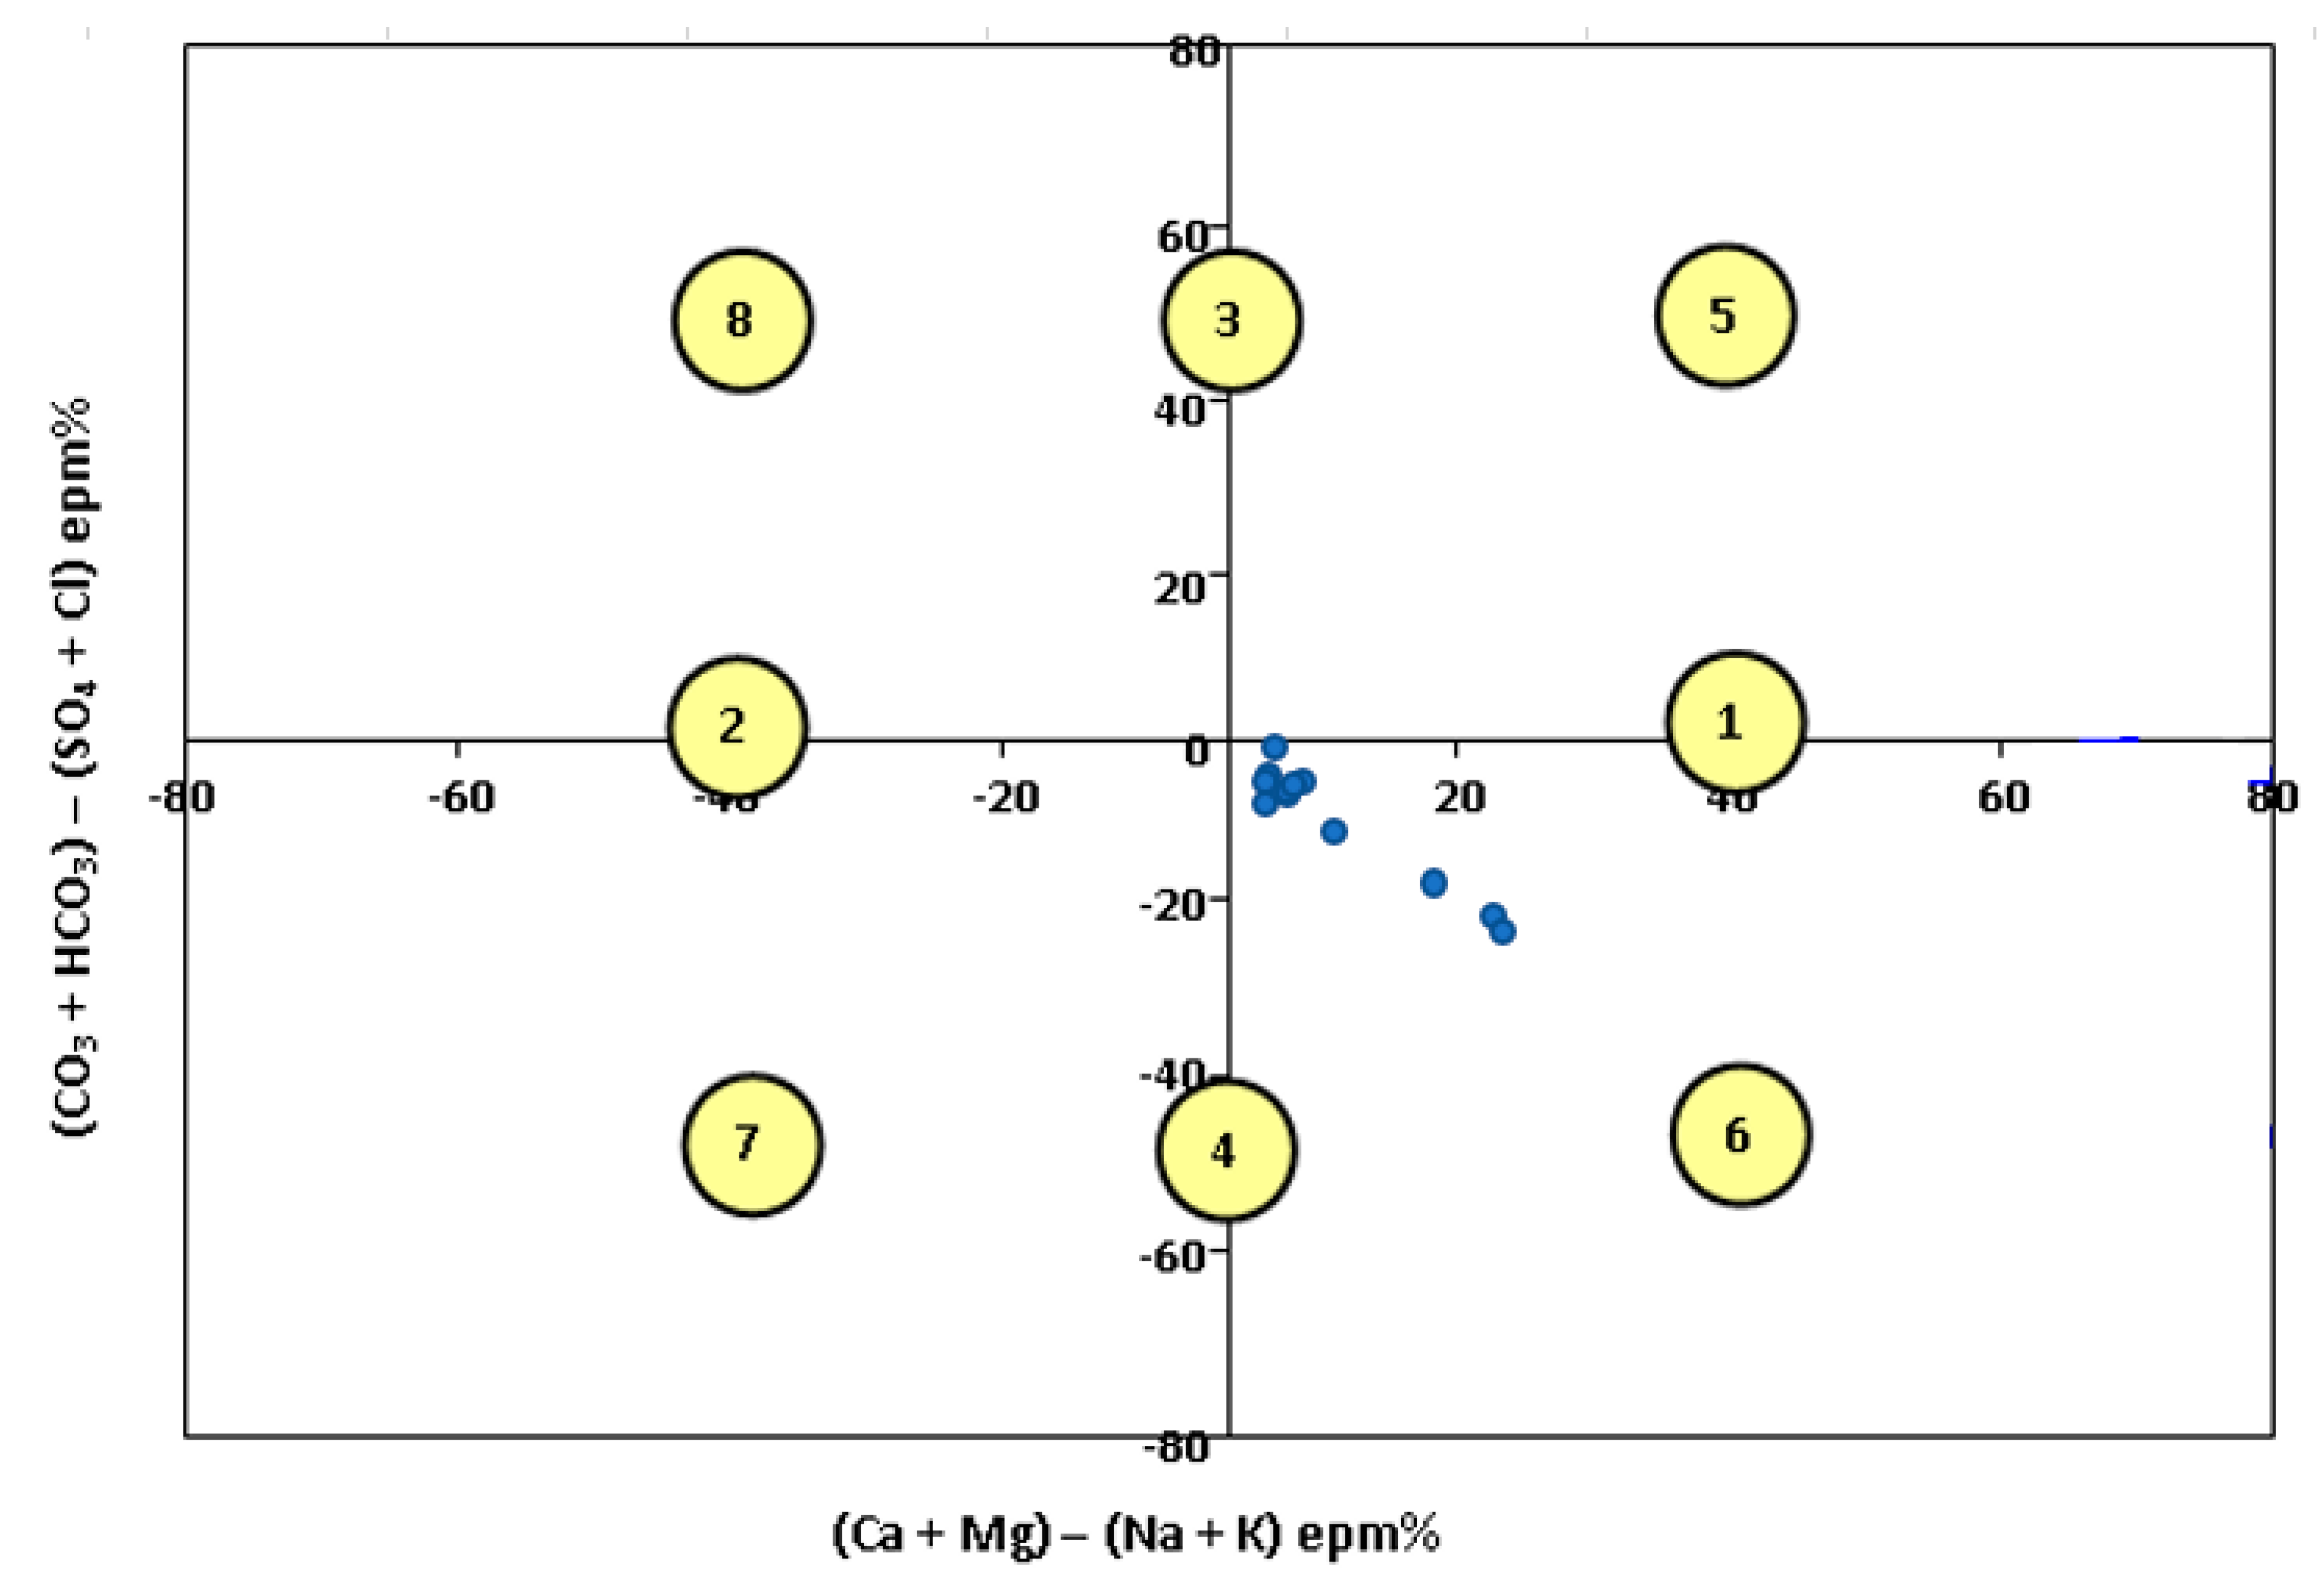
2.9.3. Chadha Classification (1999) [31]
Chadha (1999) created a new schematic dividing the origins of ions into eight categories. The square or rectangular field in a Chadha diagram represents the overall ion distribution and character of groundwater and is used to demonstrate geochemical composition and hydro-chemical processes. The rectangular field is divided into eight sub-fields, each of which symbolizes a different water type, in order to determine the basic character of groundwater (
Figure 3).
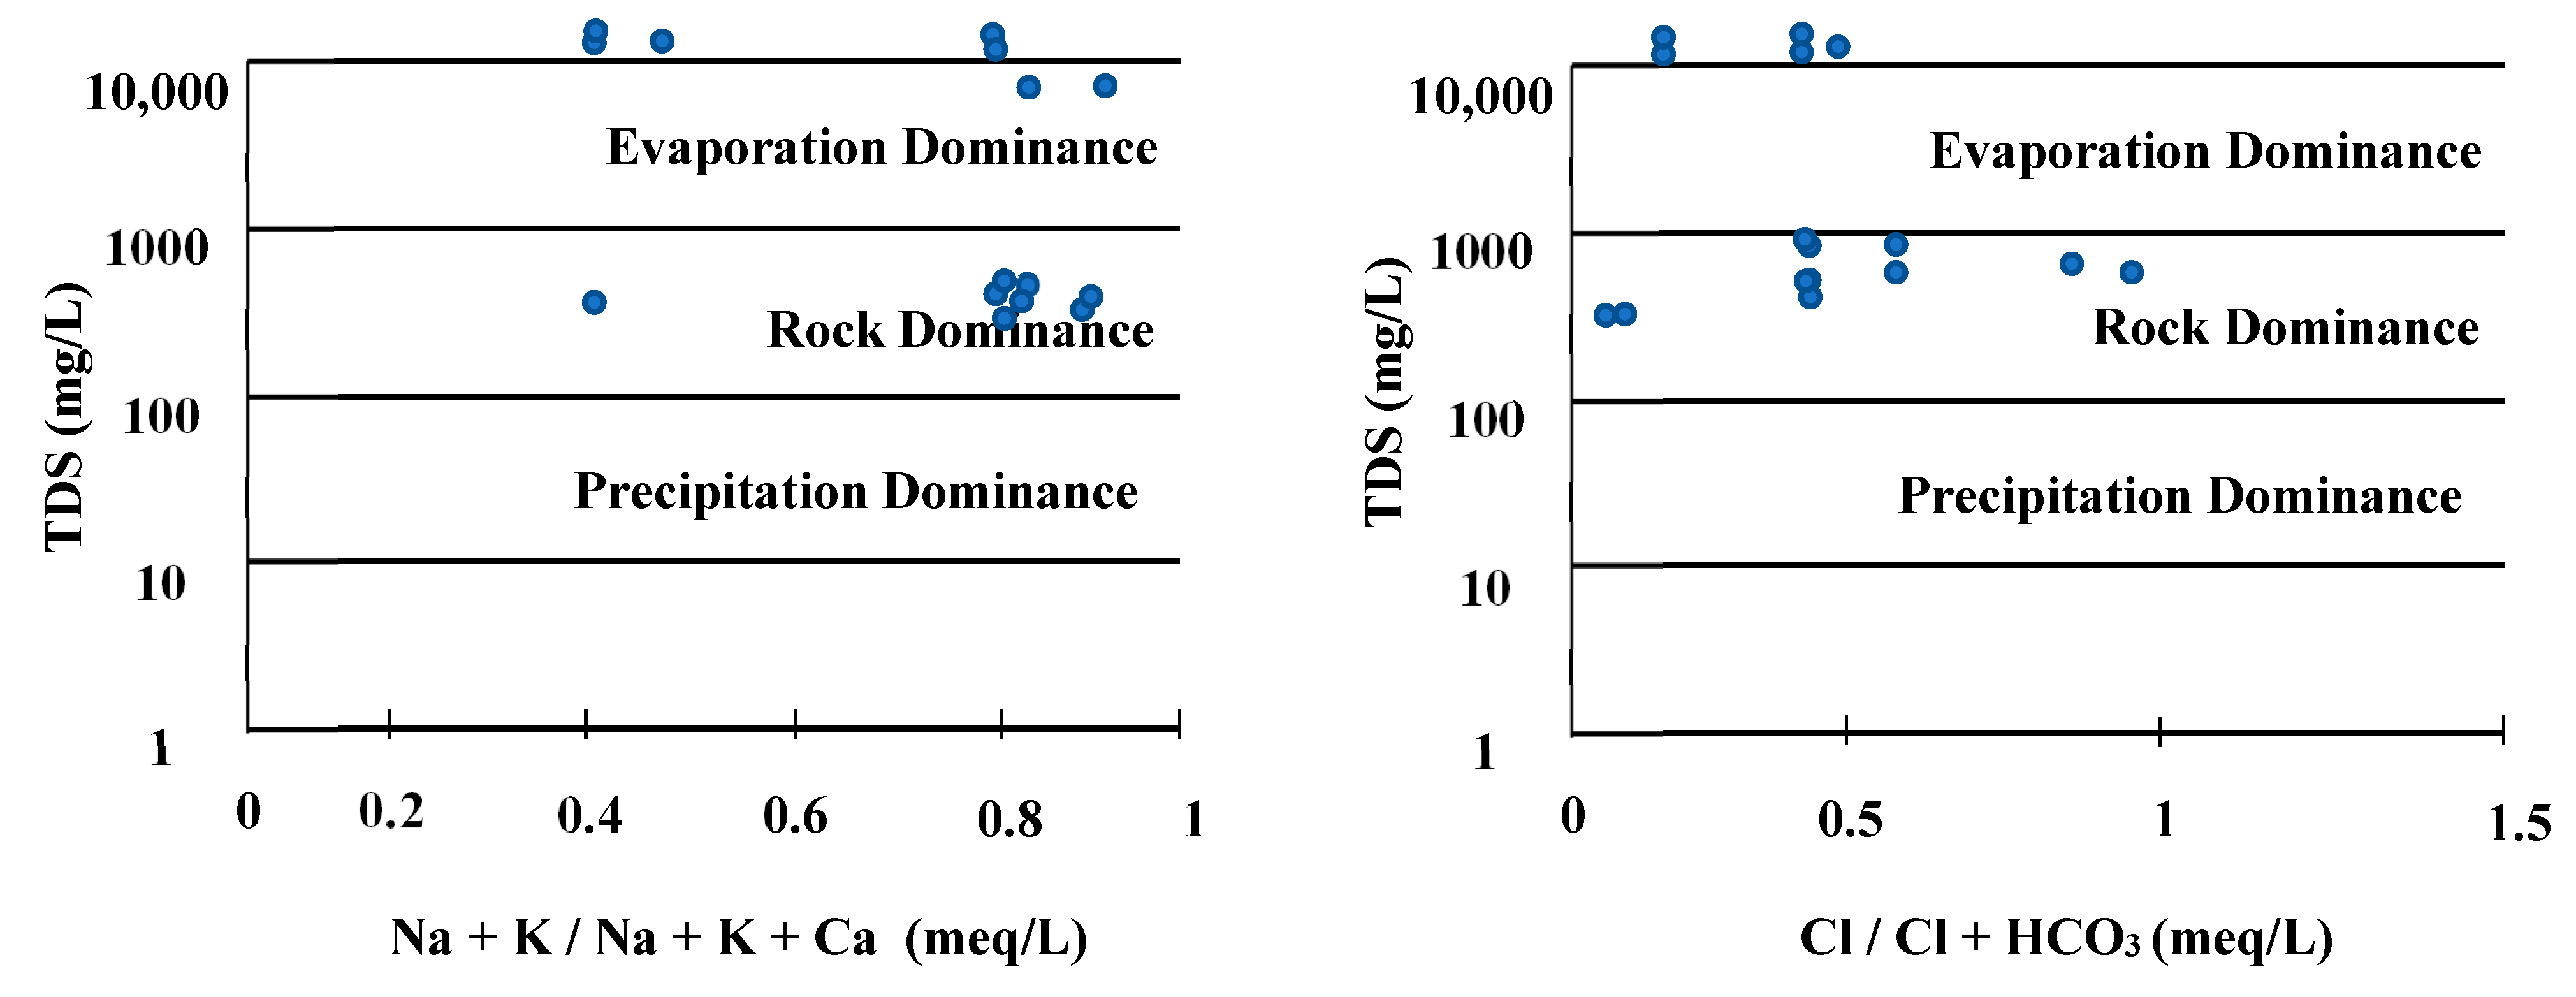
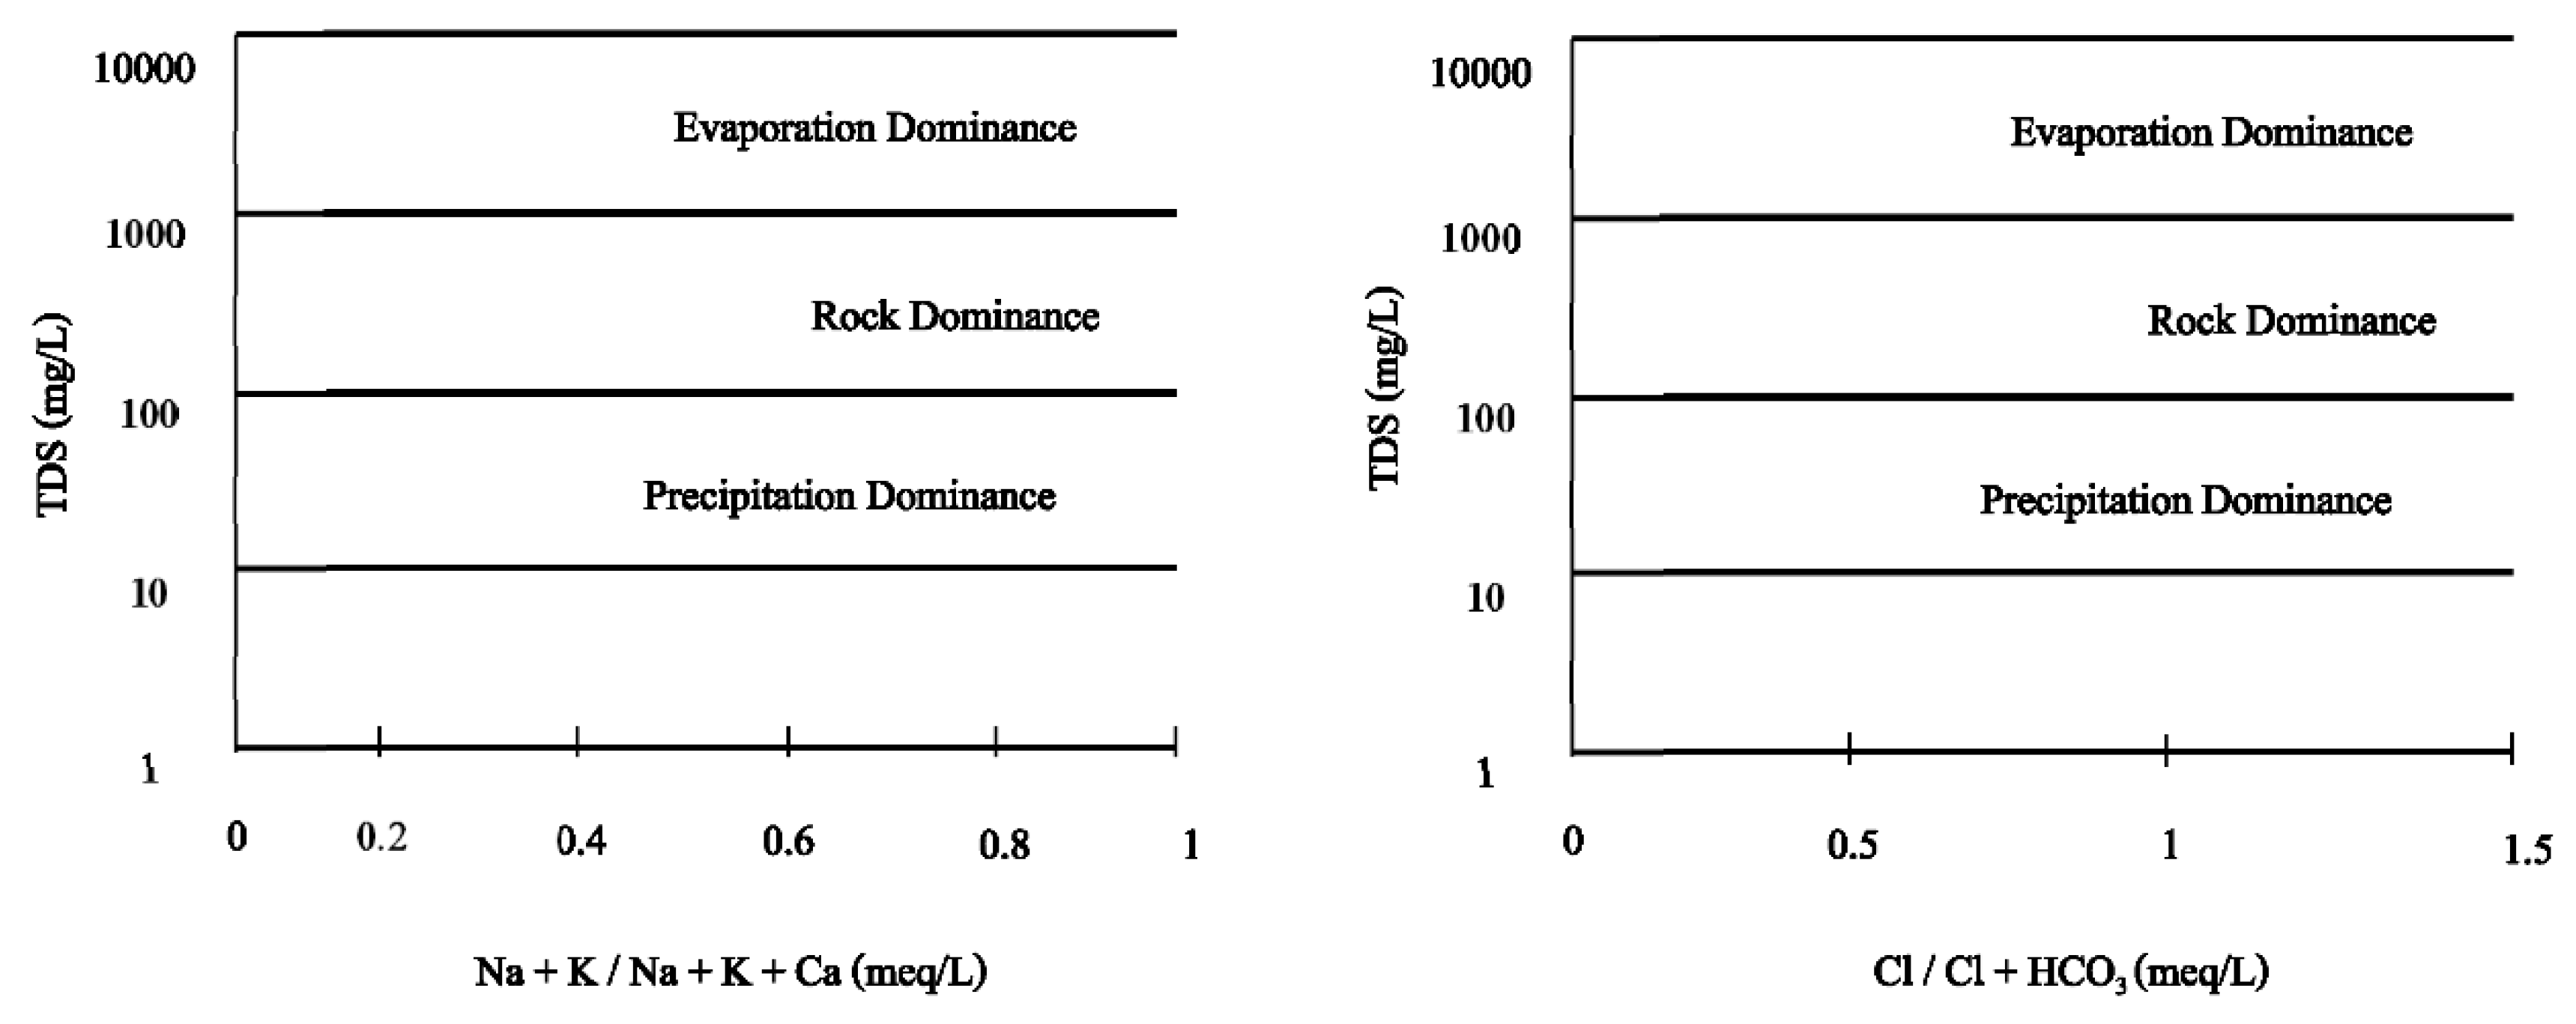
2.9.4. Gibbs Diagram Classification (1970) [32]
The Gibbs diagram is a method for estimating the origin of ions in groundwater by focusing on the correlation between the concentration of cations (Na
+, Ca
2+) and anions (Cl
−, HCO
3−), and total dissolved solids (
Figure 4).
2.10. Groundwater Level Fluctuation
The data of seven monitored wells were obtained to determine groundwater level fluctuation during the period between 2010 until 2020, and the effect of drought periods caused by climate change on the groundwater in the study area. The data was obtained from the Groundwater Directorate-Erbil, Kurdistan Region.
3. Results and Discussion
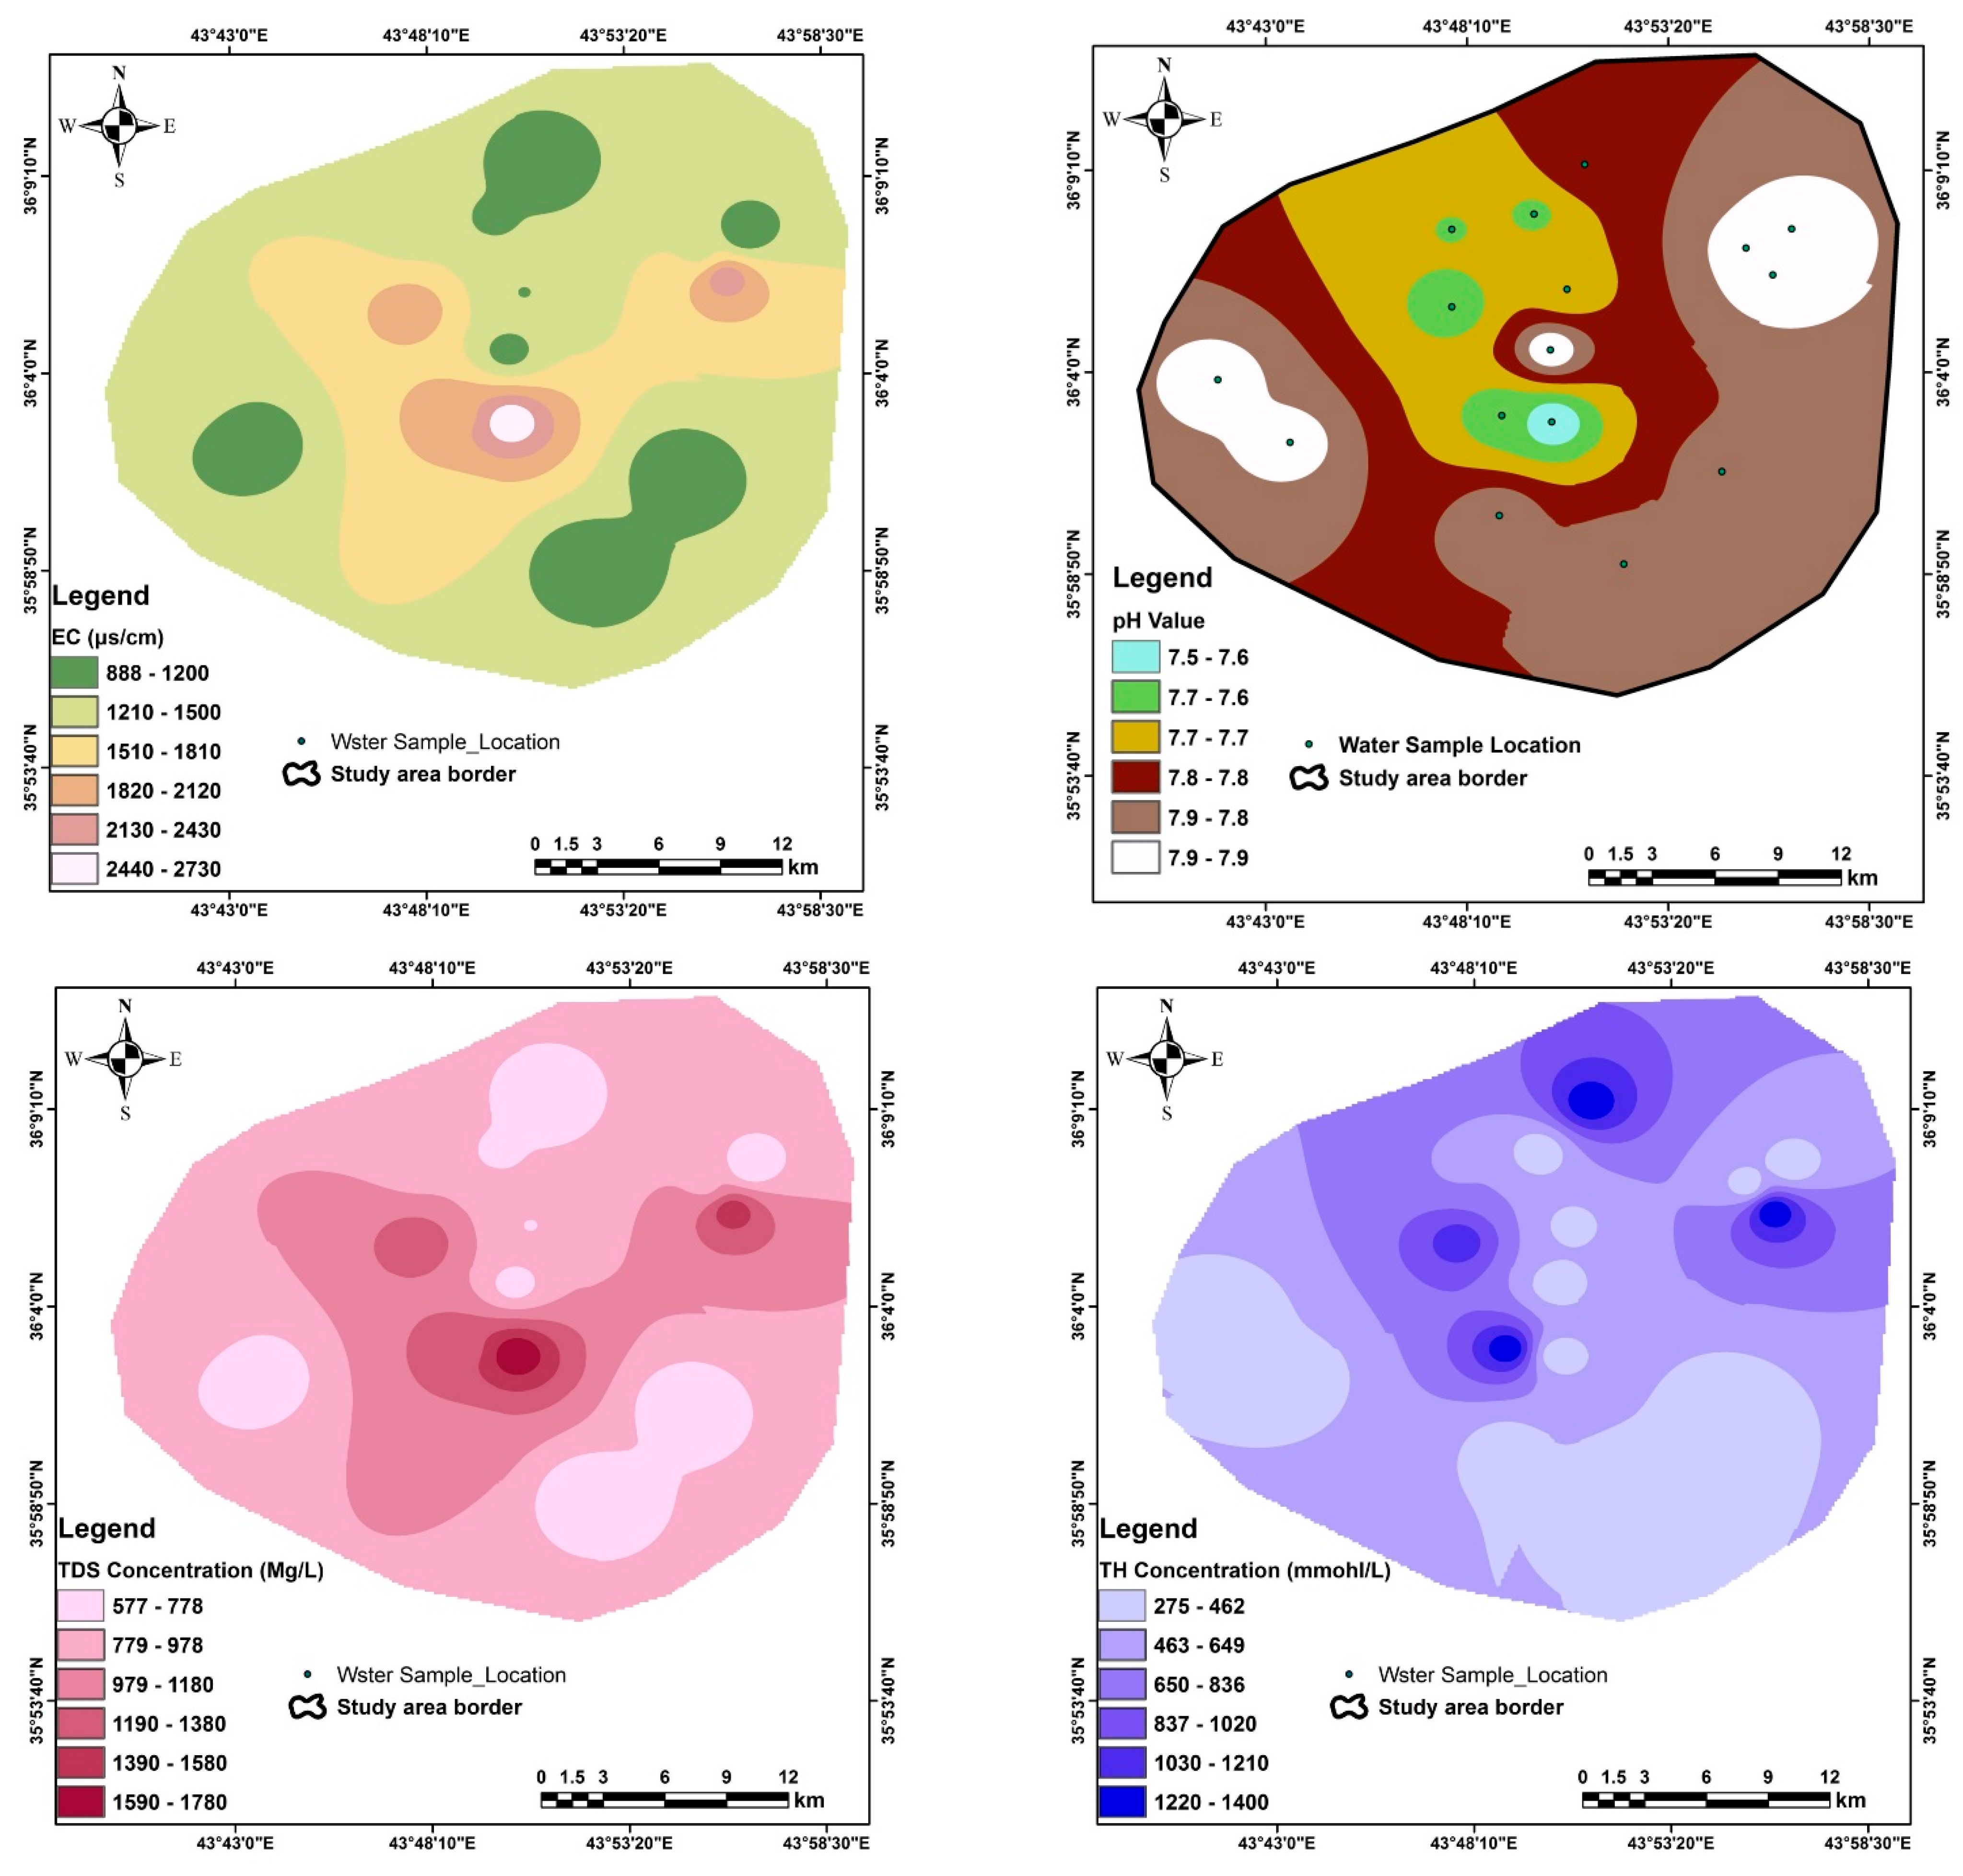
3.1. Physical and Chemical Analysis
The physico-chemical analysis is shown in
Table 7, and the special distribution of all parameters analyzed are shown in
Appendix A,
Appendix B and
Appendix C. The map of total dissolved solids shows that the high value is founded in the central part of the study area according to the groundwater flow which originates from the mountain area toward the center of the Erbil plain (
Appendix A,
Appendix B,
Appendix C,
Appendix D and
Appendix E).
3.2. Groundwater Quality Assessment Parameters
The sodium adsorption ratio (SAR) ranges from 1.1 to 2.7, with an average of 1.7 meq/L; the sodium percentage (Na%) ranges from 5.4% to 22%, with an average of 12.8%; the residual sodium carbonate (RSC) ranges from −24.3 to −1.9 meq/L, with an average of −8.9 meq/L; the monovalent cation adsorption ration (MCAR) ranges from 0.2 to 0.9, with an average of 0.5 meq/L; the cation ratio of structural stability (CROSS) ranges from 0.9 to 2.1, with an average of 1.3 meq/L; the Ps ranges from 2.5 to 35.3, with an average of 8.4 meq/L; the PI percent ranges from 2.6% to 9.4%, with an average of 6.2%, and the magnesium hazard (MH) ranges from 16.5 to 47.3, with an average of 31.7 meq/L (
Table 8 &
Appendix D). The special distribution of quality assessment parameters is shown in
Appendix E.
Increased sodium levels in irrigation water cause the breakdown of well-structured soils, which limits aeration and water permeability, resulting in lower crop development [
33]. A sodium percentage of more than 60% is considered toxic to plants; in the samples studied there is no toxic effect on the plants because all the water samples are less than 60% Na. General classification of the irrigation water is according to Bauder et al., 2004 [
23] and based on SAR, the water well samples which are suitable for irrigation have a low sodium hazard and use on sodium sensitive crops must be cautioned against. According to Eaton (1995) [
34] and based on RSC, all water samples are suitable for irrigation because they fall below the standard limit, which less than 1.5 meq/L.
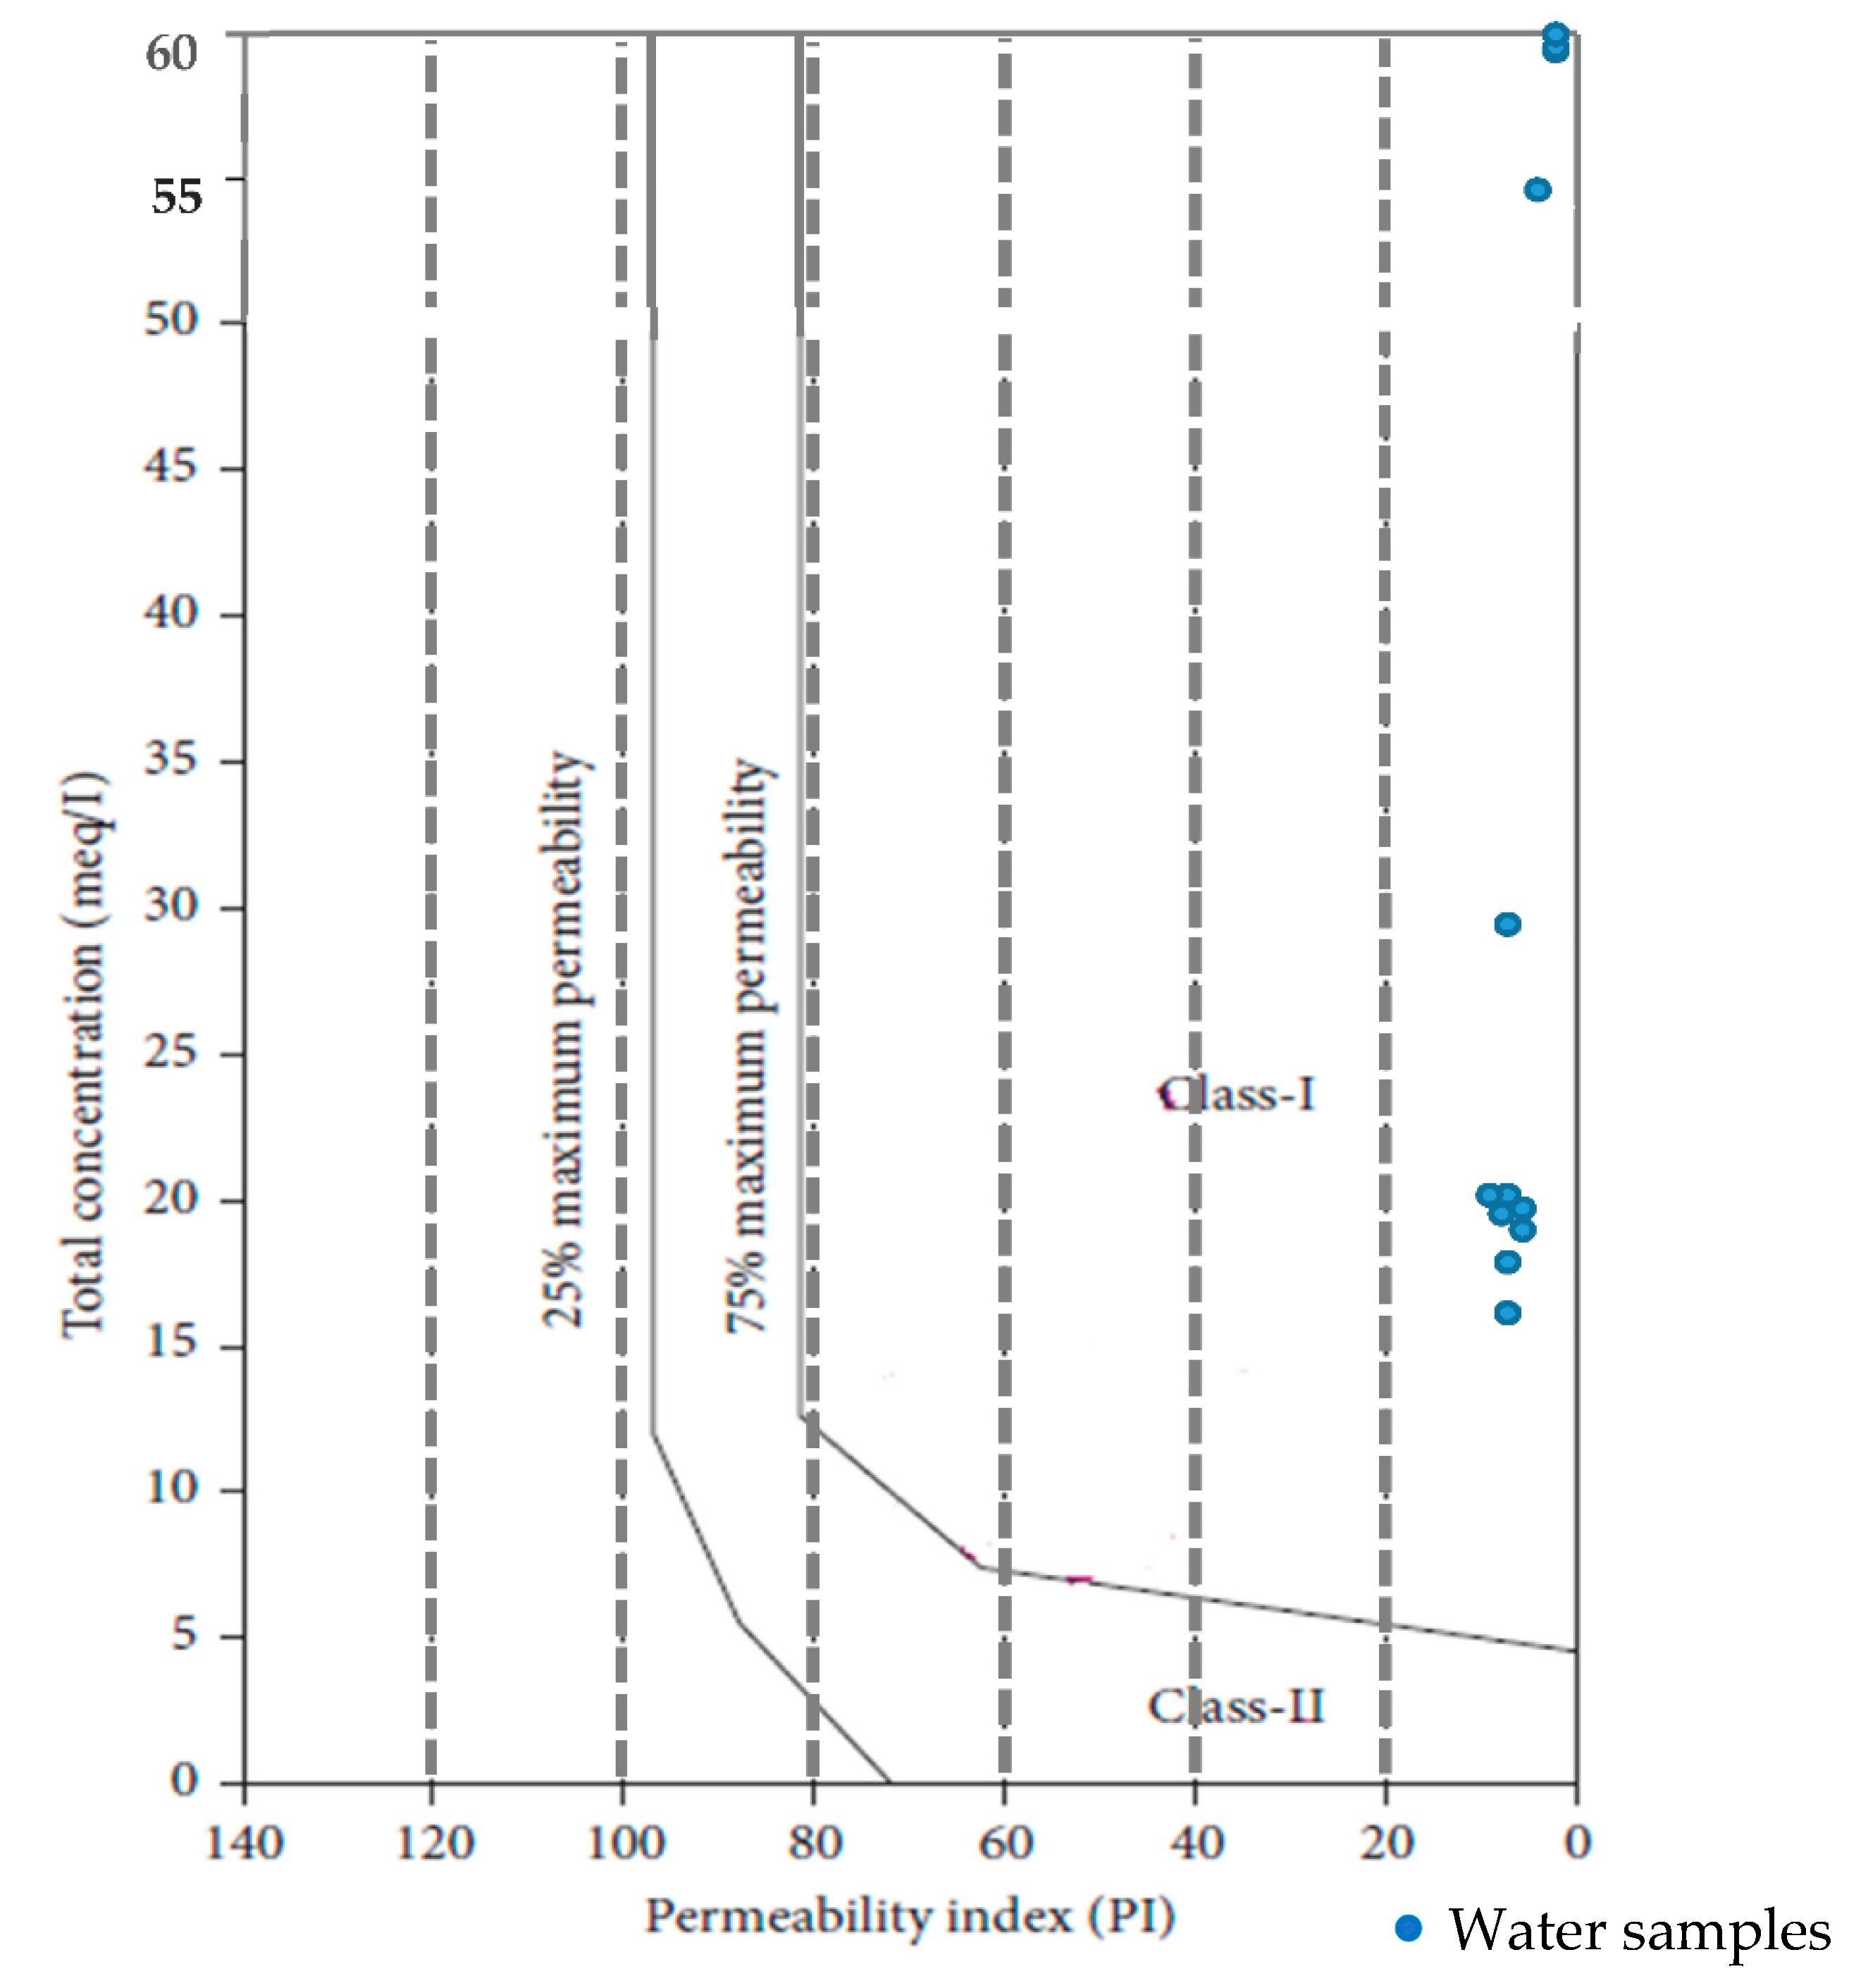
The sodium, calcium, magnesium, and bicarbonate concentrations in the soil influence soil permeability, which also affects the quality of irrigation water over time. Nagaraju et al. (2014) [
35] classified water quality on the basis of PI into Classes I, II, and III. Classes I and II indicate good water quality for irrigation purposes, while Class III water is unsuitable for irrigation (
Figure 5). A high permeability index is linked to underlying structural elements that allow for widespread groundwater contamination. The groundwater samples of the study area fall into Class I (29.05–72.75%) and were described as having excellent-to-good permeability.
An increased proportion of Mg
2+ relative to Ca
2+ increases sodication in soils, which causes the dispersion of clay particles, which destroys soil structure and lowers relative hydraulic conductivity [
36]. Magnesium ratios of more than 50 are deemed hazardous and unsuitable for irrigation. As soils grow more alkaline, this will have a negative impact on crop yield. All the water samples in the study area are acceptable for irrigation purposes.
The suitability of water for irrigation is not dependent on soluble salts. Because low-solubility salts precipitate in the soil and accumulate with each irrigation treatment, the soil salinity rises as the concentration of highly soluble salts rises [
14].
The classification of the potential salinity of groundwater samples includes three classes; 1. Excellent to Good (<5), 2. Good to Injurious (5–10), and 3. Injurious to Unsatisfactory (>10). Nine water samples are classified as excellent-to-good, three water samples are good-to-injurious, and four samples are in the injurious-to-unsatisfactory water class.
The MCAR ratio may predict the adsorption of monovalent ions by soil colloids on the basis of cation exchange isotherms, but it fails to weigh the relative efficacies of Na
+ and K
+ in the numerator and of Ca
2+ and Mg
2+ in the denominator and treats members of each pair as identical [
16].
When the soil’s K
+ and Mg
+2 levels are low, CROSS will be similar to SAR in predicting soil behavior. However, when these cations are present in higher amounts, CROSS will be more effective than either SAR or MCAR [
18].
The water quality types in the study area according to Ivanov, 1968 [
19], are of the Sulfate water type, except that two samples were of the chloride type and one sample of the Bicarbonate water type (
Table 9).
3.3. Groundwater Uses for Irrigation
Train classification of the water samples based on Total Dissolved Salts (TDS) shows that eleven water samples, when used for irrigation, had a harmful effect on sensitive crops for salinity, while five water samples had harmful effects on crops, and so experience is needed before using them. According to Bauder et al., 2004 [
23] and based on SAR, all water samples have a low sodium hazard and use on sodium sensitive crops must be carried out with caution. According to RSC, all water samples are suitable for irrigation purposes. According to Bauder et al., 2004 [
23] and based on chloride, all water samples are suitable for irrigation and generally safe for all plants.
3.4. Groundwater Classification
The Piper Diagram Classification represents one possible system of nomenclature in which water represented by point (A) would be called calcium bicarbonate water, and point (B) would represent calcium, sodium, chloride water. Point (C) would represent sodium, calcium, magnesium, chloride, and sulfate water. The plotting parameters of water samples on this diagram indicate that most of the samples are of class (C) “sulfate water type” except for two samples in class (B) “Chloride water type”, and one sample in class (A) “Bicarbonate water type” (
Figure 6).
According to the Shoeller Classification, all the water samples are in class E and F, meaning that calcium is a dominant cation in the water and the anions vary, but with a dominance of sulfate anions in most of the water samples (
Table 10).
According to the Chadha classification, the water type ranges from class 4 and 6: strong acid anion with prevailing weak acid anion and earthy alkaline prevailing felsic alkaline and strong anion acid with prevailing weak anion acid (
Figure 7).
The Gibbs classification is a method for estimating the origin of ions in groundwater by focusing on the correlation between the concentrations of cations, anions, and TDS (
Figure 8).
The Gibbs diagram shows that the origin of the concentration of ions in the groundwater is evaporation and rock dominance. This characteristic suggests that ion dissolution in groundwater occurs more frequently as a result of interactions between groundwater and rock or soil and the evaporation process than as a result of precipitation or other sources.
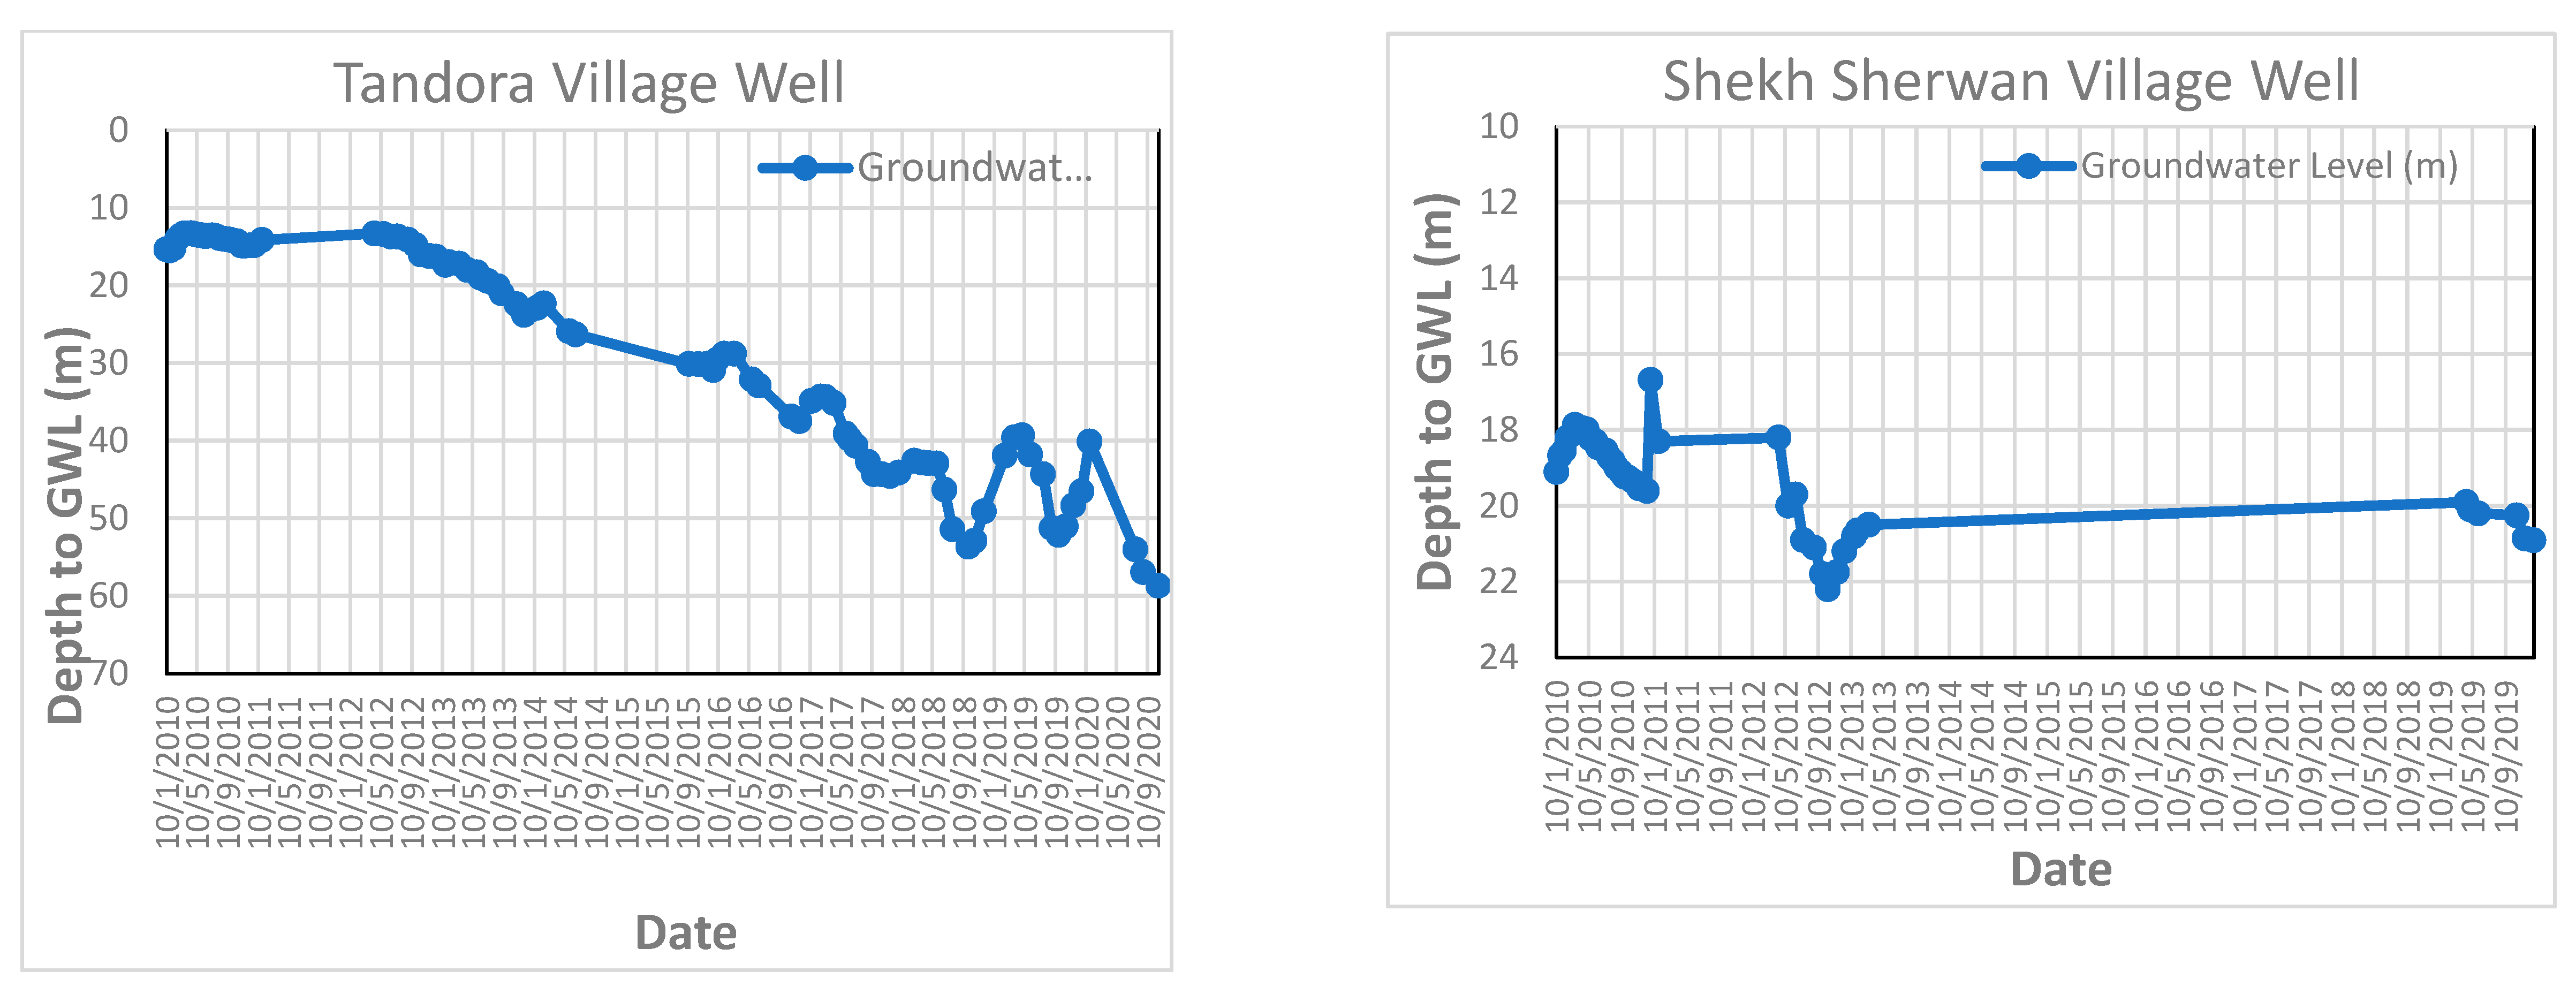
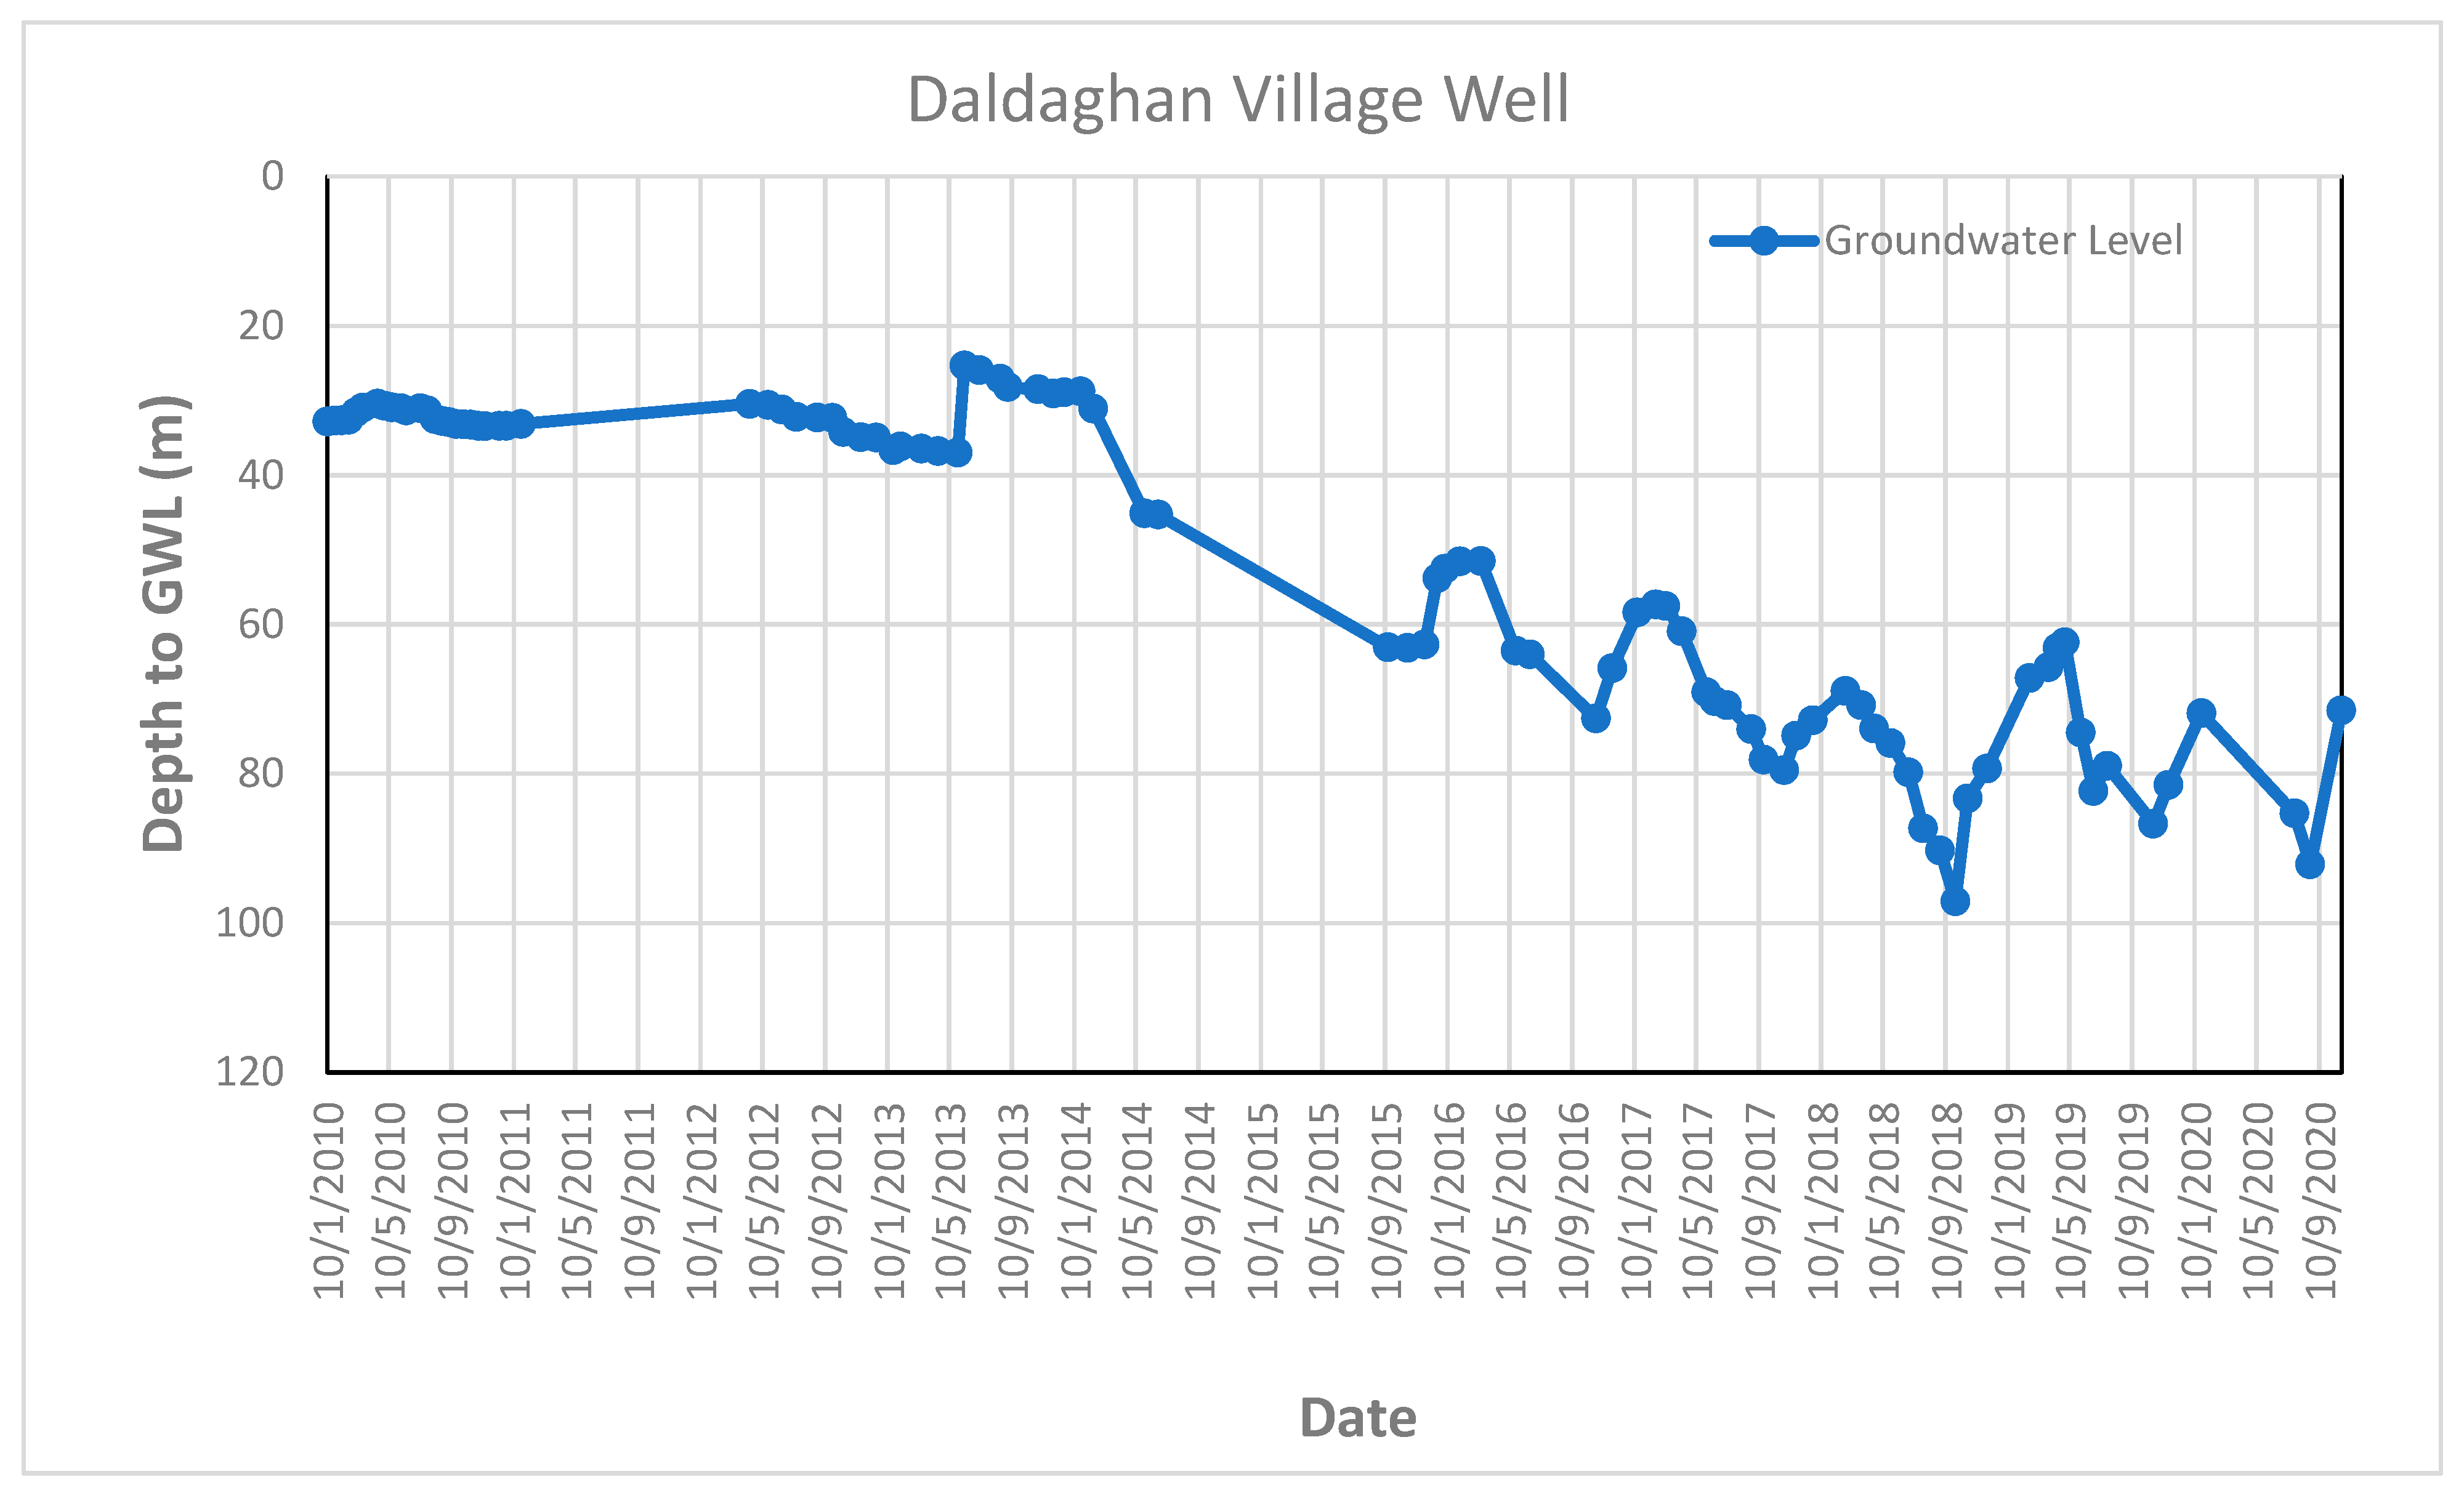
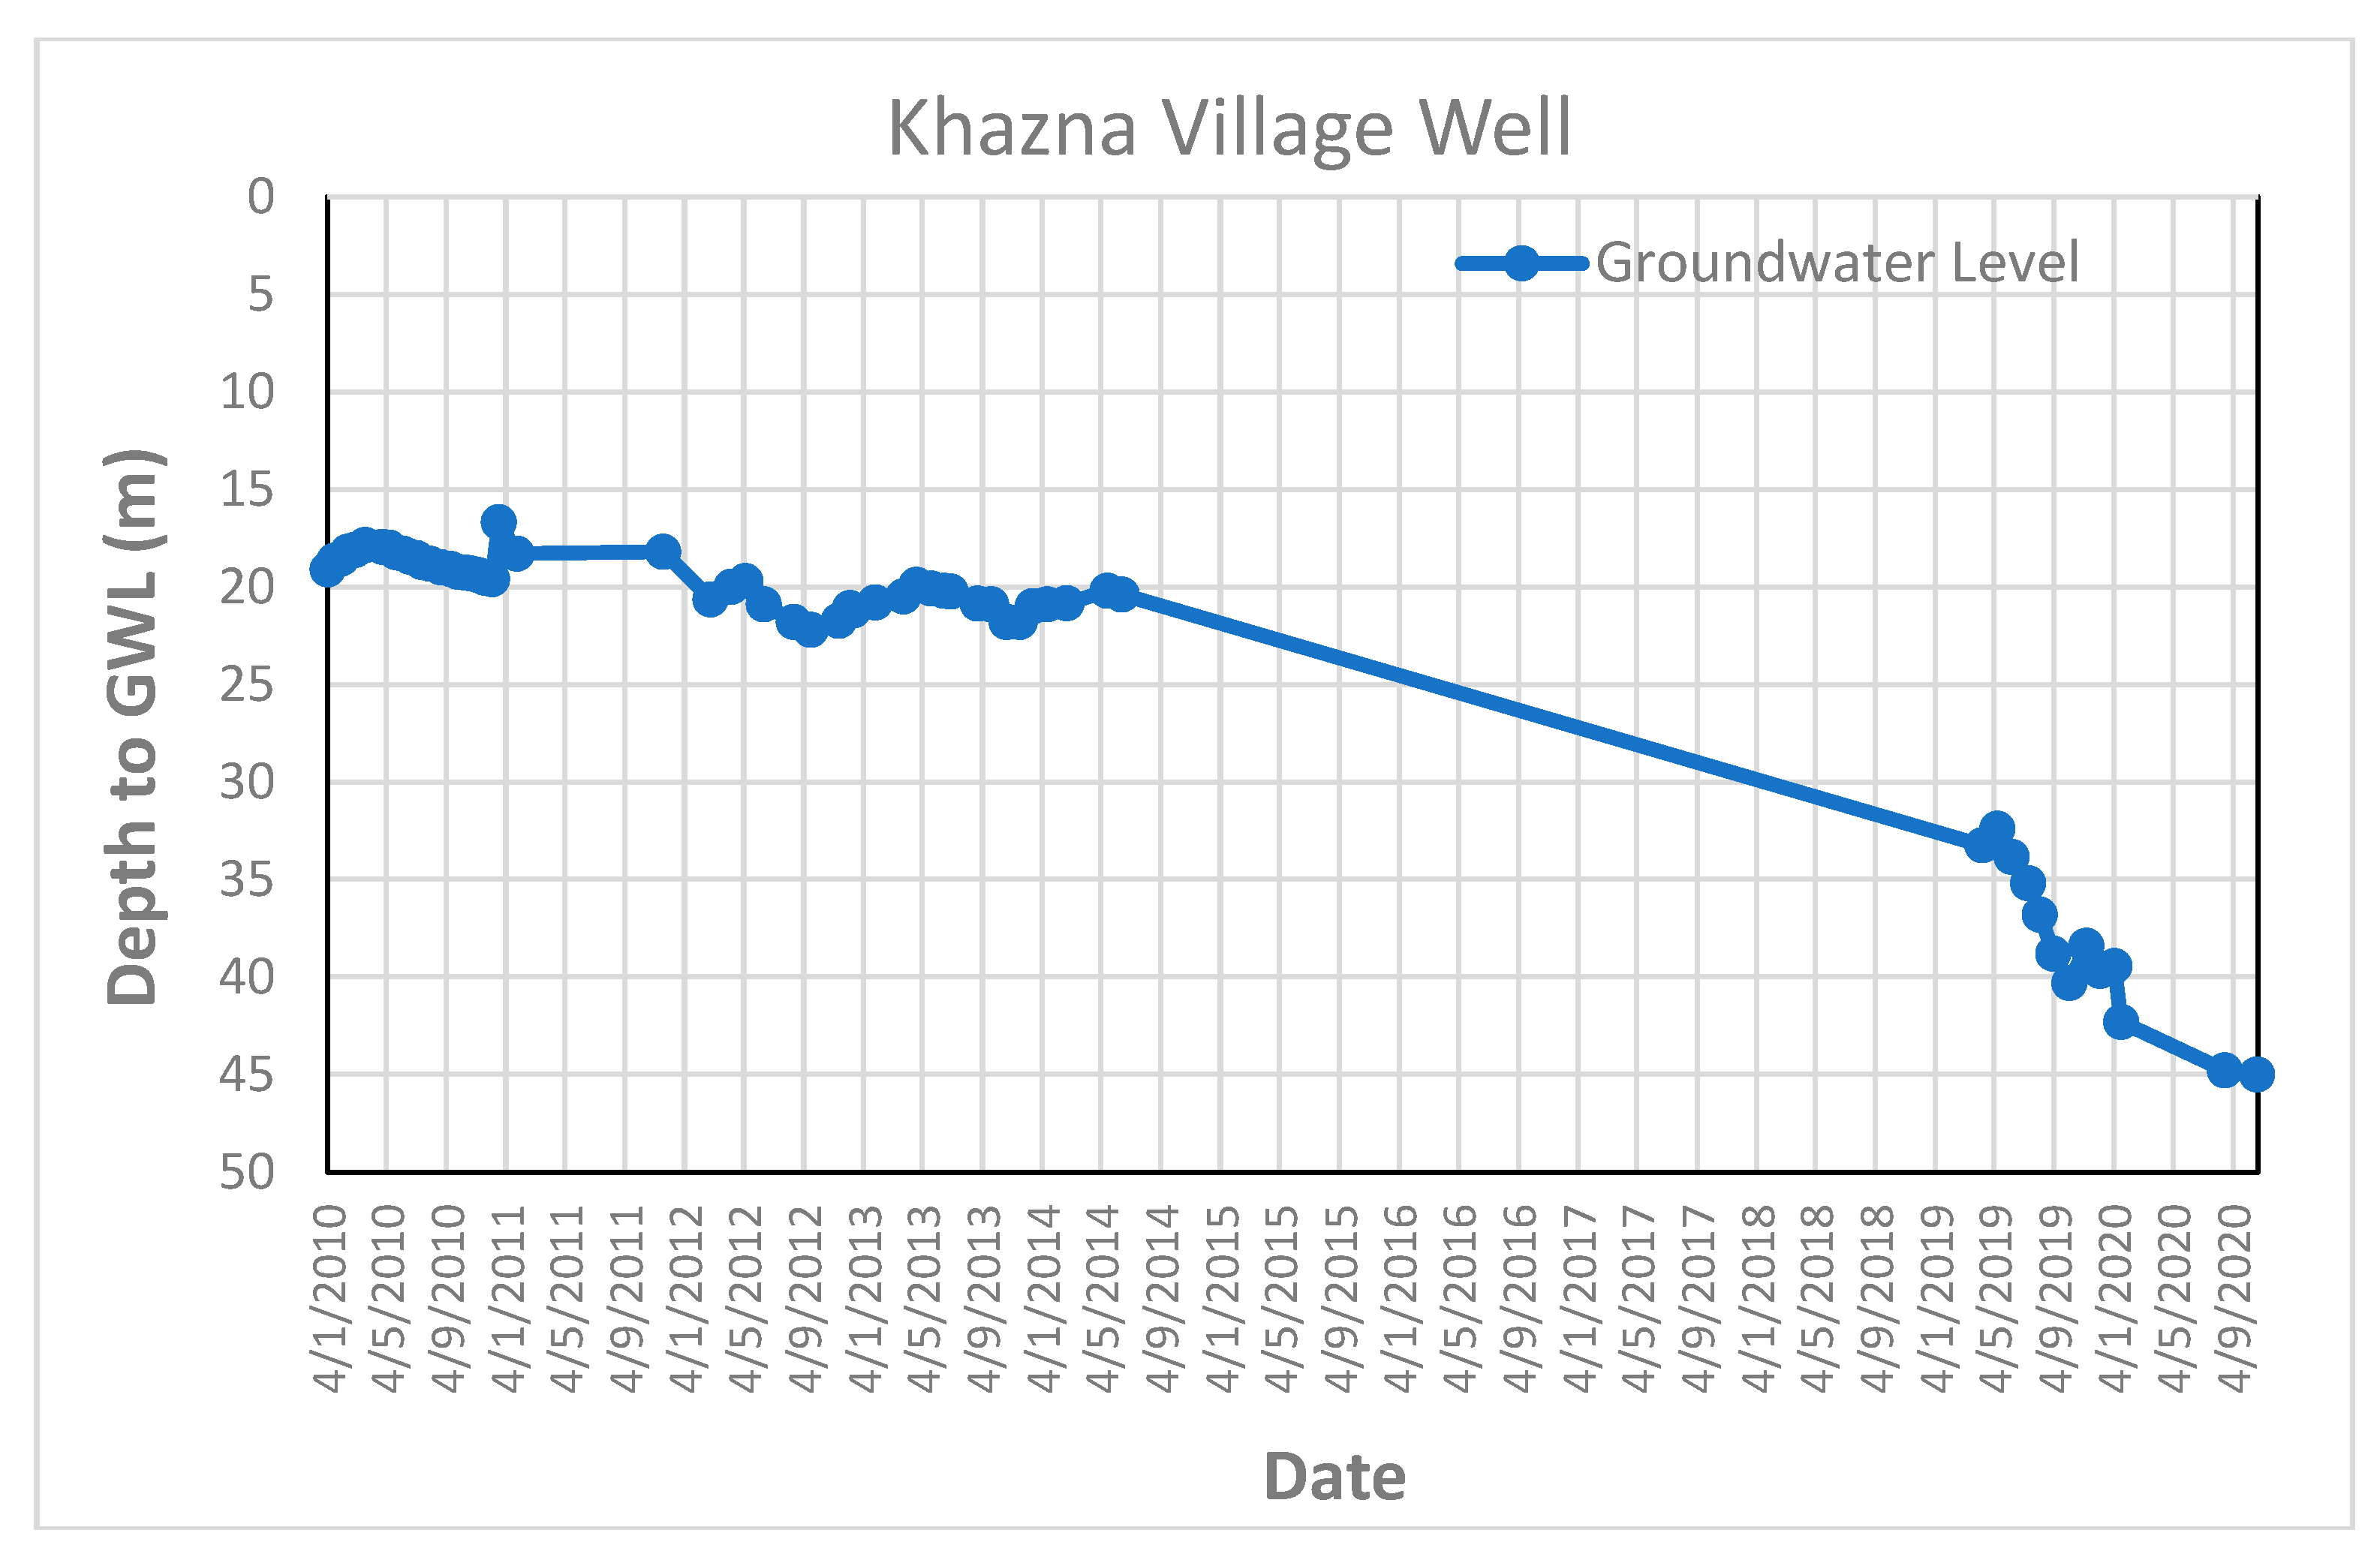
3.5. Groundwater Level Fluctuation
Many factors influence groundwater level fluctuation, including rainfall intensity, rainfall quantity, infiltration capacity of soil and rock beds, groundwater depth above sea level, terrain, evapotranspiration, and water well discharge [
8]. Fluctuations in stored water, renewable storage water amount, and groundwater investment were calculated using groundwater fluctuation analysis.
Groundwater recharge in the Erbil plain depends on rainfall quantity. In rainy months, the recharge quantity is greater than the discharge quantity in the wells, which leads to a rise in groundwater levels, while in dry months (the summer season), the discharge quantity is greater than recharge quantity (these may be absence recharges), which leads to a reduction in groundwater levels.
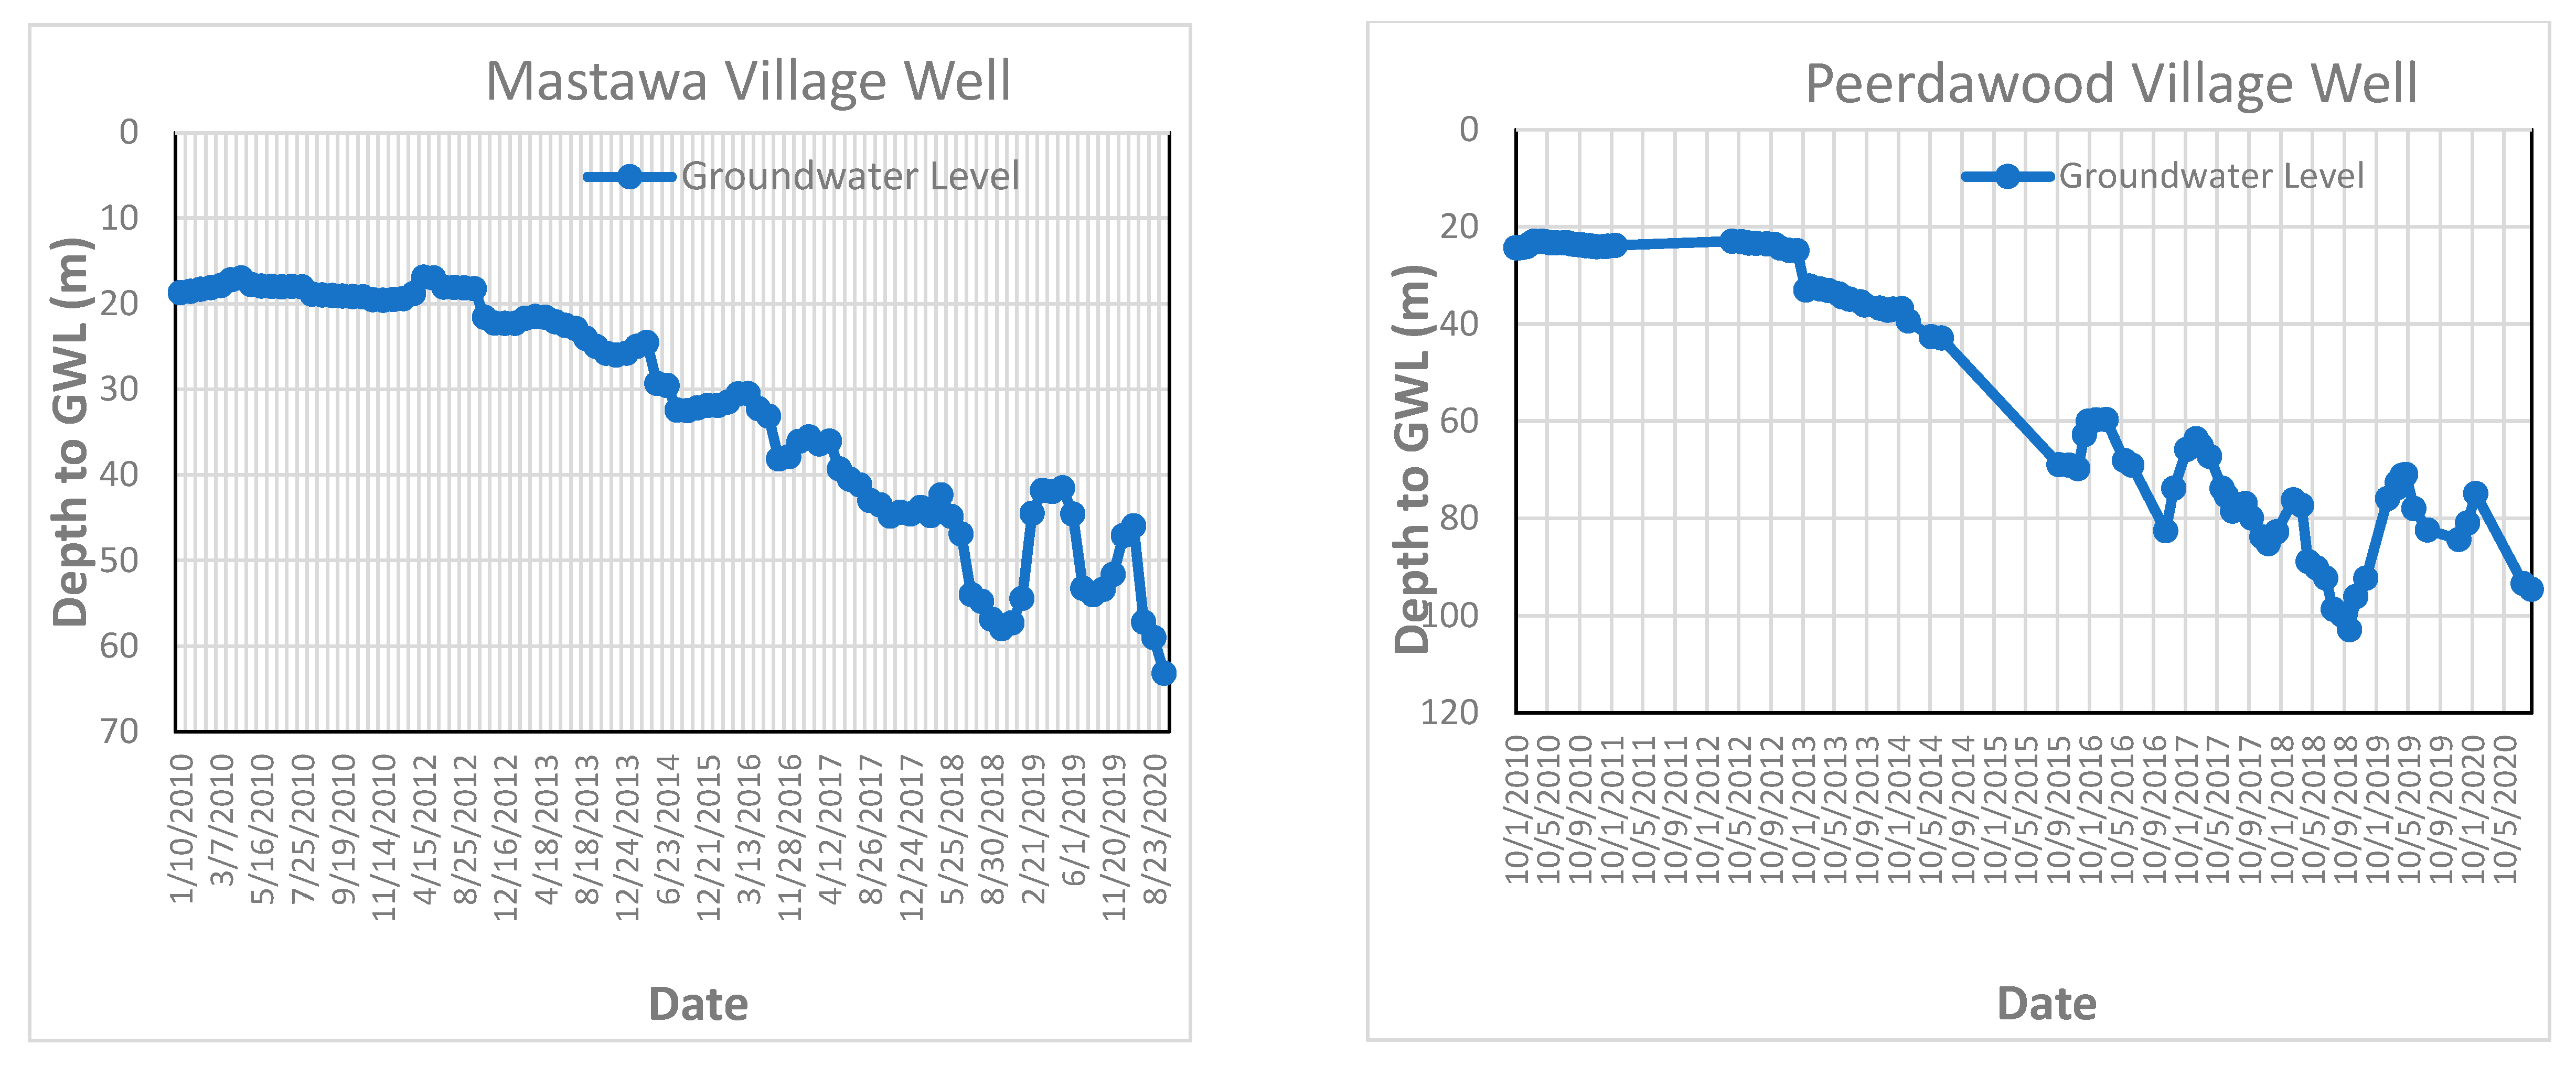
The groundwater level was measured on a weekly basis over ten years by the Groundwater Directorate in Erbil Governorate (from 2010 to 2020) for six monitored wells in the study area (Daldaghan well, Khazna well, Mastawa well, Peerdawood well, Shekh Sherwan, and Tendura-1 well). All the wells penetrate quaternary deposits and Bai Hassan Formation.
Figure 9 and
Appendix F represent the groundwater fluctuation for these six wells, which shows the depression of the groundwater table (increasing depth to groundwater) during these periods due to the effects of climatic change as well as the effects of drought periods on the study area.
4. Conclusions
The present research assessed the quality evaluation of the groundwater in the Erbil Plain region; the parameters were analyzed using the concentration distribution of ions in the groundwater. The findings demonstrate that using ground water for irrigation will not harm plants because all water samples had a sodium content of less than 60%. Based on RSC, all water samples were shown to be suitable for irrigation because they fall under the standard limit, which is less than 1.5 meq/L. SAR indicates that the water wells are suitable for irrigation because they have a low sodium hazard, though caution should be exercised when using them on sodium-sensitive crops.
According to the classification of water quality of the permeability index, groundwater samples from the study area fall into Class I, and aquifers were found to have excellent-to-good permeability. Nine water samples were classed as excellent-to-good, three water samples were good-to-injurious, and four samples were injurious-to-unsatisfactory, according to the classification of the potential salinity for groundwater samples.
Since CROSS is not based on the exchange isotherm, it cannot determine how much Na+ and K+ have been adsorbed. However, it might be used to predict dispersive effects on soil stability and hydraulic properties based on the relative amounts of the four cations present in the equilibrium soil solution. According to the criteria used to evaluate the water quality, the majority of the samples are suitable for irrigation.
All the water samples are in the sulfates water type except for two groundwater samples, which are of the chloride type (Binberze Gichka Village Well and Yarmja Village Well) and one groundwater sample is of the bicarbonate water type (Yadi Qizlar Village Well).
Over the ten years measuring the groundwater table, fluctuation in the area for some wells shows a depression in the groundwater table due to drought periods during this time, as well as to global climate change.
In the future, especially in agricultural areas, we propose the inclusion of contaminants such as pesticides in the monitoring of ground water quality. When pesticides are sprayed on crops, they can penetrate the surface of the ground and reach water-containing aquifers. Groundwater becomes contaminated as a result, making it unusable for both agricultural and human purposes. We also recommend conducting research on the toxic anion and trace elements in the study area to find out the effects of heavy metals and some toxic anions in the area.
Author Contributions
Conceptualization, S.S. and C.R.; methodology, S.S.; software, S.S.; validation, S.S., C.R. and K.M.; formal analysis, S.S. and M.A.; investigation, S.S., H.A. and C.R.; resources, S.S. and H.A.; data curation, S.S.; writing—original draft preparation, S.S.; writing—review and editing, C.R., M.R. and K.M.; visualization, S.S., H.A. and K.M.; supervision, C.R.; project administration, C.R., M.R. and K.M.; funding acquisition, C.R. All authors have read and agreed to the published version of the manuscript.
Funding
This Research is fully funded by the NUFFIC Orange Knowledge Programme (OKP-IRA-104278).
Institutional Review Board Statement
Not applicable.
Informed Consent Statement
Not applicable.
Data Availability Statement
Some data in this manuscript obtained from Ministry of Agriculture and Water Resources-Groundwater Directorate, Kurdistan Region.
Acknowledgments
This study has been funded by NUFFIC, the Orange Knowledge Programme, through the OKP-IRA-104278 project titled “Efficient water management in Iraq by switching to climate smart agriculture: capacity building and knowledge development” coordinated by Wageningen University & Research, The Netherlands.
Conflicts of Interest
The authors declare no conflict of interest.
Appendix A
Figure A1.
Special distribution of some physiochemical parameter in the study area.
Figure A1.
Special distribution of some physiochemical parameter in the study area.
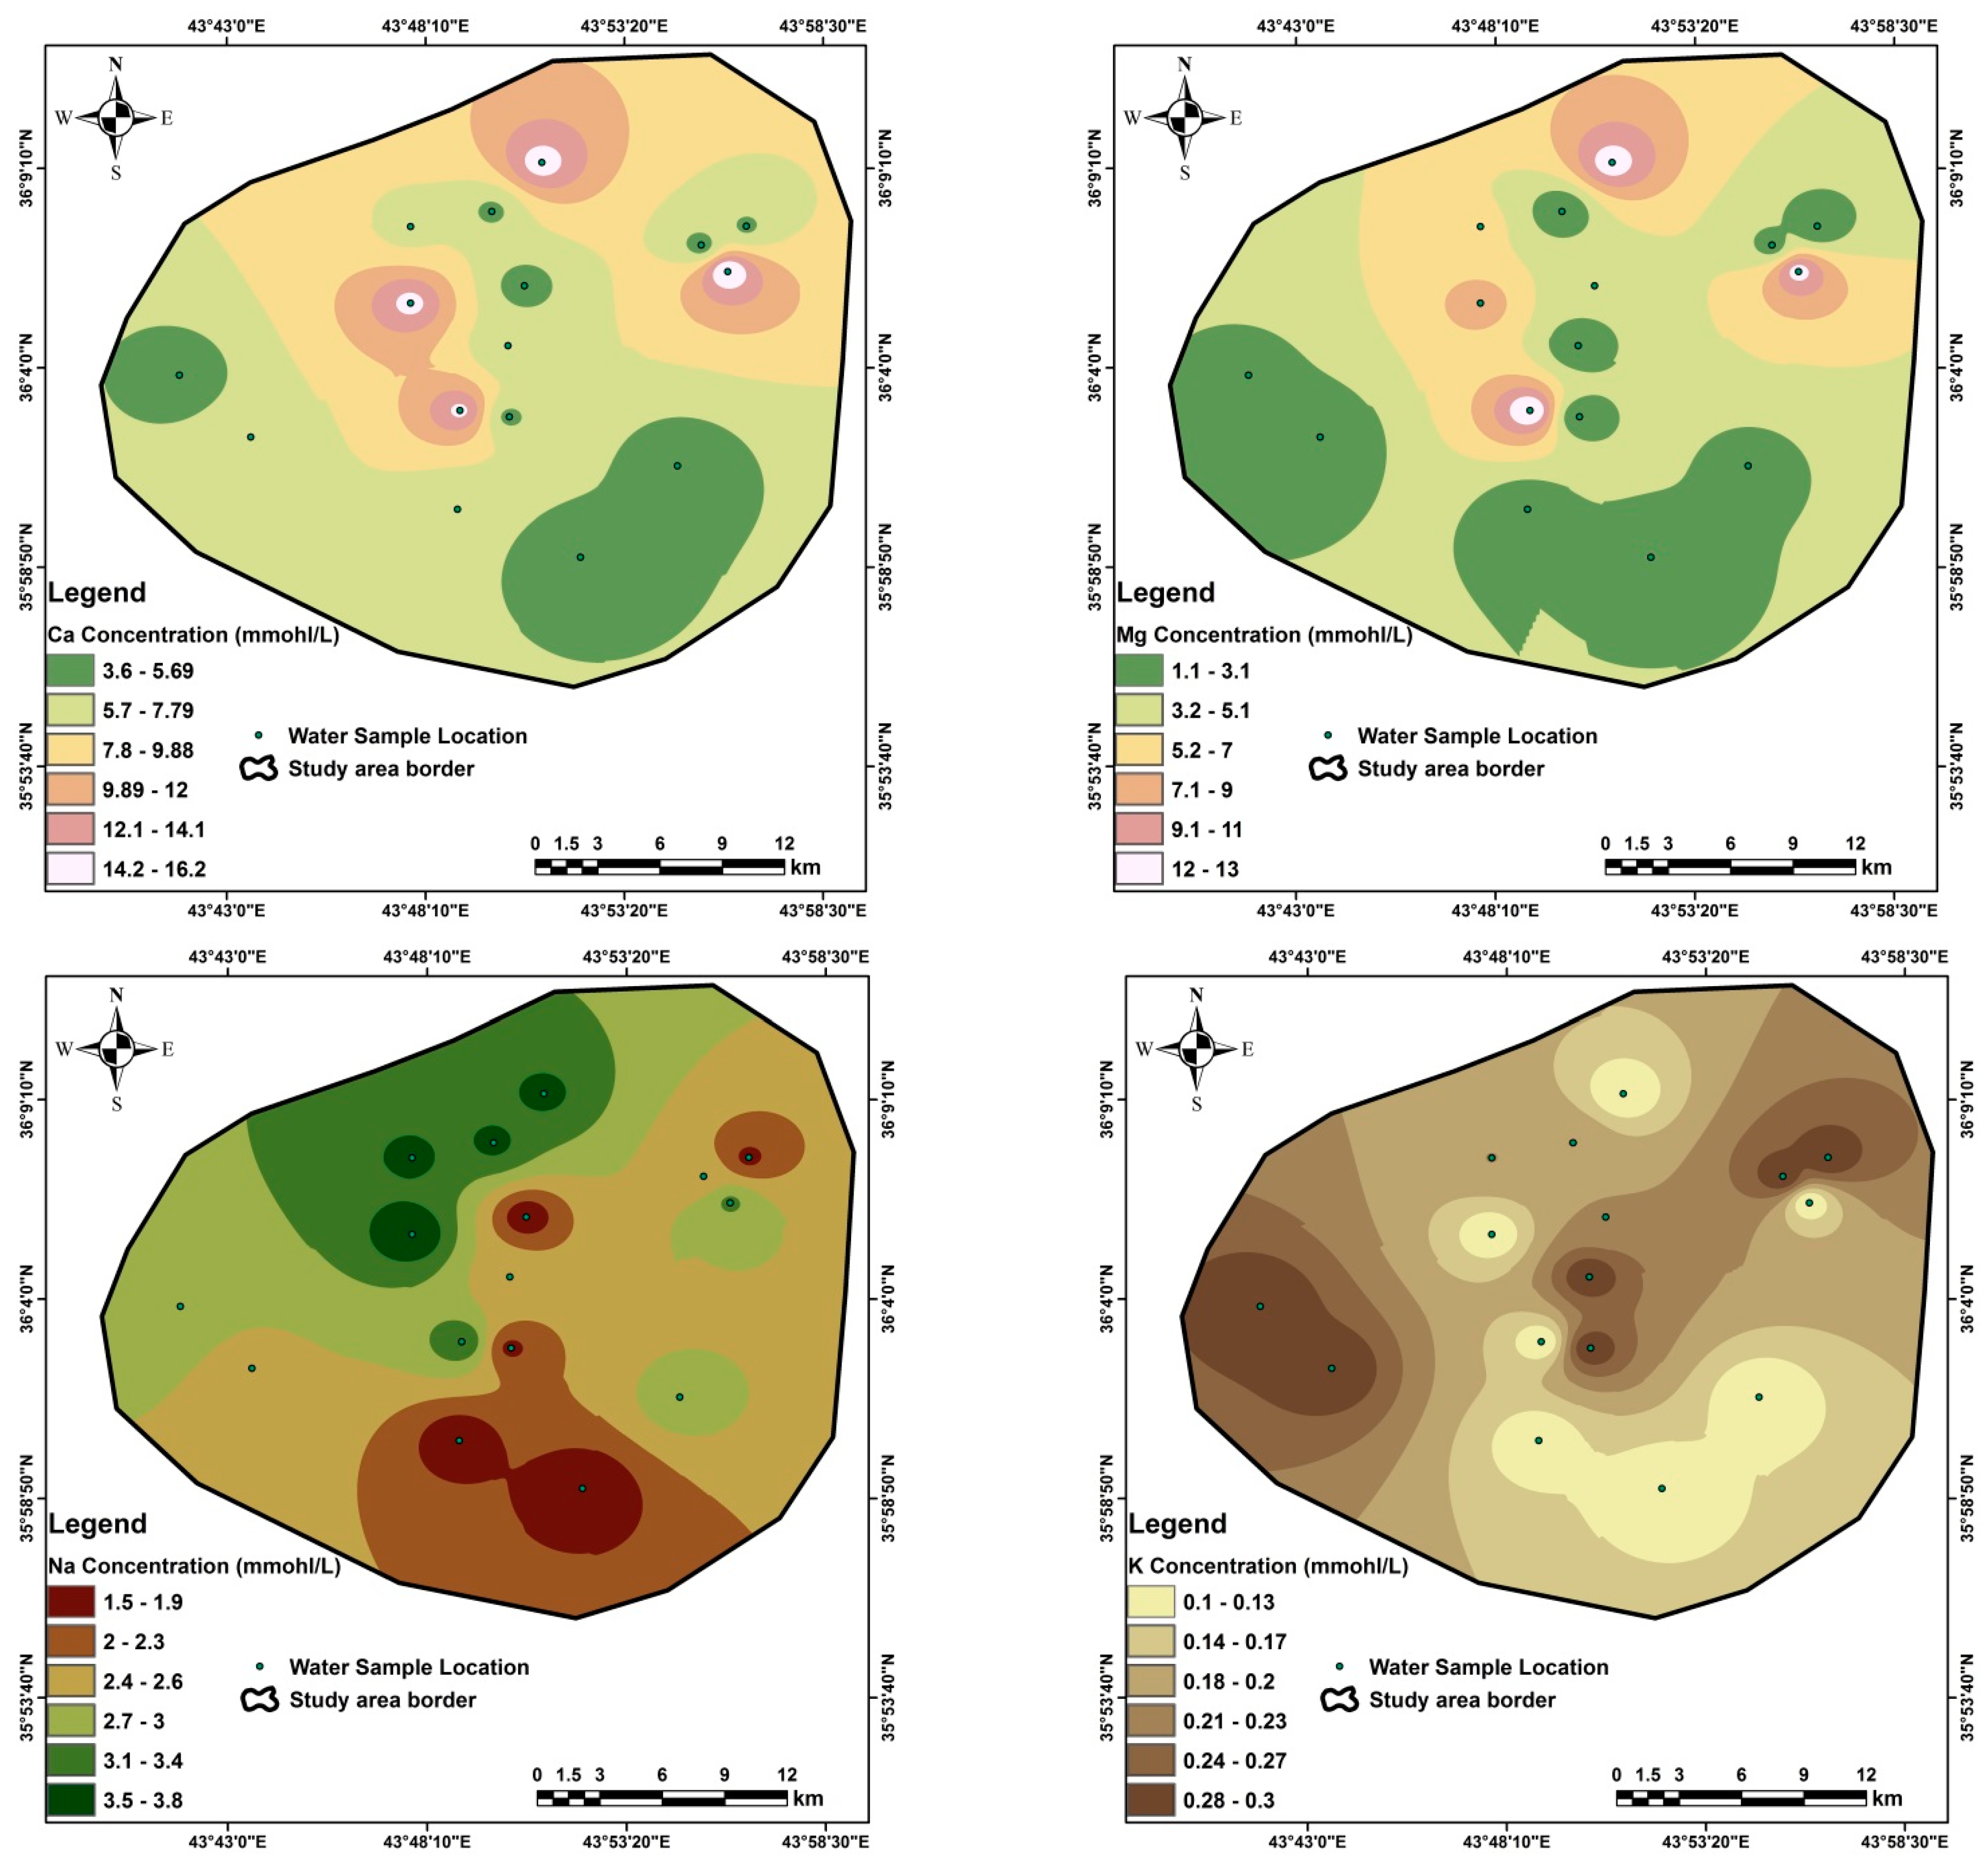
Appendix B
Figure A2.
Special distribution of the cations in the study area.
Figure A2.
Special distribution of the cations in the study area.
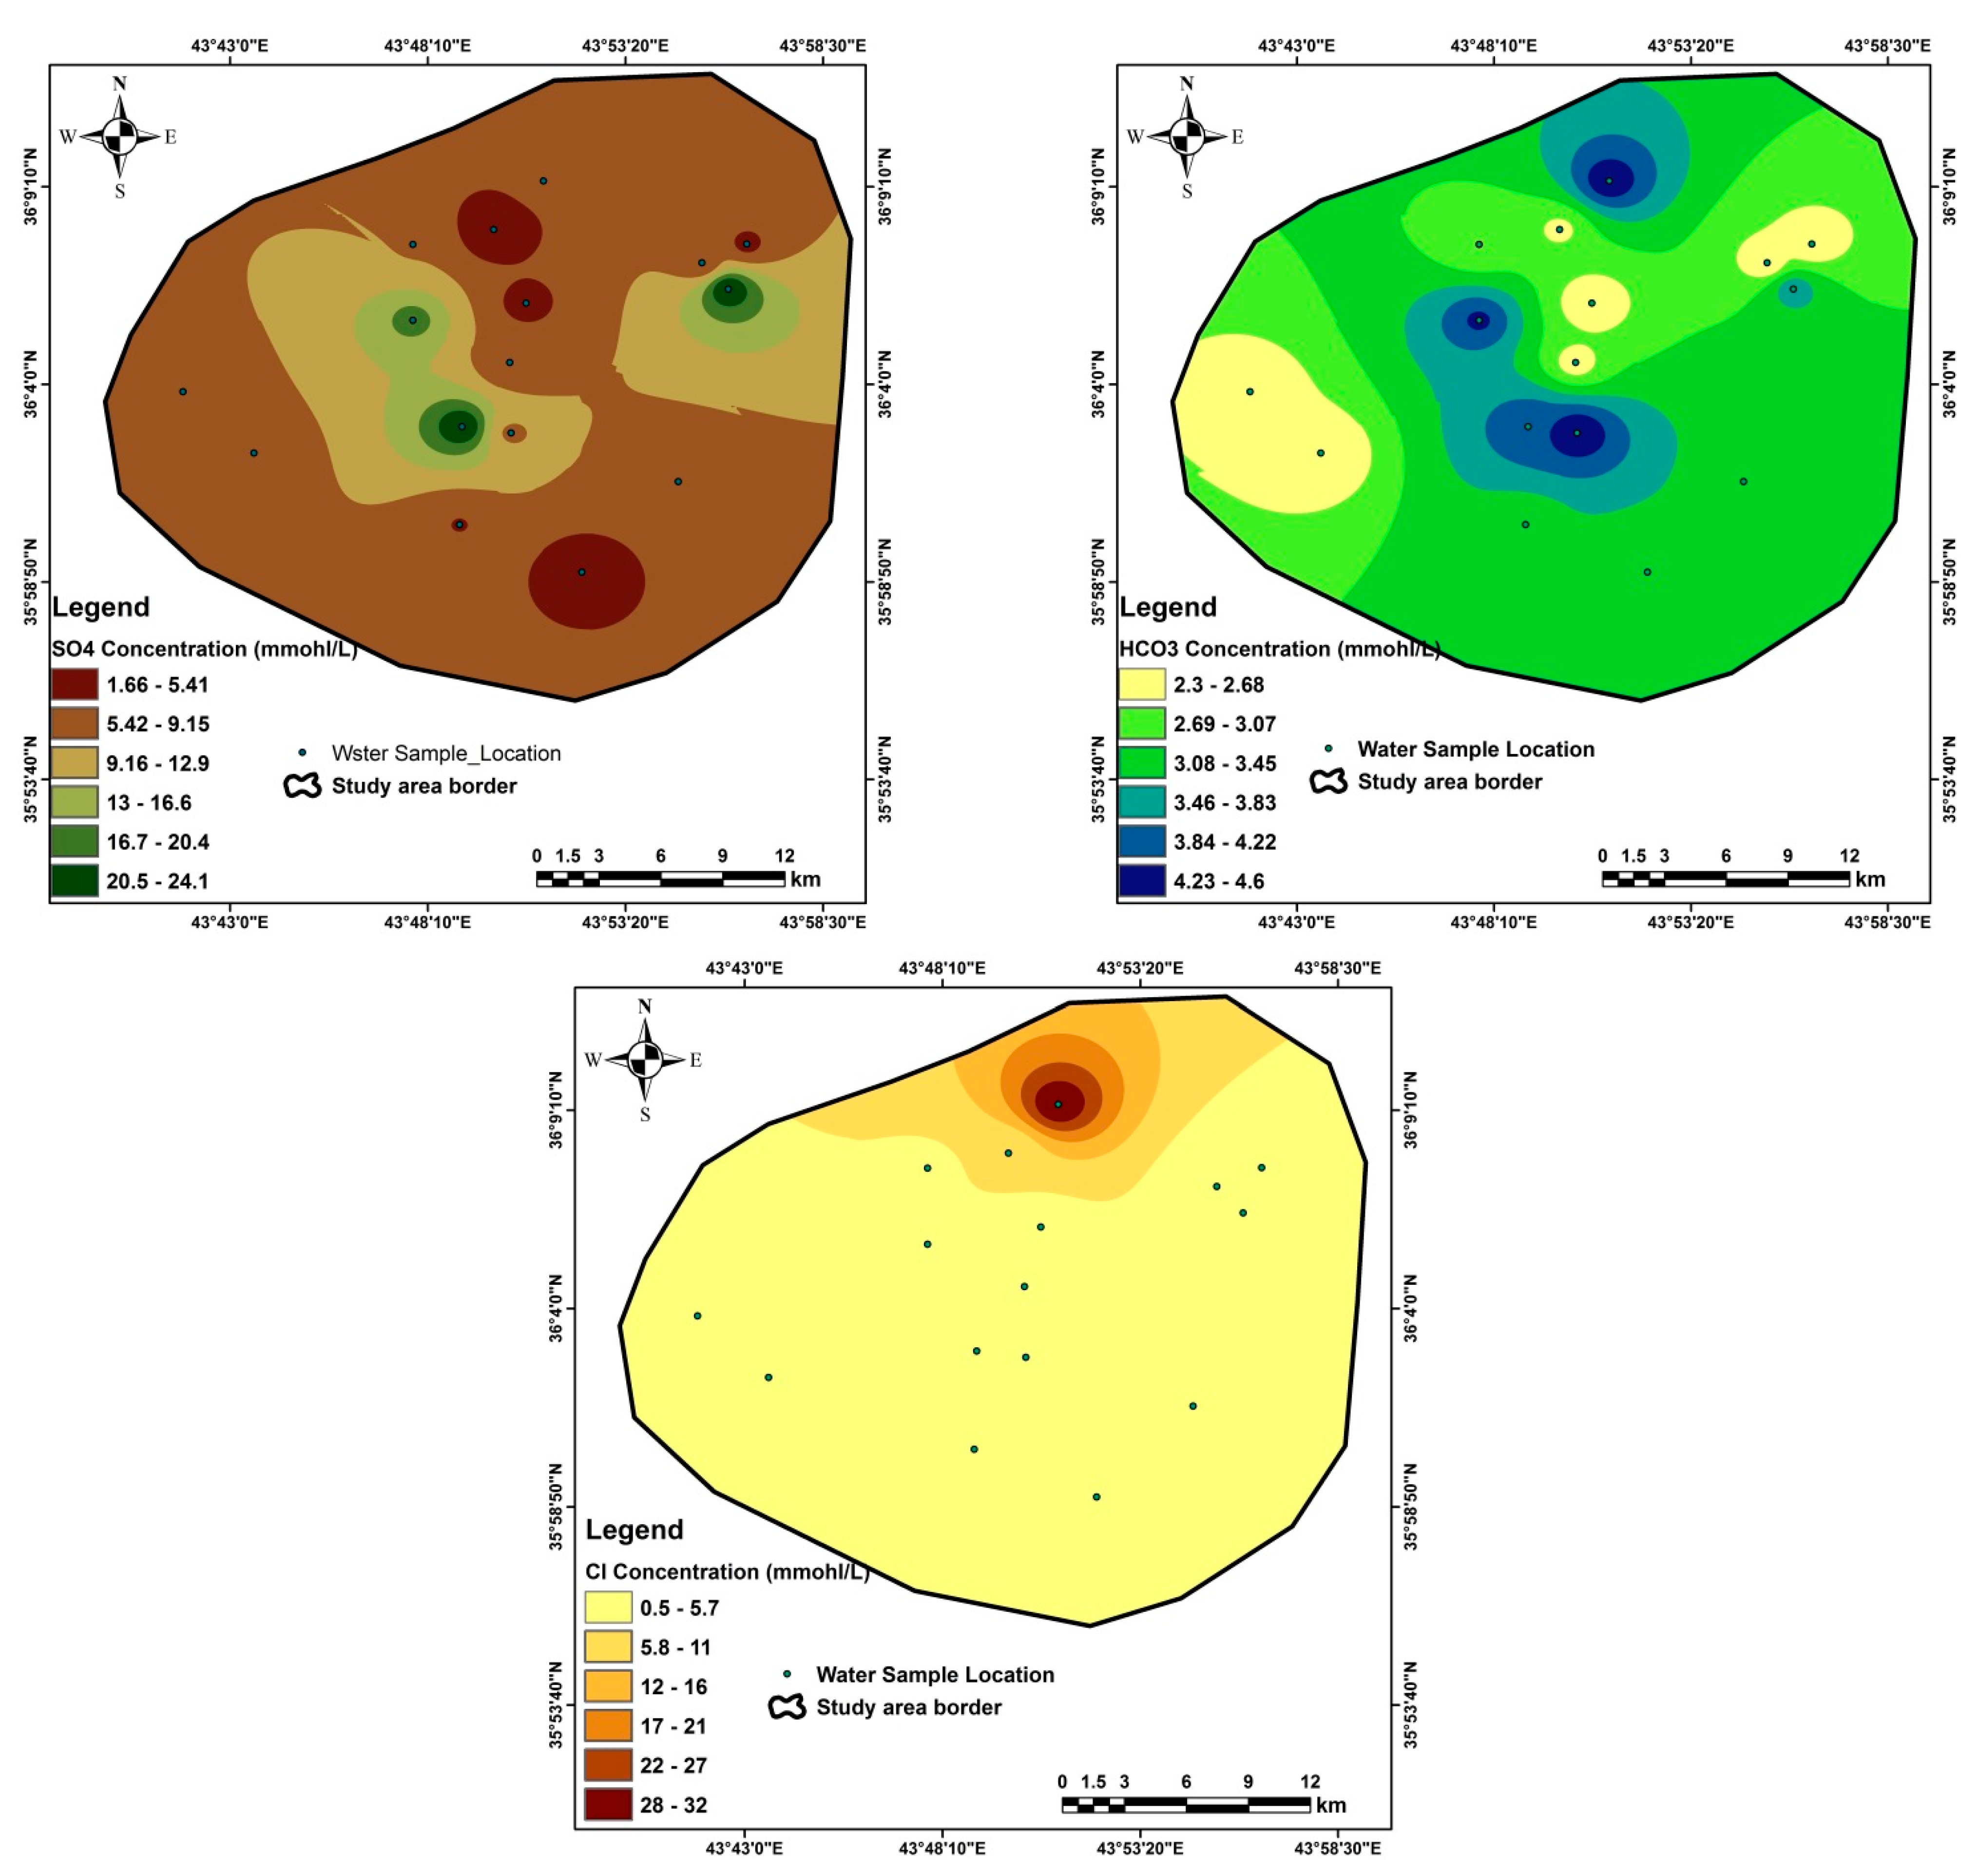
Appendix C
Figure A3.
Special distribution of the anions in the study area.
Figure A3.
Special distribution of the anions in the study area.
Appendix D
Table A1.
Calculated parameters of irrigation water quality in the study area.
Table A1.
Calculated parameters of irrigation water quality in the study area.
| SN | Well Name | Na% | SAR | Ps | RSC | MCAR | CROSS | MH | %PI |
|---|
| 1 | Tandura Village Well | 16.1 |
1.83
|
4.4
| −4.5 | 0.2 | 1.4 | 18.6 | 7.4 |
| 2 | Mastawa Village Well | 13.7 |
1.4
|
3.9
| −1.9 | 0.2 | 1.1 | 18.5 | 8.1 |
| 3 | Aliawa Shekh Village Well | 9.7 |
1.15
|
3.3
| −4.3 | 0.3 | 0.9 | 21.3 | 6.2 |
| 4 | Dil uguleKhwaru Village Well | 10.2 |
1.14
|
5.5
| −5.7 | 0.7 | 0.9 | 42.5 | 5.4 |
| 5 | Doosarafatah VillageWell | 18.8 |
2.33
|
3.4
| −3.2 | 0.6 | 1.8 | 38.5 | 9.1 |
| 6 | Haza Village Well | 16.3 |
1.83
|
4.6
| −4.6 | 0.5 | 1.5 | 31.4 | 7.4 |
| 7 | Shekh Sherwan Village Well-1 | 15.6 |
1.84
|
4.7
| −5.2 | 0.2 | 1.4 | 16.5 | 7.0 |
| 8 | YadiQizlar Village Well | 12.2 |
1.26
|
2.5
| −2.4 | 0.5 | 1.0 | 34.5 | 7.9 |
| 9 | Dheivan Village Well-1 | 5.9 |
1.28
|
14.7
| −23.3 | 0.9 | 1.0 | 47.3 | 2.8 |
| 10 | Binberze Gichka Village Well | 6.3 |
1.14
|
35.3
| −22.5 | 0.8 | 1.1 | 44.4 | 3.0 |
| 11 | Yarmja Village Well | 22.0 |
2.74
|
6.7
| −3.9 | 0.2 | 2.1 | 18.5 | 9.4 |
| 12 | Lajan Harki Village Well-1 | 13.0 |
1.99
|
9.0
| −9.8 | 0.8 | 1.6 | 44.0 | 5.5 |
| 13 | Sardar Village Well | 13.7 |
1.4
|
3.9
| −4.1 | 0.2 | 1.1 | 16.9 | 6.8 |
| 14 | Dhemat Village Well-1 | 7.8 |
2.67
|
13.4
| −18.7 | 0.6 | 1.2 | 36.1 | 3.6 |
| 15 | Awena Village Well-1 | 18.7 |
2.23
|
4.7
| −4.6 | 0.6 | 1.8 | 35.7 | 8.1 |
| 16 | Bryat Village Well | 5.4 |
1.15
|
14.9
| −24.3 | 0.7 | 0.9 | 42.1 | 2.6 |
Appendix E
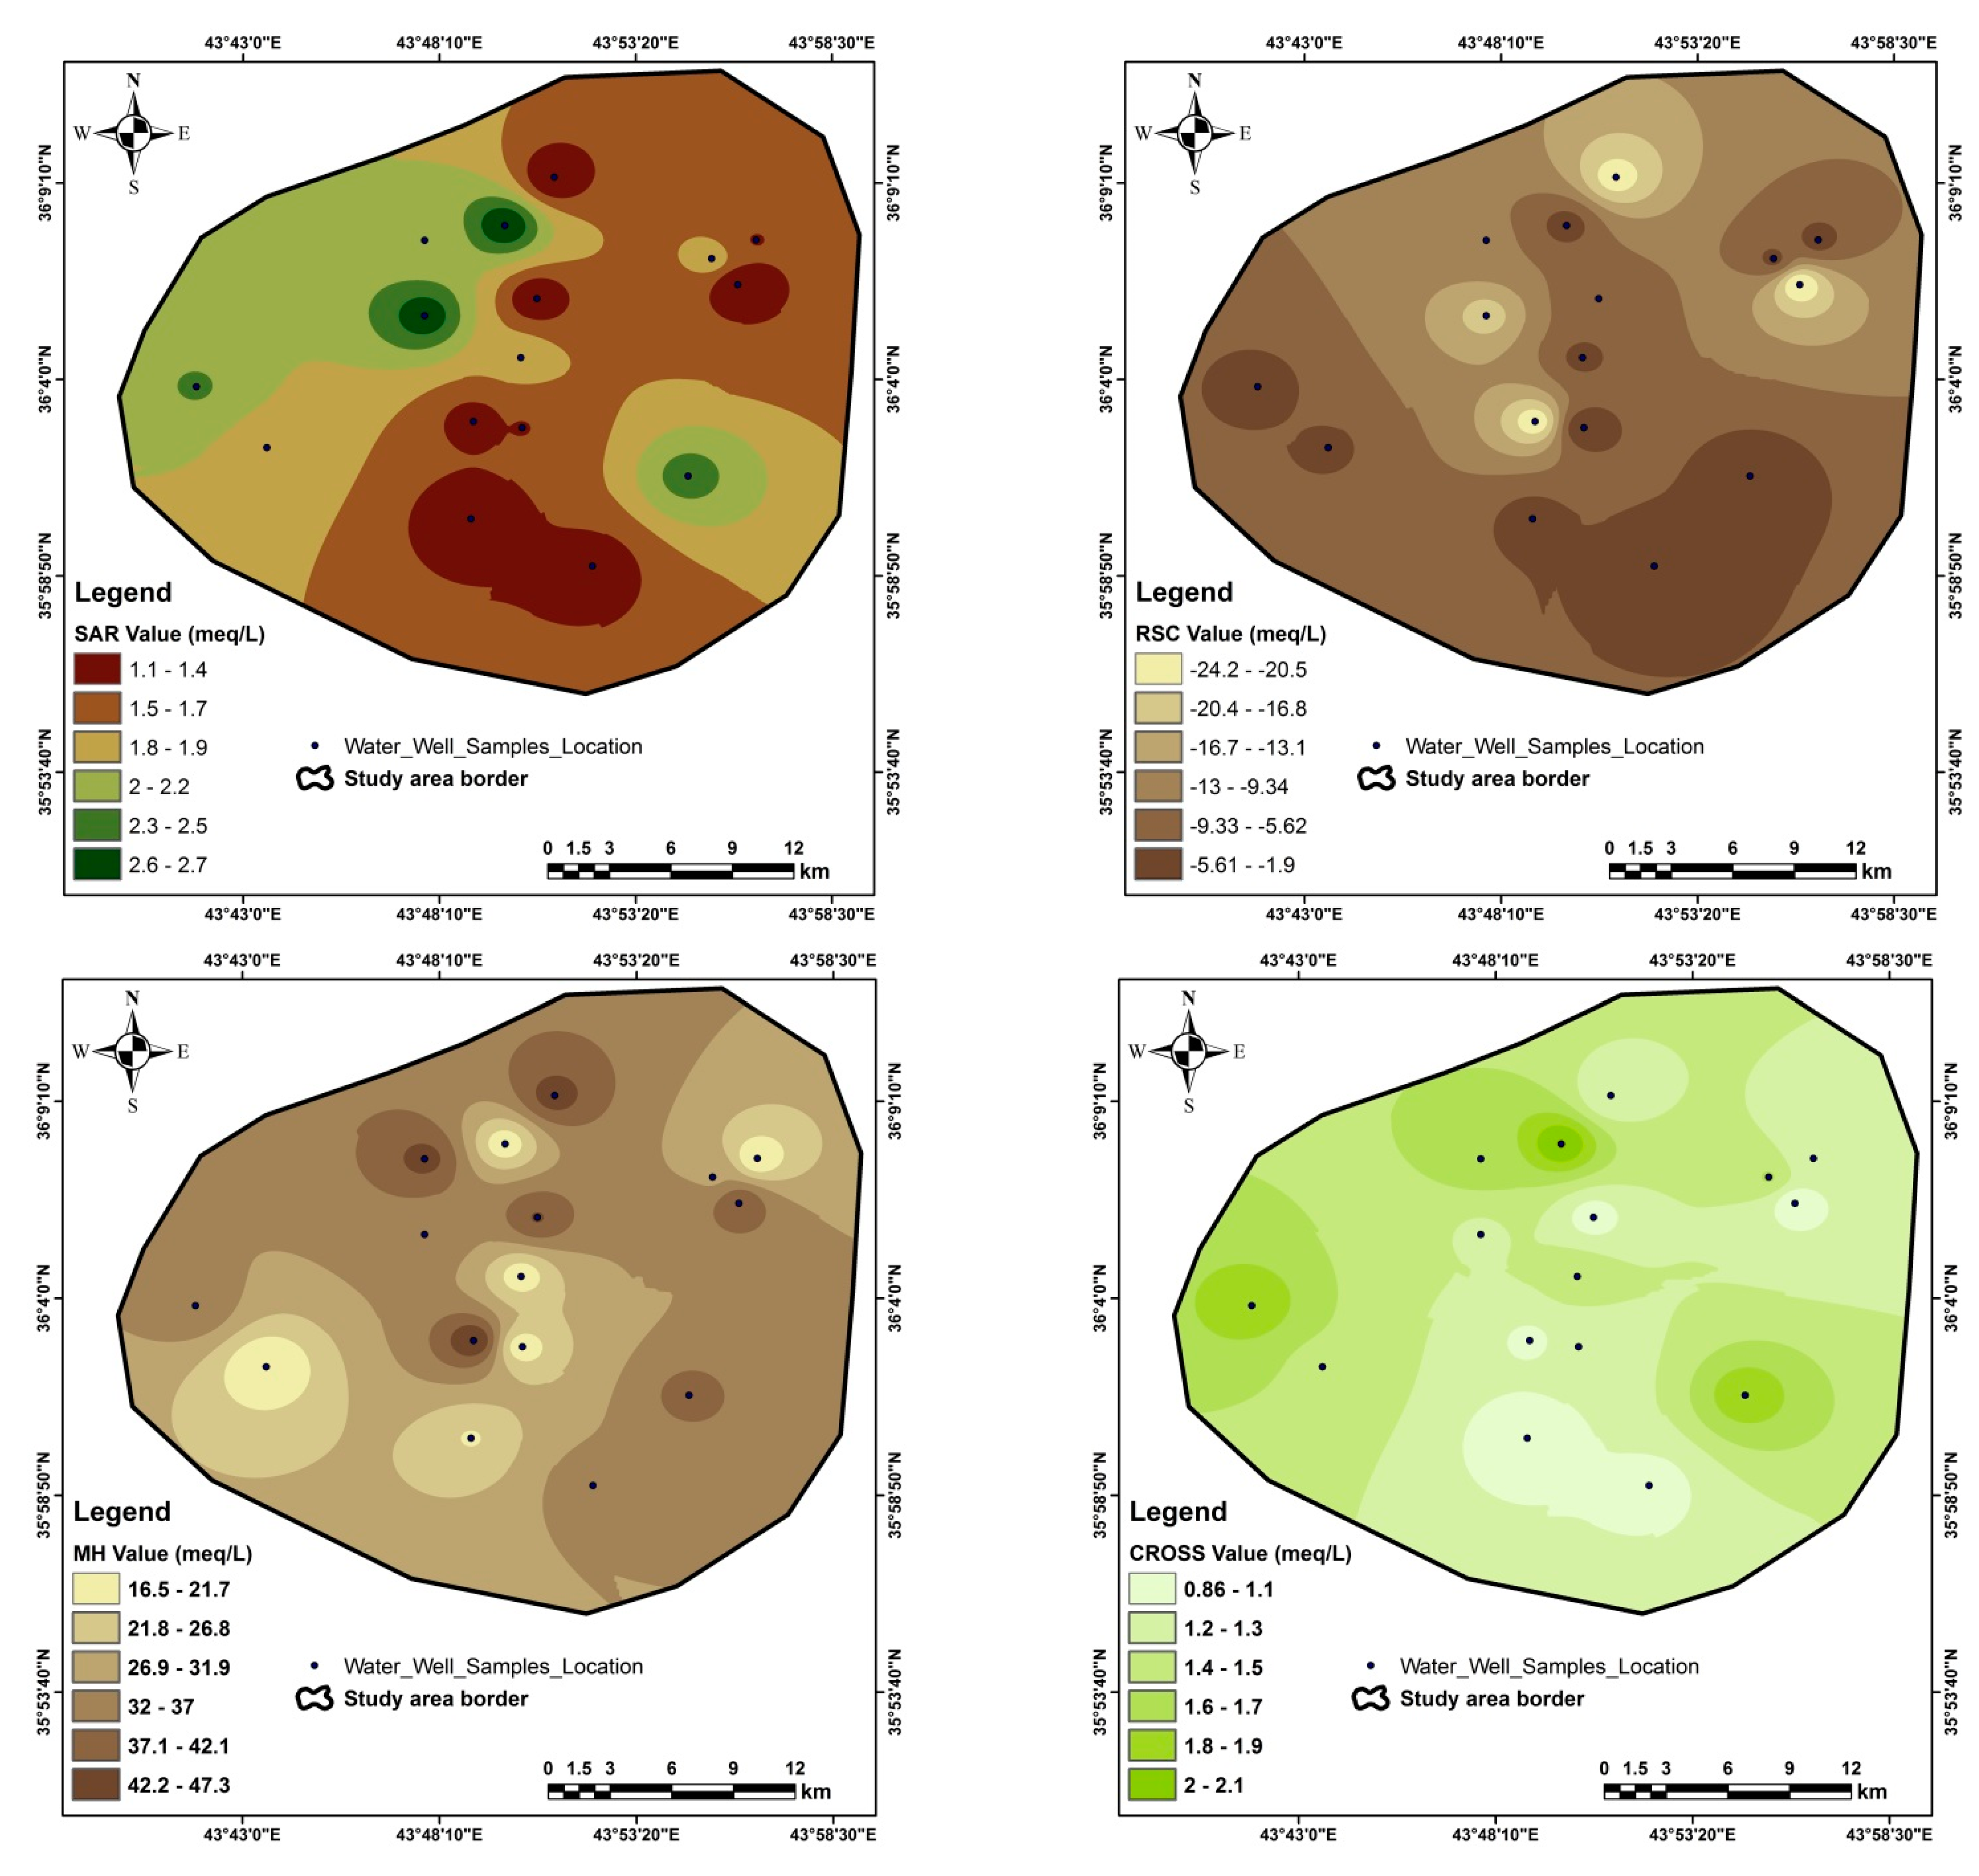
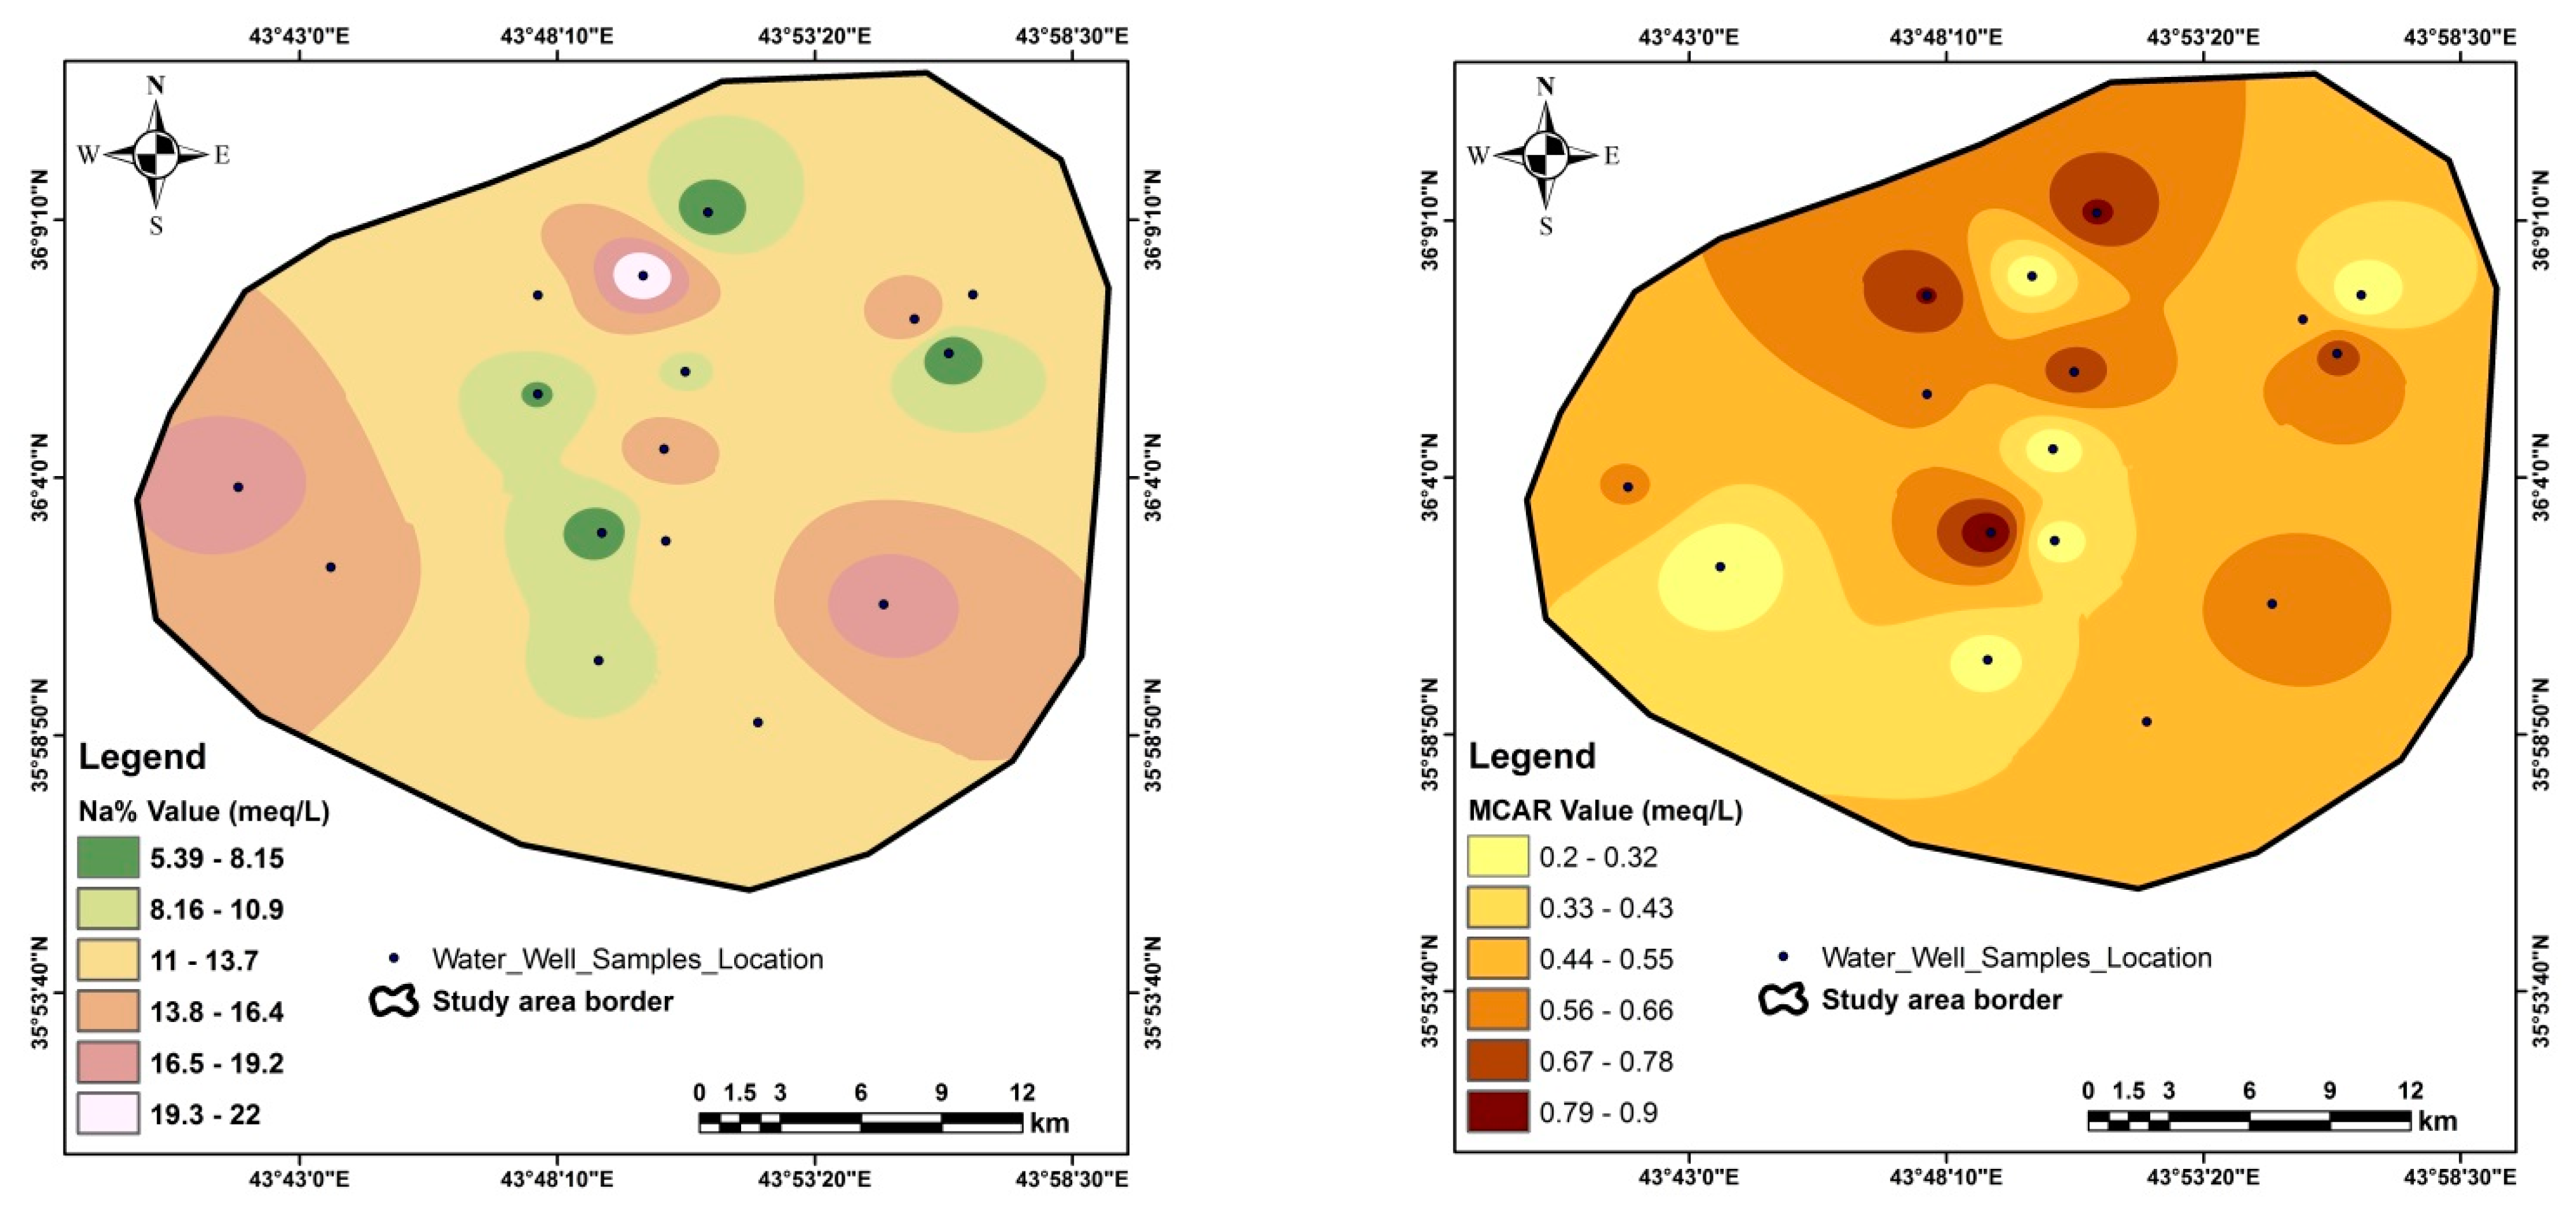
Figure A4.
Special distribution of the quality assessment parameters in the study area.
Figure A4.
Special distribution of the quality assessment parameters in the study area.
Appendix F
Figure A5.
Groundwater level fluctuation curve in some of monitored wells.
Figure A5.
Groundwater level fluctuation curve in some of monitored wells.
References
- Niemczynowicz, J. Urban hydrology and water management present and future challenges. Urban Water 1999, 1, 1–14. [Google Scholar] [CrossRef]
- Seeyan, S.; Adham, A.; Mahdi, K.; Ritsema, C. Water Quality, Availability, and Uses in Rural Communities in the Kurdistan Region, Iraq. Water 2021, 13, 2927. [Google Scholar] [CrossRef]
- Lamont, B. Maintaining Drip Irrigation System; Vegetable & Small Fruit Gazette; Penn State University Extension: Landisville, PA, USA, 2012; Volume 16. [Google Scholar]
- Belkhiri, L.; Boudoukha, A.; Mouni, L.; Baouz, T. Application of multivariate statistical methods and inverse geochemical modeling for characterization of groundwater—A case study: Ain Azel plain (Algeria). Geoderma 2010, 159, 390–398. [Google Scholar] [CrossRef]
- Al-Saffawi, A.Y.; Ibn Abubaka, B.S.; Abbass, L.Y.; Monguno, A.K. Assessment of groundwater quality for IWQ index in Al-Kasik sub-district Northwestern Iraq. Niger. J. Technol. 2020, 39, 632–638. [Google Scholar] [CrossRef]
- Seeyan, S. Hydrochemical assessment and water quality of Koysinjaq area in Kurdistan Region-Iraq. Arab. J. Geosci. 2020, 13, 491. [Google Scholar] [CrossRef]
- Lioyd, J.W. Water Resources of Hard Rock Aquifers in Arid and Semi-Arid Zones; Studies and Report in Hydrology 58; UNESCO: Paris, France, 1999; 184p. [Google Scholar]
- Wilson, E.M. Engineering Hydrology, 3rd ed.; Bloomsbury Publishing Ltd.: London, UK, 1987; 309p. [Google Scholar]
- Jassim, S.Z.; Goff, J.C. Geology of Iraq; Dolin, Prague and Moravian Museum: Brno, Czech Republic, 2006. [Google Scholar]
- Hem, J.D. Study and Interpretation of the Chemical Characteristics of Natural Water, 3rd ed.; USGS Water Supply Paper: Reston, VA, USA, 1985; 263p.
- Richard, L.A. Diagnosis and Improvement of Saline and Alkali Soils; Agricultural Hand Book 69; US Dept. Agric.: Washington, DC, USA, 1954; 160p.
- Wilcox, L.V. The Quality of water for Irrigation USE. US Dept. Tech. Bull. 1955, 962, 40. [Google Scholar]
- Szabolcs, I.; Darab, C. Influence of irrigation water of high sodium carbonate content of soils. In Proceedings of the 8th International Congress of ISSS, Tsukuba, Japan, 9 September 1964; pp. 803–812. [Google Scholar]
- Doneen, L.D. Salination of Soil by Salts in the Irrigation Water. Am. Geophys. Union Trans. 1954, 35, 943–950. [Google Scholar] [CrossRef]
- Doneen, L.D. Notes on Water Quality in Agriculture. Published as a Water Science and Engineering; Paper 4001; Department of Water Sciences and Engineering, University of California, Davis: Oakland, CA, USA, 1964. [Google Scholar]
- Smiles, D.E.; Smith, C.J. A survey of the cation content of piggery effluents and some consequences of their use to irrigate soils. Aust. J. Soil Res. 2004, 42, 231–246. [Google Scholar] [CrossRef]
- Qadir, M.; Sposito, G.; Smith, C.J.; Oster, J.D. Reassessing irrigation water quality guidelines for sodicity hazard. Agric. Water Manag. 2021, 255, 107054. [Google Scholar] [CrossRef]
- Rengasamy, P.; Marchuk, A. Cation ratio of soil structural stability (CROSS). Soil Res. 2011, 49, 280–285. [Google Scholar] [CrossRef]
- Ivanov, V.V.; Barvanon, L.N.; Plotnikova, G.N. The Main Genetic Type of Earth’s Crust Mineral Water and their distribution in the USSR. In Proceedings of the International Geological Congress of 23rd Session, Prague, Czech Republic, 19–23 August 1968; Volume 12. [Google Scholar]
- Grossman, Z. International Environmental Problems & Policy, a Class Website on Water Privatization and Commodification. Produced by Students of Geography at the University of Wisconsin-Eau Claire, USA. 2004. Available online: www.uwec.sdu/grossmzc/GEOG378.html (accessed on 12 August 2022).
- Leavy, D.B.; Kearney, W.F. Irrigation of Native Rangeland Using Treated Waste Water from Institute Uralian processing. J. Environ. Qual. 1999, 28, 208–217. [Google Scholar] [CrossRef]
- Train, R.E. Quality Criteria for Water; Castle House Publication, Ltd.: London, UK, 1979; 256p. [Google Scholar]
- Bauder, T.A.; Waskom, R.M.; Davis, J.G. Irrigation Water Quality Criteria. Colorado State University Extension: Fort Collins, CO, USA, 2004; Available online: www.ext.colostate.eud (accessed on 12 August 2022).
- Singh, K.K.; Tewari, G.; Kumar, S. Evaluation of Groundwater Quality for Suitability of Irrigation Purposes: A Case Study in the Udham Singh Nagar, Uttarakhand. J. Chem. 2020, 2020, 15. [Google Scholar] [CrossRef]
- Rijtima, P.E. Quality Standards for Irrigation Waters. Acta Hort. 1981, 119, 25–35. [Google Scholar] [CrossRef]
- Piper, A.M. A Graphical Interpretation of Water Analysis. Eos Trans. Am. Geophys. Union 1944, 25, 914–928. [Google Scholar] [CrossRef]
- Davis, S.N.; Dewiest, R.J. Hydrology; John Wiley & Sons., Inc.: New York, NY, USA, 1966; 463p. [Google Scholar]
- Shoeller, M. Edute Geochimique De La Nappe Des “Stables in fericurs” Du Bassin Daquitainse. J. Hydrol. 1972, 15, 317–328. (In French) [Google Scholar] [CrossRef]
- Fetter, C.W. Applied Hydrogeology; Prentice-Hall, Inc., A Simon & Schuster Company: Upper Saddle River, NJ, USA, 1994; 691p. [Google Scholar]
- Al-Jaleel, H.M. Effect of Industrial Wastes Discharge of Chemical Complex of Phosphate in Al-Qaim on Surface and Groundwater Pollution. Ph.D. Thesis, Baghdad University, Baghdad, Iraq, 2000; 17p. (In Arabic). [Google Scholar]
- Chadha, D.K. A Proposed New Diagram for Geochemical Classification of Natural Waters and Interpretation of Chemical Data. Hydrogeol. J. 1999, 7, 431–439. [Google Scholar] [CrossRef]
- Gibbs, R.J. Mechanisms Controlling World Water Chemistry. Science 1970, 170, 1088–1090. [Google Scholar] [CrossRef] [PubMed]
- DeHayer, Z.; Gordon, J. Classification of Irrigation Water Quality; Springer: Cham, Switzerland, 2006. [Google Scholar]
- Eaton, F.M. Significance of Carbonates in Irrigation Waters. Soil Sci. 1950, 69, 123–133. [Google Scholar] [CrossRef]
- Nagaraju, A.; Sunil Kumar, K.; Thejaswi, A. Assessment of groundwater quality for irrigation: A case study from Bandalamottu lead mining area, Guntur district, Andhra Pradesh, South India. Appl. Water Sci. 2014, 4, 385–396. [Google Scholar] [CrossRef]
- Rasouli, F.; Pouya, A.K.; Cheraghi, S.A.M. Hydrogeochemistry and Water Quality Assessment of the Kor-Sivand Basin, Fars Province, Iran. Environ. Monit. Assess. 2012, 184, 4861–4877. [Google Scholar] [CrossRef] [PubMed]
| Publisher’s Note: MDPI stays neutral with regard to jurisdictional claims in published maps and institutional affiliations. |
© 2022 by the authors. Licensee MDPI, Basel, Switzerland. This article is an open access article distributed under the terms and conditions of the Creative Commons Attribution (CC BY) license (https://creativecommons.org/licenses/by/4.0/).


 ,
, 


