Analysis of the IMERG-GPM Precipitation Product Analysis in Brazilian Midwestern Basins Considering Different Time and Spatial Scales
Abstract
:1. Introduction
2. Materials and Methods
2.1. Study Area
2.2. Data from Ground-Based Rainfall Gauging Stations
2.3. Data from the GPM Precipitation Product
2.4. Data Interpolation
2.5. Comparison of Precipitation Amounts
3. Results
3.1. Daily Time Scale
3.2. Monthly Time Scale
3.3. Anual Time Scale
4. Conclusions
Author Contributions
Funding
Acknowledgments
Conflicts of Interest
References
- McMillan, H.; Jackson, B.; Clark, M.; Kavetski, D.; Woods, R. Rainfall Uncertainty in Hydrological Modelling: An Evaluation of Multiplicative Error Models. J. Hydrol. 2011, 400, 83–94. [Google Scholar] [CrossRef]
- Ning, S.; Wang, J.; Jin, J.; Ishidaira, H. Assessment of the Latest GPM-Era High-Resolution Satellite Precipitation Products by Comparison with Observation Gauge Data over the Chinese Mainland. Water 2016, 8, 481. [Google Scholar] [CrossRef]
- Anagnostou, E.N.; Maggioni, V.; Nikolopoulos, E.I.; Meskele, T.; Hossain, F.; Papadopoulos, A. Benchmarking High-Resolution Global Satellite Rainfall Products to Radar and Rain-Gauge Rainfall Estimates. IEEE Trans. Geosci. Remote Sens. 2010, 48, 1667–1683. [Google Scholar] [CrossRef]
- Xu, S.; Shen, Y.; Du, Z. Tracing the Source of the Errors in Hourly IMERG Using a Decomposition Evaluation Scheme. Atmosphere 2016, 7, 161. [Google Scholar] [CrossRef] [Green Version]
- Xiao, S.; Xia, J.; Zou, L. Evaluation of Multi-Satellite Precipitation Products and Their Ability in Capturing the Characteristics of Extreme Climate Events over the Yangtze River Basin, China. Water 2020, 12, 1179. [Google Scholar] [CrossRef] [Green Version]
- Ma, Y.; Sun, X.; Chen, H.; Hong, Y.; Zhang, Y. A Two-Stage Blending Approach for Merging Multiple Satellite Precipitation Estimates and Rain Gauge Observations: An Experiment in the Northeastern Tibetan Plateau. Hydrol. Earth Syst. Sci. 2021, 25, 359–374. [Google Scholar] [CrossRef]
- Gado, T.A.; Hsu, K.; Sorooshian, S. Rainfall Frequency Analysis for Ungauged Sites Using Satellite Precipitation Products. J. Hydrol. 2017, 554, 646–655. [Google Scholar] [CrossRef] [Green Version]
- Dis, M.O.; Anagnostou, E.; Mei, Y. Using High-Resolution Satellite Precipitation for Flood Frequency Analysis: Case Study over the Connecticut River Basin. J. Flood Risk Manag. 2018, 11, S514–S526. [Google Scholar] [CrossRef]
- Gao, Z.; Long, D.; Tang, G.; Zeng, C.; Huang, J.; Hong, Y. Assessing the Potential of Satellite-Based Precipitation Estimates for Flood Frequency Analysis in Ungauged or Poorly Gauged Tributaries of China’s Yangtze River Basin. J. Hydrol. 2017, 550, 478–496. [Google Scholar] [CrossRef]
- Zambrano, F.; Wardlow, B.; Tadesse, T.; Lillo-Saavedra, M.; Lagos, O. Evaluating Satellite-Derived Long-Term Historical Precipitation Datasets for Drought Monitoring in Chile. Atmos. Res. 2017, 186, 26–42. [Google Scholar] [CrossRef]
- Zhong, R.; Chen, X.; Lai, C.; Wang, Z.; Lian, Y.; Yu, H.; Wu, X. Drought Monitoring Utility of Satellite-Based Precipitation Products across Mainland China. J. Hydrol. 2019, 568, 343–359. [Google Scholar] [CrossRef]
- Rhee, J.; Im, J. Meteorological Drought Forecasting for Ungauged Areas Based on Machine Learning: Using Long-Range Climate Forecast and Remote Sensing Data. Agric. For. Meteorol. 2017, 237–238, 105–122. [Google Scholar] [CrossRef]
- Park, S.; Im, J.; Han, D.; Rhee, J. Short-Term Forecasting of Satellite-Based Drought Indices Using Their Temporal Patterns and Numerical Model Output. Remote Sens. 2020, 12, 3499. [Google Scholar] [CrossRef]
- Skinner, J.C.; Bellerby, J.T.; Greatrex, H.; Grimes, D.F.D. Hydrological Modelling Using Ensemble Satellite Rainfall Estimates in a Sparsely Gauged River Basin: The Need for Whole-Ensemble Calibration. J. Hydrol. 2015, 522, 110–122. [Google Scholar] [CrossRef]
- Gilewski, P.; Nawalany, M. Inter-Comparison of Rain-Gauge, Radar, and Satellite (IMERG GPM) Precipitation Estimates Performance for Rainfall-Runoff Modeling in a Mountainous Catchment in Poland. Water 2018, 10, 1665. [Google Scholar] [CrossRef] [Green Version]
- Ma, Q.; Xiong, L.; Liu, D.; Xu, C.Y.; Guo, S. Evaluating the Temporal Dynamics of Uncertainty Contribution from Satellite Precipitation Input in Rainfall-Runoff Modeling Using the Variance Decomposition Method. Remote Sens. 2018, 10, 1876. [Google Scholar] [CrossRef] [Green Version]
- Kim, J.P.; Jung, I.W.; Park, K.W.; Yoon, S.K.; Lee, D. Hydrological Utility and Uncertainty of Multi-Satellite Precipitation Products in the Mountainous Region of South Korea. Remote Sens. 2016, 8, 608. [Google Scholar] [CrossRef] [Green Version]
- Ferraro, R.R.; Peters-lidard, C.D.; Hernandez, C.; Turk, F.J.; Aires, F.; Prigent, C.; Lin, X.; Boukabara, S.; Furuzawa, F.A.; Gopalan, K.; et al. An Evaluation of Microwave Land Surface Emissivities Over the Continental United States to Benefit GPM-Era Precipitation Algorithms. IEEE Trans. Geosci. Remote Sens. 2012, 51, 378–398. [Google Scholar] [CrossRef]
- Yong, B.; Ren, L.L.; Hong, Y.; Wang, J.H.; Gourley, J.J.; Jiang, S.H.; Chen, X.; Wang, W. Hydrologic Evaluation of Multisatellite Precipitation Analysis Standard Precipitation Products in Basins beyond Its Inclined Latitude Band: A Case Study in Laohahe Basin, China. Water Resour. Res. 2010, 46, 759–768. [Google Scholar] [CrossRef] [Green Version]
- Hasenauer, S.; Kidd, R.; Dorigo, W.; Wagner, W.; Levizzani, V. Journal of Geophysical Research: Atmospheres Rainfall from Satellite Soil Moisture Data. J. Geophys. Res. Atmos. 2014, 119, 5128–5141. [Google Scholar] [CrossRef]
- Oliveira, R.; Maggioni, V.; Vila, D.; Morales, C. Characteristics and Diurnal Cycle of GPM Rainfall Estimates over the Central Amazon Region. Remote Sens. 2016, 8, 544. [Google Scholar] [CrossRef] [Green Version]
- Huffman, G.J.; Gsfc, N.; Bolvin, D.T.; Braithwaite, D.; Hsu, K.; Joyce, R.; Kidd, C.; Nelkin, E.J.; Sorooshian, S.; Tan, J.; et al. Algorithm Theoretical Basis Document (ATBD) NASA Global Precipitation Measurement (GPM) Integrated Multi-SatellitE Retrievals for GPM (IMERG); NASA: Washington, DC, USA, 2017.
- Sharif, H.O.; Al-Zahrani, M.; El Hassan, A. Physically, Fully-Distributed Hydrologic Simulations Driven by GPM Satellite Rainfall over an Urbanizing Arid Catchment in Saudi Arabia. Water 2017, 9, 163. [Google Scholar] [CrossRef]
- Hou, A.Y.; Kakar, R.K.; Neeck, S.; Azarbarzin, A.A.; Kummerow, C.D.; Kojima, M.; Oki, R.; Nakamura, K.; Iguchi, T. The global precipitation measurement mission. Bull. Am. Meteorol. Soc. 2014, 95, 701–722. [Google Scholar] [CrossRef]
- Collischonn, W. Método de Combinação de Dados de Precipitação Estimados Por Satélite e Medidos Em Pluviômetros Para a Modelagem Hidrológica [Merging Rainfall Gauges and Satellite Rainfall Data for Hydrology Modeling]. Rev. Bras. Recur. Hídricos 2015, 20, 202–217. [Google Scholar]
- Ma, Y.; Tang, G.; Long, D.; Yong, B.; Zhong, L.; Wan, W.; Hong, Y. Similarity and Error Intercomparison of the GPM and Its Predecessor-TRMM Multisatellite Precipitation Analysis Using the Best Available Hourly Gauge Network over the Tibetan Plateau. Remote Sens. 2016, 8, 569. [Google Scholar] [CrossRef] [Green Version]
- Ma, Y.; Zhang, Y.; Yang, D.; Farhan, S. bin Precipitation Bias Variability versus Various Gauges under Different Climatic Conditions over the Third Pole Environment (TPE) Region. Int. J. Climatol. 2015, 35, 1201–1211. [Google Scholar] [CrossRef]
- Tesfagiorgis, K.; Mahani, S.E.; Krakauer, N.Y.; Khanbilvardi, R. Bias Correction of Satellite Rainfall Estimates Using a Radar-Gauge Product—a Case Study in Oklahoma (USA). Hydrol. Earth Syst. Sci. 2011, 15, 2631–2647. [Google Scholar] [CrossRef] [Green Version]
- Melo, D.d.C.D.; Xavier, A.C.; Bianchi, T.; Oliveira, P.T.S.; Scanlon, B.R.; Lucas, M.C.; Wendland, E. Performance Evaluation of Rainfall Estimates by TRMM Multi-Satellite Precipitation Analysis 3B42V6 and V7 over Brazil. J. Geophys. Res. 2015, 120, 9426–9436. [Google Scholar] [CrossRef] [Green Version]
- Pradhan, R.K.; Markonis, Y.; Vargas Godoy, M.R.; Villalba-Pradas, A.; Andreadis, K.M.; Nikolopoulos, E.I.; Papalexiou, S.M.; Rahim, A.; Tapiador, F.J.; Hanel, M. Review of GPM IMERG Performance: A Global Perspective. Remote Sens. Environ. 2021, 268, 112754. [Google Scholar] [CrossRef]
- Prakash, S. Performance Assessment of CHIRPS, MSWEP, SM2RAIN-CCI, and TMPA Precipitation Products across India. J. Hydrol. 2019, 571, 50–59. [Google Scholar] [CrossRef]
- Ramadhan, R.; Yusnaini, H.; Marzuki, M.; Muharsyah, R.; Suryanto, W.; Sholihun, S.; Vonnisa, M.; Harmadi, H.; Ningsih, A.P.; Battaglia, A.; et al. Evaluation of GPM IMERG Performance Using Gauge Data over Indonesian Maritime Continent at Different Time Scales. Remote Sens. 2022, 14, 1172. [Google Scholar] [CrossRef]
- Yu, C.; Hu, D.; Liu, M.; Wang, S.; Di, Y. Spatio-Temporal Accuracy Evaluation of Three High-Resolution Satellite Precipitation Products in China Area. Atmospheric Res. 2020, 241, 104952. [Google Scholar] [CrossRef]
- Derin, Y.; Anagnostou, E.; Berne, A.; Borga, M.; Boudevillain, B.; Buytaert, W.; Chang, C.H.; Chen, H.; Delrieu, G.; Hsu, Y.C.; et al. Evaluation of GPM-Era Global Satellite Precipitation Products over Multiple Complex Terrain Regions. Remote Sens. 2019, 11, 2936. [Google Scholar] [CrossRef] [Green Version]
- de Moraes, R.B.F.; Gonçalves, F.V. Validation of Trmm Data in the Geographical Regions of Brazil. Rev. Bras. Recur. Hidr. 2021, 26, e36. [Google Scholar] [CrossRef]
- Tang, G.; Ma, Y.; Long, D.; Zhong, L.; Hong, Y. Evaluation of GPM Day-1 IMERG and TMPA Version-7 Legacy Products over Mainland China at Multiple Spatiotemporal Scales. J. Hydrol. 2016, 533, 152–167. [Google Scholar] [CrossRef]
- Sharifi, E.; Steinacker, R.; Saghafian, B. Assessment of GPM-IMERG and Other Precipitation Products against Gauge Data under Different Topographic and Climatic Conditions in Iran: Preliminary Results. Remote Sens. 2016, 8, 135. [Google Scholar] [CrossRef] [Green Version]
- de Paes, R.P.; Costa, V.A.F.; Fernandes, W.D.S. Effects of Small Hydropower Plants in Cascade Arrangement on the Discharge Cyclic Patterns. Rev. Bras. Recur. Hidr. 2019, 24, e33. [Google Scholar] [CrossRef] [Green Version]
- PRODUCT 5: State Water Resources Plan Final Review; Goiás, Brazil, 2015. Available online: https://www.meioambiente.go.gov.br/images/imagens_migradas/upload/arquivos/2016-01/p05_plano_estadual_de_recursos_hidricos_revfinal2016.pdf (accessed on 7 June 2022).
- Santos, F.P.; Bayer, M.; Carvalho, T.M. Compartimentação Pedológica da Bacia do Rio dos Bois, Municípios de Cezarina, Varjão, Guapó Ee Palmeiras de Goiás (Go), e Sua Relação com a Suscetibilidade e Risco à Erosão Laminar. J. Exp. Psychol. Gen. 2008, 136, 23–42. [Google Scholar]
- Package, T.; Hydrology, T.; Forecasting, C. Package ‘Hyfo’. 2018. Available online: https://cran.r-project.org/web/packages/hyfo/index.html (accessed on 7 June 2022).
- Miró, J.J.; Caselles, V.; Estrela, M.J. Multiple Imputation of Rainfall Missing Data in the Iberian Mediterranean Context. Atmos. Res. 2017, 197, 313–330. [Google Scholar] [CrossRef]
- Borga, M.; Vizzaccaro, A. On the Interpolation of Hydrologic Variables: Formal Equivalence of Multiquadratic Surface Fitting and Kriging. J. Hydrol. 1997, 195, 160–171. [Google Scholar] [CrossRef]
- Plouffe, C.C.F.; Robertson, C.; Chandrapala, L. Comparing Interpolation Techniques for Monthly Rainfall Mapping Using Multiple Evaluation Criteria and Auxiliary Data Sources: A Case Study of Sri Lanka. Environ. Model. Softw. 2015, 67, 57–71. [Google Scholar] [CrossRef]
- Biondi, D.; Freni, G.; Iacobellis, V.; Mascaro, G.; Montanari, A. Validation of Hydrological Models: Conceptual Basis, Methodological Approaches and a Proposal for a Code of Practice. Phys. Chem. Earth 2012, 42–44, 70–76. [Google Scholar] [CrossRef]
- Schaefli, B.; Gupta, H.V. Do Nash Values Have Value? Hydrol. Process. 2007, 21, 2075–2080. [Google Scholar] [CrossRef] [Green Version]
- Costa, V.; Fernandes, W.; Starick, Â. Identifying Regional Models for Flow Duration Curves with Evolutionary Polynomial Regression: Application for Intermittent Streams. J. Hydrol. Eng. 2020, 25, 04019059. [Google Scholar] [CrossRef]
- Mahmud, M.R.; Hashim, M.; Nadzri, M.; Reba, M. How Effective Is the New Generation of GPM Satellite Precipitation in Characterizing the Rainfall Variability over Malaysia ? Asia Pac. J. Atmos. Sci. 2017, 53, 375–384. [Google Scholar] [CrossRef]
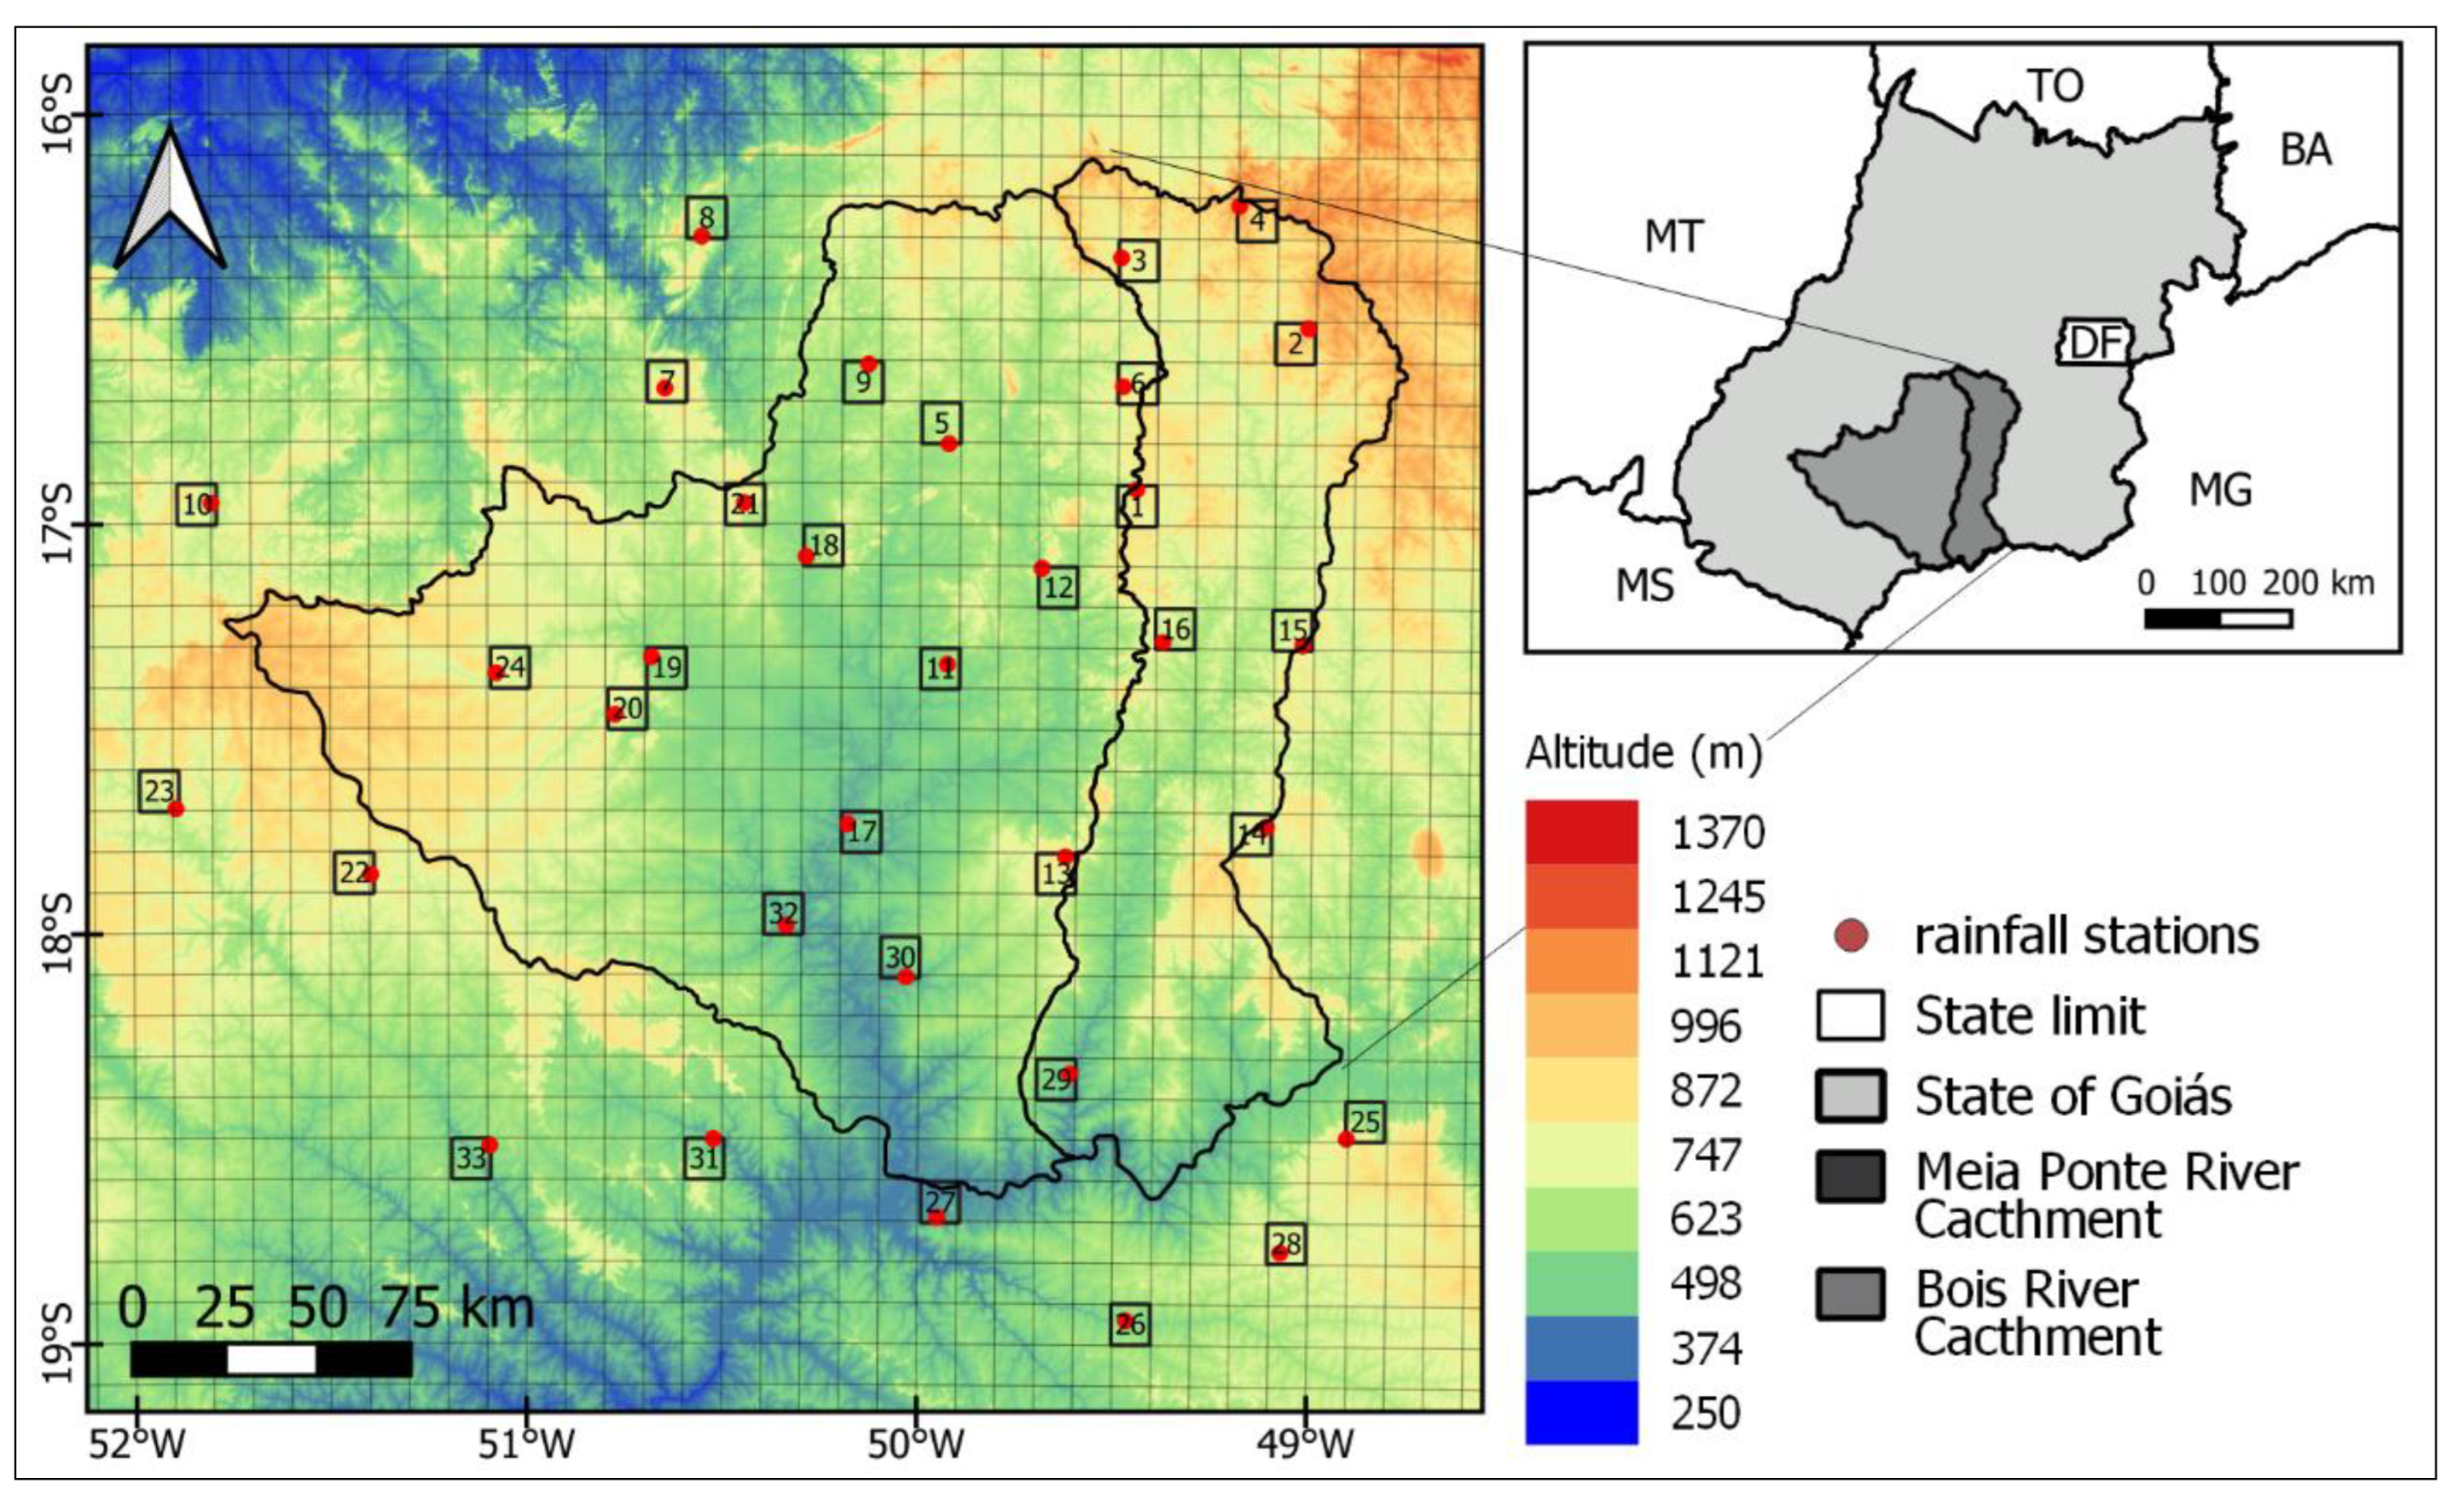


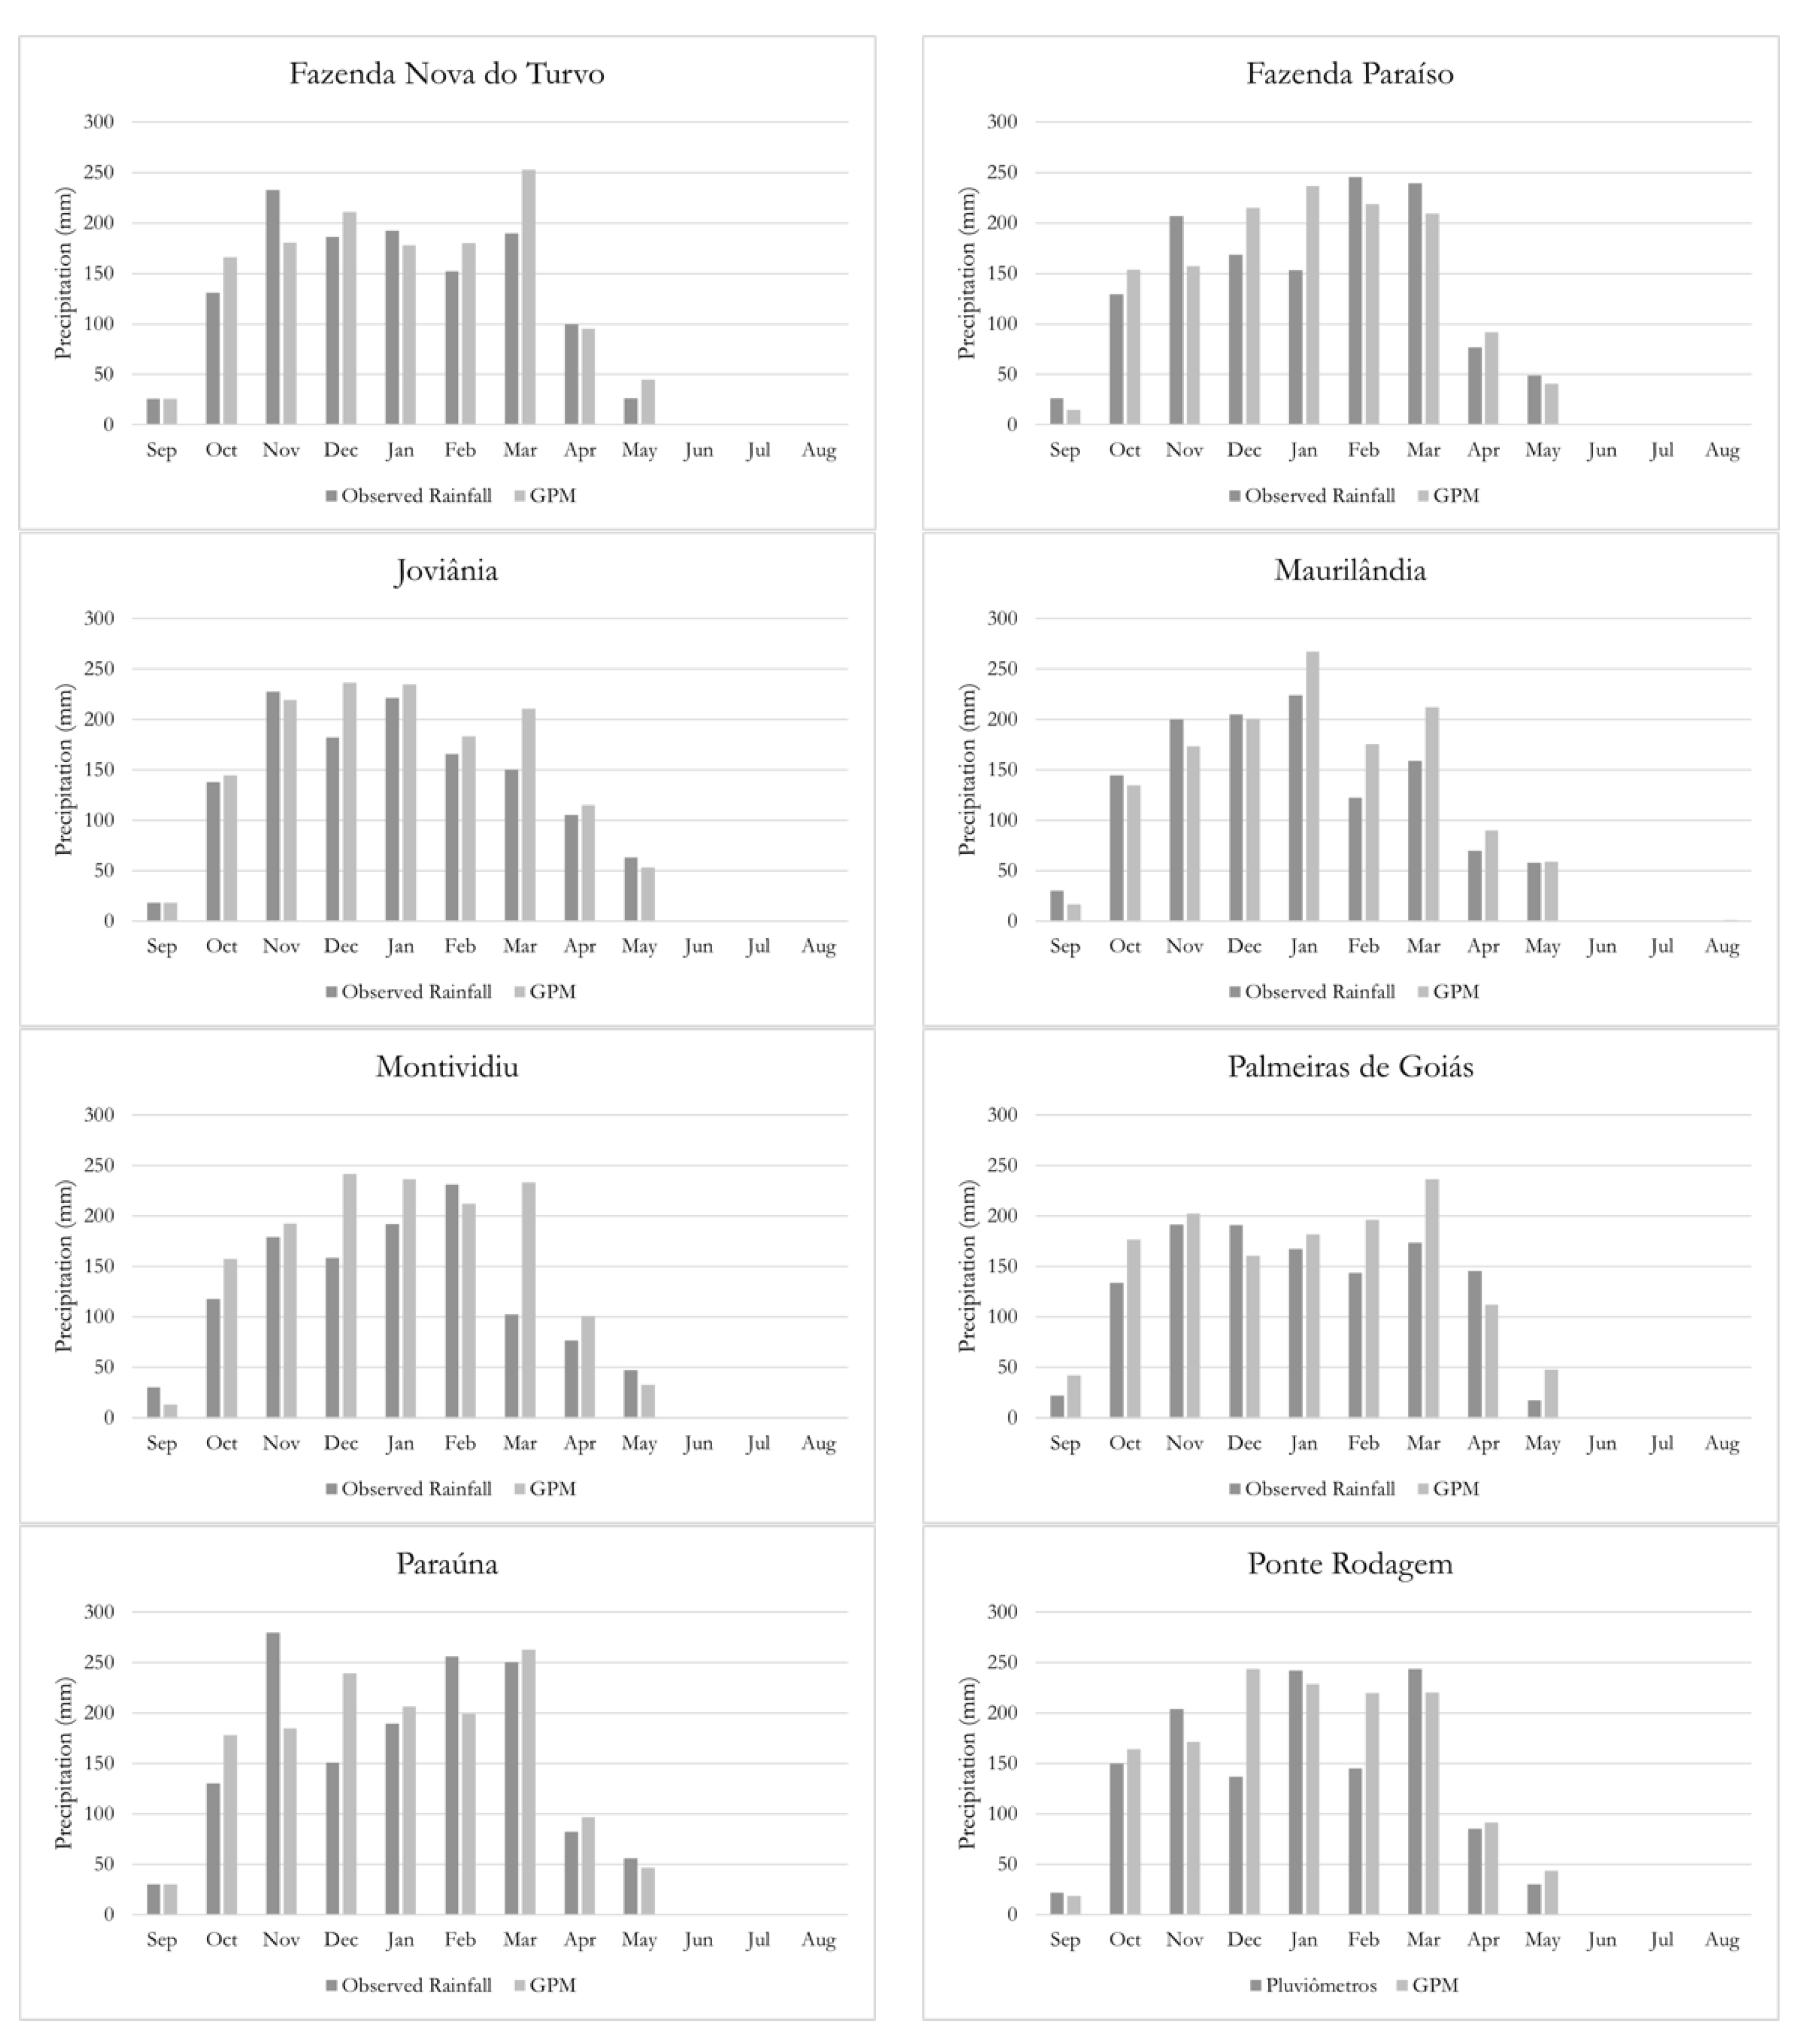
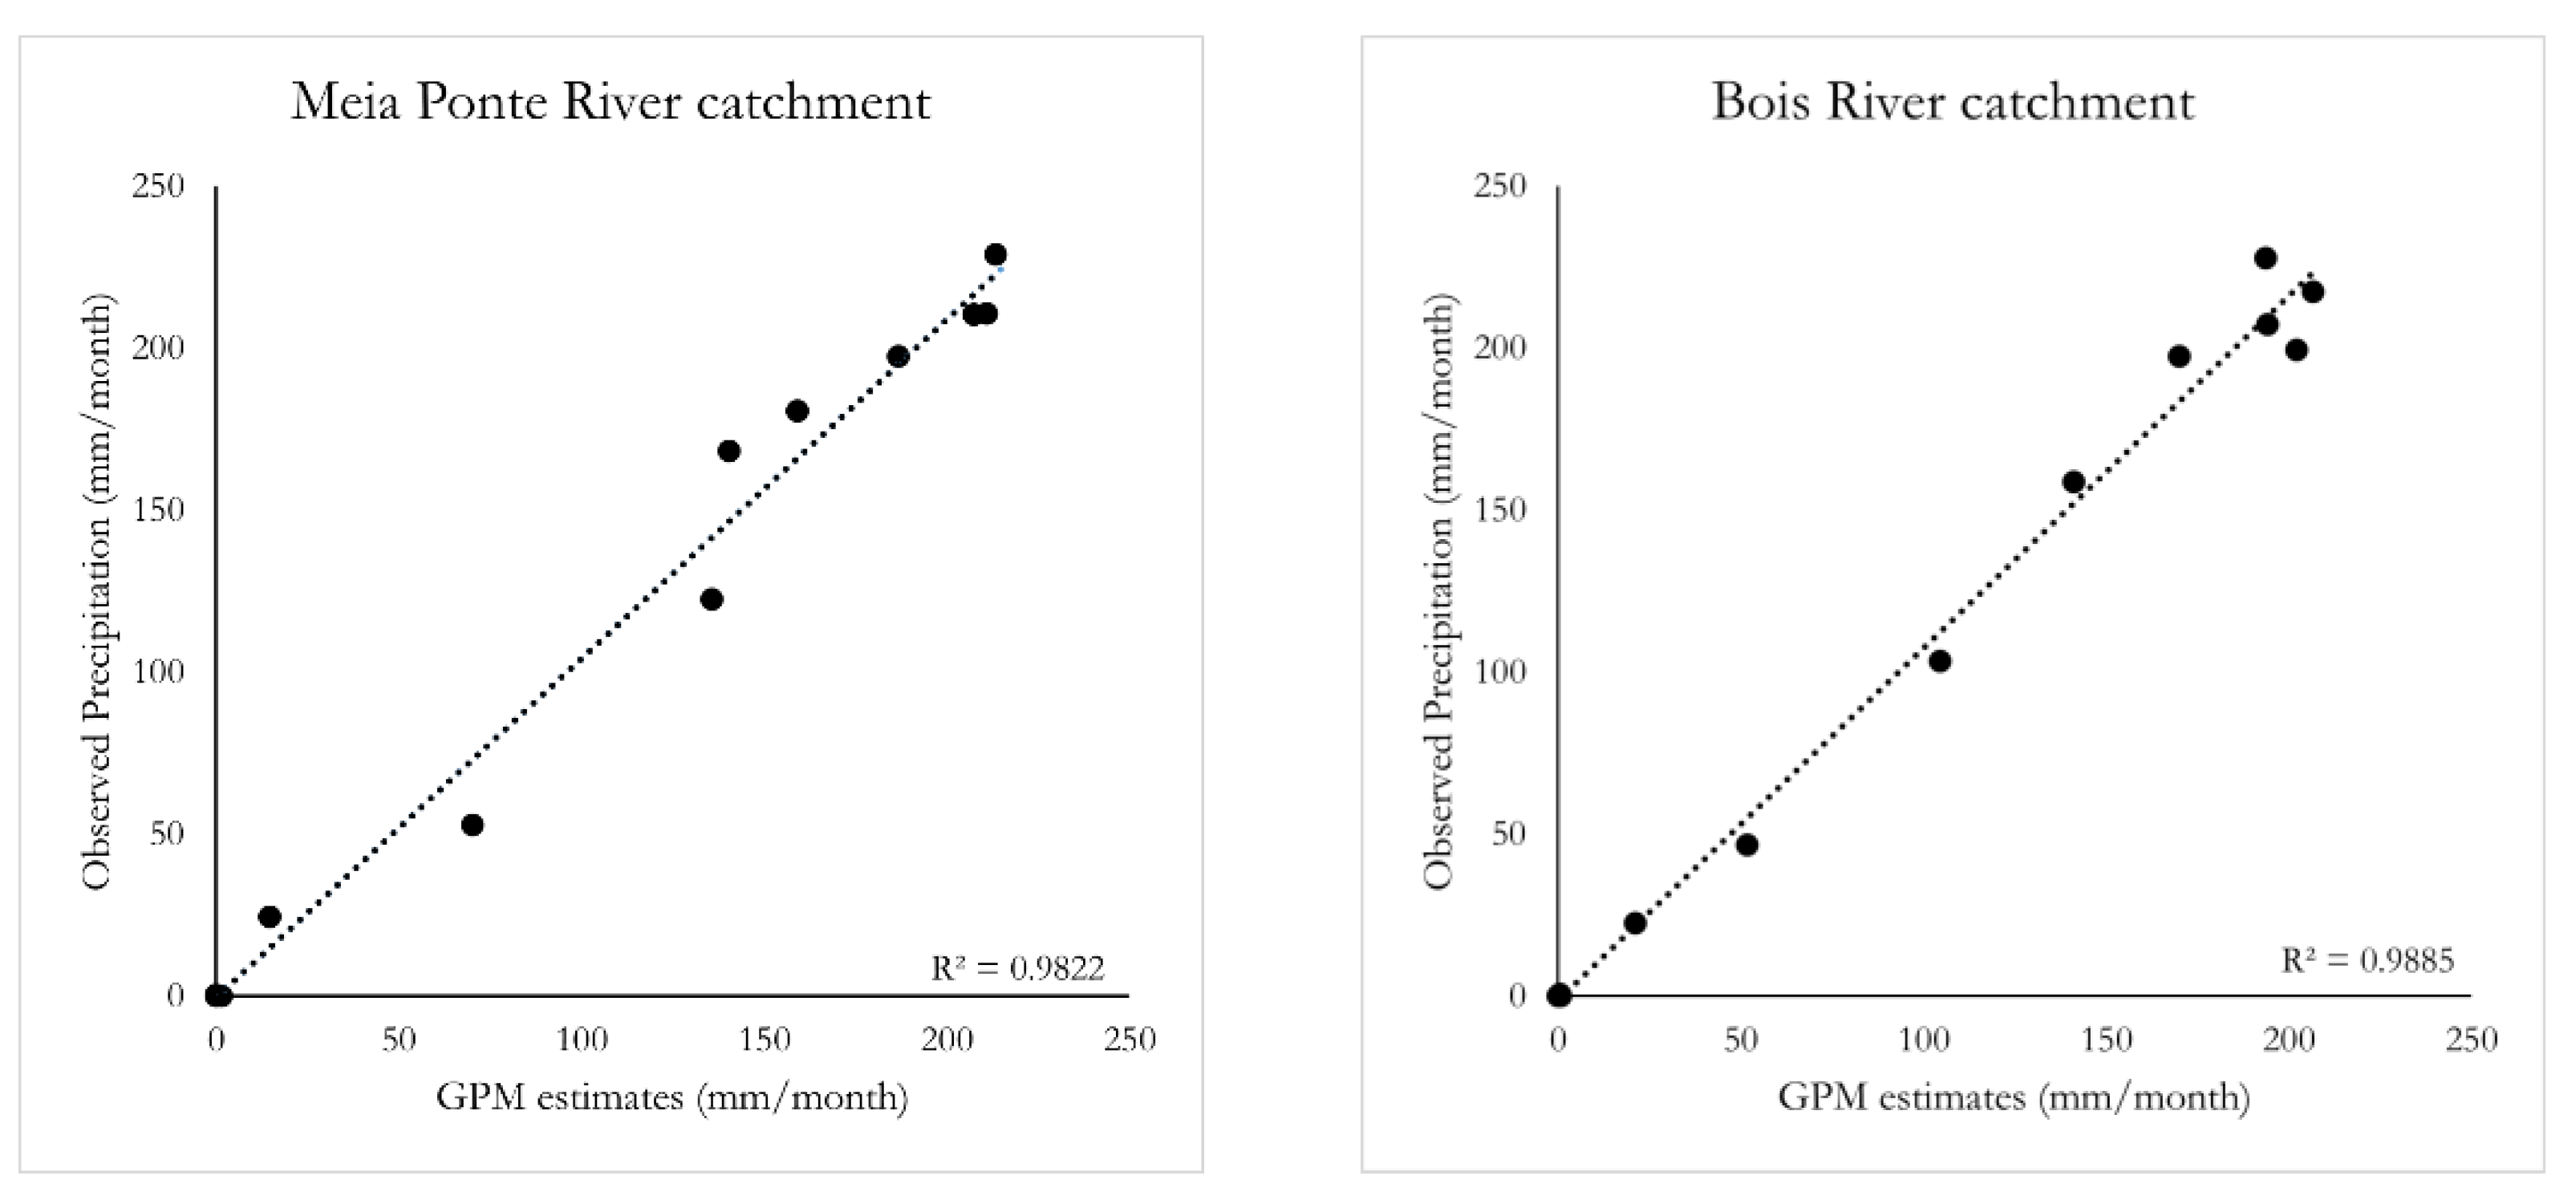

| Reference Number in Figure 1 | Code | Rainfall Gauging Station | Longitude | Latitude | Elevation (m) | Mean Annual Rainfall (mm) |
|---|---|---|---|---|---|---|
| 1 | 1649001 | Aragoiânia | −49.4522 | −16.9119 | 878 | 1711 |
| 2 | 1649004 | Goianápolis | −49.0203 | −16.5164 | 1007 | 1579 |
| 3 | 1649006 | Inhumas | −49.495 | −16.3467 | 746 | 1215 |
| 4 | 1649009 | Ouro Verde de Goiás | −49.1978 | −16.2186 | 1077 | 1159 |
| 5 | 1649010 | Palmeiras de Goiás | −49.9286 | −16.8031 | 605 | 1183 |
| 6 | 1649012 | Trindade | −49.4878 | −16.6611 | 781 | 1056 |
| 7 | 1650000 | Cachoeira de Goiás | −50.6492 | −16.6694 | 763 | 1140 |
| 8 | 1650001 | Córrego do Ouro | −50.5567 | −16.2983 | 565 | 1494 |
| 9 | 1650003 | Turvânia | −50.1328 | −16.6094 | 637 | 1372 |
| 10 | 1651000 | Caiapônia | −51.7994 | −16.9497 | 700 | 1300 |
| 11 | 1749000 | Edéia (Alegrete) | −49.9303 | −17.3414 | 590 | 1051 |
| 12 | 1749001 | Fazenda Boa Vista | −49.6908 | −17.1056 | 550 | 1147 |
| 13 | 1749002 | Joviânia | −49.6264 | −17.8094 | 845 | 1419 |
| 14 | 1749003 | Morrinhos | −49.1153 | −17.7328 | 808 | 1087 |
| 15 | 1749005 | Piracanjuba | −49.0272 | −17.2894 | 779 | 1543 |
| 16 | 1749009 | Cromínia | −49.3828 | −17.2847 | 694 | 1513 |
| 17 | 1750000 | Barra do Monjolo | −50.1808 | −17.7322 | 458 | 1151 |
| 18 | 1750001 | Fazenda Nova do Turvo | −50.2894 | −17.0792 | 529 | 1265 |
| 19 | 1750004 | Ponte Rodagem | −50.6819 | −17.3253 | 551 | 1123 |
| 20 | 1750008 | Fazenda Paraíso | −50.7742 | −17.4658 | 643 | 1263 |
| 21 | 1750013 | Paraúna | −50.4469 | −16.9489 | 684 | 1564 |
| 22 | 1751001 | Ponte Rio Doce | −51.3967 | −17.8564 | 751 | 1106 |
| 23 | 1751002 | Benjamin Barros | −51.8922 | −17.695 | 726 | 1550 |
| 24 | 1751004 | Montividiu | −51.0767 | −17.3647 | 734 | 1128 |
| 25 | 1848008 | Brilhante | −48.9028 | −18.4922 | 795 | 1356 |
| 26 | 1849000 | Ituiutaba | −49.4631 | −18.9411 | 498 | 1437 |
| 27 | 1849002 | Ipiaçu | −49.9486 | −18.6919 | 444 | 1447 |
| 28 | 1849006 | Avantiguara | −49.0697 | −18.7719 | 794 | 1316 |
| 29 | 1849016 | Ponte Meia Ponte | −49.6114 | −18.3394 | 483 | 1286 |
| 30 | 1850001 | Fazenda Aliança | −50.0314 | −18.1047 | 451 | 1307 |
| 31 | 1850002 | Quirinópolis | −50.5219 | −18.5011 | 443 | 1592 |
| 32 | 1850003 | Maurilândia | −50.3372 | −17.9797 | 479 | 1230 |
| 33 | 1851001 | Campo Alegre | −51.0936 | −18.5178 | 569 | 1845 |
| Goodness-of-Fit Metrics | Description | Equation | Perfect Value |
|---|---|---|---|
| Coefficient of correlation (CC) | Evaluates the agreement between satellite retrievals and ground-based rainfall measurements | 1 | |
| Mean absolute error–(MAE) mm | Measures the mean value of the absolute errors | 0 | |
| Root mean square error (RMSE) mm | Measures the mean value of the squared errors | 0 | |
| Percent bias (PBIAS) % | Expresses systematic errors | 0 | |
| Mean Error (ME) mm | Expresses the uncertainty in a measurement | ||
| Nash–Sutcliffe Efficiency (NSE) | Evaluates the predictive ability of hydrological models. | ||
| Coefficient of Persistence (CP) | Compares the performance of the model being used and performance of the persistent | 1 |
| Gauging Station with Reference Number | CC | MAE (mm) | RMSE (mm) | PBIAS (%) | ME (mm) | NSE | CP |
|---|---|---|---|---|---|---|---|
| 16-Cromínia | 0.59 (0.57) | 3.31 (4.07) | 7.29 (9.48) | 3.10 (−9.4) | 0.11 (−0.39) | −0.16 (0.27) | 0.02 (0.56) |
| 2-Goianápolis | 0.63 (0.48) | 3.40 (4.17) | 6.78 (8.94) | 4.57 (3.7) | 0.17 (0.14) | 0.07 (0.04) | 0.37 (0.43) |
| 3-Inhumas | 0.53 (0.49) | 3.47 (3.97) | 7.21 (8.66) | 6.01 (15.6) | 0.22 (0.52) | −0.20 (0.08) | 0.17 (0.47) |
| 29-Meia Ponte | 0.57 (0.51) | 3.37 (3.84) | 7.79 (9.11) | −1.03 (2.7) | −0.04 (0.09) | 0.05 (0.17) | 0.33 (0.47) |
| Gauging Station with Reference Number | CC | MAE (mm) | RMSE (mm) | PBIAS (%) | ME (mm) | NSE | CP |
|---|---|---|---|---|---|---|---|
| 17-Barra do Monjolo | 0.61 (0.44) | 3.15 (3.93) | 6.99 (9.26) | 22.05 (23.6) | 0.7 (0.74) | −0.36 (−0.11) | −0.16 (0.31) |
| 11-Edeia (Alegrete) | 0.40 (0.35) | 4.04 (4.58) | 9.82 (11.09) | 1.32 (30.4) | 0.05 (0.88) | −0.33 (−0.24) | 0.12 (0.37) |
| 30-Fazenda Aliança | 0.49 (0.38) | 3.45 (4.36) | 7.55 (10.58) | 2.28 (−1) | 0.08 (−0.04) | −0.25 (0.01) | 0.05 (0.39) |
| 12-Fazenda Boa Vista | 0.65 (0.6) | 3.22 (3.86) | 6.42 (7.92) | −0.24 (15.8) | −0.01 (0.5) | 0.17 (0.29) | 0.4 (0.59) |
| 18-Fazenda Nova do Turvo | 0.44 (0.39) | 3.61 (4.16) | 8.86 (10.88) | 7.95 (5.5) | 0.27 (0.19) | −0.89 (−0.16) | −0.35 (0.32) |
| 20-Fazenda Paraíso | 0.39 (0.28) | 3.81 (4.63) | 8.54 (10.31) | 3.37 (5.9) | 0.12 (0.2) | −0.26 (−0.25) | 0.22 (0.34) |
| 13-Joviânia | 0.70 (0.61) | 3.04 (3.87) | 6.36 (8.47) | 11.24 (−0.2) | 0.39 (−0.01) | 0.19 (0.31) | 0.34 (0.57) |
| 32-Muarilândia | 0.46 (0.37) | 3.44 (4.06) | 7.84 (9.56) | 9.68 (8.3) | 0.32 (0.28) | −0.41 (−0.18) | −0.03 (0.38) |
| 24-Montividiu | 0.50 (0.47) | 3.34 (3.86) | 7.37 (8.4) | 25.18 (25.9) | 0.78 (0.8) | −0.27 (−0.04) | 0.07 (0.37) |
| 5-Palmeiras de Goiás | 0.58 (0.46) | 3.37 (4.06) | 6.71 (8.78) | 14.25 (14.5) | 0.46 (0.47) | −0.25 (0) | 0.13 (0.47) |
| 21-Paraúna | 0.41 (0.4) | 4.08 (4.86) | 10.56 (12.1) | 1.32 (−7.7) | 0.05 (−0.33) | −0.48 (−0.11) | 0.05 (0.4) |
| 19-Ponte Rodagem | 0.41 (0.28) | 3.87 (4.81) | 8.92 (11.36) | 11.31 (24.8) | 0.39 (0.76) | −0.52 (−0.3) | 0.06 (0.34) |
| Gauging Station with Reference Number | 95th Empirical Quantile Rainfall Gauging Station | 95th Empirical Quantile GPM | CC | MAE | RMSE | PBIAS | ME | NSE | CP |
|---|---|---|---|---|---|---|---|---|---|
| 16-Cromínia | 25.84 | 19.26 | 0.62 | 25.83 | 28.99 | −57.6 | −24.8 | −2.56 | −0.44 |
| 2-Goianápolis | 23.92 | 24.12 | 0.33 | 19.02 | 23.39 | −50.4 | −17.91 | −3.48 | −1.65 |
| 3-Inhumas | 21.42 | 21.39 | 0.55 | 22.1 | 24.59 | −54.1 | −20.73 | −3.78 | −2.34 |
| 29-Meia Ponte | 25.26 | 21.21 | 0.43 | 21.74 | 26.05 | −58.7 | −20.76 | −2.14 | −0.34 |
| Gauging Station with Reference Number | 95th Empirical Quantile Rainfall Gauging Station | 95th Empirical Quantile GPM | CC | MAE | RMSE | PBIAS | ME | NSE | CP |
|---|---|---|---|---|---|---|---|---|---|
| 17-Barra do Monjolo | 22.30 | 21.66 | −0.18 | 20.62 | 26.44 | −51.6 | −17.39 | −4.8 | −4.14 |
| 11-Edeia (Alegrete) | 21.60 | 20.57 | 0.41 | 27.02 | 31.15 | −62.5 | −25.32 | −3.35 | −0.7 |
| 30-Fazenda Aliança | 27.18 | 21.34 | 0.21 | 28.15 | 32.11 | −68 | −26.69 | −4.52 | −1.55 |
| 12-Fazenda Boa Vista | 20.74 | 18.06 | 0.82 | 19.13 | 20.65 | −48.5 | −17.56 | −0.87 | −0.78 |
| 18-Fazenda Nova do Turvo | 22.72 | 19.64 | 0.52 | 34.62 | 38.2 | −69 | −33.9 | −4.4 | −0.61 |
| 20-Fazenda Paraíso | 24.70 | 19.64 | 0.06 | 25.29 | 29.07 | −74.7 | −25.29 | −5.79 | −2.62 |
| 13-Joviânia | 24.82 | 24.29 | 0.41 | 22.34 | 24.61 | −42.4 | −16.54 | −1.68 | −0.07 |
| 32-Muarilândia | 22.90 | 18.37 | −0.28 | 21.1 | 25.73 | −52.1 | −15.6 | −4.64 | −1.16 |
| 24-Montividiu | 19.36 | 20.04 | 0.33 | 19.13 | 22.35 | −54.2 | −19.13 | −4.73 | −1.73 |
| 5-Palmeiras de Goiás | 18.50 | 19.83 | 0.57 | 23.57 | 26.8 | −59.8 | −21.43 | −2.25 | −0.36 |
| 21-Paraúna | 28.18 | 16.54 | −0.2 | 35.45 | 41.01 | −47 | −19.81 | −3.75 | −1.42 |
| 19-Ponte Rodagem | 22.74 | 20.87 | −0.13 | 28.19 | 35.59 | −62.2 | −22.89 | −3.44 | −1.22 |
| Gauging Station with Reference Number | CC | MAE (mm) | RMSE (mm) | PBIAS (%) | ME (mm) | NSE | CP |
|---|---|---|---|---|---|---|---|
| 16-Cromínia | 0.98 | 12.41 | 17.96 | 0.03 | 3.43 | 0.96 | 0.9 |
| 2-Goianápolis | 0.95 | 18.26 | 28.45 | 0.05 | 5.22 | 0.9 | 0.75 |
| 3-Inhumas | 0.96 | 21.68 | 27.06 | 0.06 | 6.64 | 0.91 | 0.84 |
| 29-Meia Ponte | 0.97 | 13.23 | 23.11 | −1.03 | −1.14 | 0.93 | 0.83 |
| Gauging Station with Reference Number | CC | MAE (mm) | RMSE (mm) | PBIAS (%) | ME (mm) | NSE | CP |
|---|---|---|---|---|---|---|---|
| 17-Barra do Monjolo | 0.92 | 28.63 | 44.60 | 0.22 | 21.41 | 0.67 | 0.41 |
| 11-Edeia (Alegrete) | 0.96 | 17.89 | 25.96 | 0.01 | 1.49 | 0.92 | 0.86 |
| 30-Fazenda Aliança | 0.97 | 12.89 | 22.84 | 0.02 | 2.40 | 0.93 | 0.85 |
| 12-Fazenda Boa Vista | 0.97 | 16.06 | 22.48 | 0.00 | −0.27 | 0.93 | 0.88 |
| 18-Fazenda Nova do Turvo | 0.95 | 20.06 | 28.67 | 0.08 | 8.19 | 0.89 | 0.76 |
| 20-Fazenda Paraíso | 0.93 | 24.58 | 34.39 | 0.03 | 3.64 | 0.86 | 0.75 |
| 13-Joviânia | 0.98 | 15.12 | 24.86 | 0.11 | 11.93 | 0.91 | 0.80 |
| 32-Muarilândia | 0.96 | 18.75 | 27.25 | 0.10 | 9.79 | 0.89 | 0.78 |
| 24-Montividiu | 0.91 | 32.17 | 49.35 | 0.25 | 23.80 | 0.60 | 0.17 |
| 5-Palmeiras de Goiás | 0.94 | 24.92 | 31.95 | 0.14 | 14.08 | 0.84 | 0.67 |
| 21-Paraúna | 0.96 | 18.75 | 27.25 | 0.10 | 9.79 | 0.89 | 0.78 |
| 19-Ponte Rodagem | 0.91 | 32.17 | 49.35 | 0.25 | 23.80 | 0.60 | 0.17 |
Publisher’s Note: MDPI stays neutral with regard to jurisdictional claims in published maps and institutional affiliations. |
© 2022 by the authors. Licensee MDPI, Basel, Switzerland. This article is an open access article distributed under the terms and conditions of the Creative Commons Attribution (CC BY) license (https://creativecommons.org/licenses/by/4.0/).
Share and Cite
Duarte, L.V.; Formiga, K.T.M.; Costa, V.A.F. Analysis of the IMERG-GPM Precipitation Product Analysis in Brazilian Midwestern Basins Considering Different Time and Spatial Scales. Water 2022, 14, 2472. https://doi.org/10.3390/w14162472
Duarte LV, Formiga KTM, Costa VAF. Analysis of the IMERG-GPM Precipitation Product Analysis in Brazilian Midwestern Basins Considering Different Time and Spatial Scales. Water. 2022; 14(16):2472. https://doi.org/10.3390/w14162472
Chicago/Turabian StyleDuarte, Luíza Virgínia, Klebber Teodomiro Martins Formiga, and Veber Afonso Figueiredo Costa. 2022. "Analysis of the IMERG-GPM Precipitation Product Analysis in Brazilian Midwestern Basins Considering Different Time and Spatial Scales" Water 14, no. 16: 2472. https://doi.org/10.3390/w14162472
APA StyleDuarte, L. V., Formiga, K. T. M., & Costa, V. A. F. (2022). Analysis of the IMERG-GPM Precipitation Product Analysis in Brazilian Midwestern Basins Considering Different Time and Spatial Scales. Water, 14(16), 2472. https://doi.org/10.3390/w14162472


