Article

Efficient Removal of Organic Matter from Biotreated Coking Wastewater by Coagulation Combined with Sludge-Based Activated Carbon Adsorption

School of Chemical and Environmental Engineering, China University of Mining and Technology (Beijing), Beijing 100083, China
*
Author to whom correspondence should be addressed.
Water 2022, 14(15), 2446; https://doi.org/10.3390/w14152446
Submission received: 7 July 2022 / Revised: 3 August 2022 / Accepted: 4 August 2022 / Published: 7 August 2022
(This article belongs to the Section Wastewater Treatment and Reuse)

Abstract

:
Coagulation–adsorption can be effective in the removal of the organic matters remaining in biotreated coking wastewater (BTCW), and cheap and efficient adsorbents benefit the widespread application of this technology. In this study, a sludge-based activated carbon (SAC) was prepared using zinc chloride to activate sludge pyrolysis carbon for the treatment of BTCW with coagulation as the pretreatment process. According to Brunauer-Emmett-Teller (BET) and the scanning electron microscope (SEM) analysis, the SAC exhibited a specific surface area of 710.175 m2/g and well-developed pore structure. The removal characteristics of the organic matter in BTCW were systematically studied. The results show that 76.79% of the COD in the BTCW was removed by coagulation combined with SAC adsorption, and the effluent COD was below the discharge limit (80 mg/L) (GB16171-2012), with the optimal dosages of polyaluminum chloride and SAC being 150 mg/L and 4 g/L, respectively. Compared with a commercial powdered activated carbon (PAC) (48.26%), the SAC achieved a similar COD removal efficiency (47.74%) at a higher adsorption speed. The removal efficiencies of the hydrophobic components (77.27%) and fluorescent components by SAC adsorption were higher than those by PAC adsorption. The SAC also had an excellent removal effect on complex organic compounds and colored substances in the BTCW, as revealed by UV-vis spectra analyses.

Graphical Abstract

1. Introduction

Coking wastewater is a typical industrial wastewater produced from coking plants in the process of coal coking, gas purification, and by-product recovery [1,2,3,4]. It is a typical organic wastewater containing a variety of refractory compounds. Biological methods are commonly used in the treatment of coking wastewater as they are efficient and economic. However, the COD value of the secondary biochemical effluent of coking wastewater is generally above 150 mg/L with several remaining refractory organics, such as aromatic hydrocarbons, long-chain alkanes, benzene series, and polycyclic aromatic hydrocarbons [5]. The improved discharge standards of coking wastewater in China and even the zero-discharge strategy in some regions have made secondary biological treatment insufficient for the treatment of coking wastewater. Therefore, effective advanced treatment technologies for coking wastewater must be adopted, such as coagulation, adsorption, enhanced biological treatment, advanced oxidation (AOPs), or a combination of these techniques [6,7].
Based on our previous study, macromolecular organics with a molecular weight greater than 30 kDa in biotreated coking wastewater (BTCW) accounted for about 20%, as revealed by COD measurement [8]. Coagulation can remove suspended solids and macromolecular matter [9,10,11,12], which can be used as a pretreatment process for BTCW. Adsorption has been reported to effectively remove organic pollutants from BTCW in recent years [6,7,9], especially micromolecular organics. Coagulation combined with adsorption has been found to be an effective technology in the advanced treatment of textile wastewater [13] and landfill leachate [14] and can be efficient in the removal of organics in BTCW as well. The development of economic adsorbents, such as sludge-based activated carbon, has great significance for the development of adsorption technology [15].
With the development of China’s industrialization and urbanization, the amount of municipal sludge has grown rapidly [16,17,18]. It was reported that 200 million tons of sewage was treated and more than 60 million tons of municipal sludge was produced (with 80% moisture content) every day in China in 2019 [17,18], posing a huge challenge to waste management. The pyrolysis of sludge into biochar (adsorbents) is one of more cost-effective and environmentally friendly alternatives, as opposed to the commonly applied disposal methods for sludge [19]. Sludge-based activated carbon has a developed pore structure, large specific surface area, and abundant surface functional groups [20], which showed good removal effects on antibiotics, heavy metal ions, and organic pollutants in wastewater [20,21,22]. It is a potential alternative adsorbent for wastewater treatment [23,24]. However, SAC has not been applied in the advanced treatment of coking wastewater by current studies. Moreover, the understanding of the organic matter adsorption characteristics of BTCW is insufficient. More research on how SAC adsorption performs in the removal of the organic pollutants in BTCW is needed.
In this study, a SAC was produced from municipal sludge to remove the organic pollutants in BTCW with a pretreatment process of coagulation. Moreover, adsorption by a commercial PAC was applied for comparison. The adsorbents were characterized, the optimal conditions for coagulation and adsorption were studied, and the removal characteristics of the organic matter in BTCW were systematically analyzed. We believe that these results can enrich the knowledge of advanced treatment of coking wastewater.

2. Materials and Methods

2.1. BTCW Characteristics

The BTCW used in this study was collected from a coking wastewater treatment plant in northern China, which adopted a secondary treatment technology of the hydrolysis acidification-anoxic/oxic (HA-A/O) process. Characteristics of the BTCW are shown in Table 1, with the COD value ranging from 200 mg/L to 250 mg/L.

2.2. Sludge-Based Activated Carbon Preparation

The dehydrated sludge (with 80% moisture content) obtained from a municipal wastewater treatment plant in Beijing, China, was used to produce SAC according to the method of Li et al. [23,24]. First, the sludge was dried, pulverized, and sieved to a uniform size of 200 mesh. Then, the sludge was placed in a tube furnace, heated to 500 °C, and stayed for 30 min in a nitrogen atmosphere. After cooling, the pyrolyzed solid was soaked in 6 mol/L HCl for 6 h, washed with deionized water to a neutral pH, and dried. Next, it was soaked in 8 mol/L ZnCl2 with stirring for 15 h for activation, and the mass volume ratio of solid to ZnCl2 solution was 1:3. After filtration and drying, the solid was placed in a tube furnace, heated to 800 °C, and stayed for 1 h in a nitrogen atmosphere. After cooling, the solid was washed with HCl, subsequently washed with deionized water to a neutral pH, and dried at 105 °C for 24 h. The activated carbon prepared under the above conditions was named SAC.

2.3. Adsorbent Characterization

The pore structure characteristics of SAC and PAC were determined by using a gas adsorption analyzer (Quantachrome, NOVA 2000e, Boynton Beach, FL, USA) at 77.35 K. The surface properties of the two adsorbents before and after adsorption were analyzed by using a scanning electron microscope (JEOL, JSM-7800F, Tokyo, Japan), respectively. The surface organic functional groups were studied by using a Fourier transform infrared spectroscopy (Thermo Scientific, Nicolet iS10, Waltham, MA, USA). The spectra were recorded in the wavenumber range of 4000~400 cm−1. The XRD patterns were studied by using an X-ray diffractometer (Rigaku, Ultima IV, Tokyo, Japan).

2.4. Coagulation Pretreatment

The coagulation experiment was performed at room temperature. Polyaluminum chloride (10 g/L) was used as the coagulant. An amount of 200 mL BTCW was initially mixed at a speed of 250 r/min for 30 s. After the coagulant’s addition, the system was mixed at a speed of 200 r/min for another 90 s. Then, the speed was reduced to 40 r/min for 30 min. Finally, the mixture was allowed to stand for 30 min, and the supernatant samples were extracted at about 2 cm below the solution’s surface with a syringe for further analyses.

2.5. Adsorption Treatment

After the coagulation pretreatment, adsorption was performed with 20 mL BTCW at room temperature, with pH values between 7 and 8, and the vibration speed at 200 rpm/min. Then, the solution was filtered through a 0.45 μm cellulose membrane filter for further analysis. The effects of the adsorption time and adsorbent dosage on the adsorption performance were investigated for both the SAC produced in this study and a commercial PAC (CAS No. 7440-44-0) purchased from Macklin (Shanghai, China).

2.6. Dissolved Organic Matter (DOM) Fractionation

The DOM in the wastewater was classified into three different components using XAD-4 and XAD-8 resins, namely, hydrophilic fraction (HPI), transphilic fraction (TPI), and hydrophobic fraction (HPO) [6,25]. The resins were cleaned with methanol before use until no organic matters released and no changes in the ultraviolet spectrum of methanol were detected. An amount of 50 mL BTCW was acidified by using HCl until the pH value was 2, and then it passed through the XAD-8 column at a speed of 90 mL/h. The organic matters adsorbed on the XAD-8 resin were considered as the hydrophobic fraction (HPO). The effluent from the XAD-8 was subsequently passed through the XAD-4 column at a speed of 120 mL/h, and the substances adsorbed on the XAD-4 resin were considered as the transphilic fraction (TPI). Those remaining in the effluent of XAD-4 were classified as the hydrophilic fraction (HPI). The COD of raw wastewater was defined as DOM1. The COD values of the effluents from XAD-8 and XAD-4 were defined as DOM2 and DOM3, respectively.
The concentration of each DOM fraction was calculated as follows:
Hydrophobic fraction = DOM1 − DOM2
Transphilic fraction = DOM2 − DOM3
Hydrophilic fraction = DOM3

2.7. Three-Dimensional Excitation–Emission Matrix (3D-EEM) Analysis

The three-dimensional fluorescence spectra were measured by using an F-7000 fluorescence spectrophotometer. The excitation wavelengths (Ex) were set as 200~400 nm, and the emission wavelengths (Em) were 220–500 nm. The wavelength interval was 5 nm, and the scanning speed was 12000 nm/min.
The 3D-EEM spectrum is divided into 5 regions, including Region I (Ex/Em = 200~250 nm/260~330 nm), Region II (Ex/Em = 200~250 nm/330~380 nm), Region III (Ex/Em = 200~250 nm/>380 nm), Region IV (Ex/Em = 250~450 nm/260~380 nm), and Region V (Ex/Em = 250~450 nm/>380 nm). The fluorescence area integration (FRI) was used to quantitatively analyze the EEM spectrum with MATLAB 2016b [26,27]. Before the FRI analysis, blank subtraction and interpolation methods were used to correct the area of the 3D-EEM spectrum affected by Rayleigh scattering and Raman scattering.

2.8. UV-Vis Spectrum Analysis

The UV-Vis absorption spectrum was measured by using a DR6000 spectrophotometer. A 1 cm quartz cuvette was scanned in the range of 190–700 nm to measure the absorbance of the sample. Nonlinear fitting on the absorbance of different bands was performed in R 4.0.5.

2.9. Adsorption–Desorption Performance Analysis

To evaluate the SAC regeneration ability, we carried out adsorption–desorption experiments for SAC. Cyclic adsorption–desorption batches were performed by employing a 0.1 mol/L NaOH solution as the regenerant. SAC with adsorbed pollutants was treated with 0.1 mol/L NaOH for 1 h, with a mass-to-volume ratio of 1 g/10 mL. Afterwards, the desorbed SAC was rinsed and dried, exposed again to BTCW in a flask and agitated with 200 rpm at room temperature. The COD removal efficiency was measured for each repetition.

3. Results and Discussion

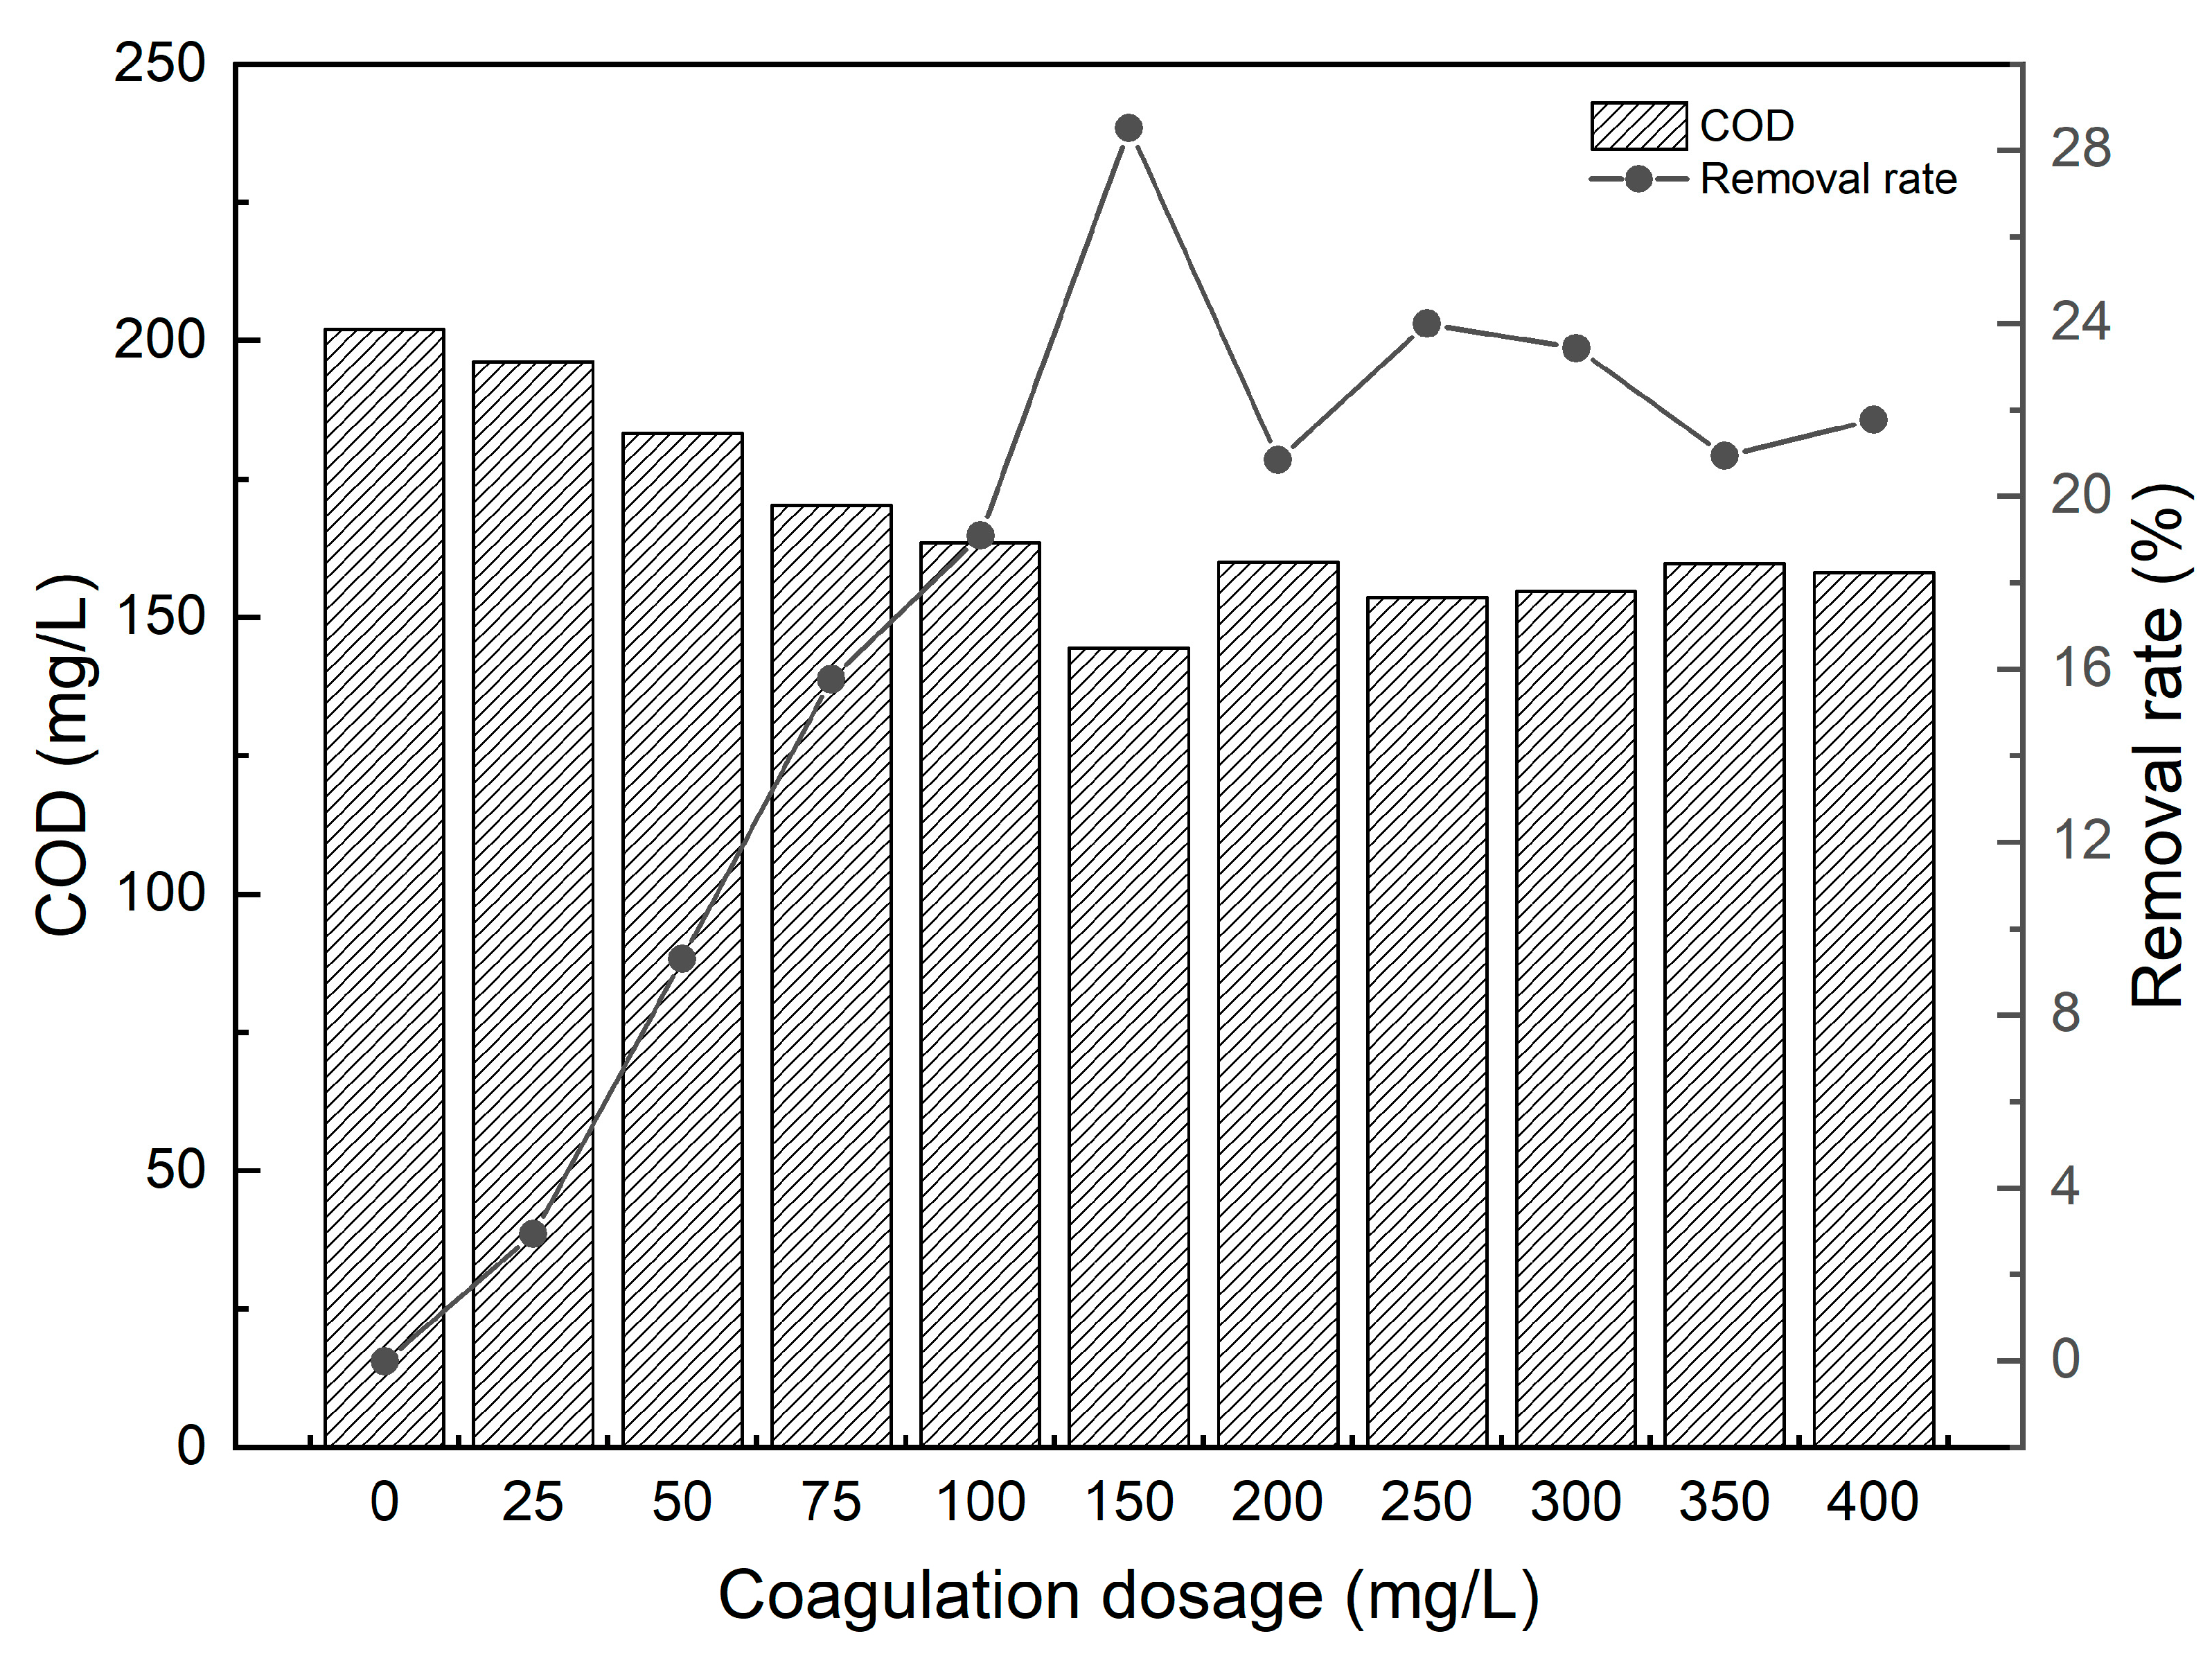
3.1. Optimal Coagulant Dosage and Coagulation Efficiency

Coagulant dosage, as a fundamental parameter, can affect the coagulation performance and determine the coagulation efficiency [28,29]. The effect of the polyaluminum chloride dosage on the coagulation capability for BTCW treatment was investigated in the jar test. The results are shown in Figure 1. The COD removal efficiency of BTCW greatly increased with the increase in the coagulant dosage in the range from 0 to 150 mg/L. The COD removal efficiency decreased and then stabilized with the increase in coagulant dosage in the range from 150 mg/L to 400 mg/L, which may be attributed to the repulsive force between the negatively charged flocs [28,30]. Thus, the optimal dosage of the polyaluminum chloride was 150 mg/L, and the optimal COD removal efficiency of BTCW was 28.52%.

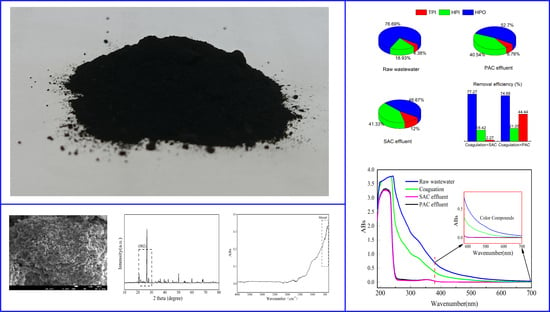
3.2. Adsorbent Characterization

3.2.1. Pore Structure of the Adsorbents

The Brunauer-Emmett-Teller (BET) results of SAC and PAC used in this study are shown in Table 2. For the SAC, the specific surface area (SBET) before adsorption was 710.175 m2/g, the total pore volume (Vtotal) was 0.433 cm3/g, and the average adsorption pore size (Dp) was 2.436 nm. In general, SAC showed a slightly smaller SBET than PAC (789.189 m2/g), but it had larger Smicro and Vmicro values (Table 2). After adsorption treatment, the SBET and Vtotal of both SAC and PAC decreased (Table 2), which indicates that organic pollutants entered the internal pores of the adsorbents during the adsorption process. Micropores play an important role in adsorption [31]. Organic pollutants with smaller molecular sizes can be more easily adsorbed into the SAC and PAC through pore filling, and some of the remaining micropores after adsorption were newly formed from mesopores [1,25]. Although the volume of the mesopores (Vmeso) accounted for a large proportion in the adsorbents, they only provided surface adsorption due to their large pore size [32] and did not contribute much to the organics’ removal. Therefore, in spite of the difference between the Vmeso values of SAC and PAC, both of the adsorbents can achieve efficient adsorption of organic matter.

3.2.2. Surface Morphology of the Adsorbents

The XRD patterns of SAC and PAC are shown in Figure S1a. SAC and PAC both exhibited a peak in the diffraction angle range of 20°~30° (Peak 002), which indicates that the crystallite structures of the SAC and PAC had the same spatial arrangement [33]. However, the 002 peak intensity of the SAC was stronger than that of the PAC, indicating that the SAC fabrication process produced more microcrystals, most of which might be similar to graphitized non-crystallites [33].
The FTIR spectra of SAC and PAC are shown in Figure S1b. It can be seen that the SAC had almost no functional groups, while the PAC had a C-OH bond stretching vibration at 1037 cm−1. C-OH is a hydrophilic group [34], which enhances the affinity of PAC for hydrophilic organics [7,25,35,36]. C-OH also occupied a certain hydrophobic adsorption site, resulting in a weaker adsorption capacity of PAC for hydrophobic organics than SAC. This is consistent with the results in the following part.
The SEM images of SAC and PAC before and after adsorption are shown in Figure S2a–d. The surface of the SAC was uneven and rough, and the interior presented a loose and porous morphology, indicating a rich pore structure of SAC. This is consistent with the results of specific surface analysis (Table 2). The abundant pore structure is beneficial for increasing the contact area between the adsorbent and adsorbate, providing more adsorption sites [22,37]. Correspondingly, it was observed that the pore structure on the surface of SAC significantly reduced after adsorption (Figure S2b), indicating that the pollutants entered the interior and blocked the pores during the adsorption process.

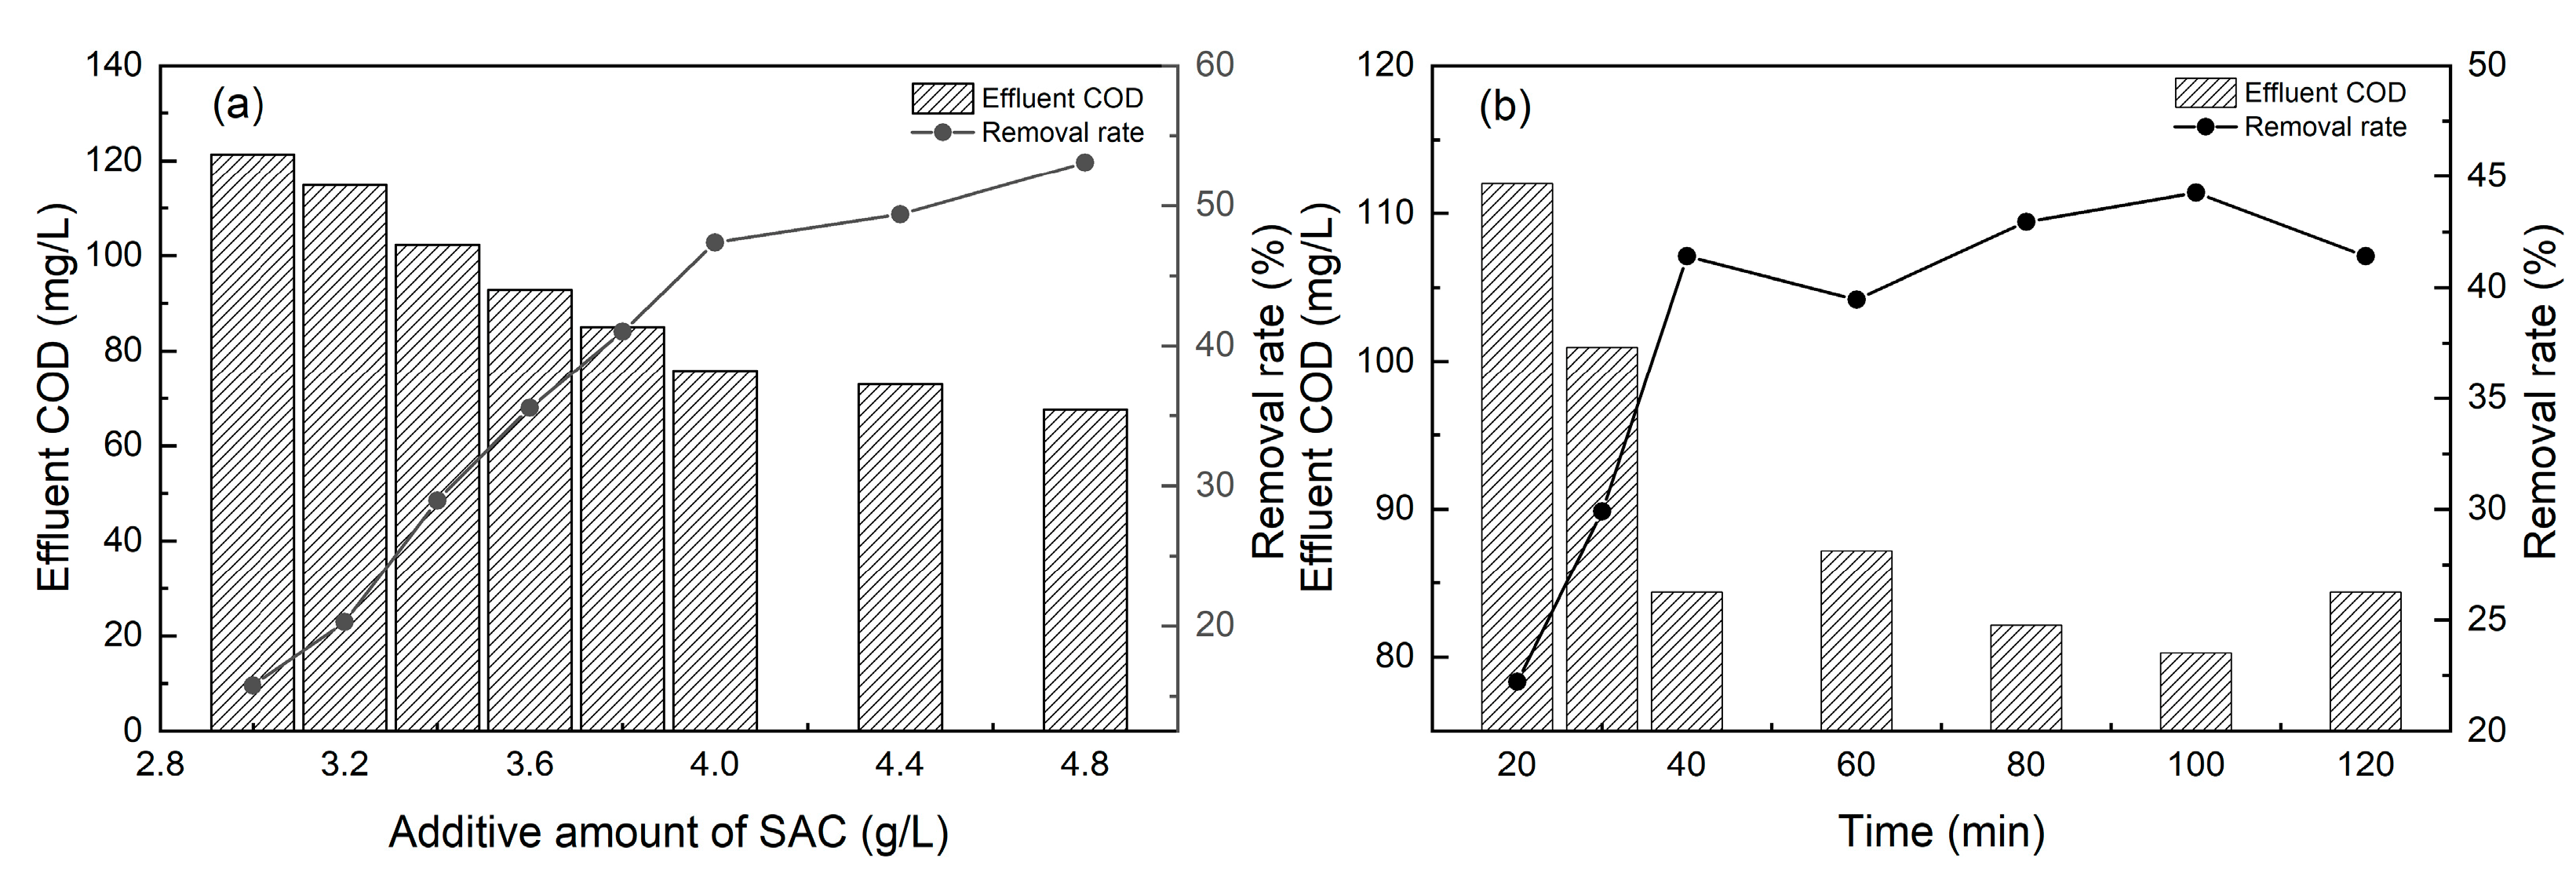
3.3. Optimal Conditions of Adsorption

The effect of SAC dosage on the COD removal efficiency of BTCW is shown in Figure 2a. With the increase in SAC dosage in the range from 3.0 to 4.0 g/L, the COD removal efficiency of BTCW increased, reaching 47.74% at the dosage of 4.0 g/L. When the SAC dosage was over 4.0 g/L, the increase in SAC dosage resulted in very limited increase in the COD removal rate of BTCW. The reason is as follows. The organic matter content in the wastewater was constant. When the stable stage of adsorption was reached, the addition of excess SAC provided excess adsorption sites, resulting in a decrease in site utilization [38]. Therefore, comprehensively considering the adsorption rate and material cost, the optimal dosage of SAC was decided to be 4 g/L. The effluent COD was below 80 mg/L and compliant with the emission standard of pollutants for the coking chemical industry (GB16171-2012) in China. Zhang et al. treated BTCW with lignite-activated coke and coal tar-derived activated carbon both at a dosage of 30 g/L [7], and their treatment efficiencies of the recalcitrant organic contaminant reached 45% and 57%, respectively. Gao et al. treated BTCW with sulfuric acid surface-modified coking coal [39], and the COD removal efficiency was 42.14% with the adsorbent dosage being 40 g/L. Therefore, the above results show that the SAC produced in this study achieved efficient COD removal at a lower dosage. The effect of the adsorption time of SAC on the COD removal rate of BTCW is shown in Figure 2b. The SAC achieved an adsorption equilibrium after 40 min, while the PAC reached the adsorption equilibrium after 60 min. The higher adsorption rate and good adsorption capacity of the SAC demonstrated its potential in practical wastewater treatment.
Based on the above results, the optimal conditions for adsorption in this study were as follows. For the SAC, the dosage was 4 g/L, the adsorption time was 40 min, the rotation speed was 200 rpm/min, the adsorption temperature was 25 °C, and the pH values were 7~8. For the PAC, the dosage was 3 g/L, and the adsorption time was 60 min. Other conditions, including the shaking speed, temperature, and pH, were the same as those of the SAC.

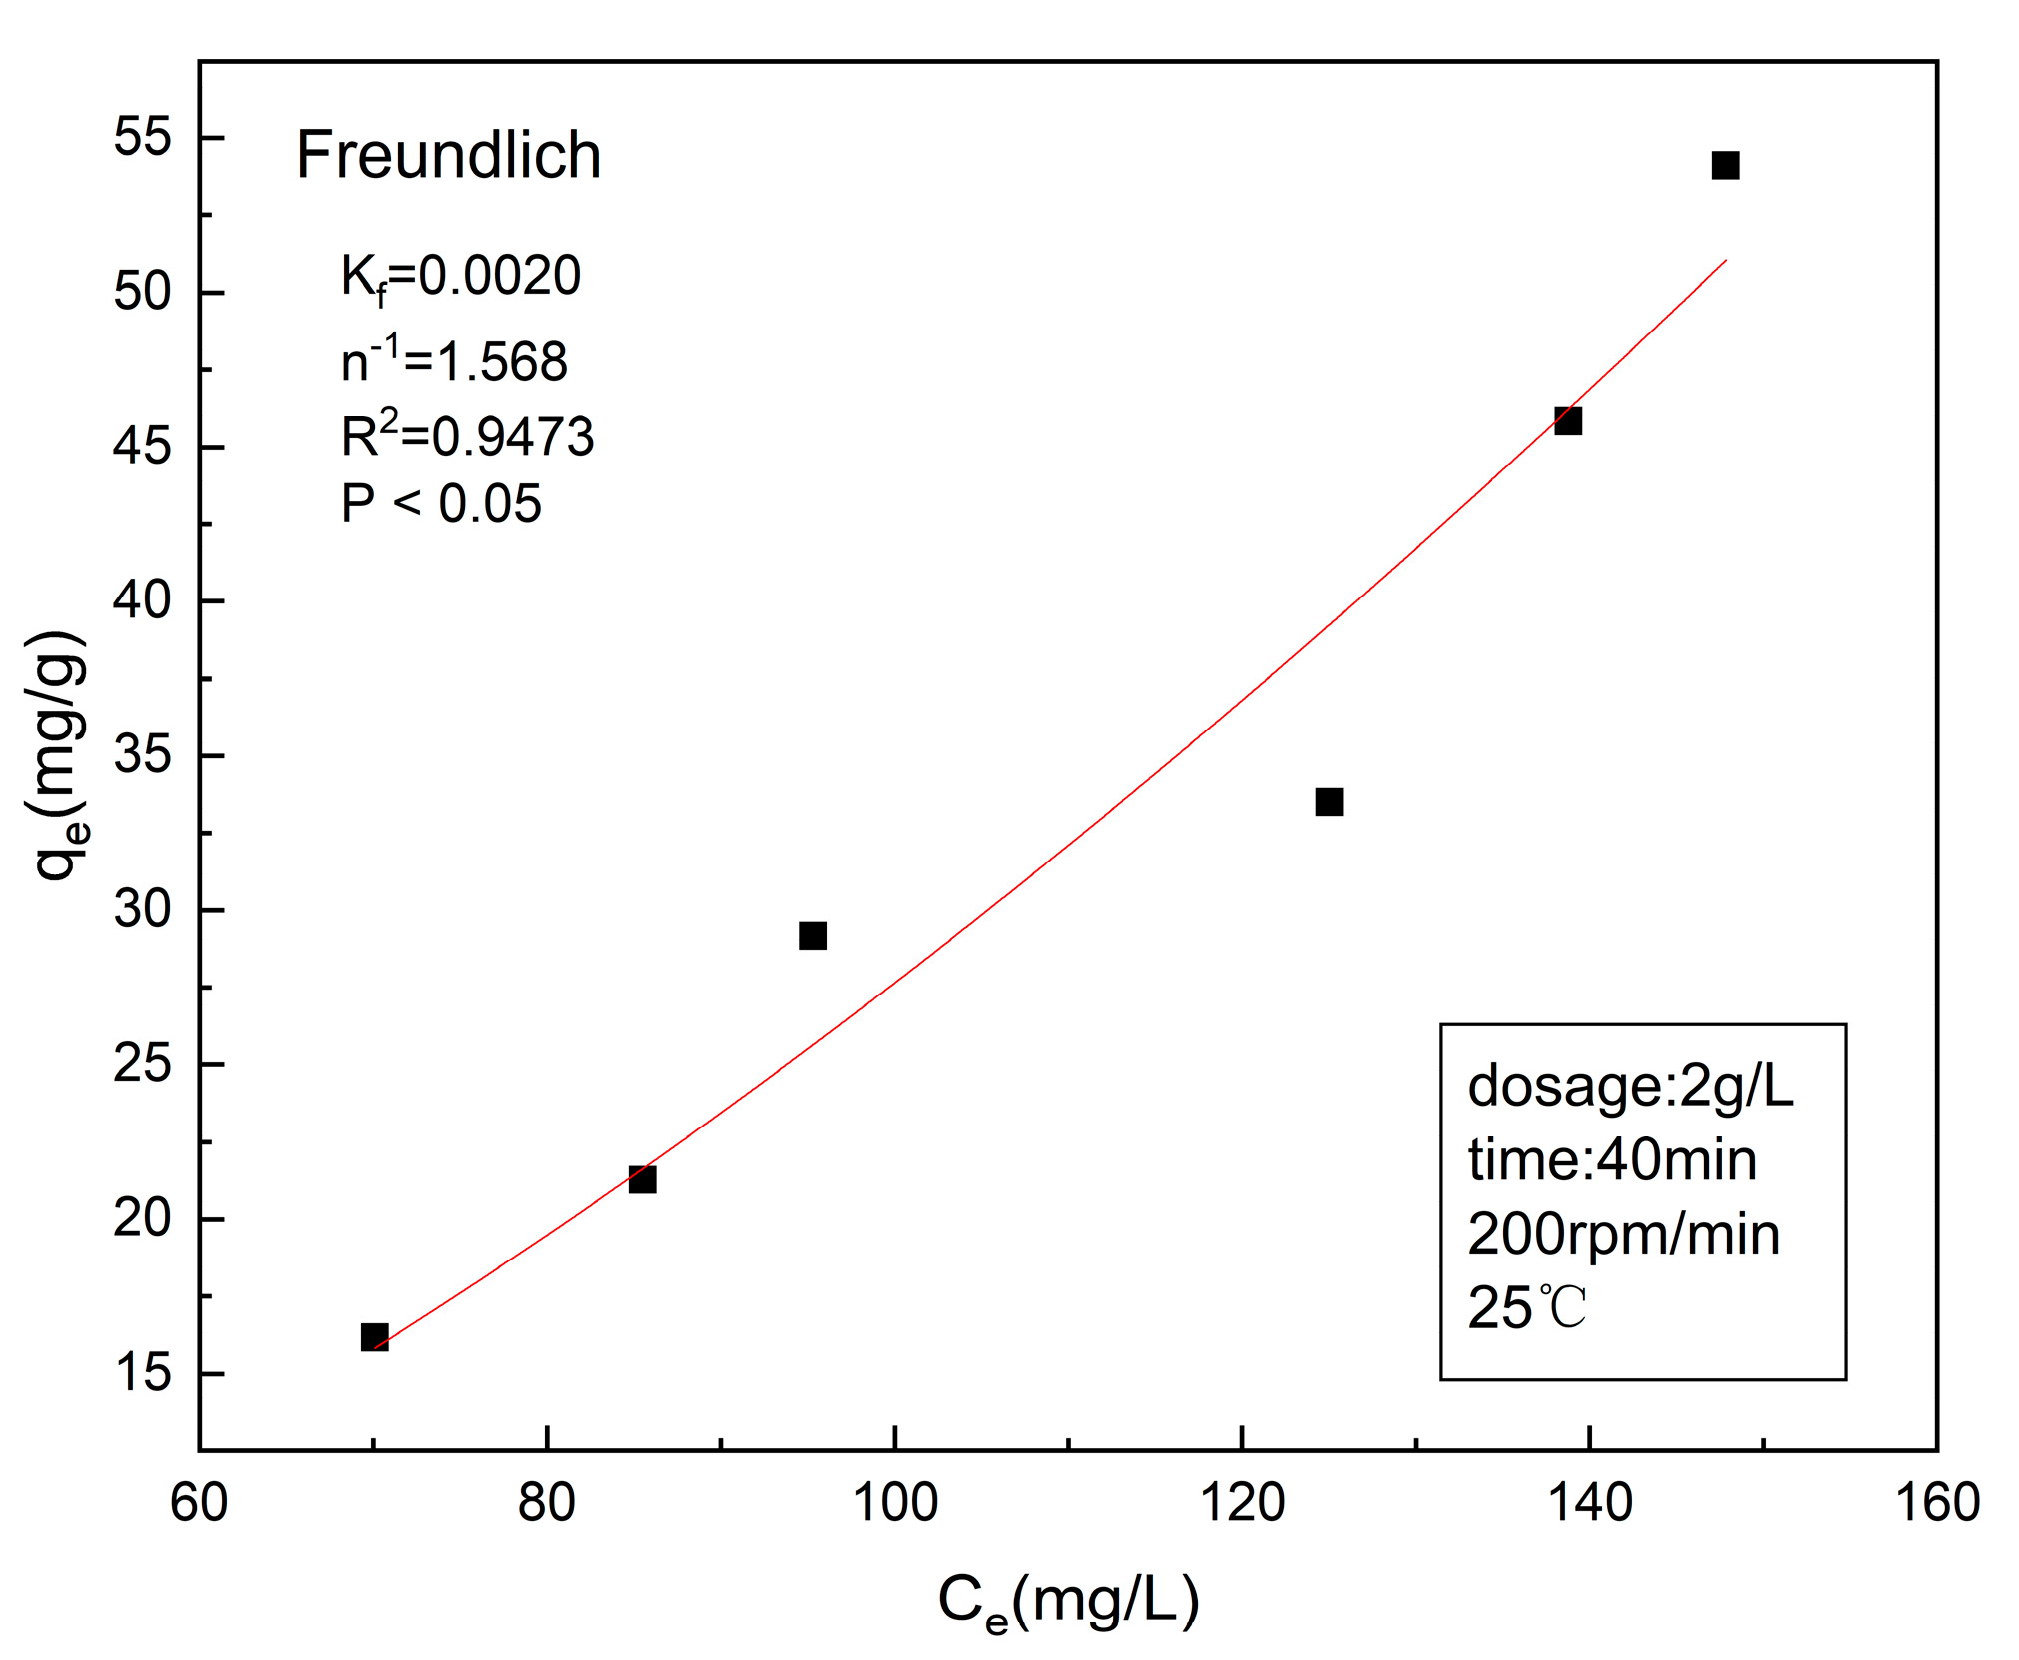
3.4. Adsorption Isotherm

In the adsorption isotherm experiment, raw BTCW and diluted BTCW with different COD values were used to analyze the adsorption characteristics of SAC. The dosage of the adsorbent was 2 g/L, the shaking speed was 200 rpm/min, and the pH values were between 7 and 8, respectively. Two models, the Langmuir adsorption isotherm and the Freundlich adsorption isotherm, were used to fit the adsorption process of BTCW by SAC at 25 °C. The equations for these two models are as follows:
Non-linear Langmuir equation:
q e = q m aC e aC e + 1
Non-linear Freundlich equation:
    q e = K f C e 1 n
where q m is the maximum adsorption capacity (mg/g), a is the Langmuir constant (L·mg−1), Ce is the concentration at adsorption equilibrium, and K f and n are the adsorption constants.
The Langmuir equation was based on a monolayer adsorption model, according to which the adsorbent surface was homogeneous, had no competition in any adsorption sites, and had the same chemical properties.
The adsorption equilibrium data fitted well with the Freundlich equation (R2 = 0.9471, p < 0.05), as shown in Figure 3. The constant n−1 in the Freundlich equation can characterize the affinity between the adsorbent and adsorbate in the system, as well as the degree of difficulty in the adsorption process [40]. When 0.1 < n−1 < 5, it indicates easy adsorption [40]. The n−1 value of organic matter adsorption by SAC in this study was 1.568, which suggests that the organic pollutants were easily adsorbed by the SAC. The Langmuir equation did not fit the data well with a convergence failure and a R2 value of 0.8445. This shows that the non-linear Langmuir model is not suitable for COD adsorption in BTCW by our SAC. The Langmuir model is reported to be usually suitable for the adsorption of high concentrations of solutes [41]. The diluted BTCW used here did not have high concentrations of COD, which may partly explain the failure of the Langmuir model. On the other hand, the low fit of the Langmuir model also indicates that the COD adsorption in the BTCW by the SAC is not a monolayer adsorption and that the SAC has complex surface chemistry. Based on the experimental data, the qm value of the SAC was 54.11 mg·g−1, which was higher than that of other adsorbents reported in previous studies. For example, the activated carbon prepared from municipal sludge and bamboo waste treating BTCW showed a phenol adsorption capacity of 20.02 mg·g−1 [42]. The activated carbon prepared from date palm waste treating municipal sewage showed a COD adsorption capacity of 41.3 mg·g−1 [43]. The activated carbon from peanut shells treating dye wastewater showed a COD adsorption capacity of 32 mg·g−1 [44].

3.5. Removal Characteristics of Organic Matter

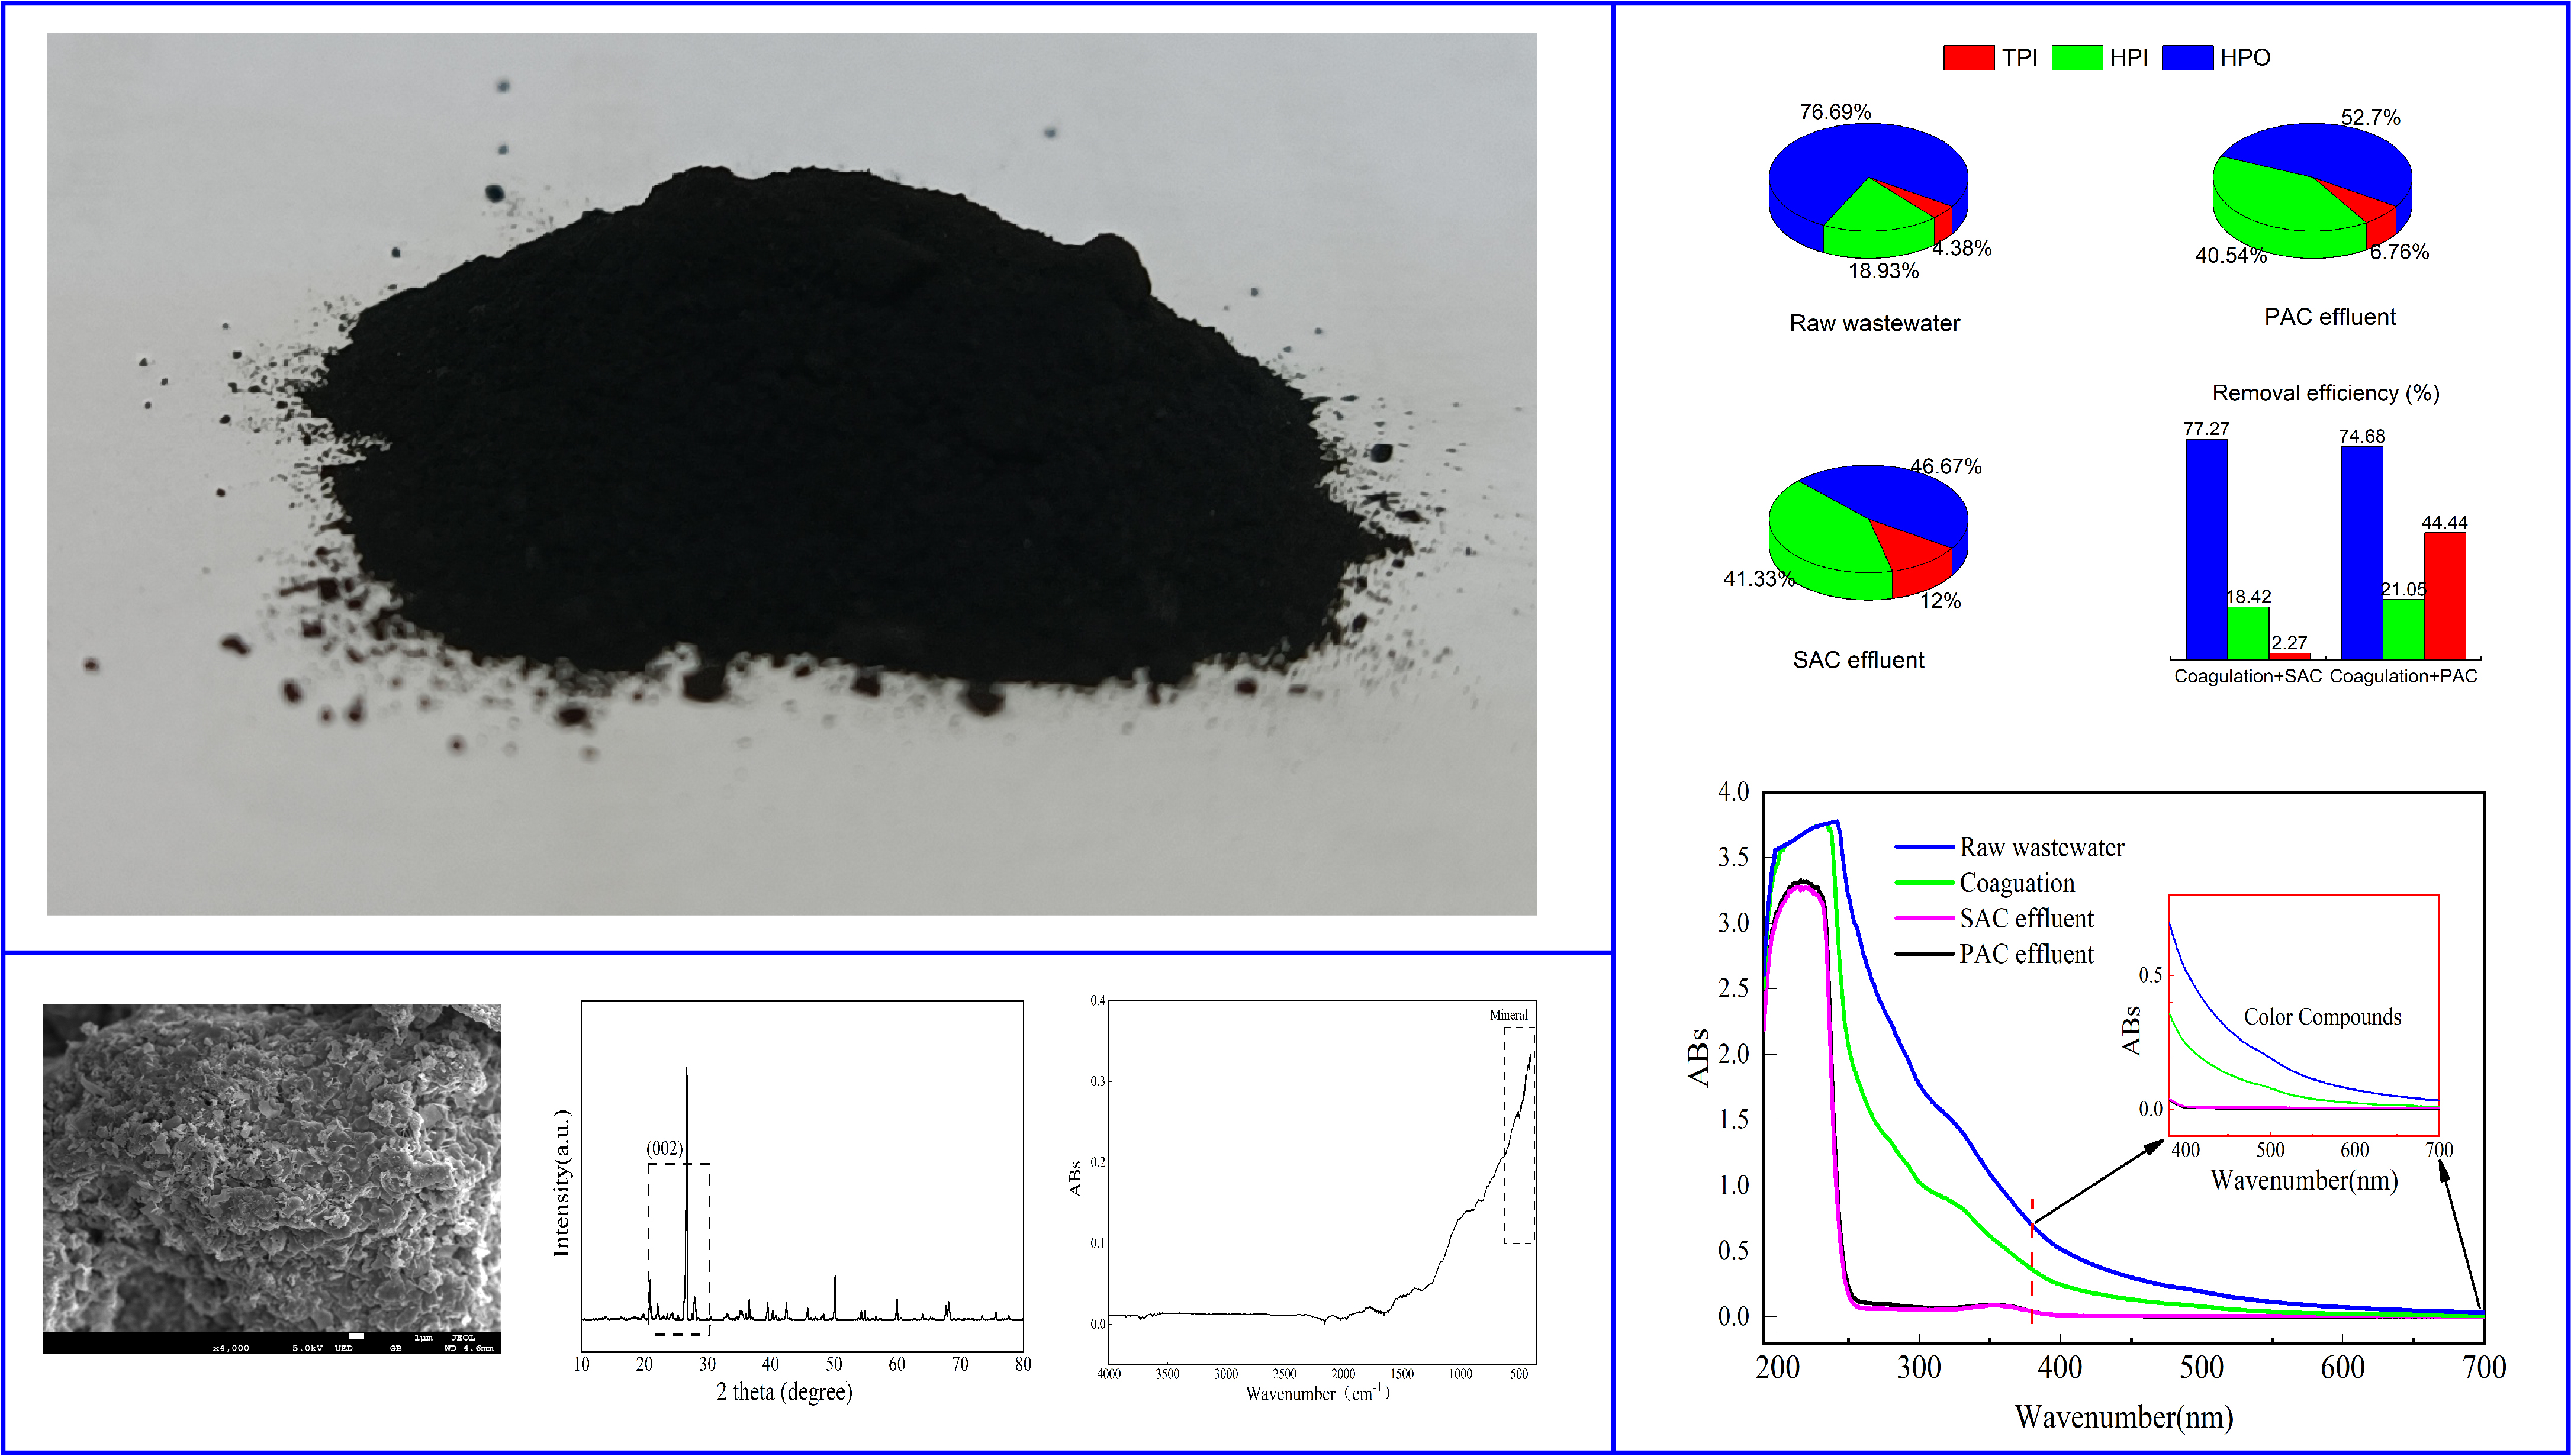
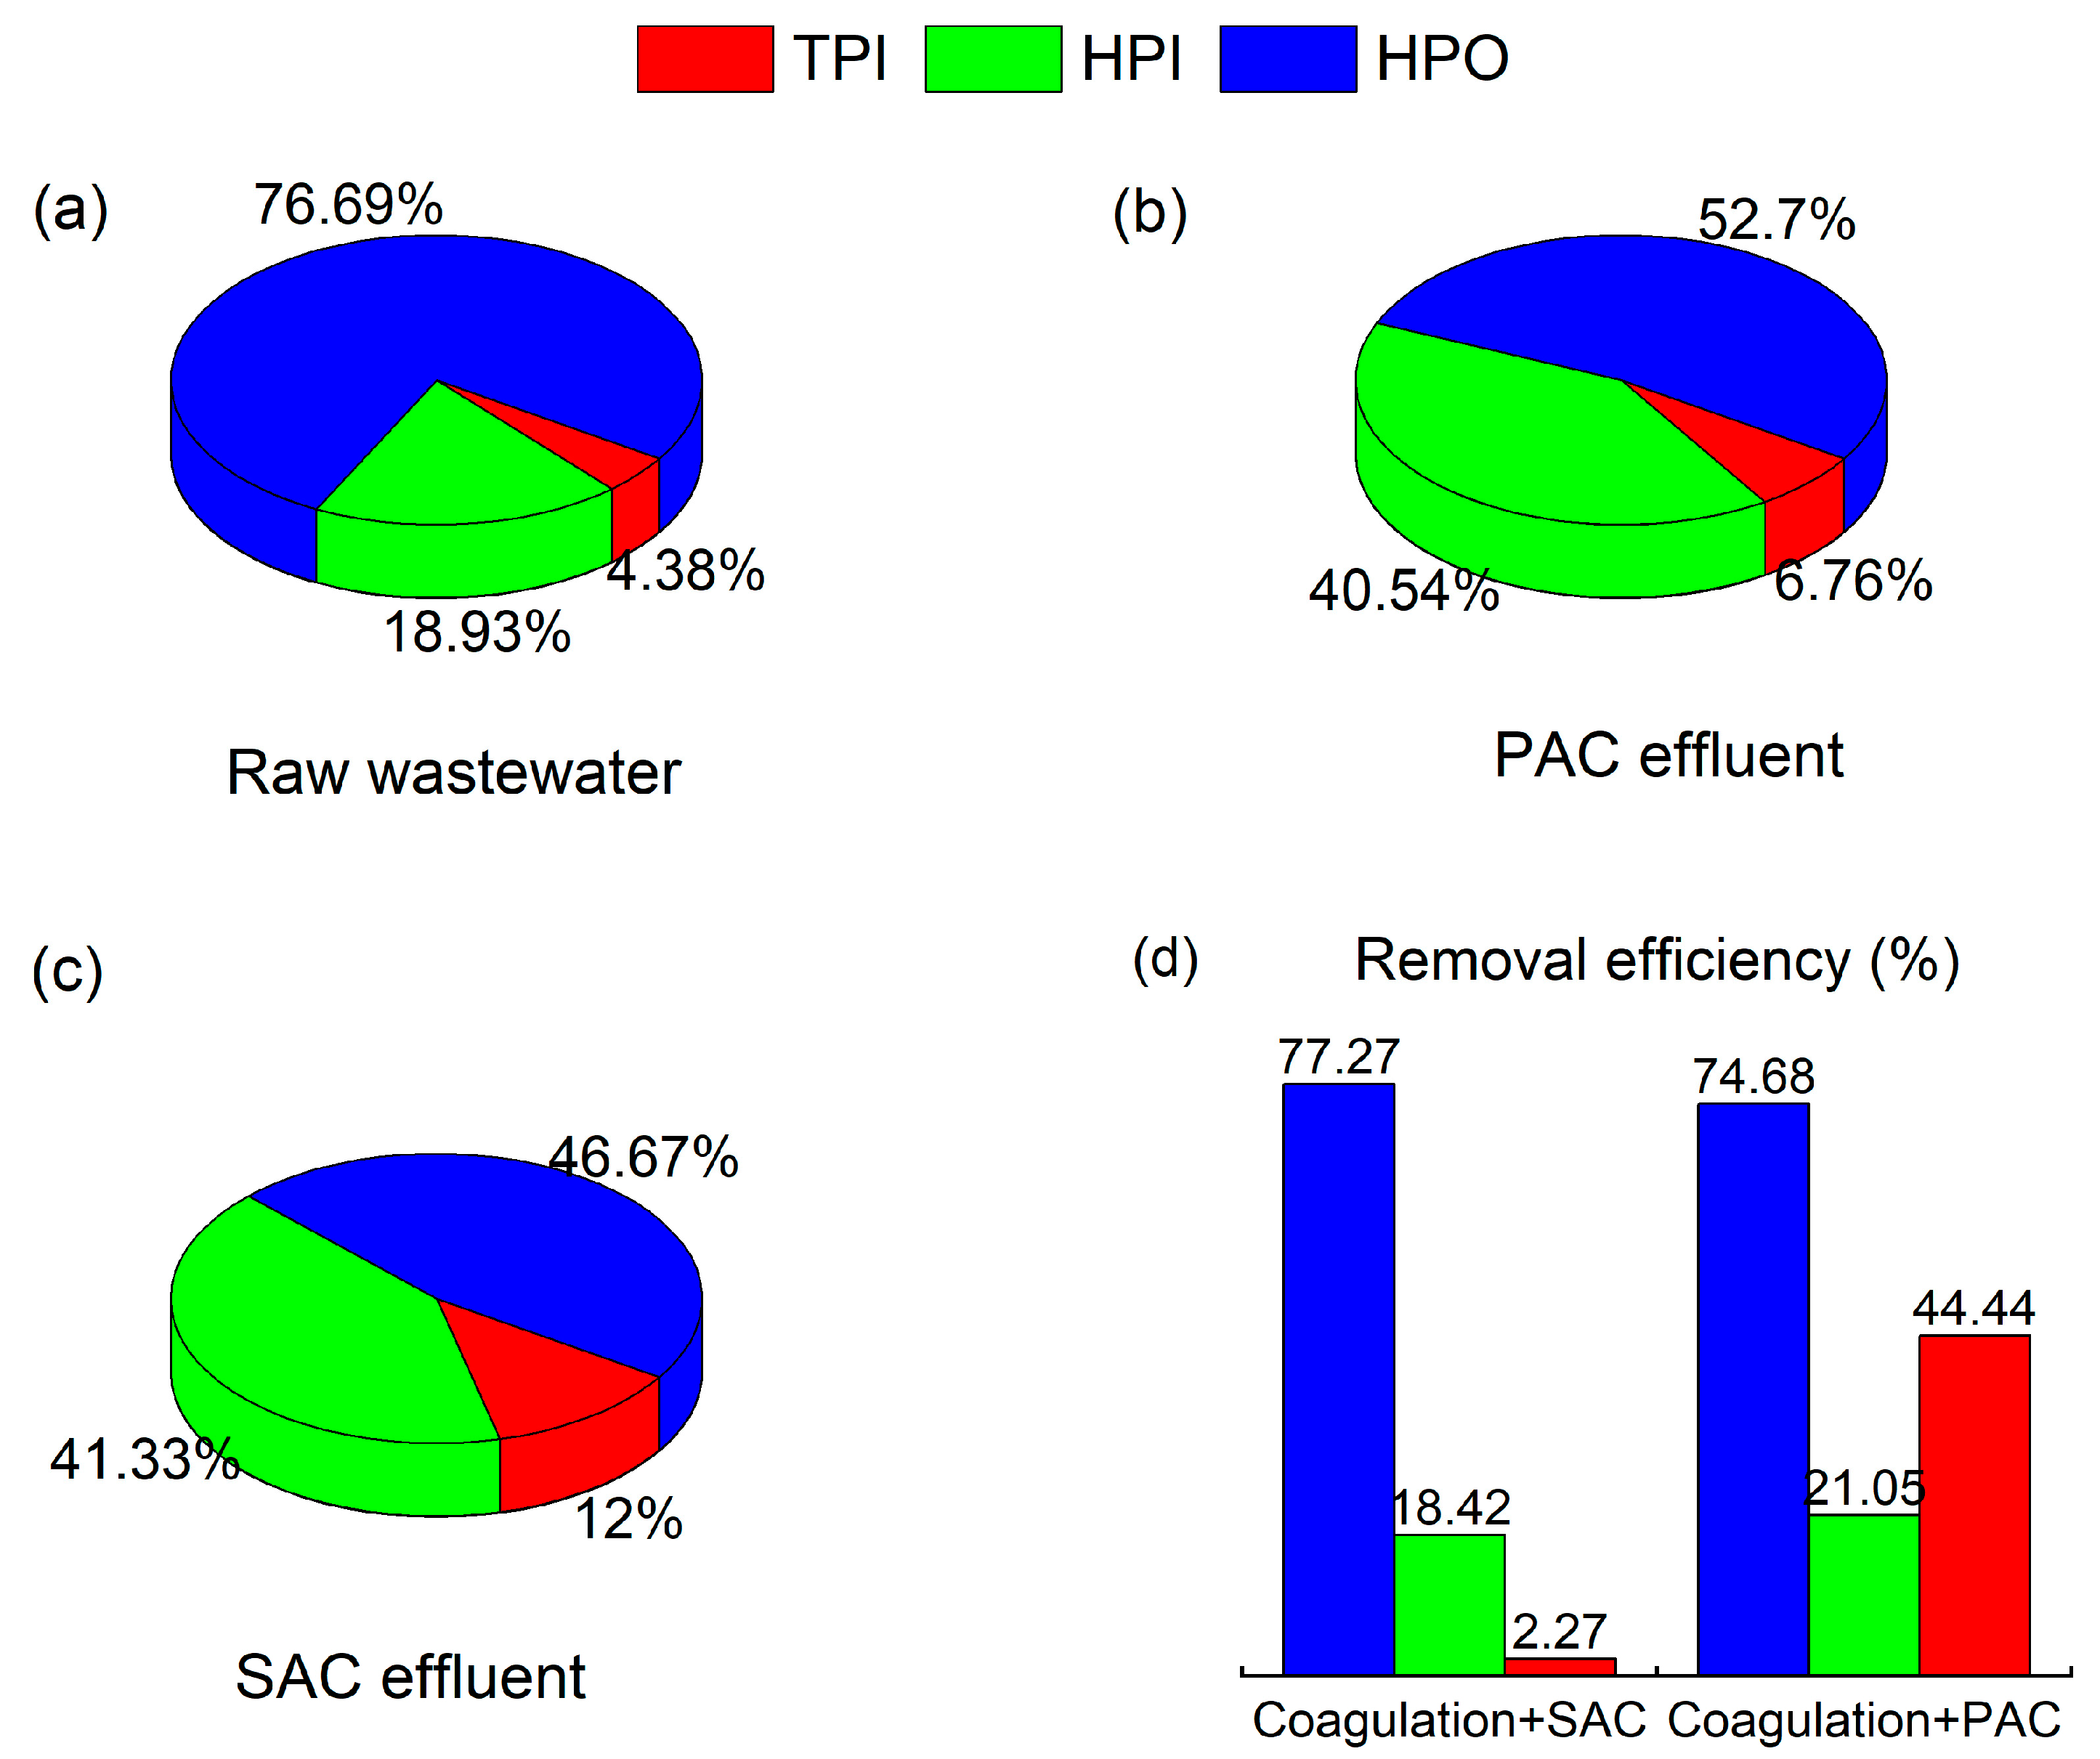
3.5.1. Removal of Hydrophilic and Hydrophobic Components by Coagulation Combined with SAC Adsorption

The DOM in the BTCW was divided into three different components: hydrophilic fraction (HPI), transphilic fraction (TPI), and hydrophobic fraction (HPO). In the raw wastewater, HPO was the main component, accounting for 76.69% of the COD (Figure 4). The proportion of TPI was the smallest, accounting for only 4.38% of the COD, which was consistent with the previous studies [6,45,46]. After coagulation and SAC adsorption, a ranking of the removal efficiencies of organic components by coagulation and SAC adsorption shows HPO (77.27%) > HPI (18.42%) > TPI (2.27%), while that of coagulation and PAC adsorption was HPO (74.68%) > TPI (44.44%) > HPI (21.05%). Carbonaceous materials usually exhibit strong hydrophobicity [36], so the affinity for HPO of the two adsorbents used in this study were greater than that for HPI and TPI. The removal efficiencies of HPO by the adsorbents in the present study were higher than that of other research on BTCW (59.55%) [25]. The SAC showed a stronger affinity for hydrophobic components than the PAC. A possible reason for this is as follows. The C-OH group of the PAC occupied certain adsorption sites, which weakens its adsorption capacity for hydrophobic organics, resulting in a stronger adsorption capacity of the SAC for hydrophobic organics than the PAC. The TPI fractions refer to the materials whose solubility is between hydrophobic fractions and hydrophilic fractions [47,48], which are difficult to be removed by adsorption, according to previous study [48]. Although the removal efficiency of TPI by the SAC was low, the SAC achieved efficient COD removal as TPI took up a very small proportion in the raw wastewater (Figure 4a).

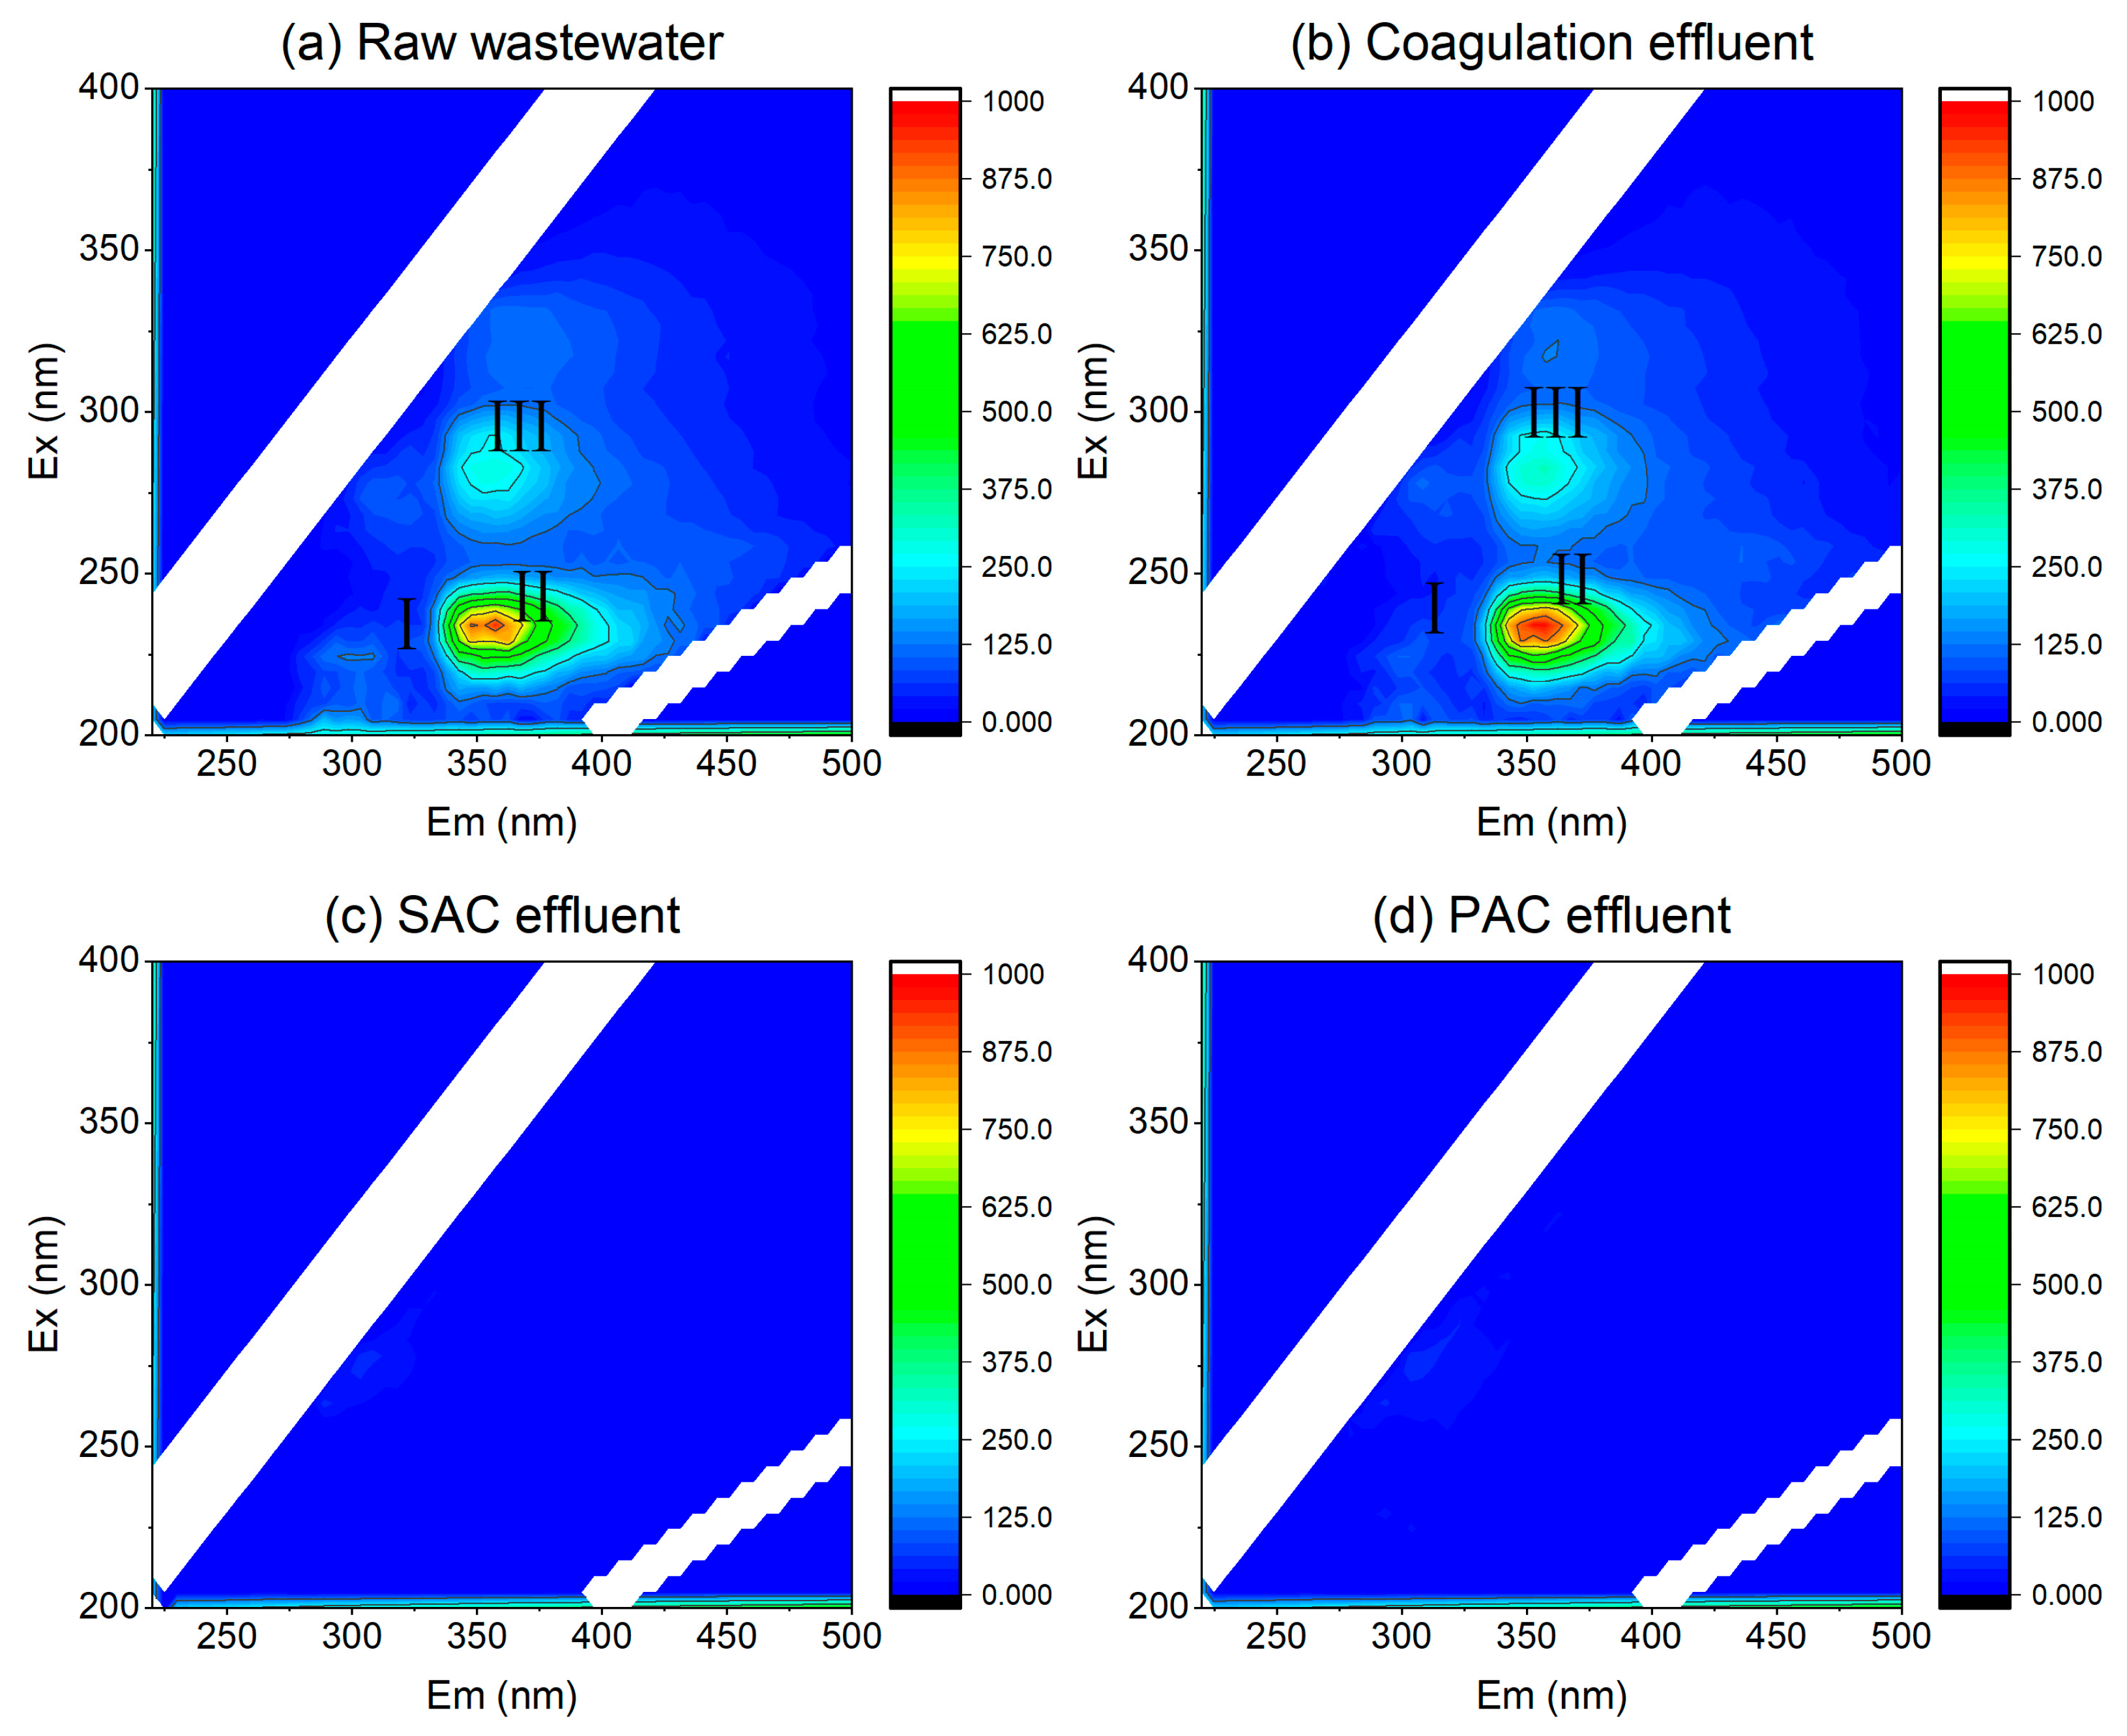
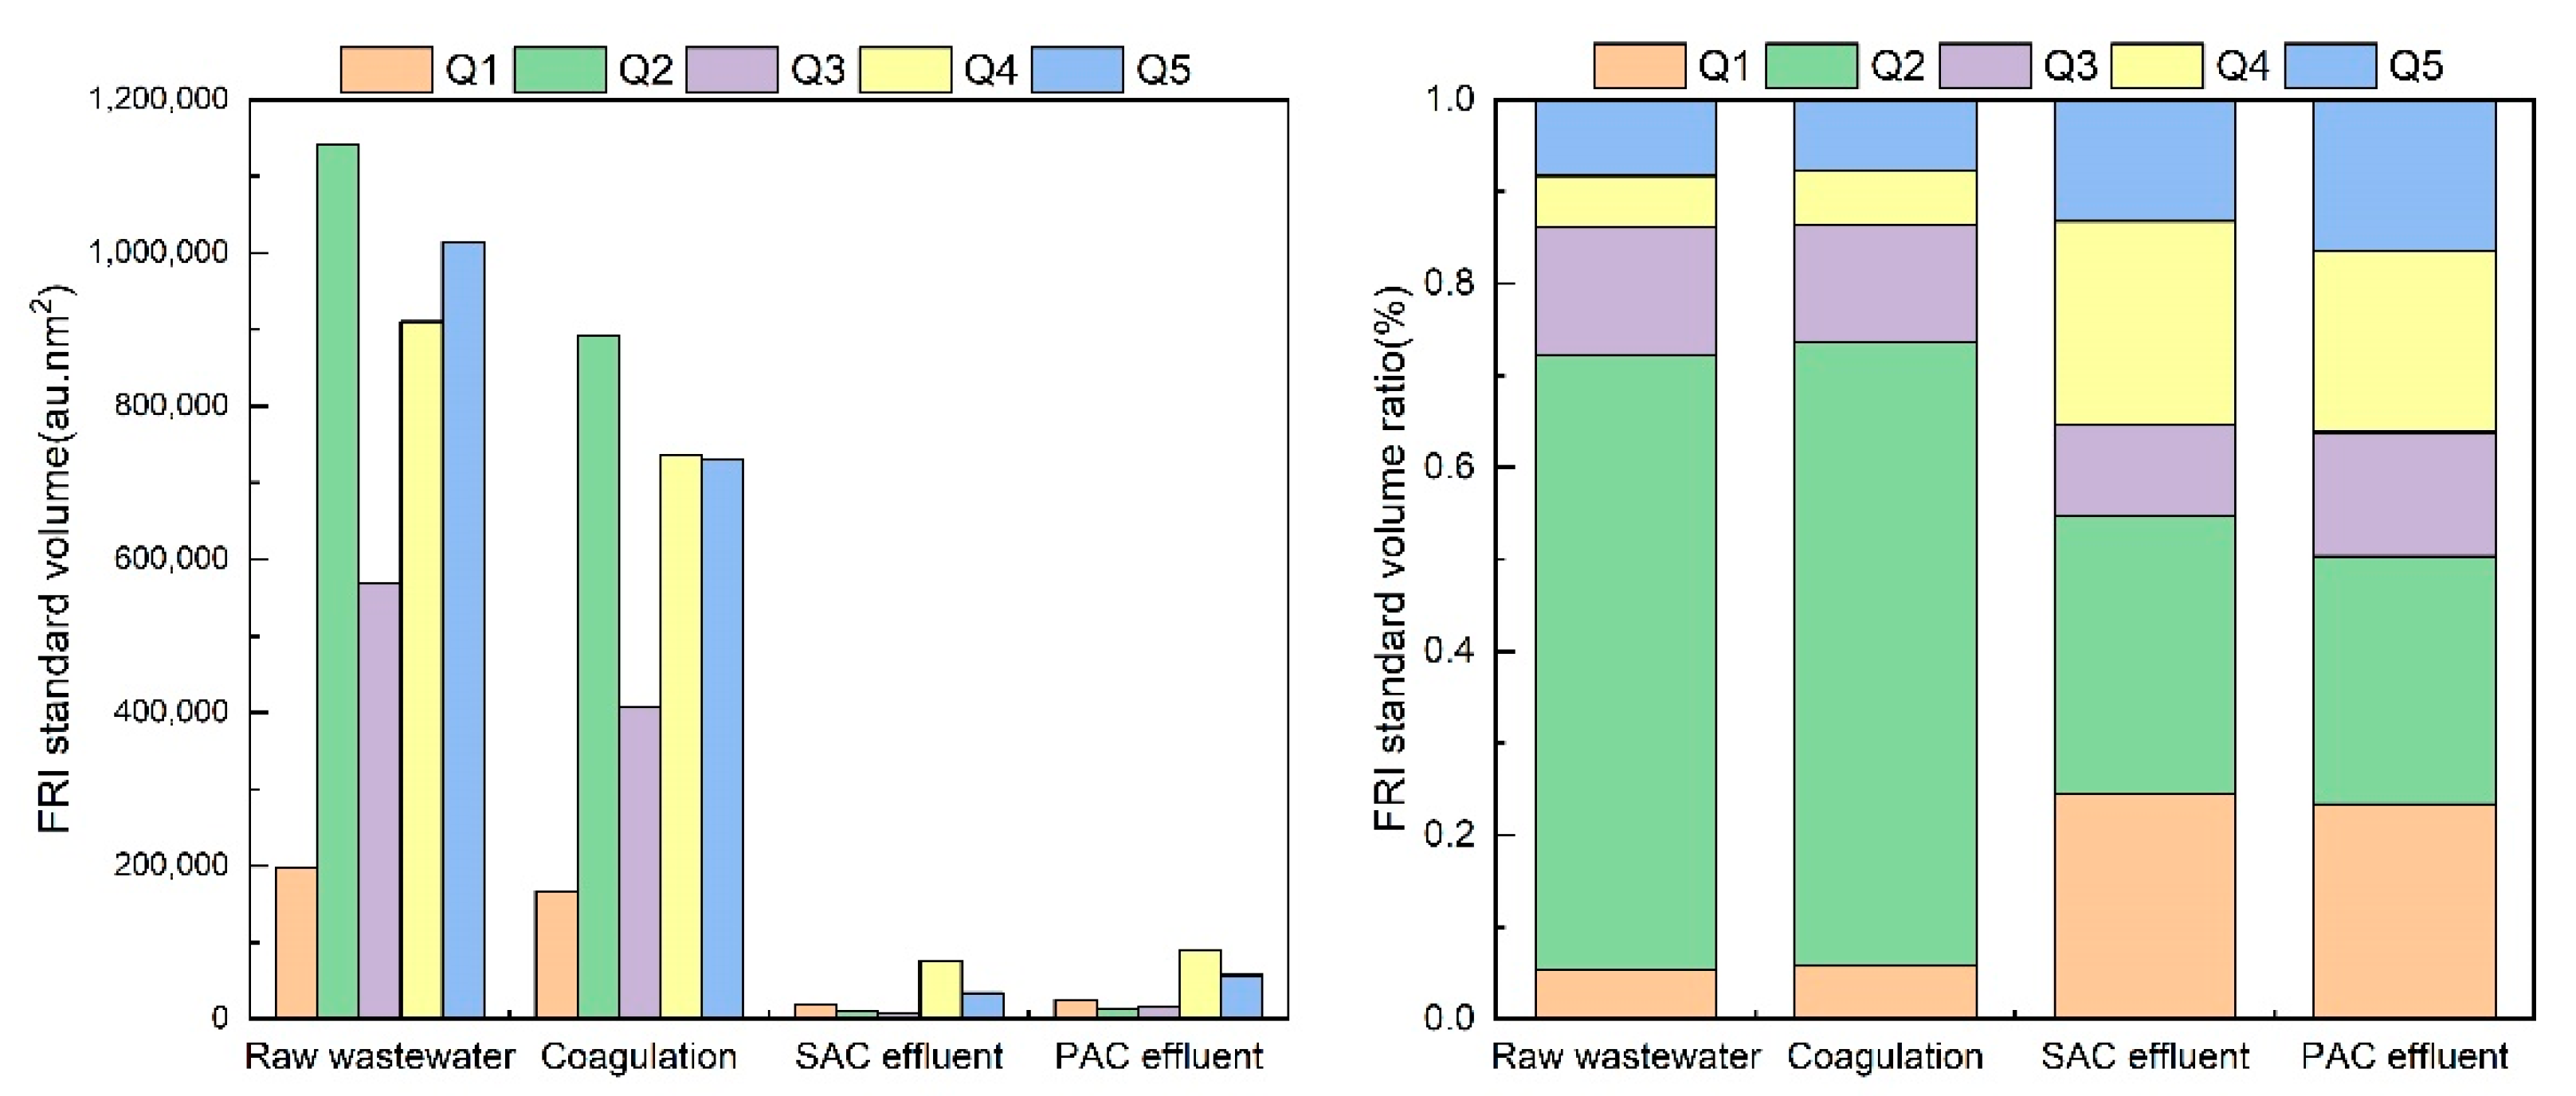
3.5.2. Fluorescence Regional Integration (FRI) Analysis of Organic Matter Removal Characteristics

Three main fluorescence peaks (I, II, III) were detected in the EEM spectra of the raw wastewater and coagulation effluent, as shown in Figure 5. The central wavelengths of Ex/Em were about 220/295 nm, 230/355 nm, and 280/355 nm, corresponding to tyrosine-like, tryptophan-like, and soluble microbial by-products (SMP), respectively [8,27,49]. After the SAC and PAC treatments, the three main fluorescence peaks were not present in the effluents (Figure 5c,d).
To quantify compositional differences, the EEM spectra of the DOM were analyzed using the FRI method [18,50,51]. It can be seen from Figure 6 that coagulation showed a limited removal effect on the fluorescent components in each area. The removal efficiencies of the tyrosine-like (Q1) and tryptophan-like (Q2) substances were 15.93% and 21.78%, respectively. The removal efficiency of soluble microbial by-products (Q4) was 19.20%. The removal efficiencies of fulvic acid organic matter (Q3) and humic acid organic matter (Q5) were the highest (28.52% and 27.95%, respectively). Similarly, previous studies also reported that the hydrophilic macromolecular organics and humic acids were preferentially removed in the coagulation stage [52]. After the SAC treatment, the removal efficiencies of the tyrosine-like (Q1), tryptophan-like (Q2), fulvic acid-like organic matter (Q3), soluble microbial by-products (Q4), and humic acid organic matter (Q5) were 88.37%, 98.78%, 97.86%, 89.63%, and 95.31%, respectively. After the PAC treatment, the removal efficiencies of the tyrosine-like (Q1), tryptophan-like (Q2), fulvic acid-like organics (Q3), soluble microbial by-products (Q4), and humic acid-like organics (Q5) were 85.09%, 98.55%, 96.16%, 87.66%, and 92.15%, respectively. The eliminating effect of the SAC on each of the five fluorescent components was higher than that of the PAC. The 3D-EEM and UV-vis spectra of raw wastewater after DOM fractionation are shown in Figures S3 and S4. Combining Figures S3 and S4, the HPO in BTCW was mainly tryptophan-like substances, the HPI was mainly monocyclic aromatic tyrosine-like organic matters, and the TPI was mainly humic-like and fulvic-like acids. Both the SAC and PAC had the highest removal efficiency of tryptophan-like (Q2) substances, which are suggested to be hydrophobic organics [53,54].

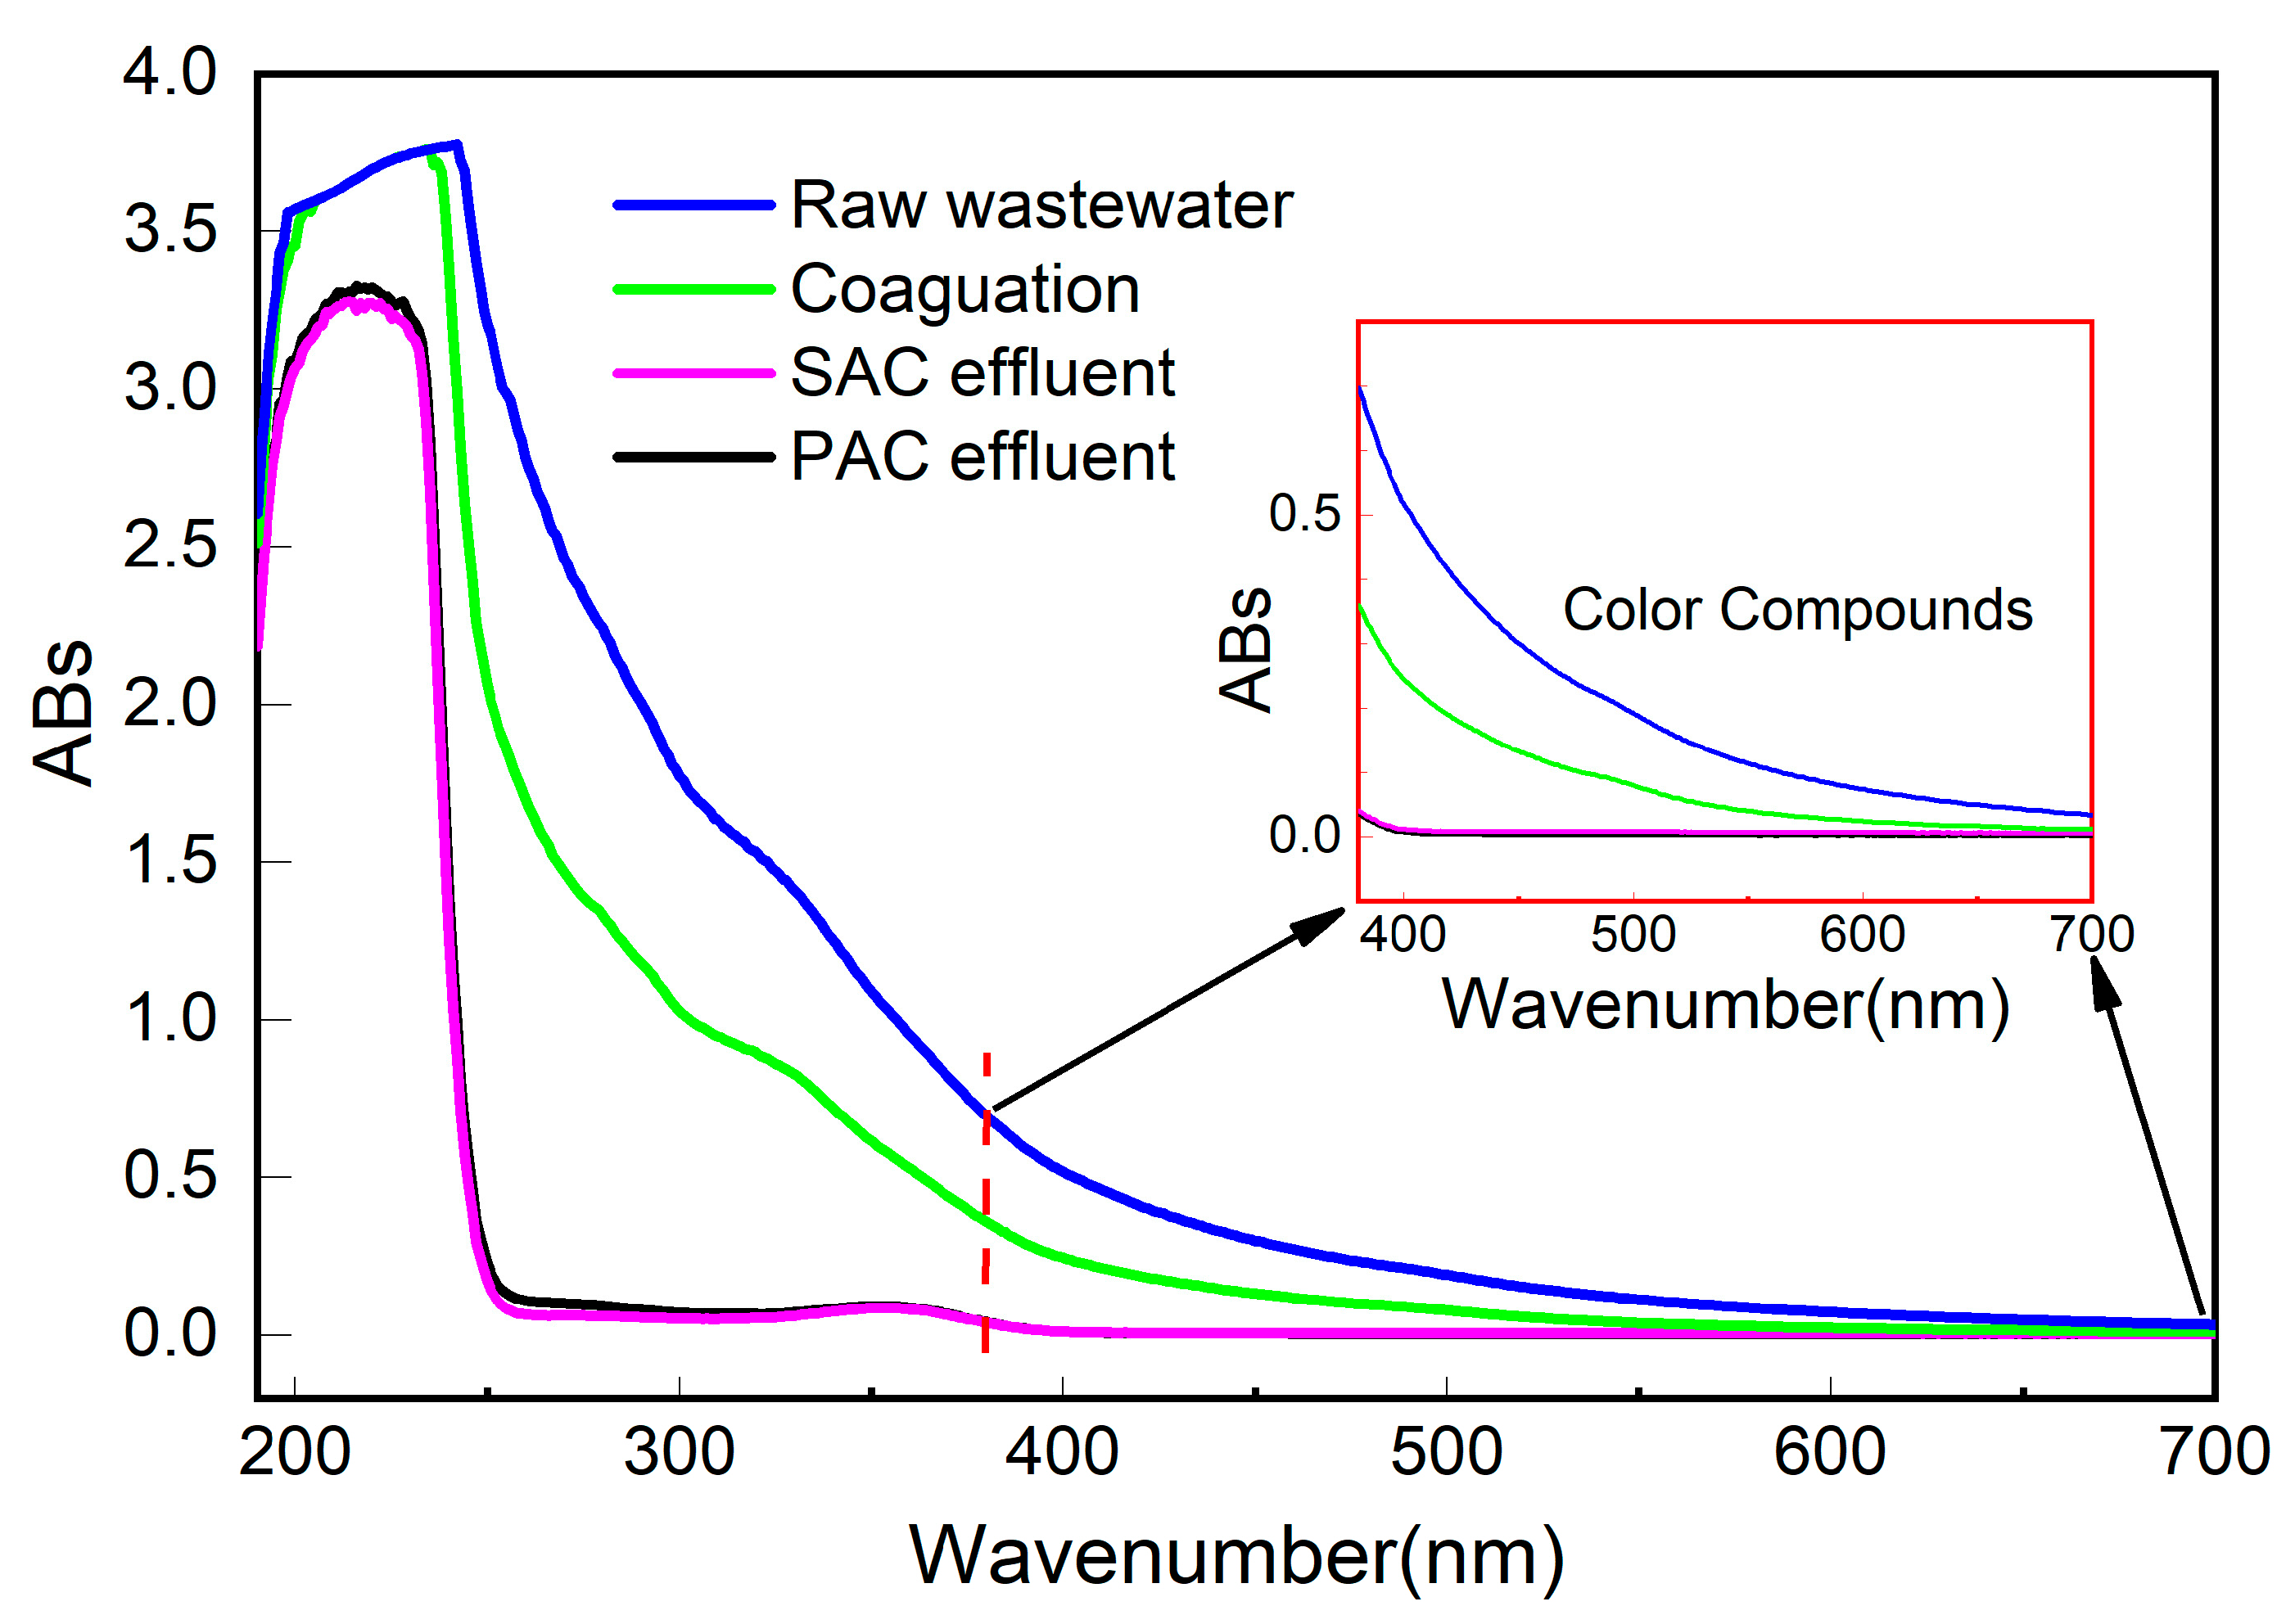
3.5.3. UV-Vis Spectroscopic Analysis of Organic Matter Removal Properties

The organic matter is a series of organic mixtures containing conjugated systems, and its aqueous solution has a strong absorption signal in the ultraviolet region of the absorption spectrum [55]. The UV-vis absorbance spectra of raw BTCW and the effluents of coagulation, SAC adsorption, and PAC adsorption are displayed in Figure 7. After the SAC or PAC treatment, the absorbance between 200 and 250 nm of the wastewater decreased little, indicating that SAC and PAC had a poor adsorption effect on monocyclic aromatic compounds [56]. However, the absorbance between 250 nm and 400 nm of the SAC and PAC effluent was relatively stable and close to 0, proving that the SAC and PAC had better treatment effects on polycyclic aromatic hydrocarbons and nitrogen heterocyclic compounds [56,57]. In addition, the wastewater after SAC or PAC treatment showed absorbance values close to 0 at the wavelengths between 380 nm and 700 nm, which belong to the visible light region [58]. This indicates that the colored substances in the coking wastewater were basically removed by adsorption.
A nonlinear fitting on the absorbance of different bands was performed to obtain their spectral characteristics and spectral slopes. The results are shown in Table 3. Among them, a254 and a300 are the absorption coefficients of 254 nm and 300 nm, which can represent the relative content of organic matter [58]. It can be known that after SAC and PAC adsorption, most of the organics were removed (Table 3). A254/A204 represented the ratio of UV absorbances at 254 nm and 204 nm, which was positively correlated with the hydrophobic/hydrophilic ratio [59]. The smaller A254/A204 of SAC adsorption effluent indicates that the removal efficiency of the hydrophobic components by the SAC was higher than that of the PAC (Table 3), which is consistent with the results shown in Figure 4. E3/E4 was the ratio of UV absorbances at 300 nm and 400 nm, which can measure the degree of humification and aromaticity [55]. The smaller the ratio, the higher the degree of humification. After coagulation pretreatment, the E2/E3 value of the wastewater increased, indicating that the humification of the wastewater decreased, which is consistent with the result of the 3D-EEM analysis. Coagulation preferentially removes hydrophilic macromolecules and humic organic matter [11,52], thus reducing humification of the effluent. On the other hand, the E2/E3 value of the wastewater decreased after SAC and PAC adsorption, indicating increased humification. The affinity of SAC and PAC to humic substances was not as good as that to other components, such as low molecular weight organics [11], resulting in a relative increase in effluent humification.

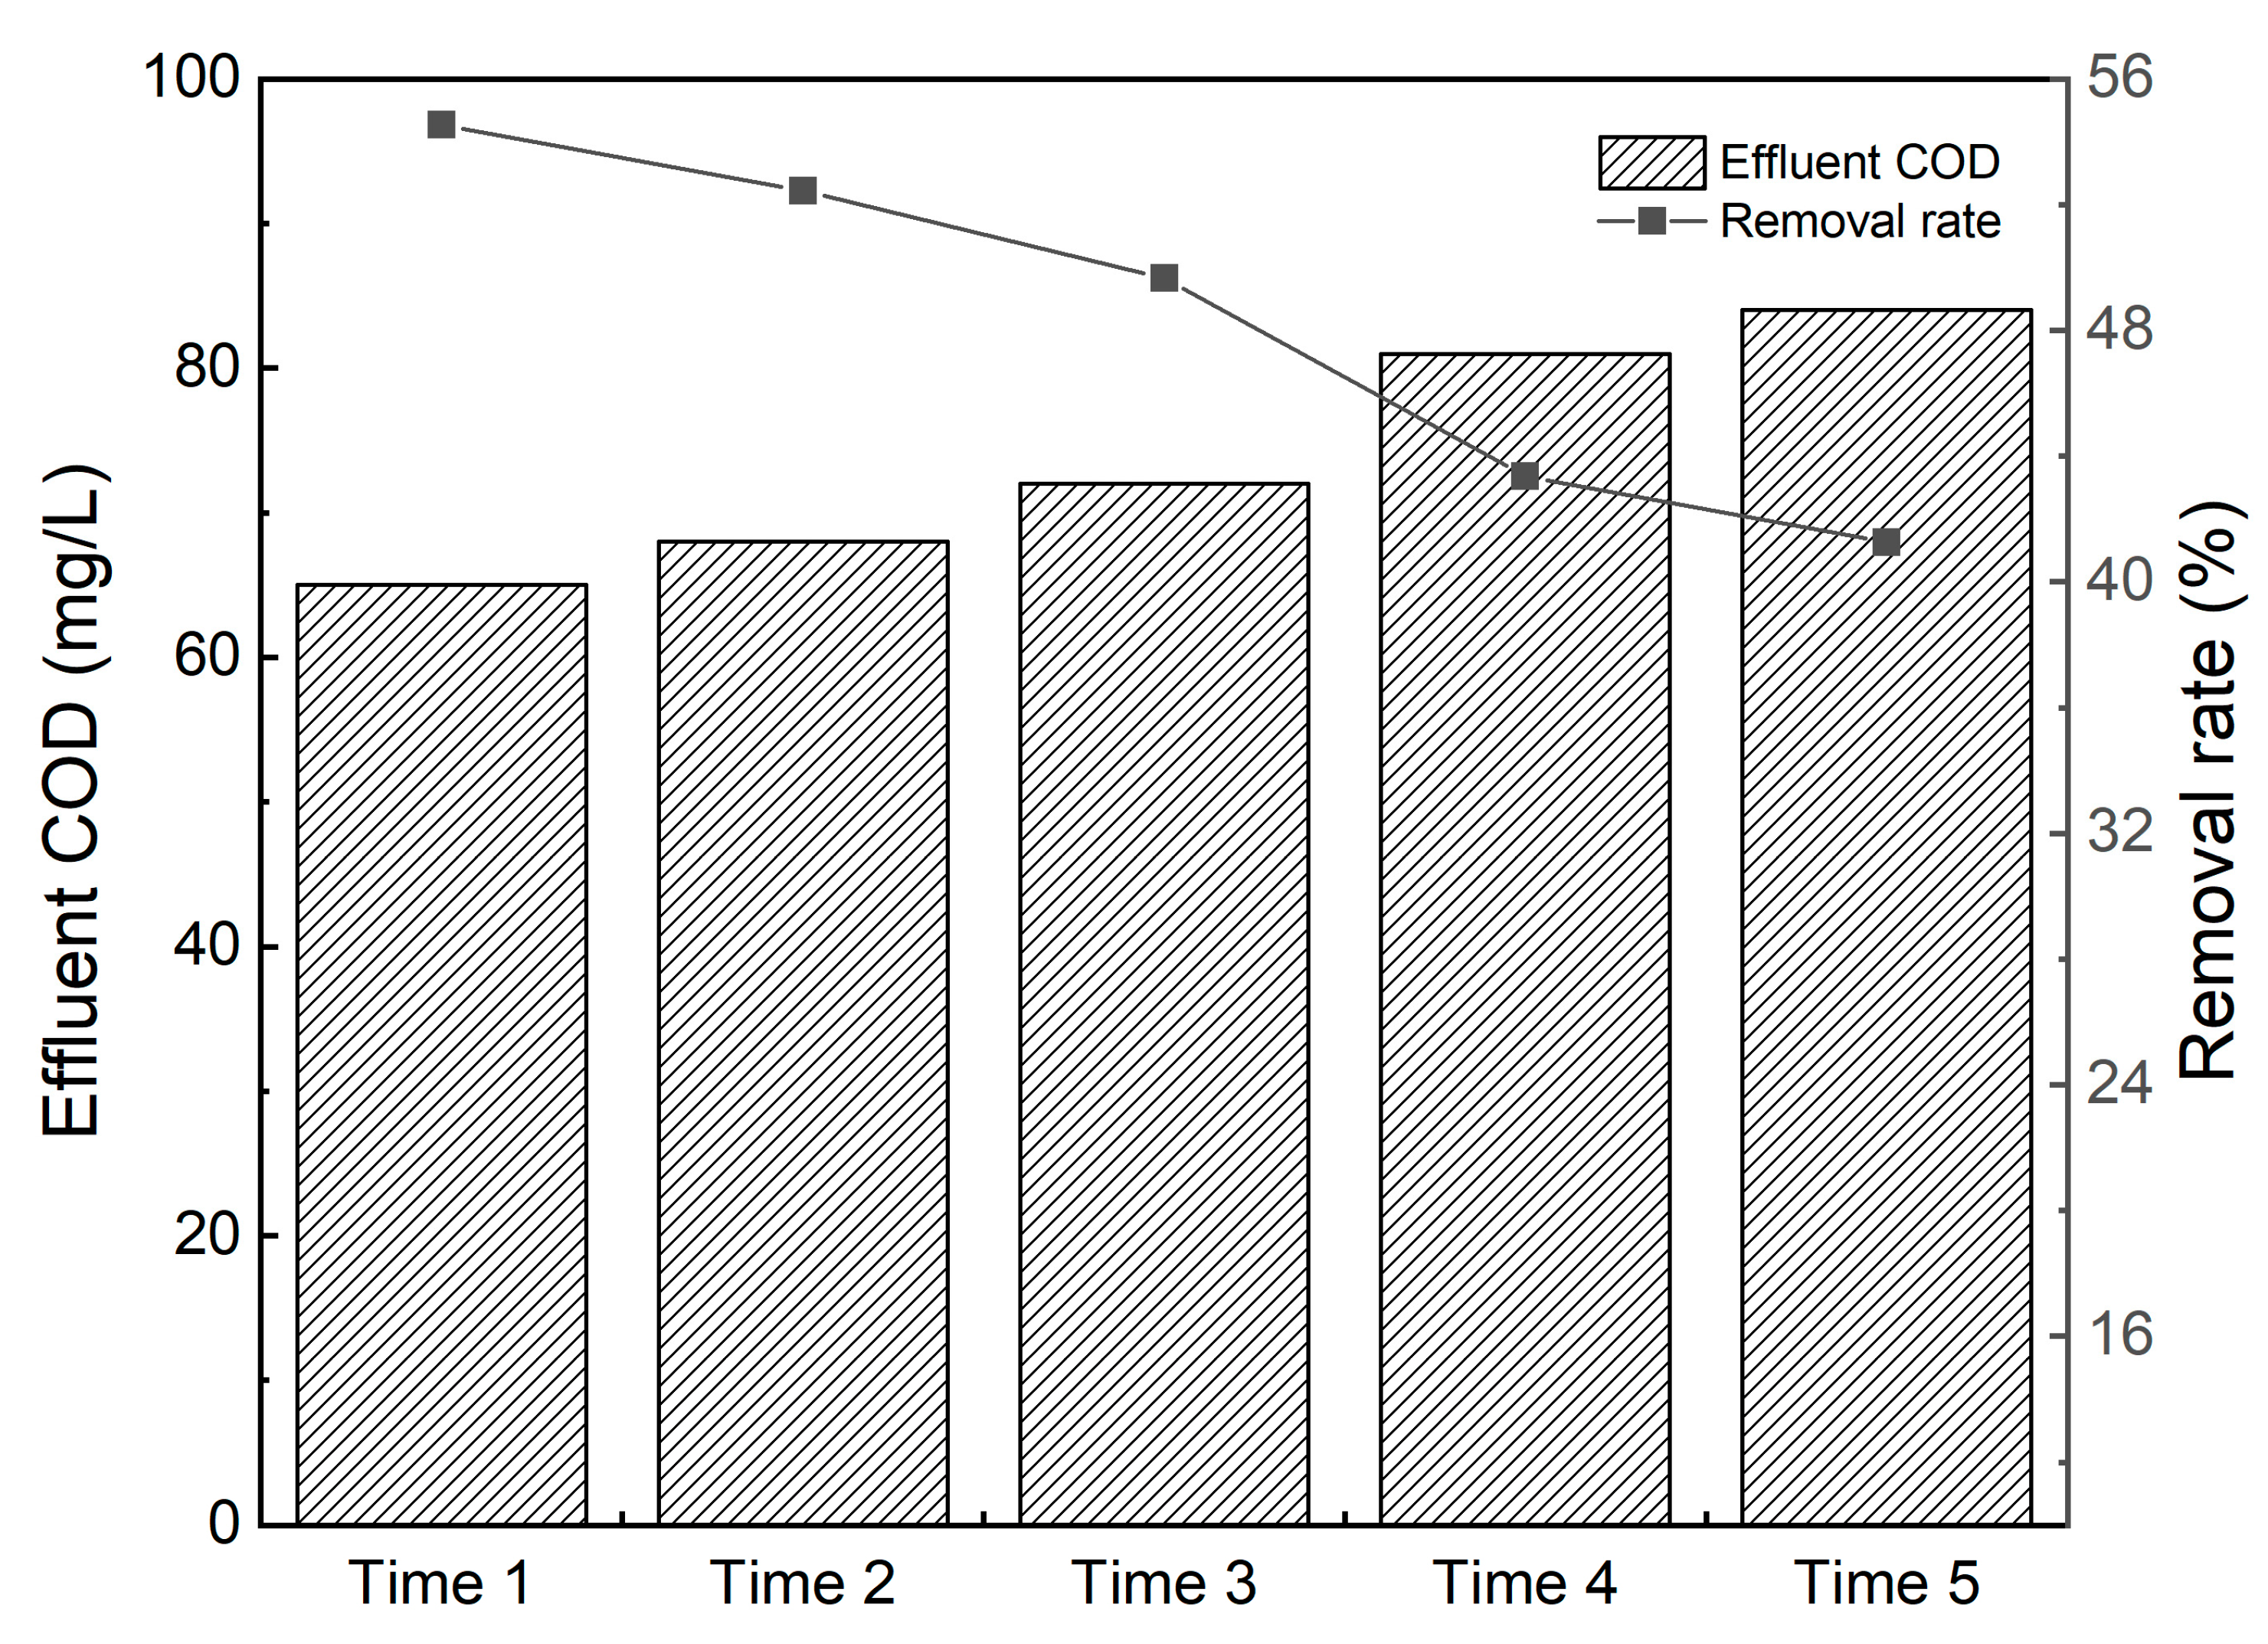
3.6. SAC Reusability

To evaluate the SAC’s reusability, an adsorption–desorption experiment was performed for SAC. After four adsorption–desorption cycles, the adsorption efficiency of the COD in BTCW by SAC adsorption only decreased by approximately 10% (Figure 8), indicating a good reusability of SAC. Moreover, the method of using NaOH as the regenerant has the advantages of being cost effective. Together, these indicate that the SAC produced in this study has great potential for application in practical wastewater treatment.

4. Conclusions

In this study, an SAC was produced from municipal sludge to remove organic pollutants in the BTCW with a pretreatment process of coagulation. Adsorption by a commercial PAC was applied for comparison as well. The adsorbents were characterized, and their removal characteristics for organic matter were systematically studied. The SAC exhibited a specific surface area of 710.175 m2/g and a well-developed pore structure based on BET and SEM analyses. The best COD treatment effect was achieved when the dosages of polyaluminum chloride and SAC were 150 mg/L and 4 g/L, respectively. After coagulation and SAC adsorption of the BTCW, the organic pollutants were able to be effectively removed, with the effluent COD below the discharge limit (80 mg/L). Compared to the commercial PAC, the SAC showed a similar performance in COD removal at a higher adsorption speed and with a higher removal effect of hydrophobic organics (77.27%), which were the main organic component in BTCW. The results of the 3D-EEM and UV-vis analysis showed that SAC and PAC had the highest removal efficiency for hydrophobic tryptophan-like substances (98.78% and 98.55%, respectively) and also had good removal of complex organic compounds and colored substances. All in all, SAC can effectively solve the problems of large proportions of hydrophobic components and complex organic compounds in BTCW, and a promising adsorbent for the removal of organic matter in BTCW.

Supplementary Materials

The following supporting information can be downloaded at: https://www.mdpi.com/article/10.3390/w14152446/s1, Figure S1: (a) XRD patterns of SAC and PAC, (b) infrared spectrograms of SAC and PAC; Figure S2: (a,b) SEM images of SAC before and after adsorption, respectively, (c,d) SEM images of PAC before and after adsorption, respectively; Figure S3: 3D-EEM spectra of raw wastewater after DOM fractionation; Figure S4: UV-vis spectra of raw wastewater after DOM fractionation.

Author Contributions

Methodology, Y.X.; funding acquisition, Y.X.; conceptualization, Y.X., W.L. and D.L.; investigation, W.L., D.L. and Y.S.; writing—original draft preparation, Y.X. and W.L.; writing—review and editing, all authors; data curation, W.L., J.C., J.L. and Y.S.; project administration, Y.X.; supervision, Y.X. and X.H.; validation, all authors. All authors have read and agreed to the published version of the manuscript.

Funding

This project was funded by the Fundamental Research Funds for the Central Universities of China University of Mining and Technology, Beijing (2022YQHH11) and the Innovation and Entrepreneurship Training Program for College Students of China, University of Mining and Technology, Beijing (202103064).

Institutional Review Board Statement

Not applicable.

Informed Consent Statement

Not applicable.

Data Availability Statement

The data sets supporting the results of this article are included within the article and its additional files.

Conflicts of Interest

The authors declare no conflict of interest.

References

  1. Yang, W.; He, C.; Wang, X.; Zhang, Y.; Cheng, Z.; Dai, B.; Zhang, L. Dissolved organic matter (DOM) removal from bio-treated coking wastewater using a new polymeric adsorbent modified with dimethylamino groups. Bioresour. Technol. 2017, 241, 82–87. [Google Scholar] [CrossRef] [PubMed]
  2. Chen, L.; Xu, Y.; Sun, Y. Combination of Coagulation and Ozone Catalytic Oxidation for Pretreating Coking Wastewater. Int. J. Environ. Res. Public Health 2019, 16, 1705. [Google Scholar] [CrossRef] [PubMed] [Green Version]
  3. Lai, P.; Zhao, H.; Wang, C.; Ni, J. Advanced treatment of coking wastewater by coagulation and zero-valent iron processes. J Hazard. Mater. 2007, 147, 232–239. [Google Scholar] [CrossRef] [PubMed]
  4. Li, J.; Wu, J.; Sun, H.; Cheng, F.; Liu, Y. Advanced treatment of biologically treated coking wastewater by membrane distillation coupled with pre-coagulation. Desalination 2016, 380, 43–51. [Google Scholar] [CrossRef]
  5. Jiang, B.; Tan, L.; Ning, S.; Shi, S. A novel integration system of magnetically immobilized cells and a pair of graphite plate-stainless iron mesh electrodes for the bioremediation of coking wastewater. Bioresour. Technol. 2016, 216, 684–690. [Google Scholar] [CrossRef]
  6. Yang, W.; Li, X.; Pan, B.; Lv, L.; Zhang, W. Effective removal of effluent organic matter (EfOM) from bio-treated coking wastewater by a recyclable aminated hyper-cross-linked polymer. Water Res. 2013, 47, 4730–4738. [Google Scholar] [CrossRef]
  7. Zhang, C.; Li, J.; Chen, Z.; Cheng, F. Factors cont rolling adsorption of recalcitrant organic contaminant from bio-treated coking wastewater using lignite activated coke and coal tar-derived activated carbon. J. Chem. Technol. Biotechnol. 2018, 93, 112–120. [Google Scholar] [CrossRef]
  8. Li, N.; Xia, Y.; He, X.; Li, W.; Yuan, L.; Wu, X.; Qin, Y.; Yuan, R.; Gong, X. Glucose Addition Enhanced the Advanced Treatment of Coking Wastewater. Water 2021, 13, 3365. [Google Scholar] [CrossRef]
  9. Li, J.; Yuan, X.; Zhao, H.; Li, F.; Lei, Z.; Zhang, Z. Highly efficient one-step advanced treatment of biologically pretreated coking wastewater by an integration of coagulation and adsorption process. Bioresour. Technol. 2018, 247, 1206–1209. [Google Scholar] [CrossRef]
  10. Jiang, W.; Zhang, G.; Ying, W. Enhanced Carbon Adsorption Process for Advanced Treatment of Biotreated Coking Plant Wastewater. In Proceedings of the 2010 4th International Conference on Bioinformatics and Biomedical Engineering, Chengdu, China, 10–12 June 2010; pp. 1–5. [Google Scholar] [CrossRef]
  11. Haberkamp, J.; Ruhl, A.; Ernst, M.; Jekel, M. Impact of coagulation and adsorption on DOC fractions of secondary effluent and resulting fouling behaviour in ultrafiltration. Water Res. 2007, 41, 3794–3802. [Google Scholar] [CrossRef]
  12. Wang, B.; Shui, Y.; Ren, H.; He, M. Research of combined adsorption-coagulation process in treating petroleum refinery effluent. Environ. Technol. 2017, 38, 456–466. [Google Scholar] [CrossRef] [PubMed]
  13. Badawi, A.K.; Zaher, K. Hybrid treatment system for real textile wastewater remediation based on coagulation/flocculation, adsorption and filtration processes: Performance and economic evaluation. J. Water Process Eng. 2021, 40, 101963. [Google Scholar] [CrossRef]
  14. El Mrabet, I.; Nawdali, M.; Rafqah, S.; Valdés, H.; Benzina, M.; Zaitan, H. Low-cost biomass for the treatment of landfill leachate from Fez City: Application of a combined coagulation–adsorption process. Euro-Mediterranean J. Environ. Integr. 2020, 5, 63. [Google Scholar] [CrossRef]
  15. Premarathna, K.; Rajapaksha, A.U.; Sarkar, B.; Kwon, E.E.; Bhatnagar, A.; Ok, Y.S.; Vithanage, M. Biochar-based engineered composites for sorptive decontamination of water: A review. Chem. Eng. J. 2019, 372, 536–550. [Google Scholar] [CrossRef]
  16. Zhou, H.; Wei, C.; Zhang, F.; Hu, Y.; Wu, H.; Kraslawski, A. A comprehensive evaluation method for sludge pyrolysis and adsorption process in the treatment of coking wastewater. J. Environ. Manag. 2019, 235, 423–431. [Google Scholar] [CrossRef] [PubMed]
  17. Wu, K.; Hu, Y.; Zhang, L.; Xu, L.; Yang, Z. Promoting the sustainable fabrication of bricks from municipal sewage sludge through modifying calcination: Microstructure and performance characterization. Constr. Build. Mater. 2022, 324, 126401. [Google Scholar] [CrossRef]
  18. Jiang, X.; Xie, Y.; Liu, M.; Bin, S.; Liu, Y.; Huan, C.; Ji, G.; Wang, X.; Yan, Z.; Lyu, Q. Study on anaerobic co-digestion of municipal sewage sludge and fruit and vegetable wastes: Methane production, microbial community and three-dimension fluorescence excitation-emission matrix analysis. Bioresour. Technol. 2022, 347, 126748. [Google Scholar] [CrossRef]
  19. Devi, P.; Saroha, A.K. Utilization of sludge based adsorbents for the removal of various pollutants: A review. Sci. Total Environ. 2017, 578, 16–33. [Google Scholar] [CrossRef]
  20. Liu, Z.; Singer, S.; Tong, Y.; Kimbell, L.; Anderson, E.; Hughes, M.; Zitomer, D.; McNamara, P. Characteristics and applications of biochars derived from wastewater solids. Renew. Sustain. Energy Rev. 2018, 90, 650–664. [Google Scholar] [CrossRef]
  21. Pan, X.; Gu, Z.; Chen, W.; Li, Q. Preparation of biochar and biochar composites and their application in a Fenton-like process for wastewater decontamination: A review. Sci. Total Environ. 2021, 754, 142104. [Google Scholar] [CrossRef]
  22. Xiang, W.; Zhang, X.; Chen, J.; Zou, W.; He, F.; Hu, X.; Tsang, D.C.W.; Ok, Y.S.; Gao, B. Biochar technology in wastewater treatment: A critical review. Chemosphere 2020, 252, 126539. [Google Scholar] [CrossRef] [PubMed]
  23. Sun, P.; Li, Y.; Meng, T.; Zhang, R.; Song, M.; Ren, J. Removal of sulfonamide antibiotics and human metabolite by biochar and biochar/H2O2 in synthetic urine. Water Res. 2018, 147, 91–100. [Google Scholar] [CrossRef] [PubMed]
  24. Yang, X.; Igalavithana, A.D.; Oh, S.-E.; Nam, H.; Zhang, M.; Wang, C.-H.; Kwon, E.E.; Tsang, D.C.; Ok, Y.S. Characterization of bioenergy biochar and its utilization for metal/metalloid immobilization in contaminated soil. Sci. Total Environ. 2018, 640, 704–713. [Google Scholar] [CrossRef] [PubMed]
  25. Shi, Y.; Hu, H.; Ren, H. Dissolved organic matter (DOM) removal from biotreated coking wastewater by chitosan-modified biochar: Adsorption fractions and mechanisms. Bioresour. Technol. 2020, 297, 122281. [Google Scholar] [CrossRef]
  26. Chen, W.; Westerhoff, P.; Leenheer, J.A.; Booksh, K. Fluorescence Excitation−Emission Matrix Regional Integration to Quantify Spectra for Dissolved Organic Matter. Environ. Sci. Technol. 2003, 37, 5701–5710. [Google Scholar] [CrossRef] [PubMed]
  27. He, X.; Fan, Q. Investigating the effect of landfill leachates on the characteristics of dissolved organic matter in groundwater using excitation–emission matrix fluorescence spectra coupled with fluorescence regional integration and self-organizing map. Environ. Sci. Pollut. Res. 2016, 23, 21229–21237. [Google Scholar] [CrossRef]
  28. Teh, C.Y.; Budiman, P.M.; Shak, K.P.Y.; Wu, T.Y. Recent Advancement of Coagulation–Flocculation and Its Application in Wastewater Treatment. Ind. Eng. Chem. Res. 2016, 55, 4363–4389. [Google Scholar] [CrossRef]
  29. Sillanpää, M.; Ncibi, M.C.; Matilainen, A.; Vepsäläinen, M. Removal of natural organic matter in drinking water treatment by coagulation: A comprehensive review. Chemosphere 2018, 190, 54–71. [Google Scholar] [CrossRef]
  30. Wang, S.; Li, E.; Li, J.; Du, Z.; Cheng, F. Preparation and coagulation-flocculation performance of covalently bound organic hybrid coagulant with excellent stability. Colloids Surf. A Physicochem. Eng. Asp. 2020, 600, 124966. [Google Scholar] [CrossRef]
  31. Wang, Z.; Yang, L.; Zhang, P.; Cui, J.; Chen, P.; Ding, Q.; Cui, X.; Xing, H. Highly Microporous Activated Carbons with Industrial Potential for Selective Adsorption of Ethane over Ethylene. Ind. Eng. Chem. Res. 2021, 60, 13301–13308. [Google Scholar] [CrossRef]
  32. Liu, S.; Peng, Y.; Chen, J.; Yan, T.; Zhang, Y.; Liu, J.; Li, J. A new insight into adsorption state and mechanism of adsorbates in porous materials. J. Hazard. Mater. 2020, 382, 121103. [Google Scholar] [CrossRef] [PubMed]
  33. Li, Y.-H.; Chang, F.-M.; Huang, B.; Song, Y.-P.; Zhao, H.-Y.; Wang, K.-J. Activated carbon preparation from pyrolysis char of sewage sludge and its adsorption performance for organic compounds in sewage. Fuel 2020, 266, 117053. [Google Scholar] [CrossRef]
  34. Shikata, T.; Okuzono, M. Are All Polar Molecules Hydrophilic? Hydration Numbers of Ketones and Esters in Aqueous Solution. J. Phys. Chem. B 2013, 117, 7718–7723. [Google Scholar] [CrossRef] [PubMed]
  35. Monroe, J.I.; Jiao, S.; Davis, R.J.; Brown, D.R.; Katz, L.E.; Shell, M.S. Affinity of small-molecule solutes to hydrophobic, hydrophilic, and chemically patterned interfaces in aqueous solution. Proc. Natl. Acad. Sci. USA 2021, 118, e2020205118. [Google Scholar] [CrossRef]
  36. Ahmed, M.B.; Johir, A.H.; Khourshed, C.; Zhou, J.L.; Ngo, H.H.; Nghiem, L.; Moni, M.; Sun, L. Sorptive removal of dissolved organic matter in biologically-treated effluent by functionalized biochar and carbon nanotubes: Importance of sorbent functionality. Bioresour. Technol. 2018, 269, 9–17. [Google Scholar] [CrossRef]
  37. Wang, B.; Gao, B.; Fang, J. Recent advances in engineered biochar productions and applications. Crit. Rev. Environ. Sci. Technol. 2017, 47, 2158–2207. [Google Scholar] [CrossRef]
  38. Wu, Z.; Zhong, H.; Yuan, X.; Wang, H.; Wang, L.; Chen, X.; Zeng, G.; Wu, Y. Adsorptive removal of methylene blue by rhamnolipid-functionalized graphene oxide from wastewater. Water Res. 2014, 67, 330–344. [Google Scholar] [CrossRef]
  39. Gao, L.; Wen, H.; Tian, Q.; Wang, Y.; Li, G. Influence of surface modification by sulfuric acid on coking coal′s adsorption of coking wastewater. Water Sci. Technol. 2017, 76, 555–566. [Google Scholar] [CrossRef]
  40. Wei, C.; Wu, H.; Kong, Q.; Wei, J.; Feng, C.; Qiu, G.; Wei, C.; Li, F. Residual chemical oxygen demand (COD) fractionation in bio-treated coking wastewater integrating solution property characterization. J. Environ. Manag. 2019, 246, 324–333. [Google Scholar] [CrossRef]
  41. Li, Y.; Li, Q.; Wu, C.; Luo, X.; Yu, X.; Chen, M. The inappropriate application of the regression Langmuir Qm for adsorption capacity comparison. Sci. Total Environ. 2020, 699, 134222. [Google Scholar] [CrossRef]
  42. Liu, Y.; Cheng, H.; He, Y. Application and Mechanism of Sludge-Based Activated Carbon for Phenol and Cyanide Removal from Bio-Treated Effluent of Coking Wastewater. Processes 2020, 8, 82. [Google Scholar] [CrossRef] [Green Version]
  43. Nayl, A.E.A.; Elkhashab, R.A.; El Malah, T.; Yakout, S.M.; El-Khateeb, M.A.; Ali, M.M.S.; Ali, H. Adsorption studies on the removal of COD and BOD from treated sewage using activated carbon prepared from date palm waste. Environ. Sci. Pollut. Res. 2017, 24, 22284–22293. [Google Scholar] [CrossRef] [PubMed]
  44. Sarkar, M.; Majumdar, P. Application of response surface methodology for optimization of heavy metal biosorption using surfactant modified chitosan bead. Chem. Eng. J. 2011, 175, 376–387. [Google Scholar] [CrossRef]
  45. Yang, W.; Wang, J.; Hua, M.; Zhang, Y.; Shi, X. Characterization of effluent organic matter from different coking wastewater treatment plants. Chemosphere 2018, 203, 68–75. [Google Scholar] [CrossRef] [PubMed]
  46. Bu, L.; Wang, K.; Zhao, Q.-L.; Wei, L.-L.; Zhang, J.; Yang, J.-C. Characterization of dissolved organic matter during landfill leachate treatment by sequencing batch reactor, aeration corrosive cell-Fenton, and granular activated carbon in series. J. Hazard. Mater. 2010, 179, 1096–1105. [Google Scholar] [CrossRef]
  47. Wang, D.; Hu, Q.; Li, M.; Wang, C.; Ji, M. Evaluating the removal of organic fraction of commingled chemical industrial wastewater by activated sludge process augmented with powdered activated carbon. Arab. J. Chem. 2016, 9, 1951–1961. [Google Scholar] [CrossRef] [Green Version]
  48. Han, Y.; Wu, C.; Su, Z.; Fu, X.; Xu, Y. Micro-electrolysis biological fluidized bed process for coking wastewater treatment. J. Water Process Eng. 2020, 38, 101624. [Google Scholar] [CrossRef]
  49. Chen, W.; Habibul, N.; Liu, X.; Sheng, G.; Yu, H. FTIR and Synchronous Fluorescence Heterospectral Two-Dimensional Correlation Analyses on the Binding Characteristics of Copper onto Dissolved Organic Matter. Environ. Sci. Technol. 2015, 49, 2052–2058. [Google Scholar] [CrossRef]
  50. Dong, H.; Zhang, K.; Han, X.; Du, B.; Wei, Q.; Wei, D. Achievement, performance and characteristics of microbial products in a partial nitrification sequencing batch reactor as a pretreatment for anaerobic ammonium oxidation. Chemosphere 2017, 183, 212–218. [Google Scholar] [CrossRef]
  51. Allpike, B.P.; Heitz, A.; Joll, C.A.; Kagi, R.I.; Abbt-Braun, G.; Frimmel, F.H.; Brinkmann, T.; Her, N.; Amy, G. Size Exclusion Chromatography To Characterize DOC Removal in Drinking Water Treatment. Environ. Sci. Technol. 2005, 39, 2334–2342. [Google Scholar] [CrossRef]
  52. Kamei, N.; Tamiwa, H.; Miyata, M.; Haruna, Y.; Matsumura, K.; Ogino, H.; Hirano, S.; Higashiyama, K.; Takeda-Morishita, M. Hydrophobic Amino Acid Tryptophan Shows Promise as a Potential Absorption Enhancer for Oral Delivery of Biopharmaceuticals. Pharmaceutics 2018, 10, 182. [Google Scholar] [CrossRef] [PubMed] [Green Version]
  53. Podorieszach, A.P.; Huttunen-Hennelly, H.E.K. The effects of tryptophan and hydrophobicity on the structure and bioactivity of novel indolicidin derivatives with promising pharmaceutical potential. Org. Biomol. Chem. 2010, 8, 1679. [Google Scholar] [CrossRef] [PubMed]
  54. Li, P.; Hur, J. Utilization of UV-Vis spectroscopy and related data analyses for dissolved organic matter (DOM) studies: A review. Crit. Rev. Environ. Sci. Technol. 2018, 48, 1030. [Google Scholar] [CrossRef]
  55. Zhou, X.; Hou, Z.; Song, J.; Lv, L. Spectrum evolution of dissolved aromatic organic matters (DAOMs) during electro-peroxi-coagulation pretreatment of coking wastewater. Sep. Purif. Technol. 2020, 235, 116125. [Google Scholar] [CrossRef]
  56. Xu, R.; Ou, H.; Yu, X.; He, R.; Lin, C.; Wei, C. Spectroscopic characterization of dissolved organic matter in coking wastewater during bio-treatment: Full-scale plant study. Water Sci. Technol. 2015, 72, 1411–1420. [Google Scholar] [CrossRef]
  57. Ghosh, T.K.; Biswas, P.; Bhunia, P.; Kadukar, S.; Banerjee, S.K.; Ghosh, R.; Sarkar, S. Application of coke breeze for removal of colour from coke plant wastewater. J. Environ. Manag. 2022, 302, 113800. [Google Scholar] [CrossRef]
  58. Xin, C.; Wang, J.; Zhang, Y.; Liu, Y.; Jia, H.; Li, L. Application of UV-vis absorption spectrum to test the membrane integrity of Membrane bioreactor (MBR). Water Res. 2021, 198, 117153. [Google Scholar] [CrossRef]
  59. Al-Juboori, R.A.; Yusaf, T.; Pittaway, P.A. Exploring the correlations between common UV measurements and chemical fractionation for natural waters. Desalination Water Treat. 2016, 57, 16324–16335. [Google Scholar] [CrossRef]
Figure 1. Variation in removal efficiency with polyaluminum chloride dosage.
Water 14 02446 g001
Figure 2. (a) Variable of removal efficiency of SAC dosage, (b) Variable of removal efficiency of adsorption time.
Water 14 02446 g002
Figure 3. Non-linear Freundlich adsorption isotherm.
Water 14 02446 g003
Figure 4. (a) Proportion of DOM components in the raw BTCW; (b,c) proportion of DOM components after coagulation and PAC treatment; (d) removal efficiency of DOM components by coagulation combined and SAC treatment.
Water 14 02446 g004
Figure 5. (ad) EEM spectra of (a) raw wastewater, (b) coagulation effluent, (c) SAC adsorption effluent, and (d) PAC adsorption effluent.
Water 14 02446 g005
Figure 6. Integral standard volume and proportion of each fluorescence area of 3D-EEM. Q1 corresponds to tyrosine-like organic compounds; Q2 corresponds to tryptophan-like organic compounds; Q3 corresponds to fulvic acid-like organic compounds; and Q4 and Q5 corresponded to soluble microbial by-products and humic acid-like organic compounds, respectively.
Water 14 02446 g006
Figure 7. UV-vis absorbance spectra of BTCW and effluents of coagulation and SAC and PAC treatments.
Water 14 02446 g007
Figure 8. Adsorption–desorption performance of SAC.
Water 14 02446 g008
Table 1. Main water quality parameters of BTCW.
COD (mg/L)BOD5 (mg/L)pHNO3-N (mg/L)NH4+-N (mg/L)
200~25020~257.0~8.011.5~14.04.0~4.5
Table 2. Specific surface area and pore size parameters of SAC and PAC.
SamplesSBET
(m2/g)
Smicro
(m2/g)
Vmicro
(cm3/g)
Vmeso
(cm3/g)
Vtotal
(cm3/g)
Dp
(nm)
SACB 1710.175414.1420.1870.2460.4332.436
A 2689.674375.8740.1630.2590.4222.447
PACB 1789.189350.0210.1470.6870.8342.113
A 2632.617295.5740.1250.5580.6834.319
1 B, before adsorption; 2 A, after adsorption.
Table 3. Spectral characteristic parameters of BTCW and effluent with coagulation and SAC and PAC treatments.
Samplesa254a300A254/A204E2/E3E3/E4
Raw wastewater683.66399.260.83653.6140.20
Coagulation effluent433.16233.970.53114.2673.43
SAC adsorption effluent20.4911.280.02982.2510.80
PAC adsorption effluent32.1515.800.04492.9018.00
Publisher’s Note: MDPI stays neutral with regard to jurisdictional claims in published maps and institutional affiliations.

