
Driving Effects and Spatial-Temporal Variations in Economic Losses Due to Flood Disasters in China

 ,
,
Abstract
:1. Introduction
2. Methods
2.1. Kaya Identity
2.2. Logarithmic Mean Divisia Index
2.3. Study Object and Data Sources
3. Results and Discussion
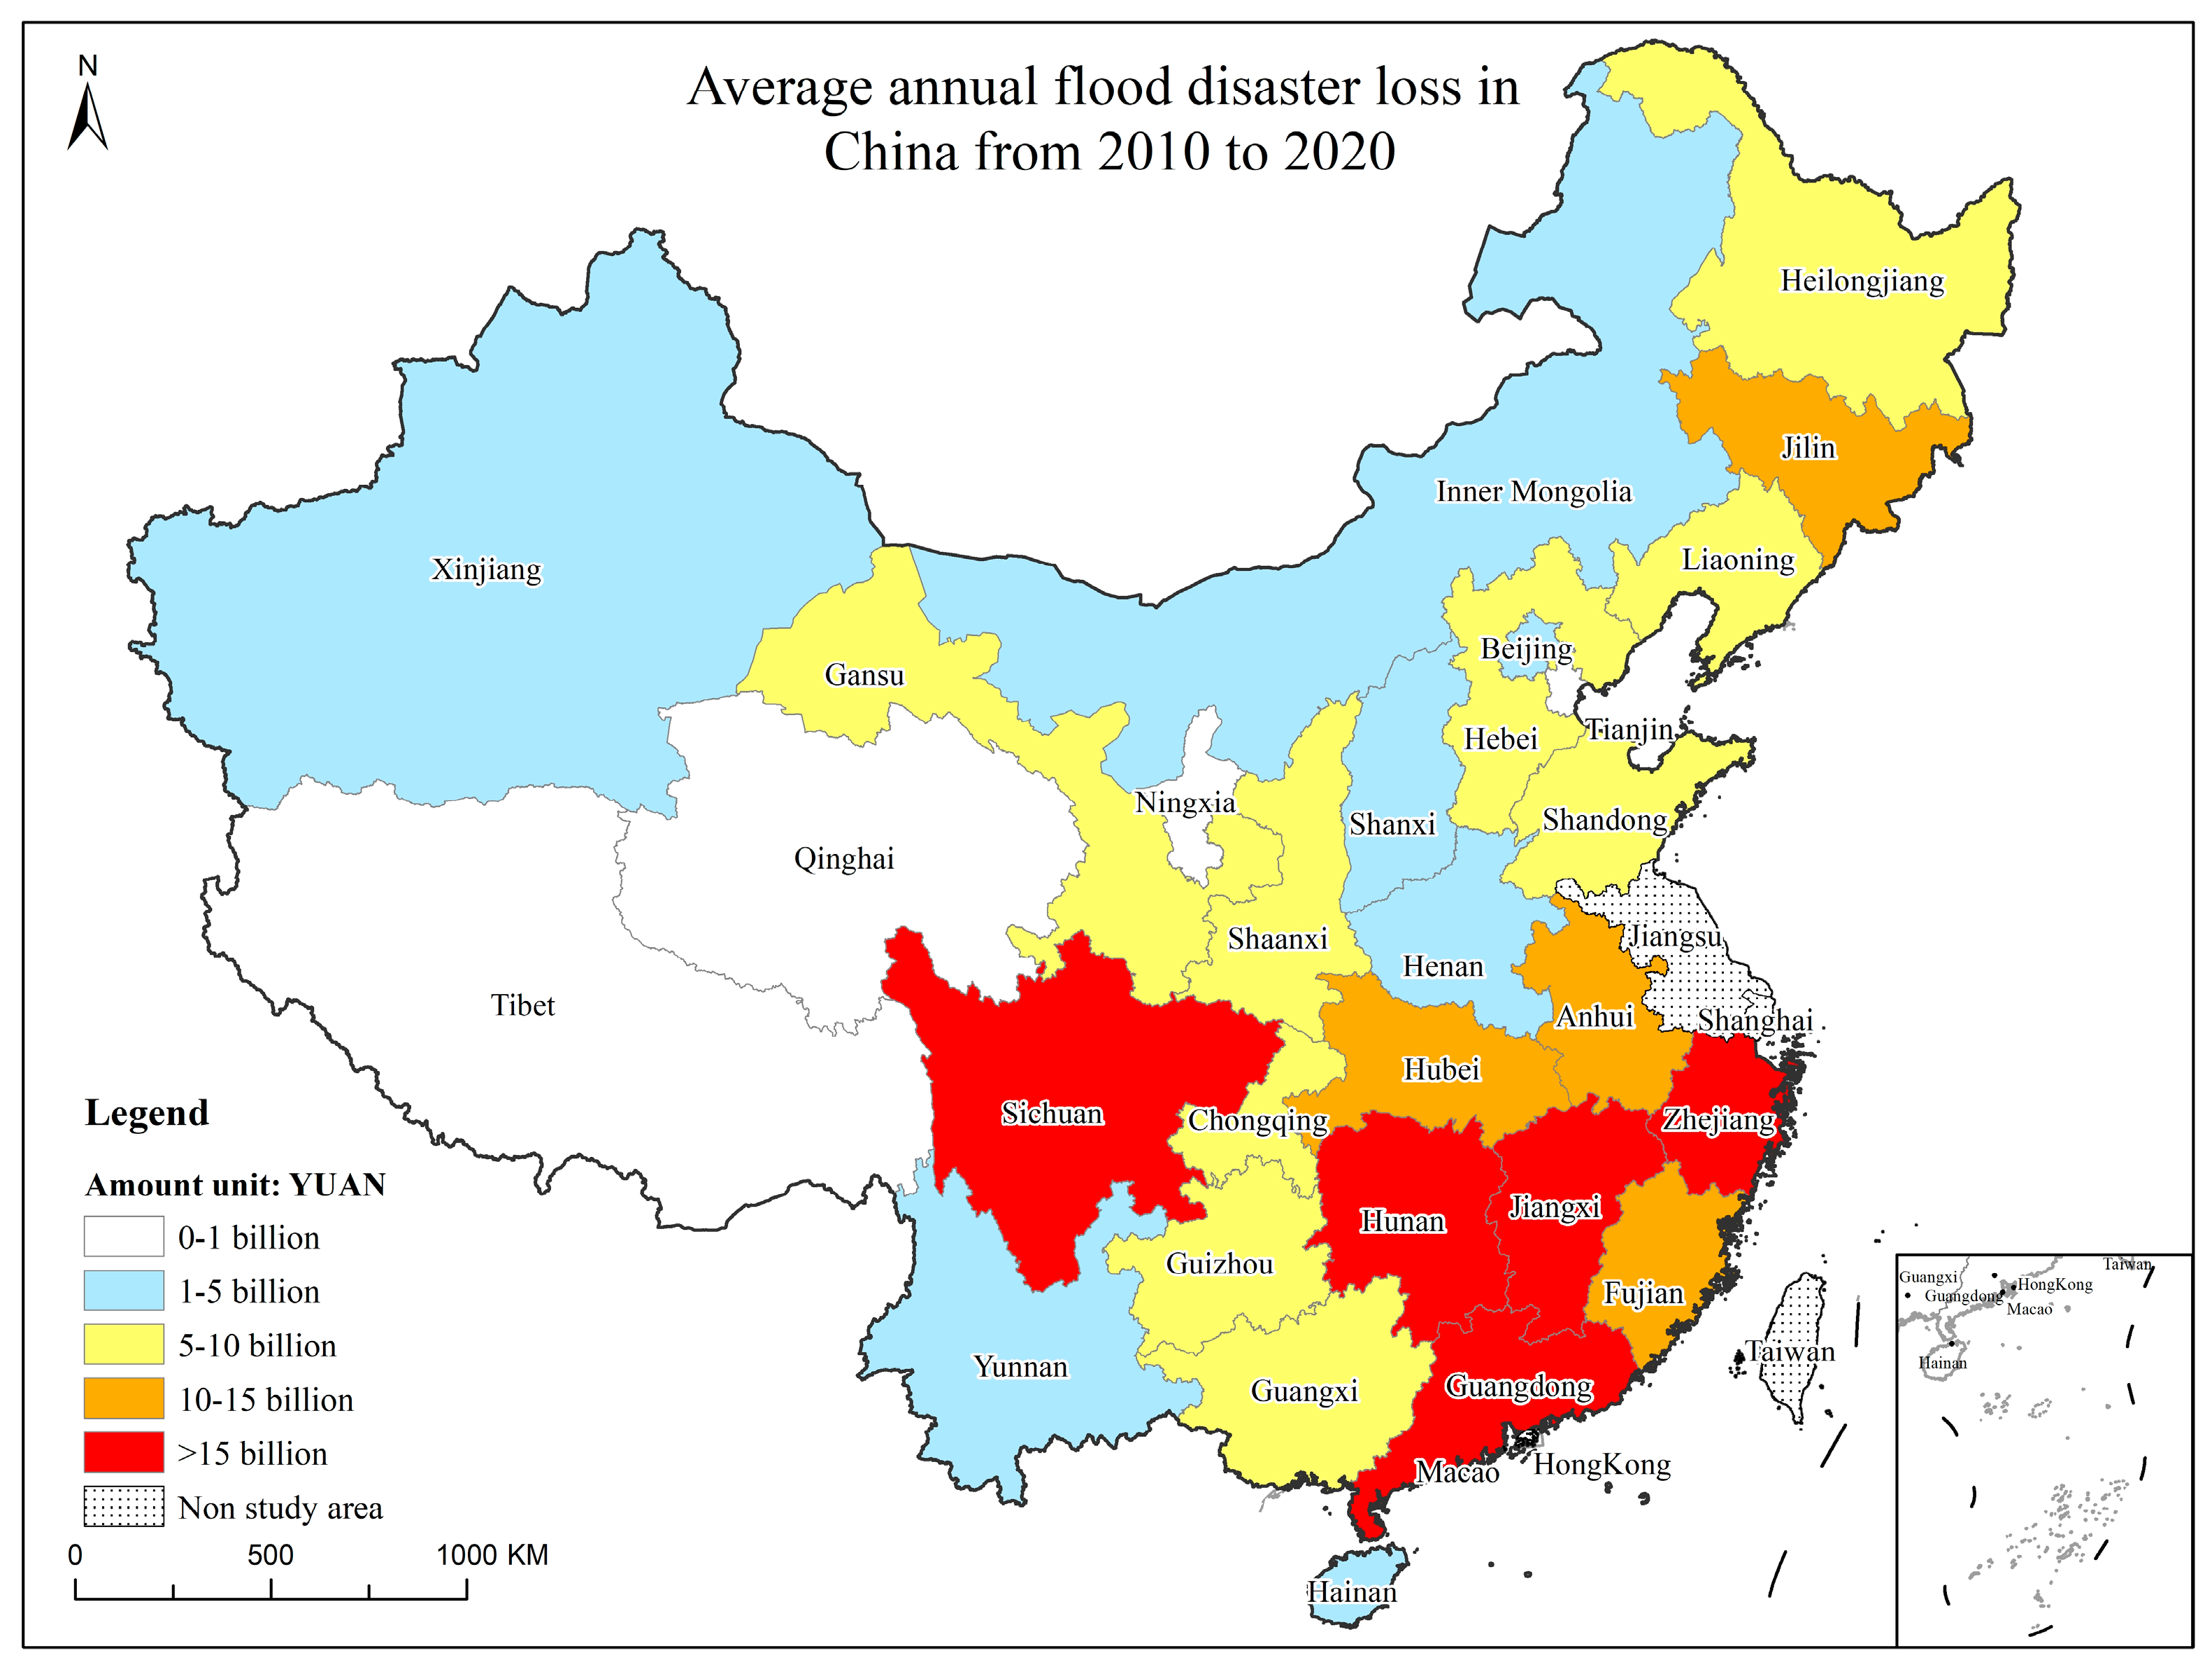
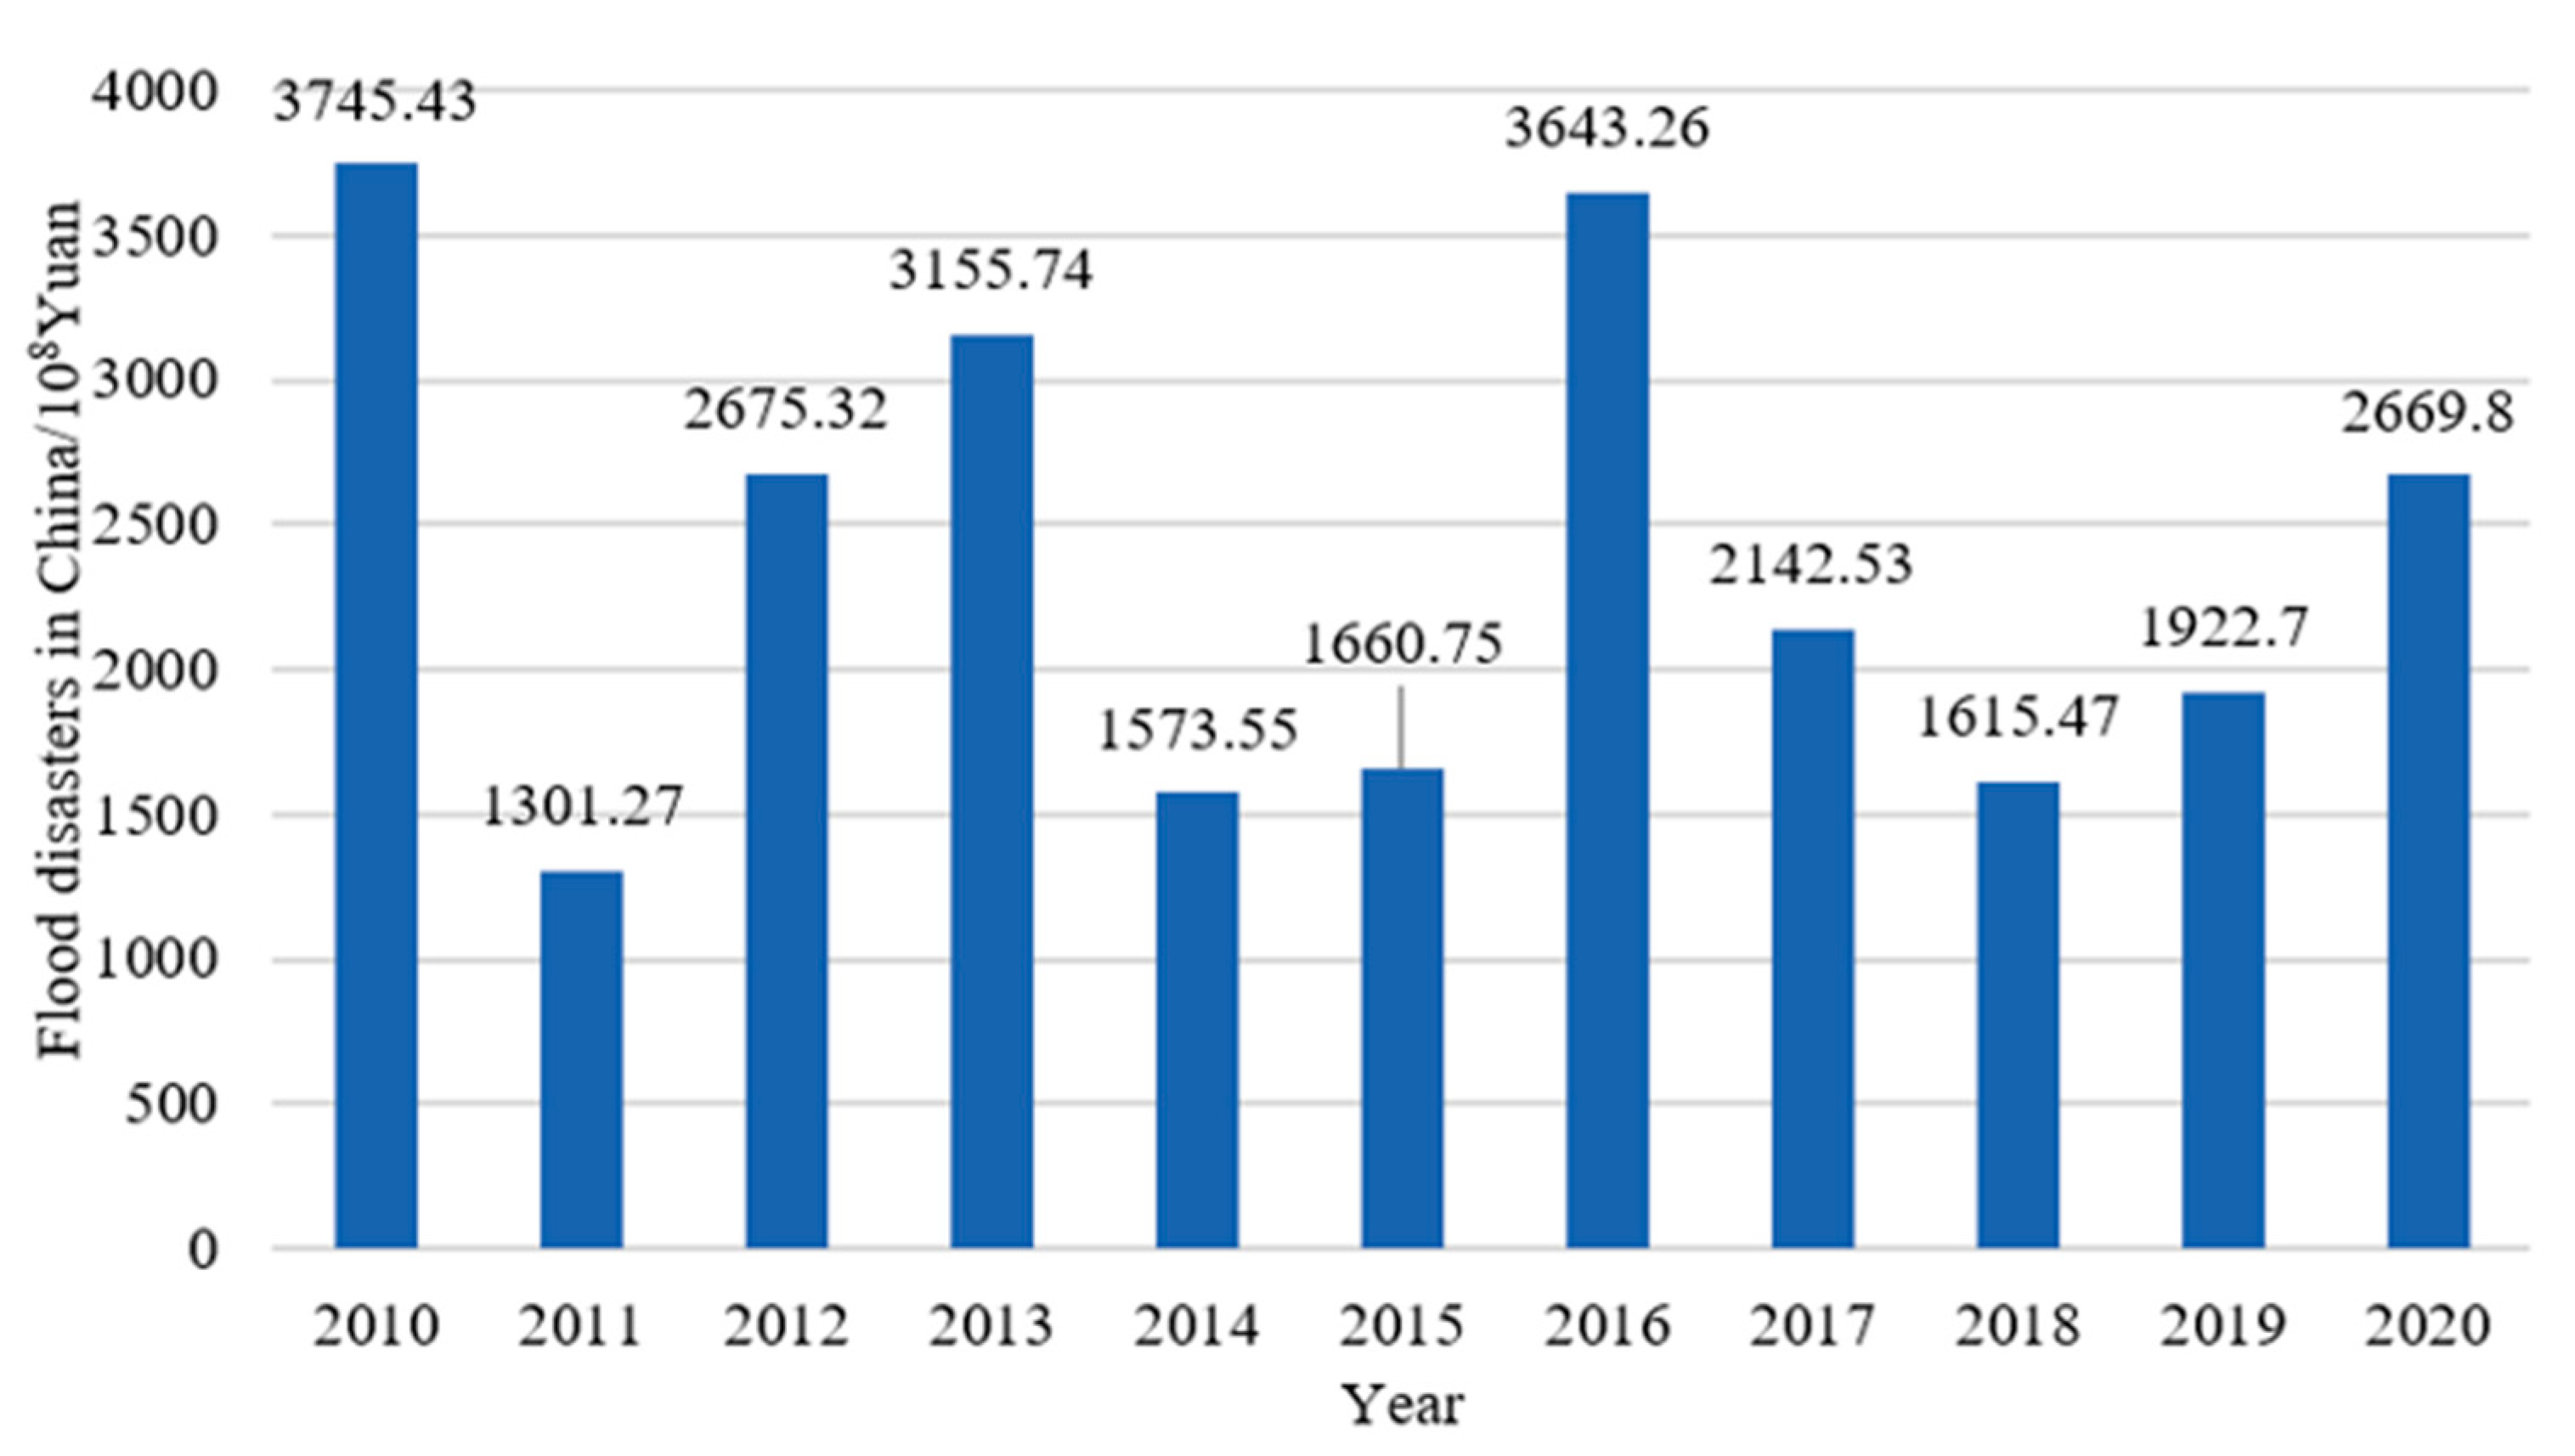
3.1. Temporal and Spatial Distribution of Flood-Related Economic Losses in China
3.2. Analysis of the Driving Factors of Flood-Related Economic Loss
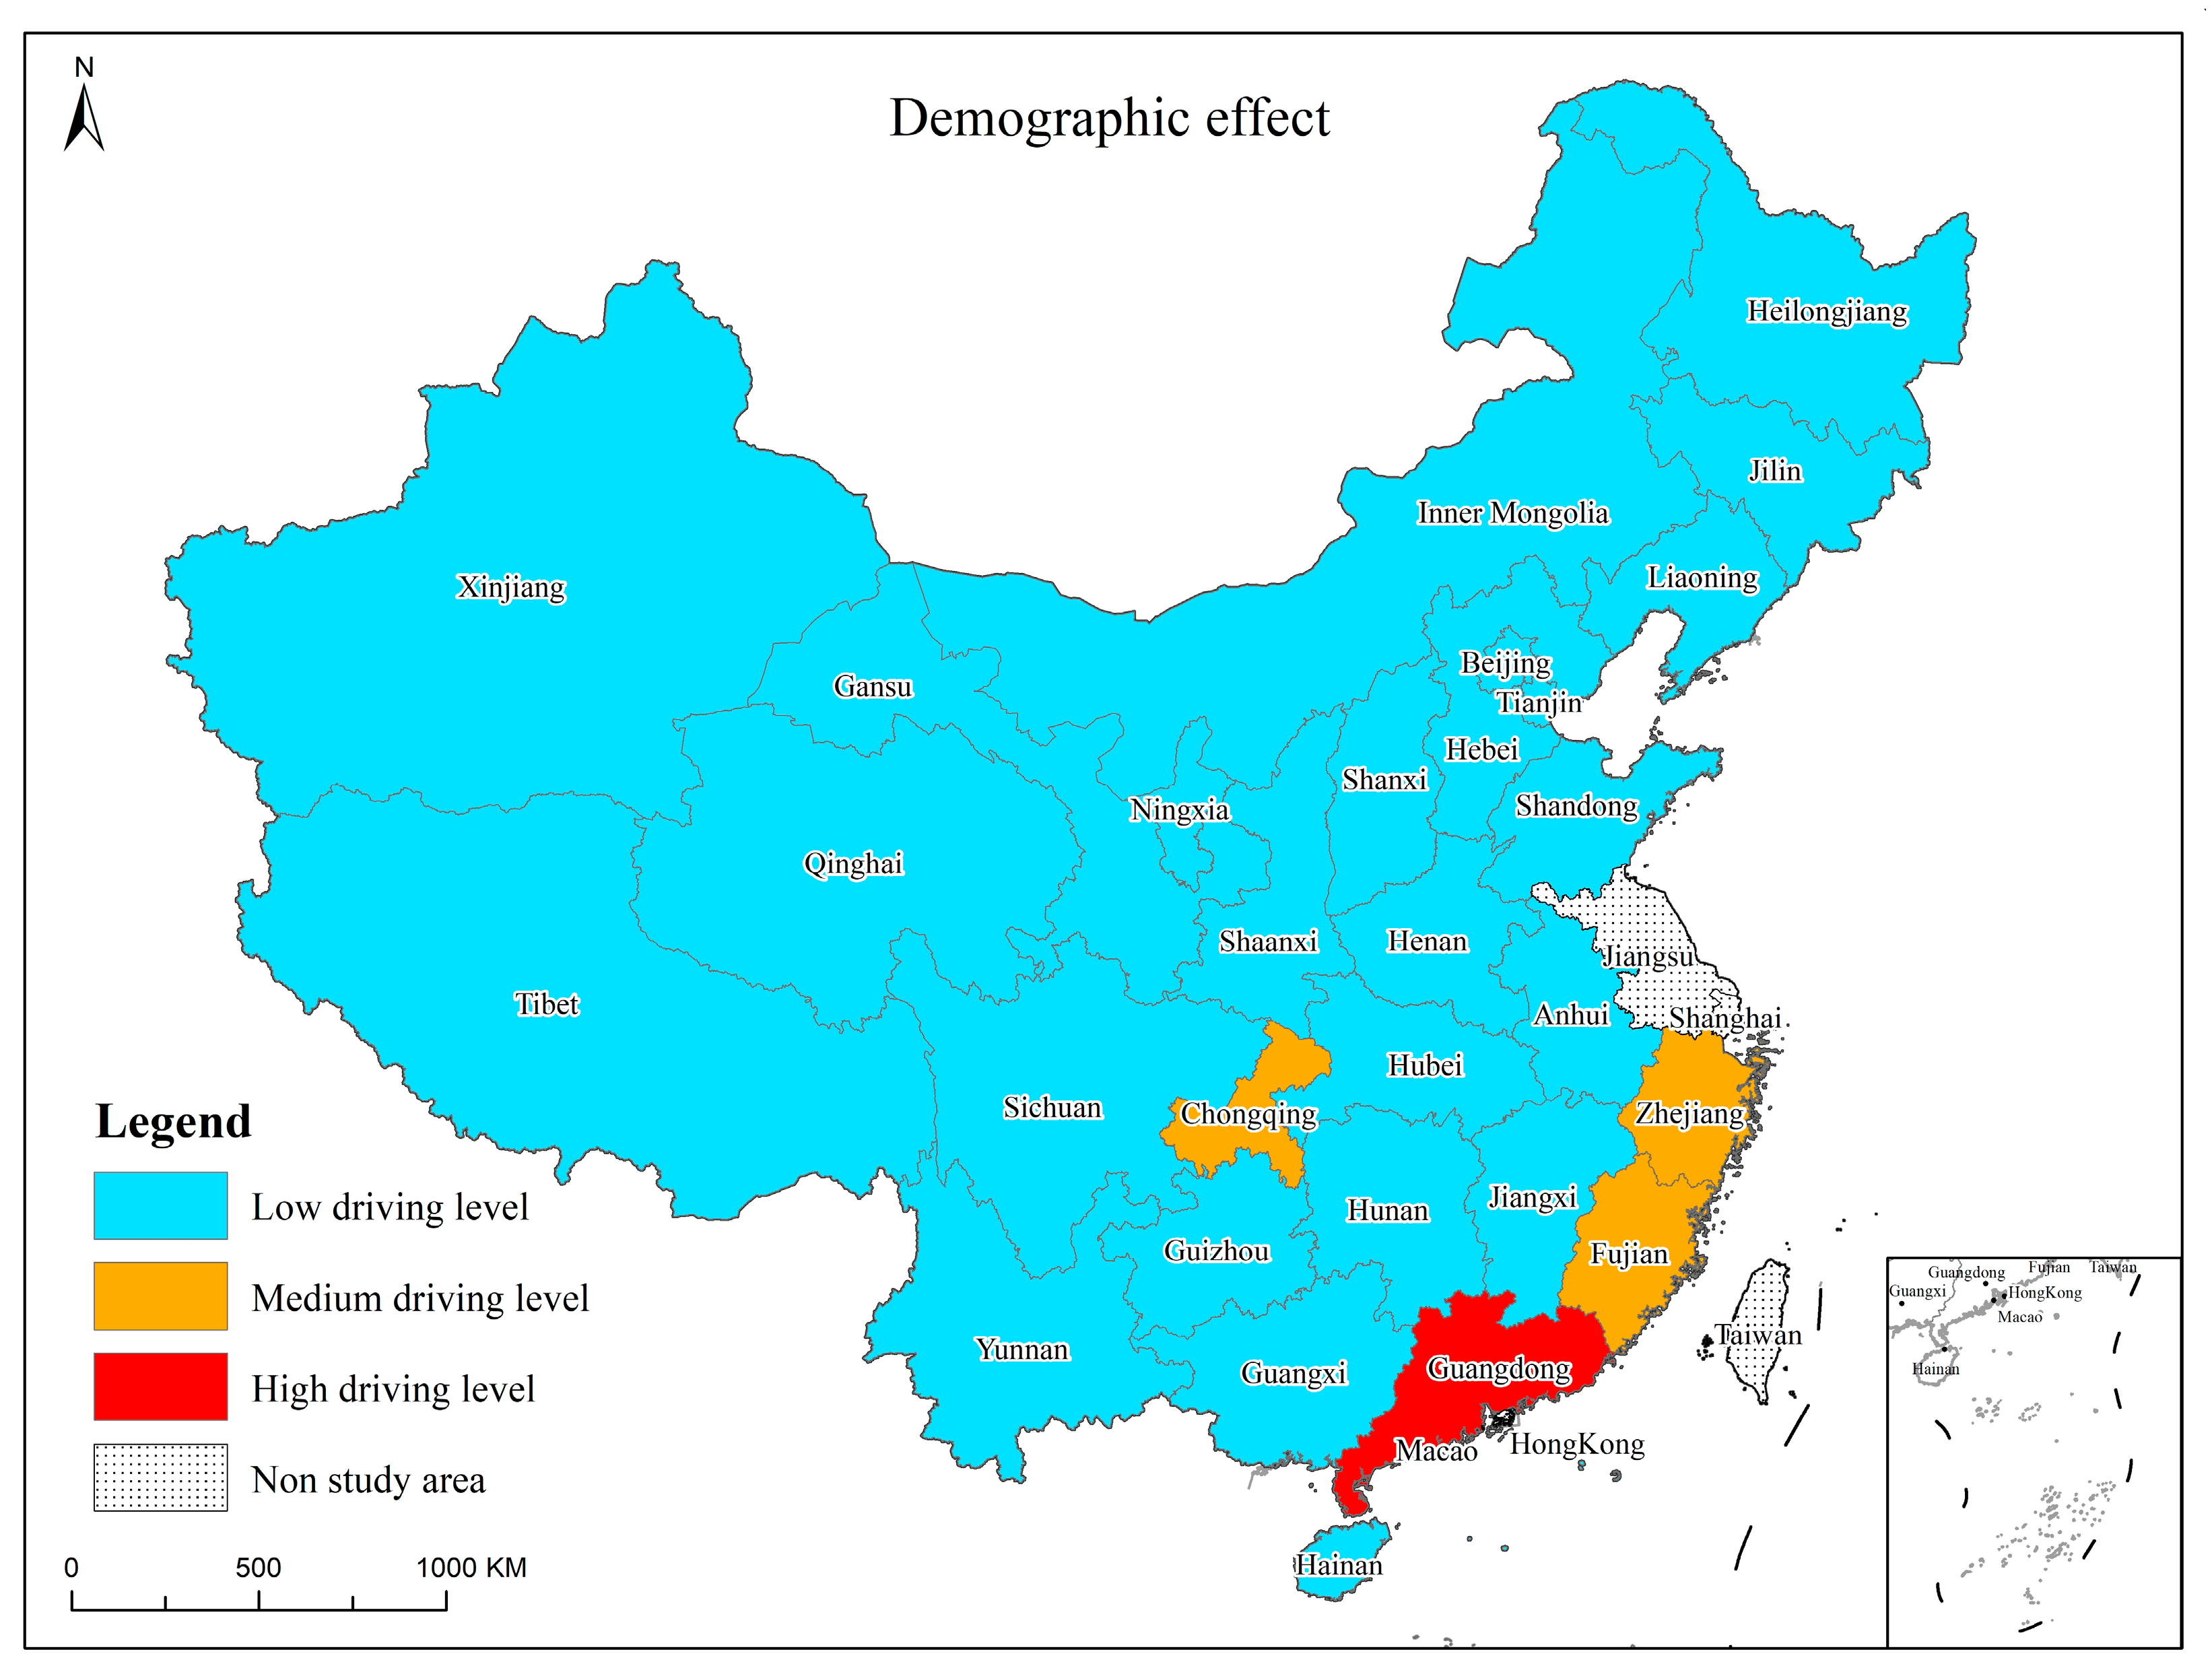
3.2.1. Demographic Effect
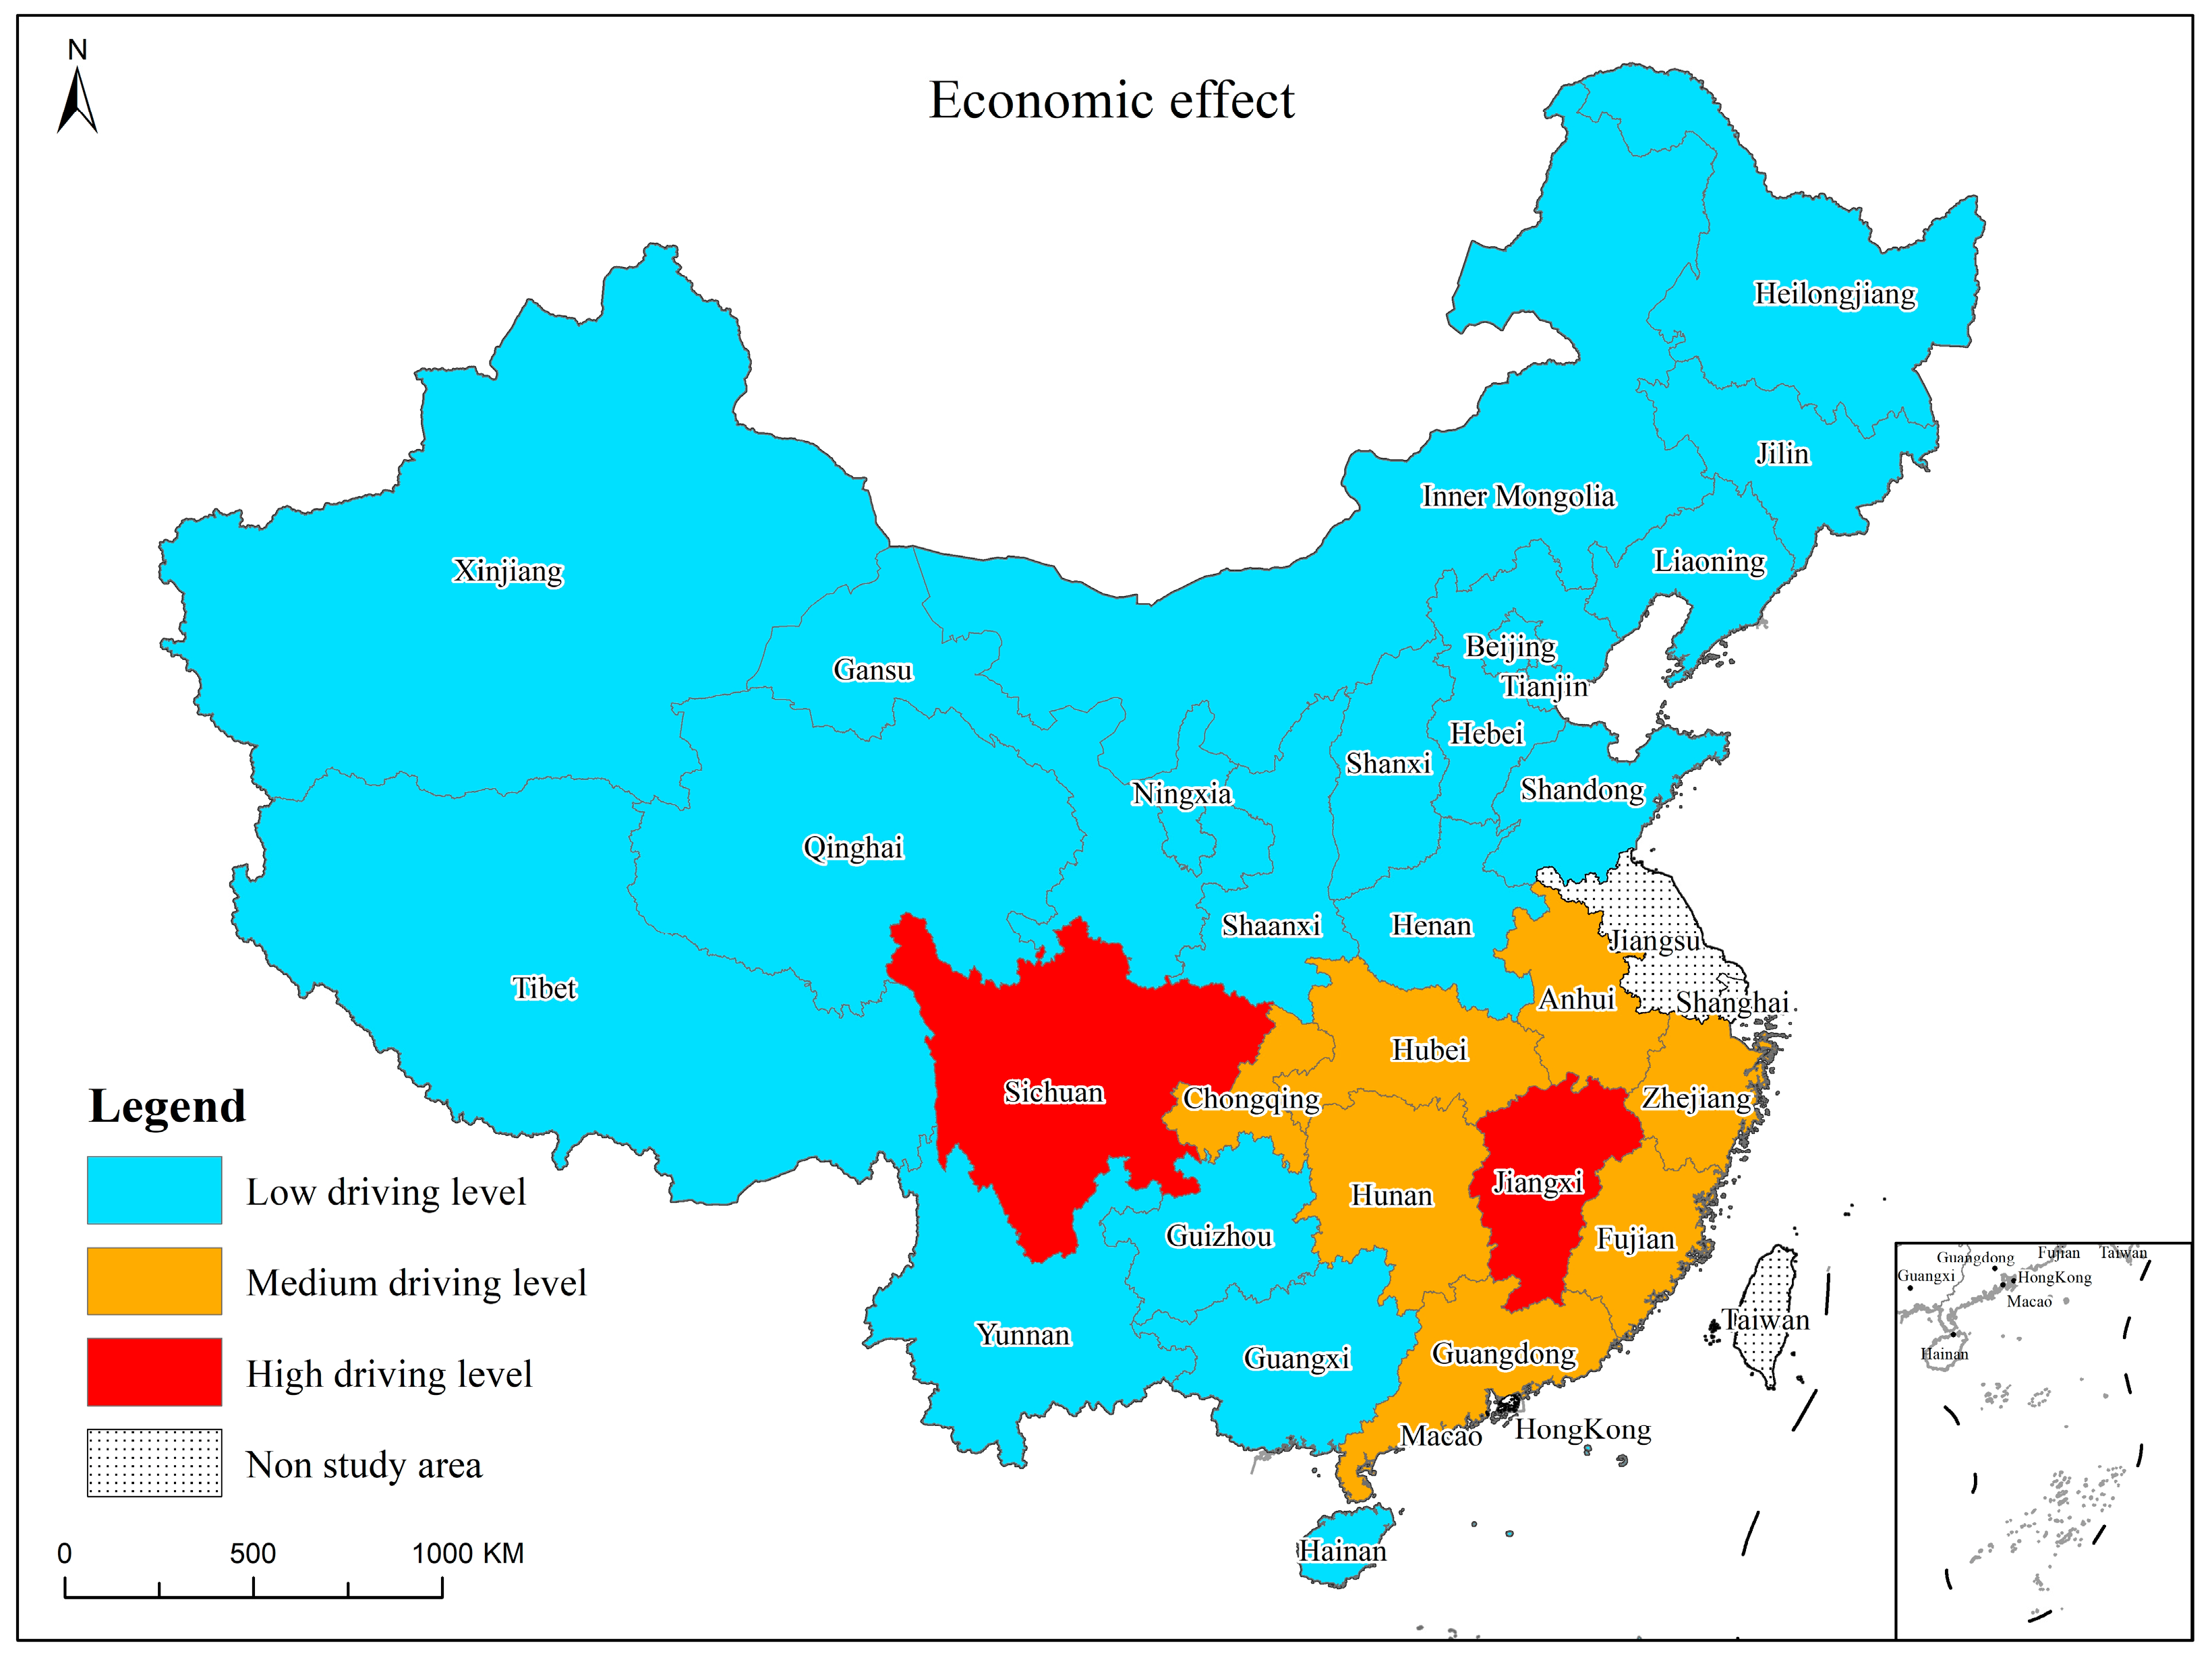
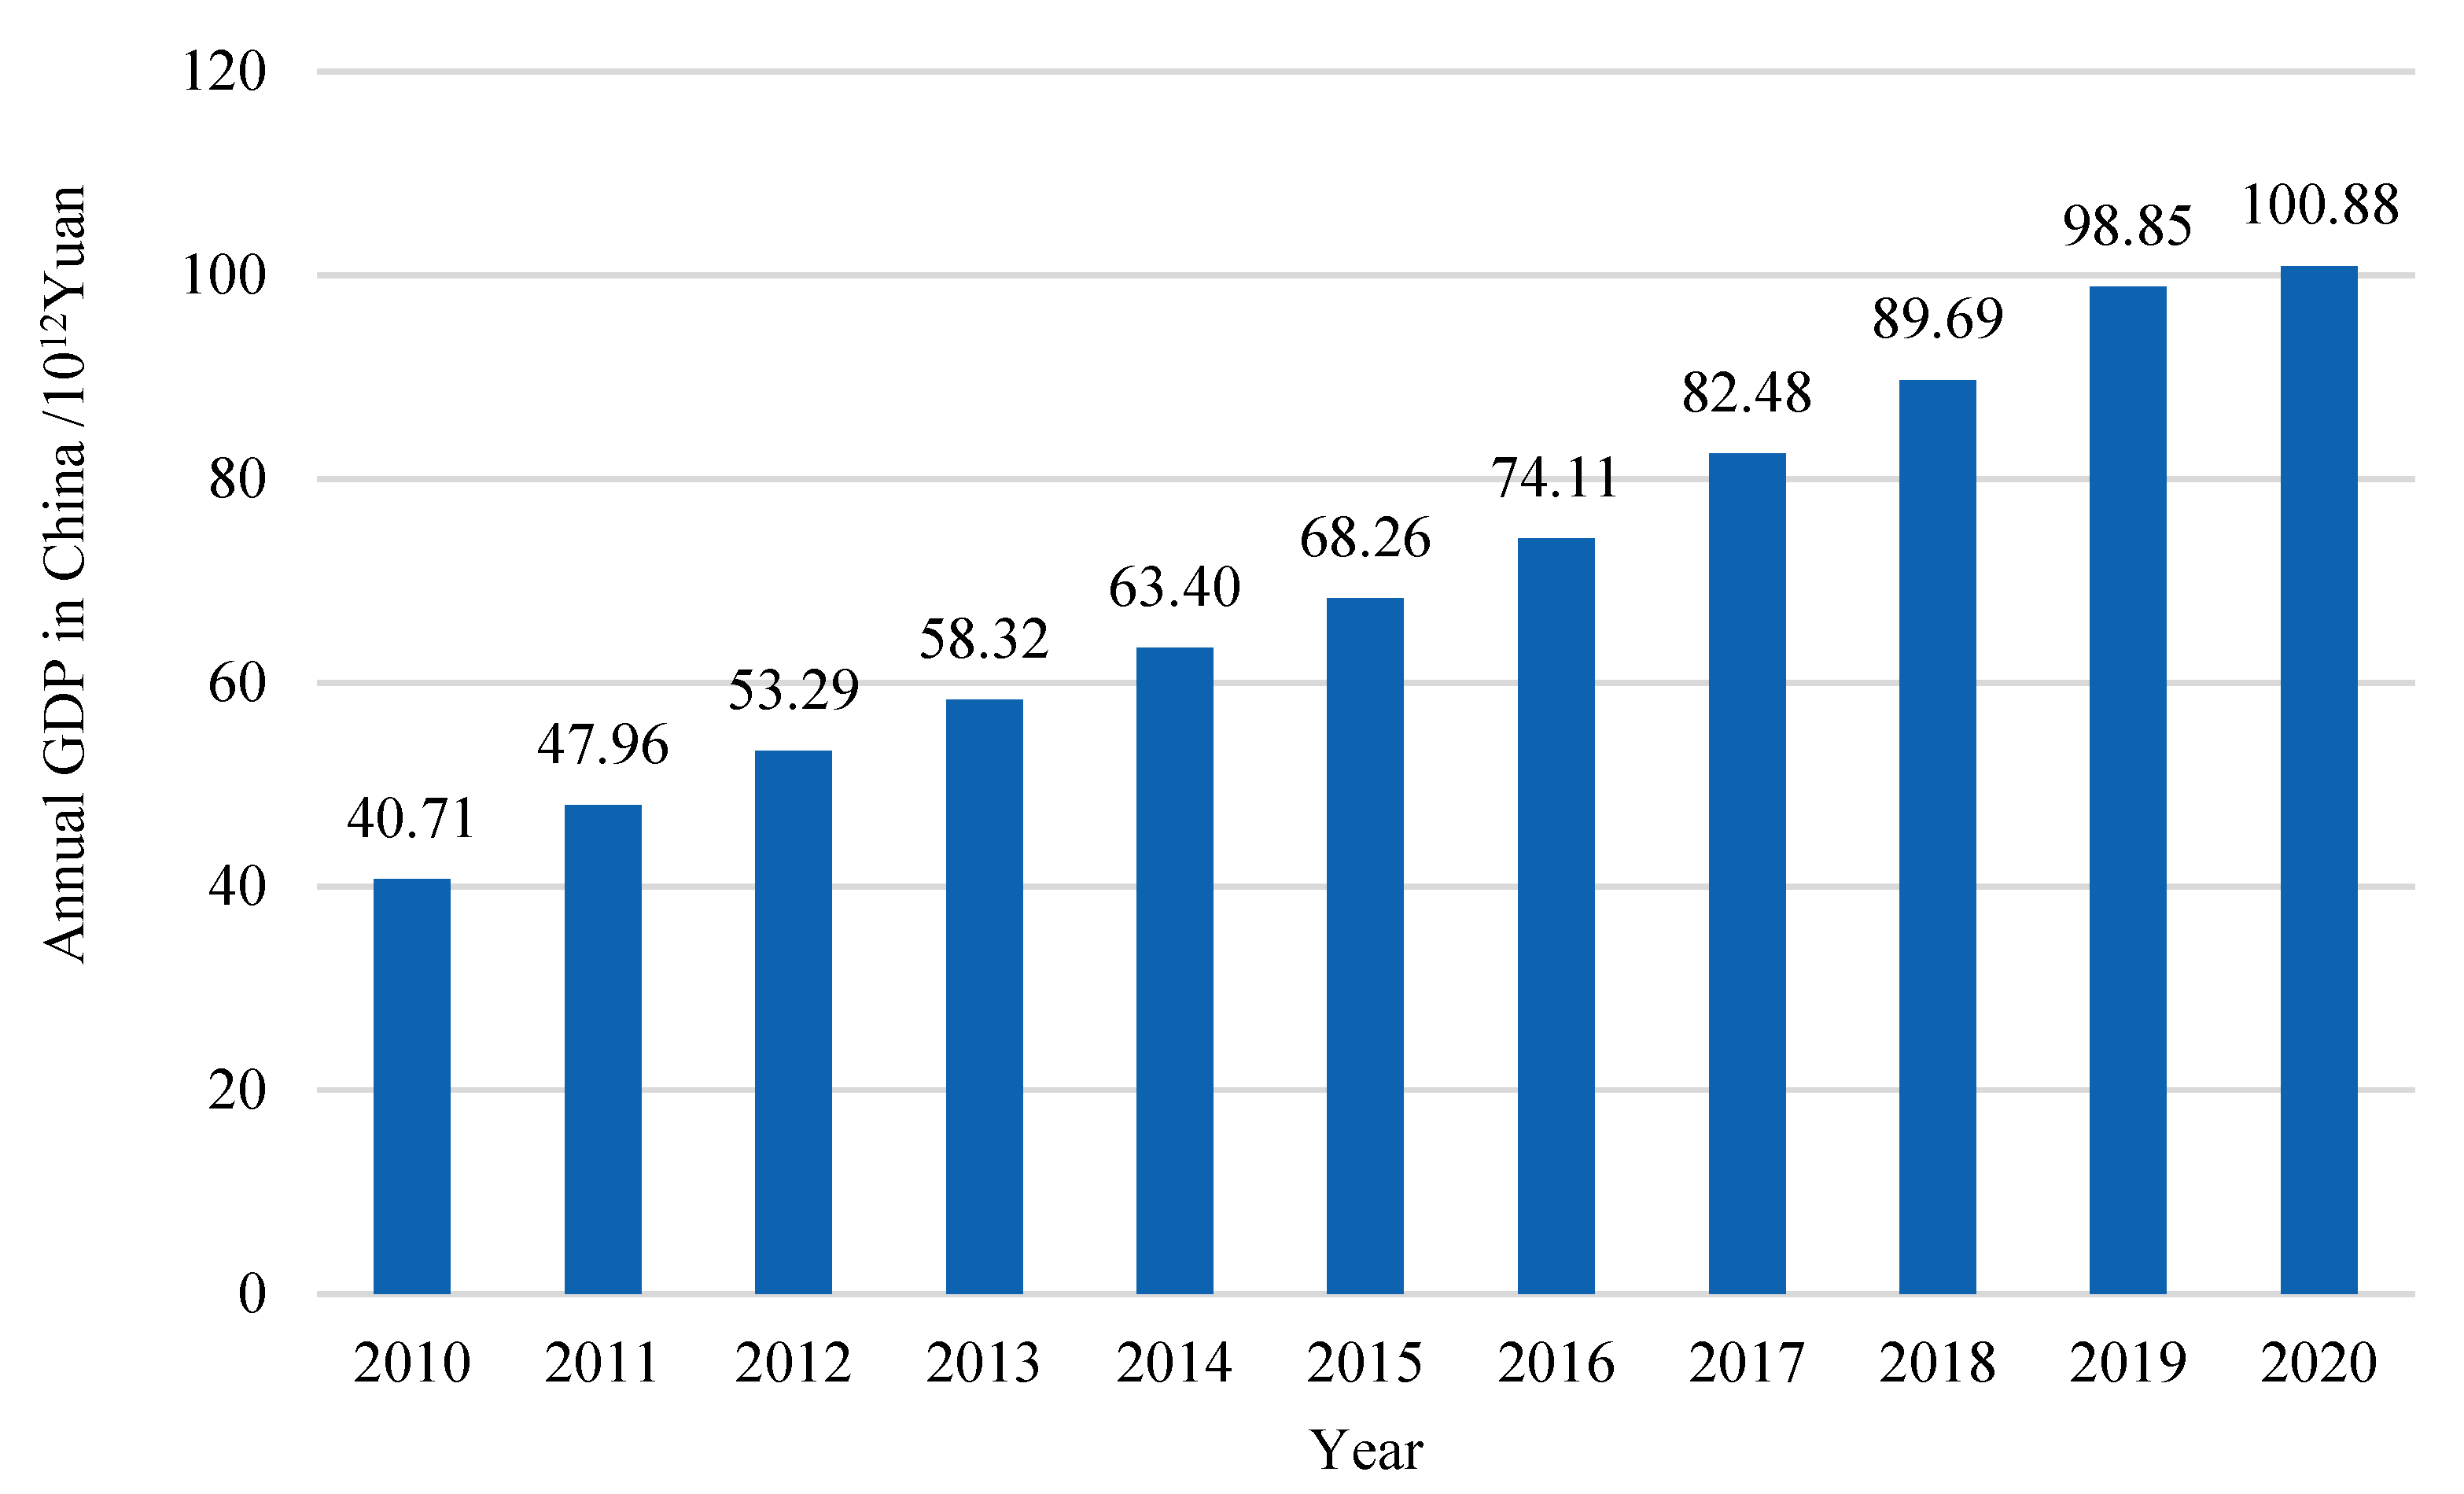
3.2.2. Economic Effect
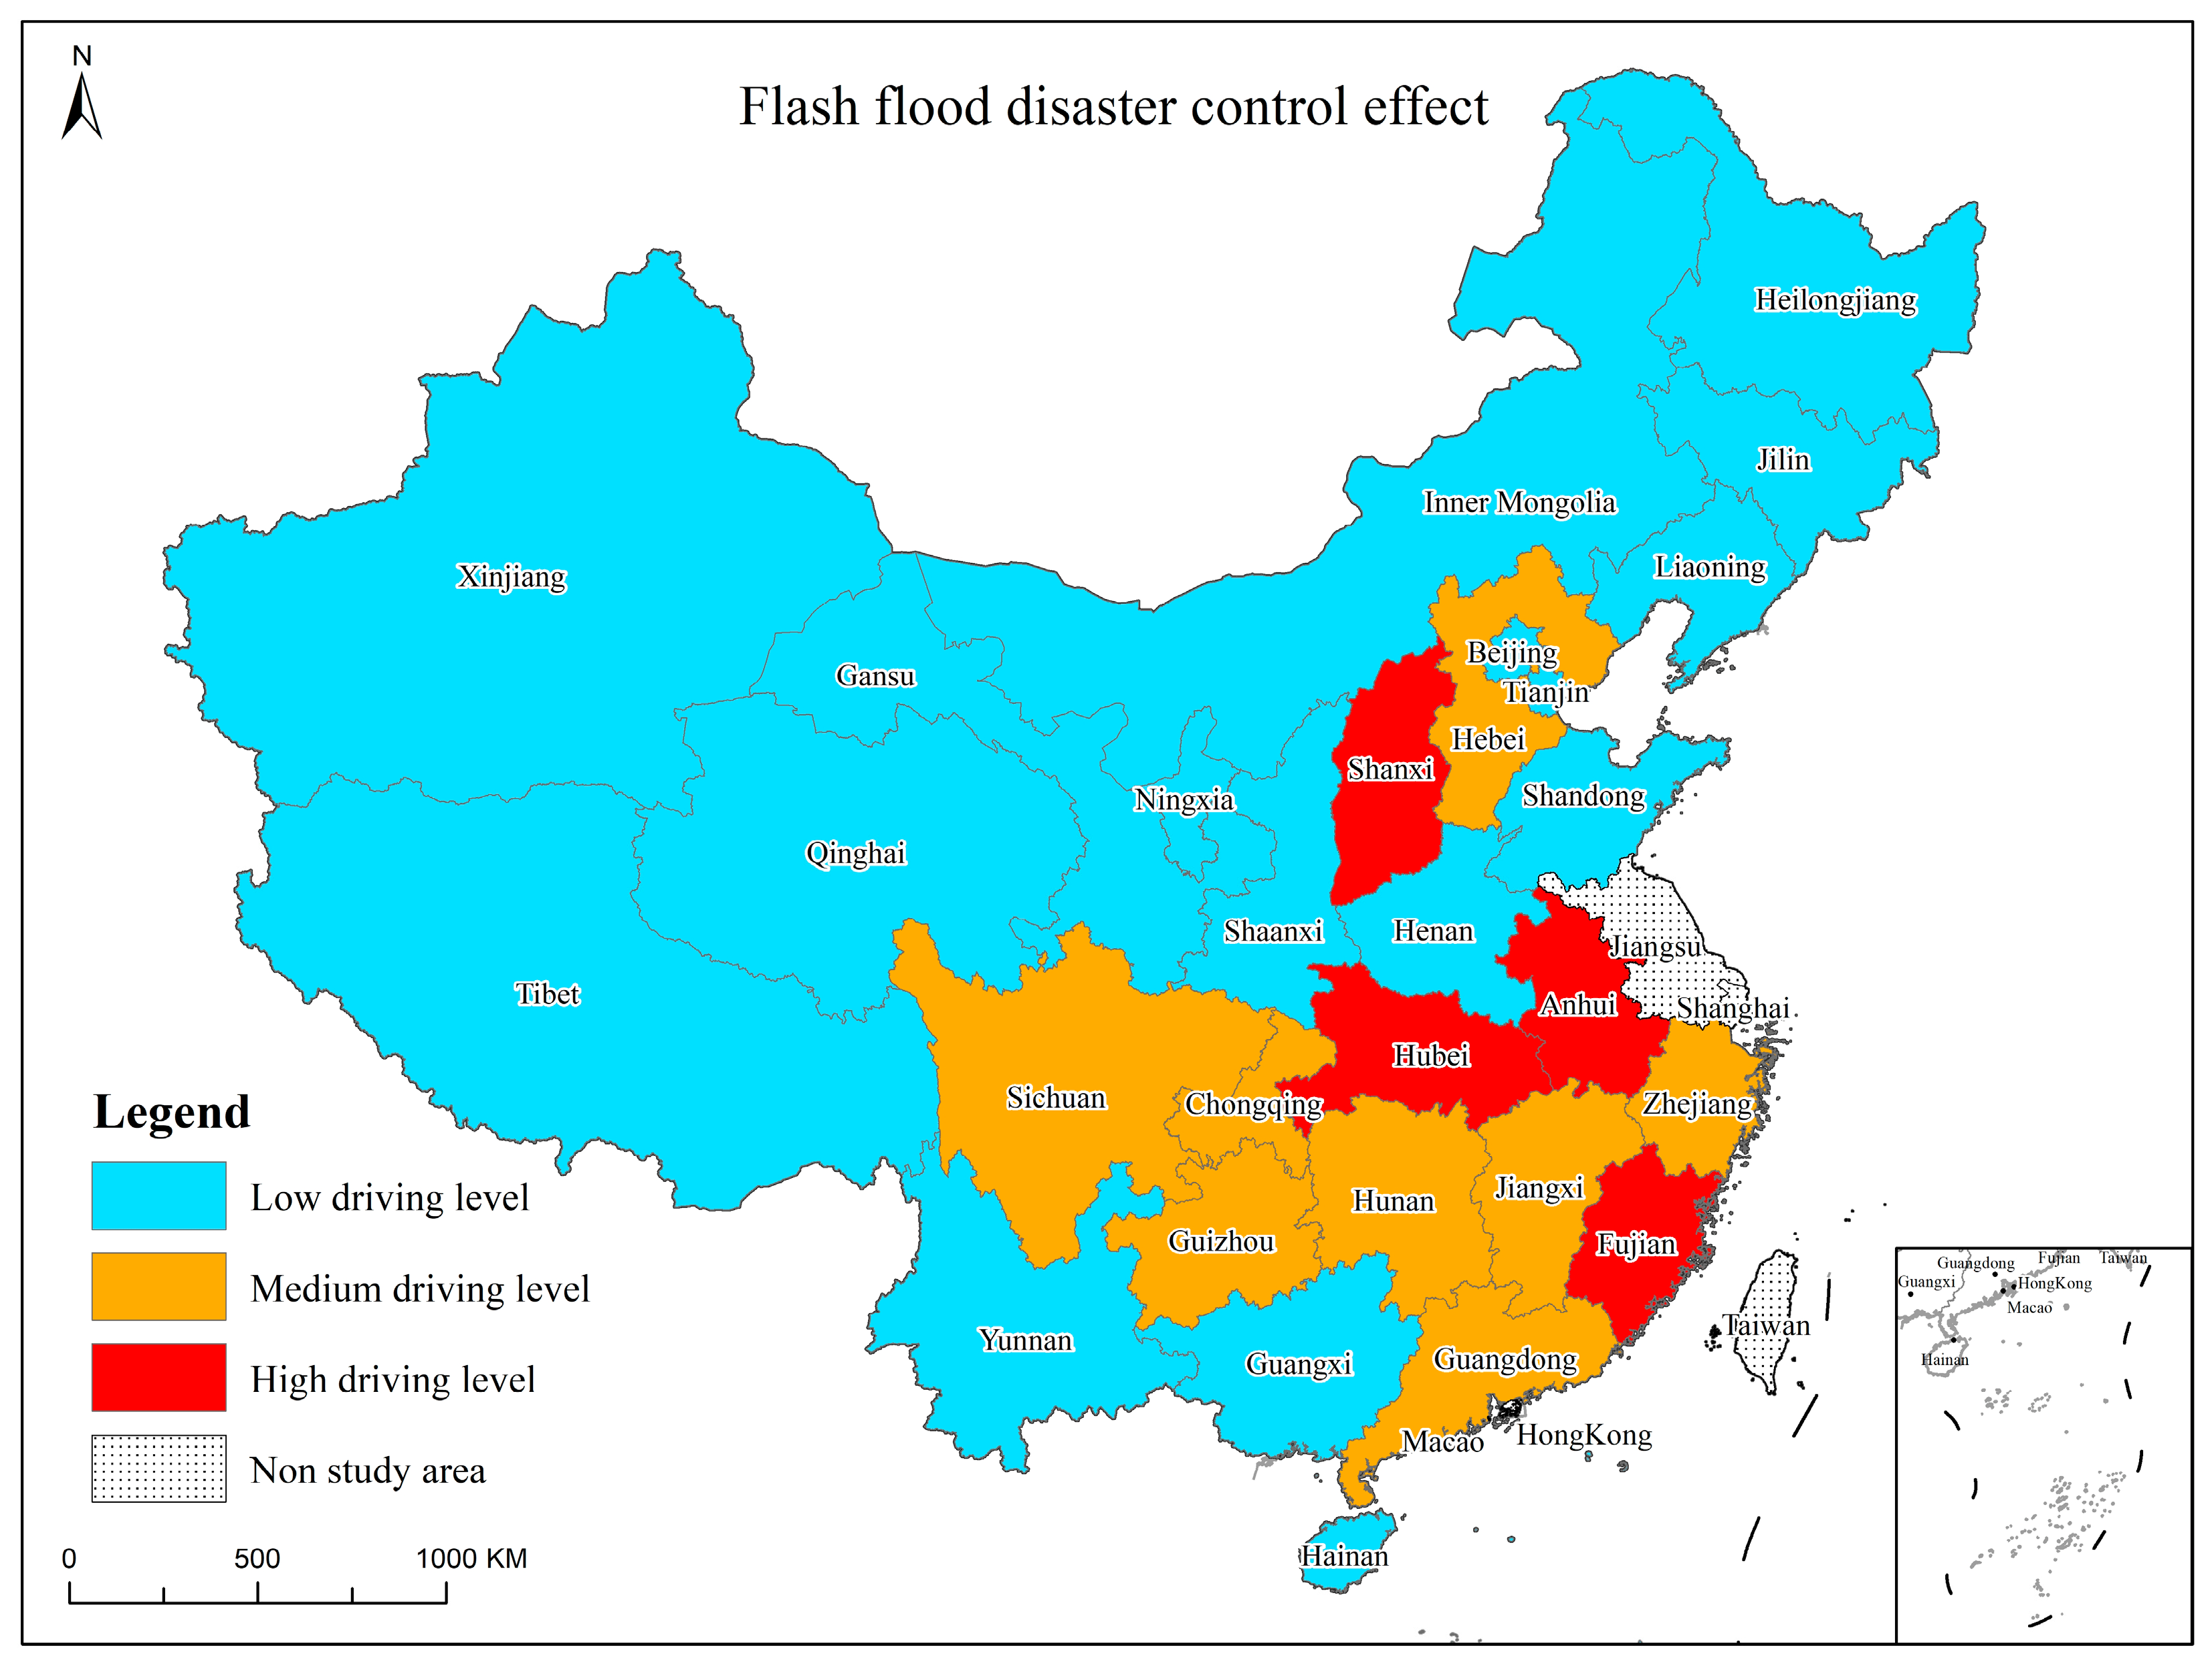
3.2.3. Flash Flood Disaster Control Effect
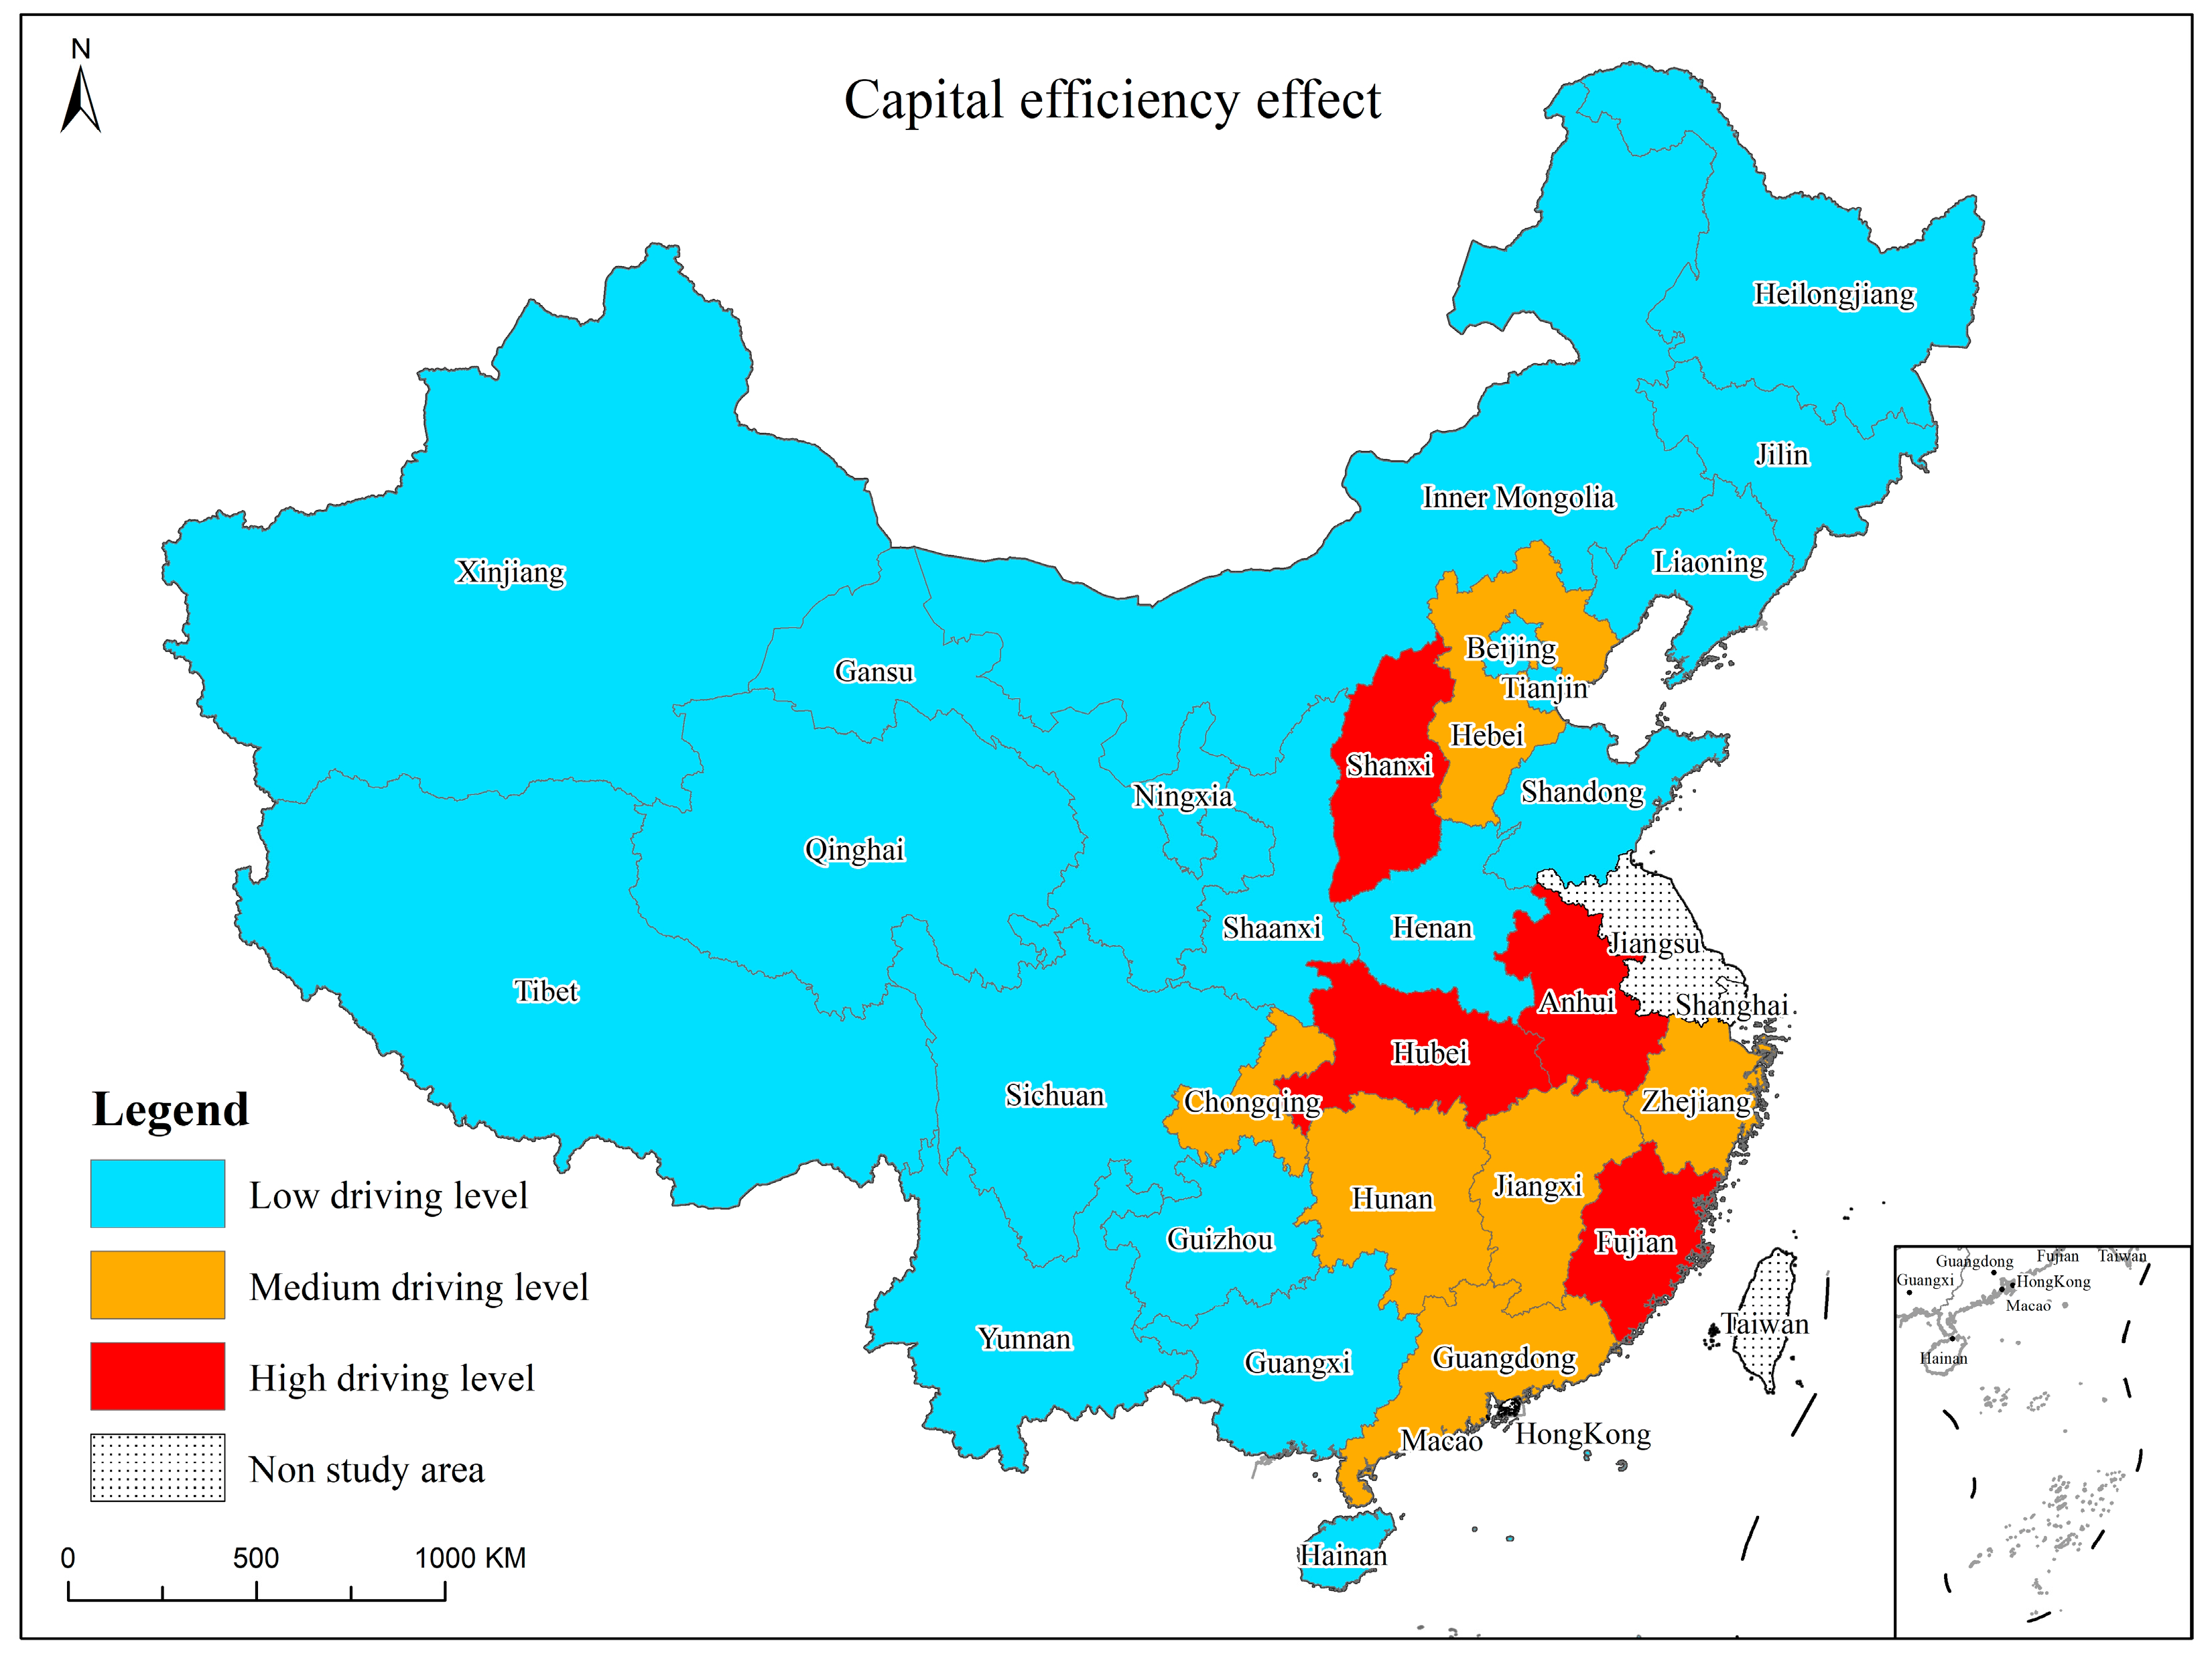
3.2.4. Capital Efficiency Effect
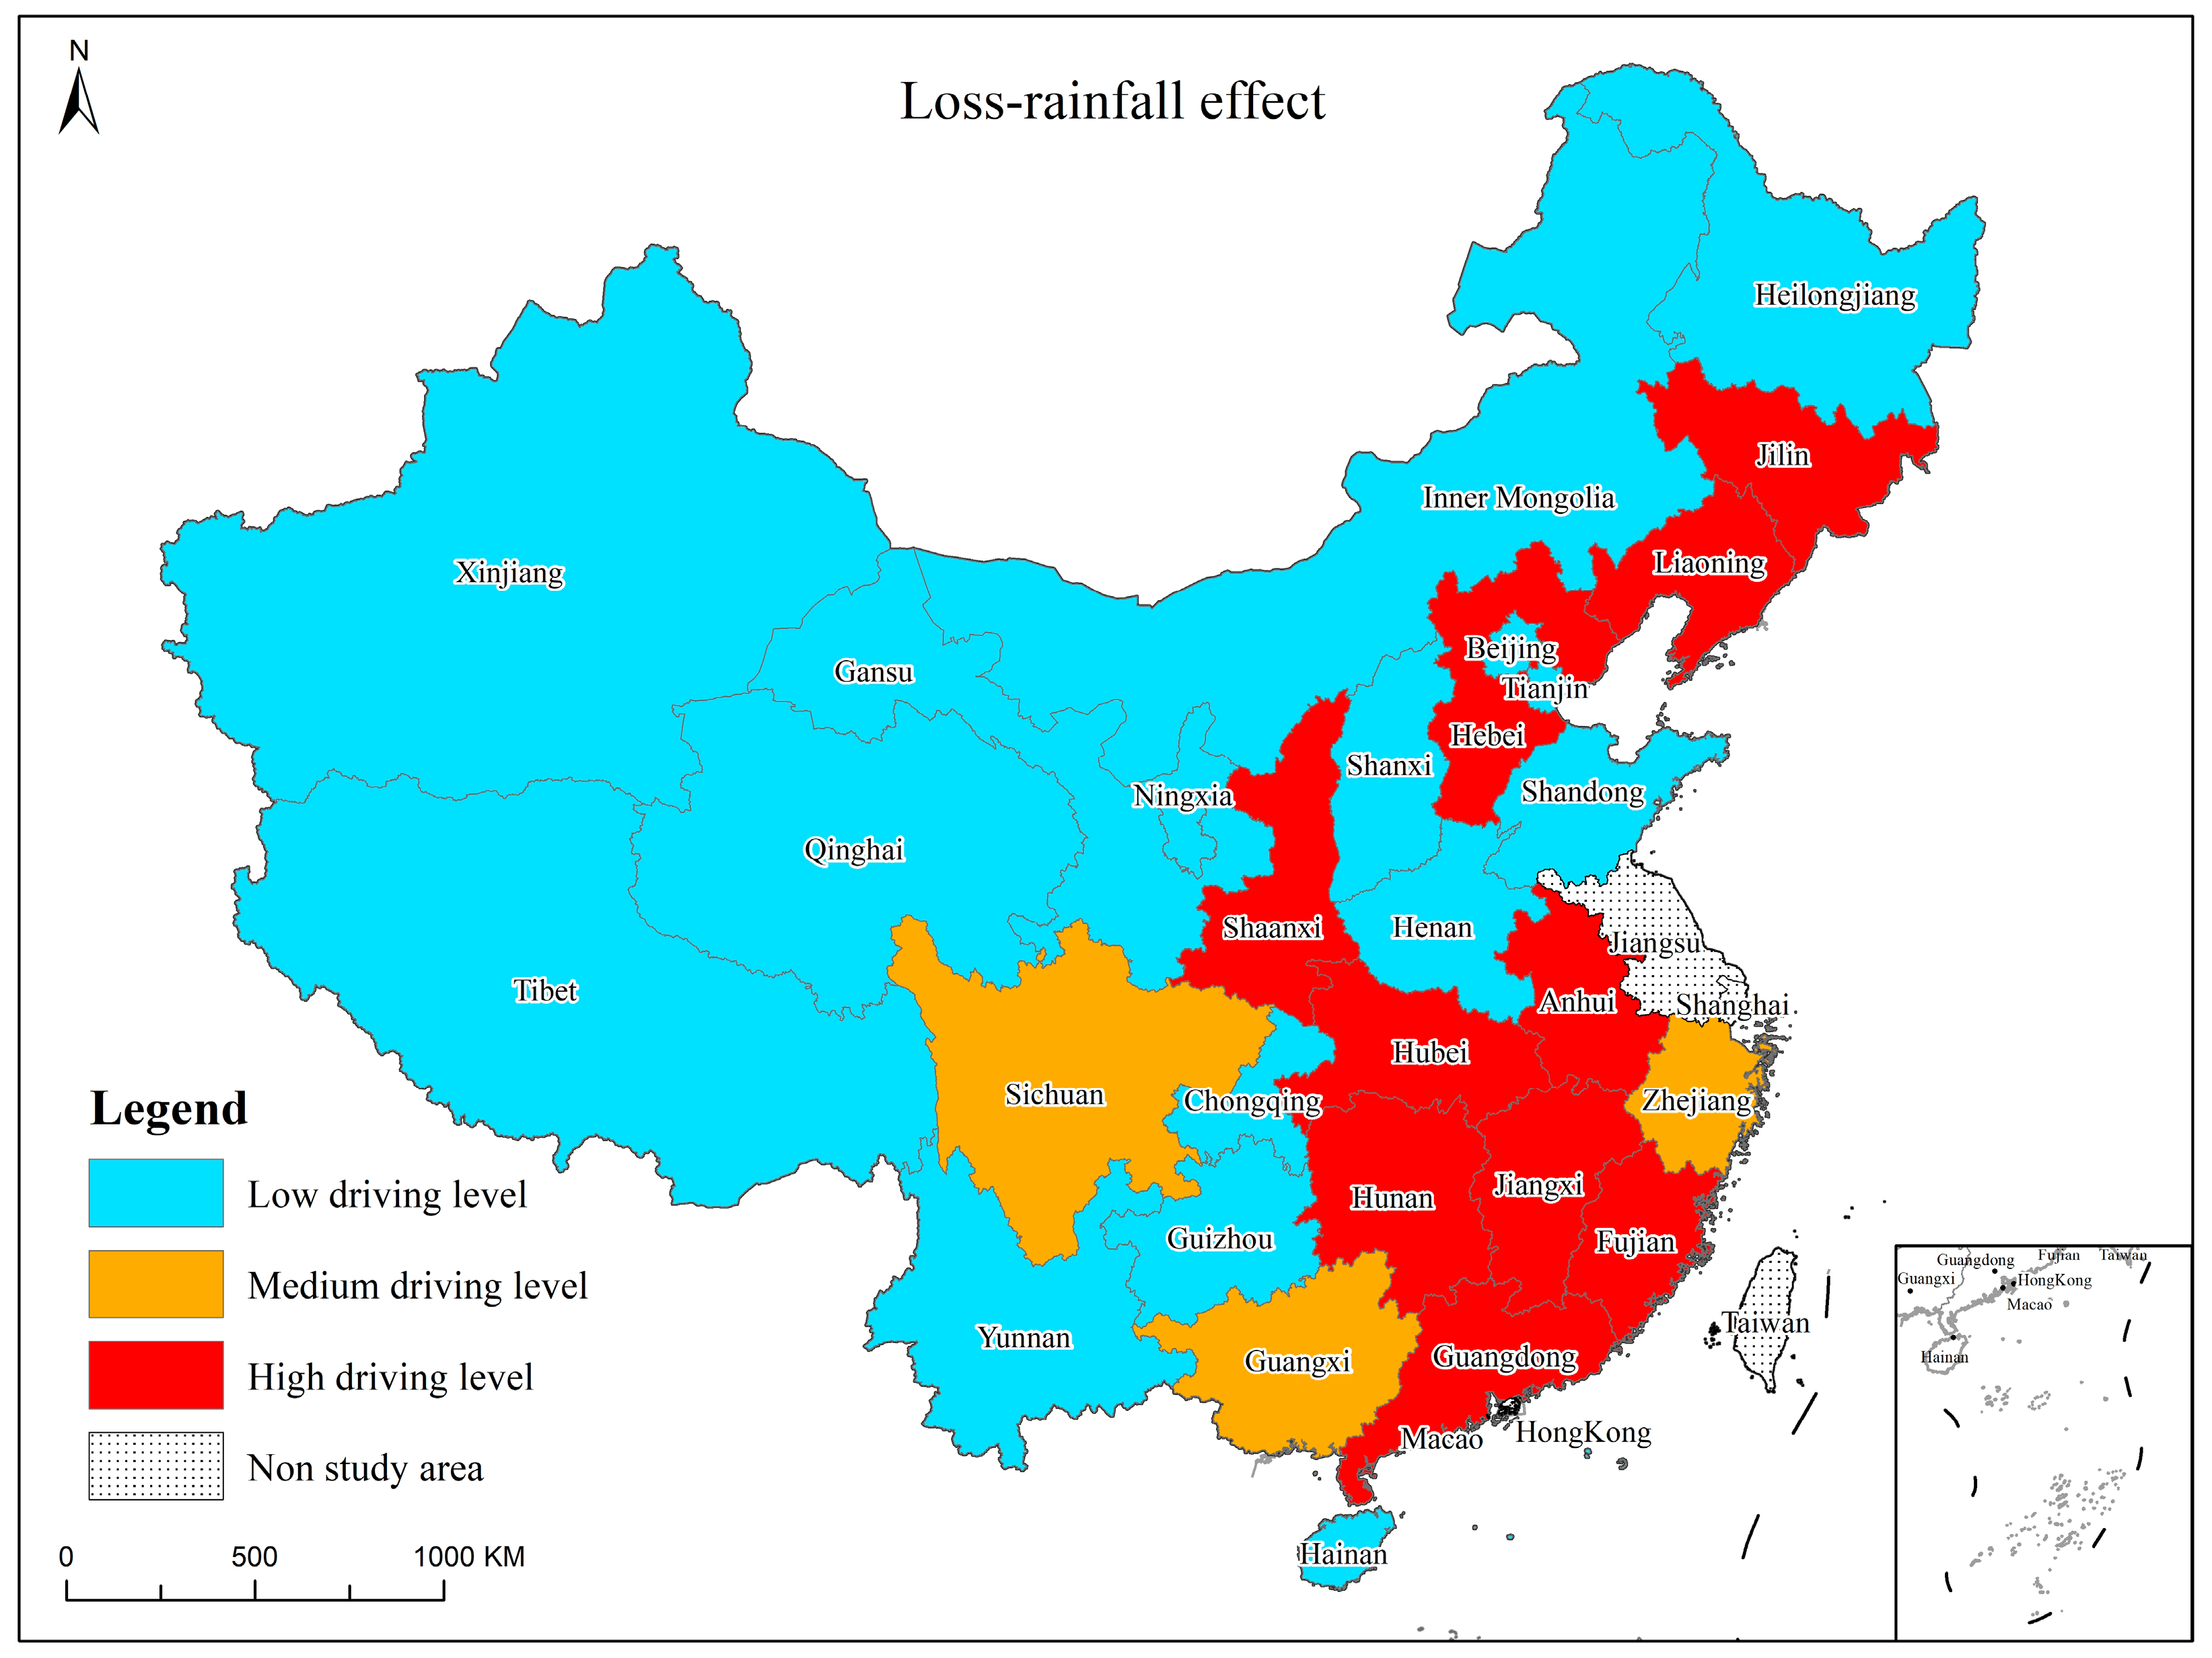
3.2.5. Loss-Rainfall Effect
4. Conclusions
Author Contributions
Funding
Institutional Review Board Statement
Informed Consent Statement
Data Availability Statement
Acknowledgments
Conflicts of Interest
References
- Centre for Research on the Epidemiology of Disasters; United Nations Office for Disaster Risk Reduction. The Human Cost of Disasters: An Overview of the Last 20 Years (2000–2019) [EB/OL]. 2020. UN Reports. Available online: https://www.undrr.org/publication/human-cost-disasters-overview-last-20-years-2000-2019 (accessed on 30 May 2022).
- Wen, Q.; Huo, Z.; Zhou, Y.; Che, Q.; Xiao, J.; Huang, D. Integrated risk assessment of flood disasters in southern China. Chin. J. Ecol. 2015, 34, 2900–2906. [Google Scholar]
- Wu, J.; Li, N.; Wen, Y.; Hu, A.; Cui, W.; Zhang, P. Economic impact of natural disaster and indirect economic loss estimation methods. Prog. Geogr. 2009, 28, 877–885. [Google Scholar]
- Jiang, L. Analysis on the characteristics of flood disaster damage in China in recent 76 years. Adv. Meteorol. Sci. Technol. 2018, 8, 11–16. [Google Scholar]
- Jiang, L.; Qiu, Z. The assessment of indirect economic loss of urban flood disaster: A case study of Beijing. Mod. Urban Res. 2014, 7, 7–13. [Google Scholar]
- Pauw, K.; Thurlow, J.; Bachu, M.; van Seventer, D.E. The economic costs of extreme weather events: A hydrometeorological CGE analysis for Malawi. Environ. Dev. Econ. 2011, 16, 177–198. [Google Scholar] [CrossRef] [Green Version]
- Joshi, S.R.; Vielle, M.; Babonneau, F.; Edwards, N.R.; Holden, P.B. Physical and economic consequences of sea-level rise: A coupled GIS and CGE analysis under uncertainties. Environ. Resour. Econ. 2016, 65, 813–839. [Google Scholar] [CrossRef]
- Borgomeo, E.; Vadheim, B.; Woldeyes, F.B.; Alamirew, T.; Tamru, S.; Charles, K.J.; Kebede, S.; Walker, O. The distributional and multi-sectoral impacts of rainfall shocks: Evidence from computable general equilibrium modelling for the Awash Basin, Ethiopia. Ecol. Econ. 2018, 146, 621–632. [Google Scholar] [CrossRef]
- He, B.S.; Ma, M.H.; Li, Q.; Liu, L.; Wang, X.H. Current situation and characteristics of flash flood prevention in China. China Rural Water Hydropower 2021, 5, 133–138, 144. [Google Scholar]
- Sun, D.; Liu, C.; He, B. Research progress on flash flood disaster control theory and technology. China Flood Drought Manag. 2022, 32, 24–33. [Google Scholar]
- Zhang, X.; Li, C.; Sun, D. Research on national flash flood disasters risk zoning based on survey and evaluation of big data. China Flood Drought Manag. 2020, 30, 61–63. [Google Scholar]
- Zhang, Z. Mountain torrent disaster prevention and control measures and their effects. Water Resour. Hydropower Eng. 2016, 47, 1–5, 11. [Google Scholar]
- Guo, L.; He, B. Construction and achievements of flash flood disaster prevention systems in China. China Flood Drought Manag. 2019, 29, 16–19, 29. [Google Scholar]
- Kaya, Y. Impact of Carbon Dioxide Emission Control on GNP Growth: Interpretation of Proposed Scenarios; IPCC Energy and Industry Subgroup, Response Strategies Working Group: Paris, France, 1989. [Google Scholar]
- Zhang, Z.X.; Sun, C.Z. Driving effect measurements and spatial-temporal variation of the per capita gray water ecological footprint in China. Acta Ecol. Sin. 2018, 38, 4596–4608. [Google Scholar]
- Sun, C.-Z.; Xie, W.; Zou, W. Contribution ratio measurement of water use efficiency driving effects and spatial driving type in China. Sci. Geogr. Sin. 2011, 10, 1213–1220. [Google Scholar]
- Ang, B.W.; Zhang, F.Q. Inter-regional comparisons of energy-related CO2 emissions using the decomposition technique. Energy 1999, 24, 297–305. [Google Scholar] [CrossRef]
- Ang, B.W. Decomposition analysis for policymaking in energy: Which is the preferred method? Energy Policy 2004, 32, 1131–1139. [Google Scholar] [CrossRef]
- Ang, B.W. The LMDI approach to decomposition analysis: A practical guide. Energy Policy 2005, 33, 867–871. [Google Scholar] [CrossRef]
- Hatzigeorgiou, E.; Polatidis, H.; Haralambopoulos, D. CO2 emissions in Greece for 1990–2002: A decomposition analysis and comparison of results using the Arithmetic Mean Divisia Index and Logarithmic Mean Divisia Index techniques. Energy 2008, 33, 492–499. [Google Scholar] [CrossRef]
- Zhao, J.; Fan, B. Characteristics of temporal and spatial distribution of flash flood in China. China Water Resour. 2006, 13, 45–47. [Google Scholar]
- Gao, J.; Wang, M.; Guo, S.; Wang, L.; Ye, B. Study and temporal distribution of rainfall disasters and analysis of its rainfall-related characteristics in Sichuan Province. Meteorol. Sci. Technol. 2022, 50, 224–233. [Google Scholar]
- Ye, B.; Feng, H.; Liu, Z.; Zhang, X.; Luo, H. Risk assessment of Sichuan flash flooding based on logistic model. J. Chengdu Univ. Inf. Technol. 2020, 35, 573–578. [Google Scholar]
- Tu, Y.; Wu, Z.; He, B. Analysis on the characteristics of flash flood disasters in China from 2011 to 2019. China Flood Drought Manag. 2020, 30, 22–25. [Google Scholar]
- Gu, Q.; Cheng, Z.; Xin, X.U. Industrialization Basically Accomplished: Concept Milestone and Prospect. Ind. Econ. Rev. 2015, 1, 1–12. [Google Scholar]
- Chu, J.; Liu, Y.; Lin, X.; Tong, D. Spatial mutual effects between municipal infrastructure investment and economic development. Acta Sci. Nat. Univ. Pekin. 2021, 57, 291–298. [Google Scholar]
- Mugume, S.N.; Gomez, D.E.; Fu, G.; Farmani, R.; Butler, D. A global analysis approach for investigating structural resilience in urban drainage systems. Water Res. 2015, 81, 15–26. [Google Scholar] [CrossRef] [Green Version]
- Raviv, G.; Fishbain, B.; Shapira, A. Analyzing risk factors in crane-related near-miss and accident reports. Saf. Sci. 2017, 91, 192–205. [Google Scholar] [CrossRef]
- Liu, J.; Xing, C.; Zhang, Q. House price, fertility rates and reproductive intentions. China Econ. Rev. 2020, 62, 101496. [Google Scholar] [CrossRef]
- Shanxi Provincial Department of Water Resources. Notice on the Best Efforts to do Flash Flood Disaster Prevention Work. Shanxi Water Resour. 2021, 37, 11. [Google Scholar]
- The People’s Government of Hebei Province. Overview of Hebei Province. Available online: http://www.hebei.gov.cn/hebei/14462058/14462085/14471224/index.html (accessed on 2 June 2022).
- Ni, Z.; Wang, P.; Huang, X.; Cao, X. Contrast analysis of effects of typhoon “Lekima” and “Rananim” on precipitation and wind in Zhejiang Province. J. Meteorol. Sci. 2021, 41, 172–182. [Google Scholar]
- Lu, Y.; Liu, H.; Li, G. Risk analysis of the extreme disaster risk caused by typhoon affecting Guangxi. Mar. Forecast. 2021, 38, 31–41. [Google Scholar]


| Year | Loss-Rainfall Effect | Capital Efficiency Effect | Flash Flood Disaster Control Effect | Economic Effect | Demographic Effect | Total |
|---|---|---|---|---|---|---|
| 2010–2011 | −2033.789 | −410.3707 | −378.5802 | 364.3994 | 14.1807 | −2444.16 |
| 2011–2012 | 1056.044 | 318.0058 | −200.9019 | 186.739 | 14.1629 | 1374.05 |
| 2012–2013 | 659.6843 | −761.9825 | 320.2077 | 245.3544 | 17.1559 | 480.4199 |
| 2013–2014 | −1494.108 | −88.0821 | −190.0587 | 174.8112 | 15.2475 | −1582.19 |
| 2014–2015 | −9.8524 | 95.3566 | −117.6909 | 111.419 | 7.9674 | 87.1997 |
| 2015–2016 | 1731.183 | 2655.194 | −2611.375 | 191.0343 | 16.4746 | 1982.51 |
| 2016–2017 | −1236.258 | −264.4714 | −302.4272 | 286.6552 | 15.7719 | −1500.73 |
| 2017–2018 | −576.1079 | 49.0477 | −156.3971 | 149.3445 | 7.0526 | −527.0602 |
| 2018–2019 | 389.8009 | −82.5708 | −171.6208 | 165.767 | 5.8539 | 307.23 |
| 2019–2020 | 561.9533 | 185.1468 | −46.1579 | 42.8678 | 3.2902 | 747.1002 |
| Effect average | −95.145 | 169.5273 | −385.5002 | 191.8392 | 11.7158 | |
| Effect standard deviation | 1208.93 | 927.548 | 803.9399 | 90.1191 | 5.1031 | |
| Effect coefficient of variation | −12.7062 | 5.4714 | −2.0854 | 0.4698 | 0.4356 |
| Region | Loss-Rainfall Effect | Capital Efficiency Effect | Flash Flood Disaster Control Effect | Economic Effect | Demographic Effect | Total |
|---|---|---|---|---|---|---|
| Beijing | 0.3007 | −0.4130 | −1.3098 | 1.1466 | 0.2754 | 0.0000 |
| Tianjin | 0.6224 | −0.7810 | −0.0749 | 0.1827 | 0.0449 | −0.0059 |
| Hebei | 0.0623 | 6.3323 | −10.7380 | 3.4588 | 0.2147 | −0.6699 |
| Shanxi | −1.4803 | 3.3480 | −3.7116 | 1.3850 | −0.0441 | −0.5030 |
| Inner Mongolia | −3.2358 | 2.0408 | −1.3984 | 2.0413 | −0.0950 | −0.6471 |
| Liaoning | −20.0179 | −8.3127 | −2.5122 | 4.9932 | −0.1004 | −25.9500 |
| Jilin | −43.0281 | −5.9829 | −3.0722 | 2.9943 | −0.7361 | −49.8250 |
| Heilongjiang | −0.3310 | −0.3150 | 1.2548 | 0.9660 | −1.0277 | 0.5471 |
| Zhejiang | 3.1282 | 3.1035 | −20.9594 | 9.7150 | 2.6387 | −2.3740 |
| Anhui | 44.4181 | 25.9407 | −26.8928 | 8.0031 | 0.2319 | 51.7010 |
| Fujian | −17.0980 | 25.9043 | −38.1183 | 9.5228 | 1.1102 | −18.6790 |
| Jiangxi | −10.6887 | 1.7504 | −19.2507 | 12.2608 | 0.1662 | −15.7620 |
| Shandong | −3.7440 | −5.1765 | −0.8274 | 1.9150 | 0.3940 | −7.4389 |
| Henan | −13.1402 | 4.1320 | −5.9747 | 1.7968 | 0.1081 | −13.0780 |
| Hubei | 1.1752 | 29.3494 | −35.1599 | 10.3178 | 0.0956 | 5.7781 |
| Hunan | −6.0440 | 9.1161 | −25.6694 | 12.7677 | 0.1605 | −9.6691 |
| Guangdong | −5.1864 | 6.0111 | −27.7194 | 12.9568 | 3.4269 | −10.5110 |
| Guangxi | 3.2246 | 4.4470 | −8.9474 | 4.9755 | 0.6034 | 4.3031 |
| Hainan | −9.3221 | 0.9359 | −7.9598 | 4.0317 | 0.6672 | −11.6471 |
| Chongqing | 8.8715 | 6.8277 | −13.4133 | 7.2321 | 0.7579 | 10.2759 |
| Sichuan | −2.3962 | −0.9183 | −19.4274 | 19.5975 | 0.5814 | −2.5630 |
| Guizhou | 2.8052 | 8.5286 | −13.3576 | 5.7722 | 0.4985 | 4.2469 |
| Yunnan | 2.2289 | 5.0178 | −9.4595 | 4.7431 | 0.1117 | 2.6420 |
| Tibet | −0.5672 | 0.7986 | −1.6222 | 0.7790 | 0.1528 | −0.4590 |
| Shaanxi | −18.7190 | 1.4214 | −7.2012 | 6.6924 | 0.3425 | −17.4639 |
| Gansu | 3.8549 | −0.8067 | −3.1115 | 5.4300 | −0.1697 | 5.1970 |
| Qinghai | −0.3791 | 0.3224 | −0.6531 | 0.3436 | 0.0222 | −0.3440 |
| Ningxia | −0.1595 | 0.5062 | −0.7422 | 0.2460 | 0.0485 | −0.1010 |
| Xinjiang | −3.3441 | 2.9019 | −4.3370 | 1.1898 | 0.2564 | −3.3330 |
| National total | −95.1450 | 169.5273 | −385.5002 | 191.8392 | 11.7158 | −107.5629 |
Publisher’s Note: MDPI stays neutral with regard to jurisdictional claims in published maps and institutional affiliations. |
© 2022 by the authors. Licensee MDPI, Basel, Switzerland. This article is an open access article distributed under the terms and conditions of the Creative Commons Attribution (CC BY) license (https://creativecommons.org/licenses/by/4.0/).
Share and Cite
Zhang, Z.; Li, Q.; Liu, C.; Ding, L.; Ma, Q.; Chen, Y. Driving Effects and Spatial-Temporal Variations in Economic Losses Due to Flood Disasters in China. Water 2022, 14, 2266. https://doi.org/10.3390/w14142266
Zhang Z, Li Q, Liu C, Ding L, Ma Q, Chen Y. Driving Effects and Spatial-Temporal Variations in Economic Losses Due to Flood Disasters in China. Water. 2022; 14(14):2266. https://doi.org/10.3390/w14142266
Chicago/Turabian StyleZhang, Zhixiong, Qing Li, Changjun Liu, Liuqian Ding, Qiang Ma, and Yao Chen. 2022. "Driving Effects and Spatial-Temporal Variations in Economic Losses Due to Flood Disasters in China" Water 14, no. 14: 2266. https://doi.org/10.3390/w14142266