Article

Hydrochemical Characteristics and the Genetic Mechanism of Low–Medium Temperature Geothermal Water in the Northwestern Songliao Basin

1
The Institute of Hydrogeology and Environmental Geology, Chinese Academy of Geological Sciences, Shijiazhuang 050061, China
2
Technology Innovation Center for Geothermal & Hot Dry Rock Exploration and Development, Ministry of Natural Resources, Shijiazhuang 050061, China
3
School of Environmental Studies, China University of Geosciences, Wuhan 430074, China
*
Author to whom correspondence should be addressed.
Water 2022, 14(14), 2235; https://doi.org/10.3390/w14142235
Submission received: 20 June 2022 / Revised: 12 July 2022 / Accepted: 13 July 2022 / Published: 15 July 2022
(This article belongs to the Topic Geothermal Energy Technology and Current Status)

Abstract

:
The geothermal resources in sedimentary basins have high potential for development and utilization, and have become an important research topic globally. This study focuses on the geothermal system in the northwestern Songliao Basin. Water chemistry and isotopic signatures of geothermal fluids and shallow groundwater are analyzed. Water–rock interactions, recharge sources, and the ages of geothermal fluids are revealed and recharge elevation, circulation depth, and the reservoir temperature of the geothermal fluids are estimated. This article proposes deep heat sources and genetic mechanism for geothermal system. The results are as follows: The hydrochemical types of geothermal water mainly included Cl·HCO3-Na, HCO3·Cl-Na, and Cl-Na, and the TDS gradually increased from the margin to the center of the basin and from anticlines to the depression on both sides. The geothermal water was recharged by paleo-atmospheric precipitation in the northwest mountainous area at an elevation of 300–700 m. The 14C ages showed that the geothermal water flowed at an extremely low rate (millennial scale) and had a low circulation rate. The temperature of the geothermal reservoirs was estimated to be 45.19–83 °C using a quartz geothermometer. The geothermal water had a genetic model of stratum-controlling geothermal reservoirs, lateral runoff recharge, and heat supply by terrestrial heat flow. The underlying reasons for the high geothermal gradient and terrestrial heat flow in the basin include the uplift of the Moho, the uplift of the upper mantle, and the presence of a high-electrical-conductivity layer in the crust.

1. Introduction

As an important type of renewable energy, geothermal resources have the advantages of great resource potential, a high utilization coefficient, and low CO2 emission in their life cycles [1]. They are an indispensable type of energy for achieving carbon neutrality, and the scientific and rational exploitation of geothermal resources will bring considerable economic and environmental benefits [2]. In China, geothermal resources are widely distributed, especially low-medium temperature (25 °C ≤ t < 150) hydrothermal resources [3]. The Songliao Basin is one of the most hydrocarbon-rich regions in China and the largest continental sedimentary basin with the highest heat flow [4,5]. The Songliao Basin has geothermal resources with great development prospects due to its geotectonic background and features [6]. The statistics show that the low–medium temperature geothermal resources in the Songliao Basin are equivalent to 42.2 billion tons of standard coal, and their annual exploitable amount is equivalent to 69 million tons of standard coal [7]. However, the uncontrolled mining of geothermal resources may result in a continuous decline in the water table and reservoir temperature [8]. The sustainable utilization of geothermal resources is a new challenge for the scientific community [9].
Among the most important issues, the reservoir temperature in any geothermal system and the circulation processes of thermal groundwater need to be characterized. Geothermal fluids have a number of unique chemical indicators. Systematic hydrochemical and isotopic studies on geothermal systems are essential tools toward effective exploration. Stable δ18O and δ2H isotopes from water combined with hydrochemistry have been widely used in tracing sources of groundwater and delineating water–rock–gas interaction processes occurring in groundwater systems [10,11,12,13,14,15]. Groundwater age can be used to evaluate the circulation rate and renewability of groundwater [16] and 14C in dissolved inorganic carbon (DIC) has been commonly used for age determination by hydrogeologists [17,18]. While empirical chemical geothermometers including quartz [19], chalcedony [19], and cation geothermometers [20,21,22] are still used to predict reservoir temperature, it is now quite common that theoretical chemical geothermometers based on a chemical thermodynamic modeling approach are used, which was proposed and improved by Reed and Spycher [23] and Pang and Reed [24].
Previous studies have mainly focused on the geological background, tectonic framework, and deep hot dry rocks of the Songliao Basin [25,26]. However, there is a lack of systematic research on the genetic mechanisms (e.g., geothermal water sources, the control of water and heat by faults) of the geothermal system in the area [27]. Therefore, this study collects samples from some geothermal wells and shallow groundwater; analyzes the hydrochemical and isotopic (δ2H, δ18O and 14C) characteristics of geothermal water from different tectonic zones and shallow groundwater; explores the recharge sources and water–rock interactions of geothermal water; evaluates the reservoir temperature of deep geothermal fluids; and reveals the genetic model of the geothermal system.

2. Study Area

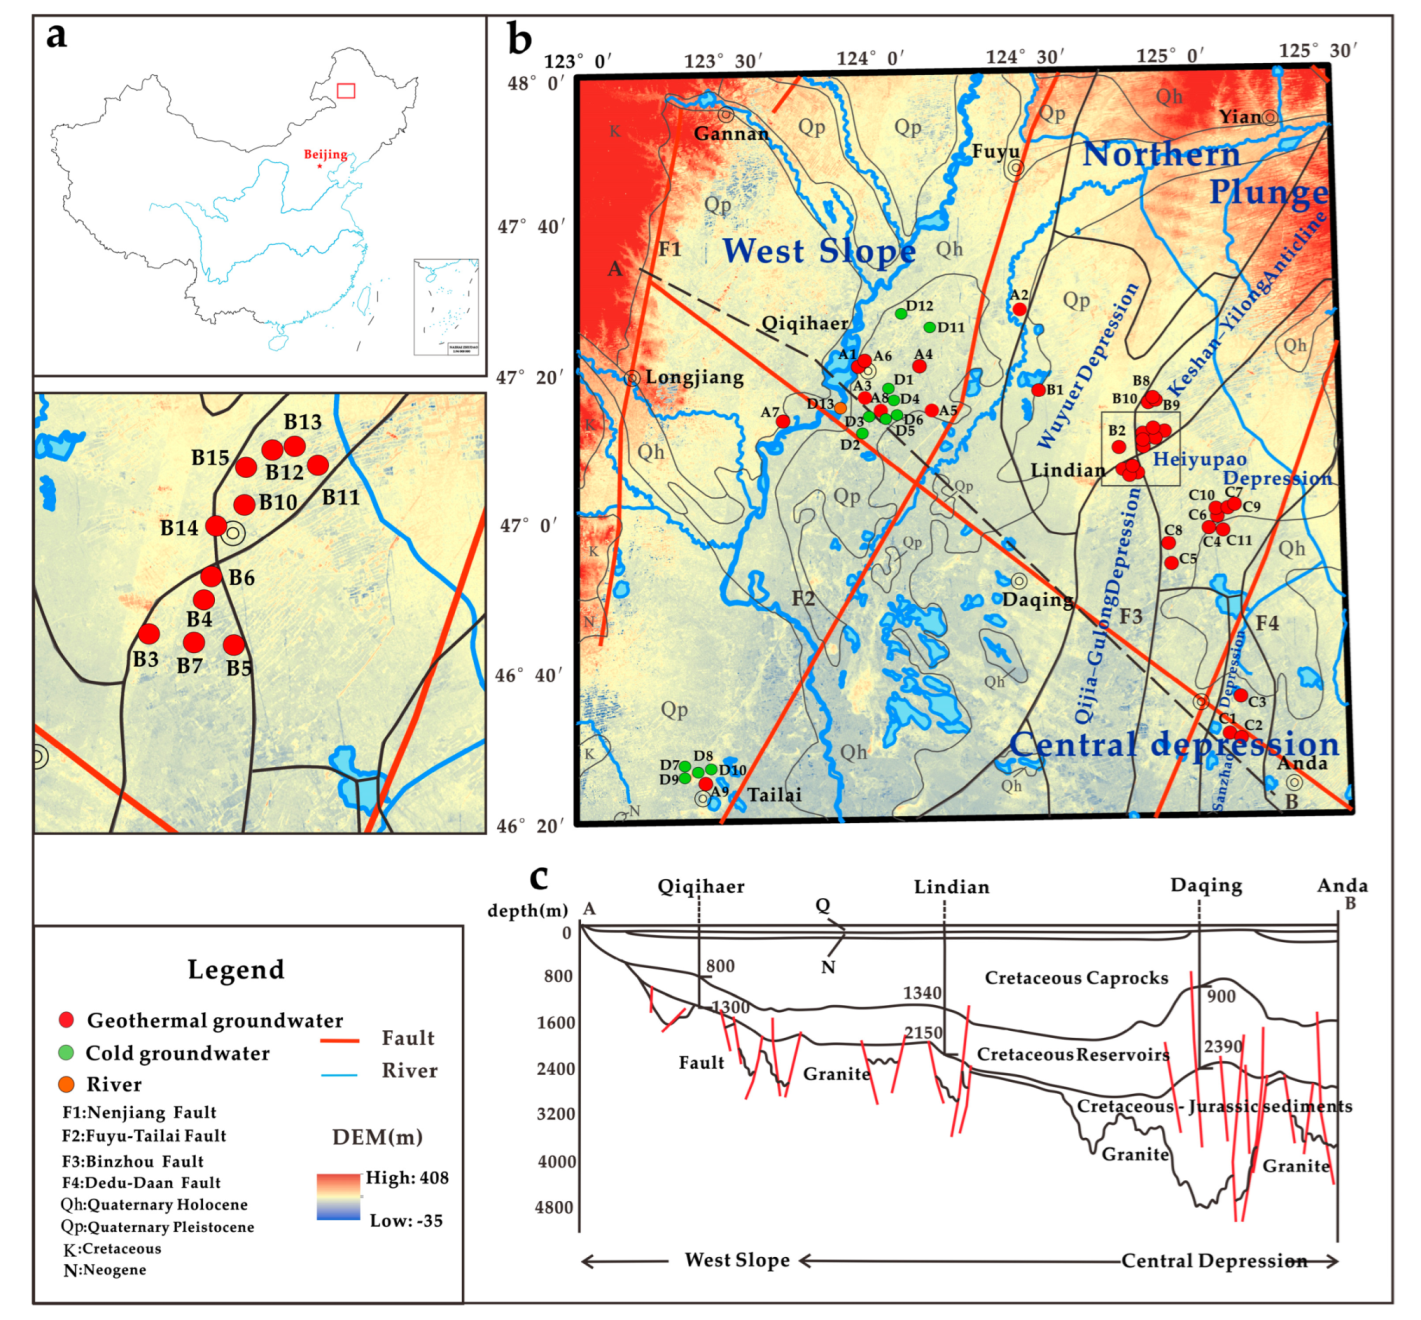
The study area is located in the northwest of the Songliao Basin. The structural unit of the area is divided into three parts, i.e., the central depression area, the north plunge area, and the west slope area [28]. The central depression area consists of three second-order tectonic units, namely, the Heiyupao, Qijia–Gulong, and Sanzhao depression, and the northern plunge area includes the Keshan–Yilong anticline and the Wuyuer depression (Figure 1).
The west slope area is located in the west of the study area and has long been a regional large monocline during the development of the basin. This area has a bedrock burial depth of approximately 700–2500 m, and its basement mainly consists of Hercynian granites, with Upper Paleozoic and pre-Paleozoic metamorphic rocks distributed locally. Moreover, this area has gentle terrain, with few faults developing. The northern plunge area is located in the northern part of the area. It lies between a slope and an uplift, with a basement burial depth of 100–3500 m. The sedimentary structures in this area have an NNE-NE strike and extend toward the southwest, pitching into the central depression area. The central depression area lies in the middle of the basin and has long been in the subsidence center during the evolution of the basin. Regarding the sedimentary strata in this area, the Jurassic–Tertiary strata are all well developed, with a thickness of 7000–10,000 m. The faults in the study area mainly include the Nenjiang lithospheric fault, the Fuyu–Tailai fault, the concealed Binzhou fault, and the Dedu–Da’an lithospheric fault, which play a key role in the formation of the geothermal system in the study area as heat- and water-conducting channels [29].
In this basin, the terrestrial strata of the late Mesozoic–Cenozoic age, comprising volcanic, volcaniclastic and sedimentary rocks, are unevenly distributed across the basin. The basement mainly consists of the middle Jurassic granites and Paleozoic strata. The Upper Jurassic and Cretaceous strata in the basin consist of ten lithologic Formations including, from bottom to top, Huoshiling (J3h), Shahezi (K1s), Yingcheng (K1y), Denglouku (K1d), Quantou (K2q), Qingshankou(K2qn), Yaojia (K2y), Nenjiang (K2n), Sifangtai (K2s) and Mingshui (K2m) [29].
The geothermal water in the study area is mainly concentrated in the Cretaceous Yaojia, Qingshankou, and Quantou Formations. Its cap rock is composed of the Quaternary and Tertiary strata and the Cretaceous Mingshui, Sifangtai, and Nenjiang Formations. Its heat-conducting strata lie below the Cretaceous Quantou Formation and include the Denglouku Formation, the Jurassic strata, and the Carboniferous–Permian strata, as well the granites intruded in the strata. The geothermal reservoirs are distributed in the form of layers in a wide area and have stable lithology and thickness and simple tectonic conditions [30].
Figure 1. (a) Location of the area in China; (b) geological map and sampling sites; (c) schematic geological cross section of study area [31].
Water 14 02235 g001

3. Materials and Methods

3.1. Sampling Sites

A sampling campaign was implemented in August 2020 in which a total of 49 water samples were collected, including 36 from geothermal wells (9 from the western slope area, 2 from the Wuyuer depression, 5 from the Qijia–Gulong depression, 9 from the Keshan–Yilong anticline, 3 from the Sanzhao depression, and 8 from the Heiyupao depression), 12 from shallow groundwater, and 1 from surface water. The sampling locations are shown in (Figure 1), and the hydrochemical characteristics of the water samples are listed in Table 1. All samples for hydrochemical analyses were filtered with a 0.45 μm membrane before bottling. Samples for cation and trace elements analysis were acidified with ultra-purified HNO3 to adjust the sample to pH < 2. Sixty mL of filtered water was collected into HDPE vials for anion analyses. A total of 20 mL of filtered water was collected into screw-capped HDPE vials for stable δ18O and δ2H analyses, and 1000 mL of unfiltered water was collected into screw-capped HDPE bottles for δ13C and 14C analyses.

3.2. Sampling and Analytical Methods

Water parameters including temperature, pH, and total dissolved solids (TDS) were measured in situ using a portable multiparameter (HQ40D, Hach, Loveland, CO, USA), which was calibrated using a standard solution before use.
All the samples were sealed immediately after collection and were stored in a low-temperature incubator. For SiO2 analyses, the geothermal water samples were diluted to 10% of their initial concentration with deionized water. All water samples were analyzed in the Key Laboratory of Groundwater Science and Engineering of the Ministry of Land and Resources. The concentrations of the major cations and trace elements were detected by ICP-AES (ICAP6300, Thermo Fisher Scientific, Waltham, MA, USA) and ICP-MS (7500C, Agilent, CA, USA), respectively. Anions were determined using ion chromatography (DX-120, Thermo Fisher Scientific, MA, USA) and HCO3 was tested by alkalinity titration [32]. The geochemical assessment of samples was carried out following standard techniques and using high-quality chemical data for which ionic balance errors were found at less than ±5%. Hydrogen and oxygen isotope tests were performed using a MAT 253 stable isotope ratio mass spectrometer. The analytical precision was ±0.1‰ and ±1‰ for δ 18O and δ2 H, respectively. Δ13C and 14C in groundwater samples were measured at Beta Analytic in the USA using accelerator mass spectrometry (AMS). The analytical precision was ±0.1‰ for δ13C and ±0.1 pmC for 14C. The isotope values for δ13CTDIC are expressed as δ ‰ vs. the PDB (Vienna Pee Dee Belemnite) international standard, with an accuracy of ±0.1‰.

3.3. Geothermometry

Geothermometers were useful for estimating the temperature of the reservoir of geothermal fields. For low–medium hydrothermal systems, silica and cation geothermometers can provide a range of temperature estimates, which may give insight into the geothermal evolution of deep parent geofluids during circulation. The empirical formulas based on the concentrations of silica and cations are listed in Table 2. For efficient reservoir temperature estimation, these classical geothermometers were combined with the multicomponent mineral equilibrium method, which was carried out using the PHREEQCI geochemical code and the LNLL thermodynamic database. There is a need to infer from the mineralogy of the aquifer formation the minerals presumably present in the reservoir, and to therefore consider them in the modelling [33].

4. Results

4.1. Hydrochemistry and Cluster Analysis

4.1.1. Clustering Features

CA is a convenient and effective means for exploring geochemical patterns and interpreting hydrochemical characteristics [34]. Cluster analysis was used as an analysis of variance approach (hierarchical cluster) to measure the distance between variable clusters in an attempt to minimize the sum of squares of any two clusters that could be formed at each step (square Euclidean distance) [35]. Hydrochemical data with similar properties were clustered in a group [36]. In this study, the major elements, including K, Na, Ca, Mg, Cl, SO4, and HCO3, were considered while evaluating the characteristics of the water samples using the average linkage hierarchical method, which is designed to optimize the minimum variance within groups (Figure 2). To avoid misclassifications arising from the different orders of magnitude of the variables, the variances for each variable were standardized.
The results of the Q-cluster analysis indicate that the water samples belonging to the four clusters had significantly different characteristics and so represent different categories of water. Well A7 in the west slope was not included in the group, only the test results are shown in Table 1.

4.1.2. Hydrochemical Characteristics

Different components of the water samples show significant heterogeneity in their physicochemical features. The discharge temperatures range from 20.1 °C to 62.5 °C and are listed in Table 1.
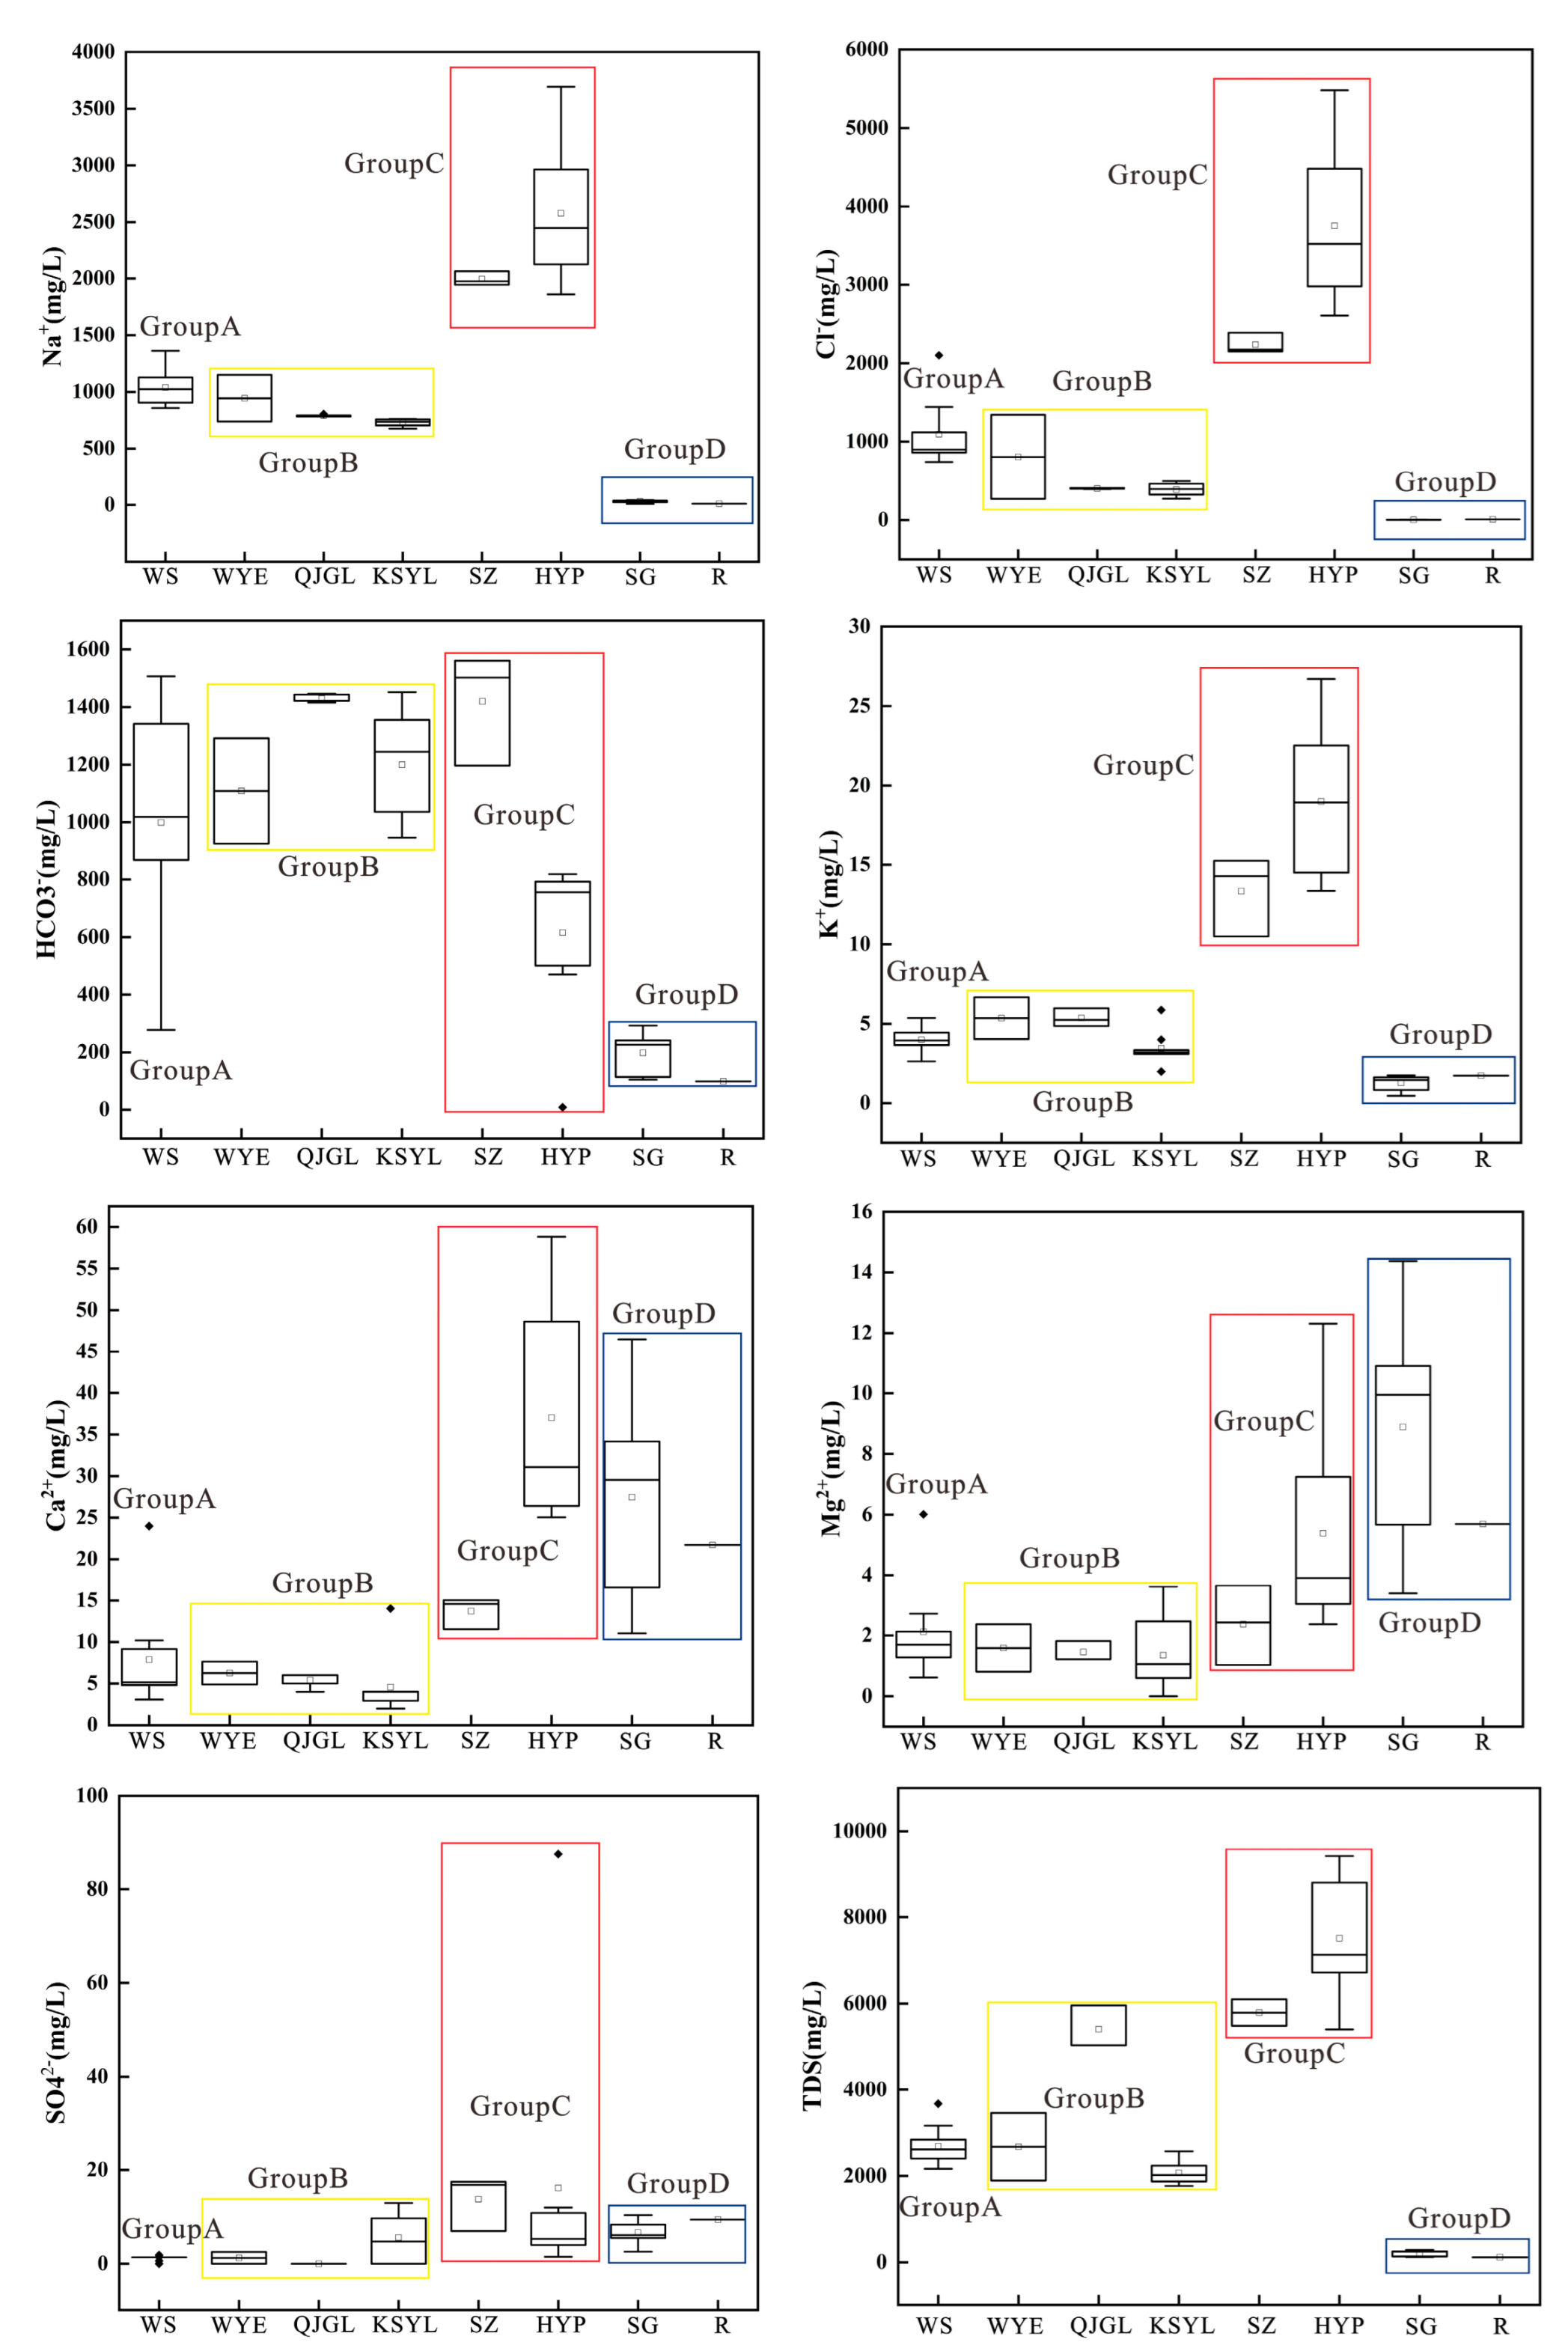
Total dissolved solid (TDS) concentration is defined as the calculated sum of the major and minor ion species concentrations (mg/L). The geothermal water samples had average TDS of 4240.73 mg/L and maximum TDS of up to 9413 mg/L, which occurred in the Heiyupao depression. The shallow groundwater samples yielded average TDS of 204.18 mg/L. As revealed by the analyses, the cations and anions in the geothermal water were dominated by Na+ (maximum: 46.48 mg/L), Cl (maximum: 5190.32 mg/L), and HCO3 (maximum: 1560.77 mg/L), while those in the shallow groundwater were dominated by Ca2+ (maximum: 3692.5 mg/L) and HCO3 (maximum: 292.9 mg/L). The pH of the geothermal water samples was 6.71–8.36 (average: 7.93), indicating alkaline water. The pH of the groundwater samples was 7.07–7.75 (average: 7.3), suggesting neutral water.
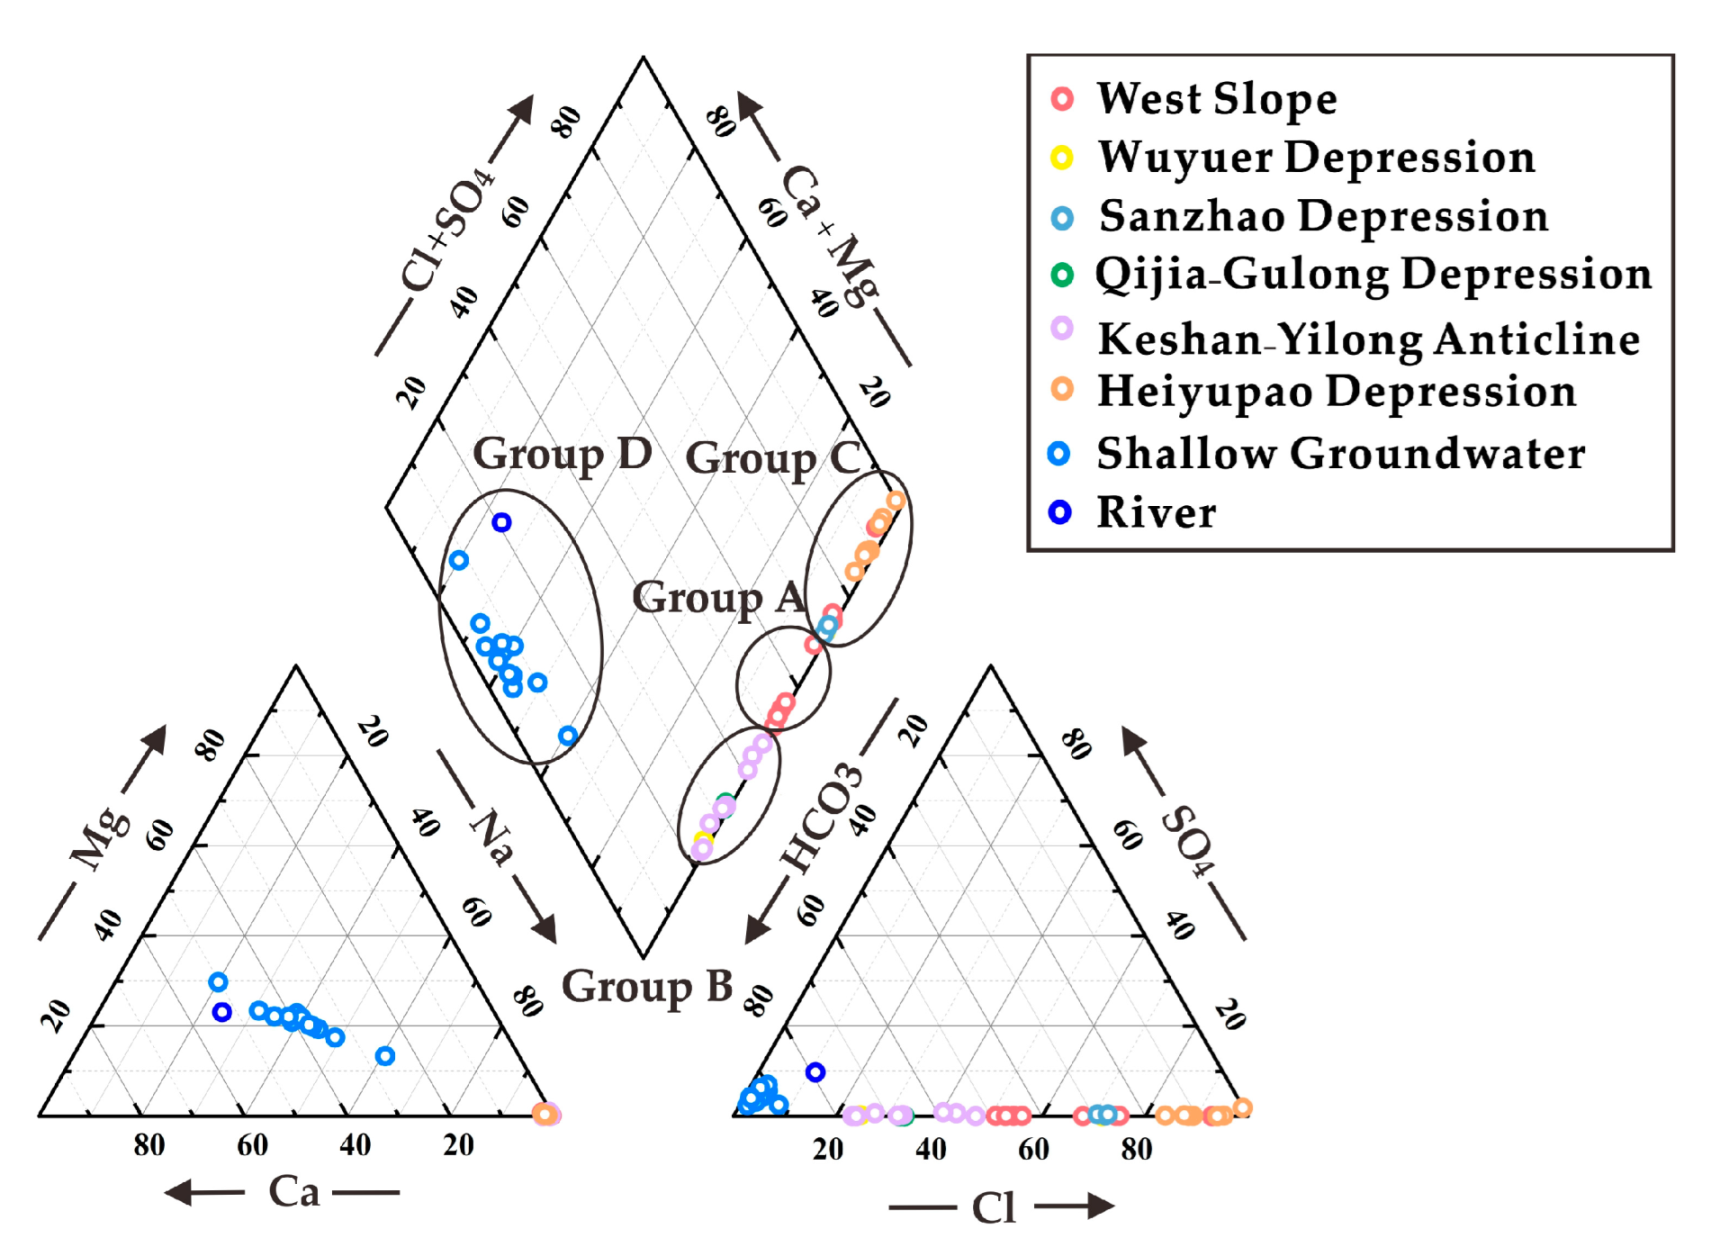
According to the Piper diagrams (Figure 3) and Q-cluster analysis, the geothermal water samples from the distinct zones can be classified into four groups [37].
Group A samples were taken from the west slope area at the margin of the geothermal field. They had hydrochemical types of mainly Cl·HCO3-Na, TDS of 2163–3671mg/L, and pH of 6.71–8.19. Their dominant cation was Na+, which had a concentration of 857.3–1362 mg/L. Their dominant anions included Cl and HCO3, with concentrations of 754.8–2101 mg/L and 277–1507 mg/L.
Group B samples were taken from the Qijia–Gulong and Wuyuer depression and the Keshan–Yilong anticline. They had pH of 7.45–8.36. Their dominant cation and anion were Na+ and HCO3, respectively, whose concentrations were 675.17–1150 mg/L and 946.82–1446.1 mg/L, respectively. They had contents of Cl of 268.17–1343.68mg/L, hydrochemical types of HCO3-Na/HCO3·Cl-Na, and TDS of 1767–5956.21 mg/L.
Group C samples were collected from the Heiyupao and Sanzhao depression. They had pH of 6.71–8.19. Compared with the water samples of Groups A and B, Group C samples had the highest Na+ and Cl concentrations, which were 1860–3692.5 mg/L and 2149.8–5481.61 mg/L, respectively. Group C samples had hydrochemical types of Cl-Na and TDS of 5400–9413 mg/L. The wellhead temperatures measured on site varied from 34.1 to 65.3 °C. Therefore, it can be inferred that Group C samples were in a relatively closed hydrogeochemical environment with slow groundwater runoff.
Group D samples were mainly taken from the Quaternary aquifers and rivers. They had hydrochemical types of mainly HCO3-Ca·Na/ HCO3-Ca·Mg, TDS of 118.5–285.6 mg/L, and pH of 7.07–7.75. Their dominant cation and anion were Ca2+ and HCO3, whose concentrations were 11.03–46.48mg/L and 97.63–292.9 mg/L, respectively.

4.1.3. Ionic Characteristics

The box plots (Figure 4) of the seven major ions and the TDS in the study area showed the following results. The K+, Na+, Cl, and TDS in the four groups of the geothermal water were in the order of C > A > B > D; HCO3 was in the order of C > B > A > D; and Mg2+ and Ca2+ were in the order of D > C > B > A. HCO3 and CO32− in water represent an open environment with strong hydrodynamic conditions that is related to atmospheric precipitation or the downward infiltration of surface water. In contrast, Cl mainly originates from sedimentary water, and a higher Cl- concentration is associated with a stronger concentration process of the sedimentary water, which means a more closed environment with weak hydrodynamic conditions. In the process of cation exchange, the Mg2+and Ca2+ dissolved in water are exchanged for K+ and Na+ absorbed by surrounding rocks, leading to an increase in the concentrations of K+ and Na+ in geothermal water. The concentrations of Mg2+ and Ca2+ are the highest in low TDS water but lower in geothermal water.

4.2. Isotopic Characteristics

4.2.1. H and O Isotopes

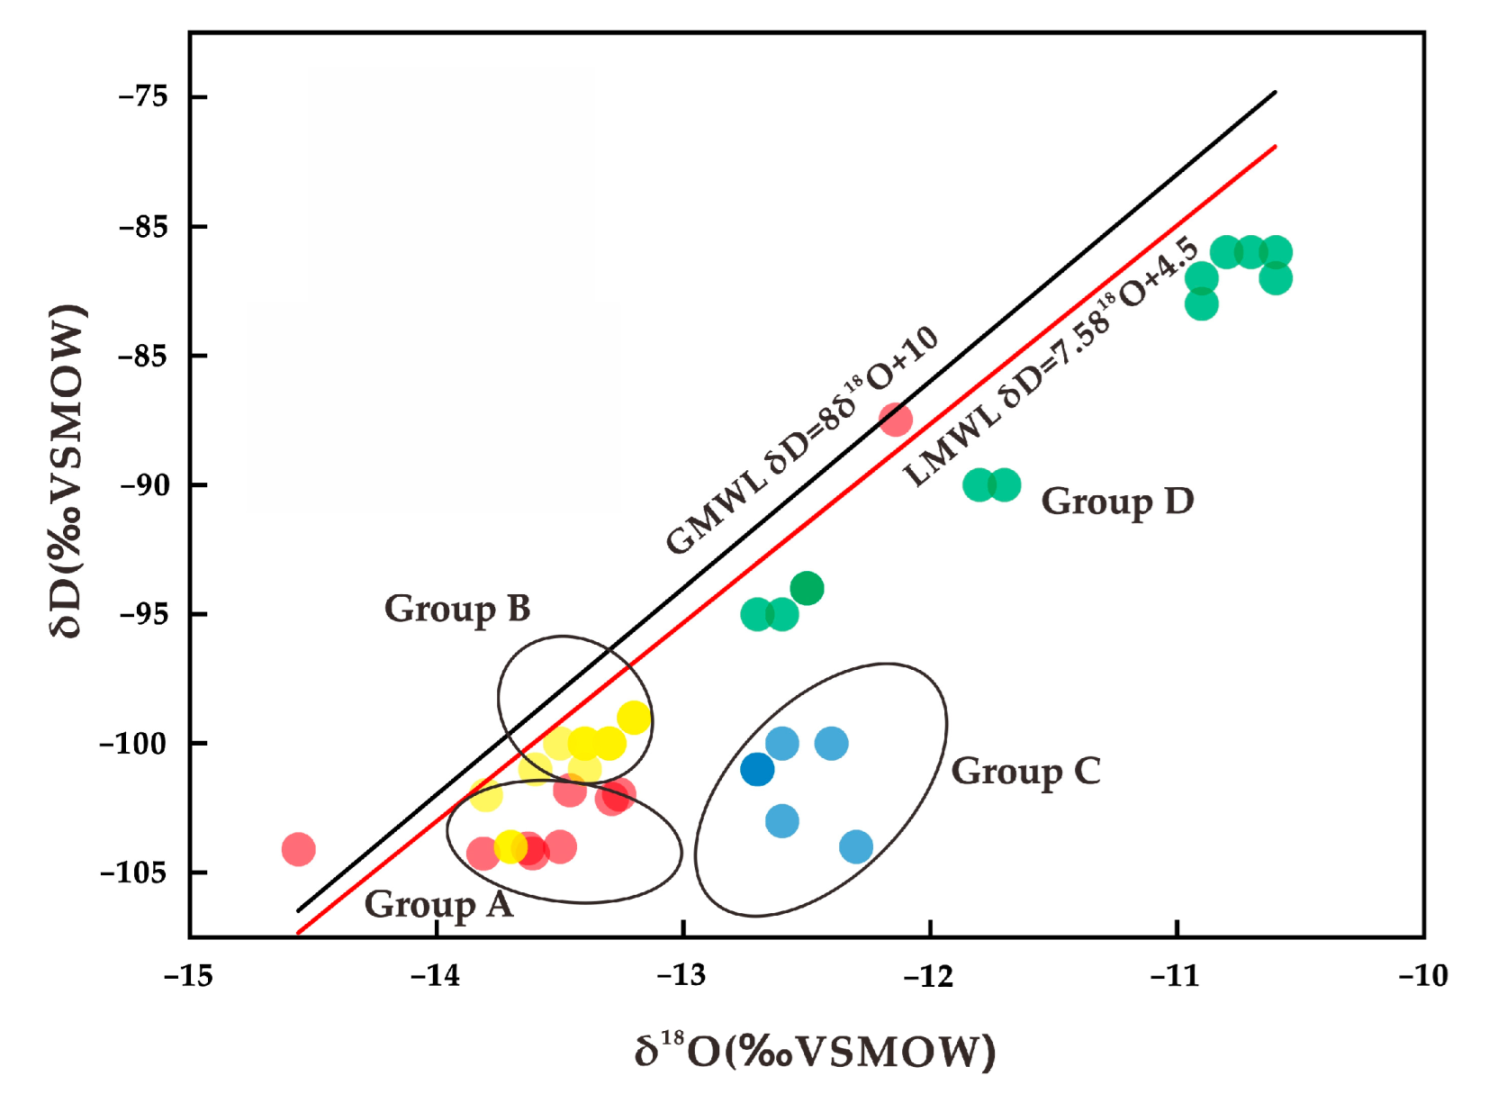
Stable isotopes (18O and 2H) provide important information about subsurface processes and the origins of water [38]. The stable isotope analysis results are listed in Table 1. The geothermal water samples yielded δ18O and δ2H values of −12.14‰–−14.56‰ and −87.47‰–−104.26‰, respectively (Figure 5). Specifically, the δ18O and δ2H values of the Group A samples were generally −13.26‰–−14.56‰ and −101.81‰–−104.26‰, respectively; those of the Group B samples were −13.2‰–−13.7‰ and −99‰–−104‰, respectively; those of the Group C samples were −12.4‰–−12.7‰ and −100‰–−103‰, respectively, and those of Group D samples were −10.6‰–−12.7‰ and −81‰–−95‰, respectively. Therefore, Group D samples were the richest in the δ2H and δ18O isotopes. The δ2H and δ18O values of the geothermal water samples were significantly smaller than those of the shallow cold groundwater samples, indicating that geothermal water originates from colder recharge areas at higher elevations.

4.2.2. C Isotopes

The 14C dating method is a mature dating method for groundwater and geothermal water with great ages. It has a large dating range and is suitable for dating groundwater at 100–5000 aB.P. [39]. The equations are as follows [40]:
t = −8267 × ln(At/A0)
where t is the age of the groundwater (aB.P.); At is the radioactivity of carbon in the sample t years after carbon exchange ceased; and A0 is the 14C radioactivity during the exchange cycle (initial value defined as 100 pMC). The 14C and δ13C of eight samples of Group A were measured (Table 3). The 14C activities in the dissolved inorganic carbon (DIC) of samples A8, A3, and A4 were relatively low, with values of 0.5–0.76 pMC. Samples from the five wells yielded 14C values of less than 0.44 pMC, which is below the detection limit of the accelerator mass spectrometry method. Therefore, the geothermal water in the study area has been formed for ages and features a long recharge path and a slow runoff rate. Its apparent age is greater than 44,800 aB.P. The δ13C was relatively rich in the DIC of Group A samples, with values of −2.7‰–−10.9‰.

5. Discussion

5.1. Water–Rock Interactions

5.1.1. Lixiviation

Cl does not react with the sedimentary framework, and the relationship between Cl and TDS can be used to reflect possible dissolution. The Cl/TDS ratio increased with increased TDS (Figure 6a). Moreover, as the temperature increased, the Cl concentration increased and the lixiviation was enhanced along the runoff paths.

5.1.2. Cation Exchange and Adsorption

Scholler [41] proposed that the cation exchange can be evaluated using chloro-alkaline indices (CAI1 and CAI2), and the equations are as follows:
CAI1 = [Cl (Na+ + K+)]/Cl
CAI2 = [Cl (Na+ + K+)]/(SO42− + HCO3 + CO32− + NO3)
They are positive if ion exchange occurs between cations Na+ and K+ dissolved in water and the cations Mg2+ and Ca2+ adsorbed in rocks, otherwise they are negative. The calculated CAI1 and CAI2 fall in the first or third quadrants (Figure 6b), indicating that the water–rock interaction is dominated by cation exchange. The water samples showed a distinct regular distribution pattern of CAI1 and CAI2. Water samples from the Keshan–Yilong anticline yielded negative CAI1 and CAI2, indicating reverse ion exchange. In other words, ion exchange occurs between cations Ca2+ and Mg2+ dissolved in water and cations Na+ and K+ adsorbed by surrounding rocks, resulting in increased concentrations of Na+ and K+ and decreased concentrations of Ca2+ and Mg2+ in the water. Some water samples from the Heiyupao and Wuyuer depression showed positive CAI1 and CAI2, indicating the ion exchange between cations Na+ and K+ dissolved in water and cations Ca2+ and Mg2+ adsorbed by the surrounding rocks, which increased the concentration of Ca2+ and Mg2+.
Therefore, Group C samples were in a more closed hydrogeochemical environment and featured slower geothermal water runoff and stronger lixiviation. These results also indicate that, from C to B to A, the geothermal water drained from the periphery to the center of the basin and that the permeability and hydrodynamic conditions deteriorated along the runoff direction of the geothermal water. For Group A and B, the dominant anions were HCO3 and Cl, respectively. This result indicates that the Group B samples were in a relatively open hydrogeochemical environment and featured more sufficient water–rock interactions, which involved more ionic components in the surrounding rock subject to lixiviation with longer duration. Correspondingly, the TDS of the Group B samples were lower. Moreover, samples in Groups A and B had far lower TDS than the Group C samples. The water with high TDS had a roughly consistent distribution range with the oil fields and oil-bearing areas inside the basin. The first-order tectonic unit where the Heiyupao depression is located, which is a part of the central depression zone, is the most important oil and gas enrichment area in the Songliao basin [42].

5.2. Temperature Estimates in the Geothermometer

Fluid geothermometry can be used to predict reservoir temperature. Cation geothermometry, theoretical chemical geothermometry, and silica (SiO2) geothermometry were applied in this study to comprehensively evaluate the reservoir temperature [43].
(1)
Cation geothermometry
The results of cation geothermometry are shown in Table 4. The reservoir temperatures were calculated to be 38.51–170.4 °C. They were either too high for this study area or lower than the measured temperature and thus were not reasonable. The errors between the calculated results and the measured data were all greater than 20%.
(2)
SiO2 geothermometry
This method is based on the dissolution equilibrium of SiO2 in geothermal water to predict the reservoir temperature. The calculated results of different SiO2 geothermometries are shown in Table 4. The reservoir temperature range was calculated to be 45.19–78.81 °C using a quartz geothermometer and 12.57–47.44 °C using a chalcedony geothermometer.
As shown in Table 4, the geothermal water in the study area had calculated temperatures of 12.57–170.4 °C. The Group C samples had the highest temperatures, followed by Groups B and A. Therefore, the reservoir temperature increases gradually from the margin to the center of the basin and is affected by the structural relief of the basement and groundwater flow. To correctly evaluate the reliability of the estimated values of various geochemical geothermometers, this study analyzed the relative errors (difference ≤ ±20%) between the estimated values of different geochemical geothermometers and the measured bottomhole temperatures of the geothermal wells. According to Table 4, the errors between the calculated temperature using a quartz geothermometer and the measured bottomhole temperature were small. Among the 17 geothermal wells, 13 yielded errors of less than 20%, and only two yielded errors of greater than 30% (31.9% and 33.5%).
(3)
Theoretical chemical geothermometry
Multiple mineral equilibrium calculations are another way of estimating the temperature of a geothermal reservoir [44]. This method is used to verify whether the geothermal water in the reservoir has reached equilibrium with relevant mineral assemblages in the host rock and provides the reservoir temperature if the equilibrium is established. According to the local geological conditions, minerals in the mudstones and sandstones in the deep parts of the Songliao Basin mainly include quartz, calcite, montmorillonite, kaolinite, and potassium feldspar. The variations in the SI with increasing temperature were calculated using the PHREEQCI geochemical code and the LNLL thermodynamic database. Samples C11, B2, and A6 were taken as examples to explain the application of this method. As shown in Figure 7, the curves of sample C11 converged well at 83 °C, which agreed with the measured temperature of 89 °C. Moreover, the curves of samples B2 and A6 converged well at 78 °C and 61 °C, respectively, which were consistent with the measured temperatures of 84 °C and 52.3 °C, respectively. The minerals with convergent curves included montmorillonite, kaolinite, potassium feldspar, calcite, quartz, and chalcedony.
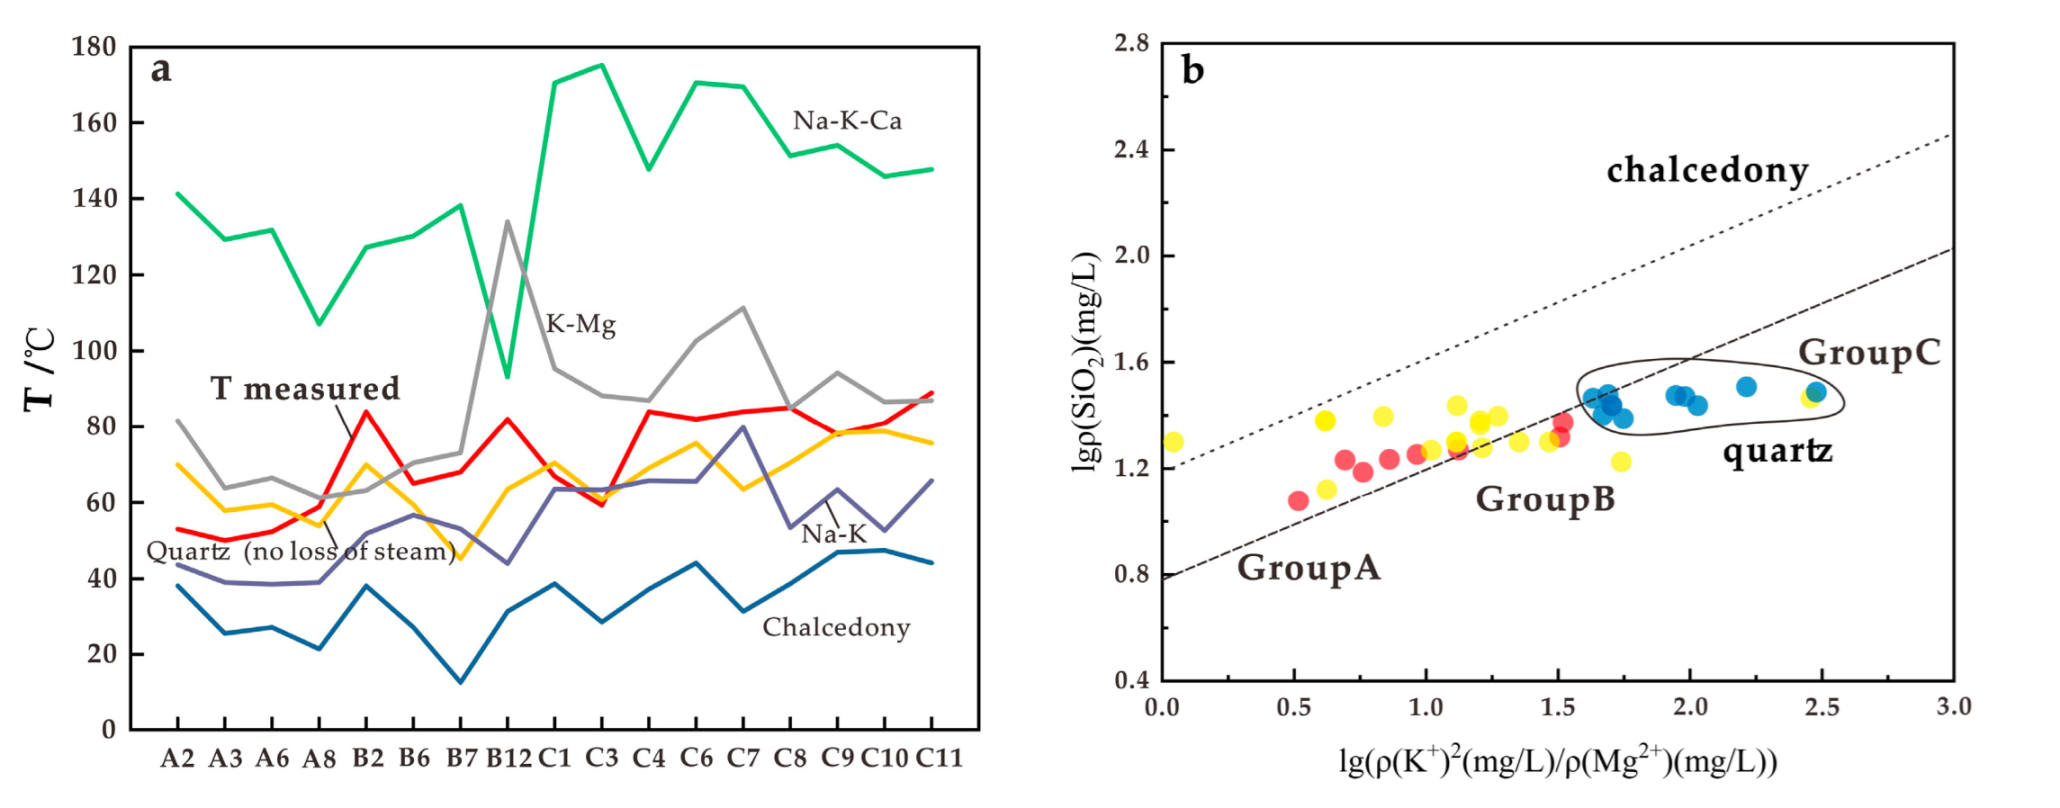
The comparison plots of the calculated results of each geothermometer and the measured bottomhole temperature are shown in Figure 8. According to these plots, the estimated temperatures of the silica geothermometer are lower than those of the cationic geothermometers. The possible reasons are as follows: The temperature and pressure decrease as the geothermal water rises, leading to a decrease in the silica content. Moreover, the mixing with shallow groundwater also dilutes silica [45]. The comparison plot of Lg (SiO2) and Lg (K2/Mg) is commonly used to indicate the silica morphology in sluggish geothermal fluids. All the geothermal water samples were distributed near the line of the quartz mineral, indicating that the quartz mineral determines the content of dissolved silica in the geothermal water [46]. The errors between the calculated results and the measured temperature also show that quartz geothermometers yielded relatively low temperatures. Therefore, the geothermal reservoir temperatures estimated using a quartz geothermometer were more reliable than the estimated results of geothermometers and were close to those calculated using theoretical chemical geothermometry.

5.3. Reservoir Temperature and Circulation Depth

The groundwater circulation depth can be calculated using the following equation [47]:
D = (T − T0)/G
where D is circulation depth (km); T is reservoir temperature (°C); T0 is the temperature of the constant temperature zone (°C); and G is the geothermal gradient (°C/km). The groundwater circulation depth of 1.5 km was obtained with an average reservoir temperature of 66 °C, an annual average temperature of 15 °C for T0, and an average geothermal gradient of 35 °C/km for G [48].

5.4. Recharge Source of Geothermal Water

The δ2H and δ18O compositions of the geothermal fluids were plotted, as shown in Figure 5. According to this figure, most of the samples fell near the local meteoric water line (LMWL, δ2H = 7.58δ18O + 4.5) [39] of the Songliao Basin and the global meteoric water line (GMWL, δ2H = 8δ18O + 10) [38], indicating the meteoric origin of the geothermal waters. Some geothermal water samples fell below the LMWL, indicating that atmospheric precipitation is affected by evaporation and water–rock isotopic exchange in the process of infiltration into the geothermal reservoir system [49].
A significant “oxygen shift” existed in the thermal waters as compared to the cold groundwater. The extent of the oxygen isotope shift depended on the initial content of δ18O in the country rock and the geothermal water, the local lithology, the geothermometer temperature, the duration of the rock and water interaction, and the aquifer properties [50]. Geothermal reservoir temperature and contact duration are the most important factors. Strong evidence exists for the “oxygen isotope shift” in the low–medium-temperature geothermal field of Songliao as a result of the long contact duration of rock and water (>30,000 years) [51].
For the four groups of water samples, the shallow groundwater samples in Group D showed slight δ18O shifts, indicating different degrees of evaporation and concentration. The δ2H and δ18O values of the geothermal water samples in groups A and C exhibited significant deviation from the meteoric water lines. This phenomenon was more significant for water samples in Group C. Owing to the increased circulation path and the low flow rate, the geothermal water samples in Group C featured a higher degree of water–rock reaction and longer durations of oxygen isotope exchange between the geothermal water and the rocks. As mentioned above, Group C samples had higher reservoir temperatures. Since a higher geothermal reservoir temperature is associated with longer oxygen isotope displacement, the δ2H and δ18O values of Group C samples also prove the rationality of the above reservoir temperature calculation.
The isotopic elevation effect of δ18O can be used to evaluate groundwater recharge elevation [52]:
H = (δG − δP)/K + h
where H is the elevation of a geothermal water recharge area (m); h is the elevation of a geothermal water sampling point (m); δG is the δ18O (or δ2H) value of the geothermal water (‰); δP is the δ18O (or δ2H) value of the atmospheric precipitation near the sampling point (‰); and K is the height gradient of the δ18O (or δ2H) value of atmospheric precipitation (−δ/100 m). Based on the relationships between the elevation and the stable hydrogen and oxygen isotopes in atmospheric precipitation, we considered that the K of δ2H was −4.95‰/100 m, as adopted in this study. Since the low plain area in the southwest, the high plain area in the northeast, and the low mountainous and hilly area in the west of the study area generally had elevations of approximately 140–160 m, 200–270 m, and 200–800 m, respectively, the elevations of the recharge areas were estimated to be 300–700 m (Table 1). The recharge areas were predicted to be the mountainous areas to the west and north of the basin.

5.5. Conceptual Circulation of the Geothermal Water

Based on hydrochemical information and the interpretation of the stable isotope data of the geothermal water, this study proposes a conceptual model for the formation of the geothermal system in the study area (Figure 9).
(1) The geothermal system in the study area is a low–medium-temperature conduction type. Its geothermal reservoirs mainly consist of sandstones of the Lower Cretaceous Quantou Formation and the Upper Cretaceous Qingshankou and Yaojia Formations. Its cap rock comprises the overburden of hugely thick Quaternary strata, Paleogene strata, and Cretaceous Mingshui, Sifangtai, and Nenjiang Formations, with lithology dominated by mudstones. The study area has thin crust, with a Moho depth of 29–33 km. Moreover, there is a low-wave-velocity and high-electrical-conductivity layer at a depth of greater than 9–17 km [53].
(2) The water in the study area mainly originates from the paleo-atmospheric precipitation to the west of the west slope area of the basin and to the north of the Keshan–Yilong anticline of the basin. After infiltrating into the geothermal reservoir, the paleo-atmospheric precipitation is heated, leading to stronger water–rock interaction. The fluids in the geothermal reservoirs gradually dissolve minerals such as halite and aluminosilicate in sedimentary rocks as they flow. As a result, the geothermal water has rich Na+, Cl, and HCO3. In addition to lateral runoff, the runoff channels of the geothermal system include the water- and heat-conducting channels of the fault zones.
(3) The geothermal reservoir temperature increases gradually from the edge to the center of the basin, varying in the range of 50–89 °C. The geothermal field of the geothermal reservoirs is controlled by the structural relief of the basement, i.e., heat conduction. The heat sources of the geothermal reservoirs include the radioactive decay of the heat-producing elements in the crust and the heat conducted from the mantle.

6. Conclusions

Hydrochemistry and stable isotopes are employed to investigate the formation of the hydrothermal system in the northwestern Songliao Basin, China. The geothermal waters in the area are recharged from the northwest mountainous at an elevation of 300–700 m by paleo-atmospheric precipitation. The 14C ages showed that the geothermal water flowed at an extremely low rate (millennial scale). Compared to shallow groundwater, geothermal waters had significant oxygen isotope shift exists, likely as a result of a long period of water–rock interaction.
The highest reservoir temperature measured in the Heiyupao depression was 89 °C and the reservoir temperature was estimated to be 45.19–83 °C using a quartz geothermometer. The average thermal gradients of the northern Songliao Basin are 3.5 °C/100 m. The underlying reasons for the high geothermal gradient and terrestrial heat flow in the basin include the uplift of the Moho, the uplift of the upper mantle, and the presence of a high-electrical-conductivity layer in the crust.
The circulation depth for the groundwater was 1.5 km. The geothermal system in the study area is the low–medium-temperature conduction type. Its formation complies with the geothermal theory of the crust and mantle producing heat and of structures accumulating heat, and the specific genetic model comprises stratum-controlling geothermal reservoirs, lateral runoff recharge, and heat supply by terrestrial heat flow.

Author Contributions

R.Y., investigation, formal analysis, data curation, original draft; W.Z., supervision; H.G., investigation; F.L., investigation; S.W., investigation; L.L., investigation, supervision, writing—review and editing. All authors have read and agreed to the published version of the manuscript.

Funding

This research was supported by the China Geological Survey Program (DD20221676, DD20190128).

Institutional Review Board Statement

Not applicable.

Informed Consent Statement

Not applicable.

Data Availability Statement

Not applicable.

Acknowledgments

We would like to thank the professional reviewers and the editors.

Conflicts of Interest

The authors declare no conflict of interest.

References

  1. Kong, Y.; Pang, Z.; Shao, H.; Hu, S.; Kolditz, O. Recent studies on hydrothermal systems in China: A review. Geotherm. Energy 2014, 2, 19. [Google Scholar] [CrossRef] [Green Version]
  2. Qiu, X.; Wang, Y.; Wang, Z.; Regenauer-Lieb, K.; Zhang, K.; Liu, J. Determining the origin, circulation path and residence time of geothermal groundwater using multiple isotopic techniques in the Heyuan fault zone of southern China. J. Hydrol. 2018, 567, 339–350. [Google Scholar] [CrossRef]
  3. Wang, G.; Li, K.; Wen, D.; Lin, W.; Lin, L.; Liu, Z.; Zhang, W.; Ma, F.; Wang, W. Assessment of geothermal resources in China. In Thirty-Eighth Workshop on Geothermal Reservoir Engineering; Stanford University: Stanford, CA, USA, 2013. [Google Scholar]
  4. Wang, G.; Zhang, W.; Liang, J.; Lin, W.; Liu, Z.; Wang, W. Evaluation of Geothermal Resources Potential in China. Acta Geosci. Sin. 2017, 38, 448–459. [Google Scholar]
  5. Yuan, R.; Wang, G.; Liu, F.; Zhang, W.; Wang, W.; Cao, S. Evaluation of shallow geothermal energy resources in the Beijing-Tianjin-Hebei Plain based on land use. J. Groundw. Sci. Eng. 2021, 9, 129–139. [Google Scholar]
  6. Zhu, H. Research on the Sedimentary Geothermal Resources in North Songliao Basin. Ph.D. Thesis, Northeast Petroleum University, Daqing, China, 2011. [Google Scholar]
  7. Zhang, W.; Wang, G.; Liu, F.; Xing, L.; Li, M. Characteristics of geothermal resources in sedimentary basins. Geol. China 2019, 46, 255–268. [Google Scholar]
  8. Duan, Z.; Pang, Z.; Wang, X. Sustainable evaluation of limestone geothermal reservoirs with extended production histories in Beijing and Tianjin, China. Geothermics 2011, 40, 125–135. [Google Scholar] [CrossRef]
  9. Hähnlein, S.; Bayer, P.; Ferguson, G.; Blum, P. Sustainability and policy for the thermal use of shallow geothermal energy. Energy Pol. 2013, 59, 914–925. [Google Scholar] [CrossRef]
  10. Belhai, M.; Fujimitsu, Y.; Barragan-Reyes, R.M. Insights into geochemical characteristics of the geothermal fluids of northwestern algeria: An updated conceptual model. Geothermics 2022, 99, 102304. [Google Scholar] [CrossRef]
  11. Saibi, H.; Batir, J.F.; Pocasangre, C. Hydrochemistry and geothermometry of thermal waters from UAE and their energetic potential assessment—ScienceDirect. Geothermics 2021, 92, 102061. [Google Scholar] [CrossRef]
  12. Xu, C.; Yu, D.; Luo, Z. Recharge Sources and Genetic Model of Geothermal Water in Tangquan, Nanjing, China. Sustainability 2021, 13, 4449. [Google Scholar] [CrossRef]
  13. Ndikubwimana, I.; Mao, X.; Zhu, D.; He, Y.; Shi, Z. Geothermal evolution of deep parent fluid in Western Guangdong, China: Evidence from water chemistry, stable isotopes and geothermometry. Hydrogeol. J. 2020, 28, 2947–2961. [Google Scholar] [CrossRef]
  14. Guo, Q.; Wang, Y.; Liu, W. O, H, and Sr isotope evidences of mixing processes in two geothermal fluid reservoirs at Yangbajing, Tibet, China. Environ. Earth Sci. 2010, 59, 1589–1597. [Google Scholar] [CrossRef]
  15. Xu, W.; Su, X.; Dai, Z.; Yang, F.; Zhu, P.; Huang, Y. Multi-tracer investigation of river and groundwater interactions: A case study in Nalenggele River basin, northwest China. Hydrogeol. J. 2017, 25, 2015–2029. [Google Scholar] [CrossRef]
  16. Huang, T.; Pang, Z.; Liu, J.; Ma, J.; Gates, J. Groundwater recharge mechanism in an integrated tableland I Loess Plateau, northern China: Insights from environmental tracers. Hydrogeol. J. 2017, 25, 2049–2065. [Google Scholar] [CrossRef]
  17. Lu, L.; Pang, Z.; Kong, Y.; Guo, Q.; Wang, Y.; Xu, C.; Gu, W.; Zhou, L.; Yu, D. Geochemical and isotopic evidence on the recharge and circulation of geothermal water in the Tangshan Geothermal System near Nanjing, China: Implications for sustainable development. Hydrogeol. J. 2018, 26, 1705–1719. [Google Scholar] [CrossRef]
  18. Stefánsson, A.; Arnórsson, S.; Sveinbjörnsdóttir, Á.E.; Heinemaier, J.; Kristmannsdóttir, H. Isotope (δd, δ18o, 3h, δ13c, 14c) and chemical (B, Cl) Constrains on water origin, mixing, water-rock interaction and age of low-temperature geothermal water. Appl. Geochem. 2019, 108, 104380. [Google Scholar] [CrossRef]
  19. Fournier, R.O. Chemical geothermometers and mixing models for geothermal systems. Geothermics 1977, 5, 41–50. [Google Scholar] [CrossRef]
  20. Fournier, R.O. A revised equation for Na/K geothermom. Geoth. Res. Counc. Trans. 1979, 3, 221–224. [Google Scholar]
  21. Fournier, R.O.; Truesdell, A.H. An empirical Na-K-Ca geothermometer for natural waters. Geochim. Cosmochim. Acta 1973, 37, 1255–1275. [Google Scholar] [CrossRef]
  22. Giggenbach, W.F. Geothermal solute equilibria-derivation of Na-K Mg-Ca geoindicators. Geochim. Cosmochim. Acta 1988, 52, 2749–2765. [Google Scholar] [CrossRef]
  23. Reed, M.; Spycher, N. Calculation of pH and mineral equilibria in hydrothermal waters with application to geothermometry and studies of boiling and dilution. Geochim. Cosmochim. Acta 1984, 48, 1479–1492. [Google Scholar] [CrossRef]
  24. Pang, Z.; Reed, M. Theoretical chemical thermometry on geothermal waters: Problems and methods. Geochim. Cosmochim. Acta 1988, 62, 1083–1091. [Google Scholar] [CrossRef]
  25. Ma, F.; Wang, G.; Sun, Z.; Zhang, W.; Hou, H.; Guo, X. An Analysis of Thermal Conductivity in Songliao Basin Based on Logging Parameters. Acta Geosci. Sin. 2019, 40, 350–360. [Google Scholar]
  26. Ge, R.; Zhang, Q.; Wang, L.; Xie, G.; Xu, S.; Chen, J.; Wang, X. Tectonic Evolution of Songliao Basin and the Prominent Tectonic Regime Transition in Eastern China. Geol. Rev. 2010, 56, 180–195. [Google Scholar]
  27. Dong, T.; Gao, Y.; Huang, H.; Tian, X.; Yang, Q.; Li, Y.; Niu, L.; Cao, Y. Mineralogical Evolution of the Cretaceous Strata in the Songliao Basin, Northeastern China: Implications for Thermal History and Paleoenvironmental Evolution. Minerals 2021, 11, 1101. [Google Scholar] [CrossRef]
  28. Jiang, G.; Wang, Y.; Shi, Y.; Zhang, C.; Tang, X.; Hu, S. Estimate of Hot Dry Rock Geothermal Resource in Daqing Oilfield, Northeast China. Energies 2016, 9, 731. [Google Scholar] [CrossRef] [Green Version]
  29. Zhang, Y.; Guo, L.; Li, Z.; Yu, Z.; Jin, X.; Xu, T. Feasibility Evaluation of EGS Project in the Xujiaweizi Area: Potential Site in Songliao Basin, Northeastern China. In Proceedings of the World Geothermal Congress 2015, Melbourne, Australia, 19–25 April 2015. [Google Scholar]
  30. Su, Y. Genesis and Rational Development of Typical Geothermal Field in the Songliao Basin: A Case Study of Lindian Geothermal Field. Ph.D. Thesis, Jilin University, Changchun, China, 2021. [Google Scholar]
  31. Wang, C.; Feng, Z.; Zhang, L.; Huang, Y.; Cao, K.; Wang, P.; Zhao, B. Cretaceous paleogeography and paleoclimate and the setting of SKI borehole sites in Songliao Basin, northeast China. Palaeogeogr. Palaeoclimatol. Palaeoecol. 2013, 385, 17–30. [Google Scholar] [CrossRef]
  32. Fuoco, I.; Rose, R.; Barca, D.; Figoli, A.; Gabriele, B.; Apollaro, C. Arsenic polluted waters: Application of geochemical modelling as a tool to understand the release and fate of the pollutant in crystalline aquifers. J. Environ. Manag. 2022, 301, 113796. [Google Scholar] [CrossRef]
  33. Li, J.; Sagoe, G.; Yang, G.; Lu, G. Evaluation of mineral-aqueous chemical equilibria of felsic reservoirs with low-medium temperature: A comparative study in Yangbajing geothermal field and Guangdong geothermal fields. J. Volcanol. Geotherm. Res. 2018, 352, 92–105. [Google Scholar] [CrossRef]
  34. Wang, X.; Wang, G.; Lu, C.; Gan, H.; Liu, Z. Hydrochemical Characteristics and Evolution of Geothermal Fluids in the Chabu High-Temperature Geothermal System, Southern Tibet. Geofluids 2018, 71, 118–131. [Google Scholar] [CrossRef] [Green Version]
  35. Gan, H.; Wang, G.; Wang, X.; Lin, W.; Yue, G. Research on the Hydrochemistry and Fault Control Mechanism of Geothermal Water in Northwestern Zhangzhou Basin. Geofluids 2019, 2019, 3925462. [Google Scholar] [CrossRef] [Green Version]
  36. Wang, J.; Zuo, R.; Caers, J. Discovering geochemical patterns by factor-based cluster analysis. J. Geochem. Explor. 2017, 181, 106–115. [Google Scholar] [CrossRef]
  37. Apollaro, C.; Vespasiano, G.; De Rosa, R.; Marini, L. Use of mean residence time and flowrate of thermal waters to evaluate the volume of reservoir water contributing to the natural discharge and the related geothermal reservoir volume. Application to Northern Thailand hot springs. Geothermics 2015, 58, 62–74. [Google Scholar] [CrossRef]
  38. Craig, H. The isotopic geochemistry of water and carbon in geothermal area. In Nuclear Geology in Geothermal Areas; Tongiori, E., Ed.; Consiglio Nazional delle Riecerche, Laboratorio di GeologiaNucleare, Pias: Spoleto, Italy, 1963; pp. 17–53. [Google Scholar]
  39. Chen, Z.; Qi, J.; Zhang, Z. Application of Isotope Hydrogeological Methods to Typical Northern Basins; Science Press: Beijing, China, 2010. [Google Scholar]
  40. Han, L.; Plummer, L. A review of single-sample-based models and other approaches for radiocarbon dating of dissolved inorganic carbon in groundwater. Earth-Sci. Rev. 2015, 152, 119–142. [Google Scholar] [CrossRef]
  41. Scholler, H. Qualitative evaluation of groundwater resource. Methods and techniques of groundwater investigation and development. Water Res. 1967, 33, 44–52. [Google Scholar]
  42. Luo, L.; Pang, Z.; Liu, J.; Hu, S.; Rao, S.; Li, Y.; Lu, L. Determining the recharge sources and circulation depth of thermal waters in Xianyang geothermal field in Guanzhong Basin: The controlling role of Weibei Fault. Geothermics 2017, 69, 55–64. [Google Scholar] [CrossRef]
  43. Roberto, C.; Marini, L. A Thermodynamic Approach to Water Geothermometry; Springer: Berlin/Heidelberg, Germany, 2020. [Google Scholar]
  44. Brahim, B.; Makni, J.; Bouri, S.; Dhia, H.B. Evaluation of temperature and mixing process of water in deep and shallow aquifers in the southwestern Tunisia: Case of Djerid region. Arab. J. Sci. Eng. 2014, 39, 5677–5689. [Google Scholar] [CrossRef]
  45. Pasvanoğlu, S.; Çelik, M. A conceptual model for groundwater flow and geochemical evolution of thermal fluids at the Kızılcahamam geothermal area, Galatian volcanic province. Geothermics 2017, 71, 88–107. [Google Scholar] [CrossRef]
  46. Wang, X. Formation conditions and Hydrogeochemical Characteristics of the geothermal water in Typical Coastal Geothermal field with Deep faults, Guangdong Province. Ph.D. Thesis, China University of Geosciences Wuhan, Wuhan, China, 2018. [Google Scholar]
  47. Li, G.; Li, F. The Circulation Law, Sustainable Development and Utilization of Geothermal Water in Guanzhong Basin; Science Press: Beijing, China, 2010. [Google Scholar]
  48. Jiang, G.; Gao, P.; Rao, S.; Zhang, L. Compilation of heat flow data in the continental area of China (4th edition). Chin. J. Geophys. 2016, 59, 2892–2910. [Google Scholar]
  49. Giggenbach, W.F. Isotopic shifts in waters from geothermal and volcanic systems along convergent plate boundaries and their origin. Earth Planet Sci. Lett. 1992, 113, 495–510. [Google Scholar] [CrossRef]
  50. Pang, Z.; Yang, F.; Huang, T.; Duan, Z. Genesis analysis of geothermal system in Guanzhong Basin of China with implications on sustainable geothermal resources development. In Proceedings of the World Geothermal Congress 2010, Bali, Indonesia, 25–29 April 2010. [Google Scholar]
  51. Clark, I.D.; Fritz, P. Environmental Isotopes in Hydrogeology; CRC: Boca Raton, FL, USA, 1997; p. 328. [Google Scholar]
  52. Ma, F.; Wang, G.; Sun, H.; Sun, Z. Indication of hydrogen and oxygen stable isotopes on the characteristics and circulation patterns of medium-low temperature geothermal resources in the Guanzhong Basin, China. J. Groundw. Sci. Eng. 2022, 10, 70–86. [Google Scholar]
  53. Vespasiano, G.; Marini, L.; Muto, F.; Auqué, L.F.; Cipriani, M.; De Rosa, R.; Critelli, S.; Gimeno, M.J.; Blasco, M.; Dotsika, E.; et al. Chemical, isotopic and geotectonic relations of the warm and cold waters of the Cotronei (Ponte Coniglio), Bruciarello and Repole thermal areas, (Calabria—Southern Italy). Geothermics 2021, 98, 102228. [Google Scholar] [CrossRef]
Figure 2. Dendrogram from the Q-cluster analysis of all water samples.
Water 14 02235 g002
Figure 3. Piper diagram of all water samples.
Water 14 02235 g003
Figure 4. Box plots of main hydrochemical components in water samples from the study area.
Water 14 02235 g004
Figure 5. δ2H–δ18O relationships of water samples from the study area.
Water 14 02235 g005
Figure 6. (a) Relationships between the Cl/TDS ratio; (b) relationships between CAI1 and CAI2.
Water 14 02235 g006
Figure 7. Variation in mineral saturation indices (SI) with increasing temperature for samples of (a) C11, (b) B2 and (c) A6. The convergence point indicates the calculated reservoir temperature (fel: K-feldspur; cal: calcite; chal: chalcedony; si: SiO2; mont: montmor-Ca; qz: quazrtz; kao: kaolinite).
Water 14 02235 g007
Figure 8. (a) Comparison between the measured results of different geothermometers; (b) comparison chart of Lg(SiO2) vs. Lg(K2/Mg).
Water 14 02235 g008
Figure 9. Conceptual model of the genetic mechanisms of the geothermal system in the study area.
Water 14 02235 g009
Table 1. Hydrochemical and isotopic characteristics of the sampled waters from west Songnen Plain, China (unit: mg/L).
SampleWell Depth (m)T (°C)pHK+Na+Ca2+Mg2+ClSO42−HCO3SiO2TDSδ2H (‰)δ18O (‰)Water TypeRecharge Elevation (m)CBE (%)
A11360328.173.66943.3210.182.721053.170.61867.9517.09 2437.02−104−13.5Cl·HCO3Na685.45 −2.41
A21652348.135.3612235.950.8714441.86873.223.68 3164−104.26 −13.81Cl·HCO3Na690.71 −1.24
A3114524.48.173.9310245.142.13861.31.39134217.19 2613−104.06 −13.63Cl·HCO3Na686.67 −1.35
A41428347.834.12867.14.921.28742.31.39108318.62 2206−101.81 −13.46Cl·HCO3Na641.21 −0.70
A5146335.68.054.4611273.080.62899.81.4150720.84 2841−102.14 −13.29Cl·HCO3Na647.88 −0.77
A6145032.77.663.9610464.811.7885.81.4137317.95 2673−101.97 −13.26Cl·HCO3Na644.44 −1.63
A71800258.154.44136223.996.0121010277.611.97 3671−104.10 −14.56ClNa687.47 −2.17
A81501-6.713.47904.19.142.0911201.5650.415.38 2401−104.25 −13.61Cl·HCO3Na690.51 −2.69
A962920.18.192.64857.33.561.66745.81.39101913.18 2163−87.47−12.14 Cl·HCO3Na351.52 −0.11
B11850478.136.6711507.640.811343.680925.9216.82 3458.14−104−13.7HCO3·ClNa685.45 −2.32
B2200253.58.04 4.047394.892.37268.172.51291.4224.90 1892.95−100−13.4HCO3·ClNa685.45 4.40
B32000537.45 4.877846.011.82406.0401421.720.00 5956.21−100−13.4HCO3·ClNa604.65 −0.12
B42000517.90 5.98792.255.011.22392.9601446.120.00 5956.21−99−13.2HCO3·ClNa604.65 0.25
B52000528.00 5.24804.756.011.22401.6801415.5920.00 5035.29−99−13.2HCO3·ClNa584.44 1.43
B62000528.154.877846.011.82406.0401421.720.00 5035.29−104−13.7HCO3·ClNa584.44 −0.12
B72000527.70 4.46788.54.011.22397.3201443.0519.00 5035.29−99−13.2HCO3·ClNa685.45 −0.22
B8300040.58.20 3.27044.052.47461.179.71036.1224.00 1872−100−13.3HCO3·ClNa584.44 1.26
B9197240.57.833.33675.172.111.06494.210946.8218.61 2185−102−13.8HCO3·ClNa604.65 0.01
B101802418.24 3.17453.910.6269.901452.223.18 1835.14−100−13.3HCO3·ClNa645.05 0.55
B112000468.24 3.3575814.03032410.81337.3724.97 2568.59−100−13.5HCO3·ClNa604.65 1.77
B122718508.02 47604.011.22394.064.761355.5527.36 1884−101−13.4HCO3·ClNa604.65 −0.55
B13205053.48.00 27201.993.62350.572.381244.8120.00 1767−101−13.6HCO3·ClNa624.85 1.48
B142000548.36 3.1757.52.930.6275.0801394.1223.99 2018.53−100−13.3HCO3Na+624.85 2.26
B152006568.32 5.87735.864.010.12453.7612.97994.6329.23 2240--HCO3·ClNa604.65 2.69
C11900597.90 15.25206315.032.432388.6571502.3729.58 6100.26--Cl·HCO3Na-−0.97
C21900508.1910.491973.6814.571.032174.4616.821560.7727.36 5485.5−104−12.3Cl·HCO3Na685.45−0.17
C3190062.58.01 14.28194511.533.652149.817.51196.9724.46 5789.19--Cl·HCO3Na-2.16
C42298477.91 14.5186026.414.162607.325.3818.4827.41 5400--ClNa-−2.63
C52300497.46 24336058.8212.315481.619.7469.8625.20 9413--ClNa-−3.72
C62302538.1919.95257025.052.433774.223.5749.0432.20 7267.77−101−12.7ClNa624.85−2.26
C72300587.84 26.7246039.122.373619.44.5762.6530.79 6990.02−100−12.6ClNa604.65−2.34
C82001596.7121.053692.558.1210.335190.321.5531.7629.18 9330.9−103−12.6ClNa665.25 2.98
C92300587.86 17.95243734.073.653416.9612766.7429.89 6768.99−100−12.4ClNa604.65 −0.56
C102305587.74 13.35239028.063.653348.6487.57.9330.11 6669.91−101−12.7ClNa624.85 4.79
C112505557.91 14.5186026.414.162607.325.3818.4827.41 8271.12--ClNa-−2.63
D1100-7.191.7337.8534.310.673.858.4323834.03 255−81−10.7HCO3Na·Ca220.81 1.28
D2100-7.341.3831.3327.619.81.755.74207.530.02 216−90−11.7HCO3Na·Ca402.63 0.34
D3100-7.431.5334.6229.3810.15.2510.39213.631.50 250.1−90−11.8HCO3Na·Ca402.63 −0.14
D4100-7.281.6341.9229.699.552.455.723832.83 247.4−81−10.6HCO3Na·Ca220.81 0.67
D5105-7.111.6435.163411.134.98.3323832.28 250.7−81−10.8HCO3Na·Ca220.81 −0.18
D6115-7.321.3936.0339.5712.172.455.28267.932.55 266−83−10.9HCO3Na·Ca261.21 0.26
D7150-7.350.6120.2312.663.932.16.31104.326.71 128.4−94−12.5HCO3Na·Ca483.43 −1.19
D8120-7.330.468.5319.526.921.45.91109.822.51 123.2−95−12.6HCO3Mg·Ca503.64 −0.70
D9180-7.260.682911.033.395.62.57116.524.94 141.5−95−12.7HCO3Na·Ca503.64 −0.21
D10120-7.350.9718.4313.594.411.752.75103.721.38 121.4−94−12.5HCO3Na·Ca483.43 1.81
D11100-7.681.6435.9346.4814.372.110.35292.925.64 285.6−82−10.6HCO3Na·Ca241.01 0.48
D12140-7.751.7639.831.6110.272.18.21244.732.21 250.6−82−10.9HCO3Na·Ca241.01 −0.35
D13--7.071.7410.5921.715.697.849.4197.639.34 118.5--HCO3Mg·Ca-1.16
Note: - means not analyzed.
Table 2. Geothermometry equations (in °C) for the cation and silica geothermometers used in this paper. C: concentration (mg/L); T1–T3 are the geothermometers estimated with dissolved SiO2.
GeothermometerEmpirical Formula
Quartz (conduction cooling) [19]T1 = [1309/(5.19 − lg (SiO2)) − 273
Quartz (maximum steam loss) [19]T2 = [1522/(5.75 − lg SiO2)] − 273
Chalcedony [19] T3 = [1032/(4.69 − lg SiO2)] − 273
Na-K-Ca [21]TNa-K-Ca = 1647/{lg (CNa/CK) + β[lg (CCa1/2/CNa) + 2.06] + 2.47} − 273
Na-K [20]TNa-K = 1217/[(lg (CNa/CK) + 1.483) − 273
K-Mg [22]TK-Mg = 4410/[14 − (lg (CK2/CMg)) − 273
Table 3. Results of geothermal water carbon isotope testing in the area.
Sample No.14C (PMC, %)Dated Age (Year)13C (PDB, ‰)
A80.543,800−7.20
A30.6242,022−6.60
A5<0.44>44,800−9.60
A9<0.44>44,800−5.70
A40.7640,339−10.30
A7<0.44>44,800−2.70
A2<0.44>44,800−10.90
A6<0.44>44,800−7.90
Table 4. Calculated geothermal reservoir t temperatures of the geothermal fields in the study area (T in °C).
Sample No.T MeasuredT3T1TNa-K-CaTNa-KTK-MgDifference (%)
(T1 – Tm)/Tm × 100%
A25338.10 69.91 141.22 43.67 81.60 31.9
A35025.58 57.85 129.26 38.99 63.76 15.7
A652.327.20 59.42 131.79 38.51 66.47 13.6
A858.8721.46 53.86 107.08 38.99 61.21 −8.5
B28438.10 69.91 127.23 51.79 63.18 −16.8
B66527.20 59.42 130.17 56.68 70.44 −8.6
B76812.57 45.19 138.21 53.08 73.07 −33.5
B128231.37 63.44 93.14 43.97 -−22.6
C166.838.65 70.44 170.40 63.57 95.30 5.4
C359.328.58 60.75 175.19 63.30 88.24 2.4
C48437.24 69.09 147.72 65.74 86.96 −17.7
C68244.11 75.65 170.47 65.57 102.63 −7.7
C78431.37 63.44 169.42 79.87 111.27 −24.5
C88538.64 70.43 151.28 53.38 84.87 −17.1
C97846.93 78.34 154.06 63.43 94.22 0.4
C108147.44 78.82 145.89 52.61 86.52 −2.7
C118944.11 75.65 147.72 65.74 86.96 −15.0
Publisher’s Note: MDPI stays neutral with regard to jurisdictional claims in published maps and institutional affiliations.