Article

Long-Term Changes in Relationship between Water Level and Precipitation in Lake Yamanaka

1
Executive Office, The University of Tokyo Forests, Graduate School of Agricultural and Life Sciences, The University of Tokyo, Bunkyo-ku, Tokyo 113-8657, Japan
2
Fuji Iyashinomori Woodland Study Center, The University of Tokyo Forests, Graduate School of Agricultural and Life Sciences, The University of Tokyo, Yamanakako, Yamanashi 401-0501, Japan
*
Author to whom correspondence should be addressed.
Water 2022, 14(14), 2232; https://doi.org/10.3390/w14142232
Submission received: 6 December 2021 / Revised: 30 June 2022 / Accepted: 13 July 2022 / Published: 15 July 2022

Abstract

:
Lake water levels fluctuate due to both natural and anthropogenic influences. Climate change can alter precipitation, driving fluctuations in lake water levels. Extreme fluctuations can cause flooding, water shortages, and changes in lake water quality and ecosystems, as well as affecting fisheries and tourism. Despite the need to predict future water-level rises, especially in the context of climate change, long-term hydrological studies are scarce. Here, we analyzed 93 years of data from 1928 to 2020 to identify changes in the relationship between water level and precipitation in Lake Yamanaka, Japan. We found that the six-day maximum rise in water level for the same six-day maximum precipitation was significantly greater in the later period than in the earlier period; the difference increased with increasing precipitation. Particularly large increases in precipitation were sometimes caused by a single event or by multiple events occurring in succession.

1. Introduction

Fluctuations in the water levels of lakes can be driven by both natural and anthropogenic influences. For example, climate change can drive changes in precipitation levels, which may cause lake water levels to fluctuate. Issues such as flooding, water shortages, and changes in lake water quality can arise as a result of extreme lake water level fluctuations, with potential effects on ecosystems, fisheries, and tourism [1]. Therefore, it is important to predict future changes in lake water levels, for which the effects of climate change and anthropogenic impacts need to be assessed separately. To this end, it is beneficial to examine past fluctuations in lake water levels over a long period; identifying their causes may provide useful information for the future prediction of lake level fluctuations [2].
The Fuji Five Lakes are a group of five small lakes in Yamanashi prefecture on the north side of Mount Fuji in Japan. From east to west, they are Lake Yamanaka, Lake Kawaguchi, Lake Sai, Lake Shoji, and Lake Motosu. In years and months with heavy precipitation, the water levels rise in the Fuji Five Lakes, and lakeside areas have suffered severe inundation damage under these conditions [3]. On the other hand, surface water flowing from the Fuji Five Lakes has long been used for agriculture, daily life, and hydropower generation, as has groundwater in lakeside areas. Thus, drops in the lake level have been a serious problem for water users because they lead directly to water shortages [4,5].
A number of hydrological studies have been conducted on the Fuji Five Lakes, focusing on lake water level, water balance, and groundwater flow [3,6,7,8,9,10,11,12,13,14,15,16]. Yamamoto and Uchiyama [3] examined the relationship between lake water level and precipitation using 100 years of lake water-level data (1911–2017) at Lake Kawaguchi. They identified three major increases in lake water levels since 1930, all of which corresponded to rainfall events (in which monthly precipitation generally exceeded 750 mm). Few of these studies have focused on Lake Yamanaka, although the area of the lake is the largest among the Fuji Five Lakes. In addition, Yamamoto and Uchiyama [3] only used monthly precipitation and water-level data; they did not analyze sub-monthly variations in precipitation.
In addition to lake water-level observation data, long-term precipitation data are essential when studying long-term fluctuations in lake water levels (e.g., over 100 years) because precipitation is the most important factor affecting lake water-level fluctuations. However, compared to Lake Kawaguchi, where precipitation observations have been recorded by the Yamanashi Prefecture and the Japan Meteorological Agency (JMA) since 1933, long-term precipitation observation data at Lake Yamanaka have not been systematically organized. Recently, Kuraji et al. [17] systematically organized long-term precipitation data at the Fuji Iyashinomori Woodland Study Center (FIWSC; 35°24′27.4″ N 138°51′51.6″ E) of the University of Tokyo, which is located in the vicinity of Lake Yamanaka. These data make it possible to study the relationship between long-term precipitation trends and lake water-level fluctuations in Lake Yamanaka.
Therefore, in this study, we focused on the relationship between increases in water levels in Lake Yamanaka and heavy rainfall events. We collected data on water levels over a long period (93 years) to analyze long-term fluctuations in relation to precipitation, with the aim of characterizing long-term fluctuations in lake water levels in Lake Yamanaka.

2. Materials and Methods

2.1. Study Site

Lake Yamanaka, one of the Fuji Five Lakes, is located in Yamanakako Village, Minamitsuru-gun, Yamanashi Prefecture, Japan (Figure 1). It is a natural lake with an area of 6.6 km2, an elevation of 981 m, a circumference of 14 km, a maximum depth of 13.3 m, and an average depth of 9.4 m. The land cover of the Yamanaka Lake catchment area has changed drastically over the past 100 years. Before humans settled in the area, the catchment area had been a cool-temperate upper broadleaf forest. The land was unsuitable for cultivation due to a combination of adverse conditions, including a cold climate above 1000 m elevation and a nutrient-poor soil accumulated from volcanic debris and lava from Mt. Fuji. In order to harvest grasses for use as a natural fertilizer for cultivation, vast forests have been converted to grasslands. In addition, extensive pastures were created to raise horses for the logistics industry. Around 1900, grasslands occupied the largest area of land in the Yamanakako Village area (Figure 2). Later, when fossil fuels and chemical fertilizers became widespread, and the main industry of the area shifted from logistics to tourism, these grasslands became inaccessible and were abandoned and gradually transitioned to forests. Furthermore, since 1960, coniferous trees, mainly larch, have been planted for timber production; half of the forests are coniferous planted forests, and the other half are broadleaf natural forests (Figure 2).

2.2. Materials

Precipitation affects the water levels of Lake Yamanaka only when it falls within the lake’s catchment area (including surface water and groundwater). The lake’s surface water catchment area includes the northern foot of Mt. Fuji. Various estimates of the size of the catchment areas have been proposed in previous studies (e.g., 66.07 km2 by Kambara [6] and 64.87 km2 by Tsutsumi [9]). It is difficult to identify the recharge area of groundwater flowing into Lake Yamanaka based purely on the region’s surface topography. Here, the water budget of Lake Yamanaka was not the main subject of our analysis, so it was not necessary for the precipitation data corresponding to increases in water level to be in the form of basin-averaged precipitation. Instead, we considered it sufficient to use precipitation data recorded at representative points. Therefore, we used daily precipitation data from the FIWSC, prepared by Kuraji et al. [17], for a period of 86 years from 1927 to 2013 (data were missing for 8–31 December 1940; 1–31 January, 1 March–31 May and 1–31 July 1943; and 1 January 1944–1 March 1952).
Daily FIWSC precipitation data were not available for 2014–2020. Therefore, we estimated daily precipitation data for this period using precipitation observations recorded at the Yamanaka site (observation point: Fujiyoshida Fire Station East Sub-branch) of the Automated Meteorological Data Acquisition System (AMeDAS) of the Japan Meteorological Agency (JMA). We accessed the JMA website on 11 September 2021, and downloaded hourly precipitation data. We compiled daily precipitation data from 25 March 2008, when the observation unit of AMeDAS Yamanaka changed from 1 mm to 0.5 mm, to 31 December 2013, at 09:00 local time (on the daily boundary). We determined the relationship between the daily precipitation data and the FIWSC daily precipitation data of Kuraji et al. [17] as follows:
Rf = 1.1588 × Ra (R² = 0.9742, n = 276)
where Rf is the FIWSC daily precipitation (mm) and Ra is the AMeDAS Yamanaka daily precipitation (mm).
We applied Equation (1) to the daily precipitation data from the AMeDAS mountains from 1 January 2014, to 31 March 2021, to estimate the daily precipitation of the FIWSC. Data were absent for the periods of 14–15 February, 15 April, 23 May, and 16 September 2014; 23 February, 25 March, and 9, 12 and 18 May 2015; and 11, 13–14 and 31 March, 12 May and 6 September 2016. However, when examining the water-level data for these dates, we found no significant precipitation-driven water-level rises.
We used documents #1–#6 as data for the Yamanaka Lake water level and outflow. Document #1 [20] comprises daily lake water-level and outflow recordings (observation time unknown) from 1927 to 1962, as described in “Water utilization survey at the northern foot of Mt. Fuji and its data analysis (Appendix): Table of water level, outflow, and rainfall of the five lakes of Fuji”. The reference point is listed as having an altitude of 978.49 m. Document #2 [21] comprises daily lake water-level and outflow recordings (observation time unknown) from 1959 to 1968, as listed in “Fuji Five Lakes: Water Level, Outflow, Rainfall Observation Table”. The altitude reference point was listed to be 878.485 m, but we assume that this was a misprint and that it should have read “978.485 m”. Comparing Documents #1 and #2 revealed that the overlapping data for 1959–1962 were consistent.
Document #3 [22,23,24,25,26] contains records of the lake water level for the years 1955–1958 and 1963–1968, as described in the “Yamanashi Prefecture Management Water Level Rainfall Observation Annual Report”. The observation times in this document were recorded once per morning in June 1955–1956 and 1963–1964, and twice per morning and evening in July–December 1956 and 1965–1968. The altitude of the reference point was listed as 878.485 m, but as in Document #2, we assume this was a misprint and should have read 978.485 m. Comparing the lake levels in Document #1 and #2 with those in Document #3 revealed that for the years 1955–1958 and 1963–1964, adding 3.00 and 0.10 m, respectively, to the latter gave the same results as those in Document #1. In the 1965–1966 period, the data were not exactly the same, but there was no significant difference in the fluctuation patterns, so we used the values from the morning observations in Document #3.
Document #4 [27] contains lake water-level recordings from April 1981 to June 1996, as described in the “Water Level Monthly Report” of the Yamanashi Prefecture River Division. These observations were recorded twice daily at 06:00 and 18:00 from April 1981 to March 1982 and once daily at 10:00 after April 1982. These measurements were not taken in May or June 1996 because of the lake’s low water level. In this study, therefore, we adopted the value of the morning observations during the period of twice-daily observations.
Document #5 [28] contains lake water levels from 16 April 1998 to 31 December 2020, as published by Yamanashi Prefecture on its website. These recordings were taken daily, with the reference point being 978.485 m. Data were missing from 2 to 17 December 2009; 30 March and 5 December 2010; 25 January and 12–24 March 2011; 7 September 2012; 7 February and 6 October 2013; 8–14 January 2015; from 5 April to 10 May 2020; and on 23 August 2020.
Document #6 [29] contains daily lake water levels and outflow from 1 January 1972 to 31 December 2020, observed by the Yamanashi Branch Office, Tokyo Electric Power Company (TEPCO), and disclosed by Yamanashi Prefecture. Data were missing from 1 January 2011 to 31 March 2013; 18 (outflow only) and 21–24 December 2014; 18–19 and 22–26 January (outflow only), 14 (outflow only) and 15–16 March, and 8–9 September 2015.

2.3. Methods

We compared long-term variations in the relationship between the amount of precipitation in the FIWSC dataset and increases in the water level of Lake Yamanaka during periods of heavy rainfall. To this end, we divided the analysis period into two: the first period, 1927–1968, and the second period, 1972–2020.

2.3.1. Long-Term Changes in Relationship between Precipitation and Water-Level Rise

We defined a flood event as an event in which the rise in water level stopped within seven days of the day it began and in which the difference in water levels between these days was 0.2 m or greater. We limited our analysis to floods in which the rise in water level stopped after seven days. This was because, in floods where the water-level rise exceeded this period, several precipitation events could be responsible, rendering it impossible to identify one event. Our analysis of this type of long-term rise in water level is presented in Section 2.3.2.
Among the identified flood events, we selected those that exceeded 200 mm of precipitation over six days. To determine this period, we examined the correlation between precipitation and the difference in water level for n days from the day when the water level stopped rising to the day n days before, for all of the rising water events. The correlation coefficient for n = 6 was the largest (R2 = 0.751), so we used a six-day period. We set the threshold value for the six-day precipitation at 200 mm because the number of events would decrease for values larger than 200 mm, while the influence of the base water level (prior to the increase in question) could not be ignored for values smaller than 200 mm.
We defined the maximum difference between the highest and lowest water levels for any six-day period during which the six-day precipitation exceeded 200 mm as the maximum six-day increase in water level. Furthermore, we defined the amount of precipitation during these six days for which the maximum six-day increase was obtained as the maximum six-day precipitation.
Analysis of covariance (ANCOVA) was used as a statistical method for comparison between the first and second periods. The comparison of time periods was made by removing the effect of the difference in six-day maximum precipitation, which is a covariate between the first and second periods.

2.3.2. Examination of Particularly Large Water Rises

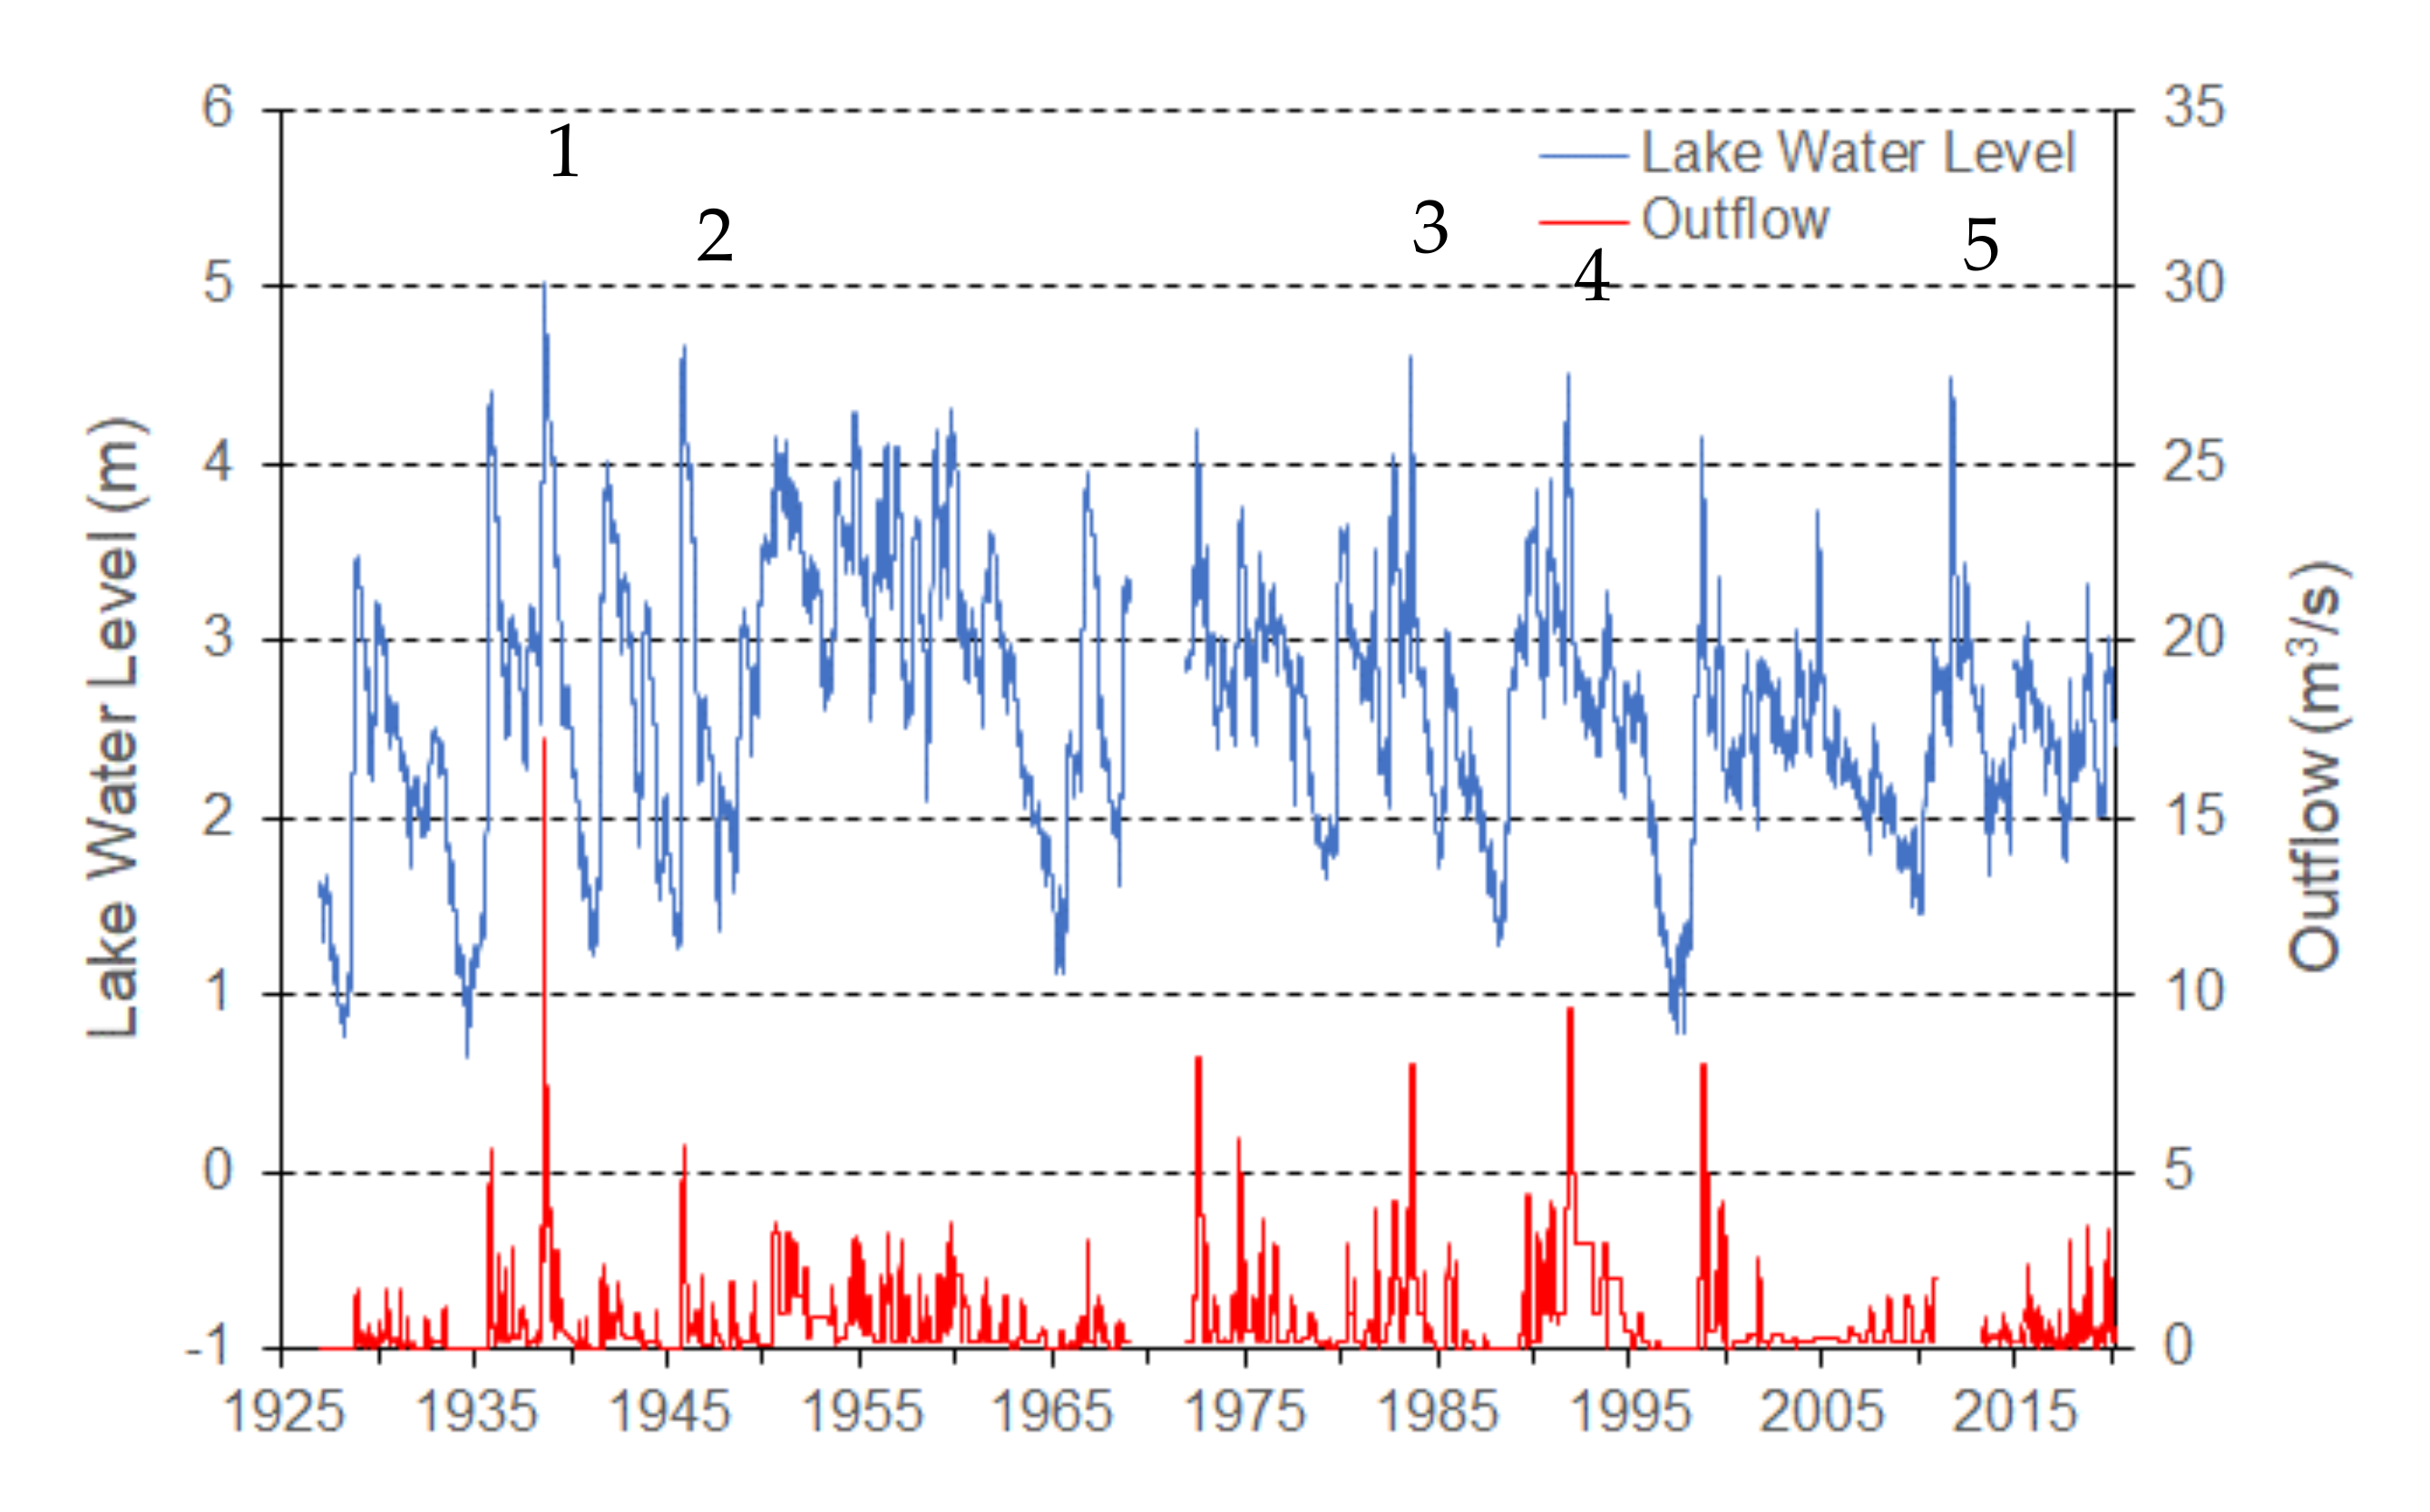
The highest water level to occur in Lake Yamanaka in recent years was 4.48 m, which occurred on 22 September 2011. In the period for which data on daily precipitation and lake level are available, we found that this level was twice exceeded: on 6 September 1938 (maximum level = 5.02 m) and on 13 October 1991 (maximum level = 4.56 m). In addition, the years 1935, 1938 (see above), and 1983, which were listed as the three years having floods over the past 100 years in a previous study into Lake Kawaguchi [3], were also recorded to have had floods at Lake Yamanaka (the highest water levels were 4.40 m on 27 October 1935, and 4.34 m on 19 August 1983). These five occurrences of high-water levels coincided with the top five highest water-level increases observed in the period covered by this study. Therefore, we conducted a comparative analysis of these five water-level increases.
Unlike the events defined in Section 2.3.1, these substantial, relatively long-lasting increases in water level are likely to have been caused not only by precipitation during the preceding six days but also by precipitation over a longer period. Thus, we examined the correlation coefficients between the accumulated precipitation from the day before the occurrence of the highest water level to the day n days before, for the years 1935, 1938, 1983, 1991, and 2011; the maximum correlation coefficient (R2 = 0.983) was obtained when n = 71. Thus, we used a period of 71 days when describing the progress of precipitation and water levels for these events.

3. Results

3.1. Lake Water Level and Outflow Data Overview

Figure 3 shows all lake water level and outflow data over the 93 years used in this study. The maximum water level was 0.64 m on 28–29 August 1934 and 5.02 m on 6 September 1938, with a range of 4.38 m. No trend or periodicity was observed throughout the 93 years. The runoff is used for irrigation and power generation, and there are seasonal fluctuations in the amount of water used for irrigation. The TEPCO has held the water rights for power generation from 23 March 1925 to the present and can withdraw water for power generation when the lake level is between 2.12 m and 4.24 m (3.33 m from July to September) [30]. When the lake level becomes high, the river administrator, Yamanashi Prefecture, releases water for flood-control purposes.

3.2. Long-Term Changes in the Relationship between Precipitation and Water-Level Rise

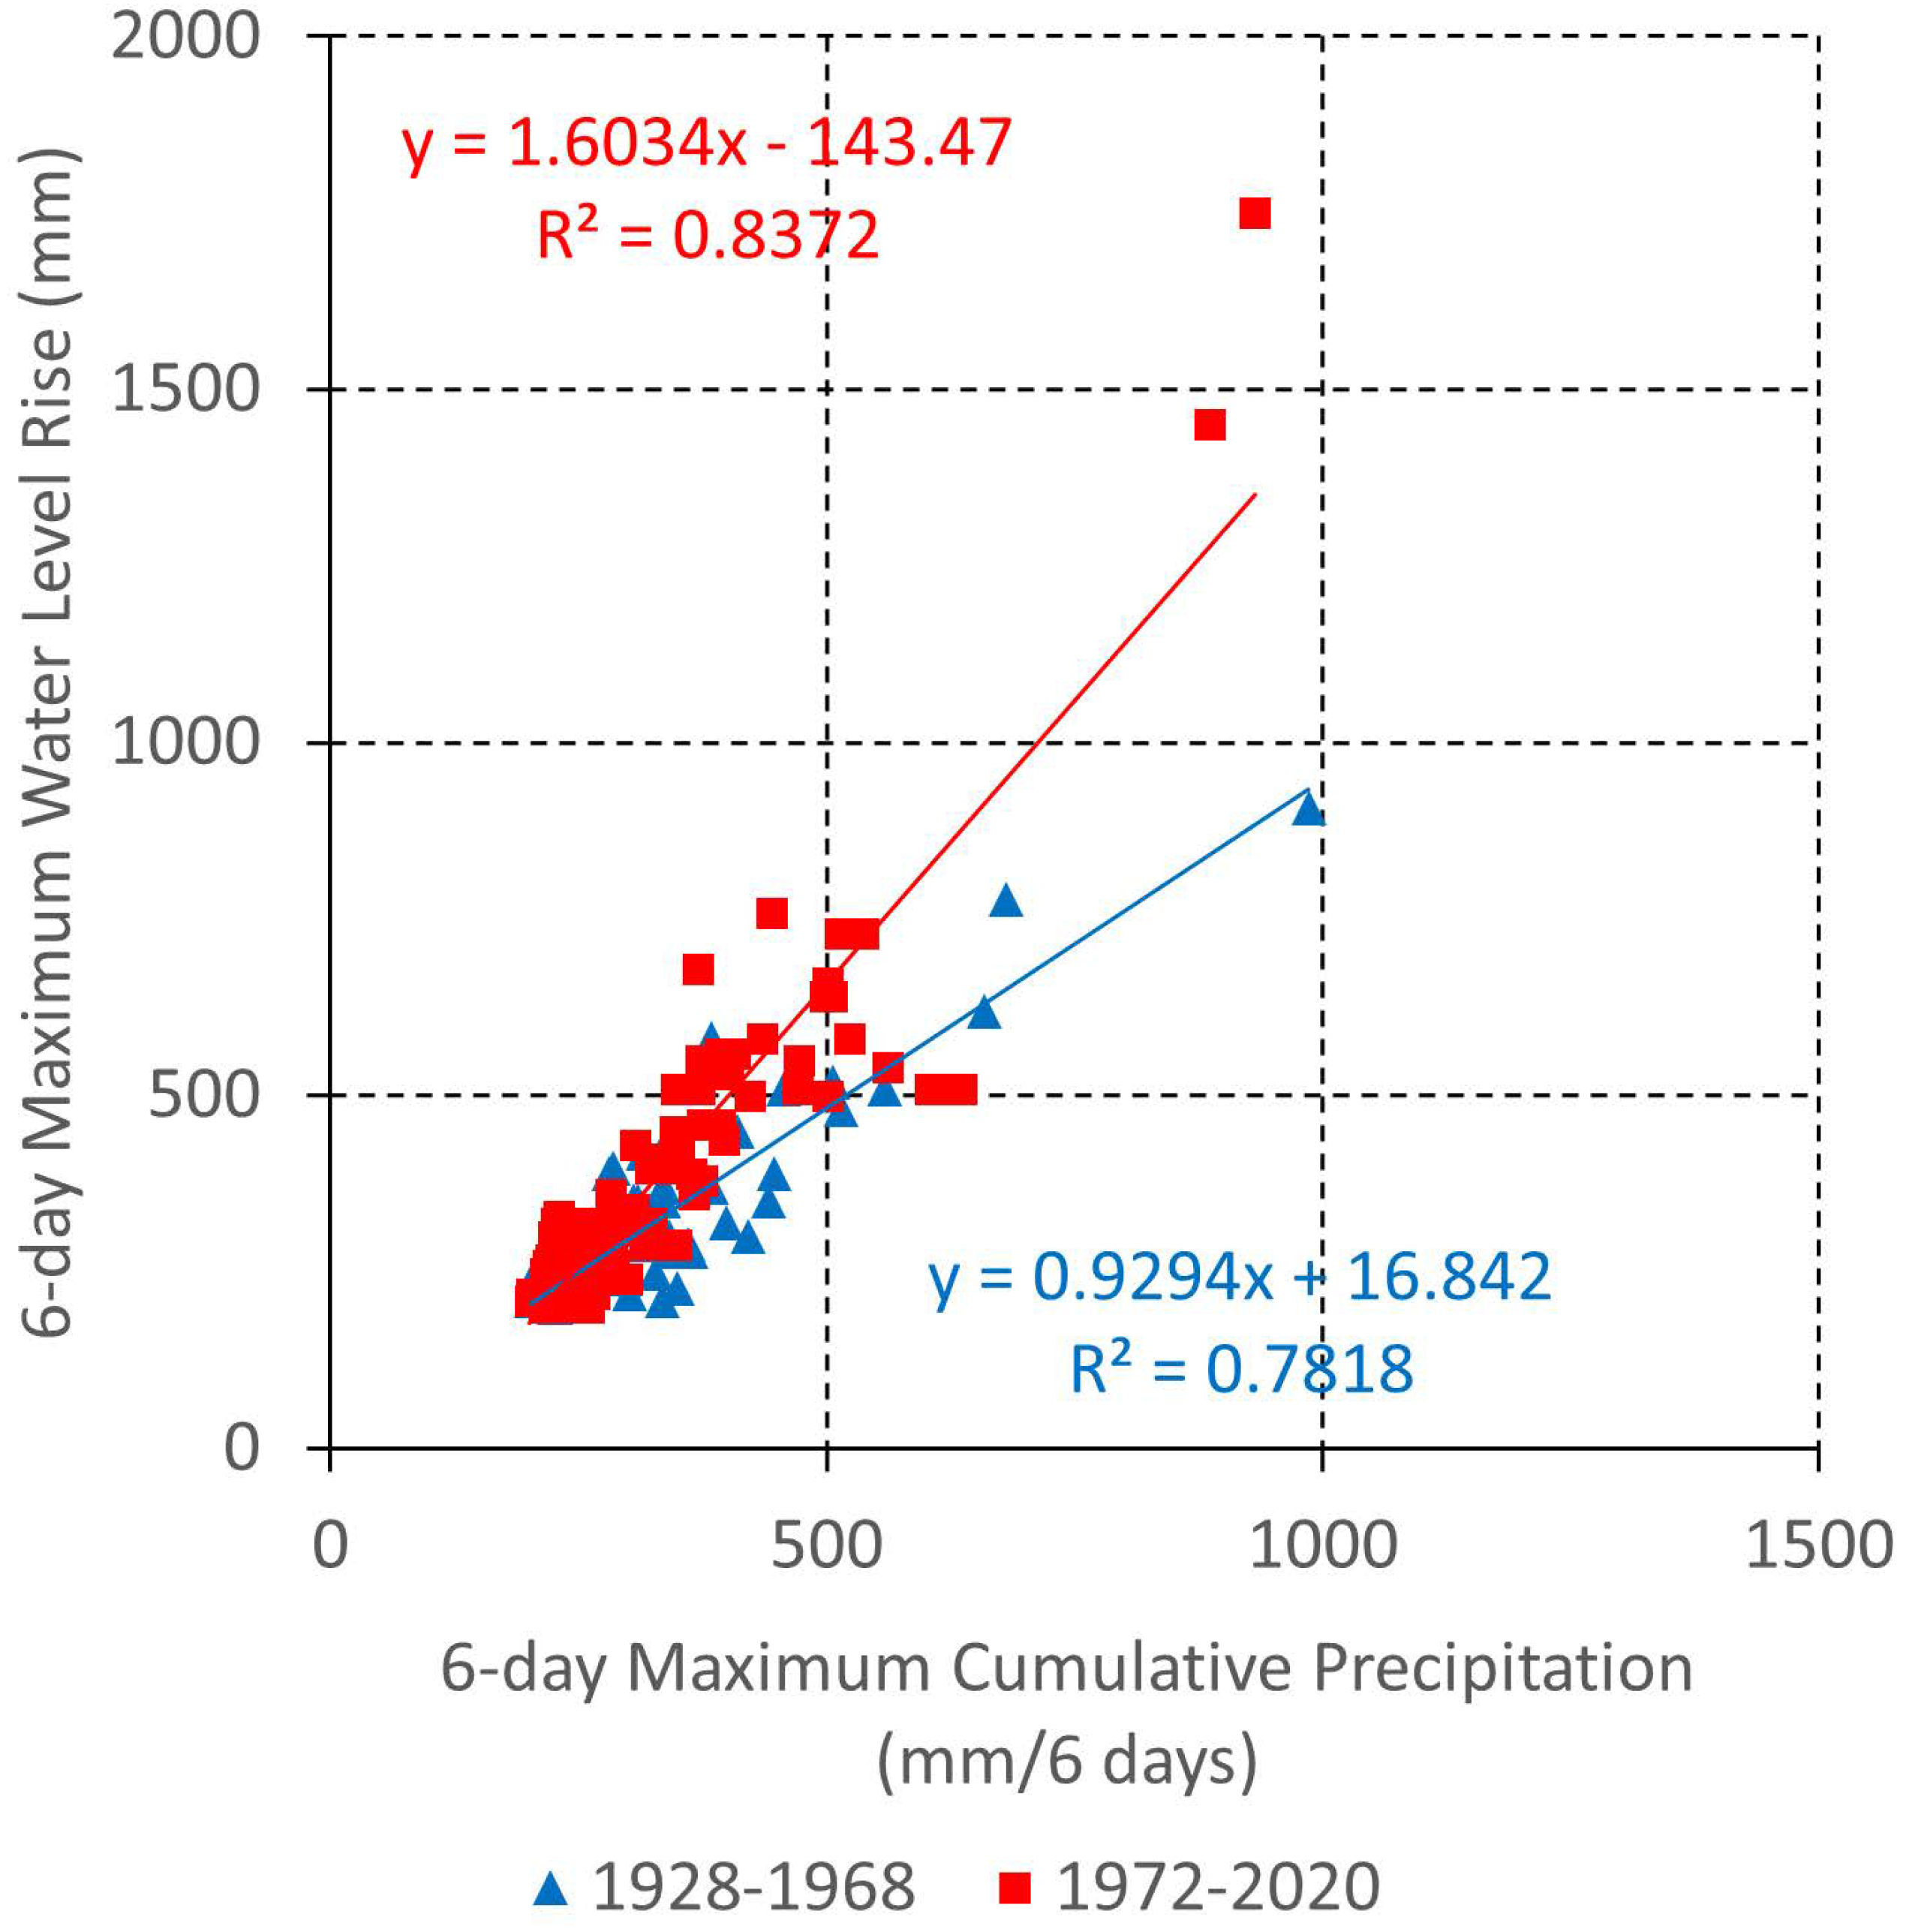
Figure 4 shows the relationship between the maximum six-day precipitation and the maximum six-day increase in water level. Although this relationship was linear in both the first and second halves of the study, a significant difference was observed between the first and second periods (ANCOVA, p < 0.0001). When the precipitation was generally 250 mm or more, the maximum six-day increase in water level for the same maximum six-day precipitation was significantly larger in the second period than in the first; moreover, this difference increased with increasing precipitation. When the maximum six-day precipitation values were 200, 400, and 600 mm, the maximum six-day increments predicted by the regression line were 0.20, 0.39, and 0.57 m, respectively, in the first period, and 0.18, 0.50, and 0.82 m in the second period, respectively.

3.3. Examination of Particularly Large Water-Level Increases

Figure 5 and Figure 6 show the time series of variations in water levels, starting from 71 days before the highest water-level occurrences in 1935, 1938, 1983, 1991, and 2011.

3.3.1. Event of 27 October 1935 (Highest Water Level = 4.40 m)

On 17 August, 72 days before the event, the water level was 1.99 m. On 23 August, the water level then dropped to 1.94 m. However, on 3 September, it rose to 2.56 m due to 625.5 mm of precipitation falling over 10 days from 24 August to 2 September (following the approach of a typhoon, as included in the analysis in Section 3.1). Precipitation during the 11 days from 3 to 13 September only amounted to 10.4 mm, but the water level rose to 2.62 m on 14 September. There was 907.5 mm of precipitation during the 12-day period from 14 to 25 September, which caused the water level to rise to 3.68 m on 26 September (included in the analysis in Section 3.1). The 14 days from 26 September to 9 October saw only 26.8 mm of precipitation, but the water level rose to 4.22 m on 9 October. There was 61.2 mm of precipitation during the two days from 10 to 11 October, which further increased the water level to 4.32 m. Only 13.5 mm of precipitation occurred during the 14 days from 12 to 25 October, with the water level dropping to 4.18 m on 25 October. The total precipitation during the 71-day period was 1729.5 mm.

3.3.2. 6 September 1938 (Highest Water Level = 5.02 m)

The water level was 2.57 m on 27 June, 72 days before this event. Then, 860.8 mm of precipitation fell from 27 June to 5 July, with the water level rising to 3.78 m on 6 July (included in the analysis in Section 3.1). In total, 193.8 mm of precipitation fell from 6 to 31 July, but the water level only rose to 3.96 m on 31 July. From 4 to 24 August, precipitation amounted to 227.9 mm, with the water level decreasing to 4.64 m on 25 August, but it then increased to 3.96 m on 31 July. The total precipitation over 71 days was 3053.4 mm.

3.3.3. Event of 19 August 1983 (Highest Water Level = 4.34 m)

The water level 72 days prior to this event, on 9 June, was 2.98 m. The water level then gradually decreased, reaching 2.59 m on 14 August. The total precipitation for 71 days was 1476.6 mm.

3.3.4. Event of 13 October 1991 (Highest Water Level = 4.56 m)

On 3 August, 72 days prior to this event, the highest water level was 2.84 m. The water level then dropped to 2.69 m on 19 August. On 20 August, 342.8 mm of daily precipitation fell due to the approach of Typhoon No. 12, with the water level rising to 3.37 m on 22 August (included in the analysis in Section 3.1). The water level dropped to 3.23 m on 30 August but then rose to 3.49 m on 31 August, following 211 mm of daily precipitation; this precipitation fell due to the approach of Typhoon No. 14 on 30 August (included in the analysis in Section 3.1). The water level then fluctuated slightly before rising to 4.27 m on 21 September (included in the analysis in Section 3.1). This increase occurred due to 664.9 mm of precipitation falling over 10 days from 12 to 21 September, associated with the approach of Typhoon No. 18. It then increased further to 4.46 m on 2 October (included in the analysis in Section 3.1) due to 267.2 mm of precipitation falling over six days from 26 September to 1 October. The total precipitation over 71 days was 2053.1 mm.

3.3.5. Event of 22 September 2011 (Highest Water Level = 4.48 m)

On 13 July, 72 days before this event, the water level was 2.52 m. Initially, the water level did not change significantly and reached 2.57 m on 31 August. However, it rose to 4.02 m on 5 September due to 885.6 mm of precipitation falling during the six-day period from 31 August to 5 September; this was caused by Typhoon No. 12 (included in the analysis in Section 3.1). The water level dropped to 3.75 m on 19 September, but the highest water level (4.48 m) was then recorded on 22 September, following 498.3 mm of precipitation falling during 19 and 20 September, caused by Typhoon No. 15 (included in the analysis in Section 3.1) The total precipitation over 71 days was 2001.4 mm.

4. Discussion

Figure 4 demonstrates that the relationship between the maximum six-day rainfall and the maximum six-day increase in water level was linear for both the first and second periods. This meant that it was possible to predict the maximum water level after the floods, based on the six-day rainfall data and the water level on the day of the flood. The following Equation could, therefore, be used to estimate the maximum water level after the flood, based on the rainfall data in the mountains recorded at AMeDAS (which are published in real-time) (also see Equation (1)), and the regression line shown in Figure 4):
ΔH = 1.6034 × Rf6 − 143.47 = 1.8580 × Ra6 − 143.47 (R² = 0.8372)
where ΔH is the estimated lake level rise (mm), Rf6 is the six-day precipitation at FIWSC (mm), and Ra6 is the six-day precipitation at AMeDAS Yamanaka (mm).
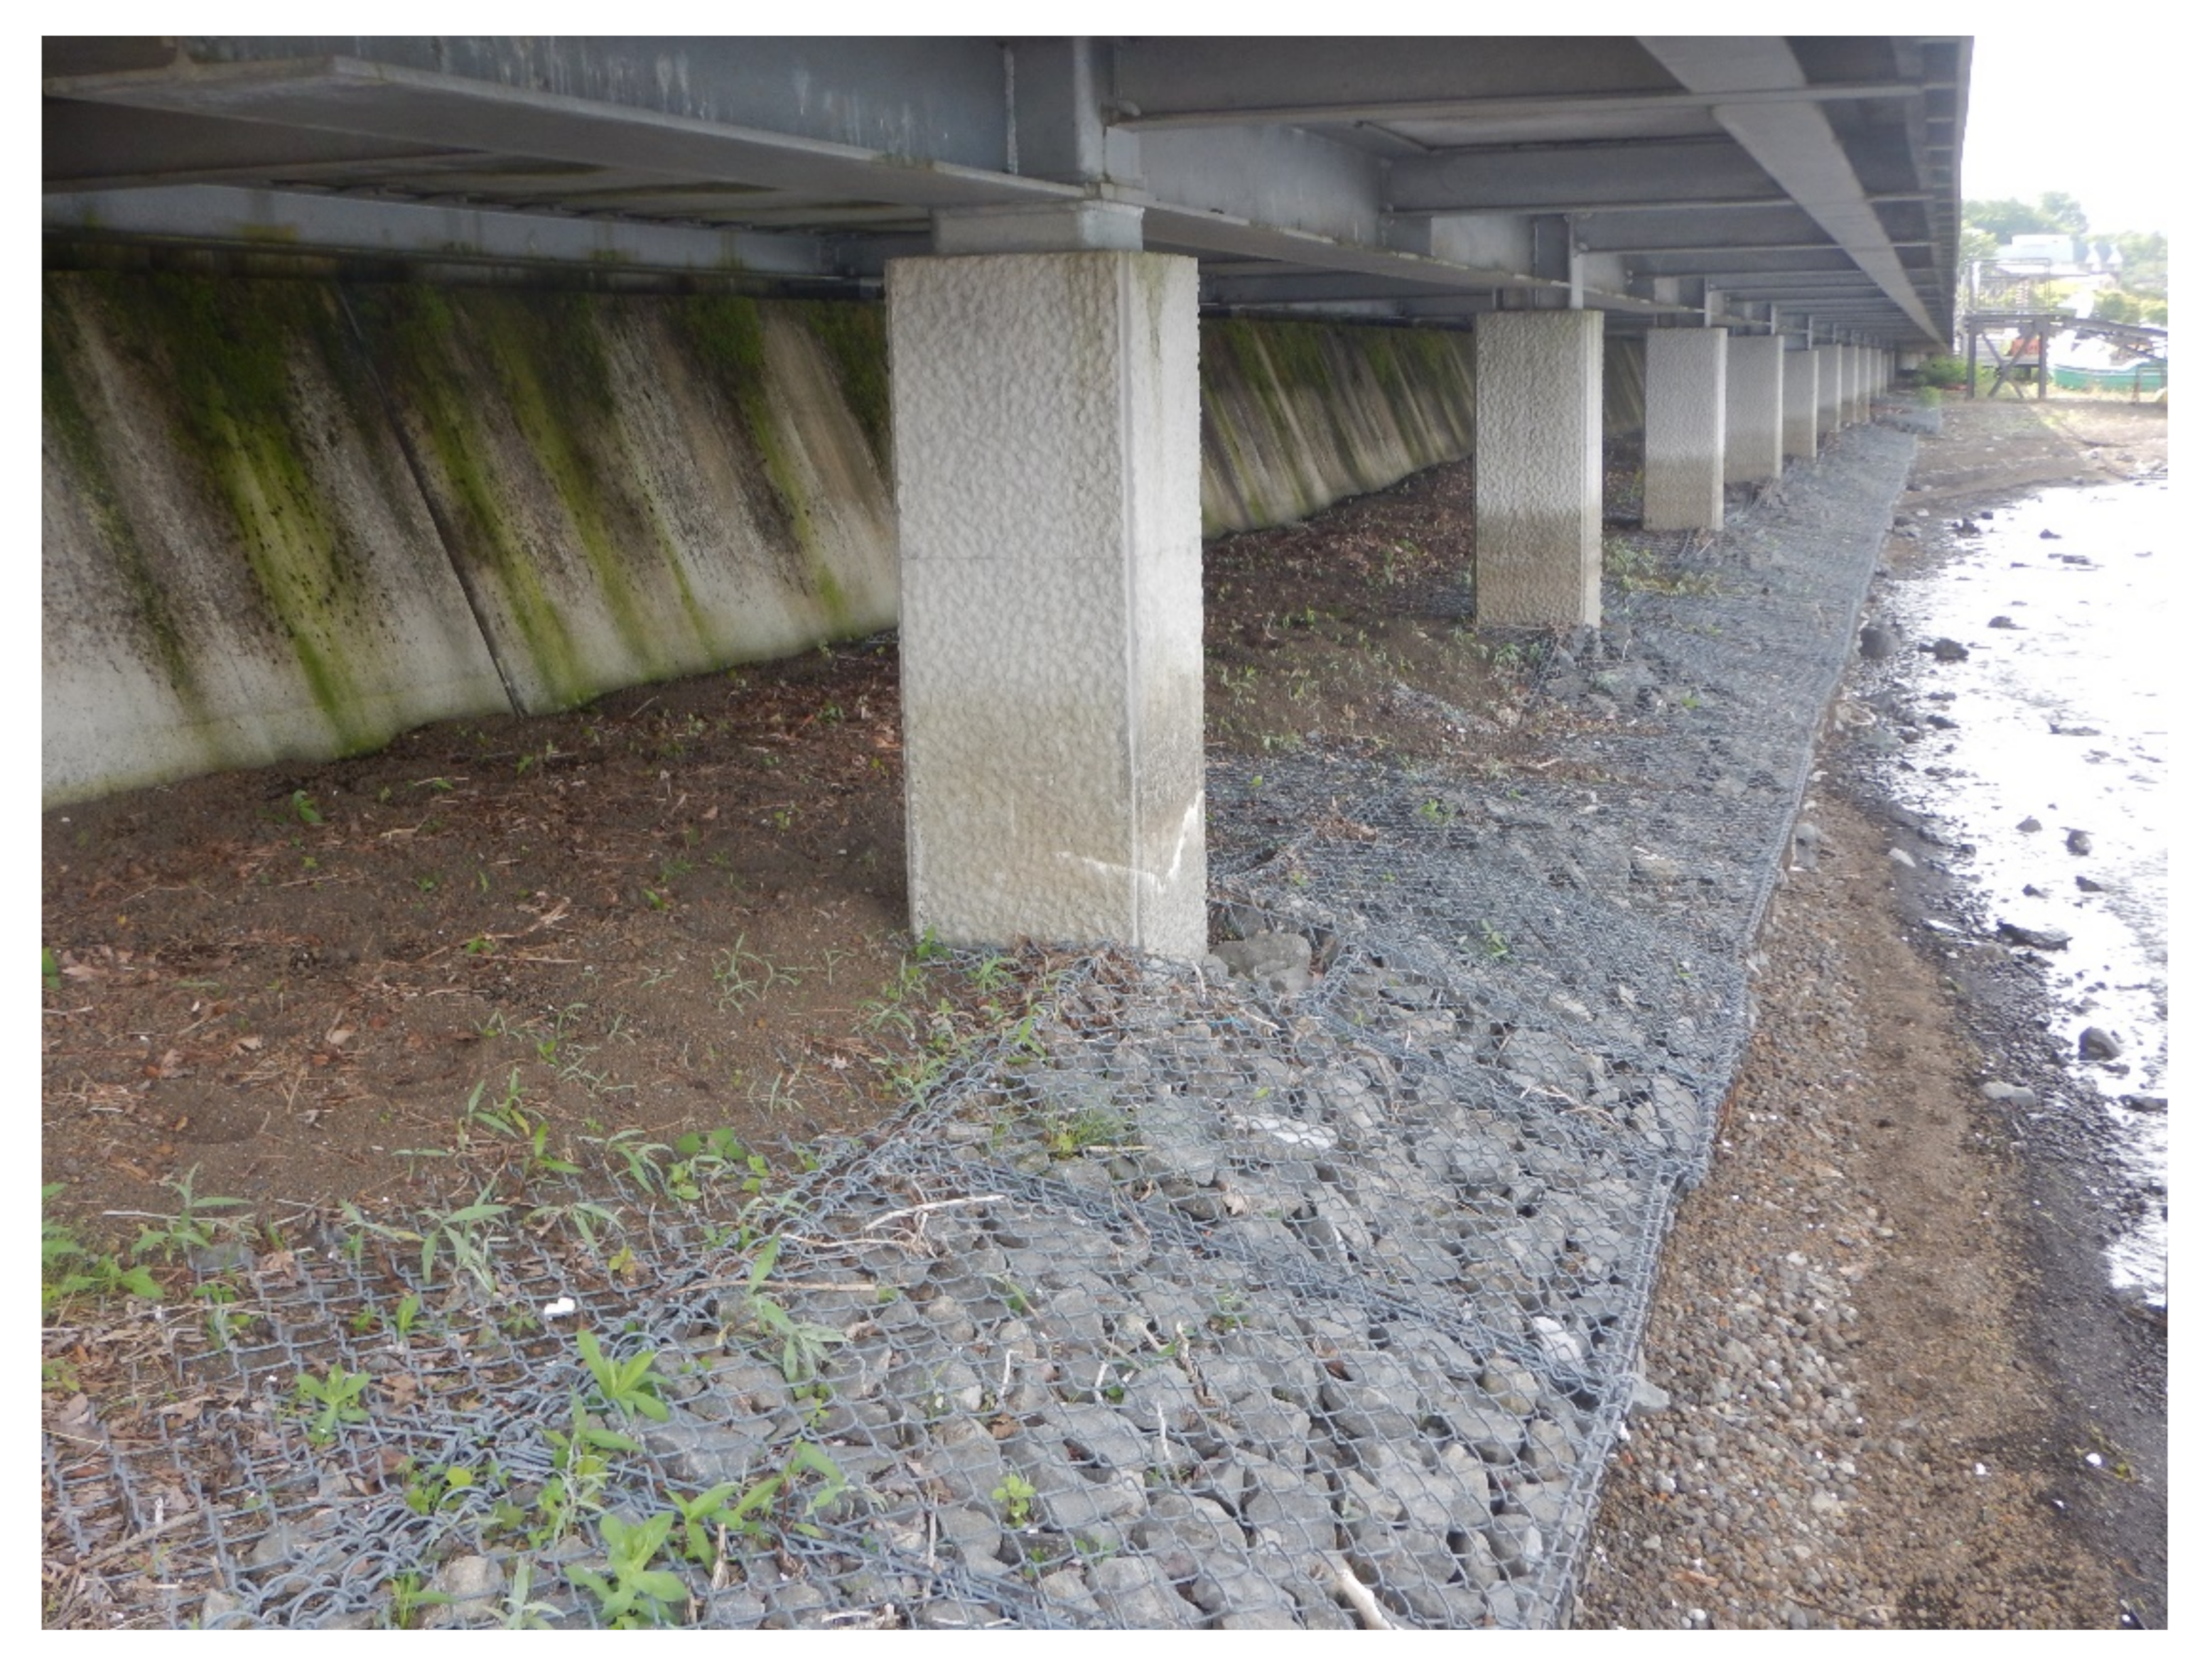
Figure 4 clearly shows that the six-day maximum rise in water volume for the same maximum six-day rainfall was significantly greater in the second period than in the first. There are two possible reasons for this: first, lakeside road construction and shoreline reclamation work progressed from the first to the second period. Okai et al. [31] reported that the lakeside road construction work was conducted from 1959 until 1962. Takahashi et al. [32] reported that the Yamanaka Village began reclaiming the lake’s shoreline and building parking lots in 1965 (Figure 7). At the same time, piers were built by private companies along the shore of the lake. The number of piers increased from 13 to 42 from 1962 to 1970. The reclamation projects likely changed the relationship between the water level and the water volume when the water level rose; the magnitude of the water-level rise may have been larger for the same increase in water volume during the second period. The second possibility is that river and erosion control efforts progressed in a channel where surface water only flowed during heavy rains, allowing surface water to enter the lake rapidly during heavy rainfall. In Yamanakako Village, Typhoon No. 9, which occurred in September 2010, caused sediment to flow out of the Yoshimasawa River, partially destroying some accommodation lodges and flooding a condominium and parking lot [33]. An erosion control weir was constructed as a disaster-related emergency erosion control project, disaster recovery projects were adopted for a village road downstream of the Yoshimasawa River, and other forms of construction were also carried out. These structures allowed precipitation to flow quickly into Lake Yamanaka, increasing the six-day maximum flood volume for the same amount of six-day maximum rainfall.
In contrast, the conversion of the former grassland watershed to forest (Figure 2) and the continued growth of trees in the lake’s watershed would have reduced the amount of rainfall contributing to lake level rise due to increased canopy interception. The increased water-holding capacity of the forest soils may also have enhanced the ability of the watershed’s soils to retain precipitation beyond six days. These “decreasing factors” may have lowered the maximum six-day increase for the same maximum six-day precipitation. However, our results suggest that these effects were overridden by the aforementioned “increasing factors”, which increased the six-day maximum water level rise for the same maximum six-day rainfall.
We focused on five events with extremely high water levels, of which two occurred in the first period and three in the second period. Of these, the rise that led to the water level of 4.34 m on 19 August 1983, was caused by only one precipitation event, while the other four were caused by multiple intermittent precipitation events. In some cases, particularly large increases in precipitation were caused by a single event that exceeded 200 mm of precipitation for six days. In other cases, high water levels were caused by multiple such events occurring in succession.
Figure 5 and Figure 6 show that the two flood events occurring in the first period featured large precipitation events (625.5 mm over 10 days and 860.8 mm over 9 days). Both were followed by a period of relatively light rainfall during which the water level continued to rise. In contrast, in two of the three floods in the second period (except for the 1983 flood mentioned above), a large amount of precipitation fell in the early stages, followed by a period of relatively little rainfall, during which the water level continued to decline. This difference may correspond to the fact that the maximum six-day increase for the corresponding maximum six-day rainfall was smaller in the earlier period than in the later period, as shown in Figure 4.
In two of the three later events (apart from the one in 1983), both a reduction in inflow and an increase in outflow may have contributed to the rapid decrease observed in the water level during the low rainfall period immediately after major precipitation events. As groundwater is the primary source of inflow to Lake Yamanaka during periods of low rainfall, this reduced inflow can be attributed to an increase in the allocation rate of precipitation to surface water, with an accompanying decrease in its corresponding allocation rate to groundwater. Alternatively, the observed trend could correspond to an increase in groundwater flow rate. Assuming that there was no long-term change in the characteristics of groundwater discharge from Lake Yamanaka toward Oshino [16], the observed increase in discharge could have arisen from one or both of two possible causes: an increase in flood flow from the Katsura River (which is the only outlet river) and an increase in anthropogenic discharge, i.e., an increase in water withdrawal by water users, such as power generation and agricultural water use.

5. Conclusions

In this study, we collected data on water level observations for 93 years, from 1928 to 2020, and analyzed long-term fluctuations in water-level rises and precipitation in Lake Yamanaka during periods of heavy rainfall. We found that the six-day maximum rise in water level for the same six-day maximum rainfall was significantly greater in the later period than in the earlier period. Moreover, this difference increased with increasing precipitation. In some cases, we found that particularly large increases in precipitation were caused by a single event, whereas in other cases, these increases were caused by multiple events occurring in succession. We posit two possible reasons for the observed difference between the two periods: first, lakeside road-building and shoreline reclamation projects both progressed from the earlier to the later period. Second, river and erosion-control structures were introduced into a channel where surface water flowed only during heavy rainfall. This allowed surface water to enter the lake rapidly during heavy rainfall.

Author Contributions

Conceptualization, K.K.; methodology, K.K.; software, K.K.; validation, K.K.; formal analysis, K.K.; investigation, K.K. and H.S.; resources, K.K. and H.S.; data curation, K.K.; writing—original draft preparation, K.K.; writing—review and editing, K.K. and H.S.; visualization, K.K.; supervision, K.K. and H.S.; project administration, K.K. and H.S.; and funding acquisition, K.K. and H.S. All authors have read and agreed to the published version of the manuscript.

Funding

This research received no external funding. It was supported by internal funding provided by the Meteorological Data Analysis Research Group at the University of Tokyo Forests.

Data Availability Statement

No new data were created or analyzed in this study. Data sharing is not applicable to this article.

Acknowledgments

This paper is a part of the results of the Research Promotion Committee Hydrological Water Quality Data Analysis Study Group established in the University of Tokyo Experimental Forest. I would like to express my profound gratitude to the Yamanashi Prefectural Library, the Yamanashi Prefectural River Improvement and Management Division, the Yamanashi Prefectural Citizens Information Center, and the University of Tokyo Library of Agricultural and Life Sciences for their generous assistance in collecting and viewing past observation data recorded in paper materials. At least 44 years of the Yamanaka Lake water-level data used in this study, from 1957 to 2000, were observed by the late Tadamichi Sugiura. I would like to express my heartfelt gratitude to the late Tadamichi Sugiura, who served as principal of Yamanaka Elementary School, Yamanaka Lake Middle School, and chairman of the Yamanaka Lake Village Cultural Properties Council, and who was awarded the Minister of Construction Prize for his many years of service as a Lake Yamanaka hydrological observer.

Conflicts of Interest

The authors declare no conflict of interest.

References

  1. Leira, M.; Cantonati, M. Effects of water-level fluctuations on lakes: An annotated bibliography. Hydrobiologia 2008, 613, 171–184. (In Japanese) [Google Scholar] [CrossRef]
  2. Calder, I.R. Blue Revolution: Integrated Land and Water Resources Management (Revised Edition); Routledge: London, UK, 2005; p. 376. [Google Scholar]
  3. Yamamoto, M.; Uchiyama, T. Precipitation and Water Level Fluctuations in Lake Kawaguchi over the Past 100 Years. Tsuru Univ. Rev. 2018, 88, 131–141. (In Japanese) [Google Scholar]
  4. Fujiyoshida Museum of Local History. MARUBI; Fujiyoshida Museum of Local History: Fujiyoshida, Japan, 1997; p. 8. (In Japanese) [Google Scholar]
  5. Yoneyama, F. Formation and changes of irrigation systems in Oshino village, Yamanashi Prefecture, Japan. Ecumene Res. 2010, 1, 3–21. (In Japanese) [Google Scholar]
  6. Kanbara, S. Geology and Hydrology of Mount Fuji; Hakushinkan: Tokyo, Japan, 1929; p. 481. (In Japanese) [Google Scholar]
  7. Tanaka, M.; Kasai, K.; Tsutsumi, M.; Sasamoto, J.; Nagata, T. Results of water quality survey and water balance at the time of abnormal rise of water level in the Fuji Five Lakes in 1982. Annu. Rep. Yamanashi Prefect. Inst. Public Health Pollut. Res. 1982, 26, 22–28. (In Japanese) [Google Scholar]
  8. Kanno, T.; Ishii, T.; Kuroda, K. Study on groundwater flow in the northern foot area of Mt. Fuji and water level changes of Lake Kawaguchi, based on the hydrogeological structure. J. Jpn. Groundw. Assoc. 1986, 28, 25–32, (In Japanese, with English abstract). [Google Scholar]
  9. Tsutsumi, M. An essay on the runoff analysis of the Sagami River basin in Yamanashi Prefecture. Annu. Rep. Yamanashi Prefect. Inst. Public Health Pollut. Res. 1987, 31, 34–38. (In Japanese) [Google Scholar]
  10. Horiuchi, S.; Lee, Y.K.; Watanabe, M.; Fujita, E. Some limnological characteristics of Fuji. Bull. Inst. Nat. Sci. Nihon Univ. 1992, 27, 45–56. (In Japanese) [Google Scholar]
  11. Susuki, E.; Taba, J. A study on the mechanism of exchange between lake waters of Fuji-Goko (Five Lakes) and the groundwater around the lakes. Bull. Inst. Nat. Sci. Nihon Univ. 1994, 29, 43–60. (In Japanese) [Google Scholar]
  12. Takeuchi, K.; Kiriishi, F.; Imamura, H. The water balance analysis of the Five Lakes of Mt. Fuji. J. Hydraul. Eng. 1995, 39, 31–36. [Google Scholar] [CrossRef] [Green Version]
  13. Yoshida, M.; Hirabayashi, K.; Yoshizawa, K. A study on the changes of water level and quantity of rainfall in Lake Kawaguchi. Bull. Yamanashi Women’s Coll. 1998, 31, 79–84, (In Japanese, with English abstract). [Google Scholar]
  14. Hamada, H.; Kitagawa, Y. Investigation of seasonal change of water temperature and water quality and water balance of Lake Yamanaka. Bull. Fac. Educ. Chiba Univ. 2010, 58, 371–380, (In Japanese, with English abstract). [Google Scholar]
  15. Ogata, M.; Kobayashi, H. Chronological change of water level of Lake Kawaguchi and that of ground water level around southeast area of Lake Kawaguchi. Compr. Res. Organ. Sci. Technol. Yamanashi Prefect. Gov. 2015, 10, 91–94, (In Japanese, with English abstract). [Google Scholar]
  16. Nakamura, T.; Hasegawa, T.; Yamamoto, M.; Uchida, T.; Seko, Y.; Shimizu, G.; Yoneyama, Y.; Kazama, F. Source of water and nitrate in springs at the northern foot of Mt. Fuji and nitrate loading in the Katsuragawa River. J. Geogr. 2017, 126, 73–88, (In Japanese, with English abstract). [Google Scholar] [CrossRef] [Green Version]
  17. Kuraji, K.; Saito, H.; Nishiyama, N.; Tsuji, R. Long-term trend of precipitation in the Fuji Iyashinomori Woodland Study Center. Bull. Univ. Tokyo For. 2021, 145, 1–18, (In Japanese, with English abstract). [Google Scholar]
  18. The Imperial Japanese Land Survey Department. 1/50,000 Scale Topographic Map (Yamanakako); The Imperial Japanese Land Survey Department: Tokyo, Japan, 1989. (In Japanese)
  19. Yamanakako Village. Natural History of Yamanakako Village; Yamanakako Village: Yamanakako, Japan, 2006. (In Japanese)
  20. Yanai, K. Water Utilization Survey at the Northern Foot of Mount Fuji and Its Data Analysis (Appendix) Water Level, Discharge and Rainfall Table of Fuji Five Lakes from 1927 to 1961; Yamanashi Prefecture: Kofu, Japan, 1962; p. 136. (In Japanese) [Google Scholar]
  21. Yamanashi Prefecture. Fuji Five Lakes Water Level, Discharge, Rainfall and Observation Table; Yamanashi Prefecture: Kofu, Japan, 1970; p. 55. (In Japanese)
  22. Yamanashi Prefecture. Annual Report of Rainfall and Water Level Observation of Yamanashi Prefecture (1955–1956); Yamanashi Prefecture: Kofu, Japan, 1958; p. 164. (In Japanese)
  23. Yamanashi Prefecture. Annual Report of Rainfall and Water Level Observation of Yamanashi Prefecture (1957–1958); Yamanashi Prefecture: Kofu, Japan, 1962; p. 172. (In Japanese)
  24. Yamanashi Prefecture. Annual Report of Rainfall and Water Level Observation of Yamanashi Prefecture (1963–1964); Yamanashi Prefecture: Kofu, Japan, 1966; p. 127. (In Japanese)
  25. Yamanashi Prefecture. Annual Report of Rainfall and Water Level Observation of Yamanashi Prefecture (1965–1966); Yamanashi Prefecture: Kofu, Japan, 1967; p. 129. (In Japanese)
  26. Yamanashi Prefecture. Annual Report of Rainfall and Water Level Observation of Yamanashi Prefecture (1967–1968); Yamanashi Prefecture: Kofu, Japan, 1969; p. 119. (In Japanese)
  27. Yamanashi Prefecture. Water Level Monthly Report, 1981–1996; Non-Published Data (viewed on 20 October 2020, pursuant to Article 12, Paragraph 1 of the Yamanashi Prefecture Information Disclosure Ordinance). (In Japanese)
  28. Historical Water Levels in Fuji Five Lakes. Available online: https://www.pref.yamanashi.jp/chisui/113_006.html (accessed on 23 November 2021).
  29. Tokyo Electric Power Company. Water Level and Outflow Reports, 1972–2020; Non-Published Data disclosed by the Governor of the Yamanashi Prefecture on 8 June 2022.
  30. National Land Agency. Sagami River Area Main Water System Survey; National Land Agency: Tokyo, Japan, 2000; p. 232. (In Japanese)
  31. Okai, K.; Fukushima, H.; Nakai, Y. A Study of Village Structure in Yamanaka District, Yamanakako Village, Minamitsuru-gun, Yamanashi Prefecture—Focusing on the Transformation of the Vertical Road, Landscape and Design Research Proceedings. Landsc. Des. Res. Proc. 2015, 11, 39–46. (In Japanese) [Google Scholar]
  32. Takahashi, T.; Fukushima, H.; Nakai, Y. Transformation of Lakeside Landscape in Yamanakako Village—Focusing on Land Ownership and Livelihood, Landscape and Design Research Proceedings. Landsc. Des. Res. Proc. 2014, 10, 126–131. (In Japanese) [Google Scholar]
  33. Takamura, T. Landslide disaster caused by “Typhoon No. 9” in 2010. Sabo Chisui 2012, 44, 40–43. (In Japanese) [Google Scholar]
Figure 1. Map showing the Lake Yamanaka and the surrounding areas.
Water 14 02232 g001
Figure 2. Land cover change in the Yamanaka Village. Source: Upper map is based on a 1/50,000 scale topographic map of the Imperial Japanese Land Survey Department [18]. The lower map is based on Yamanakako Village [19].
Water 14 02232 g002
Figure 3. Lake water level and outflow of the Lake Yamanaka over 93 years. The number on the figure indicates the events with particularly large increments in the water level (see Section 2.3.2).
Water 14 02232 g003
Figure 4. Relationship between six-day maximum cumulative precipitation (mm/6 days) and six-day maximum water-level rise for first (1928–1968) and second (1972–2020) periods.
Water 14 02232 g004
Figure 5. Relationship between cumulative rainfall during the days preceding a date with the highest water level. Note x-axis is reversed.
Water 14 02232 g005
Figure 6. Relationship between the number of days preceding a date with the highest water level and water level. Note x-axis is reversed.
Water 14 02232 g006
Figure 7. Reclamation of the lake’s shoreline and parking lot construction. Photo taken on 19 June 2022, when the lake water level was 2.26 m.
Water 14 02232 g007
Publisher’s Note: MDPI stays neutral with regard to jurisdictional claims in published maps and institutional affiliations.