Article

Occurrence and Reduction of Shiga Toxin-Producing Escherichia coli in Wastewaters in the Kathmandu Valley, Nepal

1
Department of Engineering, University of Yamanashi, Yamanashi 400-8511, Japan
2
Interdisciplinary Center for River Basin Environment, University of Yamanashi, Yamanashi 400-8511, Japan
3
Policy Research Institute, Sano Gaucharan-5, Kathmandu 44600, Nepal
4
Division of Sustainable Energy and Environmental Engineering, Osaka University, 1-1 Yamadaoka, Suita 565-0871, Japan
5
Institute of Medicine, Tribhuvan University, Maharajgunj, Kathmandu 1524, Nepal
*
Author to whom correspondence should be addressed.
Water 2022, 14(14), 2224; https://doi.org/10.3390/w14142224
Submission received: 20 June 2022 / Revised: 9 July 2022 / Accepted: 12 July 2022 / Published: 14 July 2022
(This article belongs to the Special Issue Health-Related Water Microbiology and Wastewater-Based Epidemiology)

Abstract

:
Inadequately treated effluents discharged from wastewater treatment plants (WWTPs) severely affect the environment and the surrounding population. This study analyzed the presence of the Shiga toxin-producing Escherichia coli (STEC) genes, stx1, and stx2, and the E. coli gene, sfmD, in municipal WWTP A (n = 11) and B (n = 11) where the reductions were also evaluated; hospitals (n = 17), sewage treatment plants (STPs) (n = 4) and non-functional WWTPs (not-working WWTPs) (n = 5) in the Kathmandu Valley, Nepal. The sfmD gene was detected in 100% of the samples in WWTPs, hospitals, and not-working WWTPs and 50% of STP samples. The highest detection of stx1 and stx2 was shown in the WWTP influents, followed by WWTP effluents, not-working WWTP wastewater, hospital wastewater, and STP wastewater. Log10 reduction values of sfmD, stx1, and stx2 in WWTP A were 1.7 log10, 1.7 log10, 1.4 log10, whereas those in WWTP B were 0.5 log10, 0.6 log10, 0.5 log10, respectively, suggesting the ineffective treatment of STEC in the wastewater in the Kathmandu Valley. The high concentrations of the stx genes in the wastewaters suggest the increasing presence of aggressive STEC in the Kathmandu Valley, which should be a major public health concern.

1. Introduction

A primary public health concern is the contamination of environmental waters by fecal pathogens. Wastewater typically comprises high concentrations of microbiological contaminants that require treatment before being discharged into the environment [1]. Wastewater treatment plants (WWTPs) are commonly constructed to remove organic matter in wastewater, which enables the reduction in bacterial loads, subsequently decreasing environmental water contamination [2]. The treated effluent is sometimes reclaimed for several purposes, including irrigation, landscaping, and flushing toilets, because of the increase in global population and climate change causing further water crises [3,4]. However, wastewater in many developing countries, such as Nepal, is discharged into surface water bodies without adequate treatment, yet, is still used as a primary source for agricultural irrigation [5,6]. Inefficiently treated effluent is a threat to macro- and microflora and fauna of the surface water bodies and the supply of good water quality to the population. The increased microbial concentration in the inadequately treated effluent may also cause waterborne diseases, such as gastroenteritis [7].
The Shiga toxin-producing Escherichia coli (STEC) is an important cause of foodborne diseases; however, its source of contamination extends to leafy vegetables, water, and fecal-contaminated environmental water, too [8,9]. STEC infection is caused by the ingestion of the bacteria, for which the infective dose to induce a response by the body is fewer than ten cells, due to the presence of the stx1 and/or stx2 genes. The stx1 and stx2 genes are primary virulence factors that inhibit protein synthesis, which causes apoptosis and are responsible for STEC pathogenesis, whereas the sfmD gene encodes for the outer membrane usher protein in E. coli [10,11]. Diseases associated with STEC infection include dysentery, hemorrhagic colitis, and hemolytic uremic syndrome in humans [9,12,13]. STEC was first discovered in 1977 and was first isolated from water in 1989 [14,15]. Since then, there have been several reports of waterborne STEC-related outbreaks [16,17,18,19]. These outbreaks were caused by ruminant fecal contamination of surface water bodies leaching into the unconfined aquifer used by the city, insufficient filtration by water purifier and damaged connection between reservoir, and chlorine sterilization pipelines, contamination of the water distribution system by the sewage due to backflow at or near the leakage site, and the ingestion of lake water contaminated by feces. The low infective dose is attributed to the occurrence of waterborne STEC outbreaks, and the past studies illustrate the different methods of possibilities of STEC infection [20]. A study conducted in France showed STEC presence in slurry, wastewater, and river water surrounding and in the French slaughterhouses, highlighting the importance of proper treatment of wastewater to prevent contamination of food and the environment [21]. The remaining microbiome and nutrients in the effluent may also encourage the increase in pathogenic bacteria in the environment [22]. A previous study also detected the presence in groundwater, river water, feces, and manure in the Kathmandu Valley, and suggested the possibility of river water contamination from wastewater discharge and river water and groundwater interactions near the river channels contributing to groundwater contamination [23].
Presently, only 88% of households in the Kathmandu Valley possess sewage facilities, and 11% of households still use a septic tank or pit [24]. There are currently five WWTPs in the Kathmandu Valley, of which only one WWTP was in operation (activated sludge system) and the remaining four WWTPs (aerated and non-aerated lagoons) were either under partial operation or non-functional during the time of sampling [5,23,25]. The status “partially operating” shows the inability to treat the wastewater as effectively as a fully functional treatment plant owing to poor operation, maintenance, and management [5]. In addition to WWTPs, wastewater is processed in sewage treatment plants (STPs) and hospitals before discharge.
Furthermore, the nutrient-rich environment and high density of cells in WWTPs facilitate horizontal gene transfer among microorganisms, which is also suggested to be involved in the evolution of some of the first STEC strains [26,27,28]. In addition to this, several studies have presented the inability of STEC to be removed entirely from wastewater effluents [21,29,30,31]. Previous studies in the Kathmandu Valley have examined the occurrence and reduction in pathogenic viruses and bacteria in WWTPs [32,33,34]. However, regular monitoring and surveillance of pathogens in the wastewater are not performed in the Kathmandu Valley. A contributing factor for this may include the cost of testing for pathogens on a regular basis. Since molecular methods in bacteriology typically initiate with DNA extraction for which several methods of varying advantages and disadvantages have been and are continuously developed, a cost-effective and time-efficient DNA extraction method that can be implemented in resource-poor countries is necessary to encourage regular pathogen surveillance [35]. One of these methods is the heat treatment or “boiling” method that enables bacterial DNA extraction by causing damage to the cell membranes to release the nucleic acid within to obtain the DNA extract cost-effectively and rapidly [35,36]. Due to the lack of surveillance of STEC in the wastewater, this study aimed to assess the applicability of heat-treated DNA extraction method for pathogen surveillance and analyzed the presence and reduction in STEC in two WWTPs of the Kathmandu Valley.

2. Materials and Methods

2.1. Collection of Wastewater Samples

Four types of wastewaters were obtained from different treatment plants and hospitals in the Kathmandu Valley between April and August 2018. Altogether, 48 wastewater samples, which comprised general hospital wastewater effluents that were untreated due to the absence of treatment systems (HWW) (n = 17), municipal WWTP (n = 22), STP influents (n = 4), and not-working WWTP (n = 5) samples were collected. The municipal wastewater samples were obtained by grab sampling from two WWTPs, WWTP A (n = 12) which used an oxidation ditch system and had a capacity of 17.3 million liters per day (MLD) designed for approximately 74,000 inhabitants and WWTP B (n = 10) which used stabilization ponds and had a capacity of 1.1 MLD designed for the population of eastern Lalitpur, for which the influents (n = 6 and 5 for WWTP A and B, respectively), and the effluents (n = 6 and 5) were obtained [25,37]. The water samples were collected in autoclaved 1 L plastic bottles and transported in an icebox to the laboratory within six hours of collection.

2.2. Enumeration of E. coli in Wastewater

As described in previous studies [23,38,39], the E. coli concentrations were determined in 100 mL wastewater for dilutions of 10−2, 10−4, and 10−6 using the Colilert Quanti-Tray 2000 (IDEXX Laboratories, Westbrook, USA). However, in this study, an additional bottle of 100 mL sample diluted to 10−2 was also directly incubated at 37 °C for 24 h. In the Quanti-Tray, the wells that fluoresced blue under the UV lamp were considered positive for E. coli. Based on the number of blue wells, the concentrations of E. coli were evaluated by referring to the most probable number (MPN) generating software (IDEXX Laboratories).

2.3. Performance of Heat and Kit DNA Extraction

Before performing DNA extraction of the WWTP samples, the performance of two different DNA extraction methods—heat DNA extraction and kit DNA extraction—were evaluated.
To evaluate the performance of the heat DNA extraction method, 10−1 and 10−2 dilutions of E. coli K-12 (NBRC3301, National Institute of Technology and Evaluation, Kisarazu, Japan) were prepared in 100 mL autoclaved ultrapure water. Following the manufacturer’s instructions, these samples were subjected to the Colilert-18 test kit (IDEXX Laboratories, Westbrook, ME, USA) [23,38,39]. On the Quanti-Tray 2000 (IDEXX Laboratories), wells that appeared yellow and blue under UV light were punctured using a micropipette to collect 500 μL from eight large positive wells and four small positive wells of the 10−1 tray and from eight large positive wells and six small positive wells of the 10−2 tray. In addition to this, 500 μL from four large negative wells and three small negative wells from the 10−1 tray, and from three small negative wells from the 10−2 tray were obtained. These cultured E. coli samples were stored in 1.5 mL microtubes with 500 μL 50% glycerol. During DNA extraction, 40 μL of the cultured E. coli in glycerol was transferred to a 0.2 mL PCR tube and heated at 95 °C for five minutes in the TaKaRa PCR Thermal Cycler Dice Touch (Takara Bio, Kusatsu, Japan). The resulting heated cultured E. coli in glycerol was used as the DNA extract.
Additionally, 200 μL bacterial concentrate of the corresponding samples were also subjected to a kit DNA extraction to obtain 200 μL bacterial DNA extract using the QIAamp DNA mini kit (QIAGEN, Hilden, Germany) following the provided instructions.
The performance of the two methods was evaluated based on the sensitivity, specificity, and accuracy obtained. The sensitivity was calculated as the number of true-positive samples divided by the sum of the true-positive samples and the false-negative samples. The specificity was calculated as the number of true-negative samples divided by the sum of the true-negative samples and the false-positive samples. The accuracy was calculated as the sum of the true-positive samples and the true-negative samples divided by the sum of the true-positive, false-negative, true-negative, and false-positive samples [39].

2.4. DNA Extraction and quantitative Polymerase Chain Reaction (qPCR)

One hundred mL of 10−2 dilution of the wastewater samples in autoclaved glass bottles was subjected to the Colilert test kit (IDEXX Laboratories) following the manufacturer’s instructions and incubated at 37 °C for 24 h. As mentioned above, 500 μL positive samples of cultured E. coli were obtained from the bottle and stored with 500 μL 50% glycerol in 1.5 mL tubes. Forty microliters of this sample were used for heat DNA extraction following the thermal conditions as previously explained. Alternatively, 10 mL wastewater samples were concentrated using a nitrocellulose membrane filter (pore size, 0.22 μm; diameter, 47 mm; Nalgene, Tokyo, Japan), followed by DNA extraction using the Cica Geneus DNA Extraction kit to obtain a final volume of 300 μL of purified DNA (Kanto Chemical, Tokyo, Japan), as described previously [38,40,41].
The samples subjected to heat DNA extraction were referred to as cultured qPCR, and those subjected to kit DNA extraction were referred to as direct qPCR. The wastewater samples underwent qPCR of three assays, stx1, stx2, and sfmD, as shown in Table 1. A 25 μL qPCR reaction mixture, which comprised 12.5 μL Probe qPCR Mix (Takara Bio), 1.0 μL each of 10-pmol/µL of the forward and reverse primers [11,42], 1.0 μL of 5-pmol/µL TaqMan probe, 7.0 μL PCR-grade water, and 2.5 μL DNA extract was prepared. To generate a standard curve for the qPCR run, six tenfold serial dilutions of artificially synthesized plasmid DNA containing the amplification sequences (2.0 × 100–2.0 × 10⁵ copies/μL; Takara Bio for sfmD and Eurofins Genomics, Tokyo, Japan for stx1 and stx2) were added to each run. All samples were duplicated, including the standards and the negative controls. The qPCR was performed in the Thermal Cycler Dice Real-Time System TP800 (Takara Bio) using the following thermal conditions: hold at 95 °C for 30 s, followed by 2 step PCR of 45 cycles of 95 °C for five seconds and 60 °C for 30 s. The cut-off cycle threshold value was set to 35 for sfmD and 40 for stx1 and stx2.

2.5. Data Analysis

The χ2-test was used to compare the positive ratios between the direct qPCR and cultured qPCR and between assays in the influent and effluent samples of the WWTP. The McNemar χ2-test was performed to determine the relationship of the positive ratios between the stx1 and stx2 genes. The paired t-test analyzed the difference between the mean concentrations between assays and sample types. The log10 reduction value (LRV) was evaluated by subtracting the log10 concentration of the effluent from the influent; for the non-detects, the 1/10 of the limit of detection (LOD) value for each assay was used to compute. The Welch t-test was used to evaluate the difference in the LRV of the assays between the two WWTPs. The virulent E. coli ratio was calculated as the ratio of the stx1 or stx2 gene concentration to that of the sfmD gene using only the positive samples. A p-value of <0.05 was considered statistically significant in the conducted analyses.

3. Results

3.1. Performance of Heat and Kit DNA Extraction

Of the 26 samples that were Colilert positive and ten that were Colilert negative, the heat DNA extraction exhibited 100% sensitivity (26/26), 100% specificity (10/10), and 100% accuracy (36/36), whereas the kit DNA extraction expressed 96% sensitivity (25/26), 100% specificity (10/10), and 97% accuracy (35/36). The samples subjected to heat DNA extraction resulted in a mean Ct value of 23.1 ± 1.1, whereas those subjected to kit DNA extraction resulted in 21.5 ± 0.9. Statistically, the heat DNA extraction observed a significantly lower mean Ct value than that of the kit DNA extraction (paired t-test, p < 0.05); however, the purpose of the heat DNA extraction was to obtain qualitative data to determine the viability of typical E. coli. For this reason, the heat DNA extraction was used alongside direct qPCR using kit DNA extraction to verify E. coli viability later in the study.

3.2. Detection of E. coli Genes in Wastewater Samples

As indicated in Table 2, sfmD was detected in all wastewater samples (100%) using direct qPCR except for the STP (50%). Similarly, at least one of the two virulence genes was present in all except the STP (0%) using direct qPCR. In contrast, using the cultured qPCR, sfmD and at least one of the virulence genes were exhibited in all tested wastewater types. The stx1 gene in WWTP A showed a significantly lower positive ratio in the effluent (17%) compared to in the influent (100%) (χ2 test, p < 0.05). The WWTP B effluent (80%) also expressed a lower positive ratio of the stx1 gene to the influent (100%); however, unlike WWTP A, the difference was insignificant (χ2, p > 0.05). As for the stx2 gene, only WWTP A exhibited a lower effluent positive ratio (67%) of the stx2 gene compared to the influent (100%), although the difference was also insignificant (χ2, p > 0.05).
In addition to the difference between the influent and effluent, the difference in detection of the stx1 and stx2 genes was calculated. The HWW, not-working WWTP, WWTP A and B influents observed no significant difference in the positive ratio between the stx1 and stx2 genes (McNemar χ2, p > 0.05). Only the WWTP A and B effluents exhibited a significant difference between the stx1 and stx2-positive ratios (McNemar χ2, p > 0.05). Since the stx1 and stx2 genes were undetected in the STP, the test was not applied to it.

3.3. Concentrations of E. coli and Its Genes in Wastewater Samples

The concentrations using direct qPCR for sfmD, stx1, and stx2, as well as the concentration of E. coli using the Colilert method for all wastewater samples are shown in Table 3. The concentrations of E. coli using the Colilert method and direct qPCR ranged from 6.3 ± 0.8 log10 copies/L to 8.9 ± 0.3 log10 copies/L and from 9.1 ± 0.1 log10 copies/L to 11.0 ± 0.1 log10 copies/L, respectively. Alternatively, the stx1 and stx2 concentrations ranged from < LOD to 7.1 ± 0.3 log10 copies/L and from < LOD to 7.7 ± 0.3 log10 copies/L, respectively. The mean concentration of sfmD in all wastewater samples was significantly greater (2.2 log10) than for the Colilert method (paired t-test, p < 0.05). Between the stx1 and stx2 genes, the stx2 gene is significantly greater in concentration than the stx1 gene in the HWW, WWTP A influent and effluent, and WWTP B influent and effluent samples (paired t-test, p < 0.05). However, there is no significant difference in concentrations between the stx1 and stx2 in the STP and not-working WWTP.

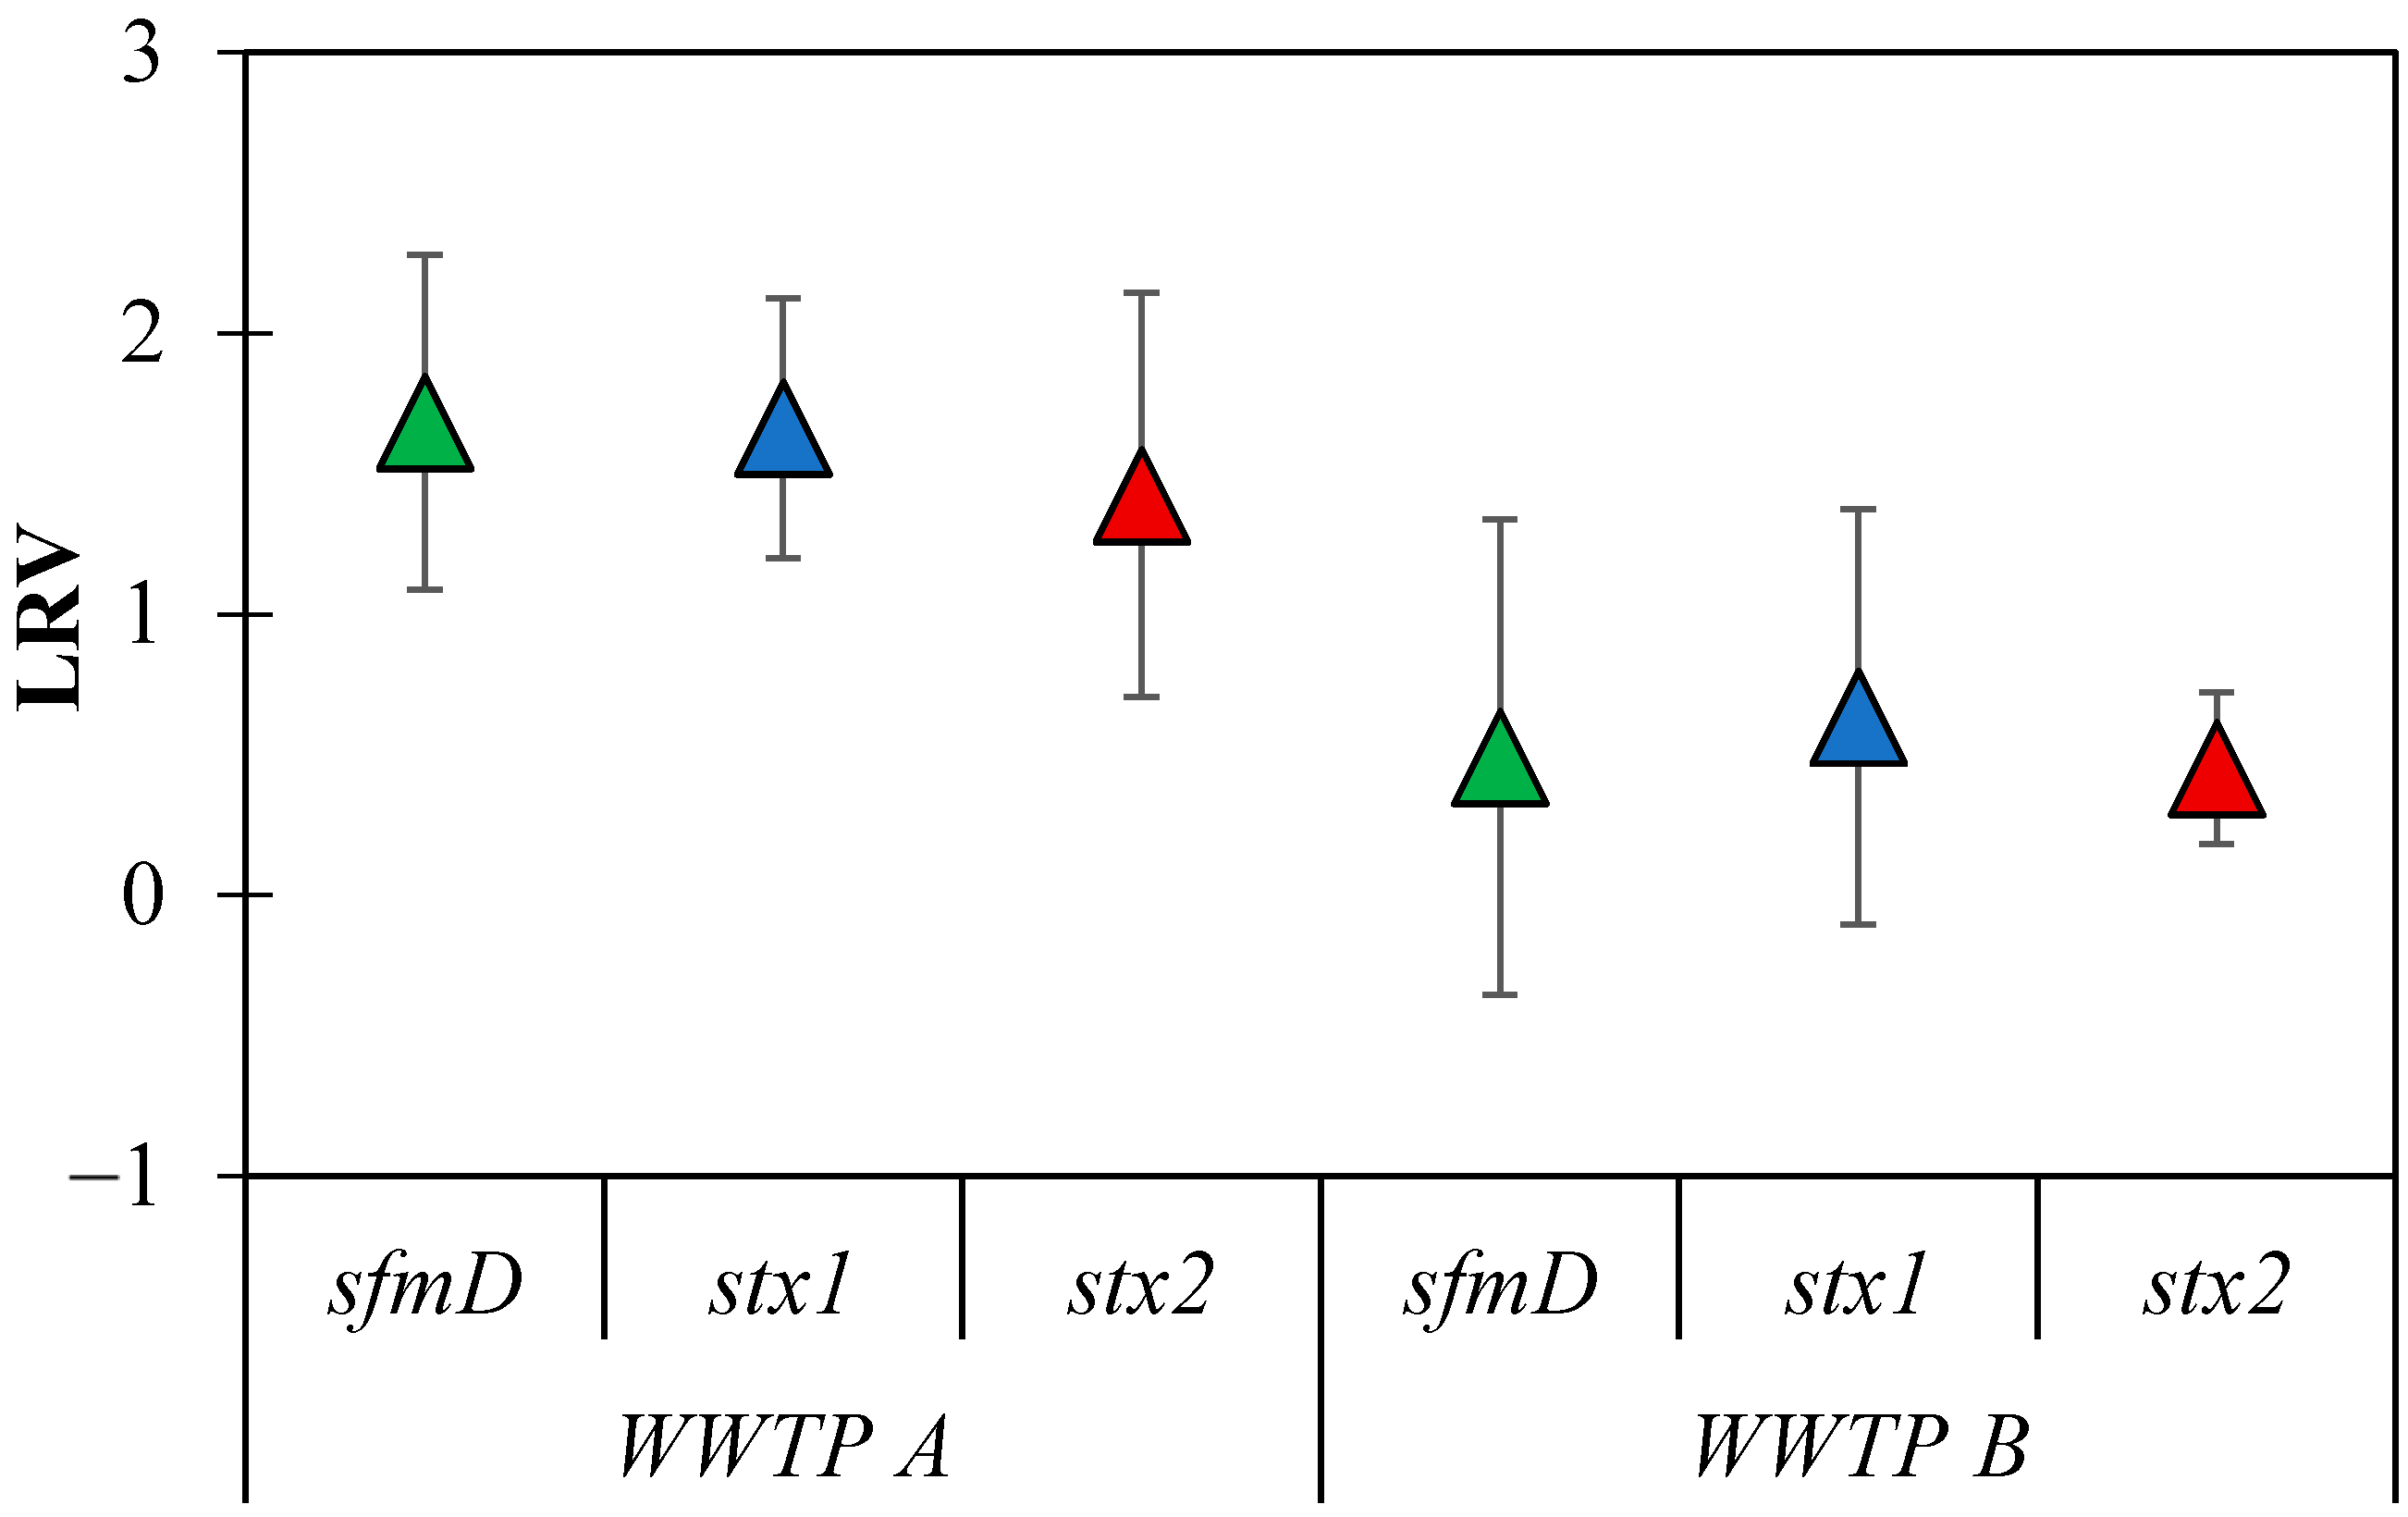
3.4. LRVs of E. coli Genes in Municipal WWTP

Among the three assays tested in the two WWTPs, only the stx2 gene showed a significant difference in mean concentrations between the influent and effluent in both WWTP A and B (paired t-test, p < 0.05). The sfmD and stx1 genes only exhibited a significant difference in LRV between the influent and the effluent in WWTP A. In addition to this, the highest LRV of the sfmD (1.7 ± 0.6) and stx1 (1.7 ± 0.5) genes were shown in WWTP A, as shown in Figure 1. The lowest LRV was observed for sfmD (0.5 ± 0.8) and stx2 (0.5 ± 0.3) genes in WWTP B. Between the two WWTPs, a significantly greater LRV (1.1) was shown by the WWTP A, compared to the WWTP B (Welch t-test, p < 0.05) for all three genes tested.

3.5. Ratio of Virulent E. coli Genes

The ratio of the virulence gene to sfmD gene ranged from 0.01% ± 0.01%–0.15% ± 0.13% for all samples, as presented in Table 4. The stx1/sfmD ratios were ranked as follows: WWTP A effluent > WWTP B influent > WWTP B effluent > HWW > WWTP A influent > not-working WWTP > STP, whereas the stx2/sfmD ratios were ranked as follows: WWTP A effluent > WWTP B effluent > WWTP B influent > WWTP A influent > HWW > not-working WWTP > STP. In addition to this, the ratio between the Colilert and sfmD gene results was determined. The highest Colilert/sfmD ratio (1.43% ± 2.14%) was exhibited by the WWTP A effluent, whereas the lowest ratio (0.60% ± 0.78%) was seen in the STP.

4. Discussion

4.1. Performance of DNA Extraction Methods

WWTPs in the Kathmandu Valley presently still lack routine monitoring and management and require further development to decrease the cause of different diseases [32]. This study analyzed the detection and reduction efficiency of STEC in several types of wastewaters in the Kathmandu Valley. Since the detection of the genes does not provide information about the viability of the pathogens, the Colilert method was applied alongside the direct qPCR method. However, the process of DNA extraction using a commercial kit is costly, laborious, and time-consuming. It sometimes requires special equipment, such as a centrifuge, to perform the procedure, which may be unsuitable for application in developing countries. Simplified versions of DNA extraction have been previously performed by heating bacterial material without adding reagents, such as by heating bacterial colonies suspended in distilled water in test tubes on a hot water bath for 10 min; by heating the bacterial colonies suspended in distilled water in a microwave oven for 10 s followed by centrifugation; by incubating the bacteria at 99 °C for 15 min; by culturing the bacteria followed by centrifugation and heating the precipitate at 100 °C for 10 min; and by boiling the bacteria suspended in TE buffer for 15 min followed by centrifugation [35,36,43,44]. The E. coli K-12 samples cultured using the method in this study underwent DNA extraction using a kit and by heating and exhibited comparable results. The performance of the heat extraction method was higher than that of the kit extraction method; however, the Ct value of the latter was significantly greater than that of the former. Despite that, the difference in Ct values did not exceed two cycles. Several past studies concluded no significant difference between the heat extraction and the commercial kit extraction methods similar to that of this study and suggest the applicability of heating bacterial material for DNA extraction, too [35,36,43,44,45]. One study assessed the ability of the bacterial DNA extracted using heat treatment to perform PCR, Restriction Fragment Length Polymorphism (RFLP), and DNA sequencing and concluded comparable results to the more complicated DNA extraction methods of these processes and suggested its applicability on other biological samples, as well [35]. Similarly, another study compared the cost per sample and the average process duration among six different DNA extraction methods and found that the boiling method cost nothing to perform and averaged about 20 min to process, whereas the cost per sample of the remaining five methods ranged from €3.96 to €5.7 and the durations ranged from 30 min to >1 h [44]. For these reasons, the heat DNA extraction was implemented on the cultured samples to obtain at least the qualitative data from qPCR to verify the presence of viable E. coli in the wastewater samples quickly and efficiently.

4.2. Detection of E. coli Genes in Wastewater Samples

This study also observed higher detection of the stx2 gene than the stx1 gene, which is congruent with many past studies [1,21,30,46,47]. However, the positive ratios in this study for the stx1 and stx2 genes in the influent and effluent of WWTP A (100%, 100%; 17%, 67%) and WWTP B (100%, 100%; 80%, 100%) were much higher than those of the previous studies. The differences in the presence of stx1 and stx2 among the studies may be attributed to the different geographical locations and their varying fecal flora composition in the wastewater and the different methods performed and sampling sizes and strategies [1]. Another contributing factor to the higher STEC presence in this study is the treatment technology employed by the treatment plants. A study that analyzed the presence of virulent genes of E. coli in activated sludge-based treatment plants with various modifications determined that the prevalence of the stx1 and/or stx2 genes did not reduce after treatment in all modifications, and the most prevalent virulent gene in all wastewater samples analyzed was the stx2 gene [47]. Similarly, a study in Brazil reported at least six strains of STEC in the raw and treated wastewater from aerated lagoons [48]. The results of this study were consistent with the previous studies and in addition to that, this study investigated an activated sludge-based treatment plant that lacked the disinfection process prior to discharge and a stabilization pond system that was improperly maintained, which may further justify these results.
The concentrations of the stx2 gene in the HWW, WWTP A, and WWTP B were also significantly greater than those of the stx1 gene, which agreed with studies conducted in Hawaii, USA, Queensland, Australia, and Saxony, Germany [30,49,50]. Studies have indicated that this is typically the case due to the different biology of the two stx-phages in the bacterial host [51,52]. The stx1 and stx2 phages harbor a late promoter that induces phage lysis; however, there is a functional promoter containing a binding site for a protein that complexes with iron adjacent to the stx1 gene. This indicates that the transcription of the stx1 gene can be activated during low concentrations of iron and is not only dependent on the late promoter of the stx1-encoding phage for stx1 production and release. In contrast, the stx2 expression is highly dependent on phage-inducing agents that induce transcription of the late promoter of the stx2-encoding phage for stx2 release [51,53,54]. Additionally, there are only two identified variants of stx1, whereas the stx2 has at least 13 characterized variants that are more commonly associated with severe effects of STEC infection [10,54]. Based on the results obtained in this study, the higher concentrations of the stx2 gene than the stx1 in the wastewaters suggest the growing presence of aggressive STEC infection in the population of the Kathmandu Valley and should be a public health concern. This is especially true due to the trail of the wastewater effluent discharged into the river water, which is reclaimed for irrigational purposes and interacts with groundwater by the river banks used for household use too, as previously discussed [23].
Typically, a not-working WWTP is expected to show a higher concentration of E. coli genes in the effluent than in operating WWTPs since the influents in the not-working WWTPs are discharged without treatment as the effluent. However, in this case, a lower concentration of all three genes was observed only in the WWTP A effluent. In contrast, the WWTP A influent and WWTP B influent and effluent exhibited greater concentrations of all three genes than in the not-working WWTPs. The lack of difference between the operational/partially operational and the non-functional WWTPs suggests the inefficacy of the WWTPs being used in the Kathmandu Valley. As previously discussed, this may be induced by the lack of a disinfection step in the WWTP, proper and regular monitoring, and maintenance due to the complexity of the operation, costly materials and electricity, and the shortage of human resources [25,32].

4.3. Reduction in E. coli Genes in WWTPs

Furthermore, this study also reported LRVs of the sfmD, stx1, and stx2 in WWTP A (1.7 ± 0.6, 1.7 ± 0.5, and 1.4 ± 0.7, respectively), and WWTP B (0.5 ± 0.8, 0.6 ± 0.7, and 0.5 ± 0.3, respectively). As mentioned above, this may be attributed to the wastewater treatment technique implemented on the influent. Studies have demonstrated that different treatment techniques remove the various microorganisms at different rates [4,55]. Oakely and Mihelcic discussed how the removal of one pathogen type, such as indicator bacteria, to meet the effluent standards may not indicate sufficient removal of another pathogen type. Previous studies on the reduction in E. coli in conventional activated sludge treatment plants have obtained a reduction ranging from 0.30–2, analogous to the LRVs acquired in this study [55]. Another study on the same WWTP obtained LRVs of 1.4 for E. coli [32], which is also congruent with this study. However, the LRVs of the indicator viruses (pepper mild mottle virus and tobacco mosaic virus) were 0.2 ± 0.6 and 0.2 ± 0.5, respectively, which were lower than the default virus LRV for well-managed and designed activated sludge plants. Unlike WWTP A, the LRVs of E. coli in this and previous studies were lower in WWTP B than in past studies and in addition to that, the LRVs of almost all tested viruses were inconsiderable [56,57].

4.4. Infectivity of Virulent E. coli

Additionally, as shown in Table 1, the infectivity of the pathogens was also evaluated by conducting cultured qPCR alongside direct qPCR. The combination of the two methods provided data on the gene concentration as well as the infectivity of the pathogens in the wastewater sample simultaneously in a shorter duration than typical culture-based methods followed by molecular methods. Subjecting the wastewater samples to both methods simultaneously also showed a more accurate depiction of the pathogen and gene presence in the sample since the culture-based methods alone don’t reveal the viable but non-culturable, dormant, or injured cells, whereas the molecular method enables the detection of the pathogen regardless of viability [58]. In this study, the presence of the sfmD, stx1, and stx2 genes using cultured qPCR (100%, 73%, 77%) were all greater than those using the direct qPCR (96%, 52%, 60%), and the lower Ct values of the former (22.0 ± 1.5, 34.1 ± 2.1, 32.3 ± 2.6) than the latter (27.6 ± 3.2, 36.8 ± 1.3, 36.3 ± 1.7) confirmed growth of the pathogens in the sample, which indicates the presence of viable bacteria. This suggests that the virulence genes detected in this study may have been derived from infectious STEC circulating in the Kathmandu Valley, and the combination of the cultured and direct qPCR is a recommended method for application in developing countries.
Furthermore, this study also examined the Colilert/sfmD ratio as well as the virulent E. coli gene ratio, as shown in Table 3. Since the Colilert method was used to enumerate the E. coli in the wastewater samples immediately after collection, the ratio between the MPN concentration and the molecular concentrations were determined. In this study, the Colilert/sfmD ratio ranged from 0.60% ± 0.78% to 1.77% ± 1.39%, which may suggest that up to 2% of the sfmD genes may have been derived from viable E. coli. In addition to this, the stx1/sfmD ratio ranged from 0% 0.02%, and the stx2/sfmD ratio ranged from 0 0.15% ± 0.13%, suggesting that up to 0.2% of the E. coli genes may have comprised of virulence genes that, as previously discussed, was derived from infectious STEC. All the results combined suggest the inefficacy of the WWTPs in the Kathmandu Valley in eliminating pathogens from the wastewater before discharging it back into the environment. Therefore, it may be necessary to improve and update the policies for the wastewater management guidelines in the Kathmandu Valley.

5. Conclusions

Studies on STEC are still limited in the Kathmandu Valley—particularly in wastewater—despite being a common cause of outbreaks worldwide. This study successfully determined the occurrence and reduction in STEC in two WWTPs in the Kathmandu Valley and provided data on STEC in the wastewaters. These results showed the ineffective treatment of the STEC genes from the influent to the discharged effluent due to the high concentrations in both and a low LRV between the two. The inability to decrease the pathogen demands the installation of a disinfection unit that uses chlorination, which is cost-effective and energy-efficient, and better maintenance of the treatment techniques presently implemented to reduce the concentrations and infectivity of the pathogens. To further decrease the pathogen load in the WWTPs, hospitals must be required to build a treatment system that performs disinfection of both the influent and the effluent, such as also using chlorination from the HWW before being discharged into the sewers that lead to the municipal WWTP; these may assist in lowering the WWTP effluent pathogen concentrations in the Kathmandu Valley.

Author Contributions

Conceptualization, N.S., J.B.S. and E.H.; formal analysis, N.S.; funding acquisition, E.H. and F.K.; investigation, N.S., B.M., R.G.S., S.T., O.T. and E.H.; methodology, N.S., B.M., R.G.S., S.T., O.T. and E.H.; supervision, E.H. and F.K.; validation, N.S., B.M. and E.H.; visualization, N.S. and E.H.; writing—original draft preparation, N.S.; writing—review and editing, B.M., R.G.S., S.T., O.T., J.B.S., E.H. and F.K. All authors have read and agreed to the published version of the manuscript.

Funding

This study was supported by the Science and Technology Research Partnership for Sustainable Development (SATREPS) program of Japan International Cooperation Agency (JICA) and Japan Science and Technology Agency (JST), entitled “Hydro-microbiological Approach for Water Security in Kathmandu Valley, Nepal”, and the Japan Society for the Promotion of Science (JSPS) through the Fund for the Promotion of Joint International Research (Fostering Joint International Research (B)) (grant number JP18KK0297) and the Grant-in-Aid for Scientific Research (B) (grant number JP20H02284).

Institutional Review Board Statement

Not applicable.

Informed Consent Statement

Not applicable.

Data Availability Statement

Not applicable.

Acknowledgments

The authors thank Suresh Das Shrestha (Tribhuvan University, Nepal), Kei Nishida, Takashi Nakamura, and Bijay Man Shakya (University of Yamanashi, Japan) for their support in water sampling.

Conflicts of Interest

The authors declare no conflict of interest.

References

  1. Bibbal, D.; Um, M.M.; Diallo, A.A.; Kérourédan, M.; Dupouy, V.; Toutain, P.L.; Bousquet-Mélou, A.; Oswald, E.; Brugère, H. Mixing of Shiga toxin-producing and enteropathogenic Escherichia coli in a wastewater treatment plant receiving city and slaughterhouse wastewater. Int. J. Hyg. Environ. Health 2018, 221, 355–363. [Google Scholar] [CrossRef] [PubMed]
  2. Curtis, T. Bacterial pathogen removal in wastewater treatment plants. In Handbook of Water and Wastewater Microbiology; Mara, D., Horan, N., Eds.; Academic Press: London, UK, 2003; pp. 477–490. [Google Scholar]
  3. Ghernaout, D. Increasing trends towards drinking water reclamation from treated wastewater. World J. Appl. Chem. 2018, 3, 1–9. [Google Scholar] [CrossRef]
  4. Aghalari, Z.; Dahms, H.U.; Sillanpää, M.; Sosa-Hernandez, J.E.; Parra-Saldívar, R. Effectiveness of wastewater treatment systems in removing microbial agents: A systematic review. Global. Health 2020, 16, 1–11. [Google Scholar]
  5. Thapa, B.; Khatiwada, N.R.; Ghimire, A.; Adhikari, B.; Badaila, R. Study on kinetics of pollutants removal in Guheshwori Wastewater Treatment. J. Water Pollut. Control 2019, 2, 1–7. [Google Scholar]
  6. Shrestha, S.; Haramoto, E.; Shindo, J. Assessing the infection risk of enteropathogens from consumption of raw vegetables washed with contaminated water in Kathmandu Valley, Nepal. J. Appl. Microbiol. 2017, 123, 1321–1334. [Google Scholar] [CrossRef]
  7. Naidoo, S.; Olaniran, A.O. Treated wastewater effluent as a source of microbial pollution of surface water resources. Int. J. Environ. Res. Public Health 2013, 11, 249–270. [Google Scholar] [CrossRef] [Green Version]
  8. Terajima, J.; Izumiya, H.; Hara-Kudo, Y.; Ohnishi, M. Shiga Toxin (Verotoxin)-producing Escherichia coli and Foodborne Disease: A Review. Food Saf. 2017, 5, 35–53. [Google Scholar] [CrossRef] [Green Version]
  9. Pires, S.M.; Majowicz, S.; Gill, A.; Devleesschauwer, B. Global and regional source attribution of shiga toxin-producing Escherichia coli infections using analysis of outbreak surveillance data. Epidemiol. Infect. 2019, 147, 1–9. [Google Scholar] [CrossRef] [Green Version]
  10. Melton-celsa, A.R. Shiga Toxin (Stx) classification, structure, and function. Microbiol. Spectr. 2014, 2, 1–13. [Google Scholar] [CrossRef] [Green Version]
  11. Kaclíková, E.; Pangallo, D.; Oravcová, K.; Drahovská, H.; Kuchta, T. Quantification of Escherichia coli by kinetic 5′-nuclease polymerase chain reaction (real-time PCR) oriented to sfmD gene. Lett. Appl. Microbiol. 2005, 41, 132–135. [Google Scholar] [CrossRef]
  12. Sandhu, K.S.; Gyles, C.L. Pathogenic Shiga toxin-producing Escherichia coli in the intestine of calves. Can. J. Vet. Res. 2002, 66, 65–72. [Google Scholar] [PubMed]
  13. Gyles, C.L. Shiga toxin-producing Escherichia coli: An overview. J. Anim. Sci. 2007, 85, E45–E62. [Google Scholar] [CrossRef] [PubMed]
  14. Thorpe, C.M. Shiga toxin-producing Escherichia coli infection. Clin. Infect. Dis. 2004, 38, 1298–1303. [Google Scholar] [CrossRef] [PubMed] [Green Version]
  15. McGowan, K.L.; Wickersham, E.; Strockbine, N.A. Escherichia coli O157:H7 from water. Lancet 1989, 333, 967–968. [Google Scholar] [CrossRef]
  16. Olsen, S.J.; Miller, G.; Breuer, T.; Kennedy, M.; Higgins, C.; Walford, J.; McKee, G.; Fox, K.; Bibb, W.; Mead, P. A waterborne outbreak of Escherichia coli O157:H7 infections and hemolytic uremic syndrome: Implications for rural water systems. Emerg. Infect. Dis. 2002, 8, 370–375. [Google Scholar] [CrossRef] [Green Version]
  17. Park, J.; Kim, J.S.; Kim, S.; Shin, E.; Oh, K.H.; Kim, Y.; Kim, C.H.; Hwang, M.A.; Jin, C.M.; Na, K.; et al. A waterborne outbreak of multiple diarrhoeagenic Escherichia coli infections associated with drinking water at a school camp. Int. J. Infect. Dis. 2018, 66, 45–50. [Google Scholar] [CrossRef] [Green Version]
  18. Swerdlow, D.L.; Woodruff, B.A.; Brady, R.C.; Griffin, P.M.; Tippen, S.; Donnell, H.D.; Geldreich, E.; Payne, B.J.; Meyer, A.; Wells, J.G.; et al. A waterborne outbreak in Missouri of Escherichia coli O157:H7 associated with bloody diarrhea and death. Ann. Intern. Med. 1992, 117, 812–819. [Google Scholar] [CrossRef]
  19. Keene, W.E.; McAnulty, J.M.; Hoesly, F.C.; Williams, P., Jr.; Hedberg, K.; Oxman, G.L.; Barrett, T.J.; Pfaller, M.A.; Fleming, D.W. A swimming-associated outbreak of hemorrhagic colitis caused by Escherichia coli 157:H7 and Shigella sonnei. N. Engl. J. Med. 1994, 331, 579–584. [Google Scholar] [CrossRef]
  20. Etcheverría, A.I.; Padola, N.L. Shiga toxin-producing Escherichia coli: Factors involved in virulence and cattle colonization. Virulence 2013, 4, 366–372. [Google Scholar] [CrossRef] [Green Version]
  21. Loukiadis, E.; Kérourédan, M.; Beutin, L.; Oswald, E.; Brugère, H. Characterization of Shiga toxin gene (stx)-positive and intimin gene (eae)-positive Escherichia coli isolates from wastewater of slaughterhouses in France. Appl. Environ. Microbiol. 2006, 72, 3245–3251. [Google Scholar] [CrossRef] [Green Version]
  22. Numberger, D.; Ganzert, L.; Zoccarato, L.; Mühldorfer, K.; Sauer, S.; Grossart, H.P.; Greenwood, A.D. Characterization of bacterial communities in wastewater with enhanced taxonomic resolution by full-length 16S rRNA sequencing. Sci. Rep. 2019, 9, 1–14. [Google Scholar] [CrossRef] [PubMed] [Green Version]
  23. Sthapit, N.; Malla, B.; Ghaju Shrestha, R.; Tandukar, S.; Sherchand, J.B.; Haramoto, E.; Kazama, F. Investigation of Shiga toxin-producing Escherichia coli in groundwater, river water, and fecal sources in the Kathmandu Valley, Nepal. Water. Air. Soil Pollut 2020, 231, 557. [Google Scholar] [CrossRef]
  24. Shrestha, S.; Aihara, Y.; Bhattarai, A.P.; Bista, N.; Rajbhandari, S.; Kondo, N.; Kazama, F.; Nishida, K.; Shindo, J. Dynamics of domestic water consumption in the urban area of the Kathmandu Valley: Situation analysis pre and post 2015 Gorkha Earthquake. Water 2017, 9, 222. [Google Scholar] [CrossRef] [Green Version]
  25. Jha, A.K.; Bajracharya, T.R. Wastewater treatment technologies in Nepal. In Proceedings of the IOE Graduate Conference, Kathmandu, Nepal, 15 July 2014. [Google Scholar]
  26. van Elsas, J.D.; Bailey, M.J. The ecology of transfer of mobile genetic elements. FEMS Microbiol. Ecol. 2002, 42, 187–197. [Google Scholar] [CrossRef]
  27. Bielaszewska, M.; Mellmann, A.; Zhang, W.; Köck, R.; Fruth, A.; Bauwens, A.; Peters, G.; Karch, H. Characterisation of the Escherichia coli strain associated with an outbreak of haemolytic uraemic syndrome in Germany, 2011: A microbiological study. Lancet Infect. Dis. 2011, 11, 671–676. [Google Scholar] [CrossRef] [Green Version]
  28. Reid, S.D.; Herbelin, C.J.; Bumbaugh, A.C.; Selander, R.K.; Whittam, T.S. Parallel evolution of virulence in pathogenic Escherichia coli. Nature 2000, 406, 64–67. [Google Scholar] [CrossRef]
  29. Ayaz, N.D.; Gencay, Y.E.; Erol, I. Prevalence and molecular characterization of sorbitol fermenting and non-fermenting Escherichia coli O157:H7+/H7- isolated from cattle at slaughterhouse and slaughterhouse wastewater. Int. J. Food Microbiol. 2014, 174, 31–38. [Google Scholar] [CrossRef]
  30. Yang, K.; Pagaling, E.; Yan, T. Estimating the prevalence of potential enteropathogenic Escherichia coli and intimin gene diversity in a human community by monitoring sanitary sewage. Appl. Environ. Microbiol. 2014, 80, 119–127. [Google Scholar] [CrossRef] [Green Version]
  31. Frigon, D.; Biswal, B.K.; Mazza, A.; Masson, L.; Gehr, R. Biological and physicochemical wastewater treatment processes reduce the prevalence of virulent Escherichia coli. Appl. Environ. Microbiol. 2013, 79, 835–844. [Google Scholar] [CrossRef] [Green Version]
  32. Tandukar, S.; Ghaju Shrestha, R.; Malla, B.; Sthapit, N.; Sherchand, J.B.; Sherchan, S.P.; Haramoto, E. Virus reduction at wastewater treatment plants in Nepal. Environ. Challenges 2021, 5, 100281. [Google Scholar] [CrossRef]
  33. Gautam, B.; Rajbhanshi, A.; Adhikari, R. Bacterial load reduction after primary and secondary treatment in Guheswori sewage treatment plant, Kathmandu, Nepal. J. Coll. Med. Sci. 2019, 15, 40–44. [Google Scholar]
  34. Pantha, K.; Acharya, K.; Mohapatra, S.; Khanal, S.; Amatya, N.; Ospina-Betancourth, C.; Butte, G.; Shrestha, S.D.; Rajbhandari, P.; Werner, D. Faecal pollution source tracking in the holy Bagmati River by portable 16S rRNA gene sequencing. NPJ Clean Water 2021, 4, 1–10. [Google Scholar] [CrossRef]
  35. Dashti, A.A.; Jadaon, M.M.; Abdulsamad, A.M.; Dashti, H.M. Heat treatment of bacteria: A simple method of DNA extraction for molecular techniques. Kuwait Med. J. 2009, 41, 117–122. [Google Scholar]
  36. Junior, J.C.R.; Tamanini, R.; Soares, B.F.; de Oliveira, A.M.; Silva, F.d.G.; da Silva, F.F.; Augusto, N.A.; Beloti, V. Efficiency of boiling and four other methods for genomic DNA extraction of deteriorating spore-forming bacteria from milk. Semin. Agric. Sci. 2016, 37, 3069–3078. [Google Scholar]
  37. Kathmandu Upatyaka Khanepani Limited NEP: Kathmandu Valley Wastewater Management Project 2013. Available online: https://www.adb.org/projects/documents/kathmandu-valley-wastewater-management-project-iee (accessed on 15 December 2021).
  38. Ghaju Shrestha, R.; Tanaka, Y.; Malla, B.; Bhandari, D.; Tandukar, S.; Inoue, D.; Sei, K.; Sherchand, J.B.; Haramoto, E. Next-generation sequencing identification of pathogenic bacterial genes and their relationship with fecal indicator bacteria in different water sources in the Kathmandu Valley, Nepal. Sci. Total Environ. 2017, 601, 278–284. [Google Scholar] [CrossRef] [PubMed]
  39. Malla, B.; Ghaju Shrestha, R.; Tandukar, S.; Sherchand, J.B.; Haramoto, E. Performance Evaluation of Human-Specific Viral Markers and Application of Pepper Mild Mottle Virus and CrAssphage to Environmental Water Samples as Fecal Pollution Markers in the Kathmandu Valley, Nepal. Food Environ. Virol. 2019, 11, 274–287. [Google Scholar] [CrossRef] [PubMed]
  40. Malla, B.; Ghaju Shrestha, R.; Tandukar, S.; Bhandari, D.; Inoue, D.; Sei, K.; Tanaka, Y.; Sherchand, J.B.; Haramoto, E. Validation of host-specific Bacteroidales quantitative PCR assays and their application to microbial source tracking of drinking water sources in the Kathmandu Valley, Nepal. J. Appl. Microbiol. 2018, 125, 609–619. [Google Scholar] [CrossRef]
  41. Malla, B.; Shrestha, R.G.; Tandukar, S.; Bhandari, D.; Inoue, D.; Sei, K.; Tanaka, Y.; Sherchand, J.B.; Haramoto, E. Identification of human and animal fecal contamination in drinking water sources in the Kathmandu Valley, Nepal, using host-associated Bacteroidales Quantitative PCR Assays. Water 2018, 10, 1796. [Google Scholar] [CrossRef] [Green Version]
  42. Perelle, S.; Dilasser, F.; Grout, J.; Fach, P. Detection by 5′-nuclease PCR of Shiga-toxin producing Escherichia coli O26, O55, O91, O103, O111, O113, O145 and O157:H7, associated with the world’s most frequent clinical cases. Mol. Cell. Probes 2004, 18, 185–192. [Google Scholar] [CrossRef]
  43. Yamagishi, J.; Sato, Y.; Shinozaki, N.; Ye, B.; Tsuboi, A.; Nagasaki, M.; Yamashita, R. Comparison of boiling and robotics automation method in DNA extraction for metagenomic sequencing of human oral microbes. PLoS ONE 2016, 11, 1–15. [Google Scholar] [CrossRef] [Green Version]
  44. Dimitrakopoulou, M.-E.; Stavrou, V.; Kotsalou, C.; Vantarakis, A. Boiling extraction method vs commercial kits for bacterial DNA isolation from food samples. J. Food Sci. Nutr. Res. 2020, 03, 311–319. [Google Scholar] [CrossRef]
  45. Peng, X.; Yu, K.Q.; Deng, G.H.; Jiang, Y.X.; Wang, Y.; Zhang, G.X.; Zhou, H.W. Comparison of direct boiling method with commercial kits for extracting fecal microbiome DNA by Illumina sequencing of 16S rRNA tags. J. Microbiol. Methods 2013, 95, 455–462. [Google Scholar] [CrossRef] [PubMed]
  46. García-Aljaro, C.; Muniesa, M.; Blanco, J.E.; Blanco, M.; Blanco, J.; Jofre, J.; Blanch, A.R. Characterization of Shiga toxin-producing Escherichia coli isolated from aquatic environments. FEMS Microbiol. Lett. 2005, 246, 55–65. [Google Scholar] [CrossRef] [Green Version]
  47. Osińska, A.; Korzeniewska, E.; Harnisz, M.; Niestępski, S. The prevalence of virulence genes specific for Escherichia coli in wastewater samples from wastewater treatment plants with the activated sludge process. In Proceedings of the 10th Conference on Interdisciplinary Problems in Environmental Protection and Engineering EKO-DOK 2018, Online, 16–18 April 2018. [Google Scholar]
  48. Razzolini, M.T.P.; dos Santos, F.A.; Matte, M.H.; Matte, G.R.; Gunther, W.M.R. Occurrence of Escherichia coli O157 in raw and treated domestic sewage stabilization ponds with potential reuse in agricultural irrigation.; XXVIII Inter-American Congress of Sanitary and Environmental Engineering: Cancun, Mexico, 2002; pp. 1–3. [Google Scholar]
  49. Ahmed, W.; Gyawali, P.; Toze, S. Quantitative PCR measurements of Escherichia coli including Shiga toxin-producing E. coli (STEC) in animal feces and environmental waters. Environ. Sci. Technol. 2015, 49, 3084–3090. [Google Scholar] [CrossRef] [PubMed]
  50. Dumke, R.; Schröter-Bobsin, U.; Jacobs, E.; Röske, I. Detection of phages carrying the Shiga toxin 1 and 2 genes in waste water and river water samples. Lett. Appl. Microbiol. 2006, 42, 48–53. [Google Scholar] [CrossRef] [PubMed]
  51. Grau-Leal, F.; Quirós, P.; Martínez-Castillo, A.; Muniesa, M. Free Shiga toxin 1-encoding bacteriophages are less prevalent than Shiga toxin 2 phages in extraintestinal environments. Environ. Microbiol. 2015, 17, 4790–4801. [Google Scholar] [CrossRef] [PubMed]
  52. Shimizu, T.; Ohta, Y.; Noda, M. Shiga toxin 2 is specifically released from bacterial cells by two different mechanisms. Infect. Immun. 2009, 77, 2813–2823. [Google Scholar] [CrossRef] [Green Version]
  53. Karmali, M.A. Emerging public health challenges of Shiga toxin-producing Escherichia coli related to changes in the pathogen, the population, and the environment. Clin. Infect. Dis. 2017, 64, 371–376. [Google Scholar]
  54. Allison, H.E. Stx-phages: Drivers and mediators of the evolution of STEC and STEC-like pathogens. Future Microbiol. 2007, 2, 165–174. [Google Scholar] [CrossRef]
  55. Oakley, S.; Mihelcic, J. Pathogen reduction and survival in complete treatment works. In Global Water Pathogen Project; Part 4 Management of Risk from Excreta and Wastewater; Rose, J.B., Jiménez-Cisneros, B., Mihelcic, J.R., Verbyla, M.E., Eds.; Michigan State University: East Lansing, MI, USA; UNESCO: Paris, France, 2019; Available online: http://www.waterpathogens.org/book/pathogen-reduction-and-survival-in-complete-treatment-works (accessed on 15 December 2021). [CrossRef]
  56. García-Aljaro, C.; Ballesté, E.; Muniesa, M.; Jofre, J. Determination of crAssphage in water samples and applicability for tracking human faecal pollution. Microb. Biotechnol. 2017, 10, 1775–1780. [Google Scholar] [CrossRef]
  57. Worley-Morse, T.; Mann, M.; Khunjar, W.; Olabode, L.; Gonzalez, R. Evaluating the fate of bacterial indicators, viral indicators, and viruses in water resource recovery facilities. Water Environ. Res. 2019, 91, 830–842. [Google Scholar] [CrossRef] [PubMed]
  58. Foddai, A.C.G.; Grant, I.R. Methods for detection of viable foodborne pathogens: Current state-of-art and future prospects. Appl. Microbiol. Biotechnol. 2020, 104, 4281–4288. [Google Scholar] [CrossRef] [PubMed] [Green Version]
Figure 1. Log10 reduction values of E. coli genes in the wastewater treatment plants.
Water 14 02224 g001
Table 1. Primer and probe sequences of the qPCR assays used in this study.
AssayFunctionSequence (5′–3′) aReference
sfmDForward primerACTGGAATACTTCGGATTCAGATACGT[11]
Reverse primerATCCCTACAGATTCATTCCACGAAA
TaqMan probeFAM-CAGCAGCTGGGTTGGCATCAGTTATTCG-TAMRA
stx1Forward primerTTTGTYACTGTSACAGCWGAAGCYTTACG[42]
Reverse primerCCCCAGTTCARWGTRAGRTCMACRTC
TaqMan robeFAM-CTGGATGATCTCAGTGGGCGTTCTTATGTAA-TAMRA
stx2Forward primerTTTGTYACTGTSACAGCWGAAGCYTTACG[42]
Reverse primerCCCCAGTTCARWGTRAGRTCMACRTC
TaqMan probeFAM-TCGTCAGGCACTGTCTGAAACTGCTCC-TAMRA
Note: a FAM, 6-carboxyfluorescein; TAMRA, 5-carboxytetramethylrhodamine; Y denotes C or T; S denotes C or G; W denotes A or T; R denotes A or G; M denotes A or C.
Table 2. Detection of E. coli genes in wastewater samples.
Wastewater TypeNo. of Tested SamplessfmDstx1stx2
Direct qPCRCultured qPCRDirect qPCRCultured qPCRDirect qPCRCultured qPCR
No. of Positive Samples (%)Ct (Mean ± SD)No. of Positive Samples (%)Ct (Mean ± SD)No. of Positive Samples (%)Ct (Mean ± SD)No. of Positive Samples (%)Ct (Mean ± SD)No. of Positive Samples (%)Ct (Mean ± SD)No. of Positive Samples (%)Ct (Mean ± SD)
HWW1717 (100)28.3 ± 3.917 (100)22.2 ± 2.16 (35)37.7 ± 0.98 (47)34.9 ± 2.16 (35)37.0 ± 0.99 (53)32.4 ± 3.0
STP42 (50)31.3 ± 0.44 (100)22.1 ± 0.80 (0)NA0 (0)NA0 (0)NA1 (25)36.3
Not-working WWTP55 (100)27.3 ± 2.65 (100)22.7 ± 1.23 (60)38.2 ± 1.25 (100)36.5 ± 2.73 (60)37.5 ± 1.55 (100)35.5 ± 3.1
WWTP A influent66 (100)25.3 ± 0.46 (100)21.7 ± 1.06 (100)36.5 ± 0.96 (100)33.9 ± 1.86 (100)35.5 ± 1.26 (100)31.8 ± 2.2
WWTP A effluent66 (100)30.5 ± 1.66 (100)21.9 ± 0.61 (17)38.8 6 (100)33.5 ± 1.14 (67)38.9 ± 0.36 (100)31.8 ± 1.7
WWTP B influent55 (100)24.9 ± 0.55 (100)21.6 ± 0.85 (100)35.7 ± 0.95 (100)32.9 ± 1.35 (100)34.7 ± 0.95 (100)31.3 ± 2.0
WWTP B effluent55 (100)26.4 ± 2.25 (100)21.5 ± 0.94 (80)36.6 ± 1.35 (100)32.6 ± 1.05 (100)36.0 ± 1.35 (100)31.1 ± 1.6
Total4846 (96)27.6 ± 3.248 (100)22.0 ± 1.525 (52)36.8 ± 1.335 (73)34.1 ± 2.129 (60)36.3 ± 1.737 (77)32.3 ± 2.6
Note: SD, standard deviation; NA, not applicable.
Table 3. Concentrations of E. coli and its genes in wastewater samples.
Wastewater TypeNo. of Tested SamplesColilertsfmDstx1stx2
Conc. (log10 MPN/L) (Mean ± SD)Conc. (log10 Copies/L) (Mean ± SD)Conc. (log10 Copies/L) (Mean ± SD)Conc. (log10 Copies/L) (Mean ± SD)
HWW177.5 ± 1.410.0 ± 1.26.5 ± 0.36.9 ± 0.3
STP46.3 ± 0.89.1 ± 0.1<LOD a<LOD b
Not-working WWTP58.2 ± 0.810.3 ± 0.86.3 ± 0.36.7 ± 0.6
WWTP A Influent68.7 ± 0.2 10.9 ± 0.16.8 ± 0.27.5 ± 0.3
WWTP A Effluent67.3 ± 0.39.2 ± 0.65.2 ± 0.46.1 ± 0.6
WWTP B Influent58.9 ± 0.311.0 ± 0.17.1 ± 0.37.7 ± 0.3
WWTP B Effluent58.6 ± 0.710.5 ± 0.86.5 ± 0.97.3 ± 0.4
Note: MPN, most probable number; SD, standard deviation; LOD, limit of detection; a 6.3 log10 copies/L; b 6.6 log10 copies/L.
Table 4. Ratio of virulent E. coli genes.
Wastewater TypeNo. of Tested SamplesColilert/sfmD Ratio (%)stx1/sfmD Ratio (%)stx2/sfmD Ratio (%)
HWW171.43 ± 2.140.01 ± 0.010.03 ± 0.02
STP40.60 ± 0.78NANA
Not-working WWTP50.90 ± 0.360.004 ± 0.0020.01 ± 0.01
WWTP A Influent60.73 ± 0.360.01 ± 0.010.05 ± 0.03
WWTP A Effluent61.77 ± 1.390.020.15 ± 0.13
WWTP B Influent50.87 ± 0.510.01 ± 0.010.06 ± 0.04
WWTP B Effluent51.17 ± 0.510.01 ± 0.010.09 ± 0.12
Publisher’s Note: MDPI stays neutral with regard to jurisdictional claims in published maps and institutional affiliations.

