
Redefining and Calculating the Pass-through Rate Coefficient of Nonpoint Source Pollutants at Different Spatial Scales

Abstract
:
1. Introduction
2. Materials and Methods
2.1. Study Area
2.2. Data Source
2.3. Methodology
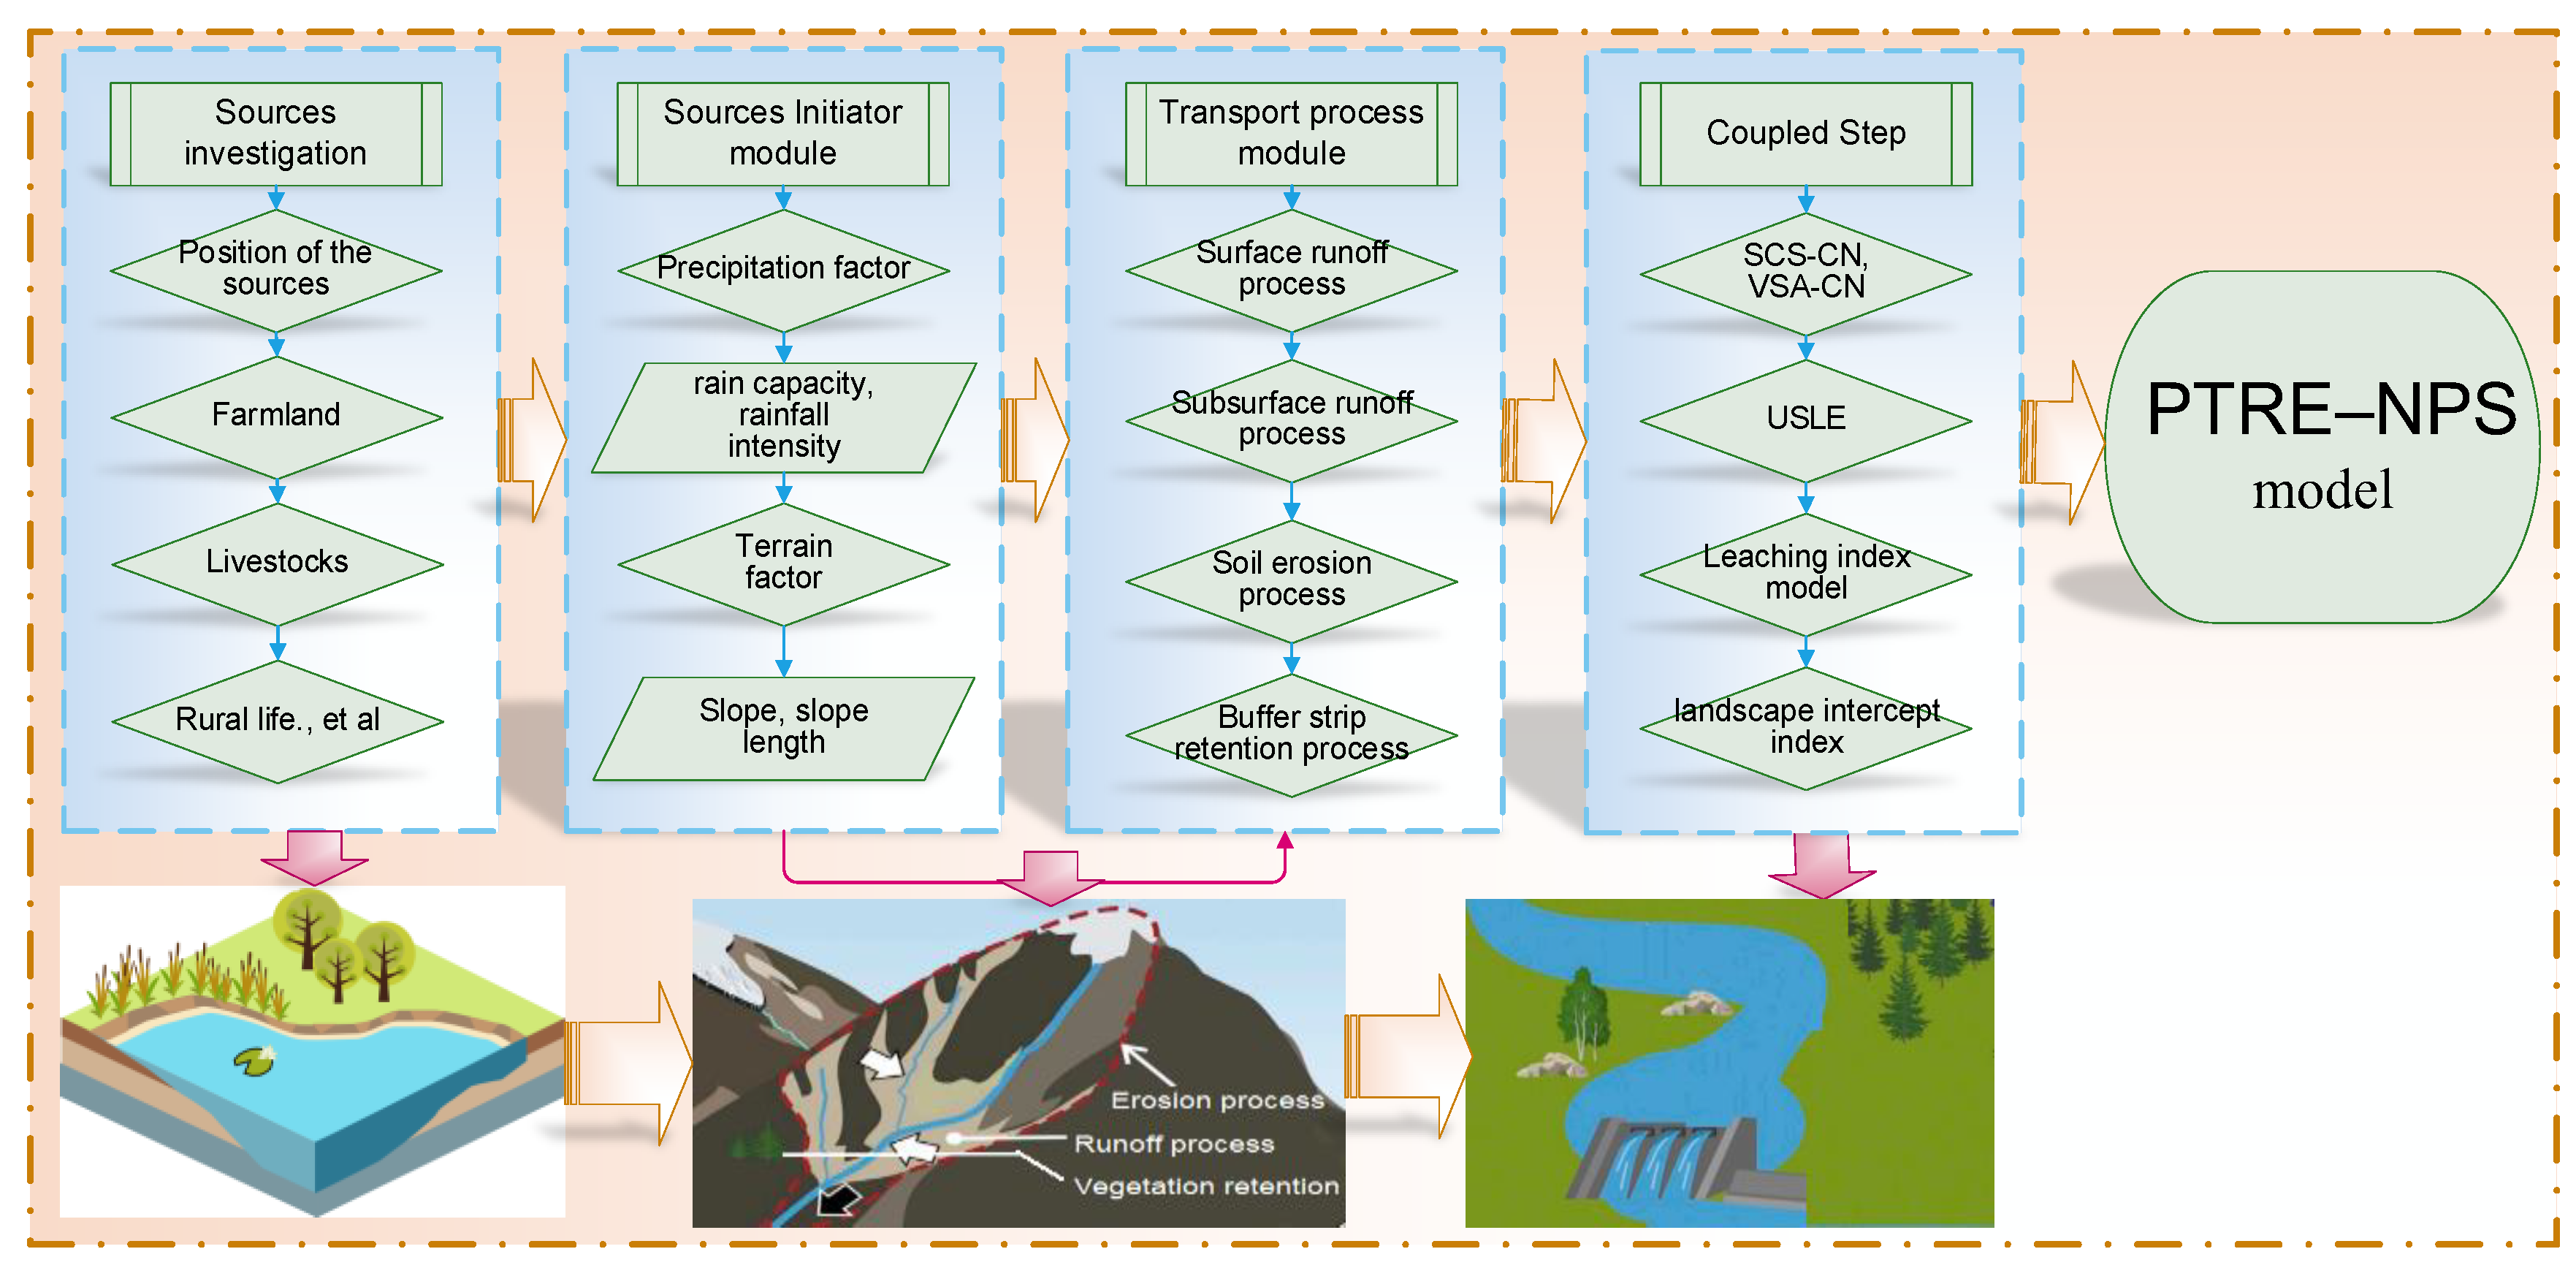
2.3.1. The Sources Initiator Module
2.3.2. The Transport Process Modules
3. Results and Discussion
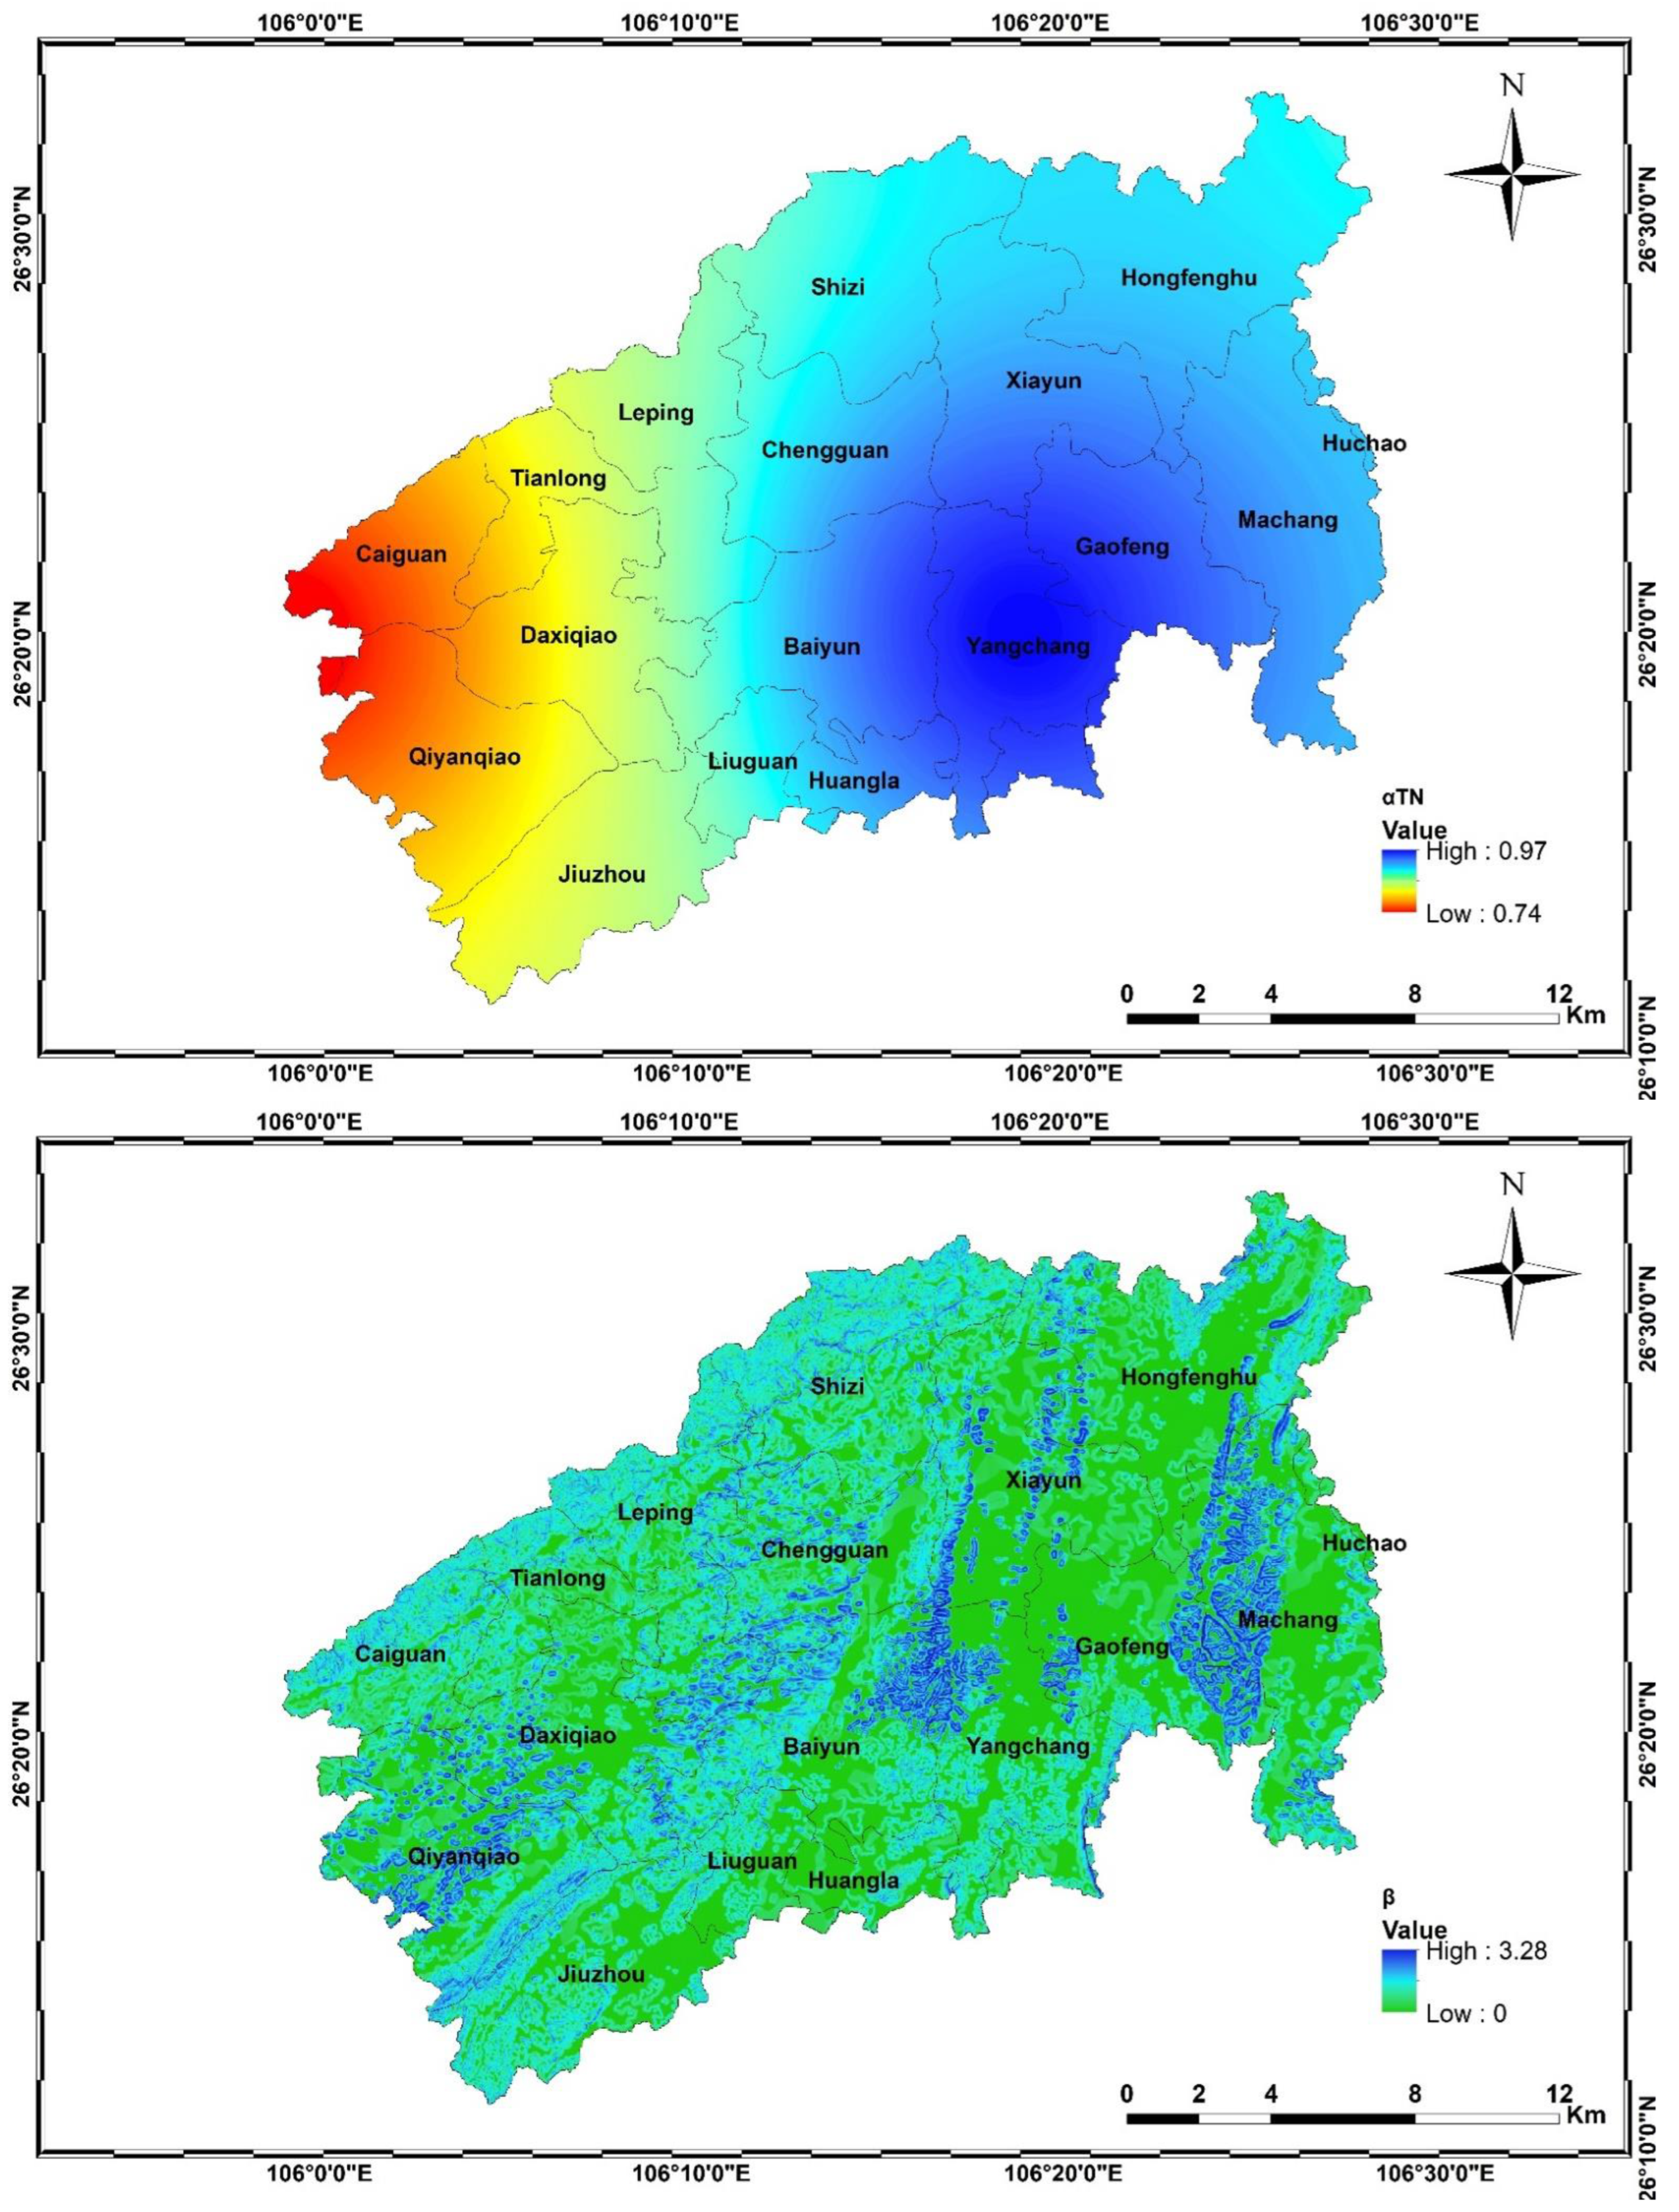
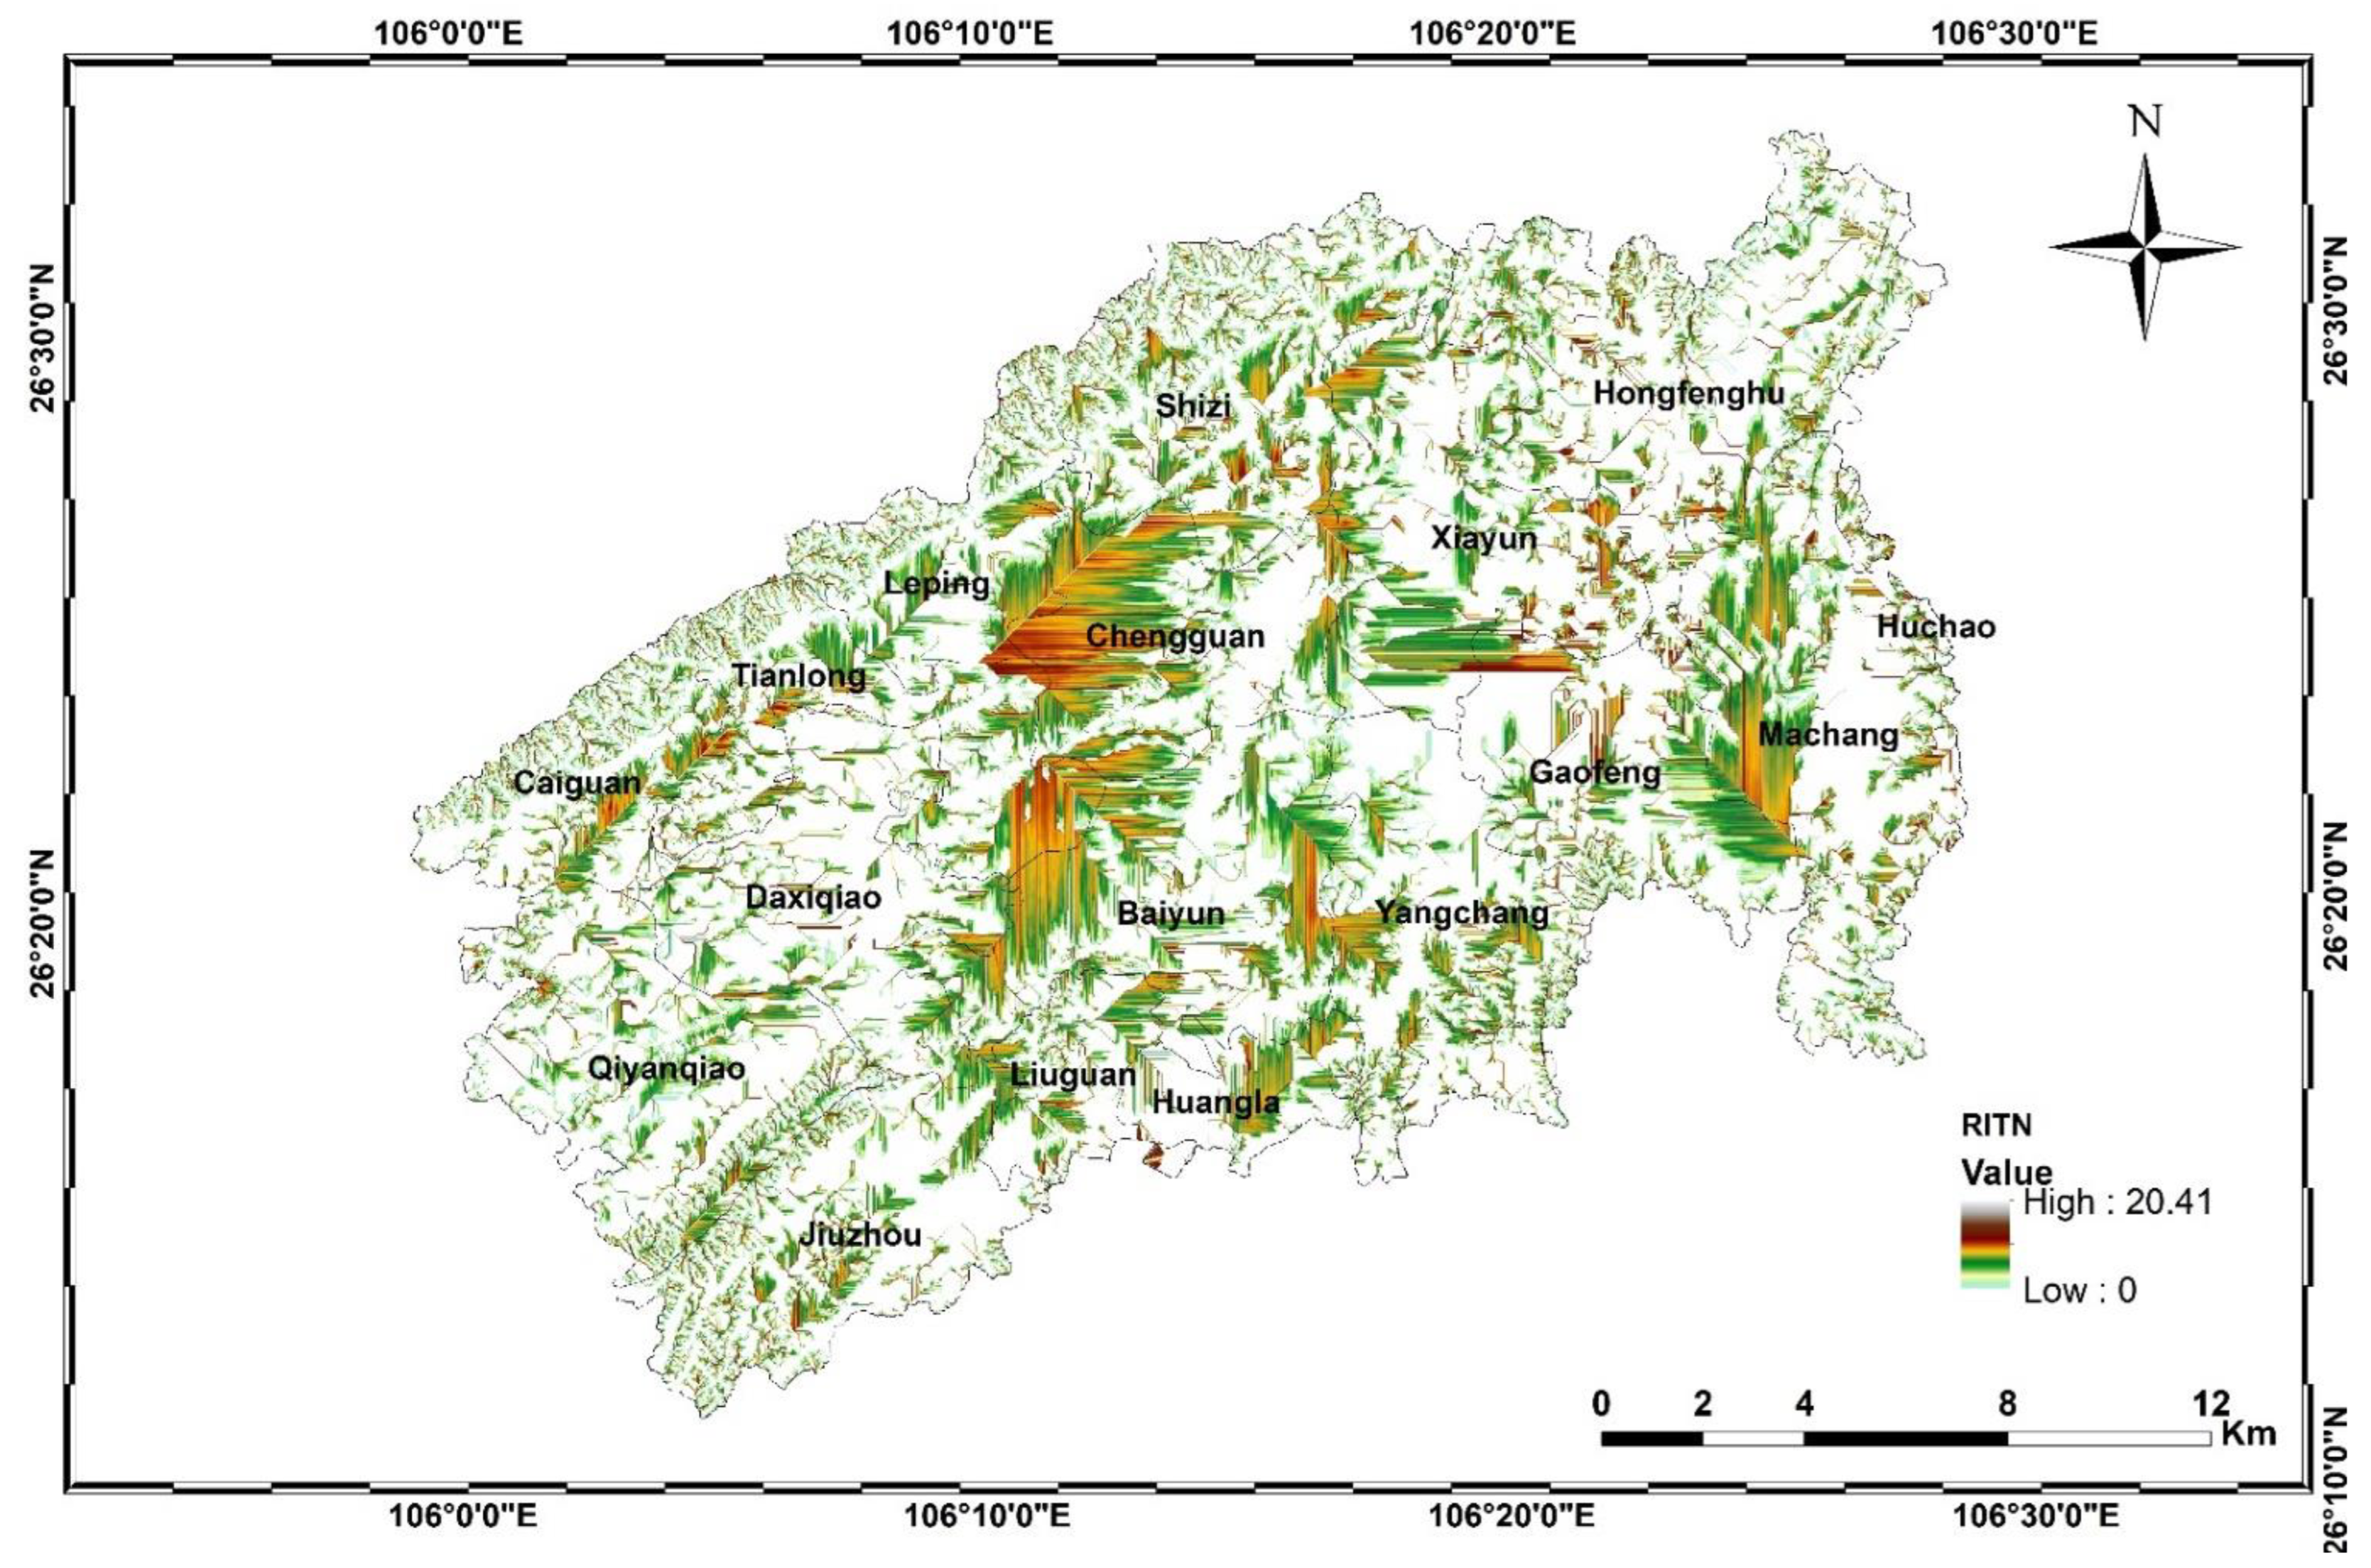
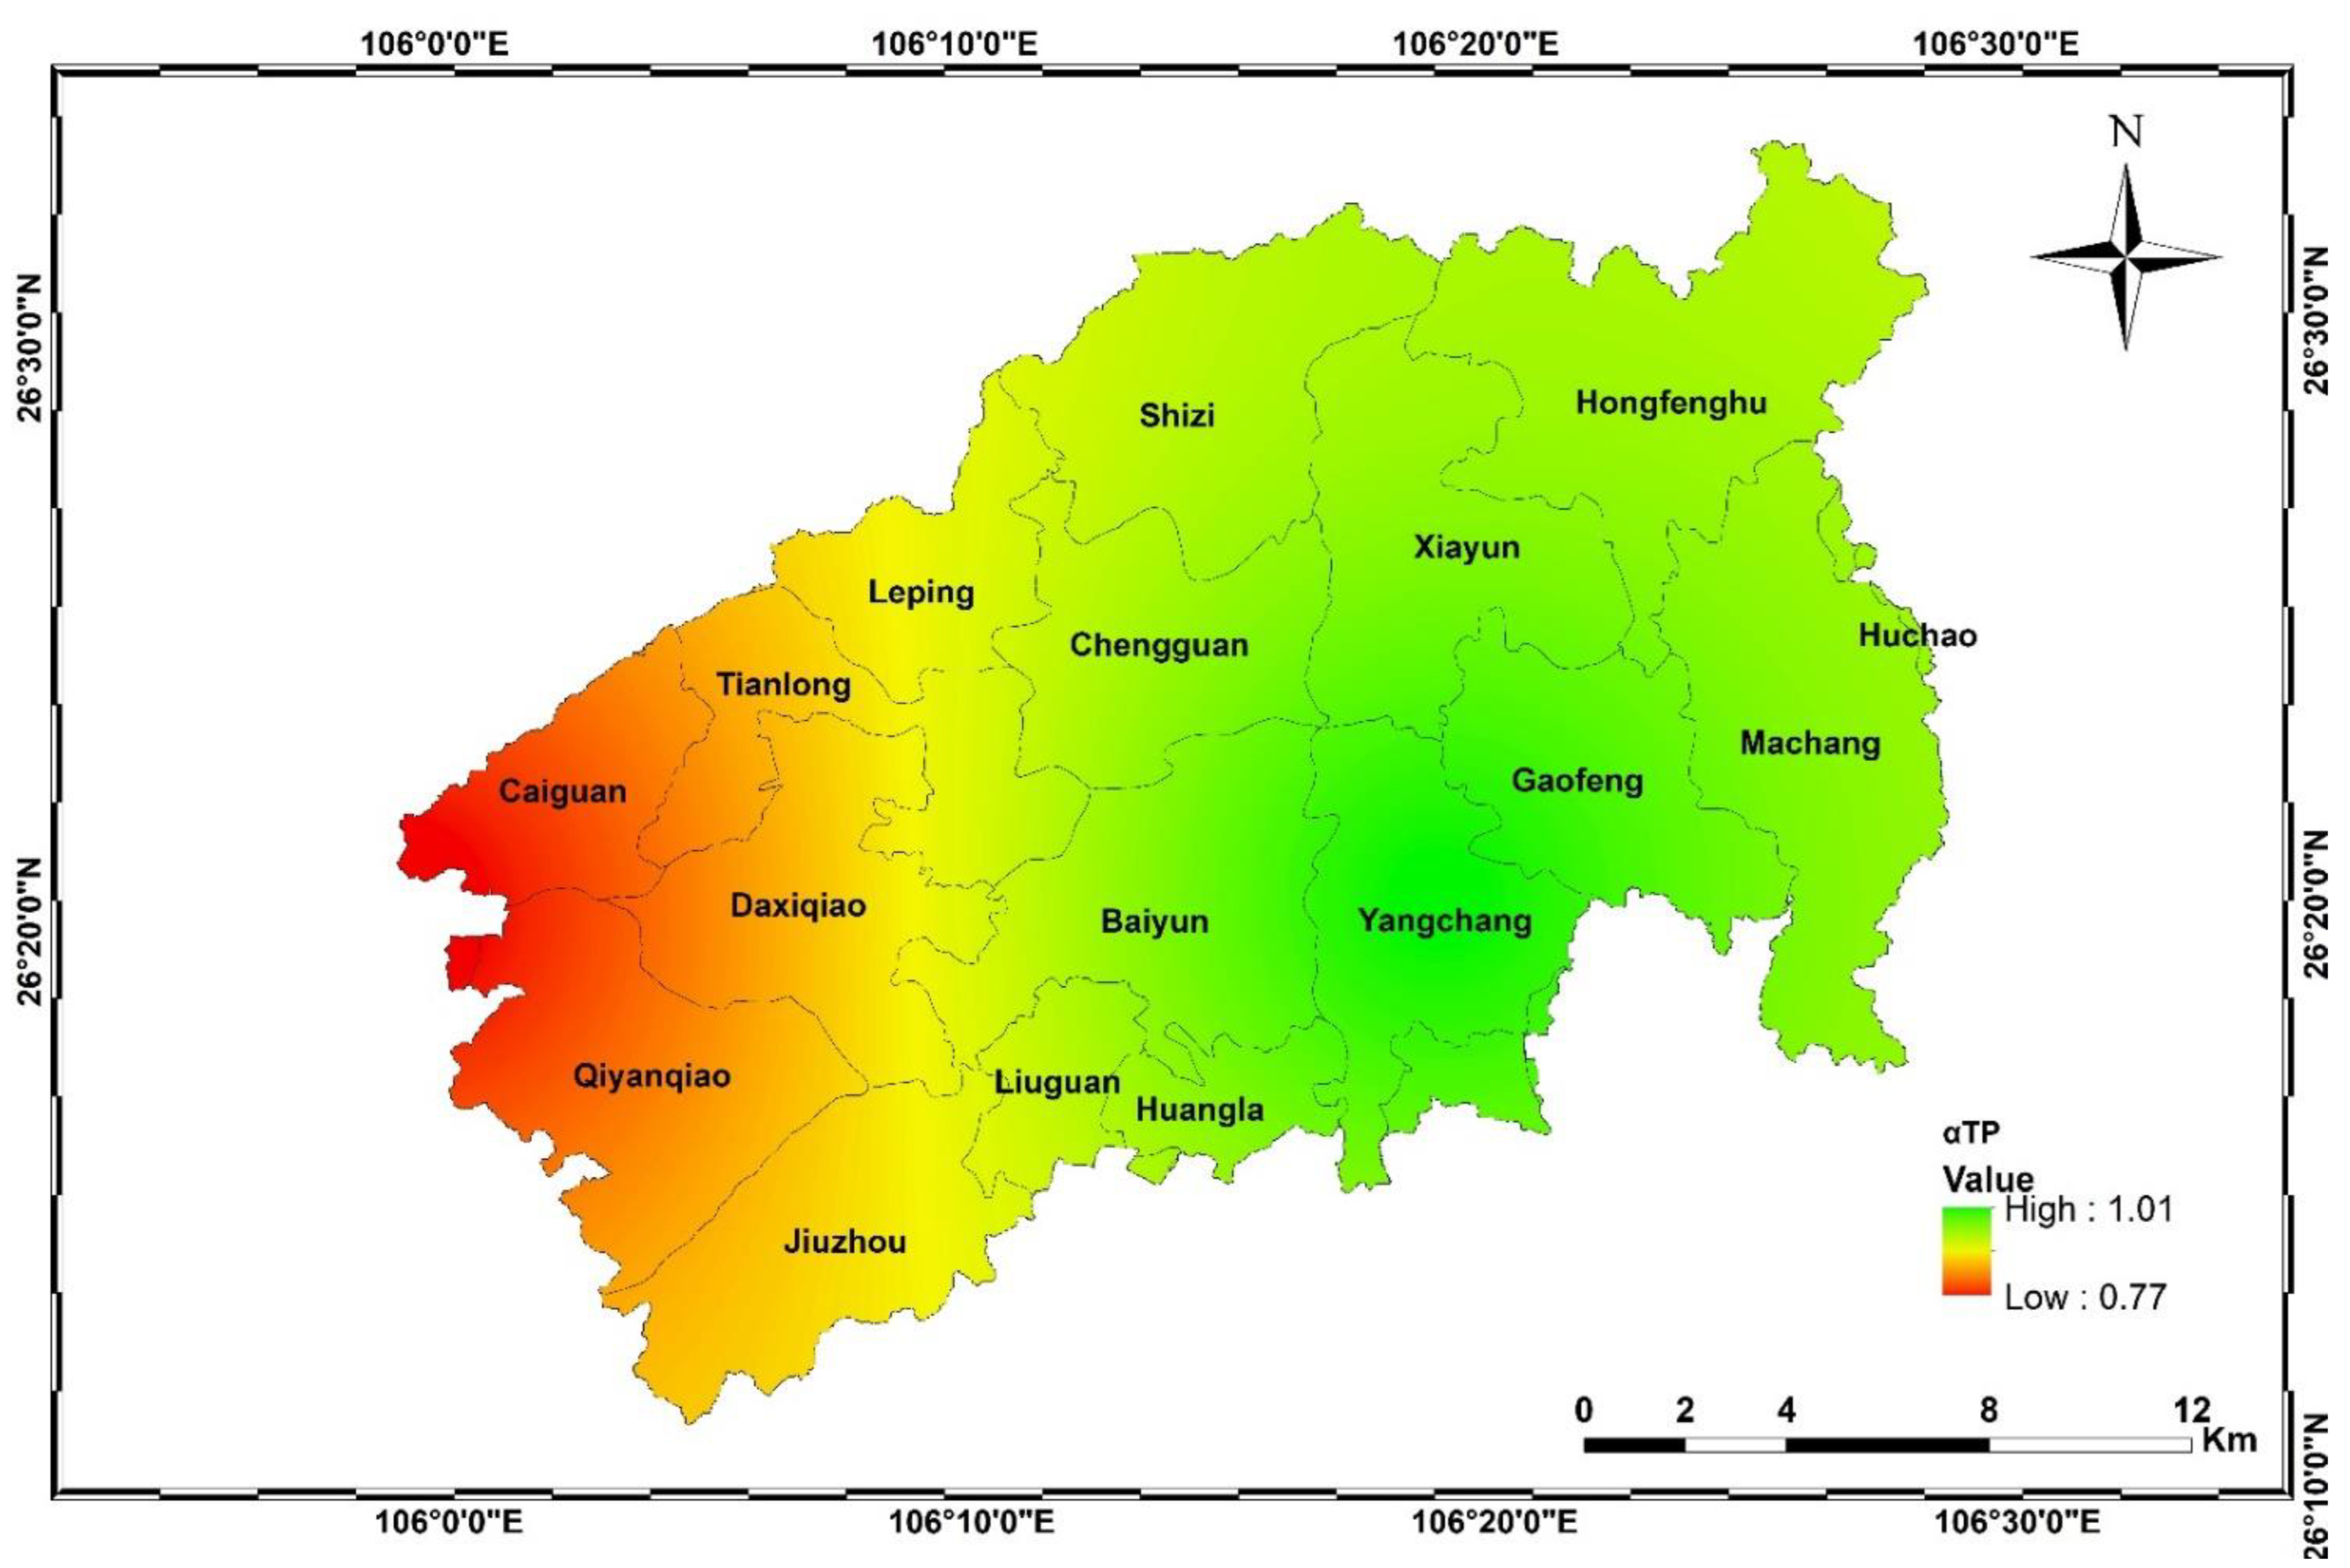
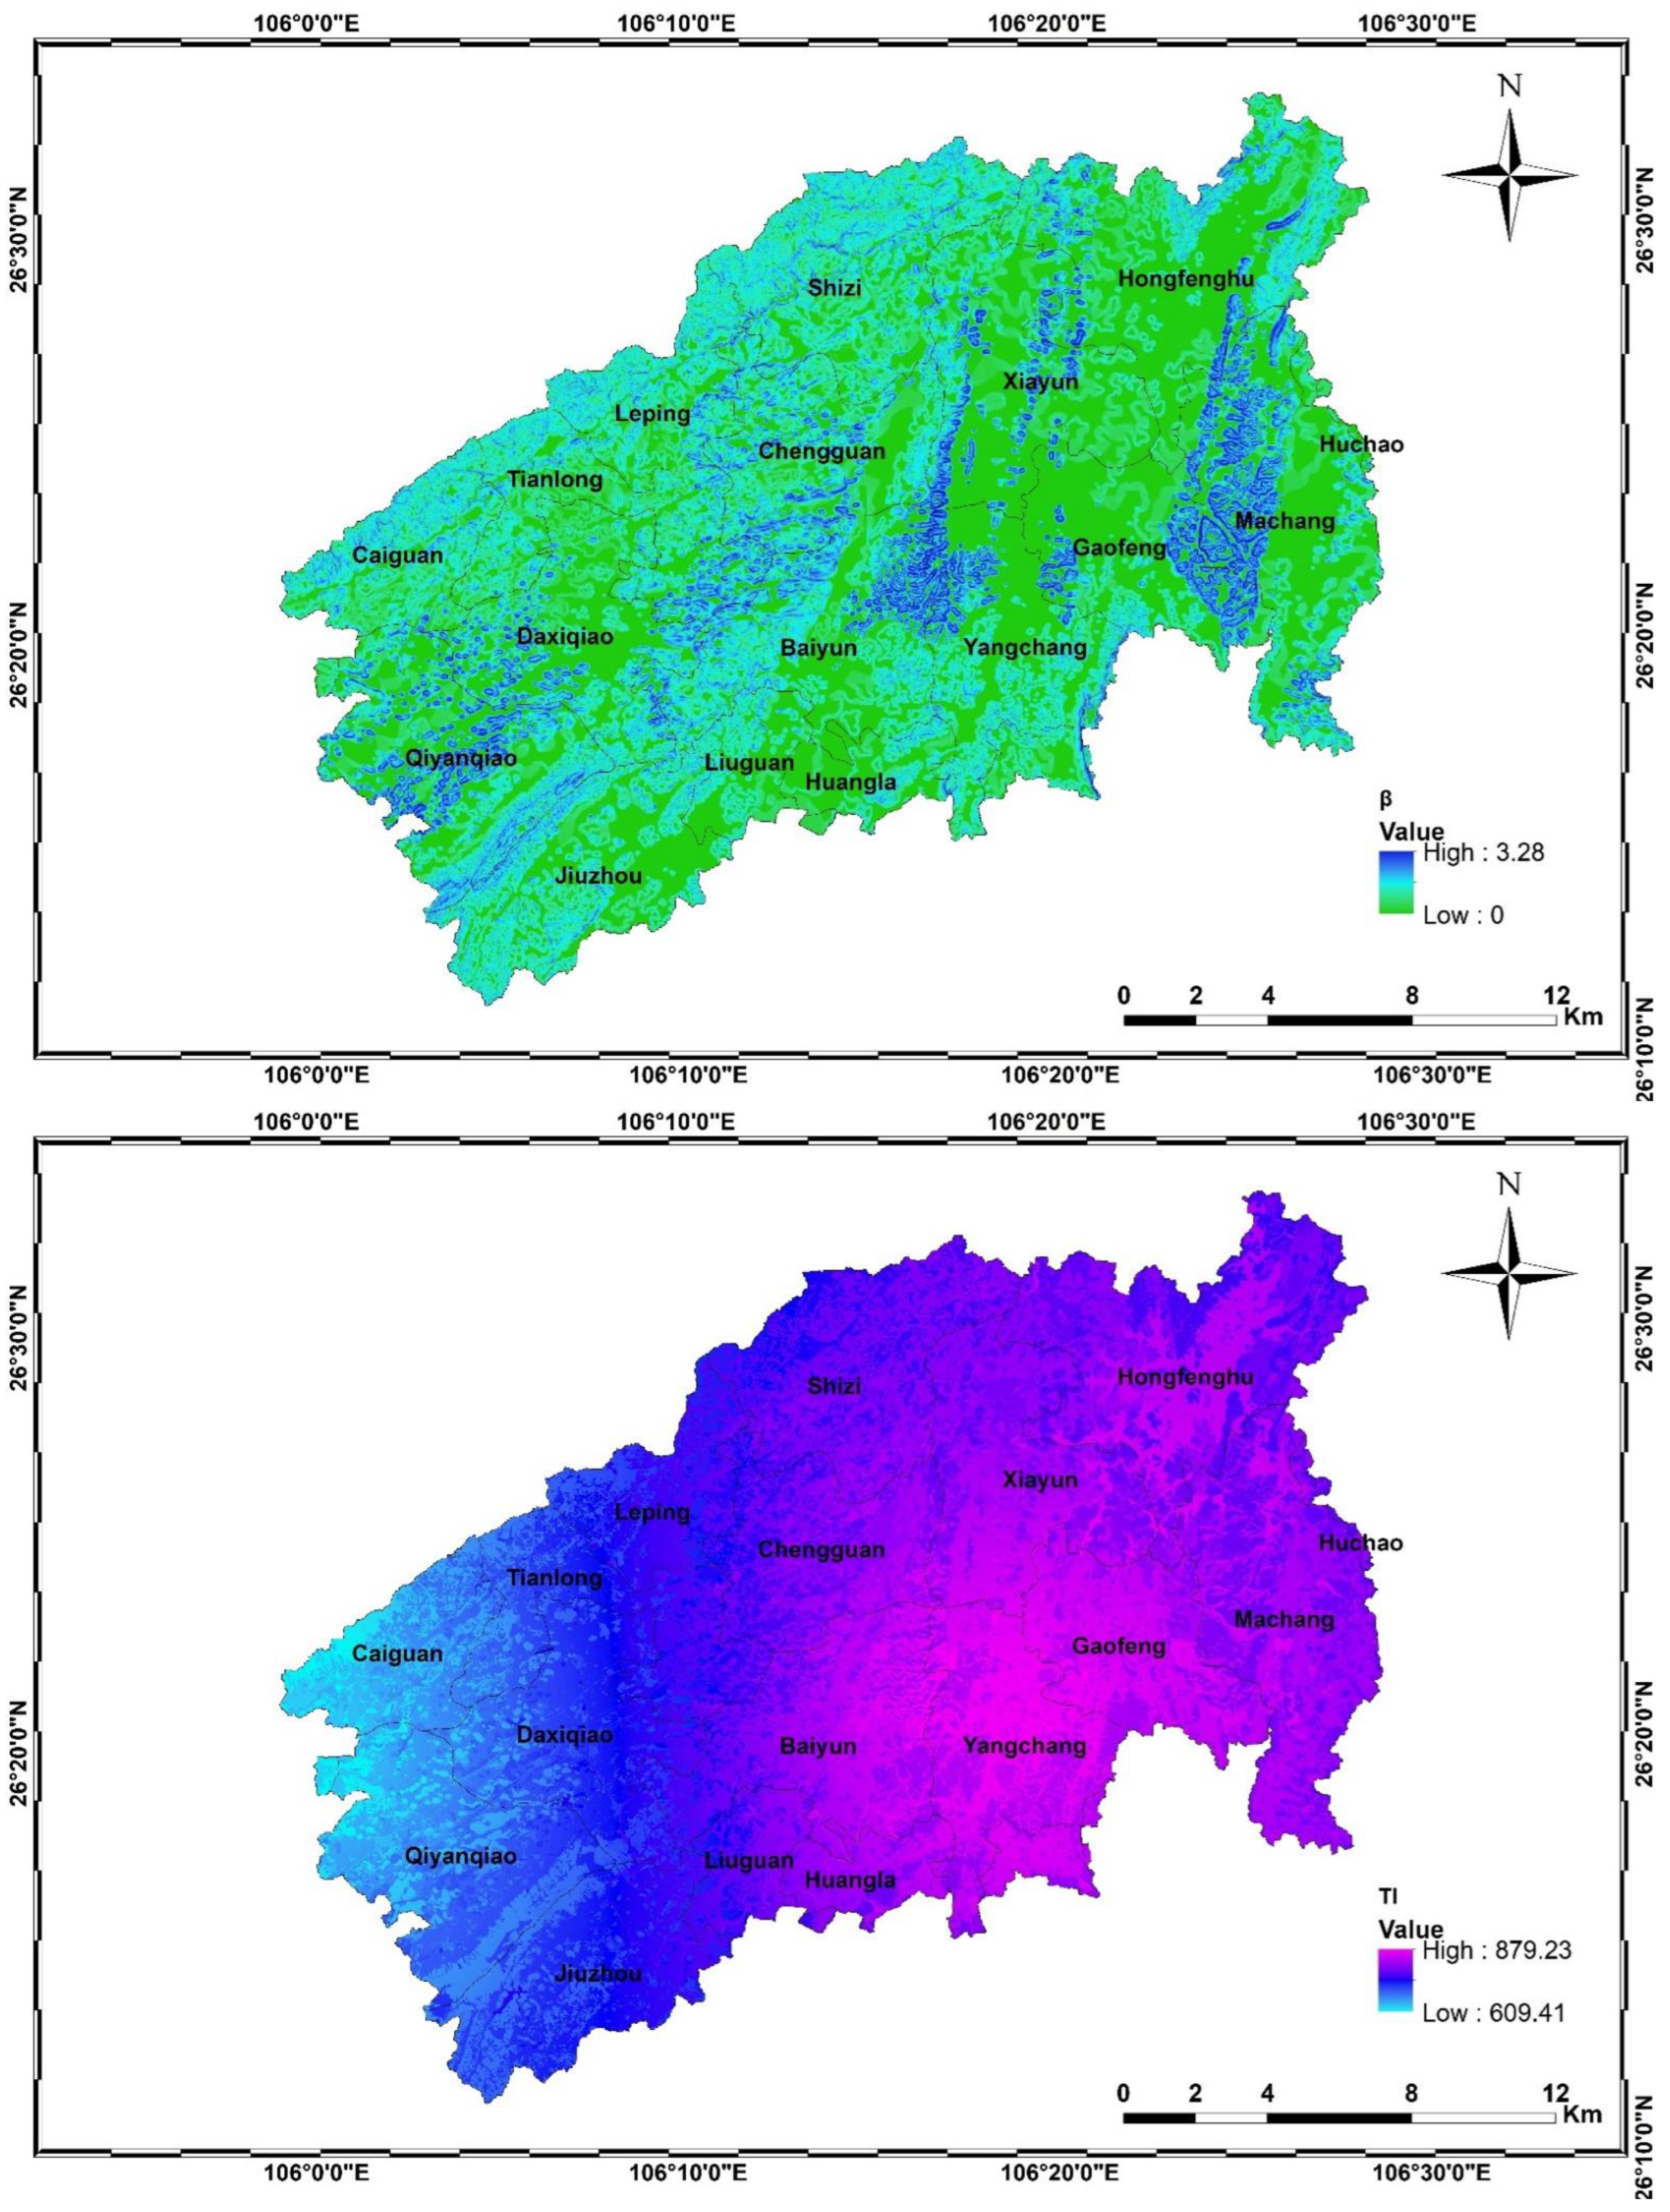
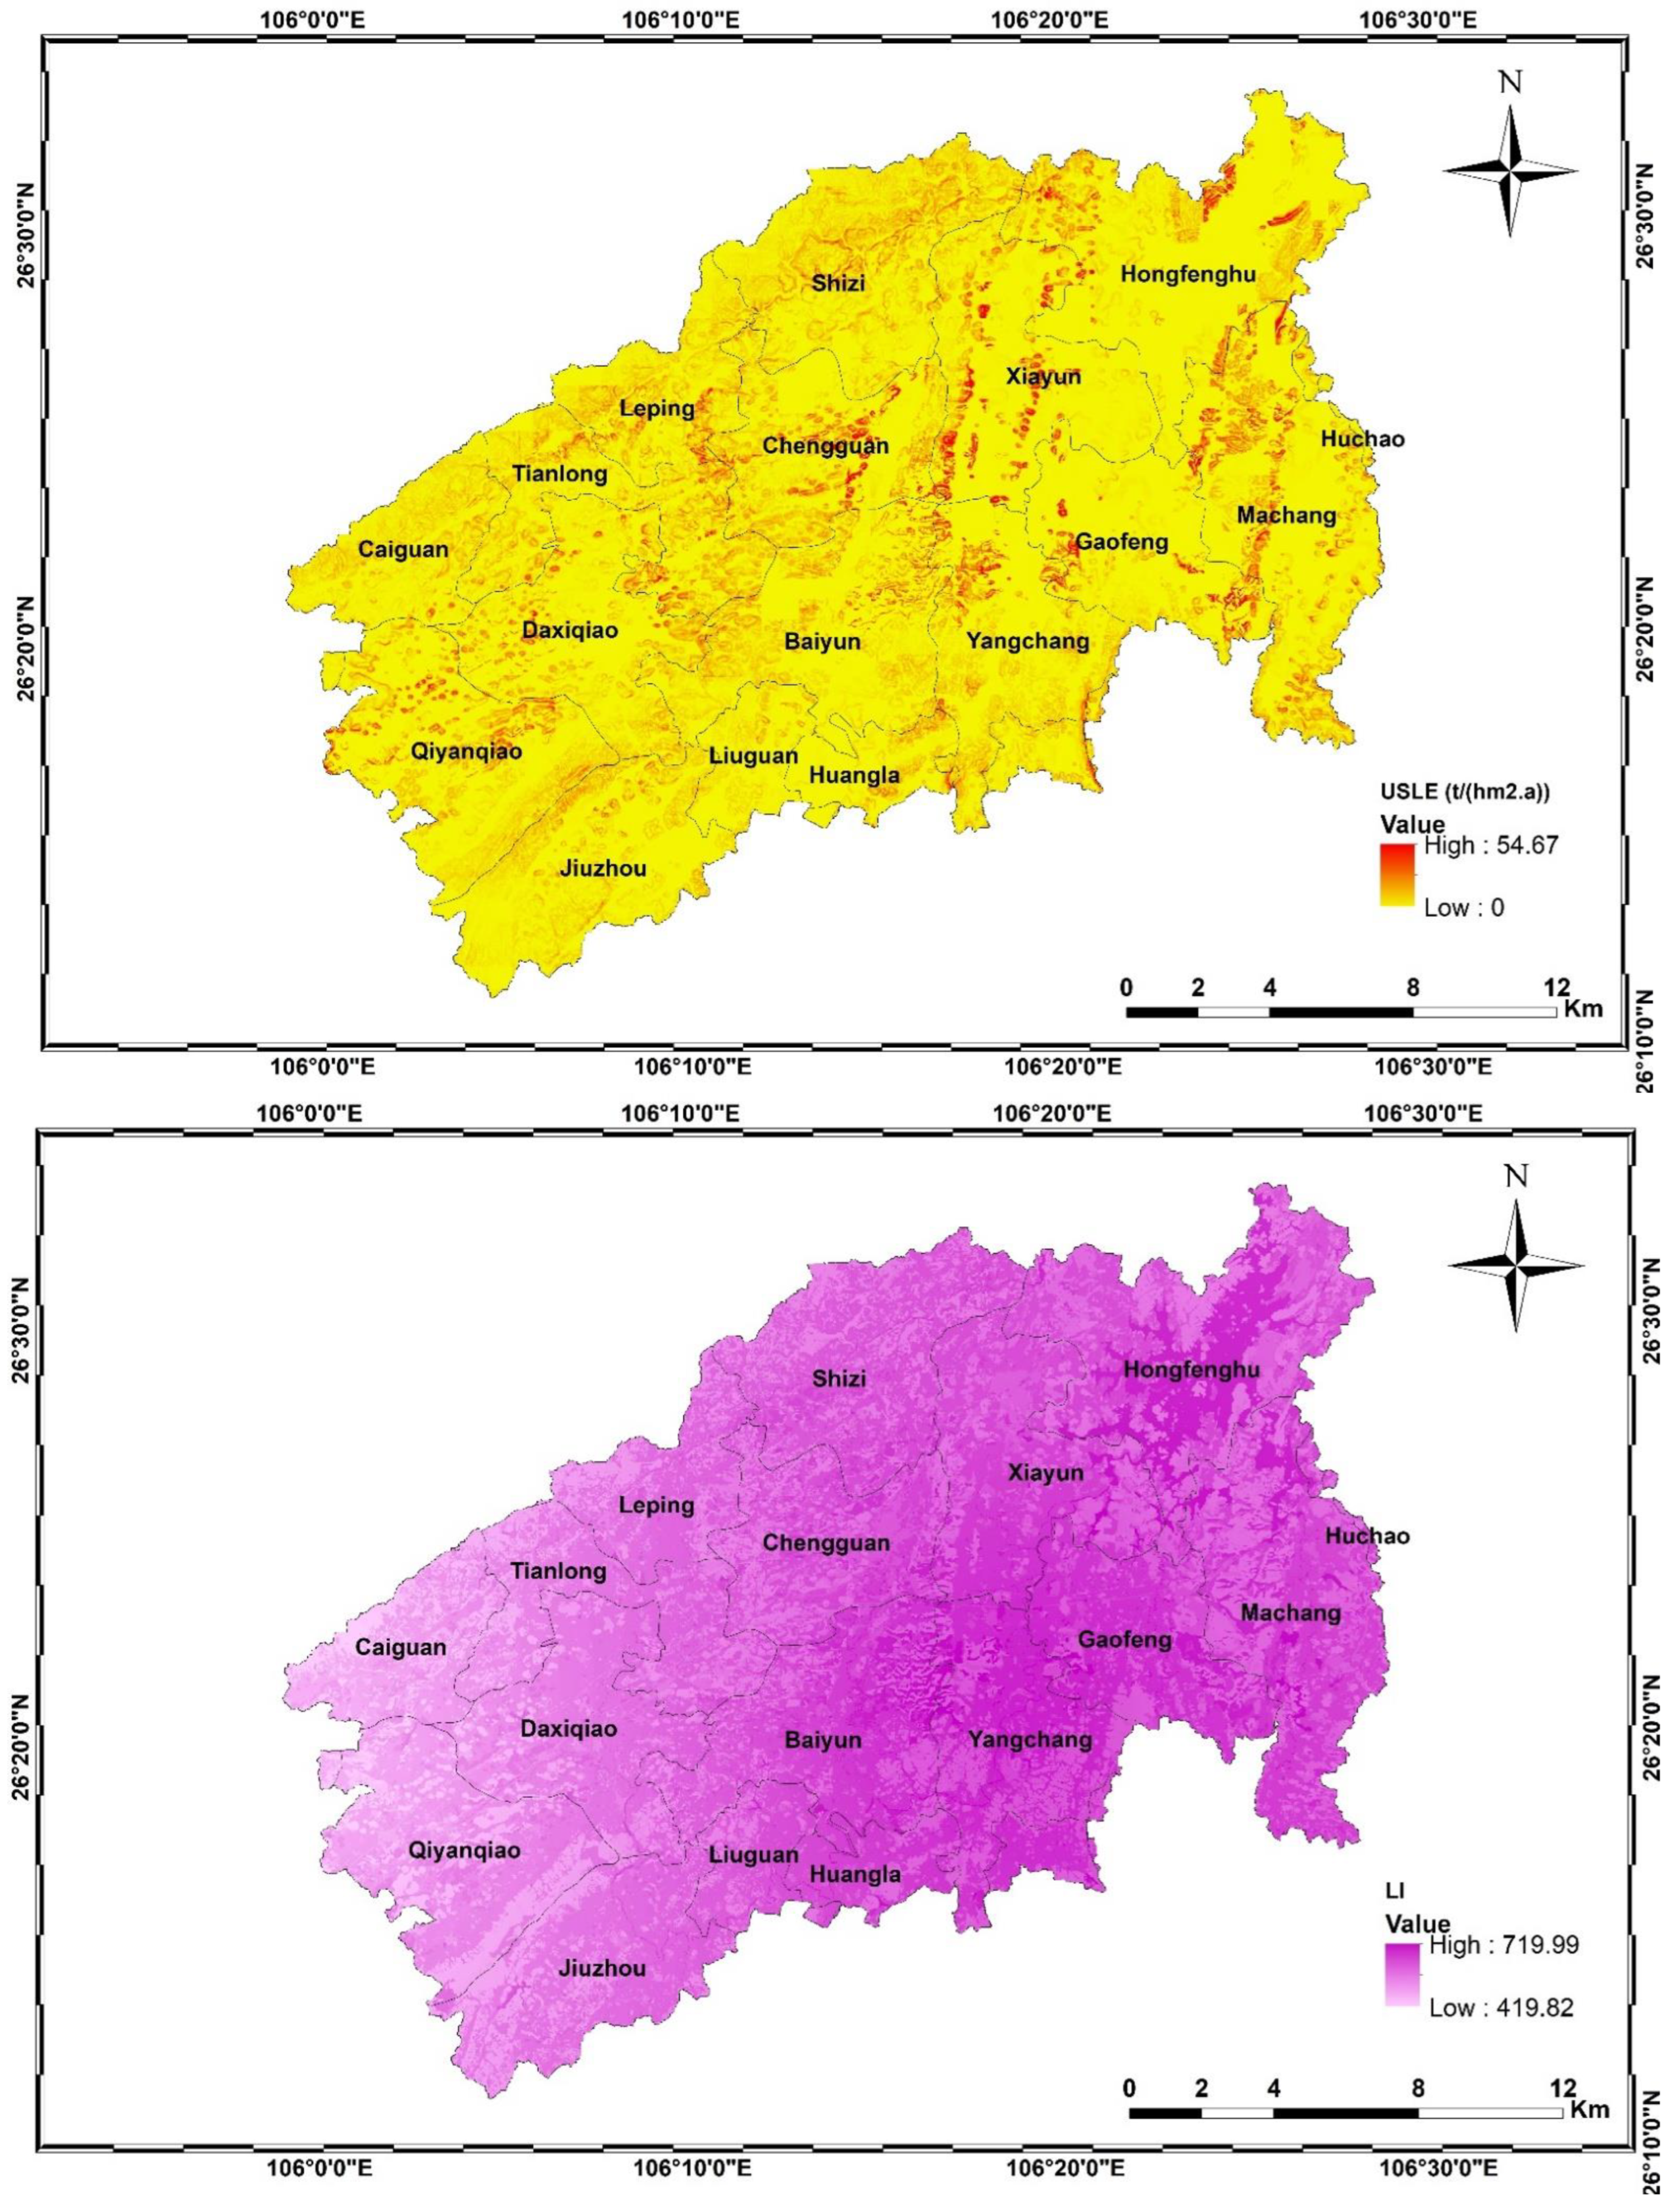
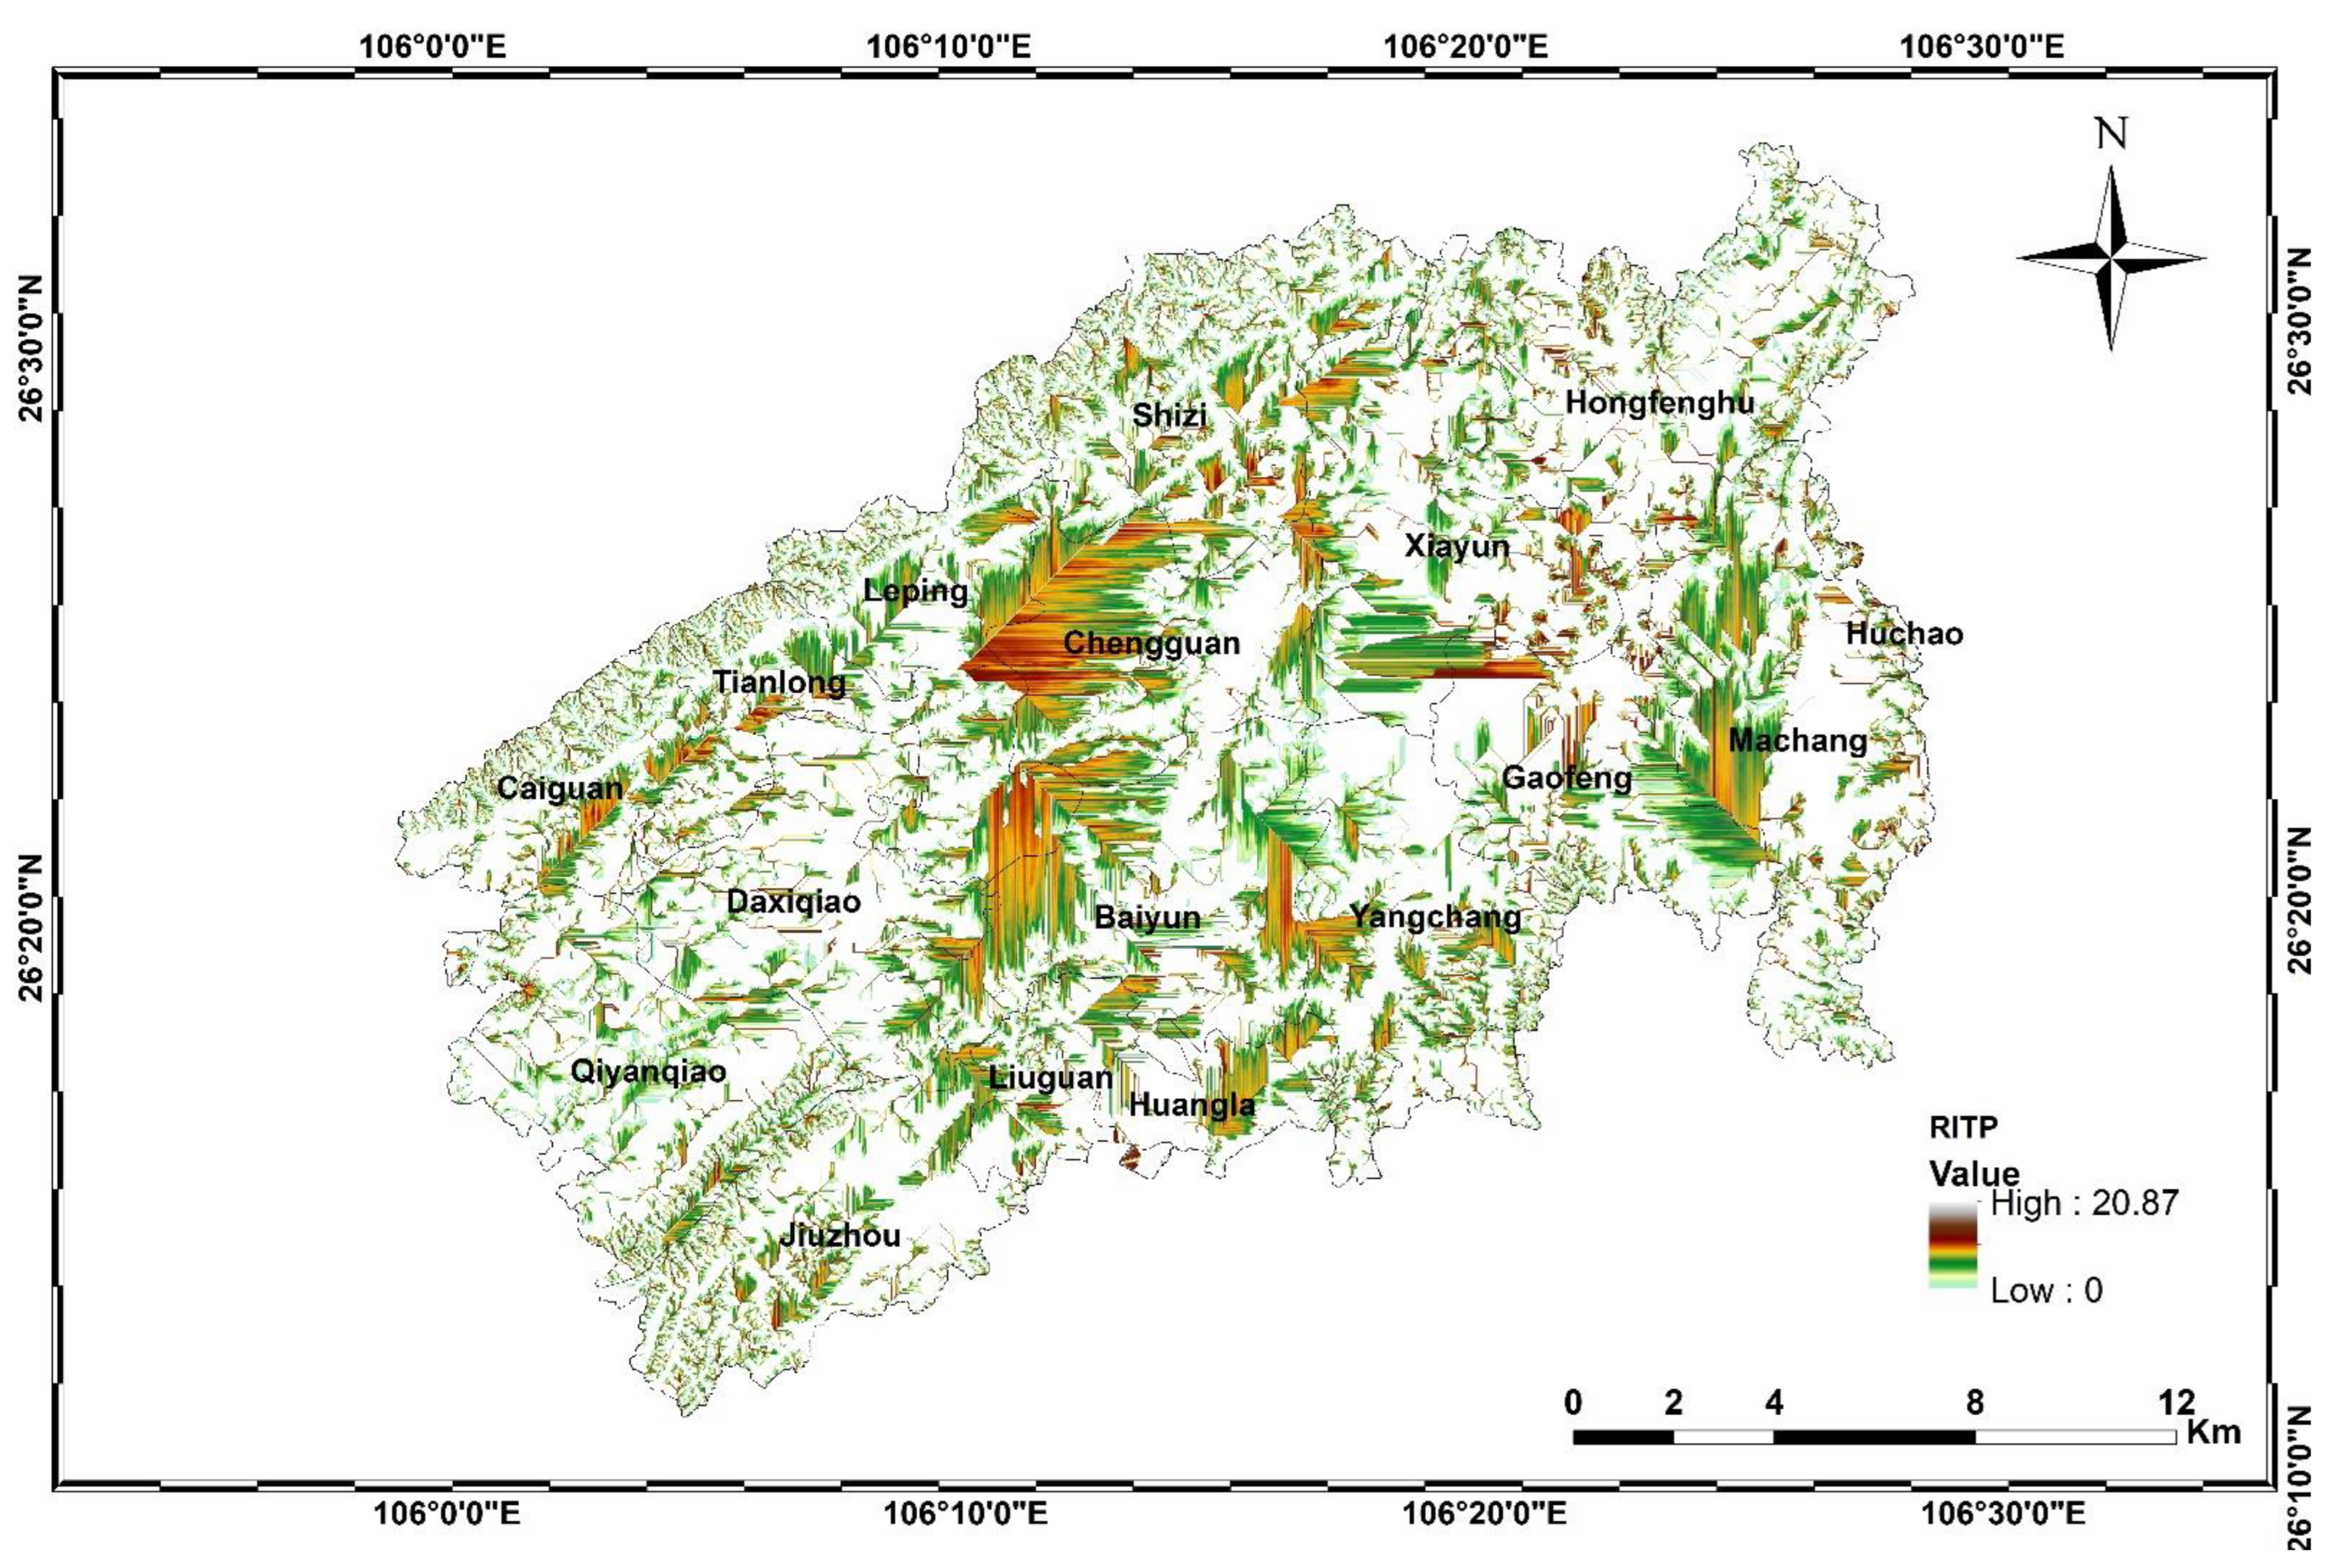
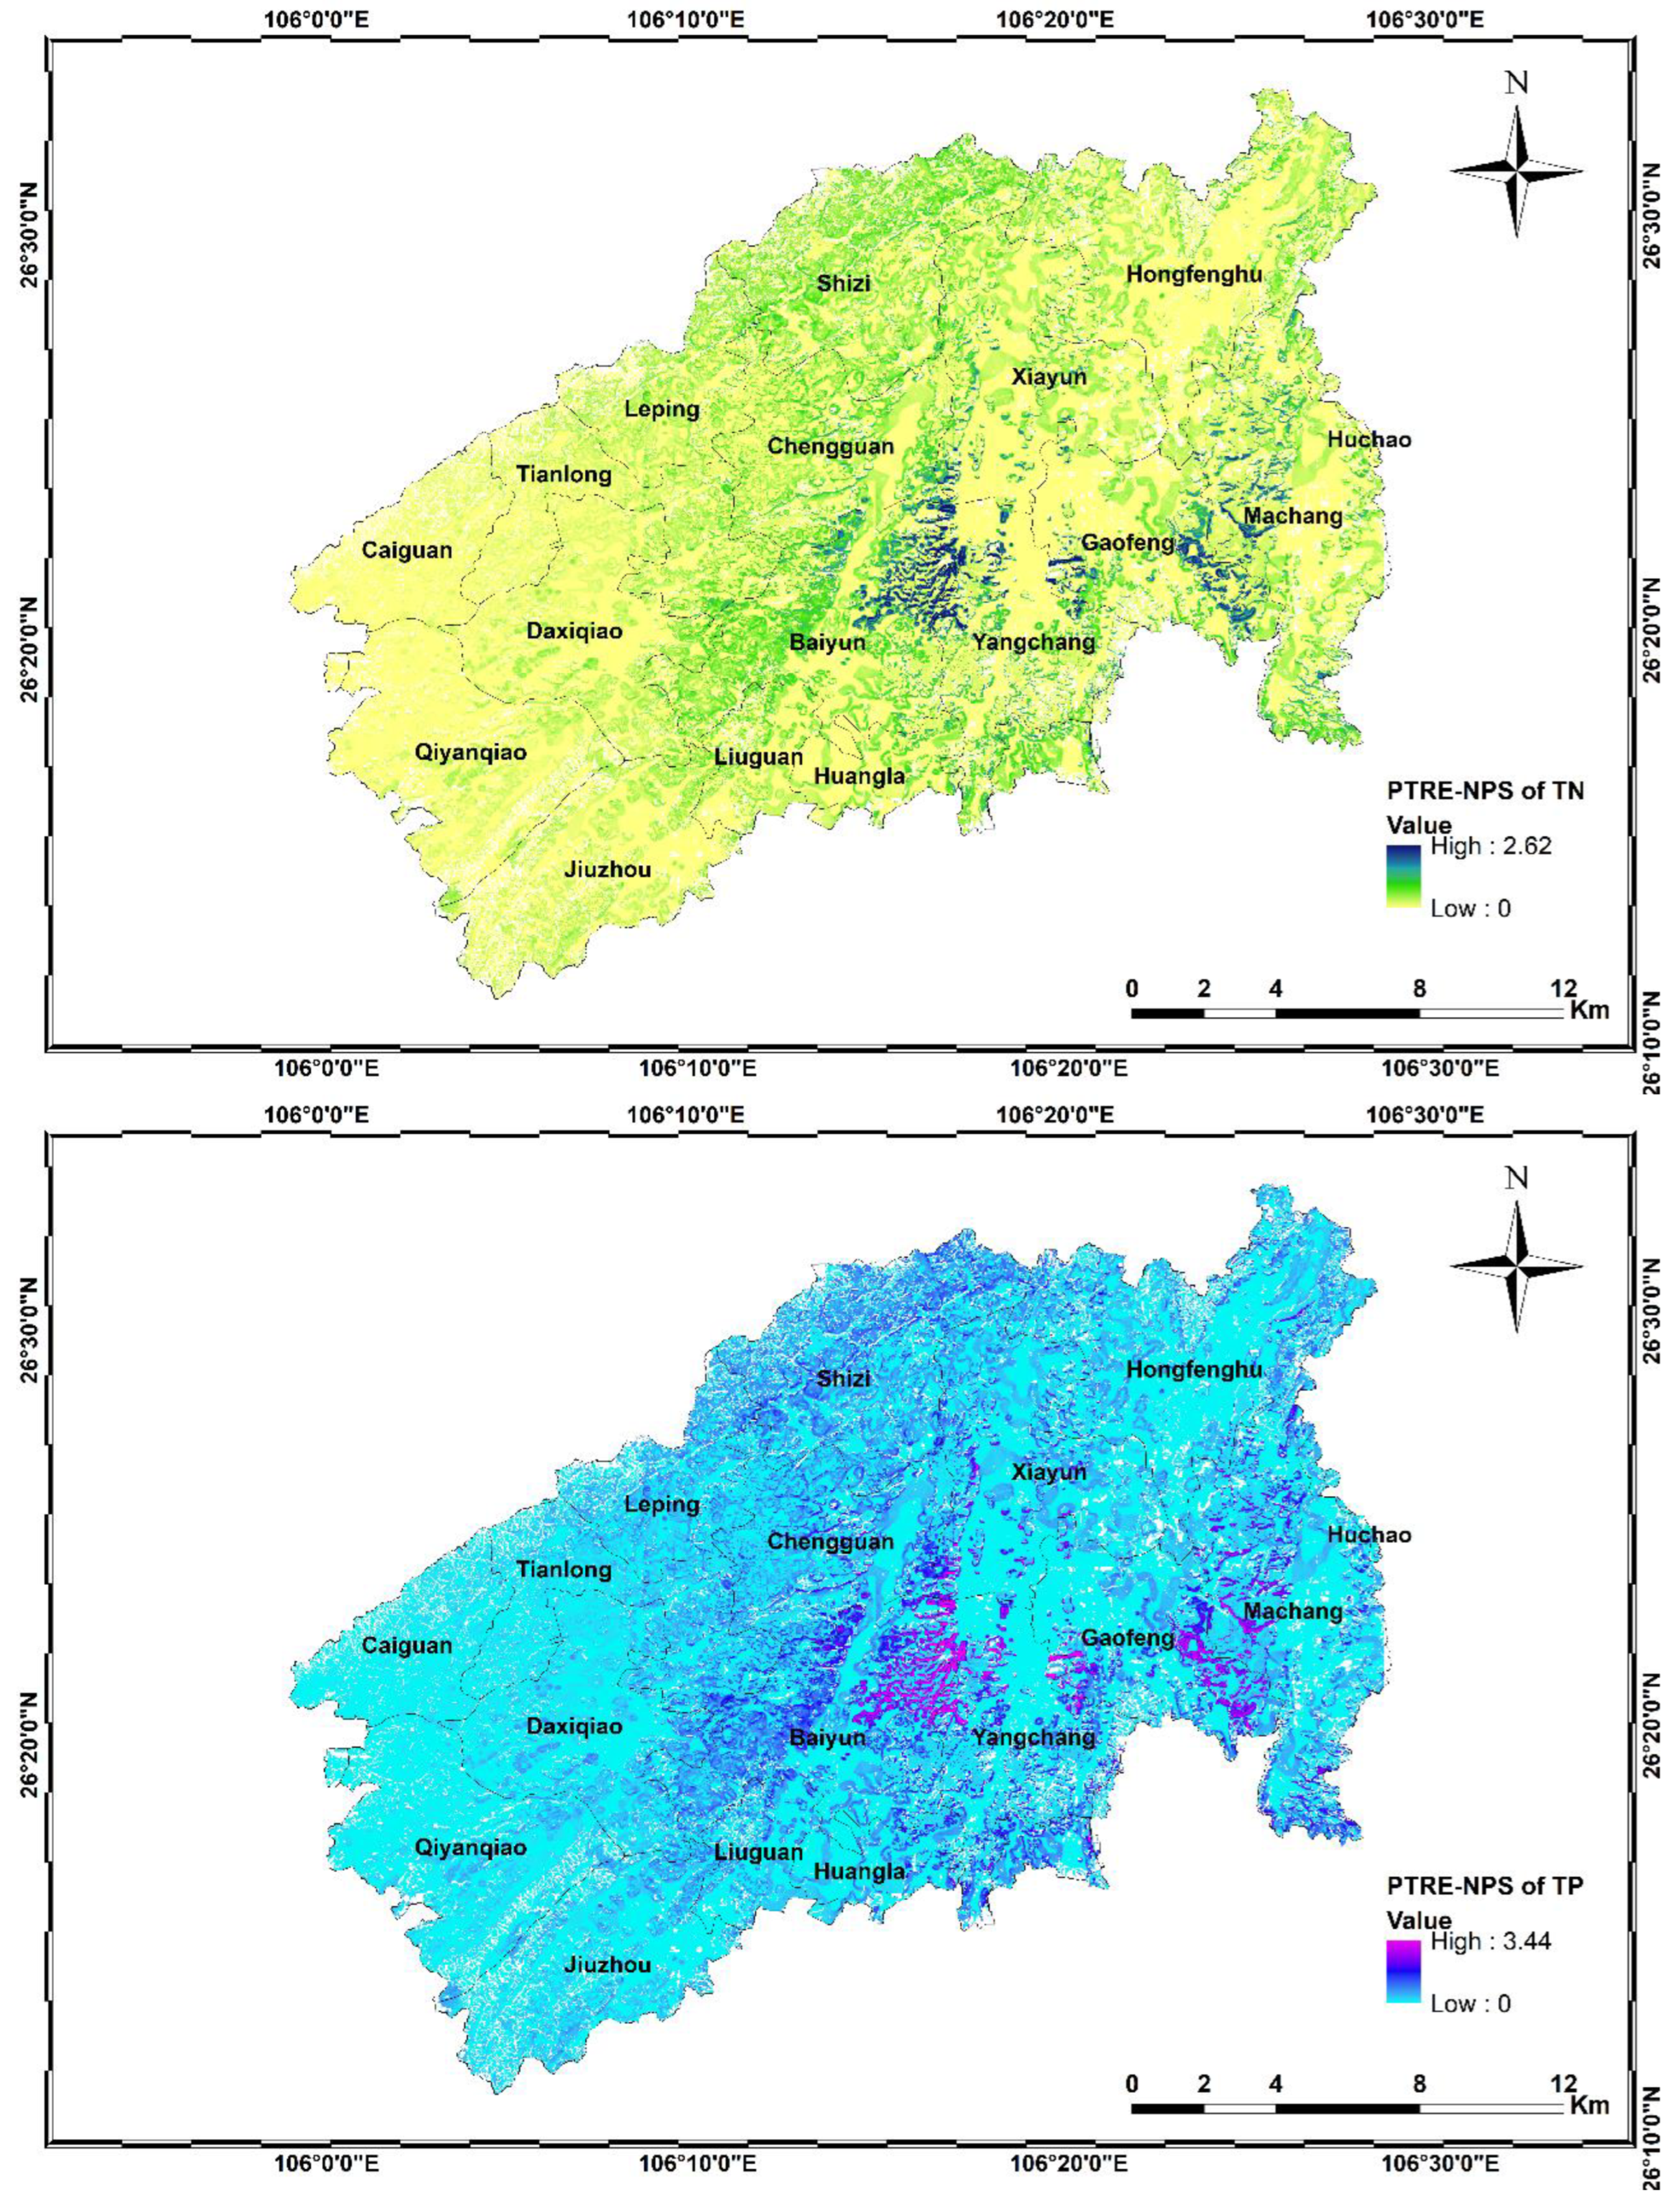
3.1. Spatial Distribution of Major Parameters of the PTRE-NPS
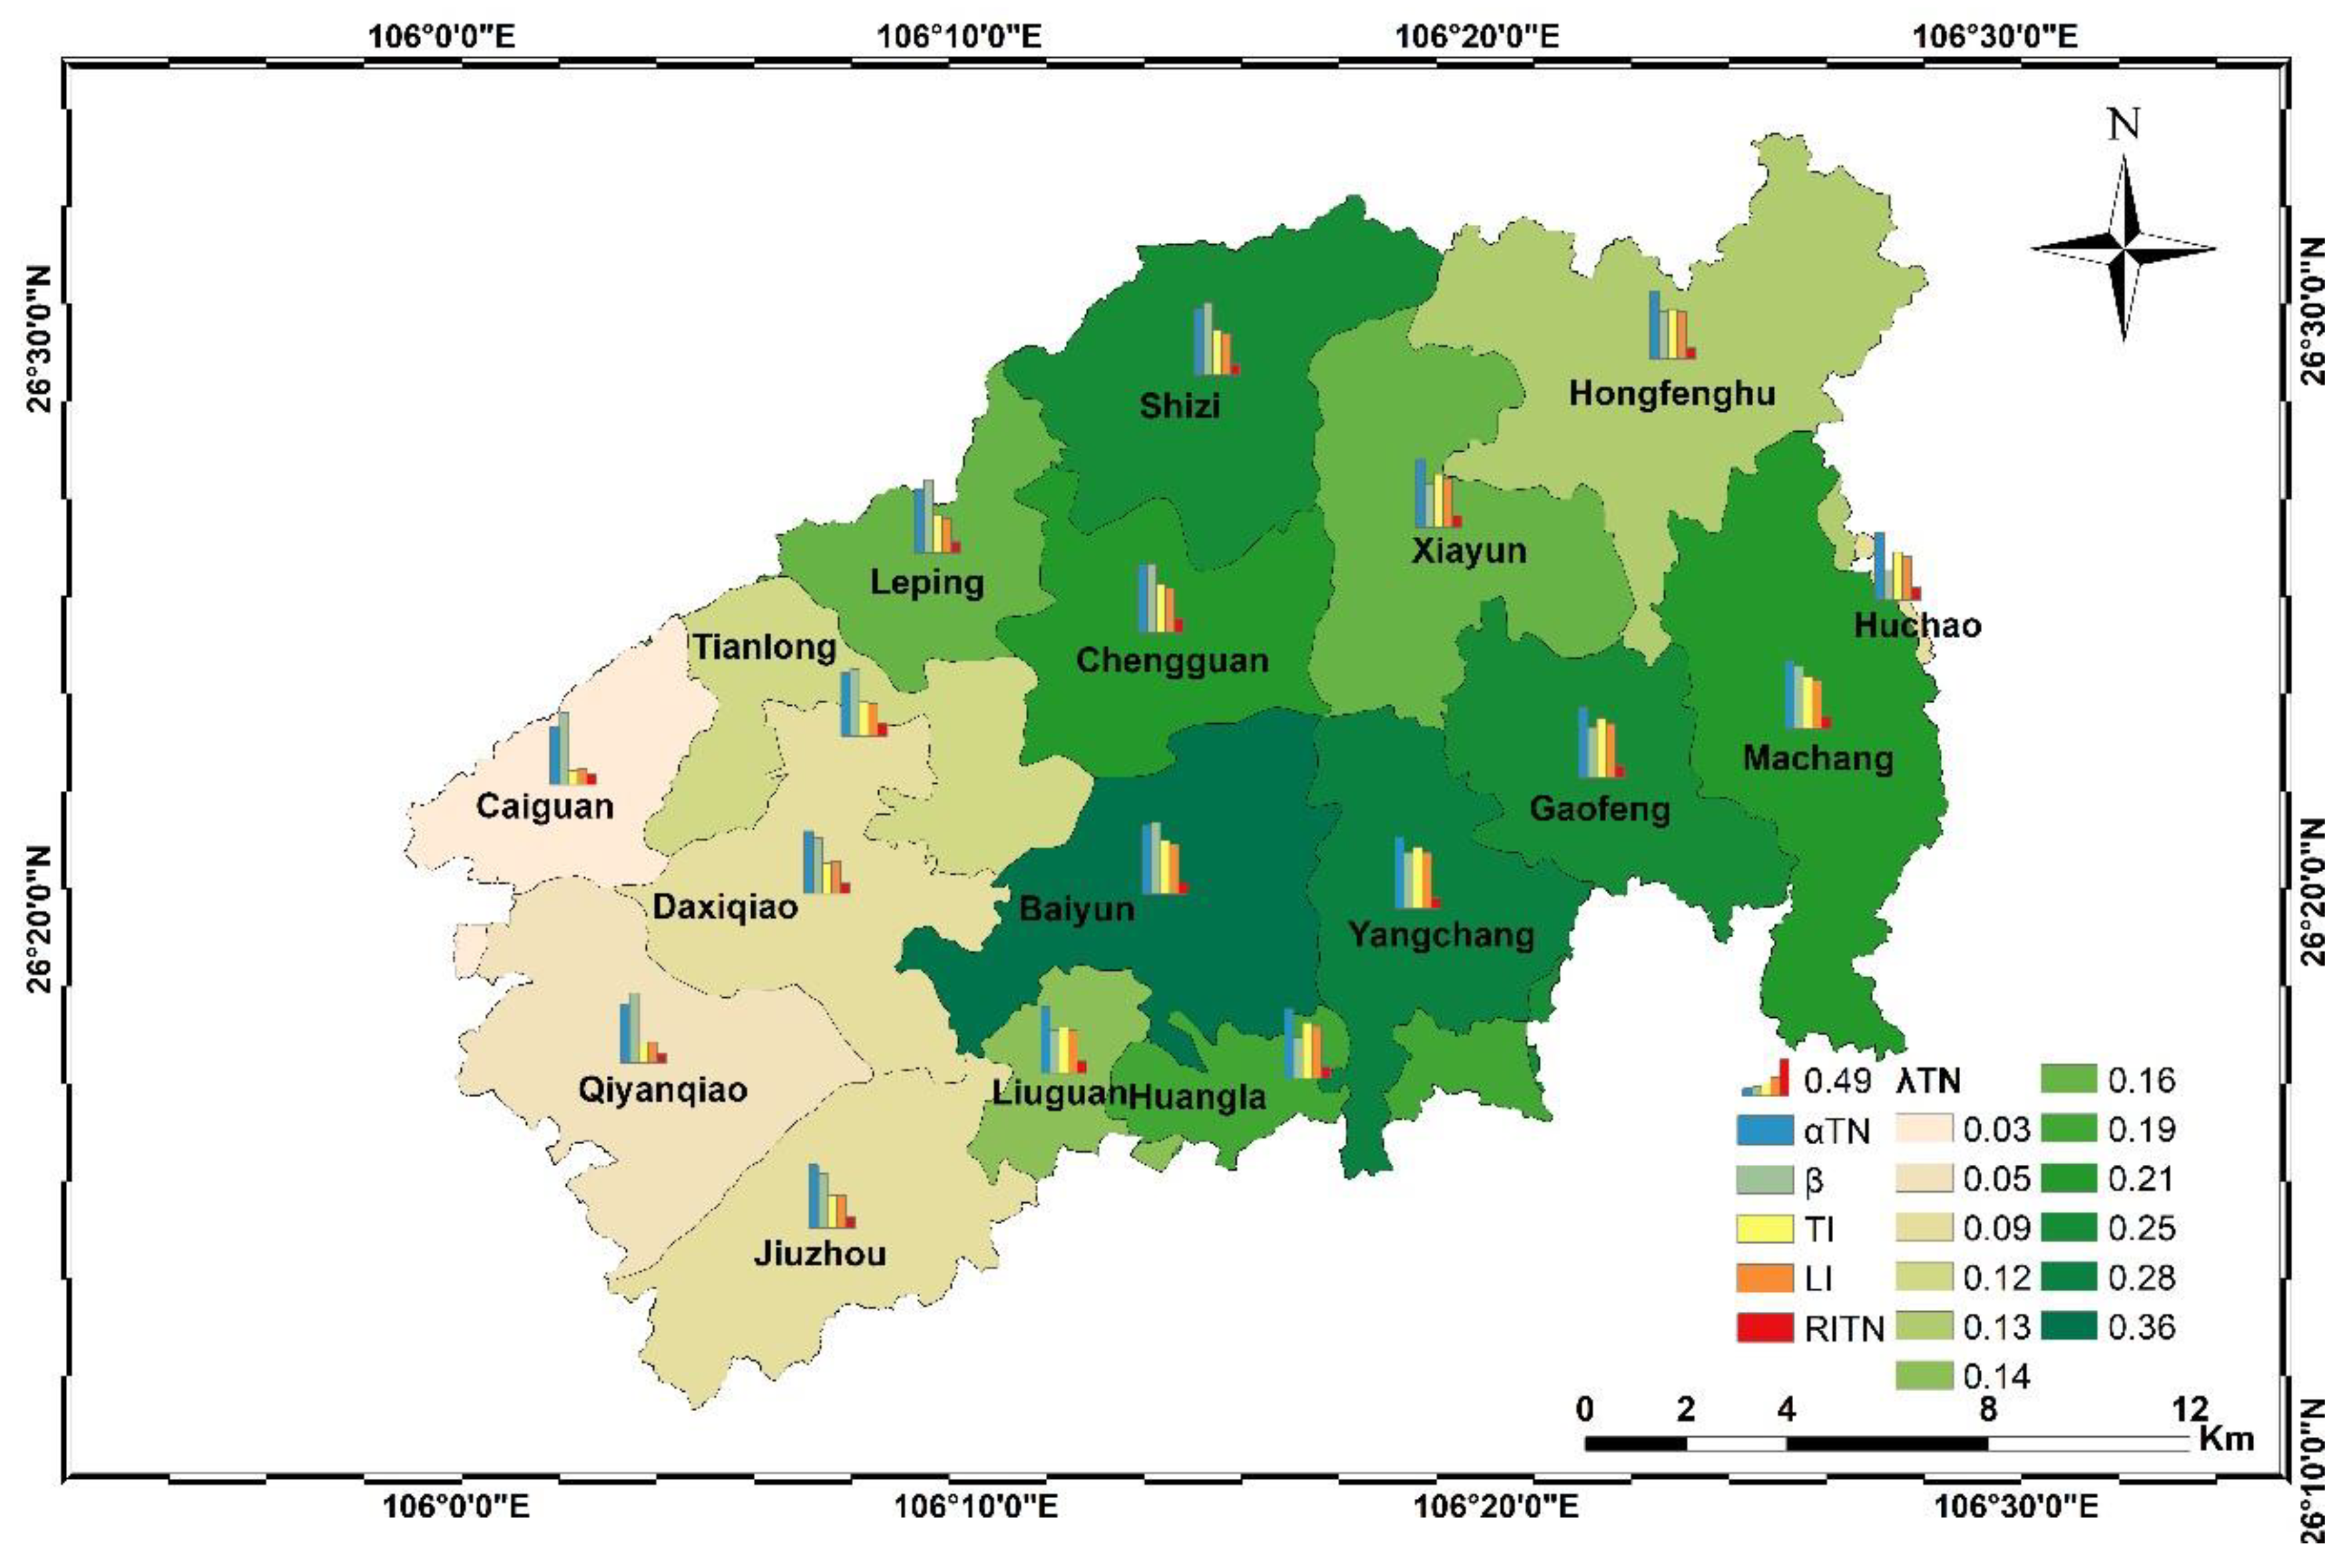
3.2. Spatial Distribution of PTRE–NPS on the Watershed and Town Scale
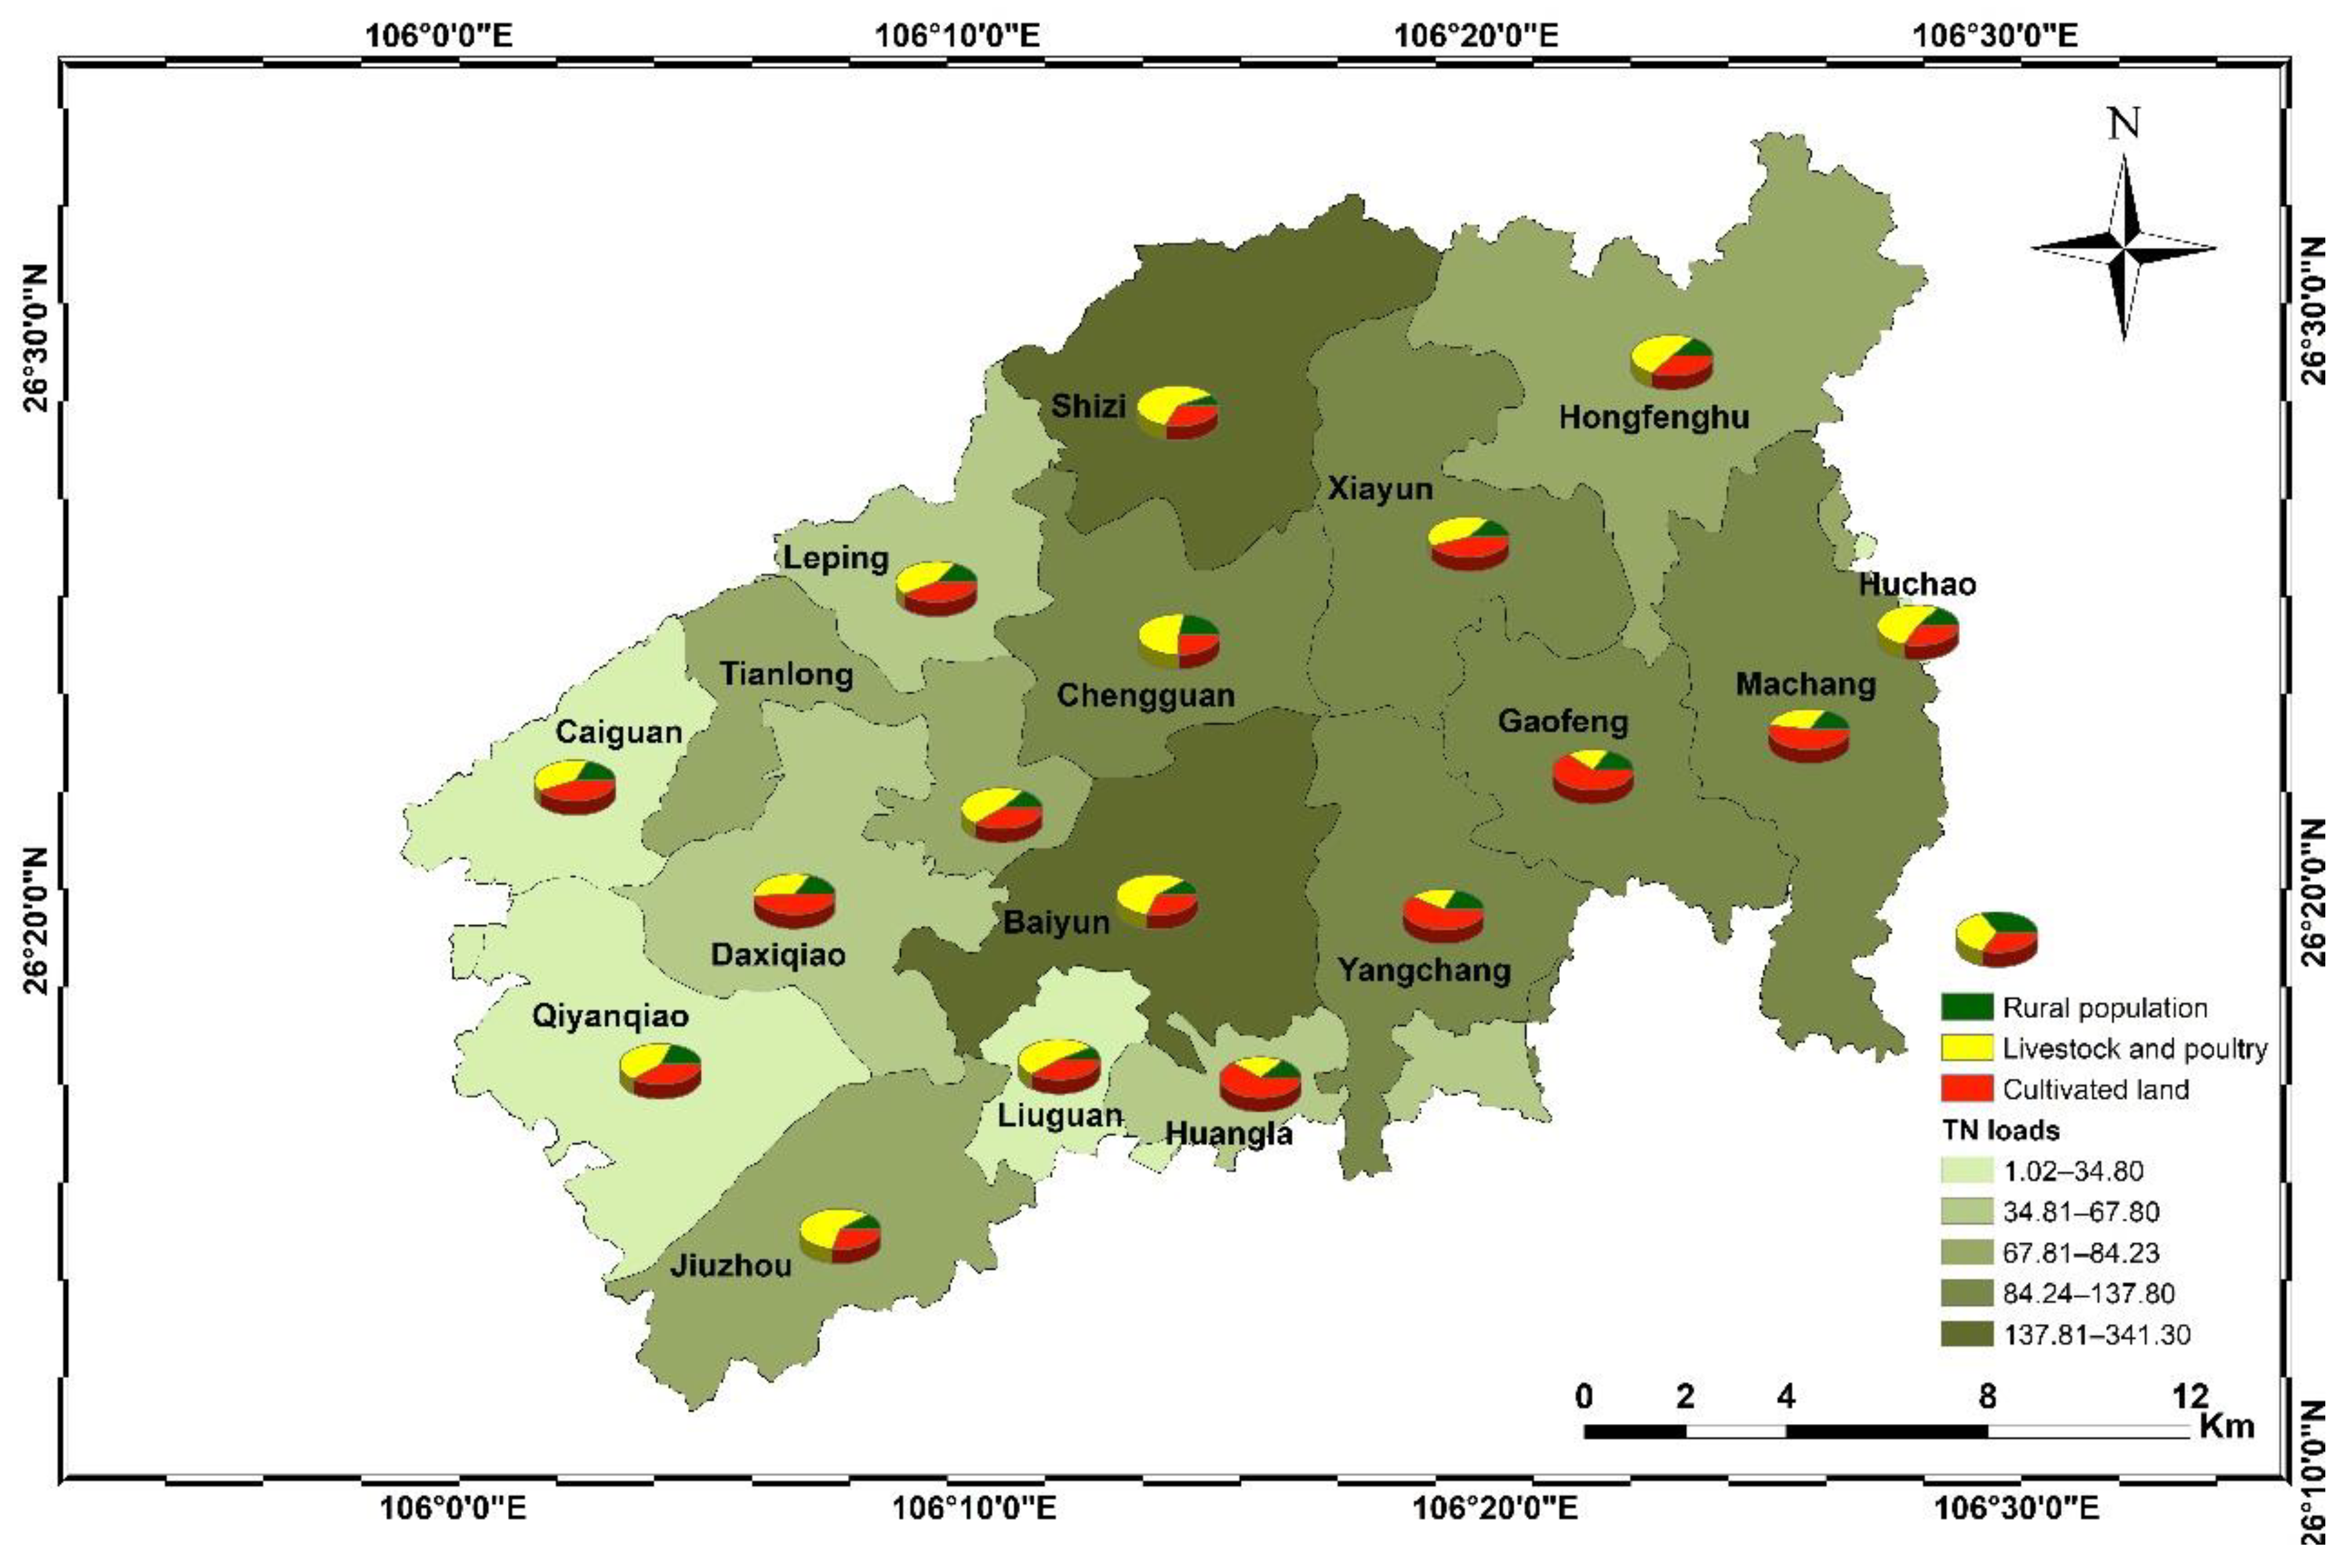
3.3. Estimated Pollutants into the River from Agricultural Sources
3.4. Identification of Critical Source Areas
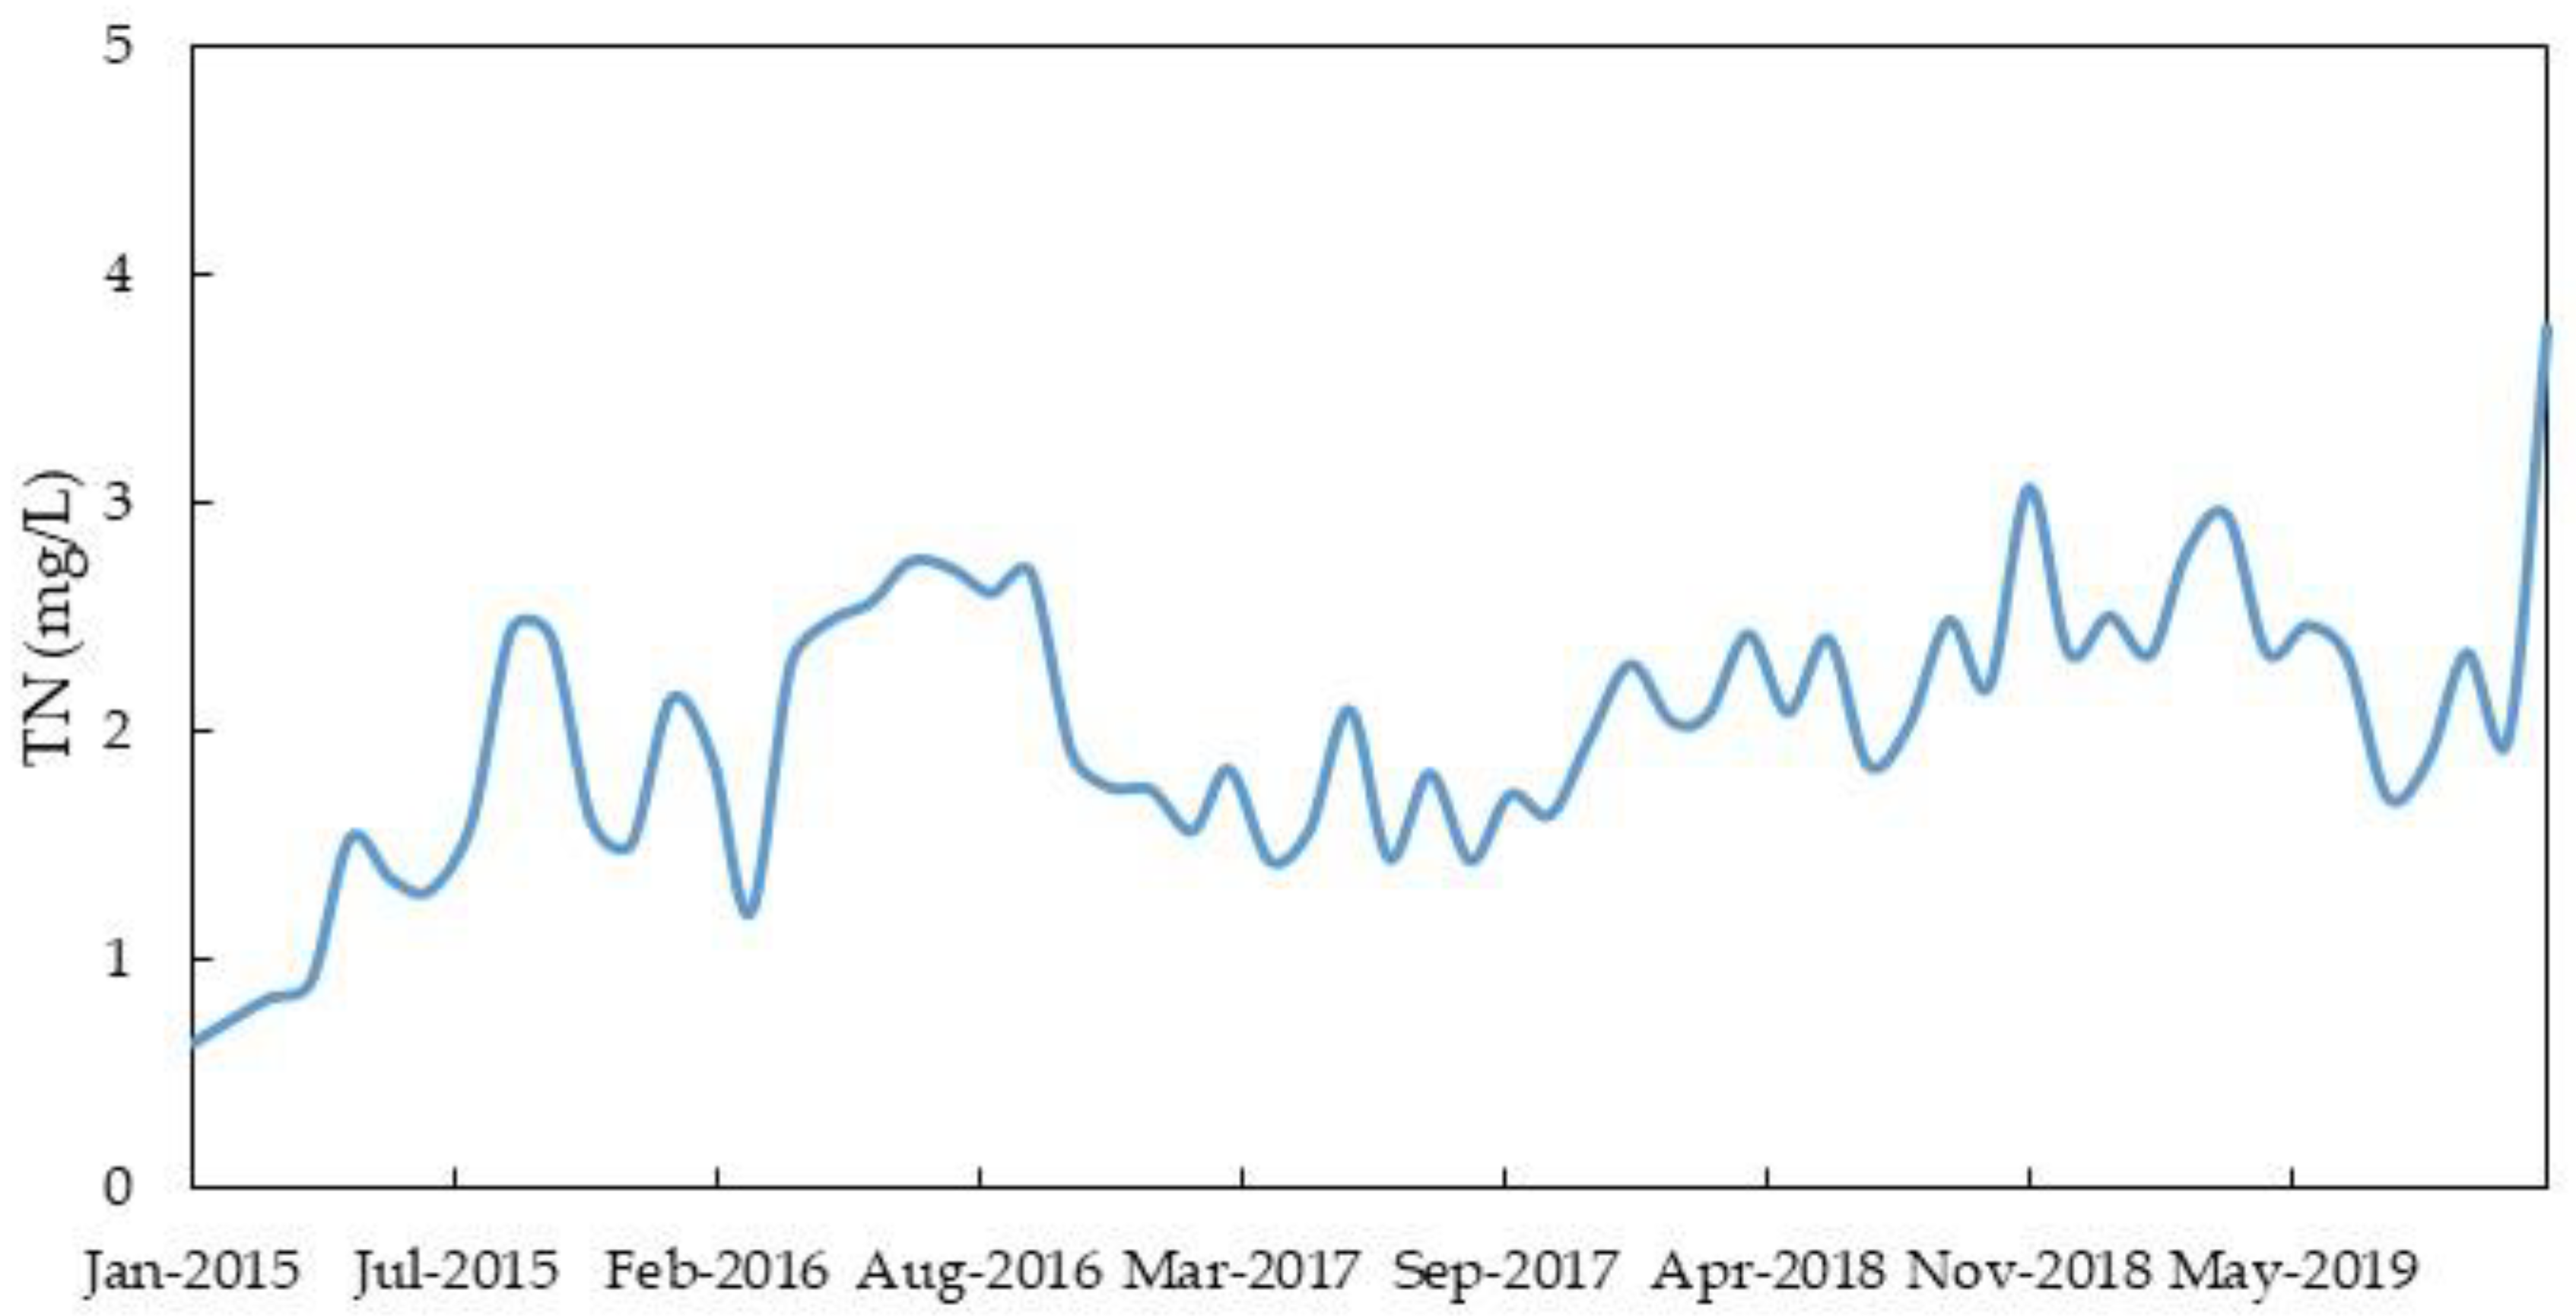
3.5. Verification of the PTRE–NPS Model
4. Conclusions
- The constructed PTRE–NPS model was successfully applied in simulations of agricultural NPS in the Hongfenghu reservoir watershed, which occupies Guiyang and Anshun Cities in the Guizhou Province of China. The TN and TP loads into rivers and lakes were 1707.78 and 209.03 t, respectively, with Re values of −45.36% and 13.07%, respectively. The simulation accuracy of the PTRE-NPS was acceptable. Baiyun Town presented the highest PTRE–NPS for both TN and TP.
- Baiyun, Shizi, Yangchang, Chengguan, and Machang are the high-risk townships for pollution by agricultural nonpoint TN, collectively accounting for 56.73% of the TN load. Baiyun, Shizi, and Chengguan are also at high risk of TP pollution from agricultural nonpoint sources, collectively accounting for 45.15% of the TP load. The key pollution sources of TN and TP were cultivated land and livestock/poultry farming, respectively. Therefore, they should be considered for taking effective control measures to control nonpoint source pollution.
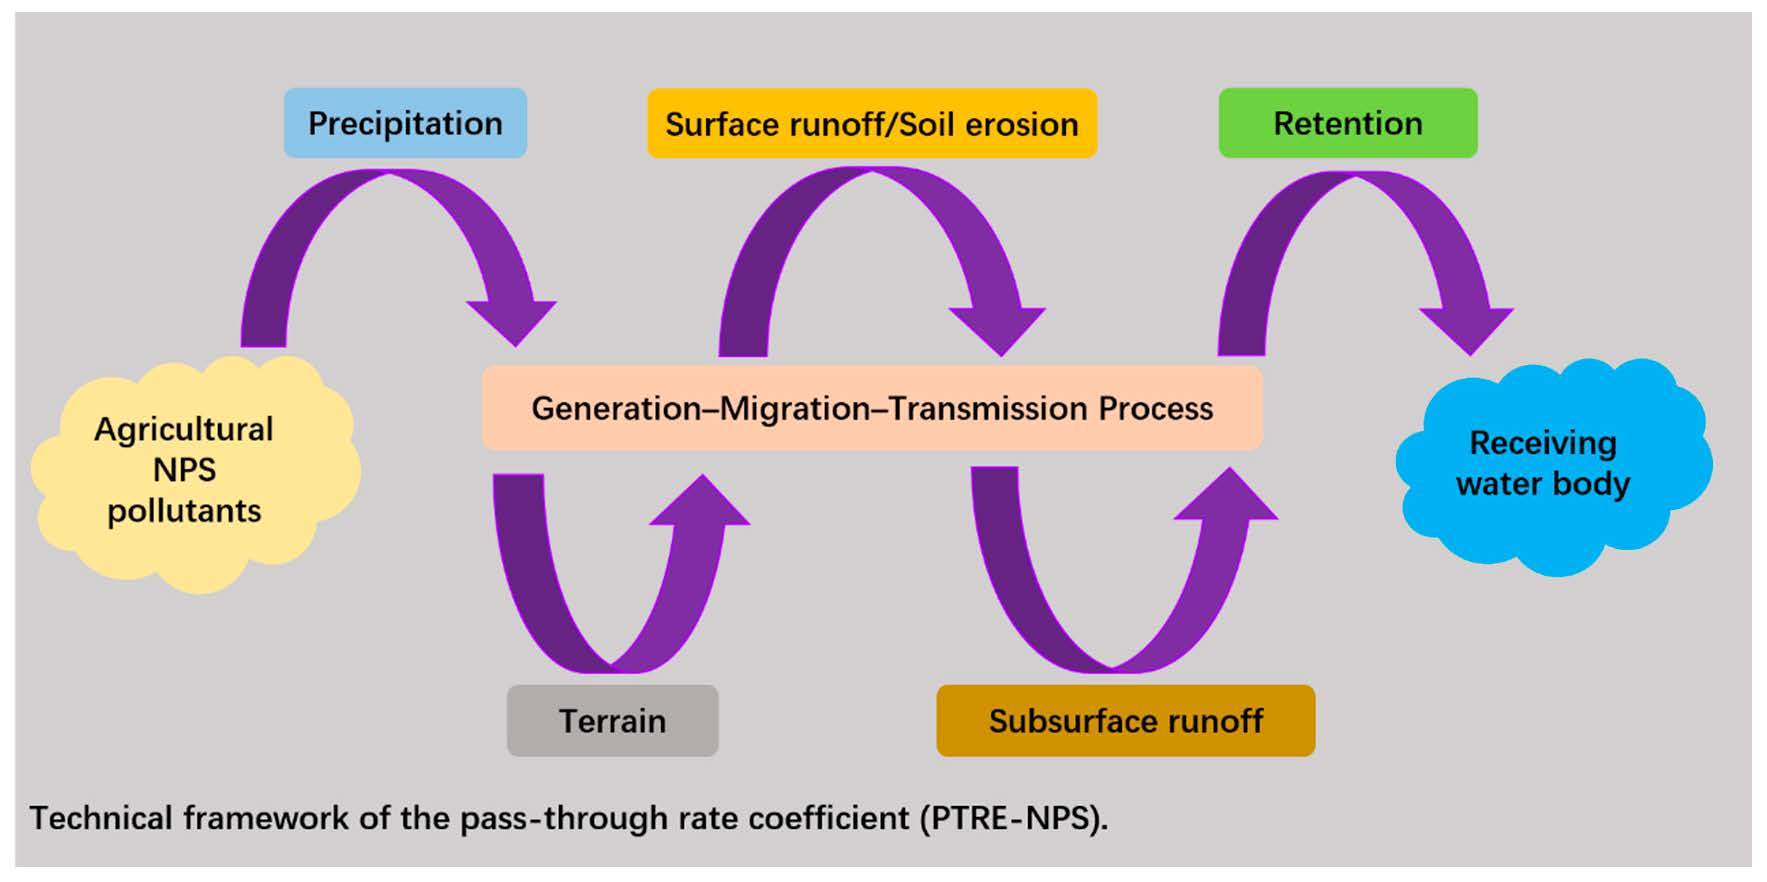
- Compared with other methods of estimating the path-through rate for NPS pollutants, such as field monitoring, and the ECM, the PTRE-NPS model can scientifically represent the generation–migration–transmission process of agricultural nonpoint source pollutions in each grid at both the watershed and administrative scales. The model can also be used as an effective tool to identify transport paths for NPS pollution.
Author Contributions
Funding
Institutional Review Board Statement
Informed Consent Statement
Data Availability Statement
Conflicts of Interest
References
- Fleming, P.; Stephenson, K.; Collick, A.; Easton, Z. Targeting for nonpoint source pollution reduction: A synthesis of lessons learned, remaining challenges, and emerging opportunities. J. Environ. Manag. 2022, 308, 114649. [Google Scholar] [CrossRef] [PubMed]
- Ministry of Ecology and Environment of the People’s Republic of China. Bulletin of the Second National Census of Pollution Sources of China; Ministry of Ecology and Environment of the People’s Republic of China: Beijing, China, 2020.
- Zhu, X.; Lu, J.X. Nonpoint source pollution and soil erosion Control—Application of the Universal Soil erosion Equation in the United States. Trends Environ. Sci. 1984, 11, 2–8. [Google Scholar]
- Li, H.E. Application of hydrological models to non-point source pollution studies. Shaanxi Water 1987, 3, 18–23. [Google Scholar]
- He, C.S.; Fu, B.J.; Chen, L.D. Non-point source pollution control and management. Environ. Sci. 1998, 88–92, 97. [Google Scholar]
- Xu, Q.G.; Liu, H.L.; Shen, Z.Y.; Xi, B.D. Characteristics on nitrogen and phosphorus losses in the typical small watershed of the Three Georges Reservoir area. Acta Sci. Circum. 2007, 27, 326–331. [Google Scholar]
- Wang, X.Y.; Zhang, Y.F.; Ou, Y.; Yan, Y.M. Predicting effectiveness of best management practices for control of nonpoint source pollution—a case of Taishitun Town, Miyun County, Beijing. Acta Sci. Circum. 2009, 29, 2440–2450. [Google Scholar]
- Shen, Z.Y.; Liao, Q.; Hong, Q.; Gong, Y. An overview of research on agricultural nonpoint source pollution modelling in China. Sep. Purif. Technol. 2012, 84, 104–111. [Google Scholar] [CrossRef]
- Yang, G.X.; Best, E.P. Spatial optimization of watershed management practices for nitrogen load reduction using a modeling-optimization framework. J. Environ. Manag. 2015, 161, 252–260. [Google Scholar] [CrossRef]
- Johnes, P. Evaluation and management of the impact of land use change on the nitrogen and phosphorus load delivered to surface waters: The export coefficient modelling approach. J. Hydrol. 1996, 183, 323–349. [Google Scholar] [CrossRef]
- Geng, R.Z.; Yin, P.H.; Zhou, L.L.; Wang, M. Review: Assessment and calculation for the pass through rate of agricultural diffuse sources pollution in national scale. Environ. Sustain. Dev. 2019, 44, 26–30. [Google Scholar]
- Cherry, K.; Shepherd, M.; Withers, P.; Mooney, S. Assessing the effectiveness of actions to mitigate nutrient loss from agriculture: A review of methods. Sci. Total Environ. 2008, 406, 123. [Google Scholar] [CrossRef] [PubMed]
- Buchanan, B.P.; Josephine, A.A.; Zachary, M.E. A phosphorus index that combines critical source areas and transport pathways using a travel time approach. J. Hydrol. 2013, 486, 123–135. [Google Scholar] [CrossRef]
- Li, W.; Liu, S.; Liu, H. Review on Phosphorus Indices as Risk—Assessment Tools at Home and Abroad. Chin. J. Soil Sci. 2016, 47, 489–498. [Google Scholar]
- Arnold, J.G.; Fohrer, N. SWAT2000: Current capabilities and research opportunities in applied watershed modelling. Hydrol. Process. 2005, 19, 563–572. [Google Scholar] [CrossRef]
- Chahor, Y.; Casalí, J.; Giménez, R. Evaluation of the AnnAGNPS model for predicting runoff and sediment yield in a small Mediterranean agricultural watershed in Navarre. Agric. Water Manag. 2014, 134, 24–37. [Google Scholar] [CrossRef]
- Mohamoud, Y.M.; Parmar, R.; Wolfe, K. Modeling Best Management Practices (BMPs) with HSPF; American Society of Civil Engineers (ASCE): Reston, FL, USA, 2010. [Google Scholar]
- Majhi, A.; Shaw, R.; Mallick, K.; Patel, P.P. Towards improved USLE-based soil erosion modelling in India: A review of prevalent pitfalls and implementation of exemplar methods. Earth-Sci. Rev. 2021, 221, 103786. [Google Scholar] [CrossRef]
- Wischmeier, W.H.; Smith, D.D. Predicting Rainfall Erosion Losses: A Guide to Conservation Planning; USDA Agricultural Handbook No. 537; Science and Education Administration, U.S. Department of Agriculture: Washington, DC, USA, 1978.
- Chen, T.; Niu, R.Q.; Li, P.X.; Zhang, L.P.; Du, B. Regional soil erosion risk mapping using RUSLE, GIS, and remote sensing: A case study in Miyun Watershed, North China. Environ. Earth Sci. 2011, 63, 533–541. [Google Scholar] [CrossRef]
- Ding, X.; Shen, Z.Y.; Hong, Q.; Yang, Z.; Wu, X.; Liu, R. Development and test of the export coefficient model in the upper reach of the Yangtze River. J. Hydrol. 2010, 383, 233–244. [Google Scholar] [CrossRef]
- Beven, K.; Kirkby, M.J. A physically based, variable contributing area model of basin hydrology. Hydrol. Sci. Bull. 1979, 24, 43–69. [Google Scholar] [CrossRef] [Green Version]
- Chen, Z.; Liu, X.; Zhu, B. Runoff estimation in hillslope cropland of purple soil based on SCS-CN model. Trans. Chin. Soc. Agric. Eng. 2014, 30, 72–81. [Google Scholar]
- He, Y.; Wang, X.; Duan, S. Characteristics of runoff and sediment during individual rainfall in upper area of Miyun Reservior. Trans. Chin. Soc. Agric. Eng. 2015, 31, 134–141. [Google Scholar]
- Coale, F.J.; Baugher, E.; Sims, J.T.; Leytem, A. Accelerated Deployment of an Agricultural Nutrient Management Tool in Response to Local Government Policy: The Maryland Phosphorus Site Index. J. Environ. Qual. 2002, 31, 1471–1476. [Google Scholar] [CrossRef] [PubMed]
- Ralf, K.; Christoph, H.; Christian, W. Quantification of nitrate leaching from German forest ecosystems by use of a process oriented biogeochemical model. Environ. Pollut. 2011, 159, 3204–3214. [Google Scholar]
- Endreny, T.A.; Wood, E.F. Watershed weighting of export coefficients to map critical phosphorous loading areas. J. Am. Water Resour. Assoc. 2003, 39, 165–181. [Google Scholar] [CrossRef]
- Sharpley, A.; Kleinman, P.; Baffaut, C.; Beegle, D.; Bolster, C.; Collick, A.; Easton, Z.; Lory, J.; Nelson, N.; Osmond, D. Evaluation of phosphorus site assessment tools: Lessons from the USA. J. Environ. Qual. 2017, 46, 1250–1256. [Google Scholar] [CrossRef] [Green Version]
- Sharpley, A.N.; Kleinman, P.J.; Flaten, D.N.; Buda, A.R. Critical source area management of agricultural phosphorus: Experiences, challenges and opportunities. Water Sci. Technol. 2011, 64, 945–952. [Google Scholar] [CrossRef]
- Panagopoulos, Y.; Makropoulos, C.; Mimikou, M. Diffuse surface water pollution: Driving factors for different geoclimatic regions. Water Resour. Manag. 2011, 25, 3635–3660. [Google Scholar] [CrossRef]
- Panagopoulos, Y.; Makropoulos, C.; Mimikou, M. Reducing surface water pollution through the assessment of the cost-effectiveness of BMPs at different spatial scales. J. Environ. Manag. 2011, 92, 2823–2835. [Google Scholar] [CrossRef]
- Biddau, R.; Cidu, R.; Da Pelo, S.; Carletti, A.; Ghiglieri, G.; Pittalis, D. Source and fate of nitrate in contaminated groundwater systems: Assessing spatial and temporal variations by hydrogeochemistry and multiple stable isotope tools. Sci. Total Environ. 2019, 647, 1121–1136. [Google Scholar] [CrossRef]
- Bu, H.M.; Song, X.F.; Zhang, Y.; Meng, W. Sources and fate of nitrate in the Haicheng River basin in Northeast China using stable isotopes of nitrate. Ecol. Eng. 2017, 98, 105–113. [Google Scholar] [CrossRef]
- Steenhuis, T.S.; Winchell, M.; Rossing, J. SCS runoff equation revised for variable-source runoff areas. J. Irrig. Drain. Eng. 1995, 121, 234–238. [Google Scholar] [CrossRef]
- Lyon, S.W.; Walter, M.T.; Gerard-Marchant, P. Using a topographic index to distribute variable source area runoff predicted with the SCS curve-number equation. Hydrol. Process. 2004, 18, 2757–2771. [Google Scholar] [CrossRef]
- Sharpley, A.N.; McDowell, R.W.; Weld, J.L. Assessing site vulnerability to phosphorus loss in an agricultural watershed. J. Environ. Qual. 2001, 30, 2026–2036. [Google Scholar] [CrossRef] [PubMed] [Green Version]
- Verma, R.K.; Verma, S.; Mishra, S.K.; Pandey, A. SCS-CN-Based Improved Models for Direct Surface Runoff Estimation from Large Rainfall Events. Water Resour. Manag. 2021, 35, 2149–2175. [Google Scholar] [CrossRef]
- Liu, J.; Pang, S.; He, Y.; Wang, X. Critical area identification of phosphorus loss based on runoff characteristics in small watershed. Trans. Chin. Soc. Agric. Eng. 2017, 33, 241–249. [Google Scholar] [CrossRef]
- Fan, X.; Wu, F.P.; Meng, C.; Ye, L.; Li, X.; Zhang, M.Y.; Li, Y.Y.; Wu, G.Y.; Wu, J.S. Estimation of nitrogen output load of a river watershed based on net anthropogenic nitrogen input and river inflow coefficient. J. Agric.-Environ. Sci. 2021, 40, 185–193. [Google Scholar]
- Xing, B.Q.; Chen, H. Estimation of agricultural non-point source pollution load and river inflow coefficient in Beijing. Soil Wat Con. Chin. 2016, 5, 34–37. [Google Scholar]
- Yang, D.H. Analysis on aquatic environment of Anhui Province in Xinanjiang River watershed. Water Resour. Prot. 2006, 5, 77–80. [Google Scholar]
- Su, B.L.; Yuan, J.Y.; Li, H.; Luo, Y.X.; Zhang, Q. Loss rates of rural domestic pollutants in the down-stream plain polder area of Ganjiang. J. Beijing Norm. Univ. (Nat. Sci.). 2013, 449, 256–260. [Google Scholar]
- Zhou, L.L.; Geng, R.Z. Development and assessment of a new framework for agricultural nonpoint source pollution control. Water 2021, 13, 3156. [Google Scholar] [CrossRef]


| Type | Model | Output | Factor | Reference | ||||
|---|---|---|---|---|---|---|---|---|
| Correction of Production and Discharge Coefficient | Difference of Spatial Distribution of Precipitation | Difference of Spatial Distribution of Terrain | Difference of Transmission Process | Plants Retention | ||||
| Empirical model | USLE | Raster | × | √ | √ | √ | × | [18,19,20] |
| Raster | √ | √ | × | × | × | [21] | ||
| Raster | √ | × | √ | × | × | [21,22] | ||
| SCS–CN | Raster | × | × | × | √ | × | [23,24] | |
| VSA–CN | Raster | × | × | × | √ | × | [23,24] | |
| Raster | × | × | × | √ | × | [25,26] | ||
| Raster | × | × | × | × | √ | [27] | ||
| Mechanism model | SWAT | HRUs | × | √ | √ | √ | × | [15] |
| AnnAGNPS | Small watershed | × | √ | √ | √ | × | [16] | |
| HSPF | Small watershed | × | √ | √ | √ | × | [17] | |
| Data | Storage | Map Scale | Data Precision | Period |
|---|---|---|---|---|
| Digital Elevation Model | Grid | 1:50,000 | 30 × 30 m | 2013 |
| Land use | Shp | 1:100,000 | 30 × 30 m | 2013 |
| Soil type | Shp | 1:1000,000 | 2010 | |
| Vegetation coverage | Grid | 1:1000,000 | 1000 × 1000 m | 2016 |
| Stream | Shp | 1:250,000 | 2013 | |
| Administrative boundary | Shp | 1:250,000 | 2013 | |
| Meteorological data | *.txt and *.xls | — | Daily | 2013 |
| Hydrological and water quality data | *.txt and *.xls | — | Huangmao village | 2013 |
| Socioeconomic data | *.txt and *.xls | — | Years | 2013 |
| Agricultural Source | TN (t) | Percent (%) | TP (t) | Percent (%) |
|---|---|---|---|---|
| Rural population | 282.63 | 16.55 | 27.69 | 13.25 |
| Livestock and poultry | 384.79 | 22.53 | 99.70 | 47.69 |
| Cultivated land | 1040.36 | 60.92 | 81.65 | 39.06 |
| Total | 1707.78 | 100 | 209.03 | 100 |
| Year | TN (t) | TP (t) |
|---|---|---|
| 2013 | 427.51 | 55.27 |
| 2017 | 682.19 | 59.53 |
| Trend | +59.57% | +7.71% |
| Study Area | Scale | Model | λTN | λTP | Reference |
|---|---|---|---|---|---|
| Hongfenghu reservoir watershed | Mesoscale | PTRE-NPS | 0.03−0.36 | 0.03−0.42 | This study |
| Laodaohe watershed | Mesoscale | NANI | 0.042−0.155 | − | [39] |
| Haihe Basin | Large scale | ECM | 0.109−0.904 | 0.084−0.317 | [40] |
| Xinanjiang River Basin | Large scale | Investigation and monitoring | 0.20 | 0.21 | [41] |
| Downstream plain polder area of Ganjiang | Middle scale | Investigation | 0.141−0.143 (Rural population) | 0.129−0.137 (Rural population) | [42] |
| Laizhou Bay | Large scale | Pollutant load estimation method | 0.1 (Farmland) 0.25 (Rural population) 0.07 (Livestock) | 0.1 (Farmland) 0.25 (Rural population) 0.07 (Livestock) | [43] |
Publisher’s Note: MDPI stays neutral with regard to jurisdictional claims in published maps and institutional affiliations. |
© 2022 by the authors. Licensee MDPI, Basel, Switzerland. This article is an open access article distributed under the terms and conditions of the Creative Commons Attribution (CC BY) license (https://creativecommons.org/licenses/by/4.0/).
Share and Cite
Wang, M.; Geng, R. Redefining and Calculating the Pass-through Rate Coefficient of Nonpoint Source Pollutants at Different Spatial Scales. Water 2022, 14, 2217. https://doi.org/10.3390/w14142217
Wang M, Geng R. Redefining and Calculating the Pass-through Rate Coefficient of Nonpoint Source Pollutants at Different Spatial Scales. Water. 2022; 14(14):2217. https://doi.org/10.3390/w14142217
Chicago/Turabian StyleWang, Meng, and Runzhe Geng. 2022. "Redefining and Calculating the Pass-through Rate Coefficient of Nonpoint Source Pollutants at Different Spatial Scales" Water 14, no. 14: 2217. https://doi.org/10.3390/w14142217