3.2.1. Land Use Change
The statistics of land use area of the Ashe River Basin were carried out using ArcGIS software’s statistical categorization for three periods of 2000, 2010, and 2020, and the land use area changes were produced in
Table 6.
The main land types in the Ashe River basin are arable land and forest land, as shown in
Table 6. In the years 2000, 2010, and 2020, 3234.92 km
2 (92.4%), 3227.92 km
2 (92.2%), and 3115.89 km
2 (89.0%), respectively, are inhabited. The area of arable land, forest land, and grassland has been steadily decreasing according to many types of statistics. The amount of water, urban land, and undeveloped land, on the other hand, is gradually increasing. Arable land shrinks the most, by 27.34 km
2 from 2000 to 2010, and by 72.95 km
2 from 2010 to 2020, followed by forest land, which grows by 17.89 km
2 from 2000 to 2010 but then shrinks by 38.45 km
2 from 2010. From 2000 to 2020, grassland declines by 17.02 km
2, while the increase or decrease of the water area is the least among the six kinds. From 2000 to 2010, 1.03 km
2 decreased, then increased by 2.37 km
2 from 2010. Both urban and unused land are expanding, with 92.07 and 44.50 km
2 added, respectively. Both land for urban use and unused land are increasing, with 92.07 and 44.50 km
2 increases, respectively.
Overall, the decline in arable land, grassland, and forest land is the highest, totaling 100.29 km2; on the other hand, the rise in urban land is the largest, totaling 92.07 km2.
Land use change can also be analyzed using a land use dynamic degree [
30], which uses a single land use type to depict the rate of change of that type through time, with the formula written as Equation (4).
where
is a particular land use single land use dynamic degree during the study period,
is the area of a certain land use/cover type at moment
a at the beginning of the study (km
2),
is the area of a certain land use/cover type at moment
b at the beginning of the study (km
2),
is the length of the study period, and if the unit is year,
is the dynamic degree of a certain land use in the study area during the time period.
When > 0, it means that the area of the type is in a gradual growth trend; on the contrary, when < 0, it means that the area of the type is in a decreasing trend. Meanwhile, when = 0, it means that the area of the type in the area has not changed during this period.
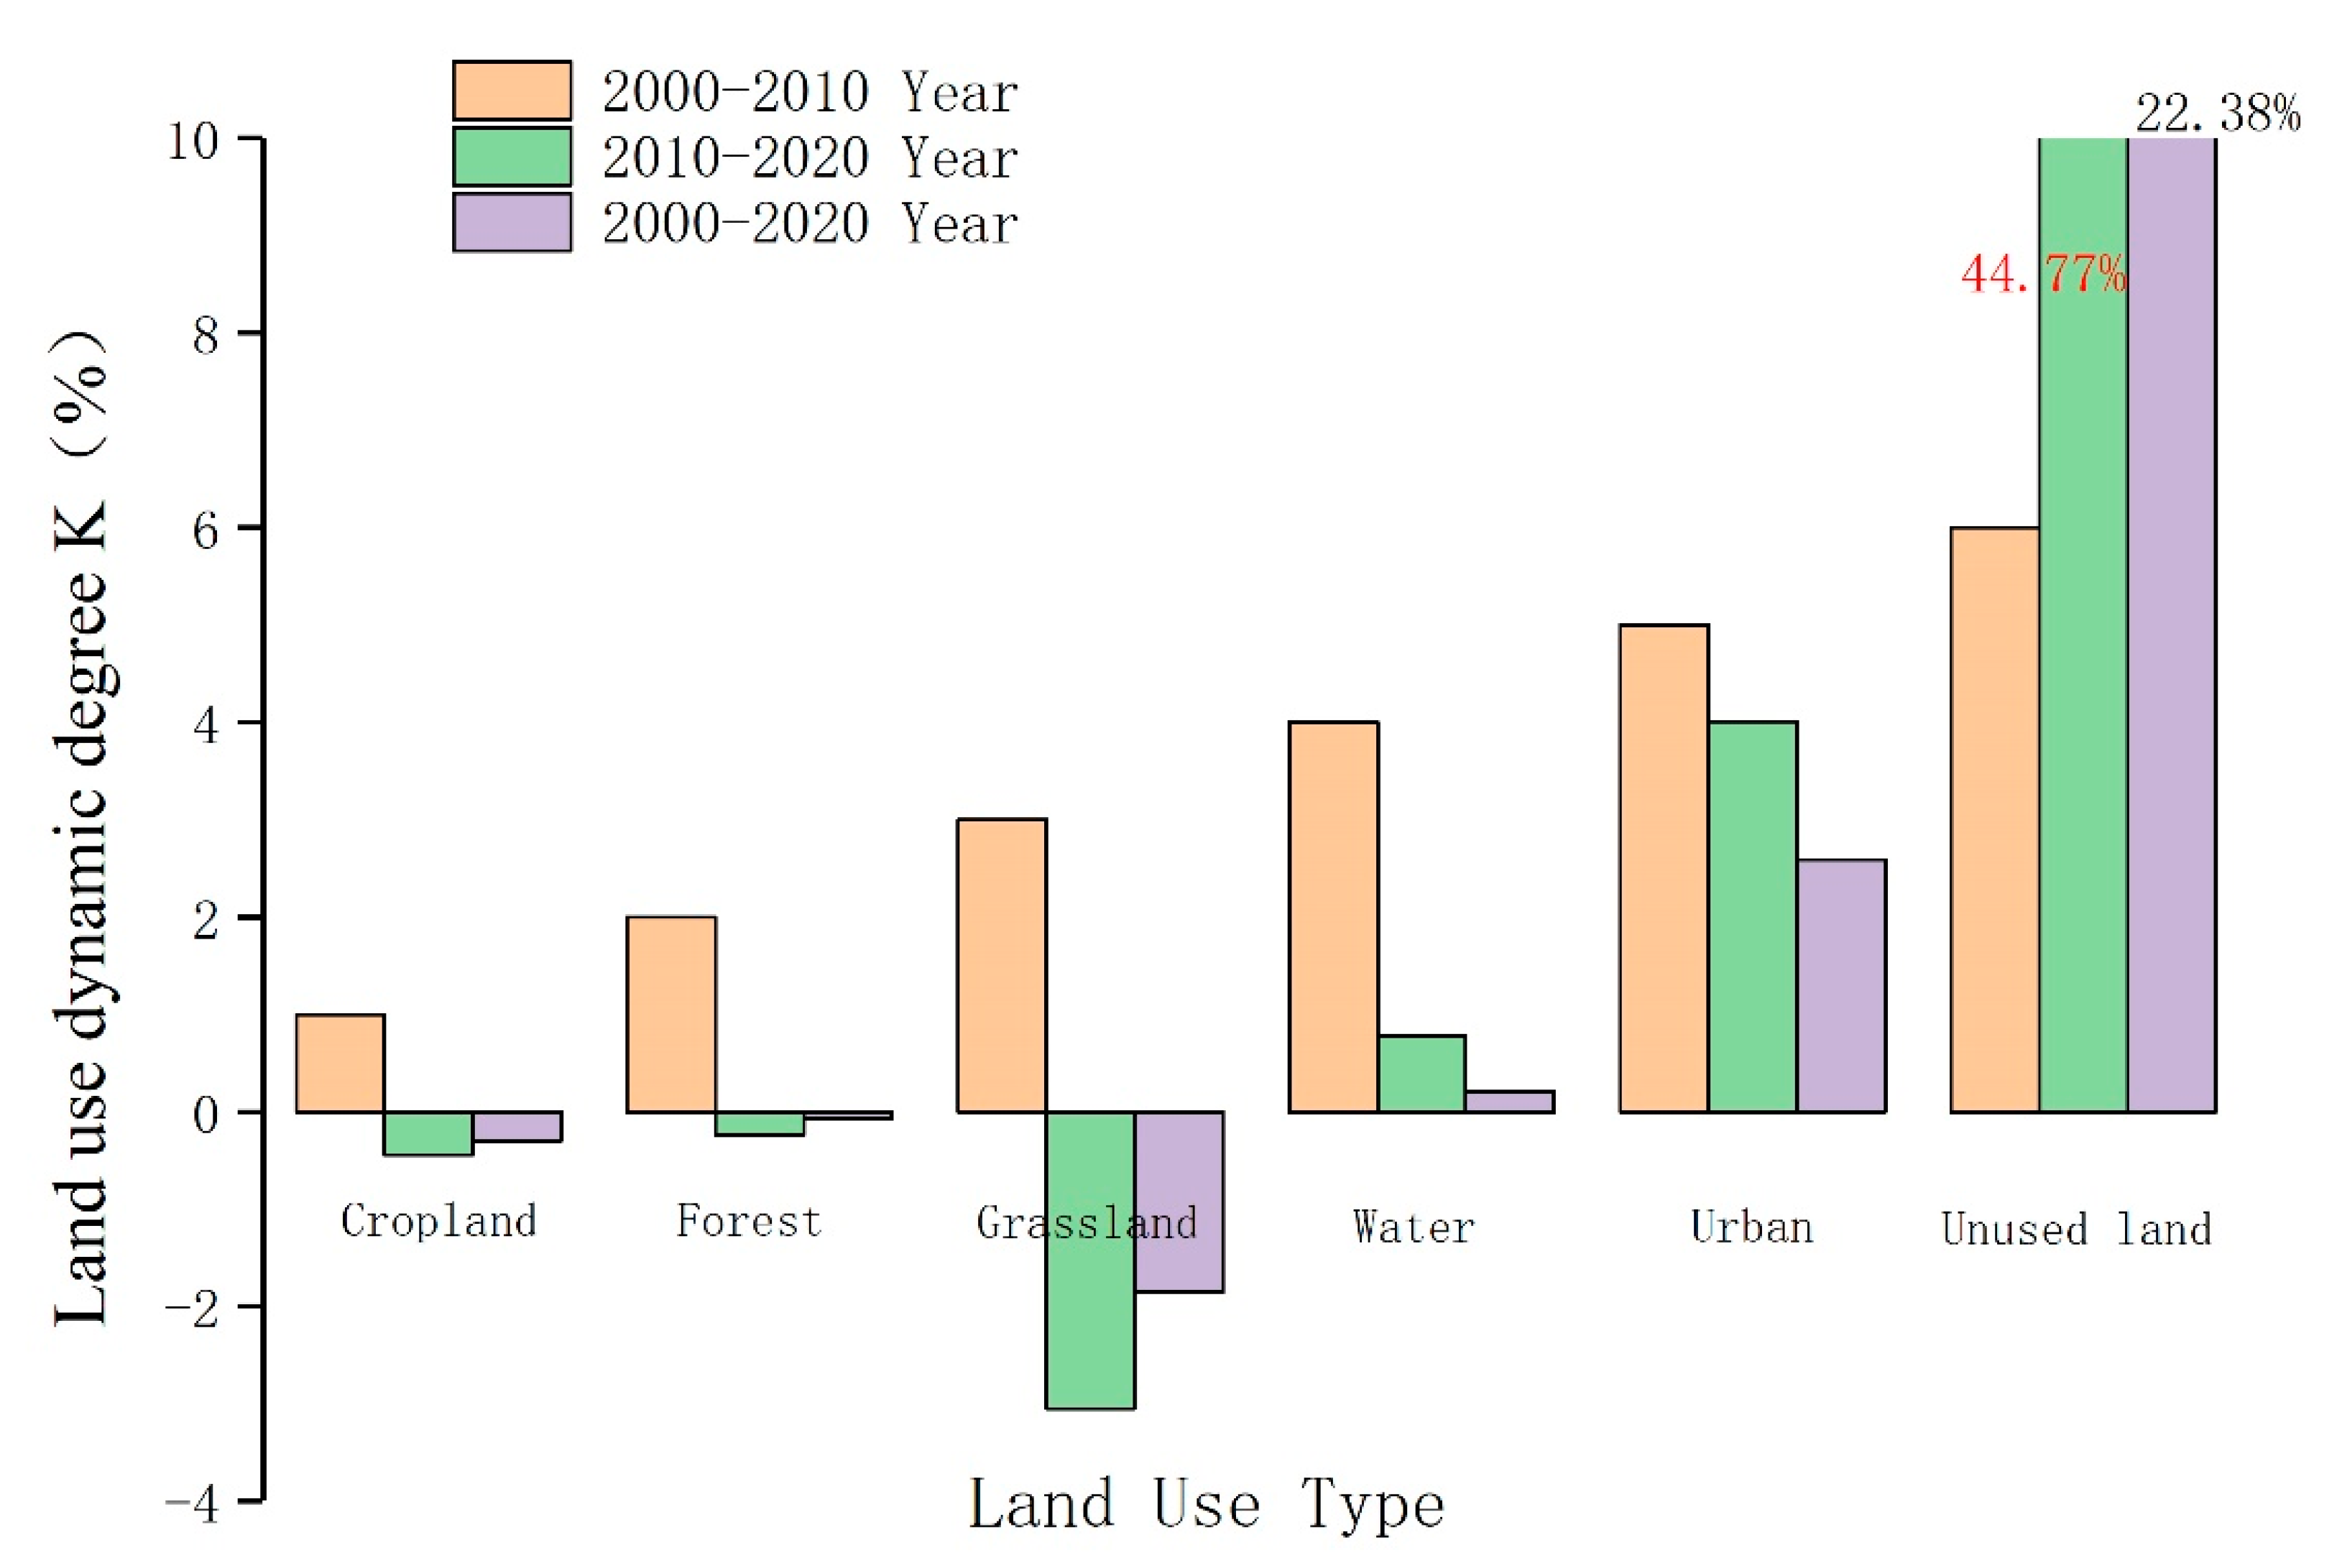
Table 6 depicts that arable land and grassland have been declining in recent years, while unused land and urban land have been rising, forest land has been increasing and then reducing, and watershed has been falling and then increasing. The largest increases in the magnitude of land use from the dynamic degree in the period 2000–2010 is in towns, with a coefficient of 0.83%, while the largest reduction is in grasslands, with a coefficient of −0.94%. Cropland and forest land are changing at slower paces of −0.16 and −0.11%, respectively. −0.33% is a moderate rate of change in water area. The state of undeveloped land remained stable. From 2000 to 2020 as a whole, the most significant change, excluding the change in unused land, is in urban land, followed by grassland, with 2.59% and −1.85%, respectively. The gradual growth of urban land is closely related to the economic development within the ARB. From 2000 to 2020 as a whole, the most significant change, excluding the change in unused land, is in urban land, followed by grassland, with 2.59% and −1.85%, respectively. The gradual growth of urban land is closely related to the economic development within the ARB. The dynamic degree of land use is shown in
Figure 10, which is presented by means of markers because 44.77% of unused land varies too much from 22.38% and other values.
3.2.2. Land Use Transfer Matrix
From the analysis of changes in land use quantities as well as dynamic degrees, only a single change of situation can be known. However, the total area of the watershed constant, as well as the matrix transfer table, can be evaluated by changes in land use types through time. The land use matrix can reflect dynamic information on the change of various land types over time and can be studied by the area transferred into and out of a certain land area over time [
31].
The matrix expression is Equation (5).
where
is the area of the land use type in the
i-th land use type conversion
,
indicates the total number of land use types.
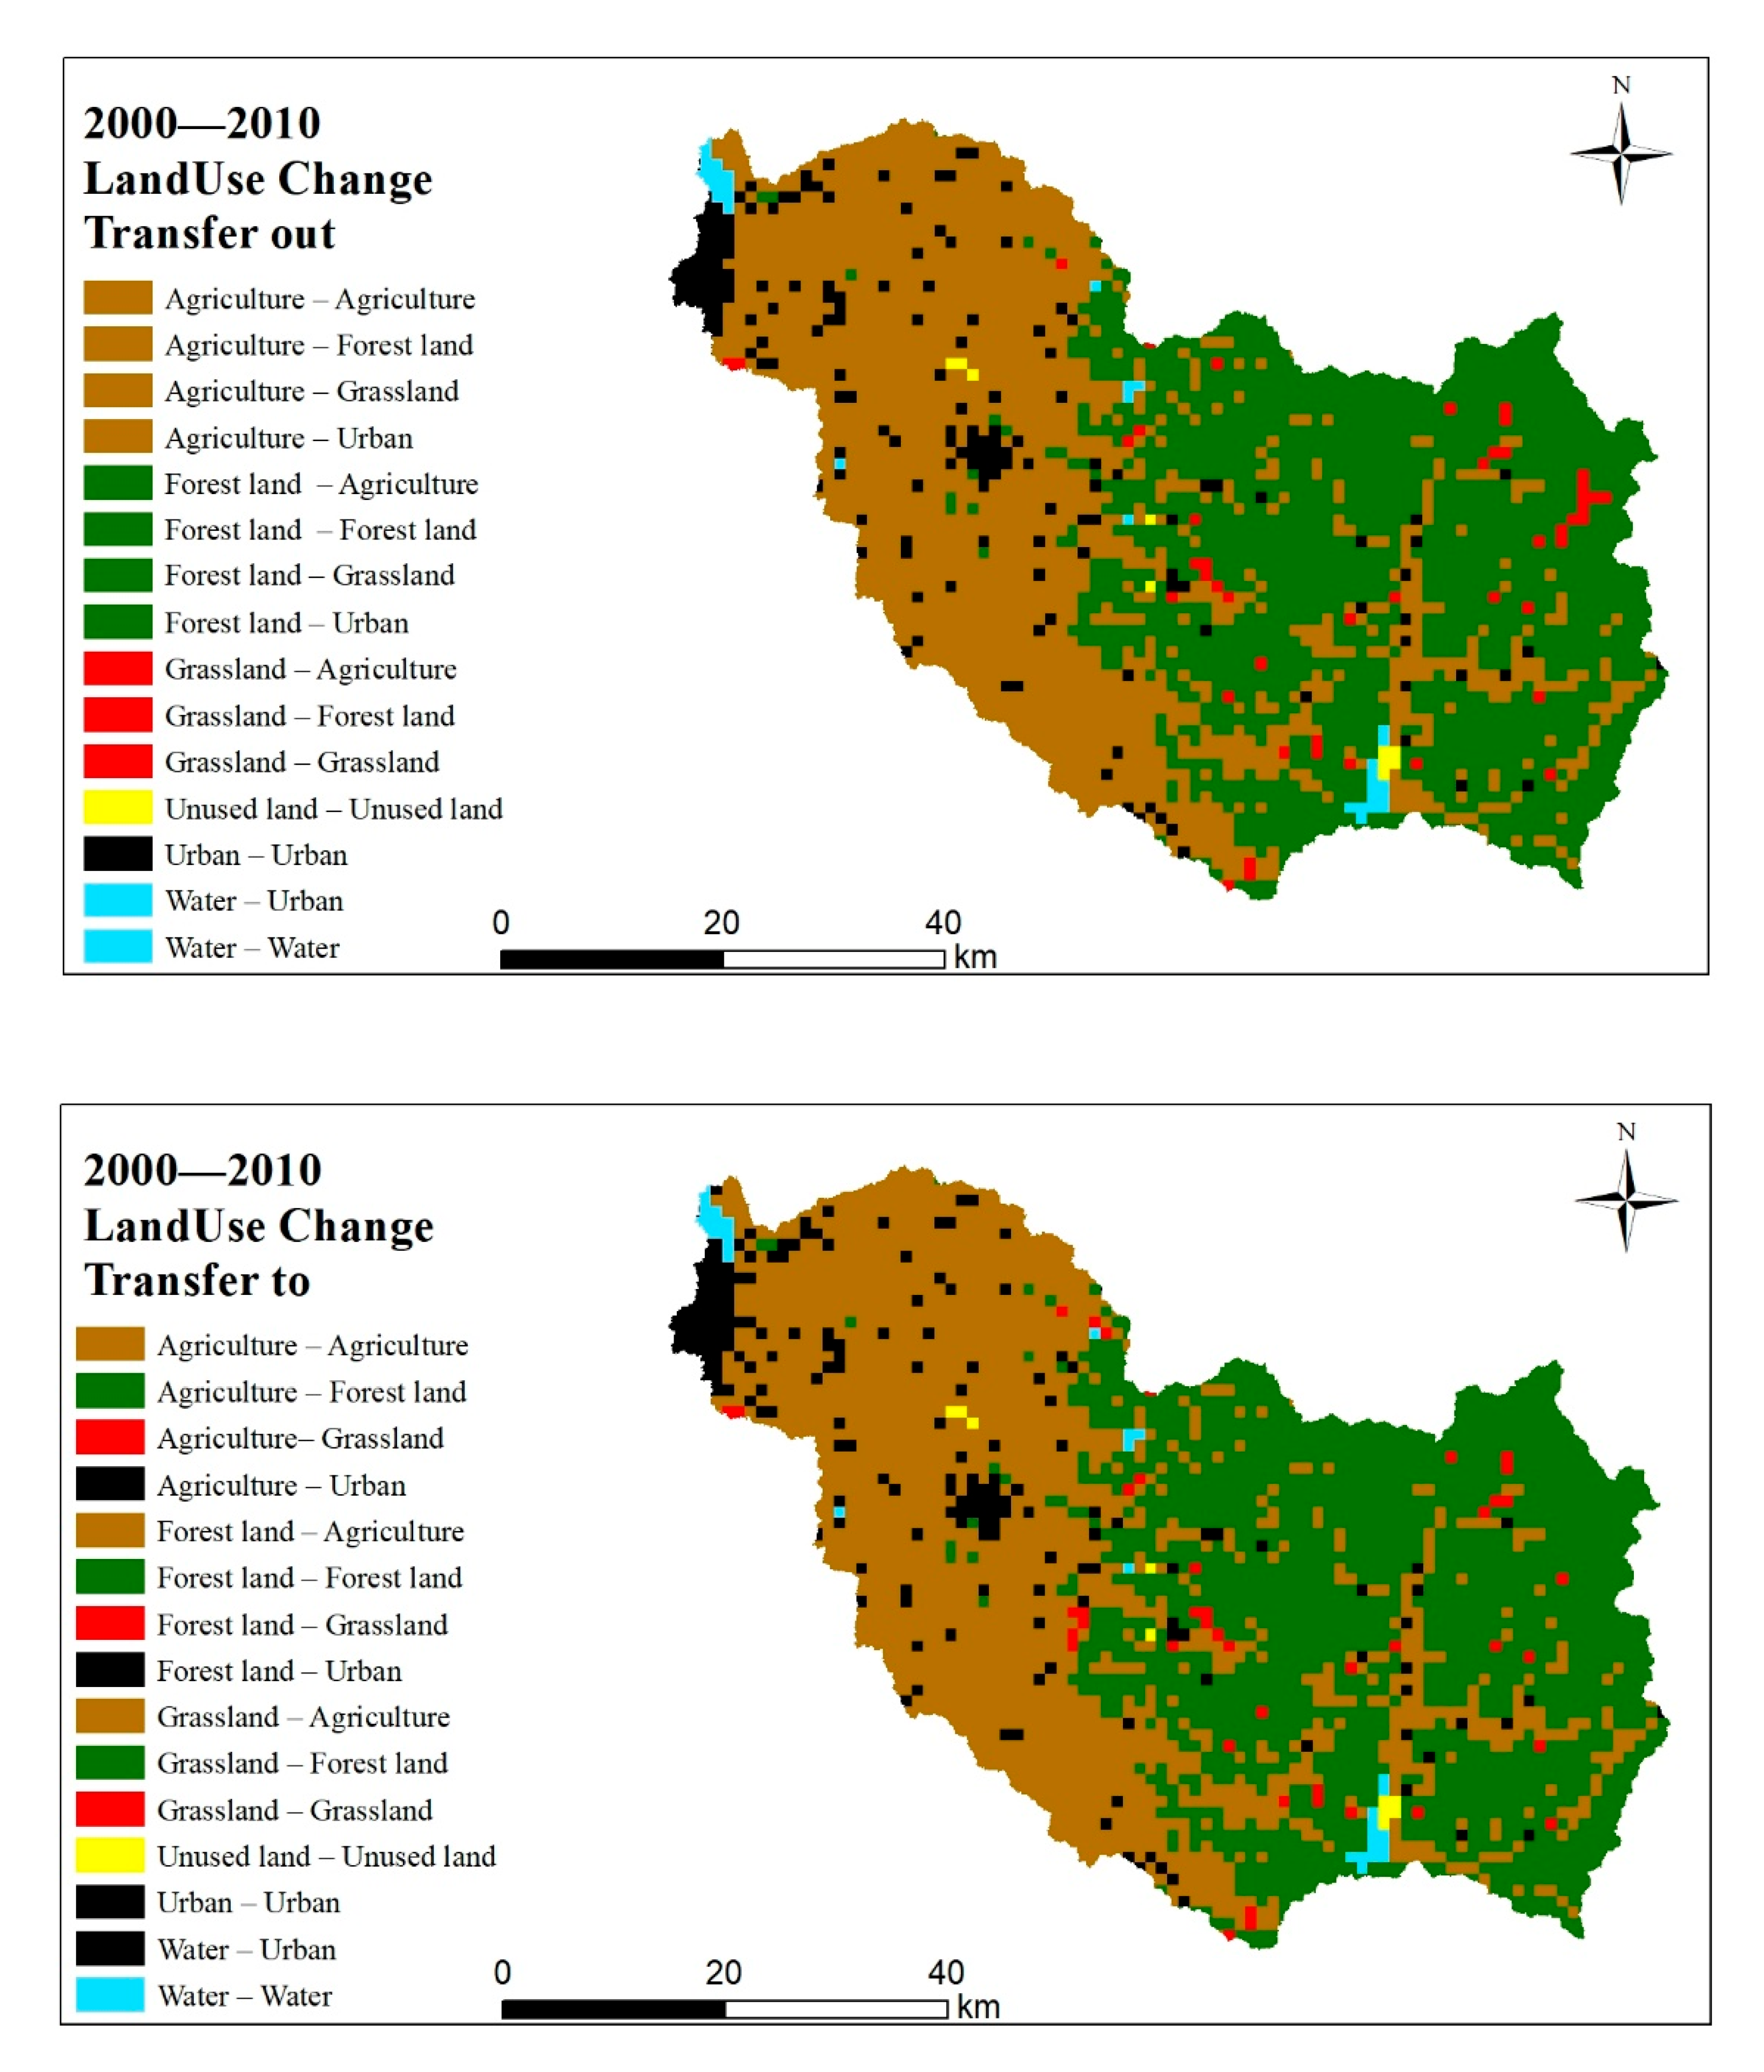
According to
Table 7, the transfer out in 2000 was as follows: initially, the majority of the arable land was transferred out to urban and forest land, with just a tiny portion transferred out to grassland. The total area transported out was 12.73, 10.91, and 5.78 km
2. The area of forest land transferred to cropland, grassland, and urban land is 1.04 km
2; grassland is mostly transferred to forest land, with an area of 10.10 km
2 accounting for 22% of grassland area; and there is essentially no change in water, urban land, and unused land. The area of arable land transferred to forest land and grassland is equal but tiny at 1.01 km
2; forest land was transferred from arable land and grassland to 10.91 and 10.10 km
2 correspondingly, and grassland was transferred to 5.78 km
2 of arable land area and 1.04 km
2 of forest land area. Through arable land, forest land, and water area, urban land was shifted to 12.73, 1.04, and 1.04 km
2, respectively. Taken as a whole, the land use transition from 2000 to 2010 was minimal since development was still in its early stages. The most arable land, forest land, and grassland were transferred out, with 29.43, 3.12, and 11.15 km
2 transferred out, respectively.
There are two diagrams in
Figure 11, representing the transfer out and transfer in of land use. We can see the same color of each transfer out by the transfer out graph, while in the bottom one we can compare well that the transfer out part is transformed into a different land use. For example, in the middle part of the unused land represented in red, some of it turns into yellow for cropland and some of it turns into green for forest land. (
Figure 11).
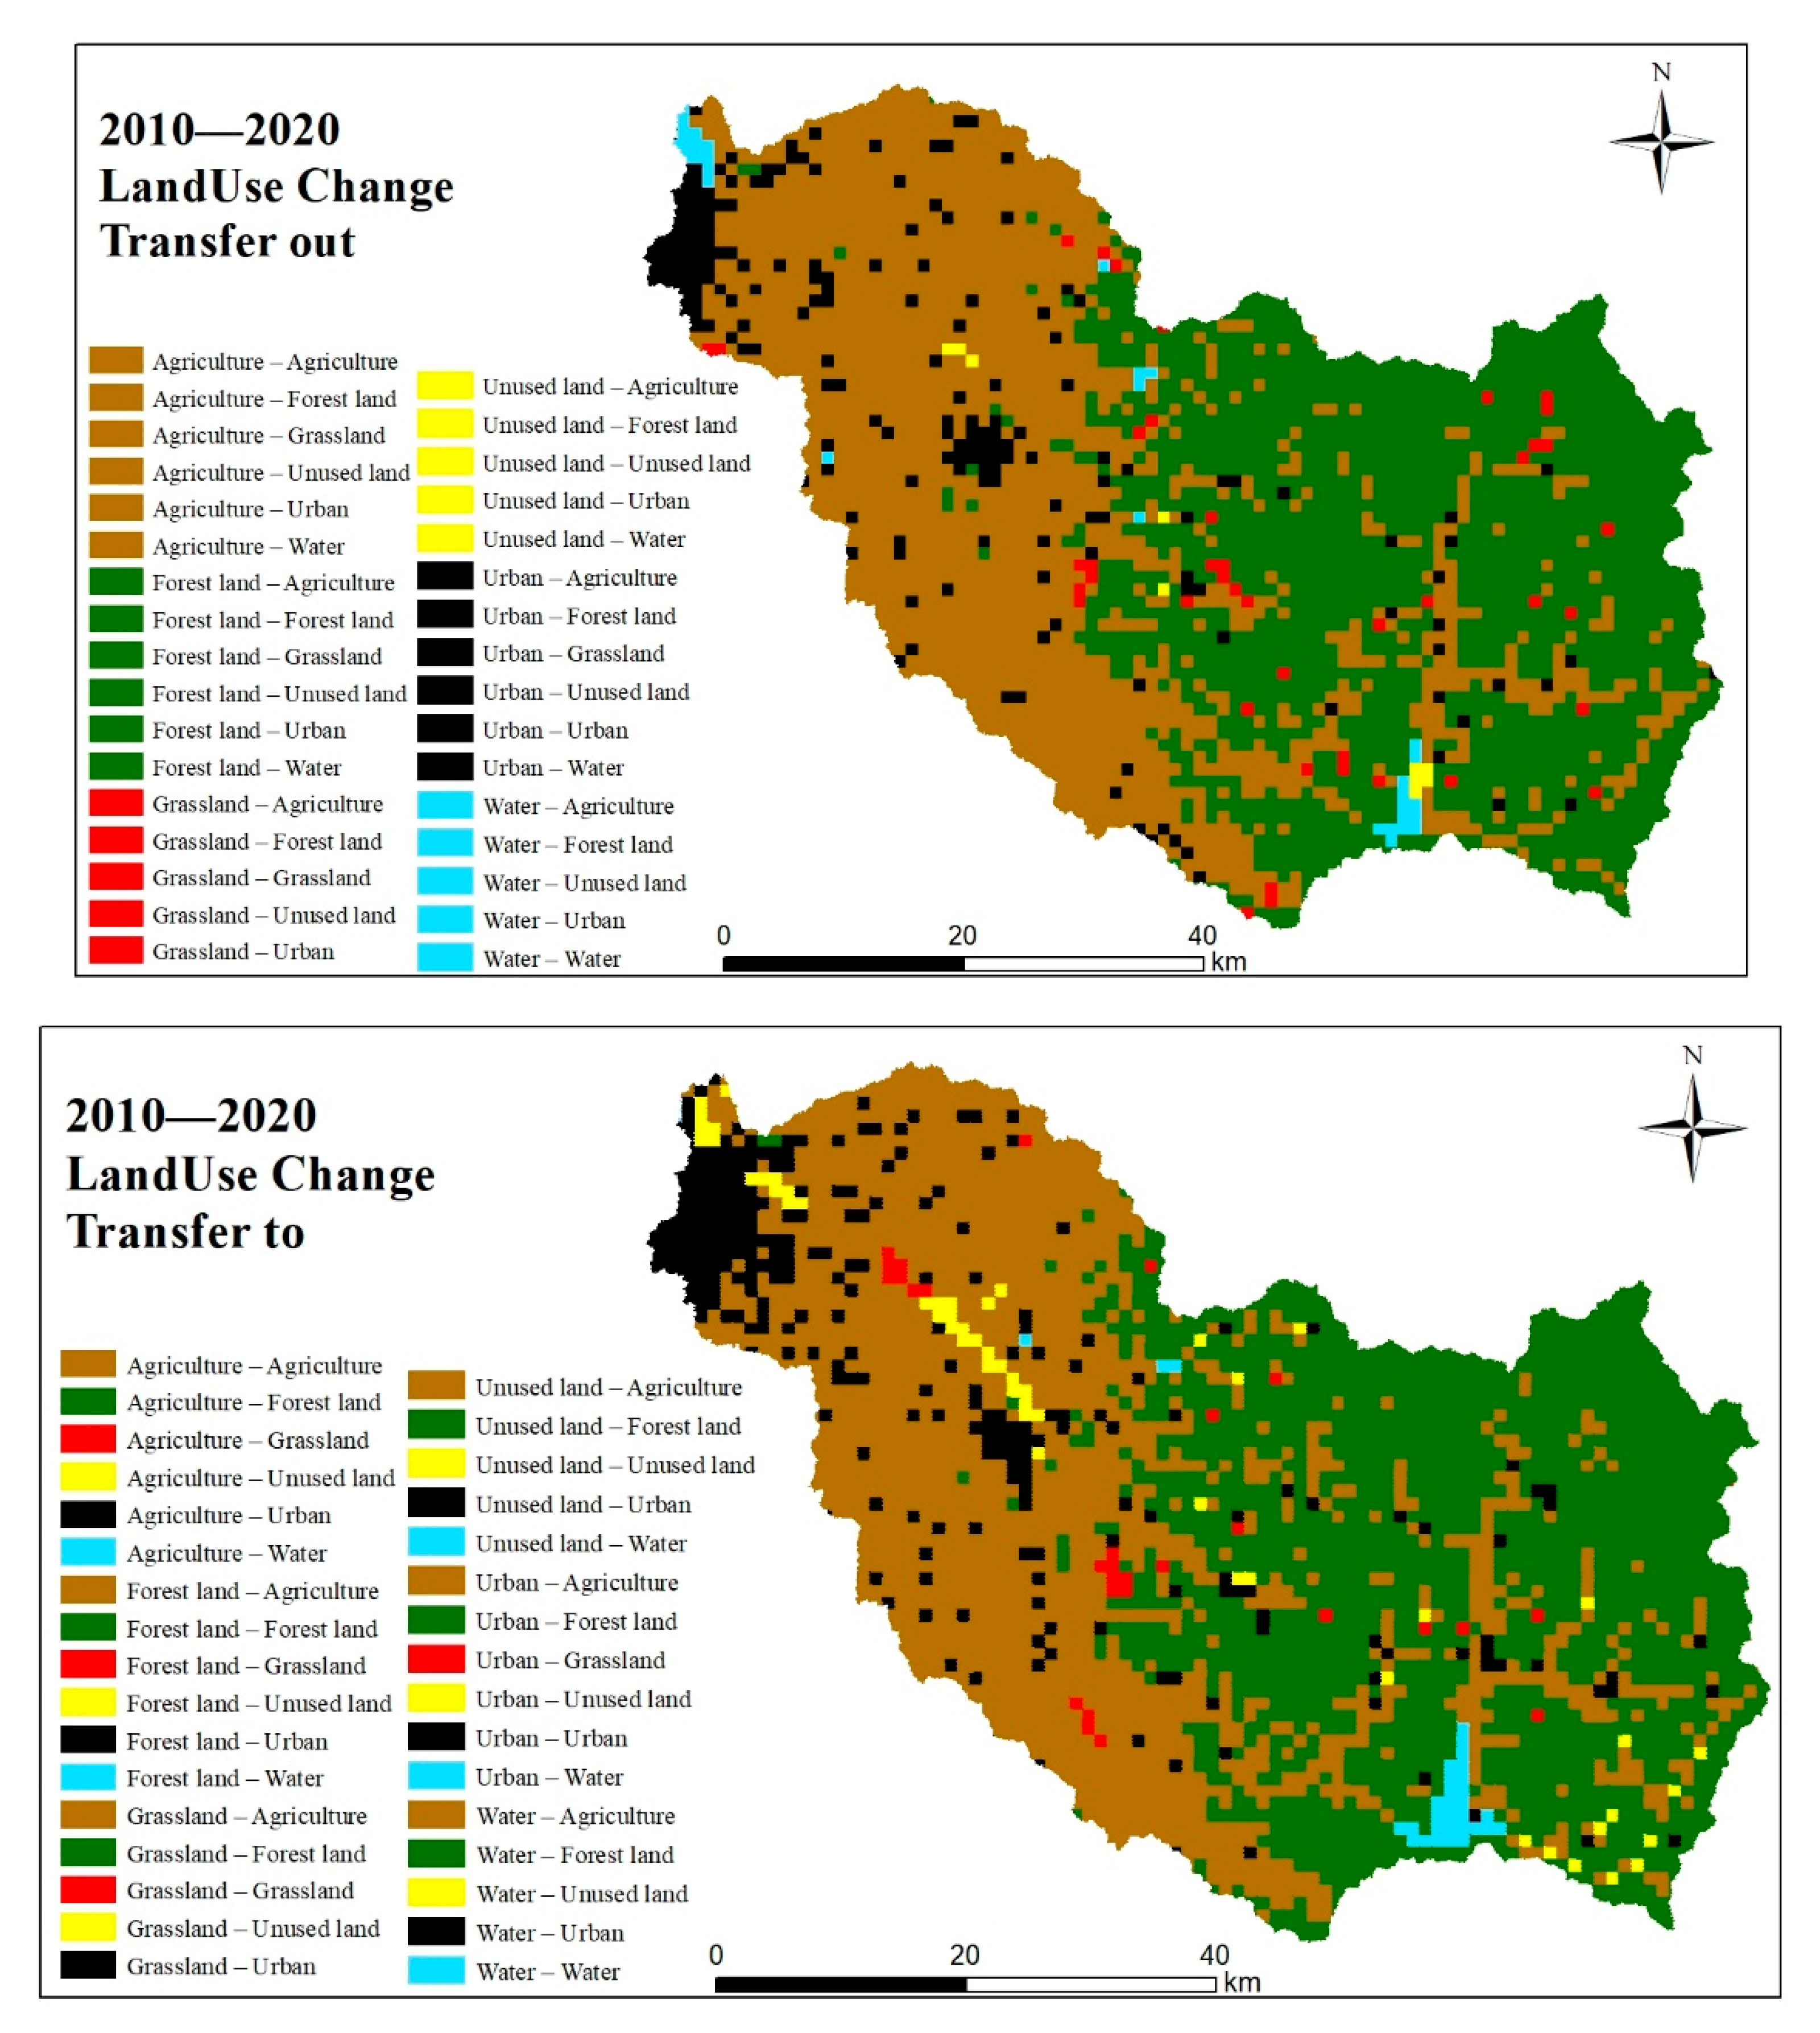
According to
Table 8, between 2010 and 2020, arable land was predominantly turned into forest land and towns, totaling 188.19 and 161.90 km
2, respectively, with a tiny part converted into grassland, water, and unused land. The transfer of forest land was primarily to cropland, with an area of 221.86 km
2 accounting for 14% of forest land. A small portion of urban land was turned into arable land, but as far as the 2010 transfer out is concerned, urban land increased by 161.90 km
2, which indicates that it is tending to be urbanized. 12.60 km
2 of grassland was transferred to cropland and 23.93 km
2 to forest land, accounting for 30 and 57% of grassland, respectively. The area transferred out of waters is smaller, but even the area transferred between unused land to waters is larger, accounting for more than half of the total. Concerning the 2020 transfer in, first and foremost, agricultural transfer in was mostly by forest land and urban land, with areas of 221.86 and 94.57 km
2, respectively. The area shifted from agriculture to forest land totals 188.19 km
2. In comparison to 2010, the area transferred from grassland to forest land totals 188.19 km
2. In comparison to 2010, the transfer of grassland is around 10 km
2 less than the transfer out; the major difference is the transfer of cropland, which reaches 161.90 km
2 and will reach 269.87 km
2 in 2020 (
Figure 12).
The land use changes were analyzed using the aforementioned tabular observations of the two time periods.
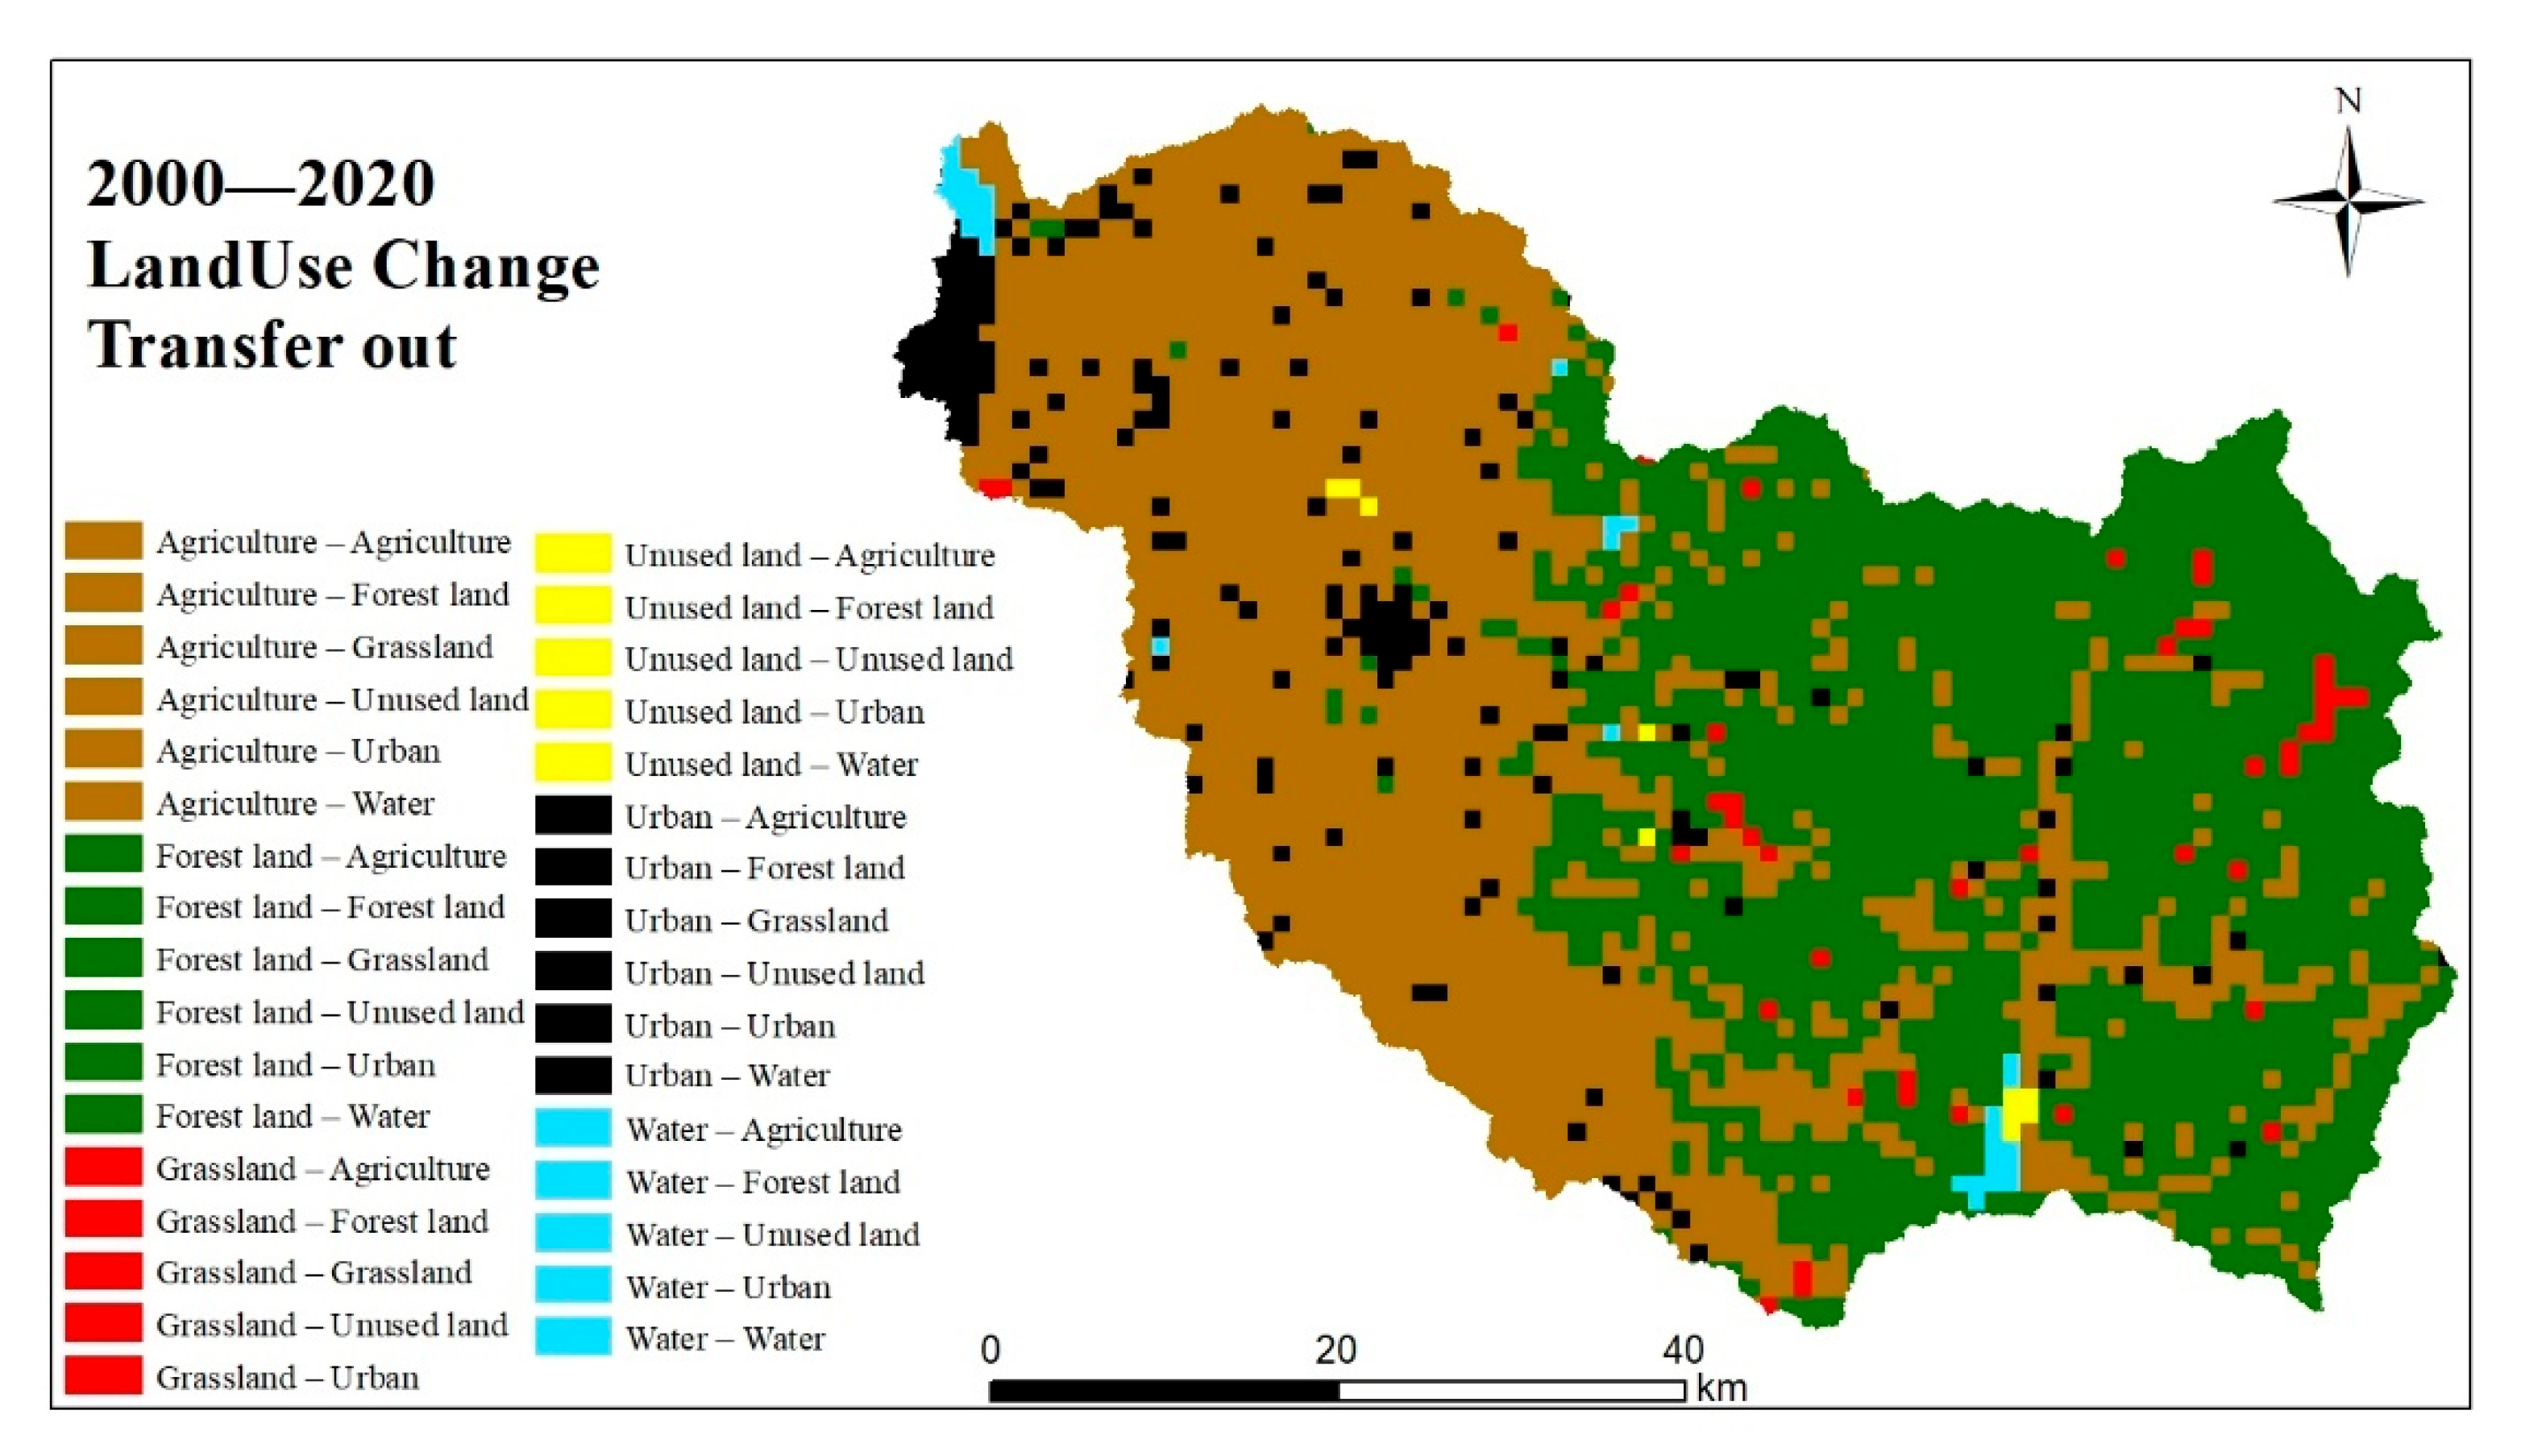
Table 9 shows the entire land use transfer matrix analysis for 2000–2020 to better examine the changes in land use area in the ARB.
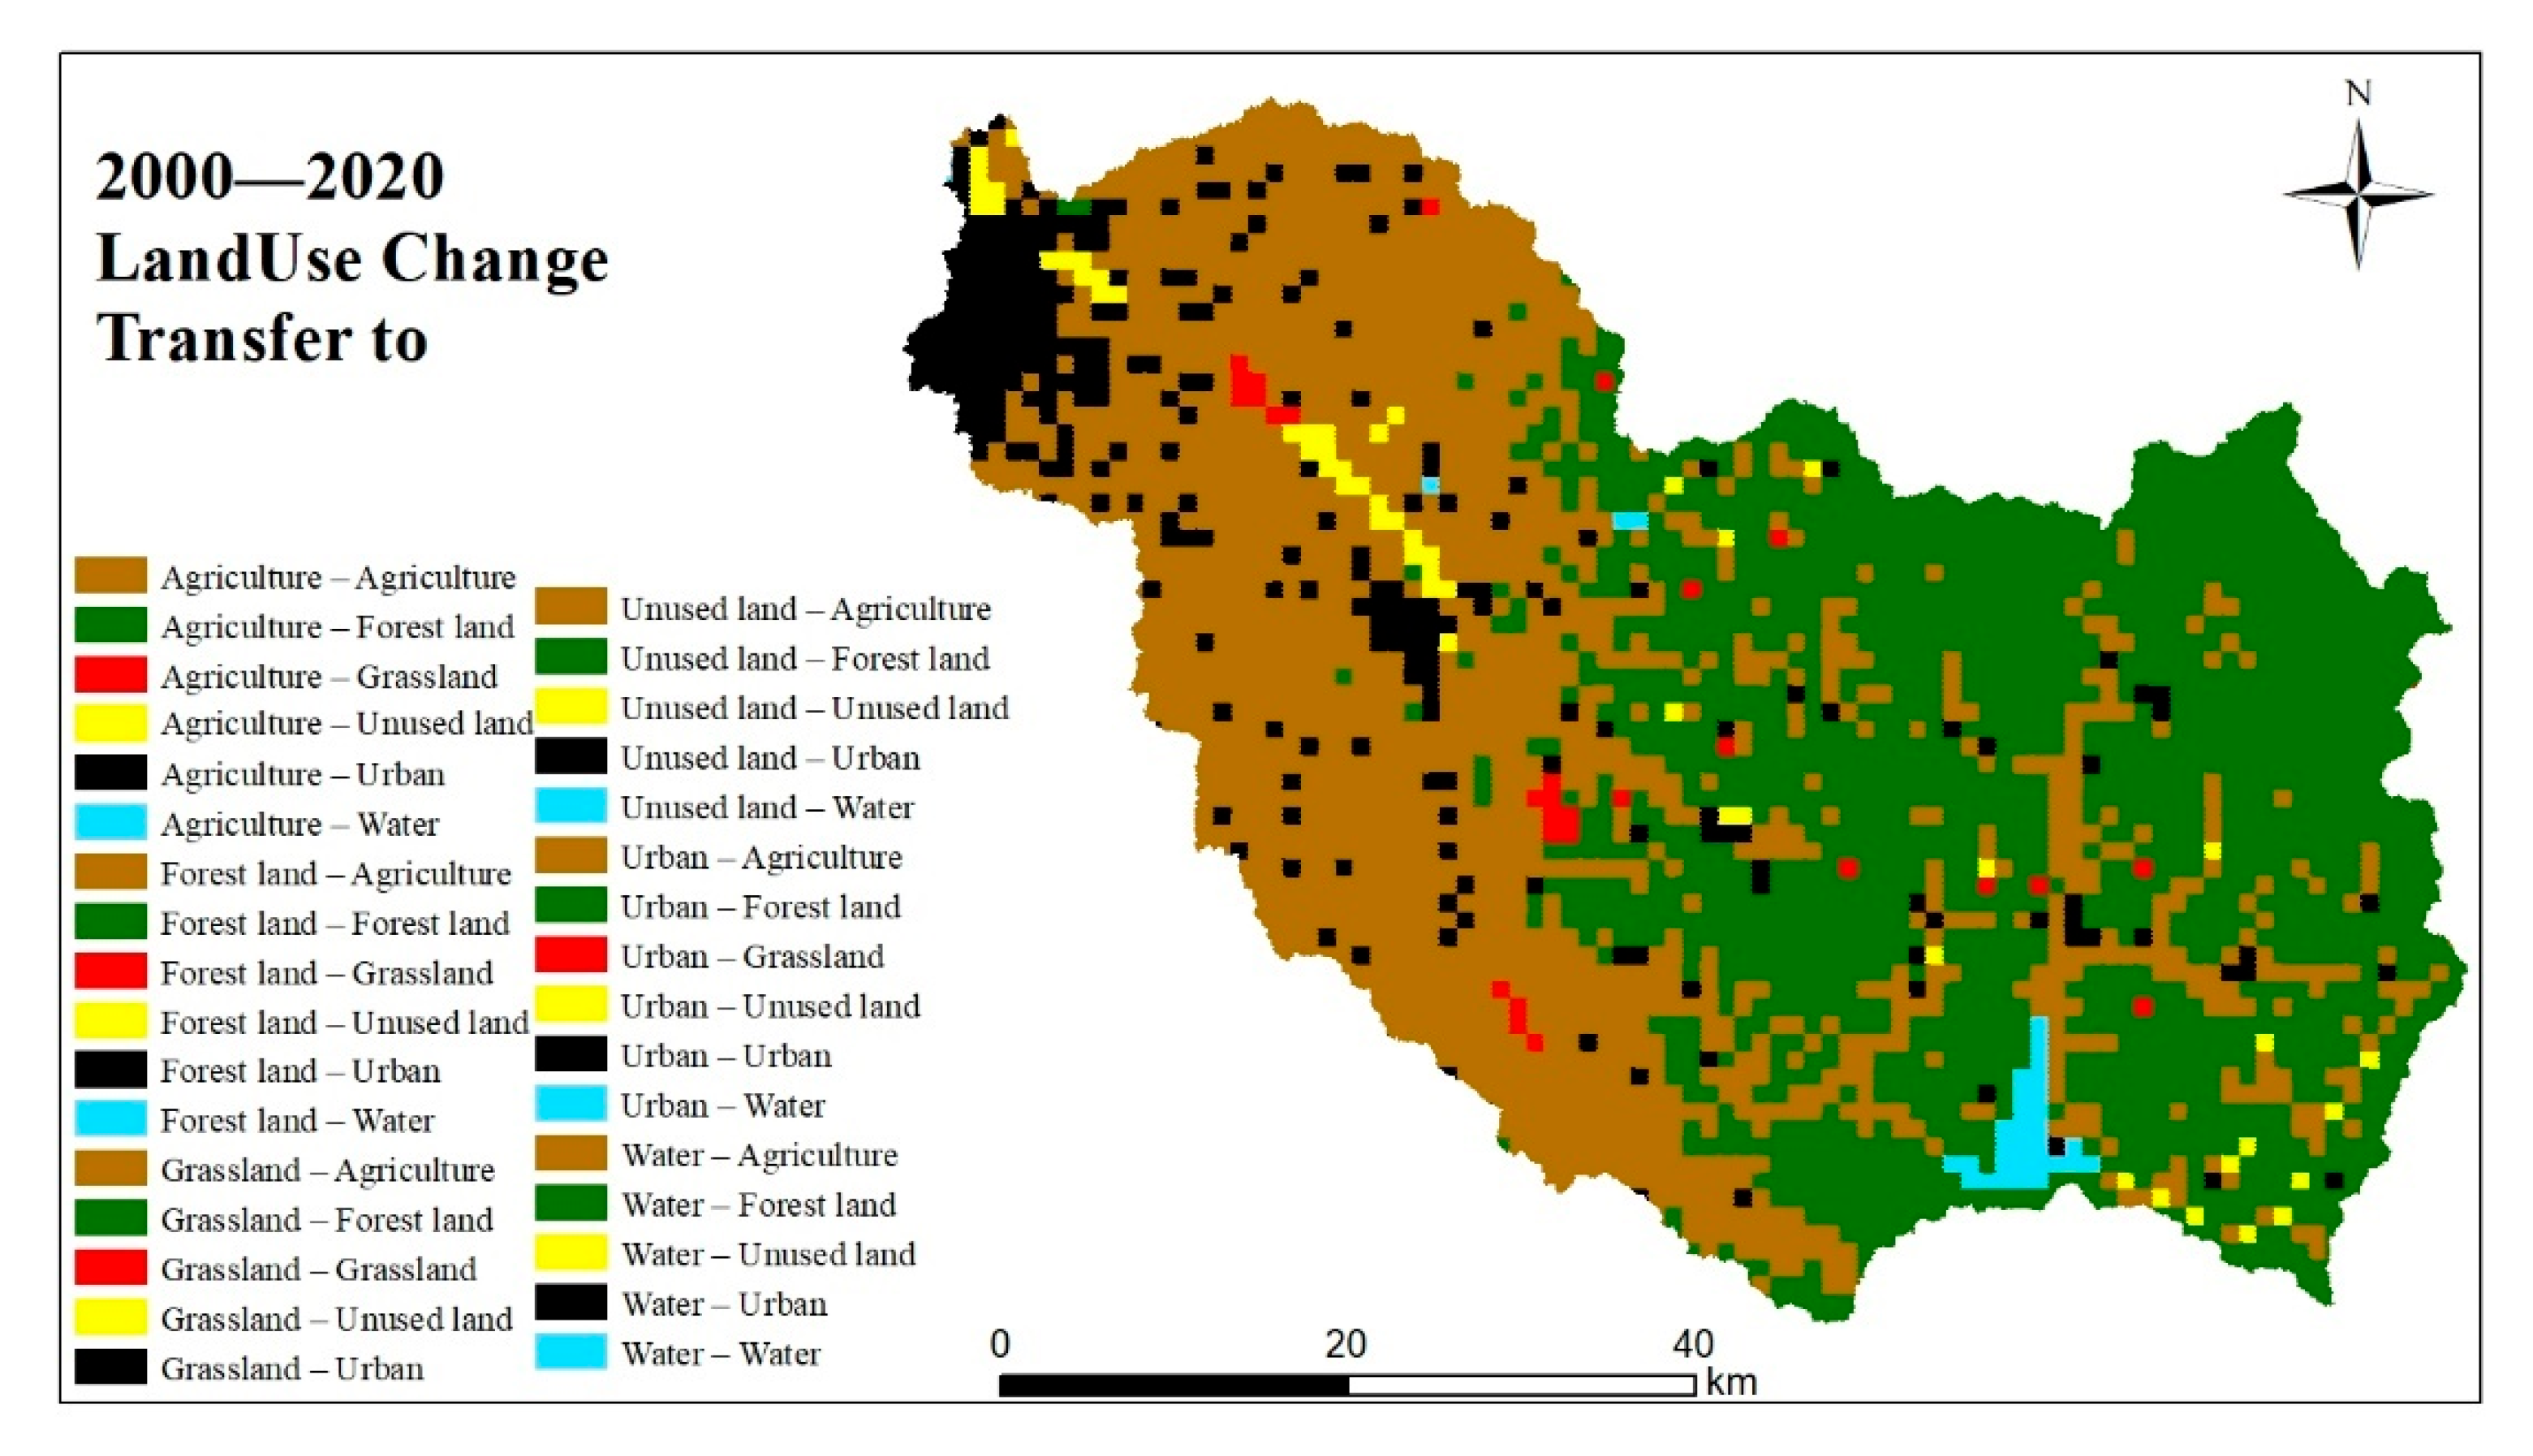
Looking at the land use types in the ARB over the last twenty-one years, 191.07 km2 of arable land transferred since 2000 has been transferred to forest land, while 171.82 km2 has been transferred to urban land. Forest land has primarily been transferred to arable land, with an area of 217.01 km2. Watershed is transferred into forest land, townland, and unused land, with areas of 6.32, 6.27, and 5.19 km2, respectively. Townland is mostly transferred out of arable land (90.97 km2), and unused land is mainly transferred out of watershed, with an area of 5.02 km2.
According to the transfer situation in 2020, arable land is primarily transferred through forest land and urban land, with areas of 217.01 and 90.97 km2, respectively. Forest land is primarily transferred through arable land and grassland, with areas of 191.07 and 33.29 km2, respectively.
Grassland is transferred from cropland and forest land, which provide areas of 15.36 and 10.24 km2, respectively. Water is transferred principally through 13.30 km2 of cropland, and urban land is transferred predominantly through cropland and forest land, which have areas of 171.82 and 19.77 km2, respectively. The percentage of unused land has increased from 9.94 in 2000 to 54.44 in 2020, owing primarily to population growth. The amount of unused land increased from 9.94 km2 in 2000 to 54.44 km2 in 2020, owing mostly to the transfer of 28.65 km2 of arable land and 14.77 km2 of forest land.
In summary, the mainland types transferred out are arable land and forest land, with 451.89 km
2 and 296.69 km
2 transferred out, respectively. Even though the area transferred out of grassland is just 46.03 km
2, the proportion of transferred out area is 99.9%. Cultivated land is the primary source of transfer to other types of land (
Figure 13).


