
Study of Non-Point Pollution in the Ashe River Basin Based on SWAT Model with Different Land Use


Abstract
:1. Introduction
2. Materials and Methods
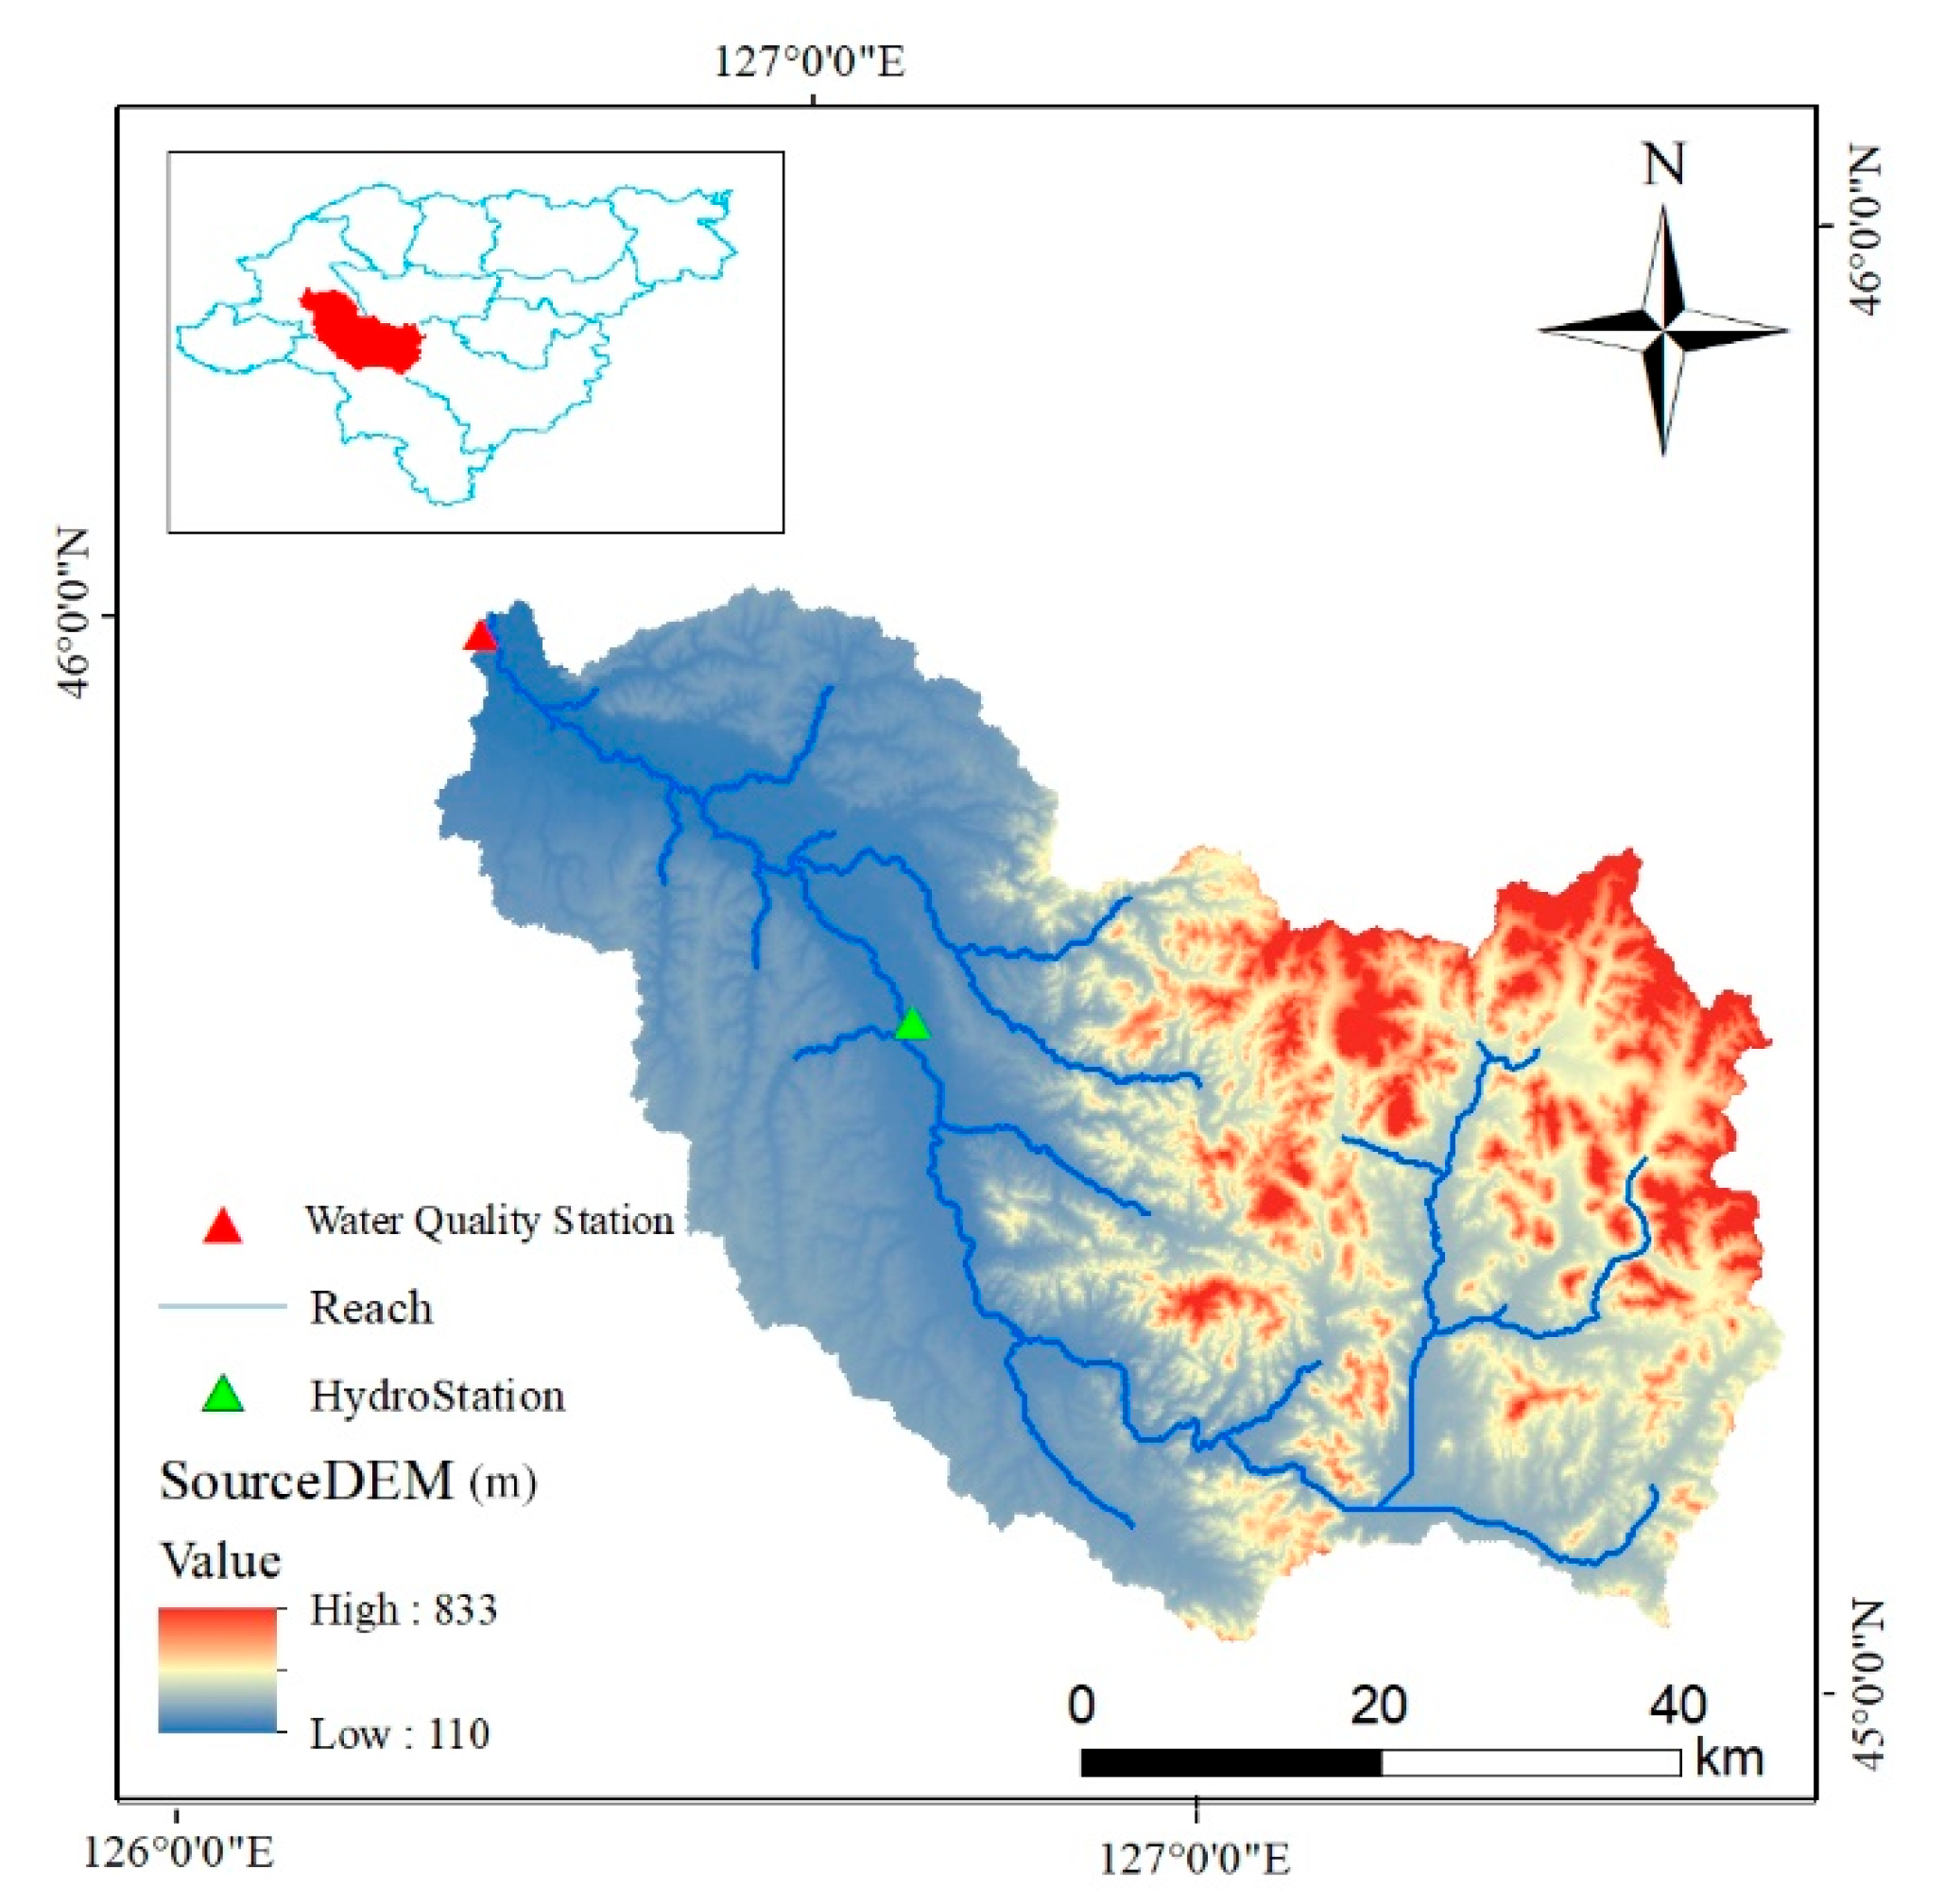
2.1. Study Area
2.2. Data Collection
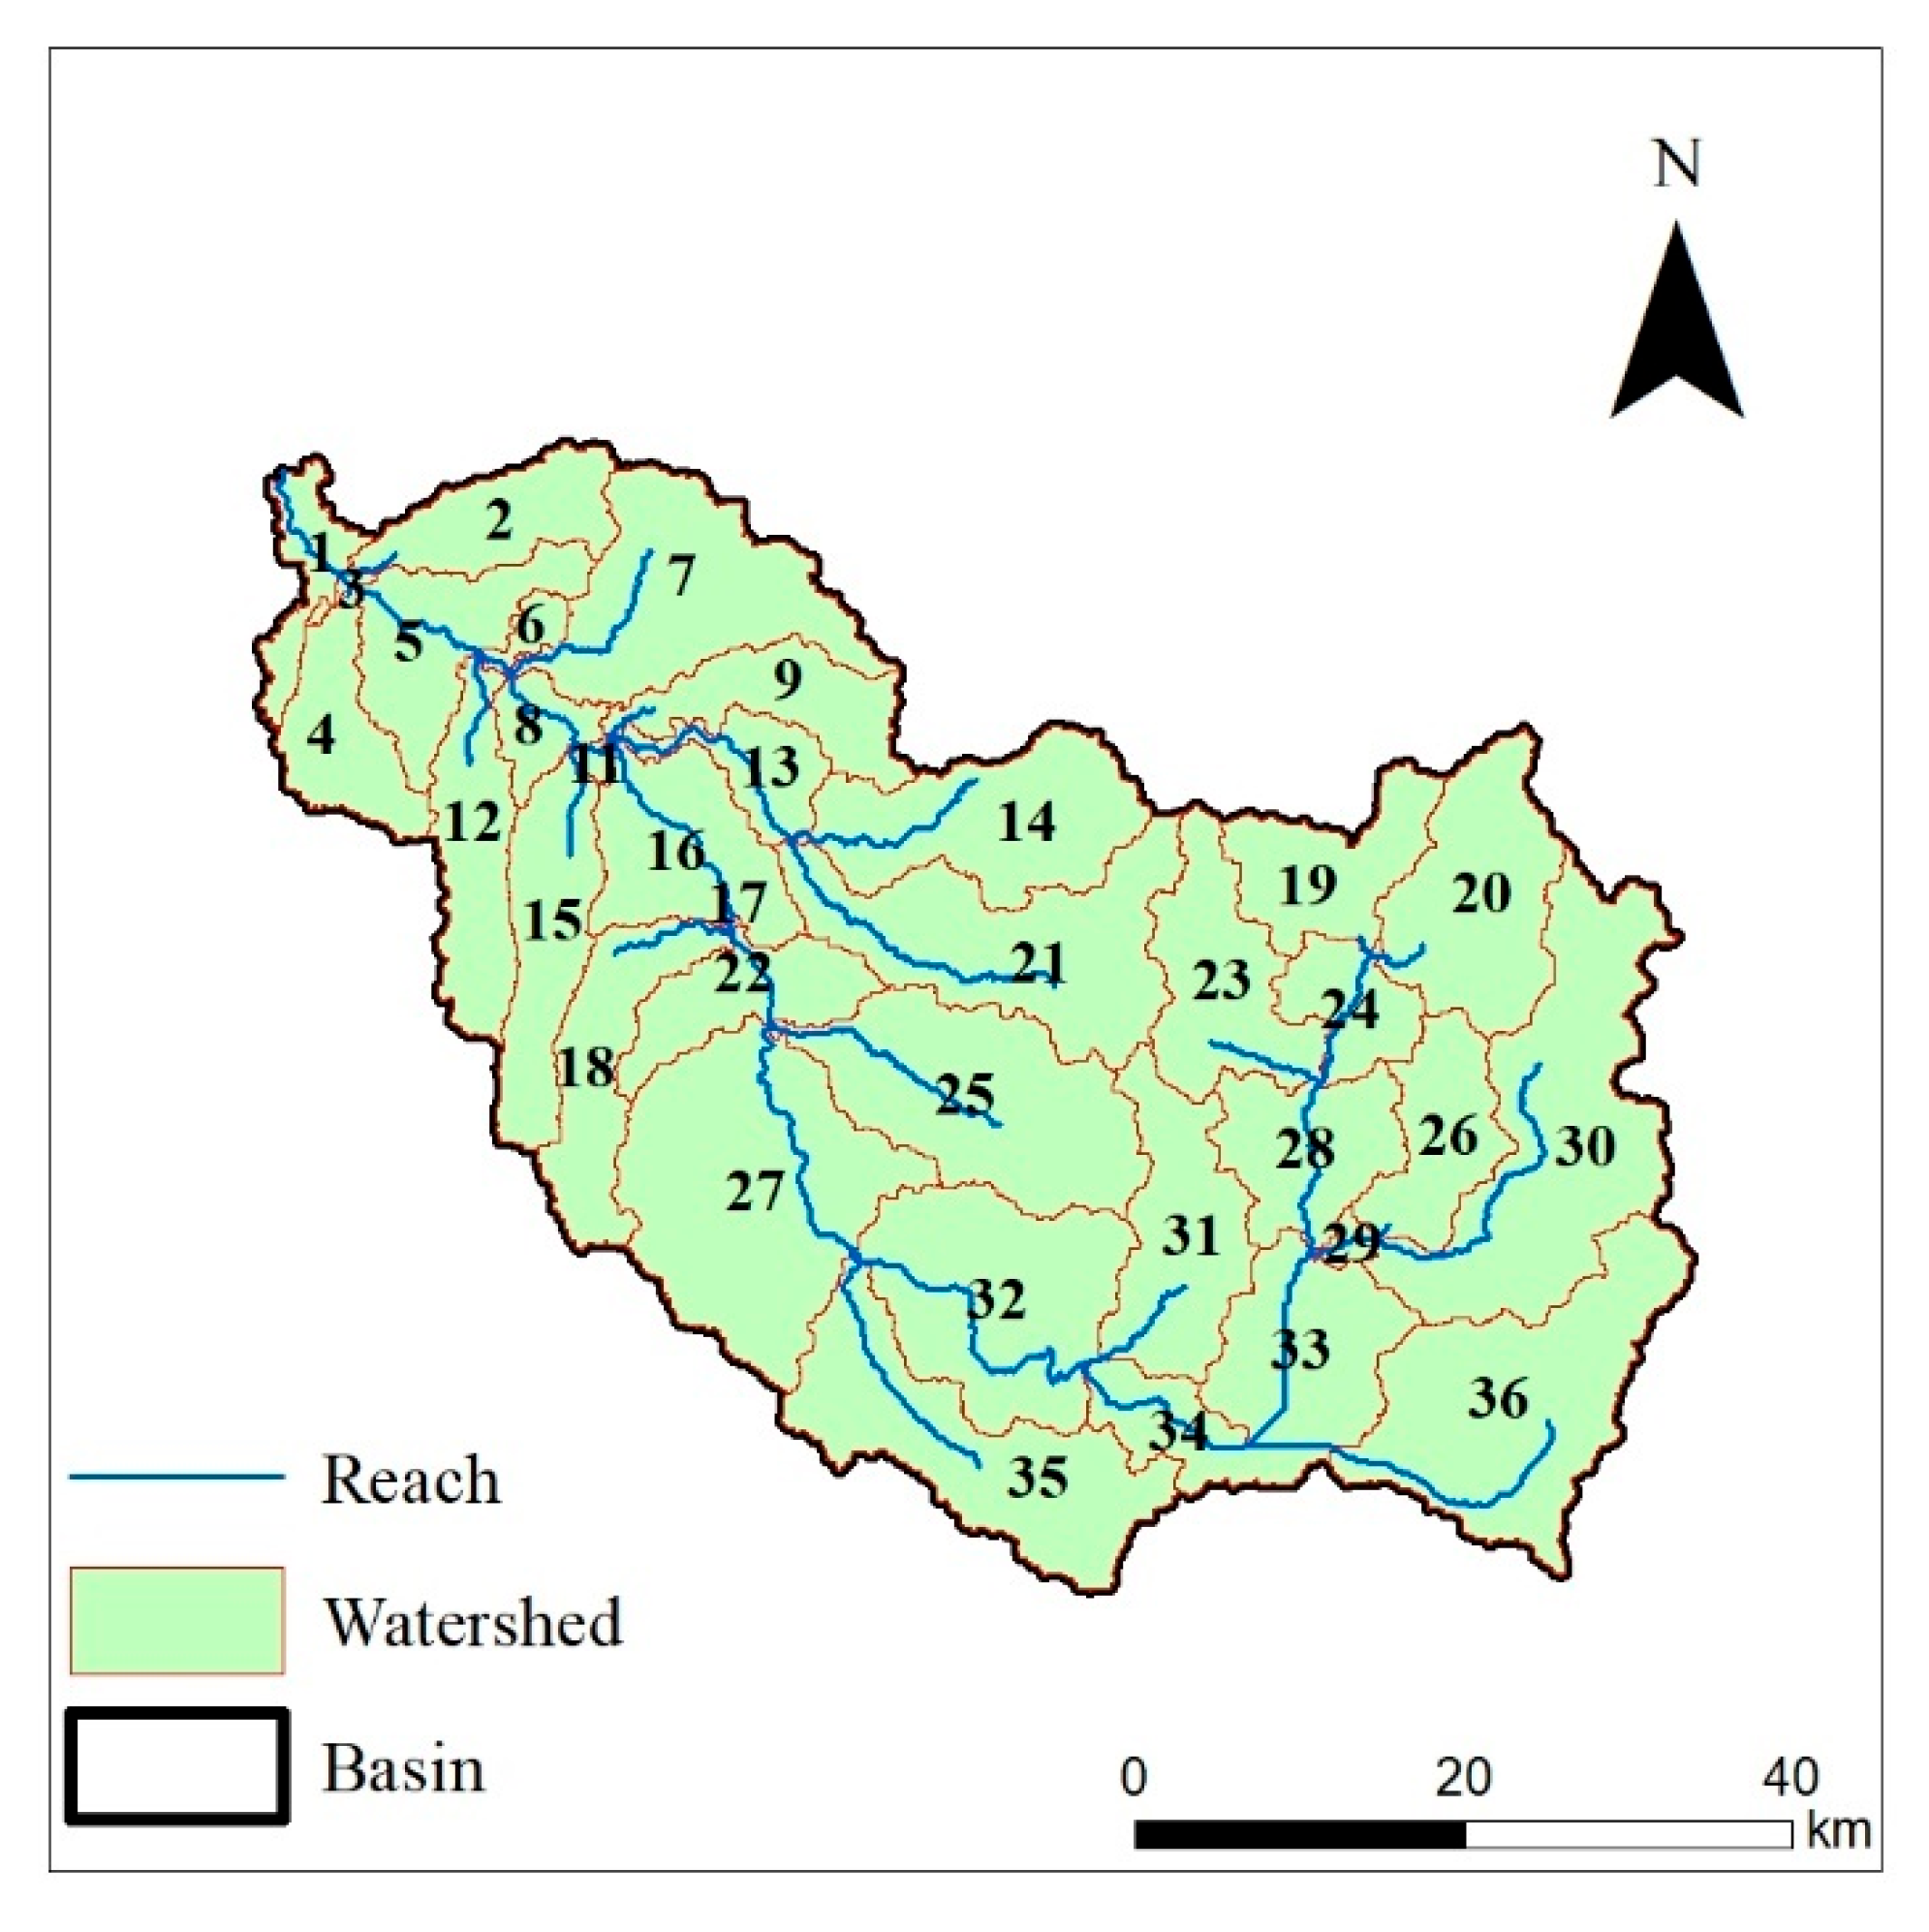
2.2.1. Watershed System Data
2.2.2. Types of Land Use
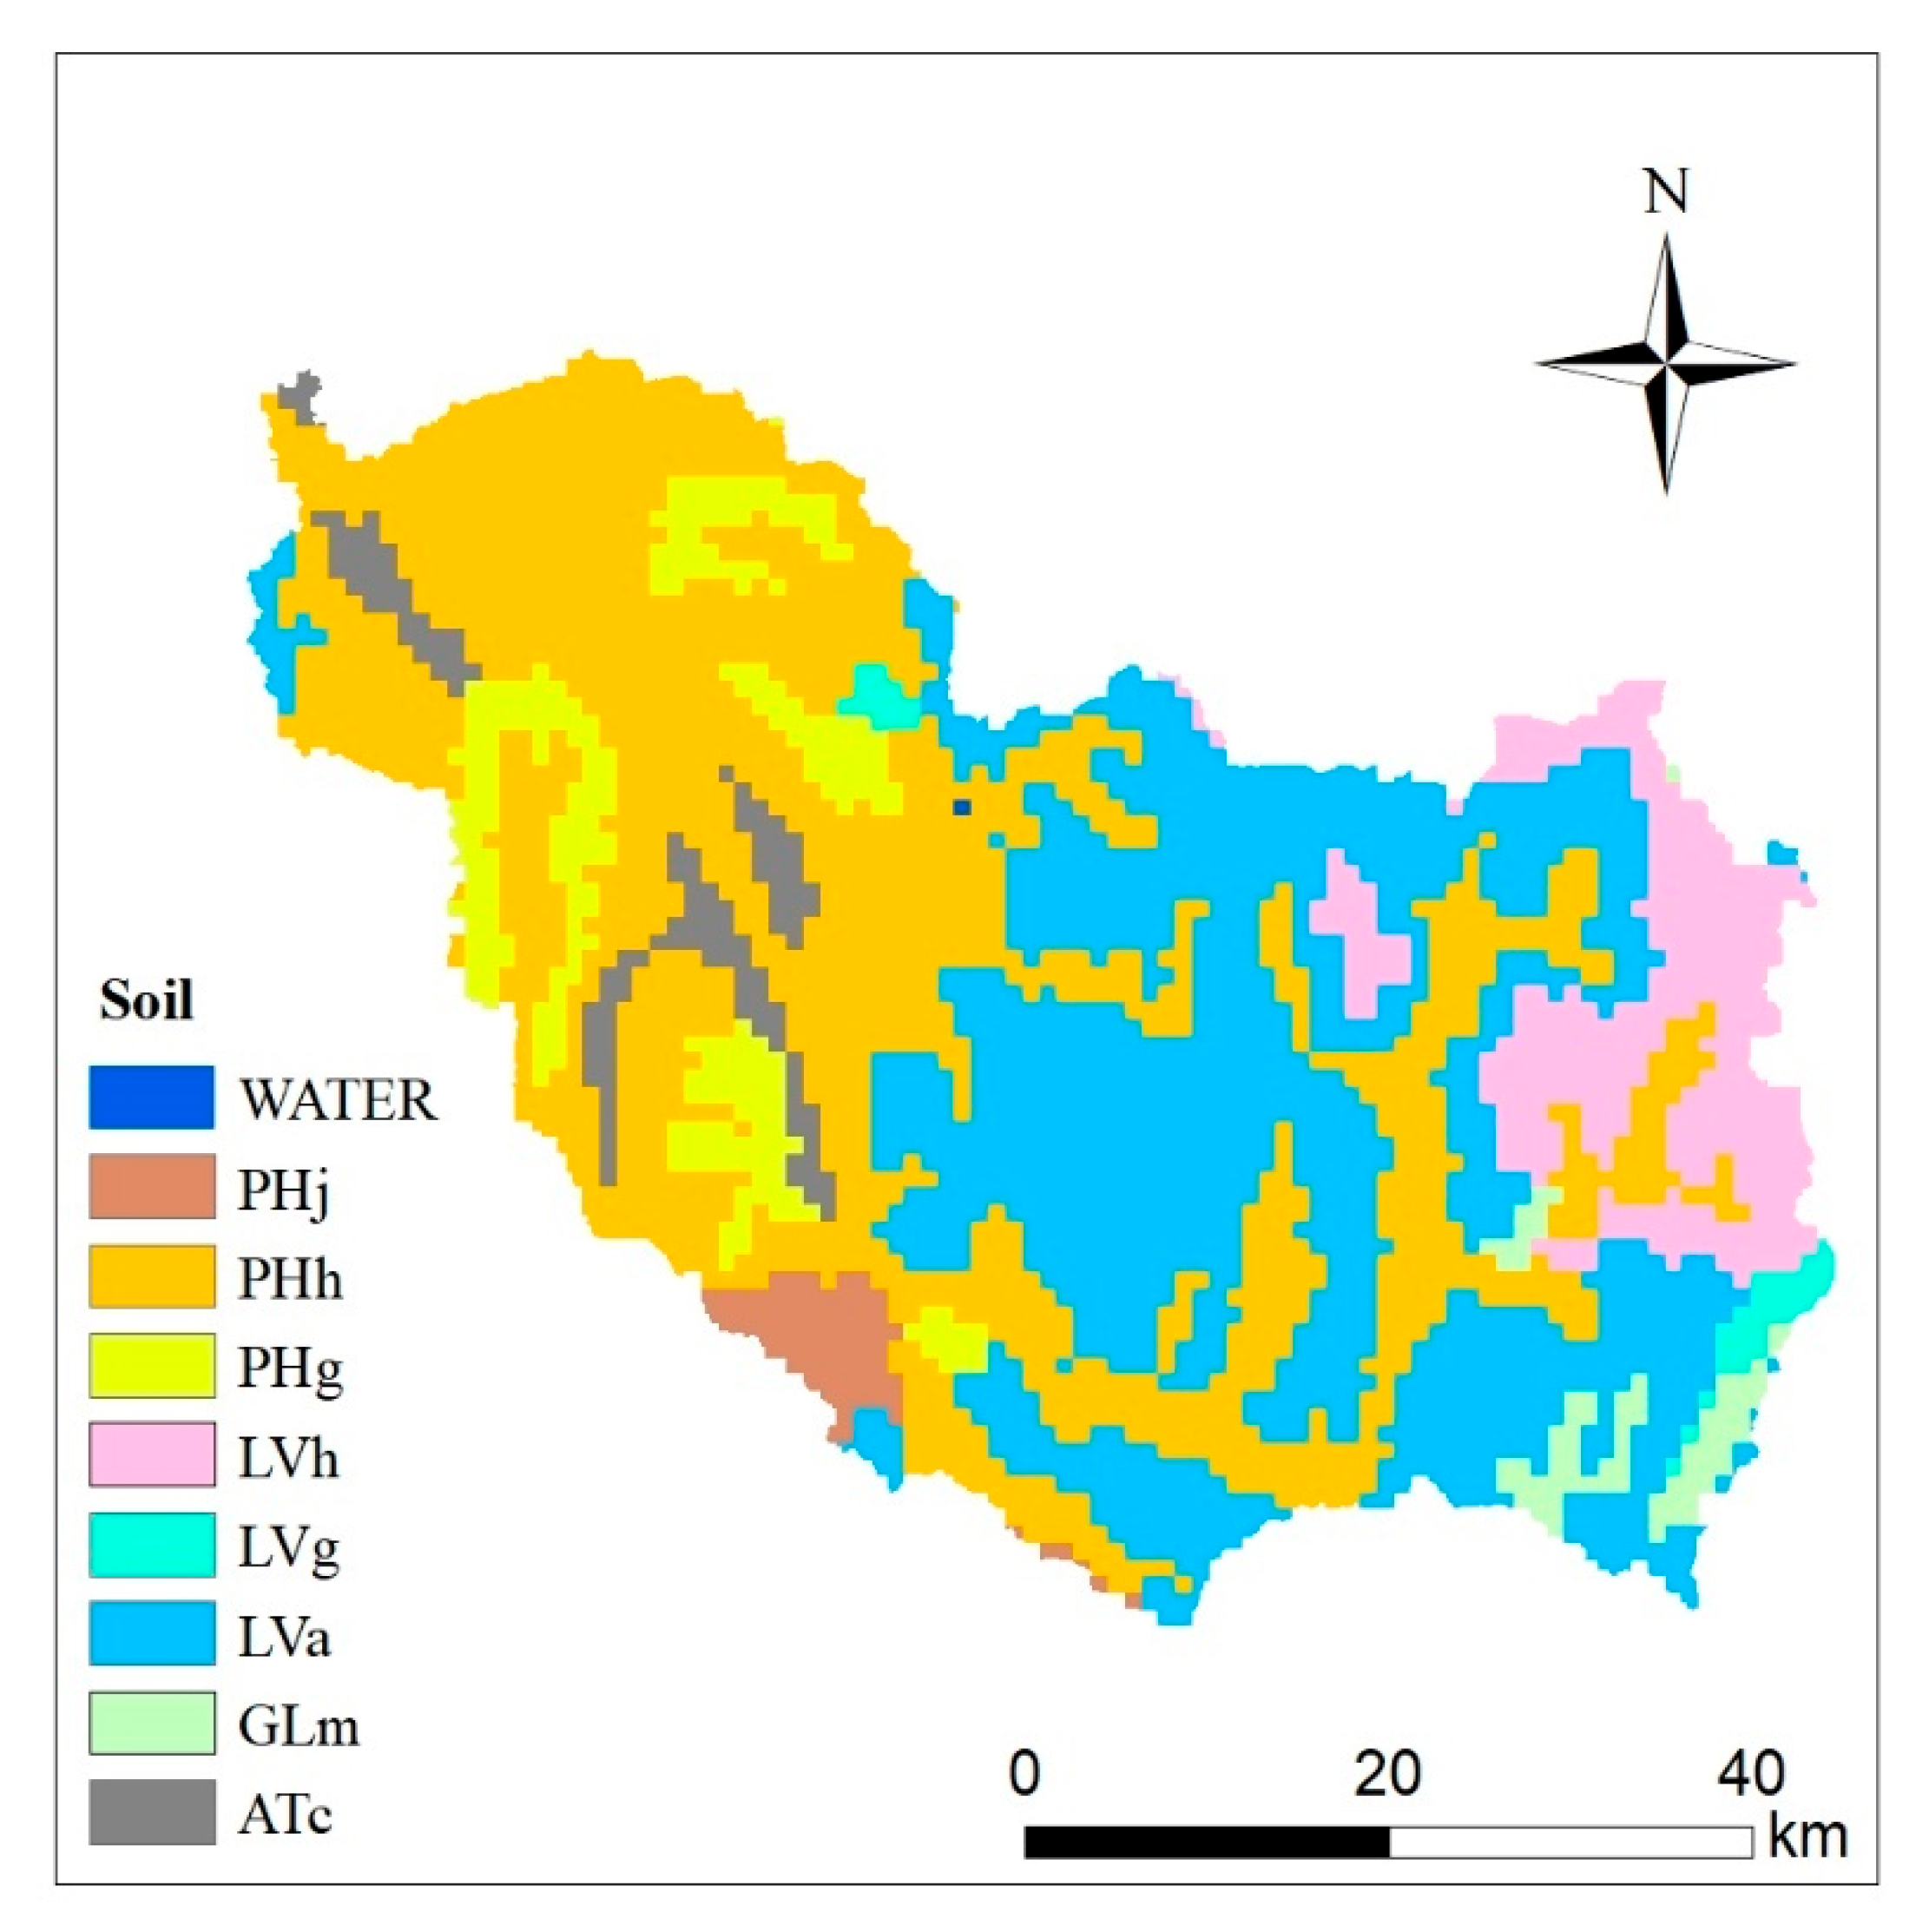
2.2.3. Types of Soil Data
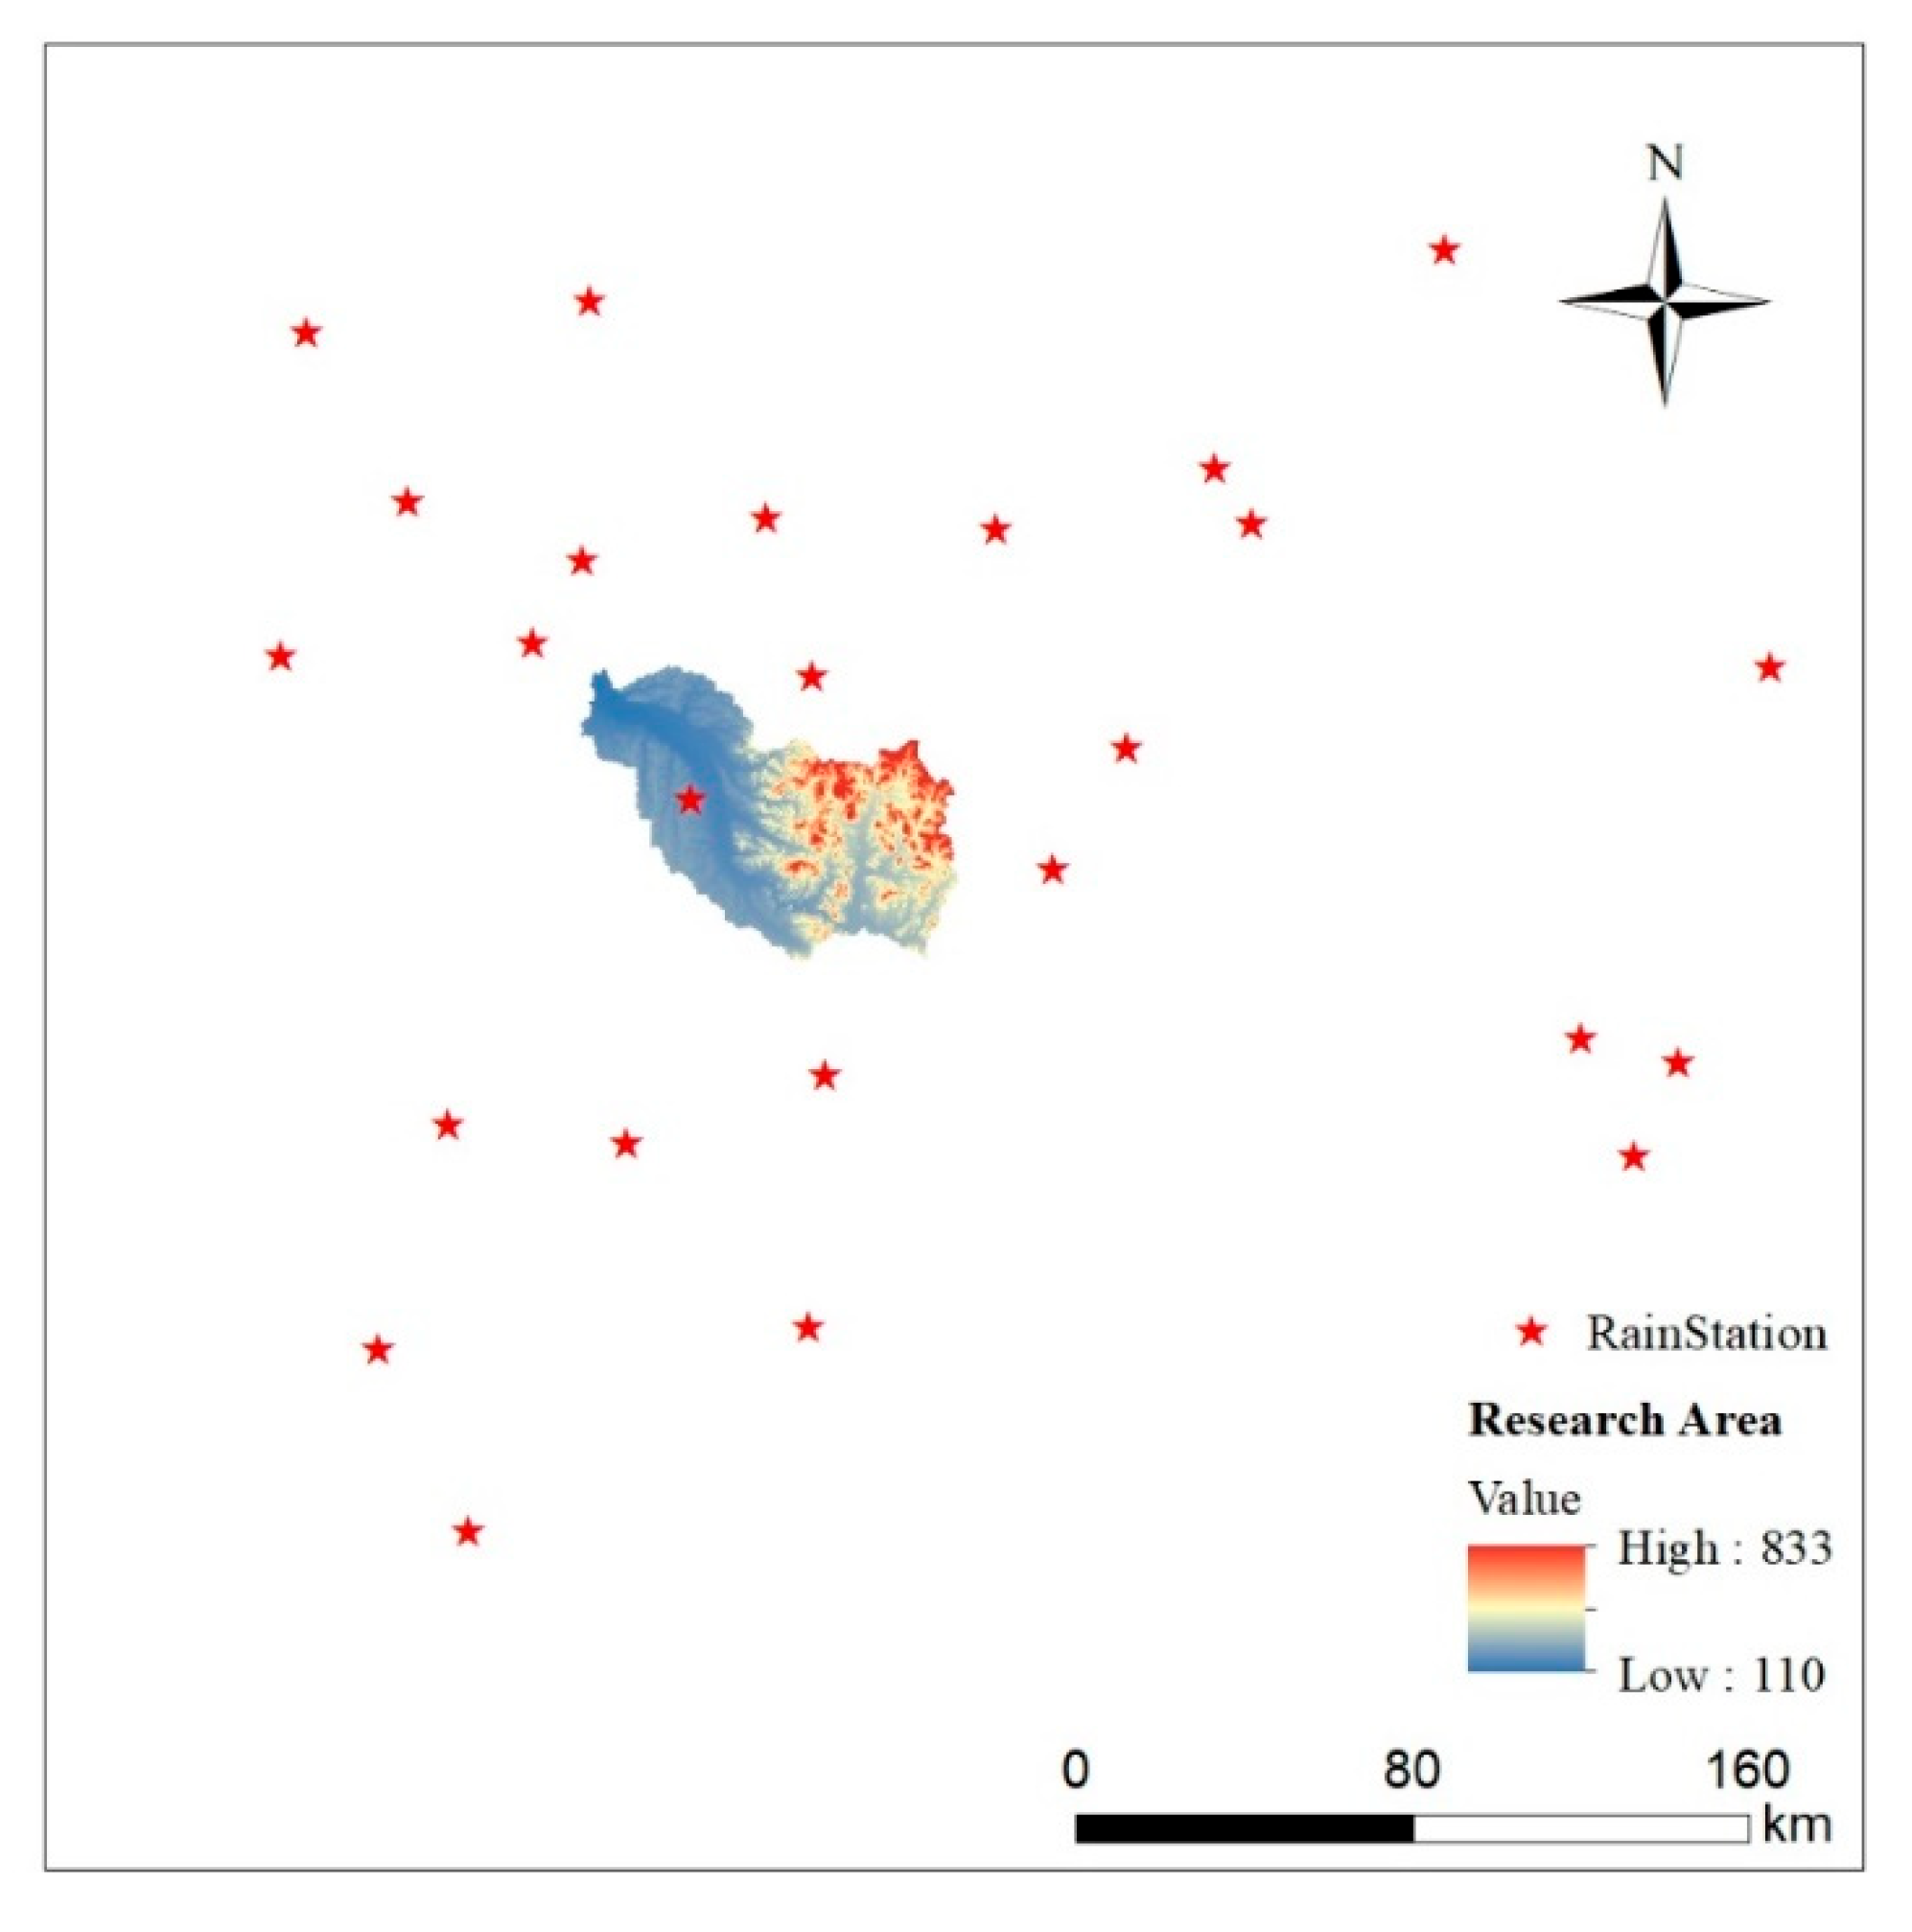
2.2.4. Meteorological Data
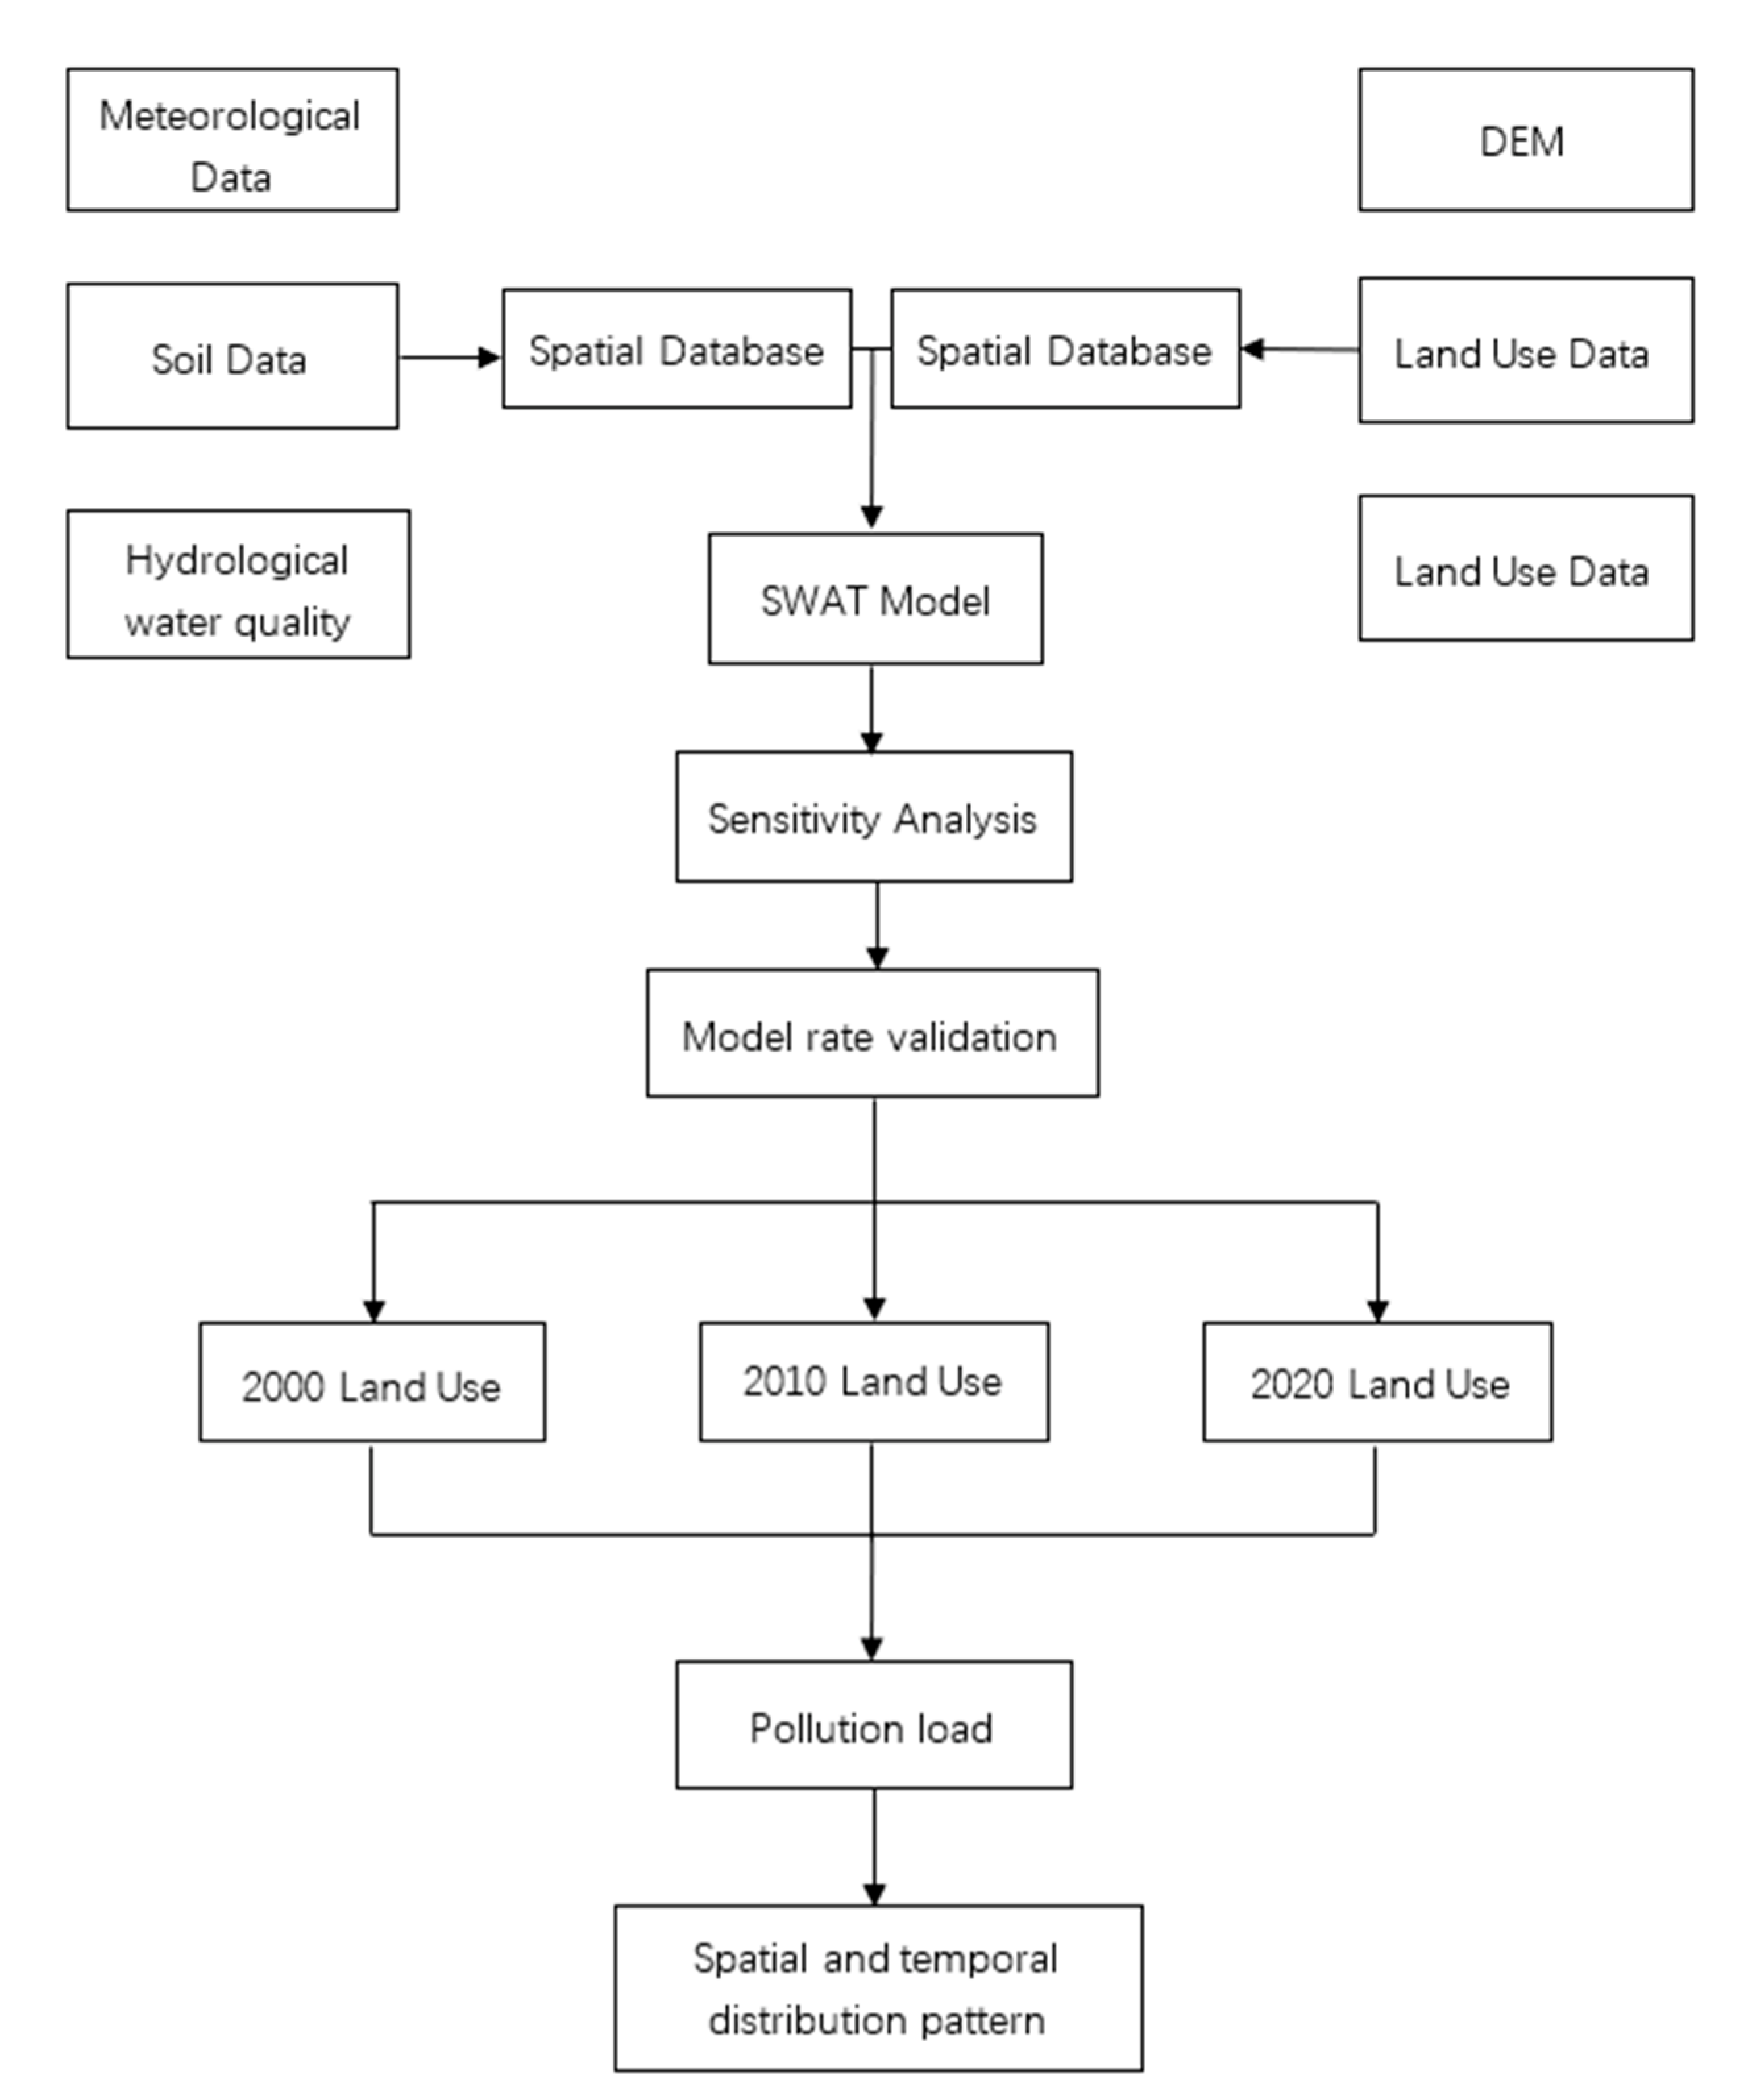
2.3. Model Introduction
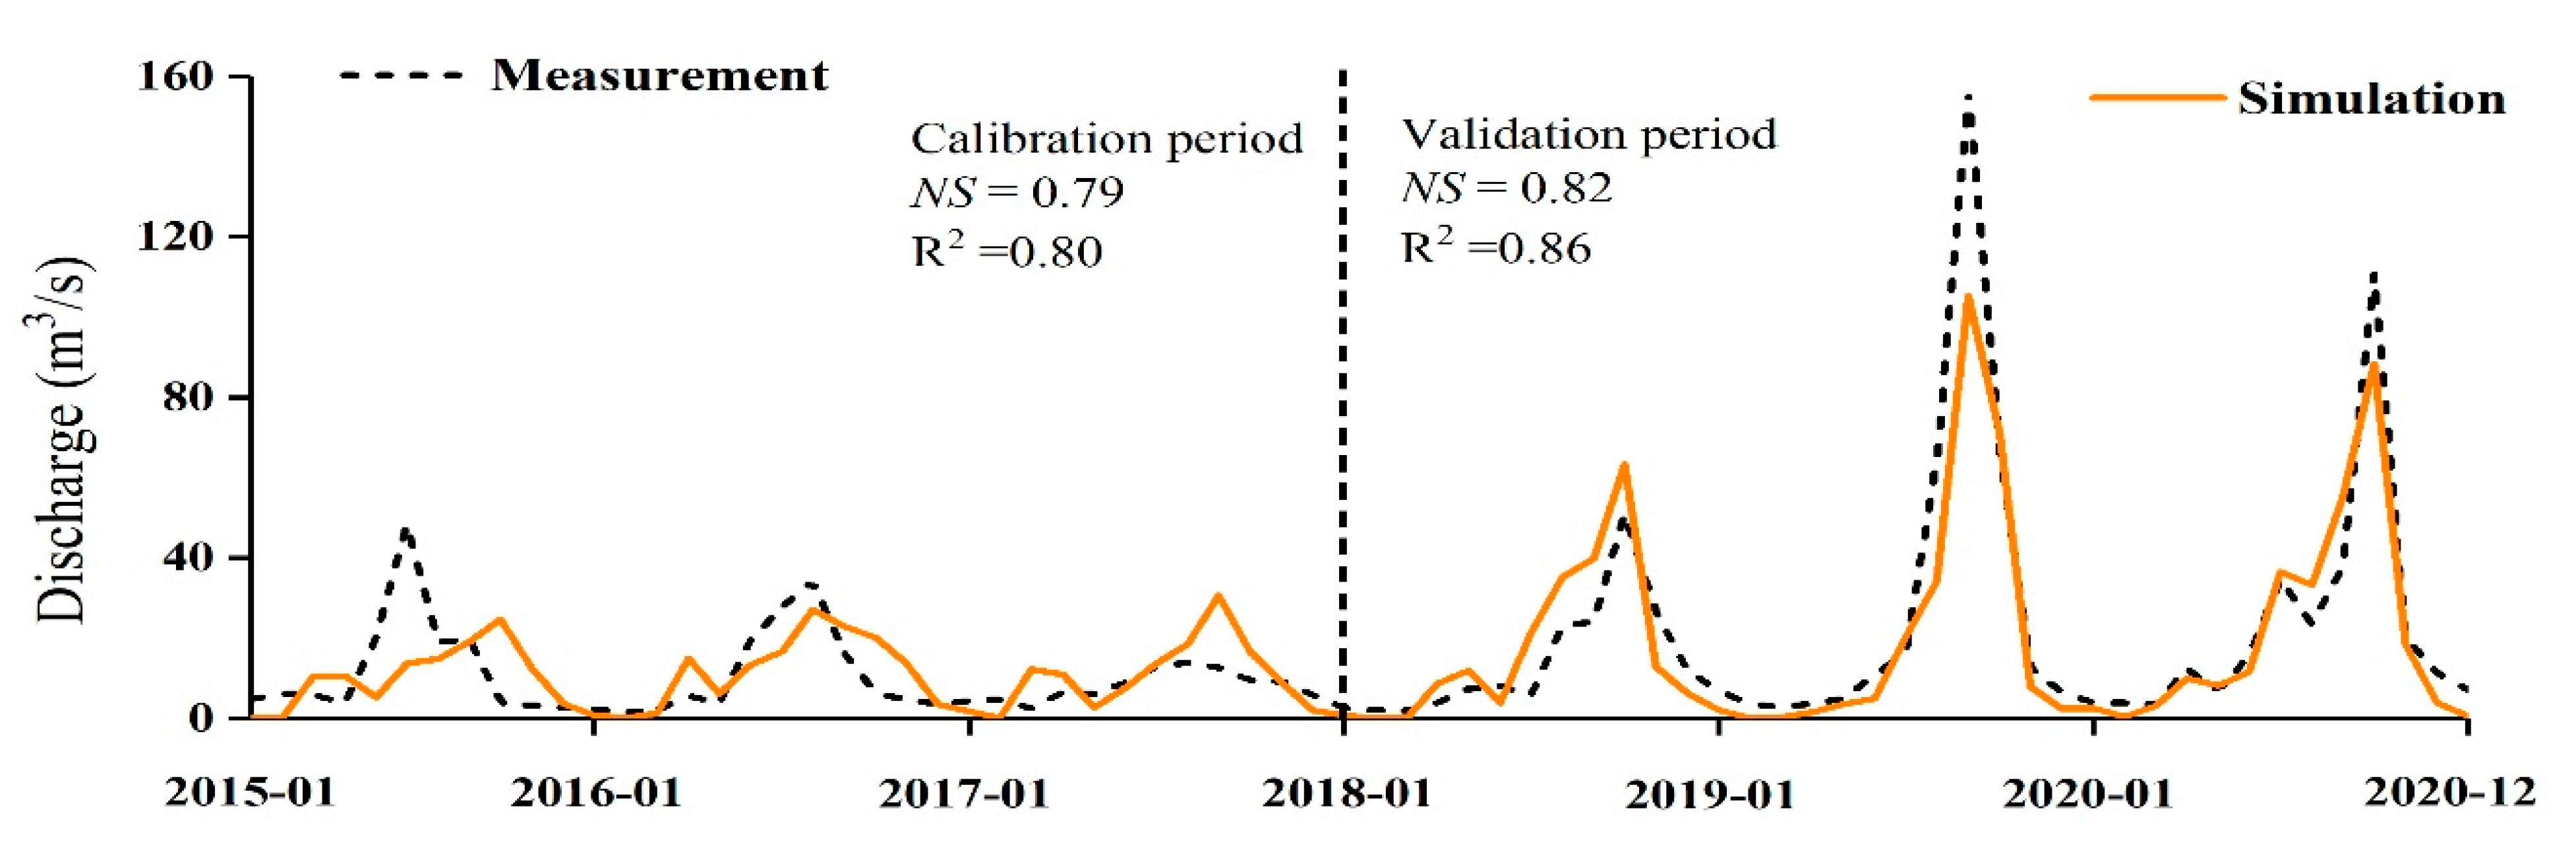
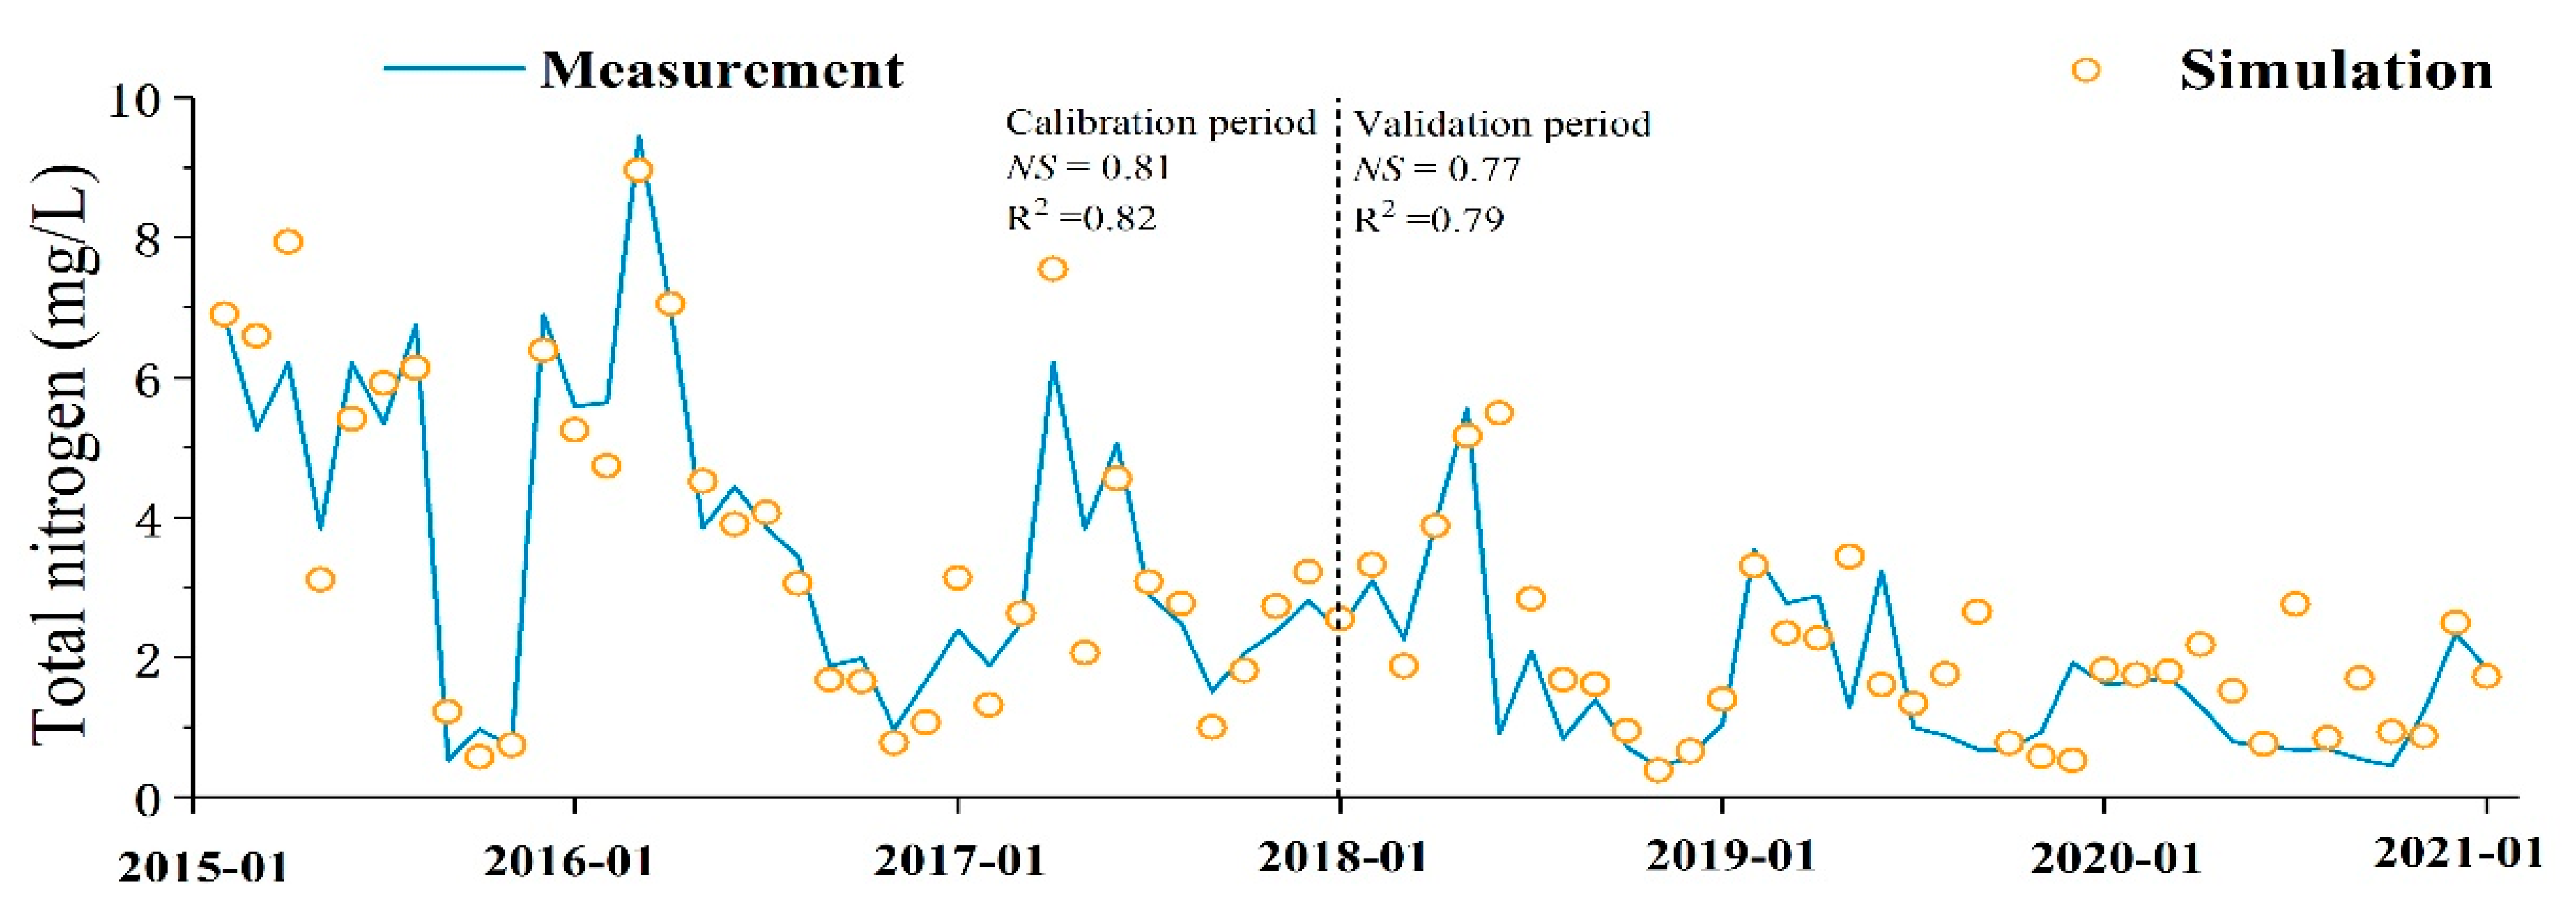
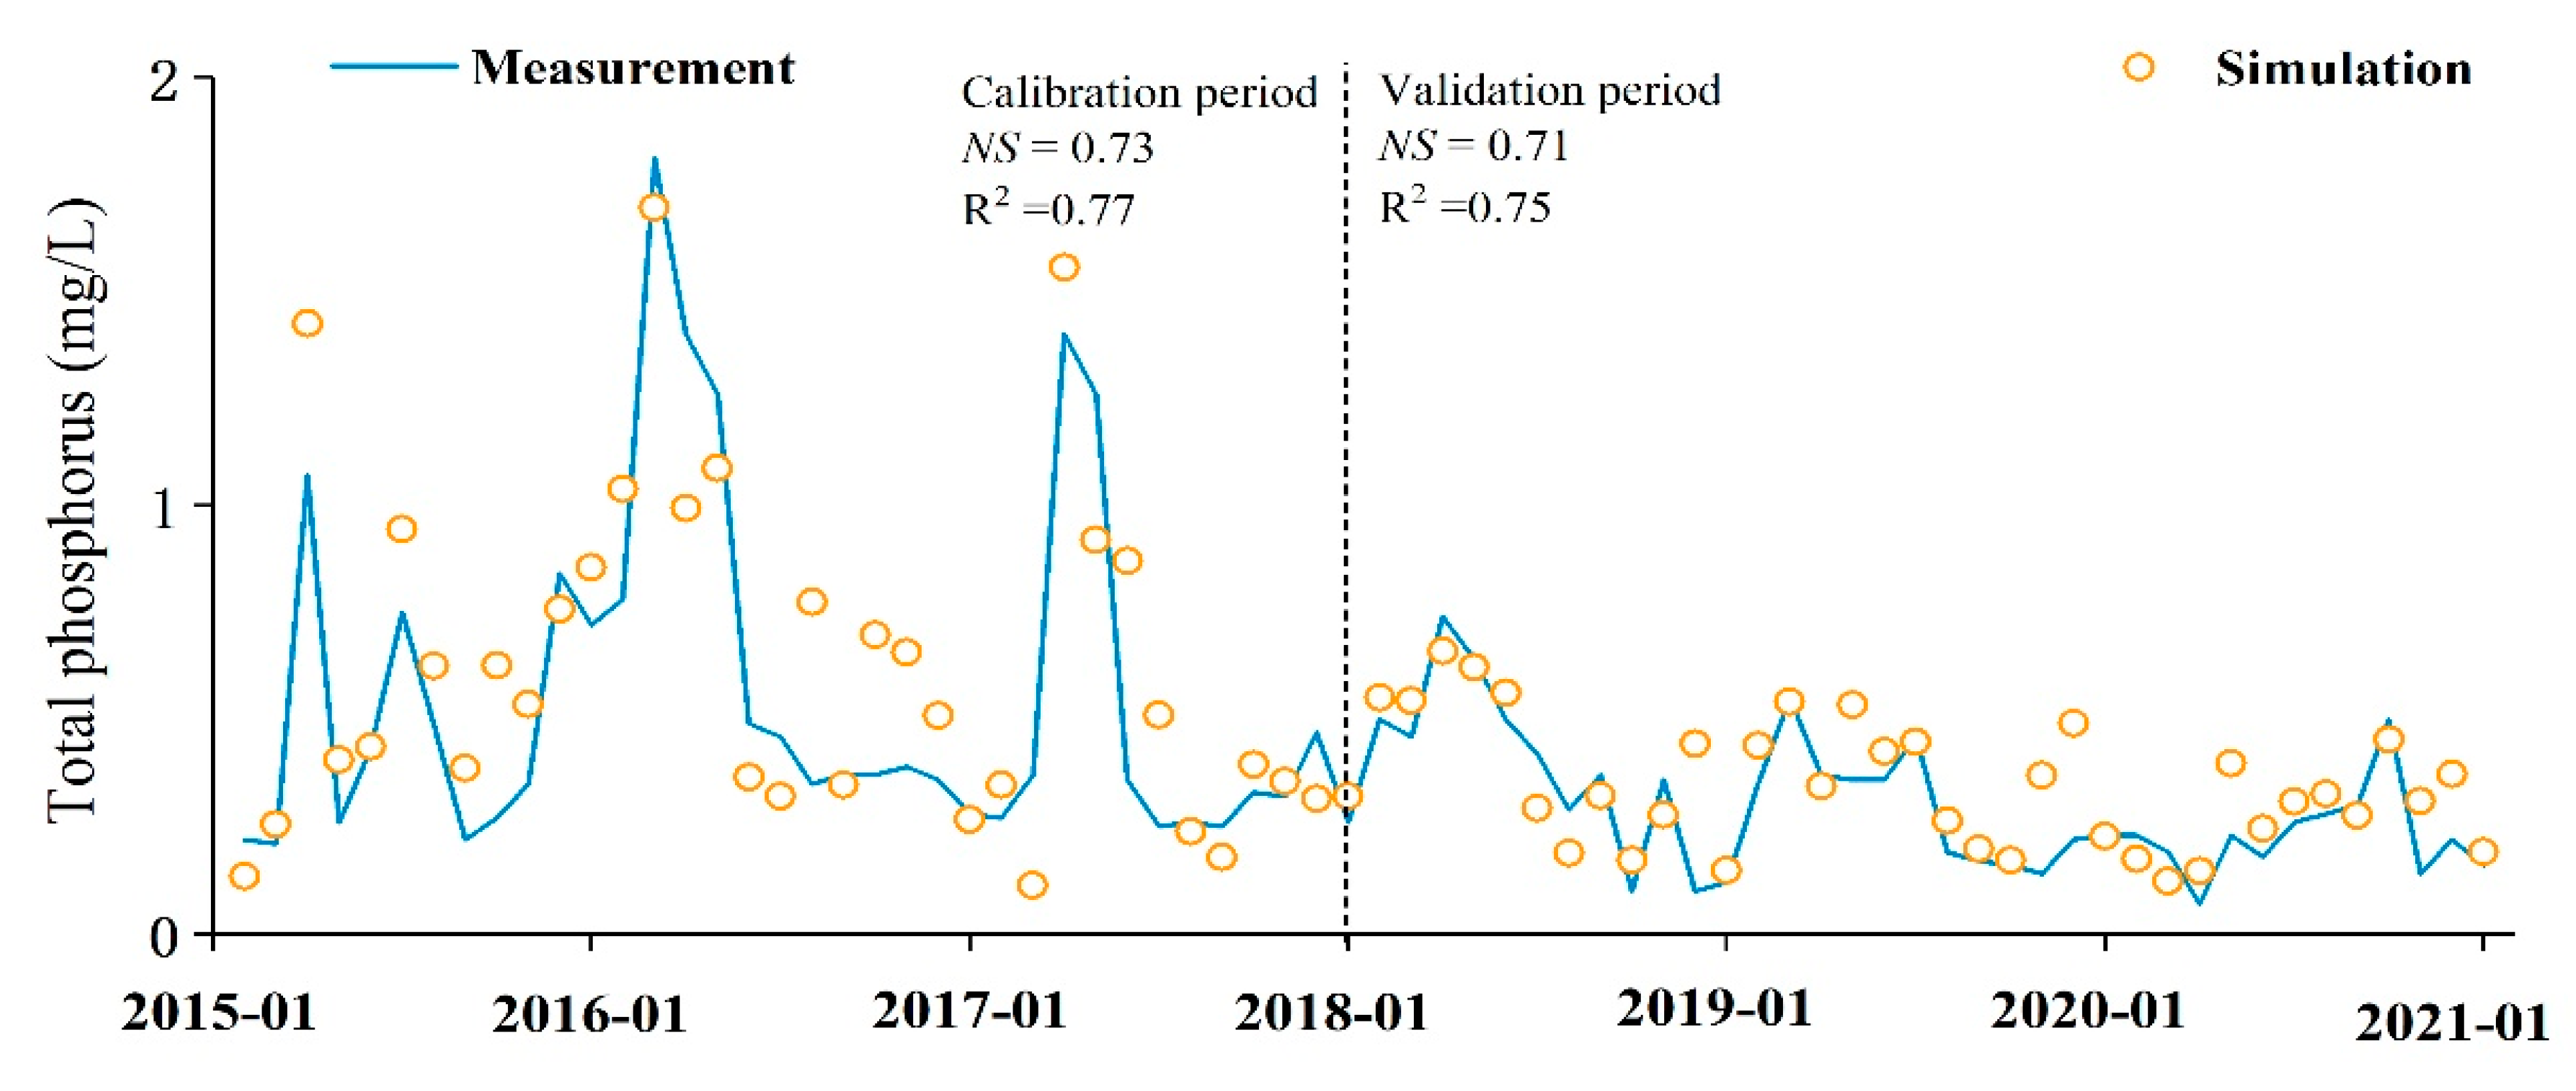
2.4. Validation Criteria and Model Parameter Rates
3. Results and Analysis
3.1. Model Practicality Analysis
3.2. Analysis of Quantitative Changes in Land Use in the ARB
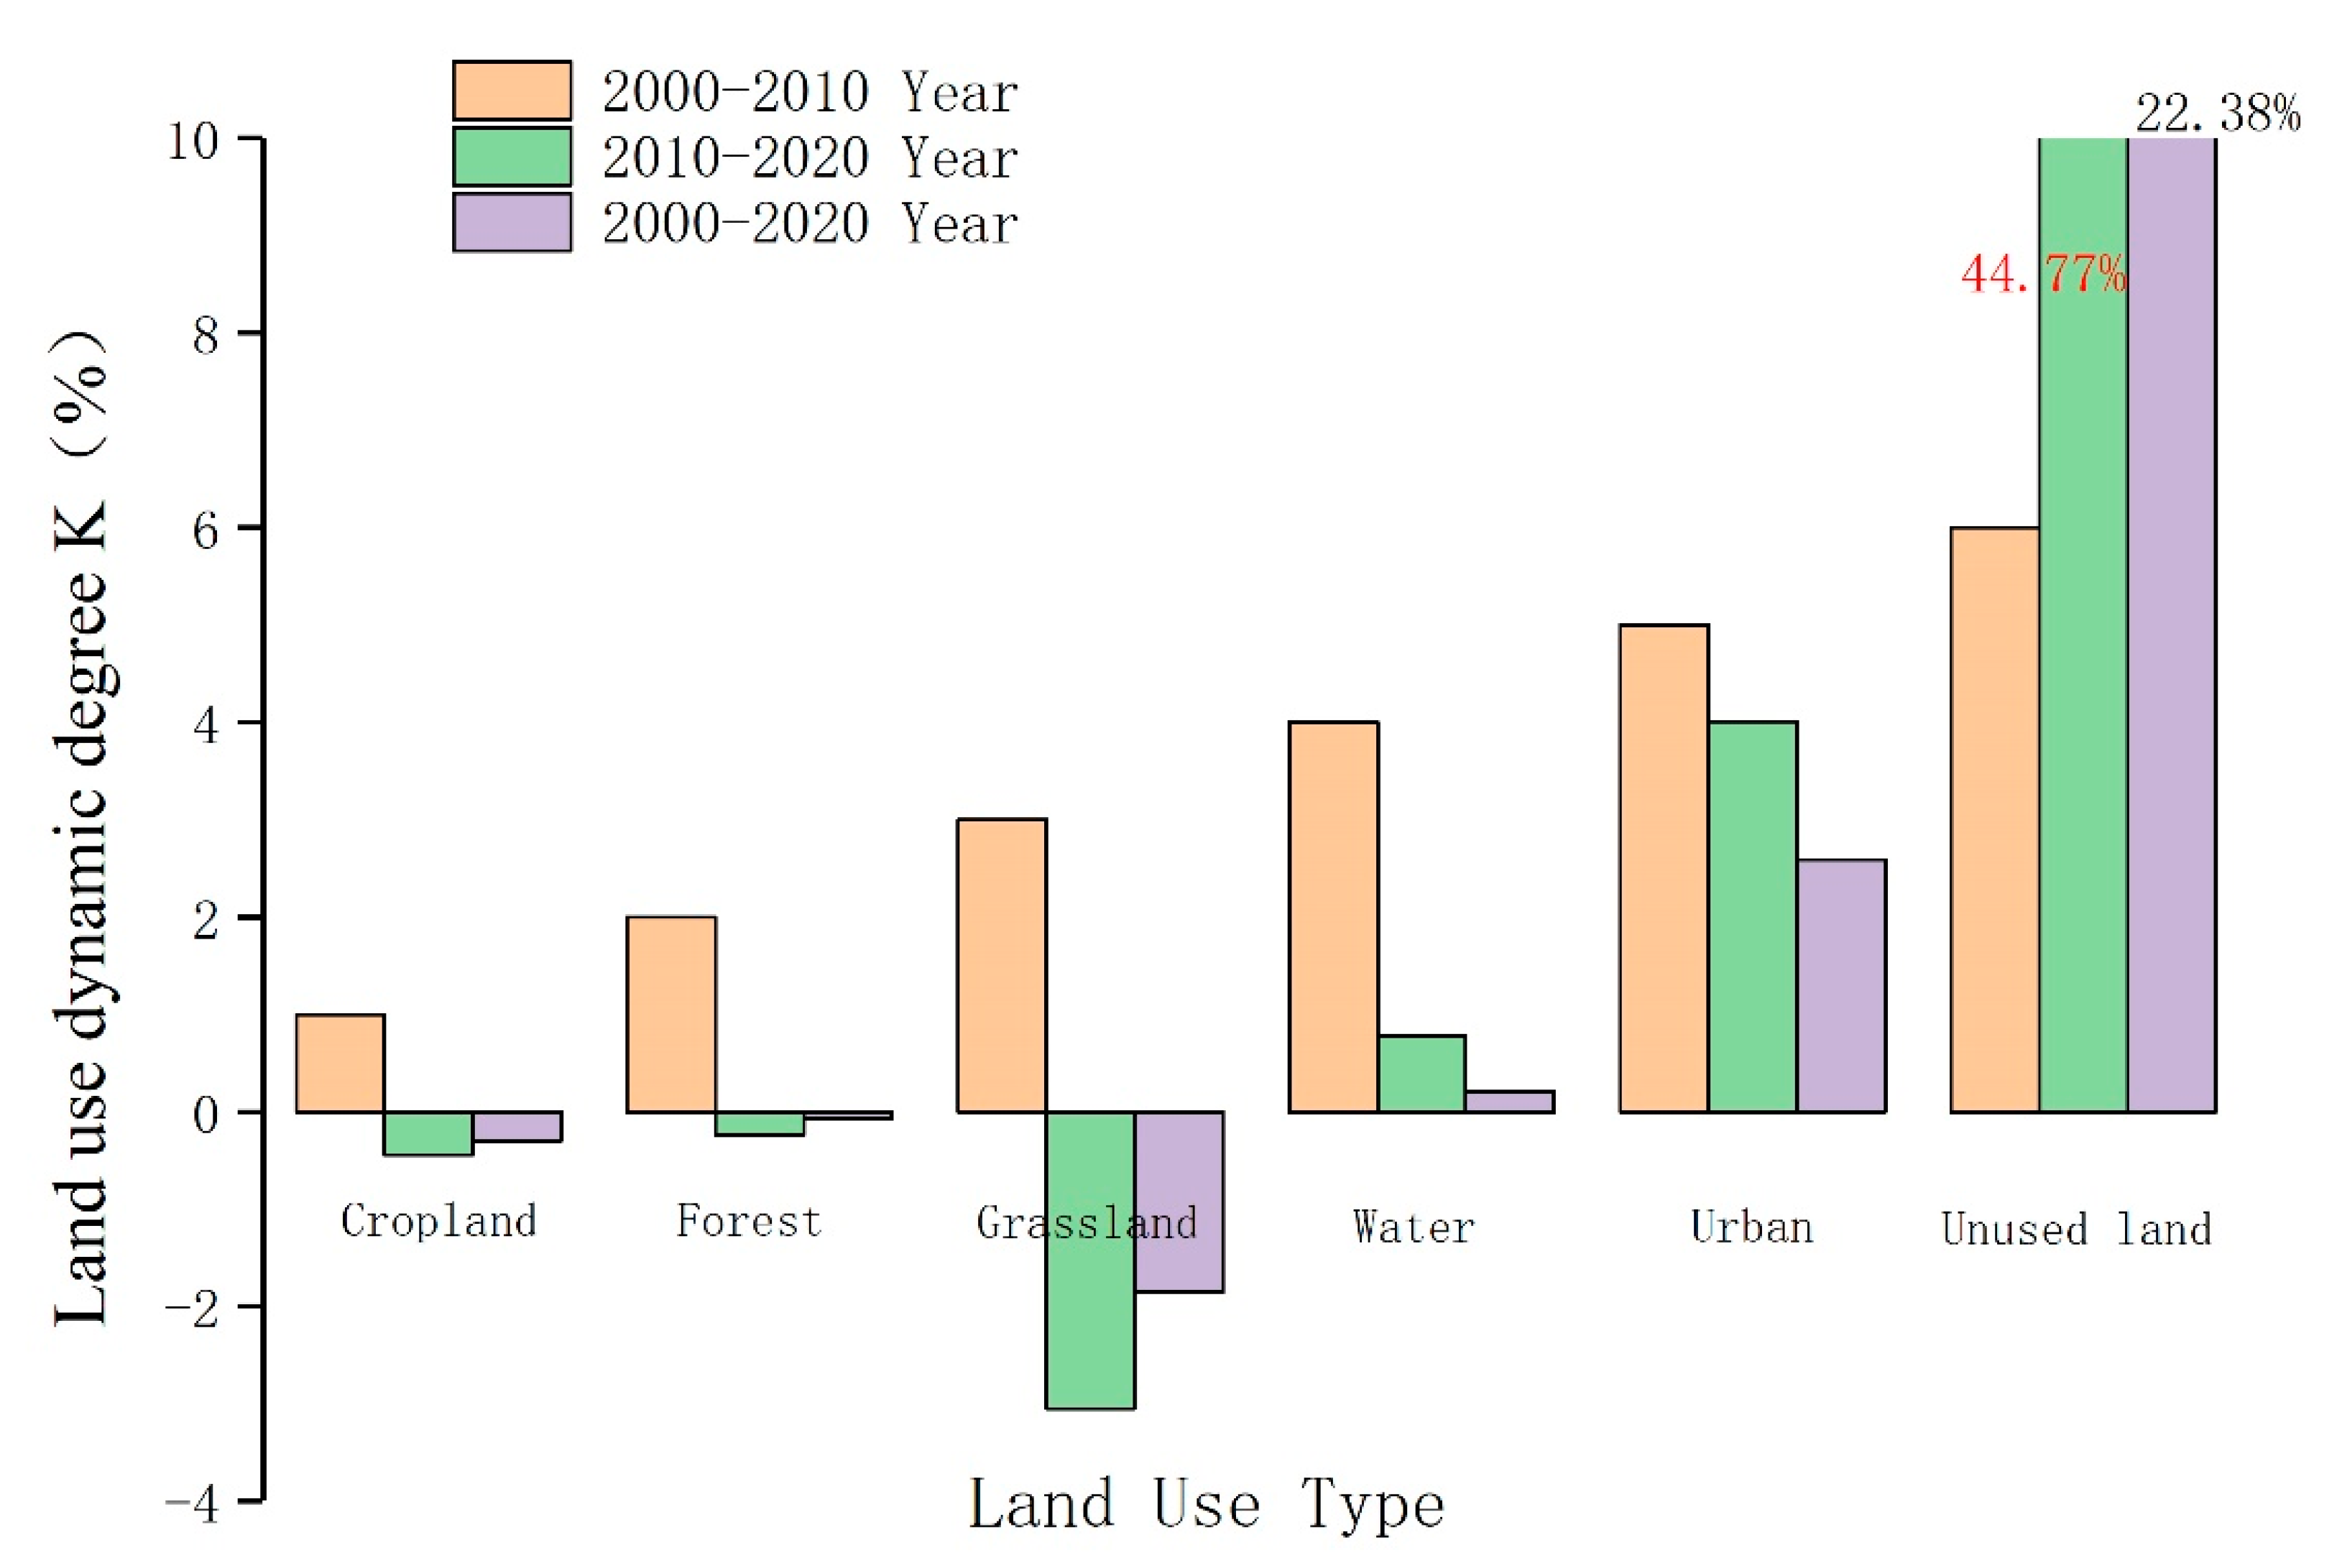
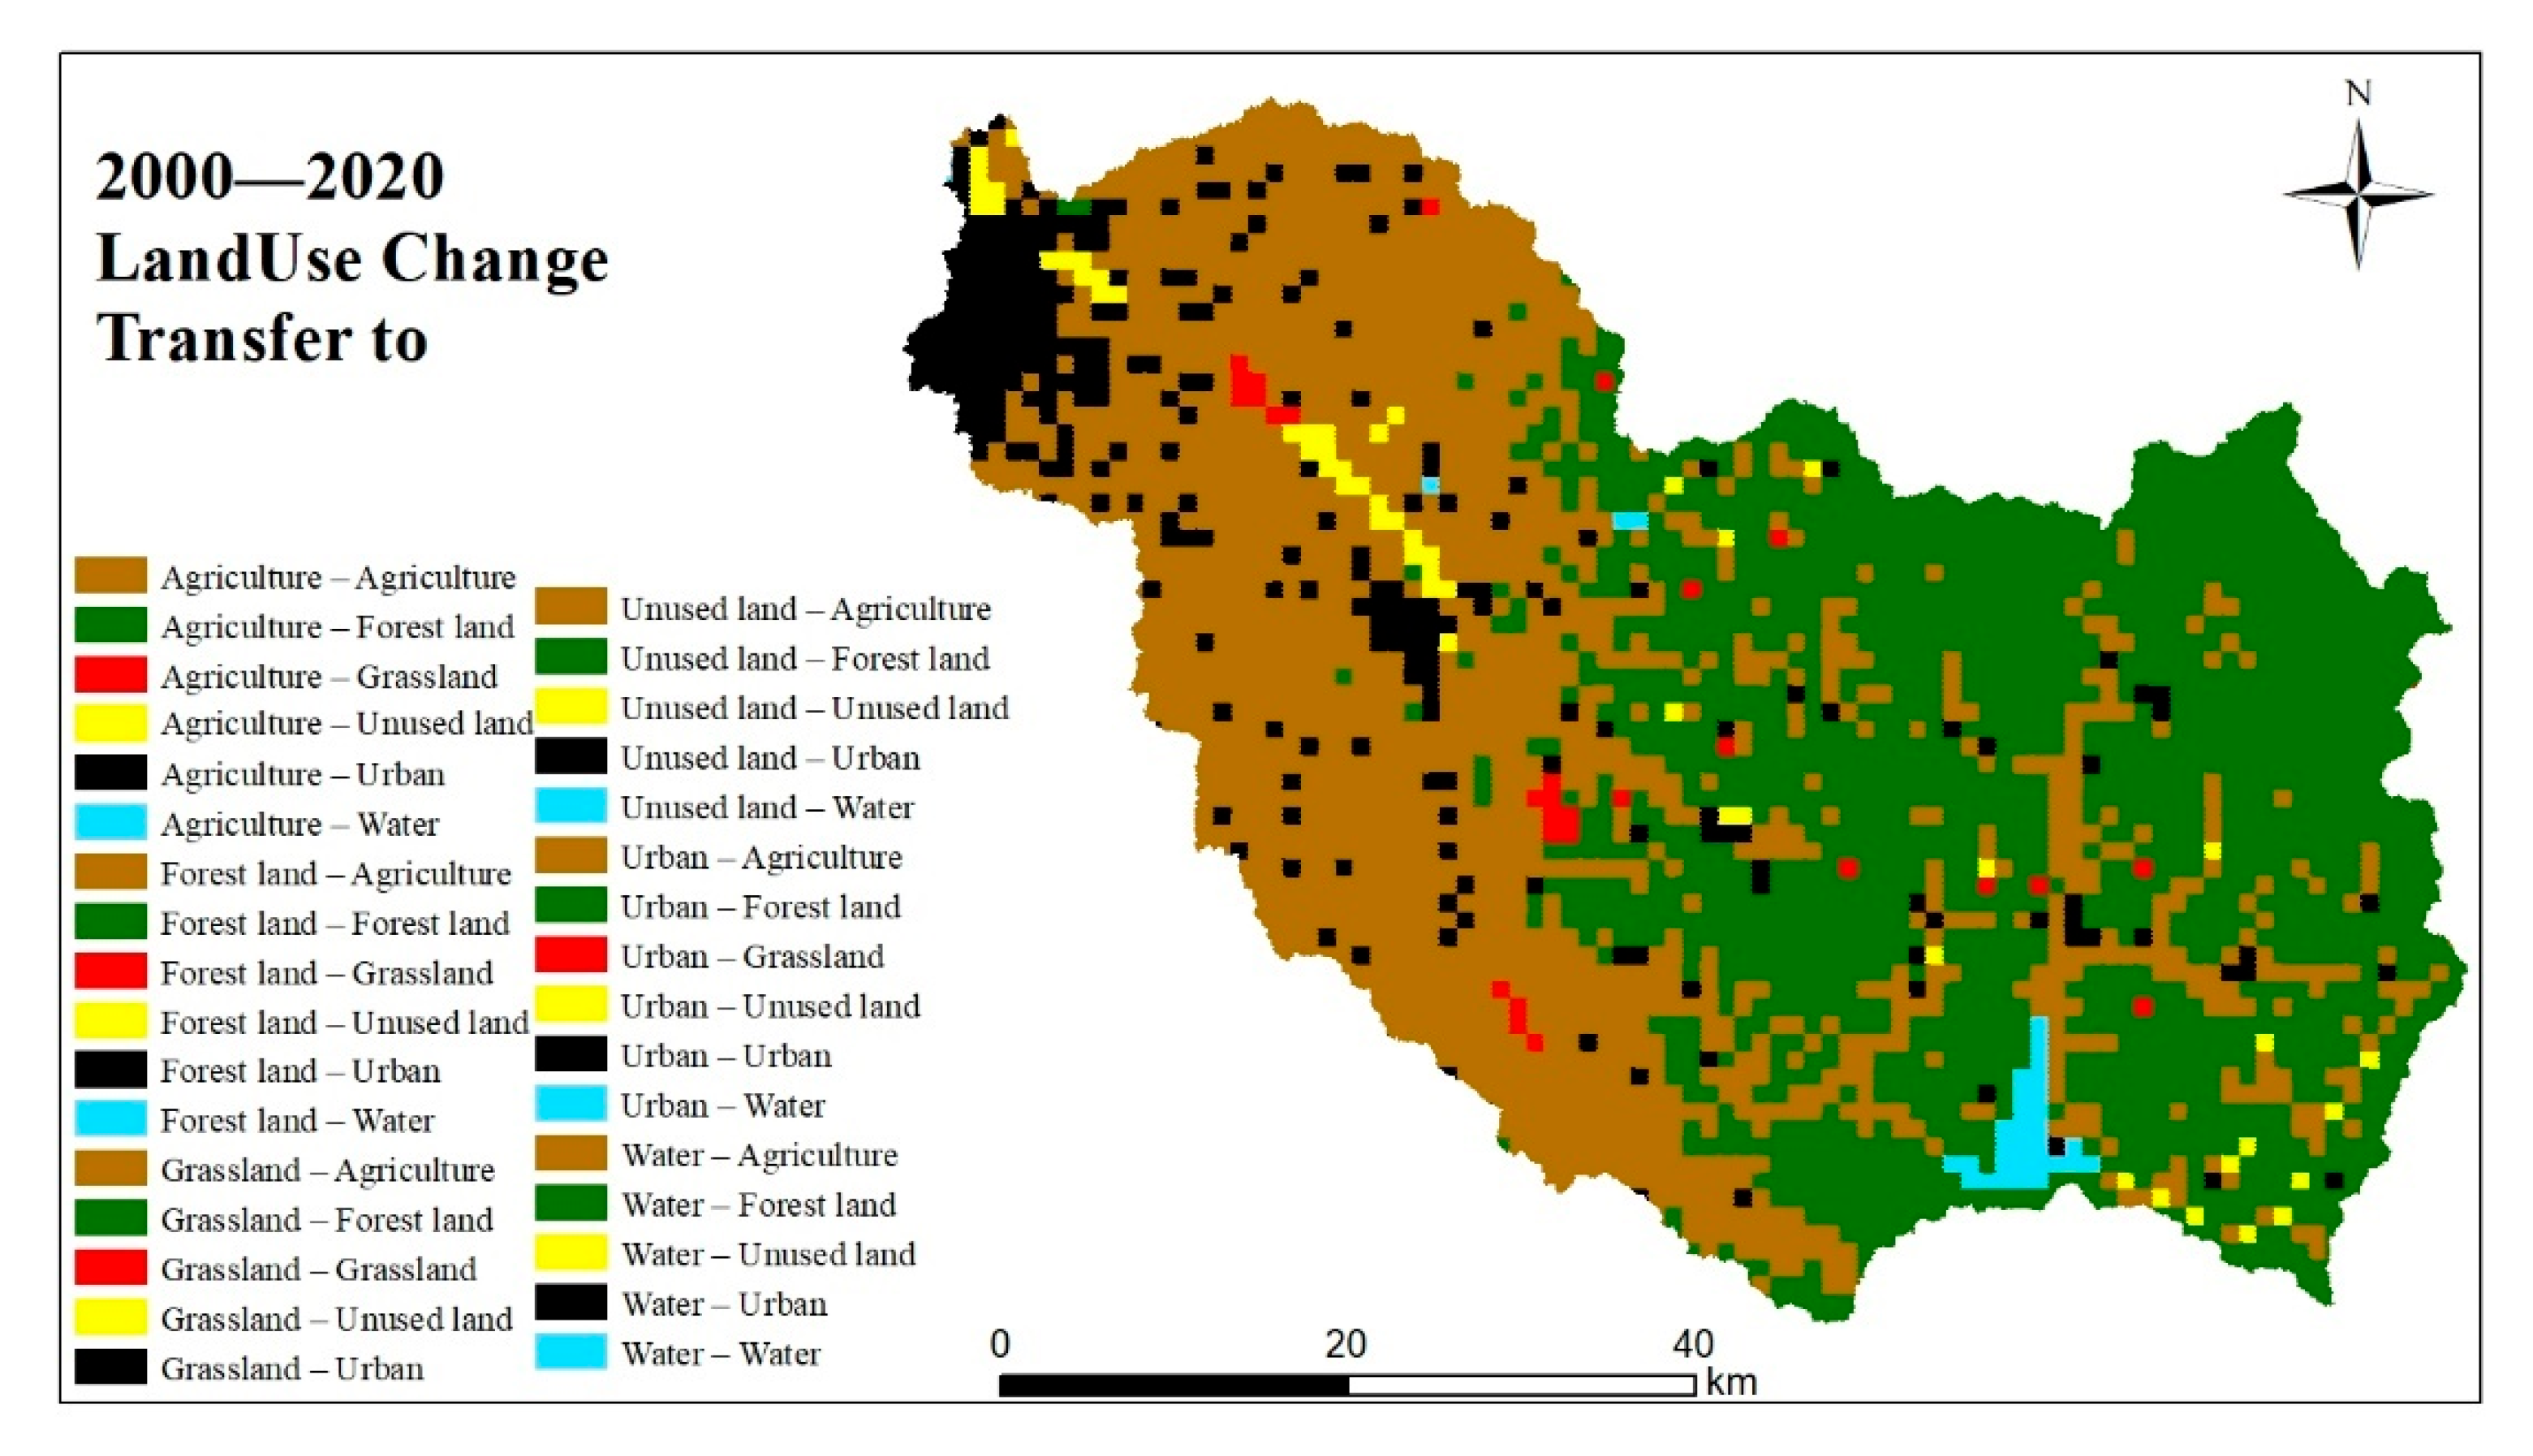
3.2.1. Land Use Change
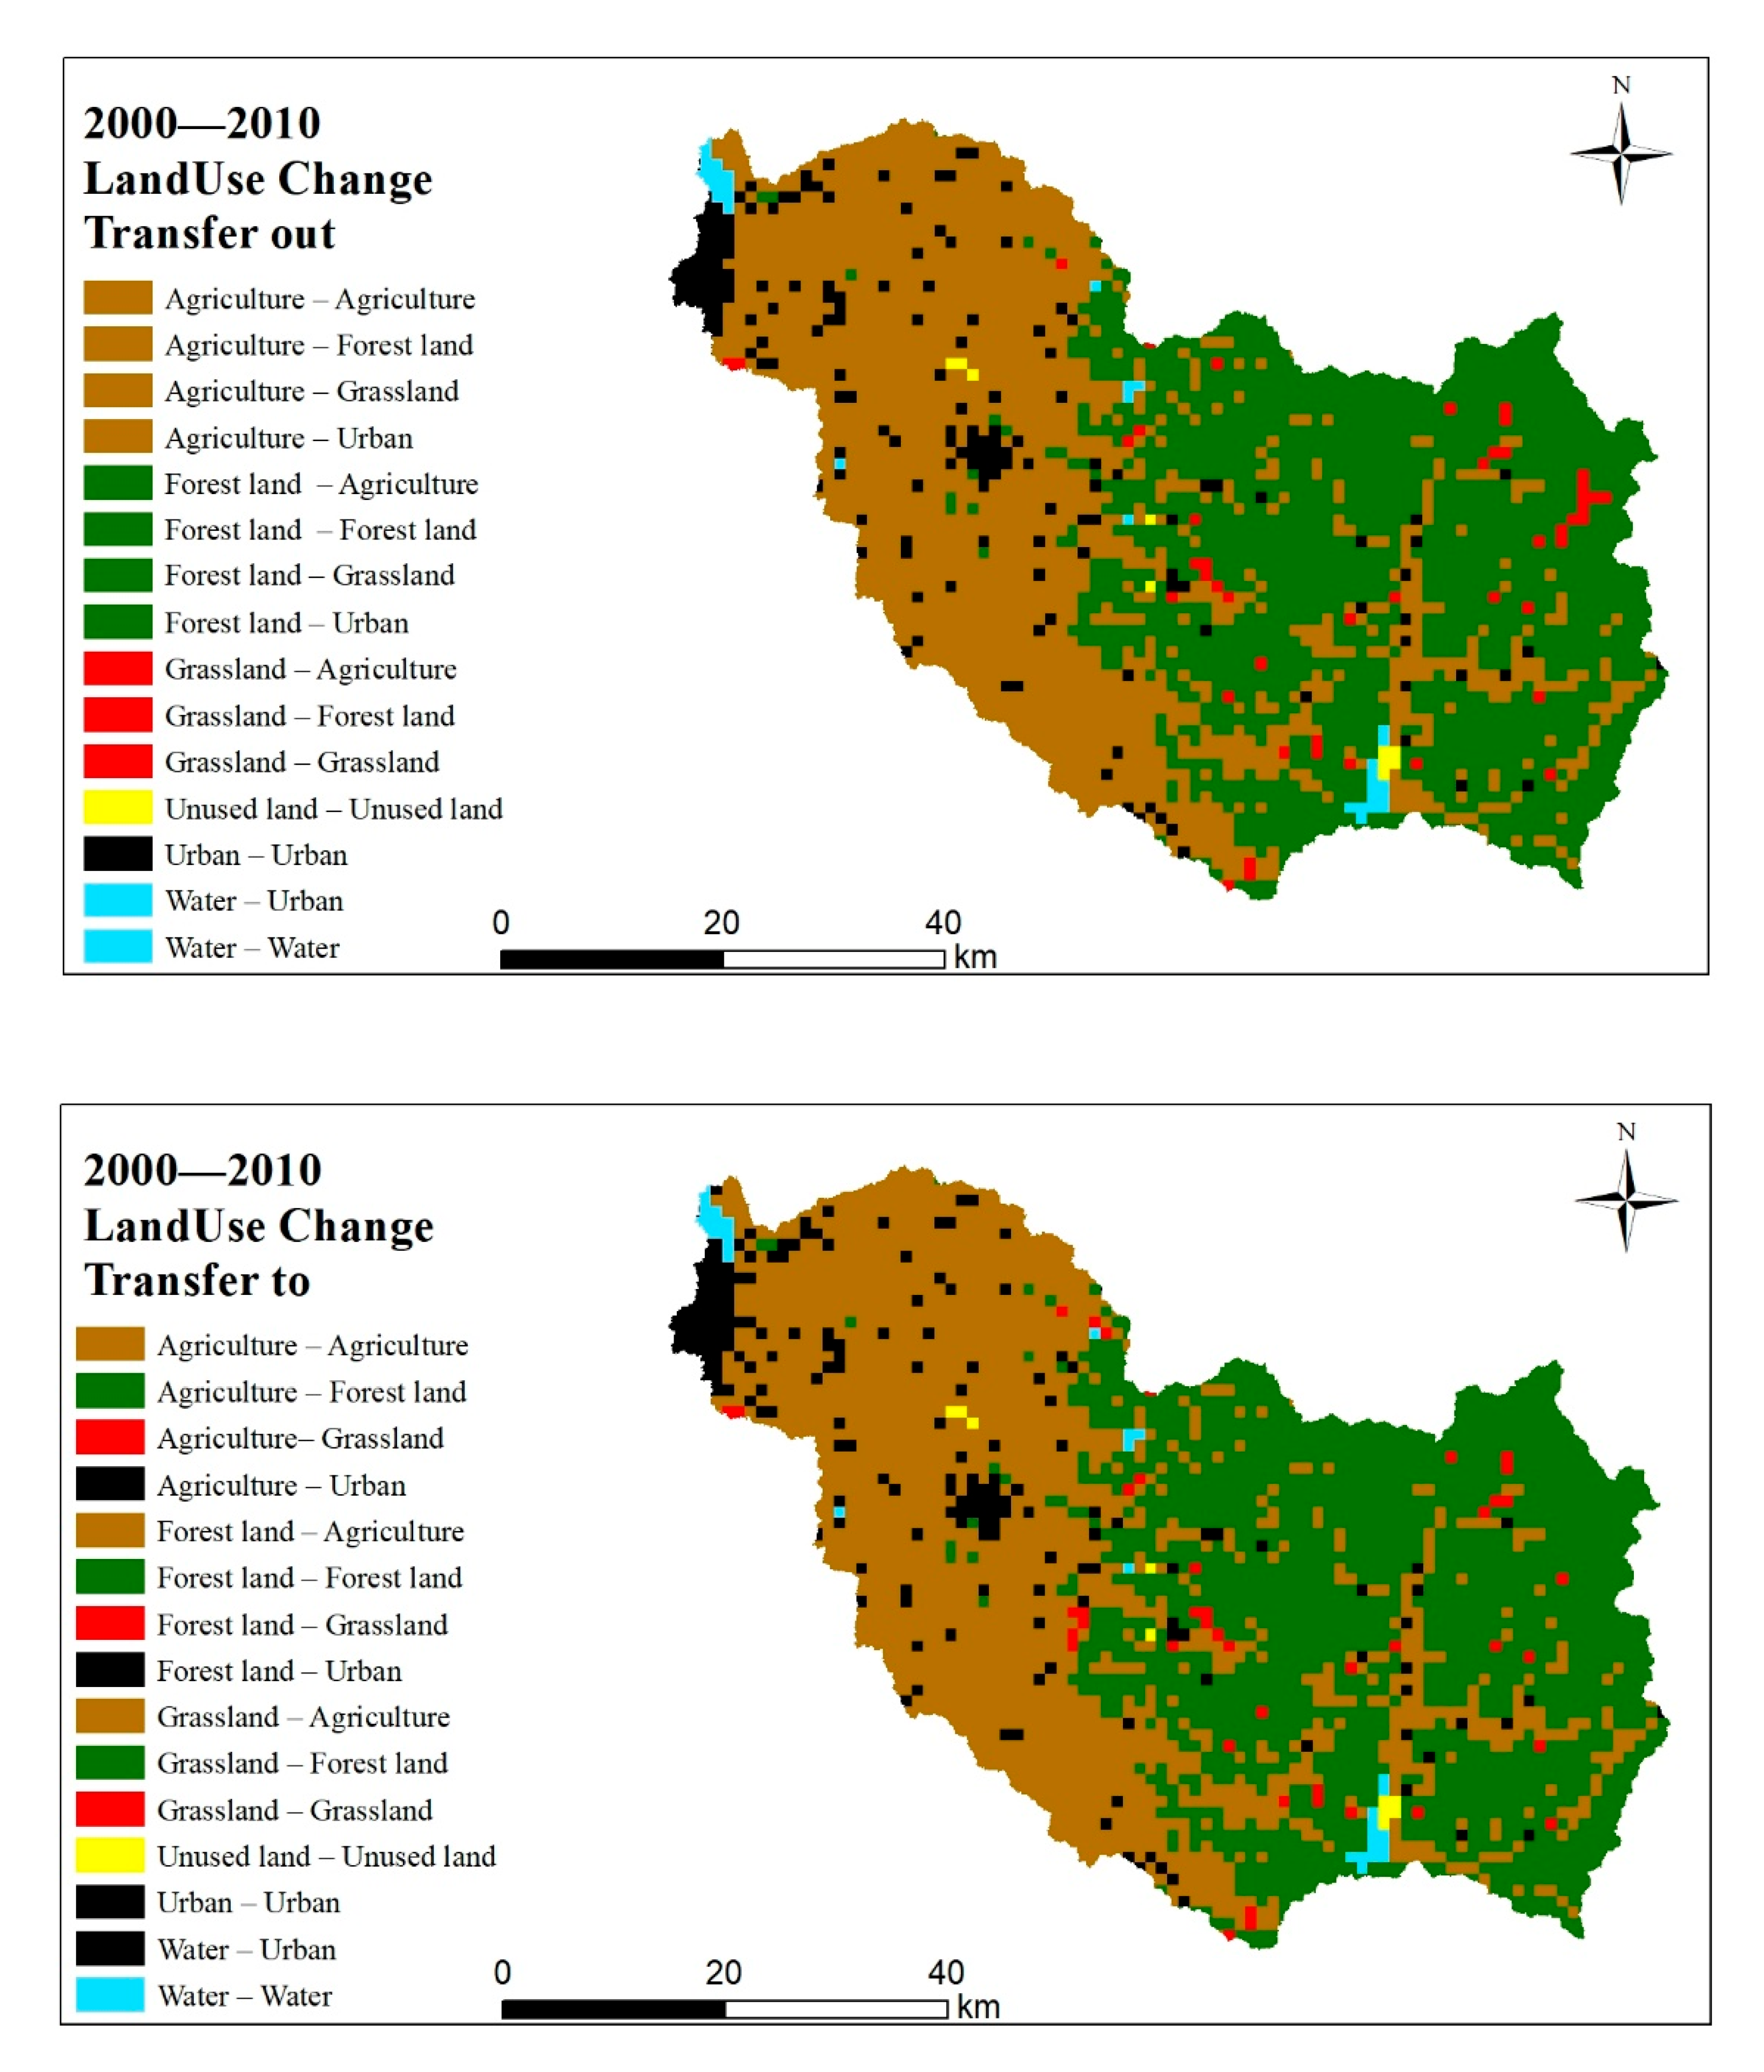
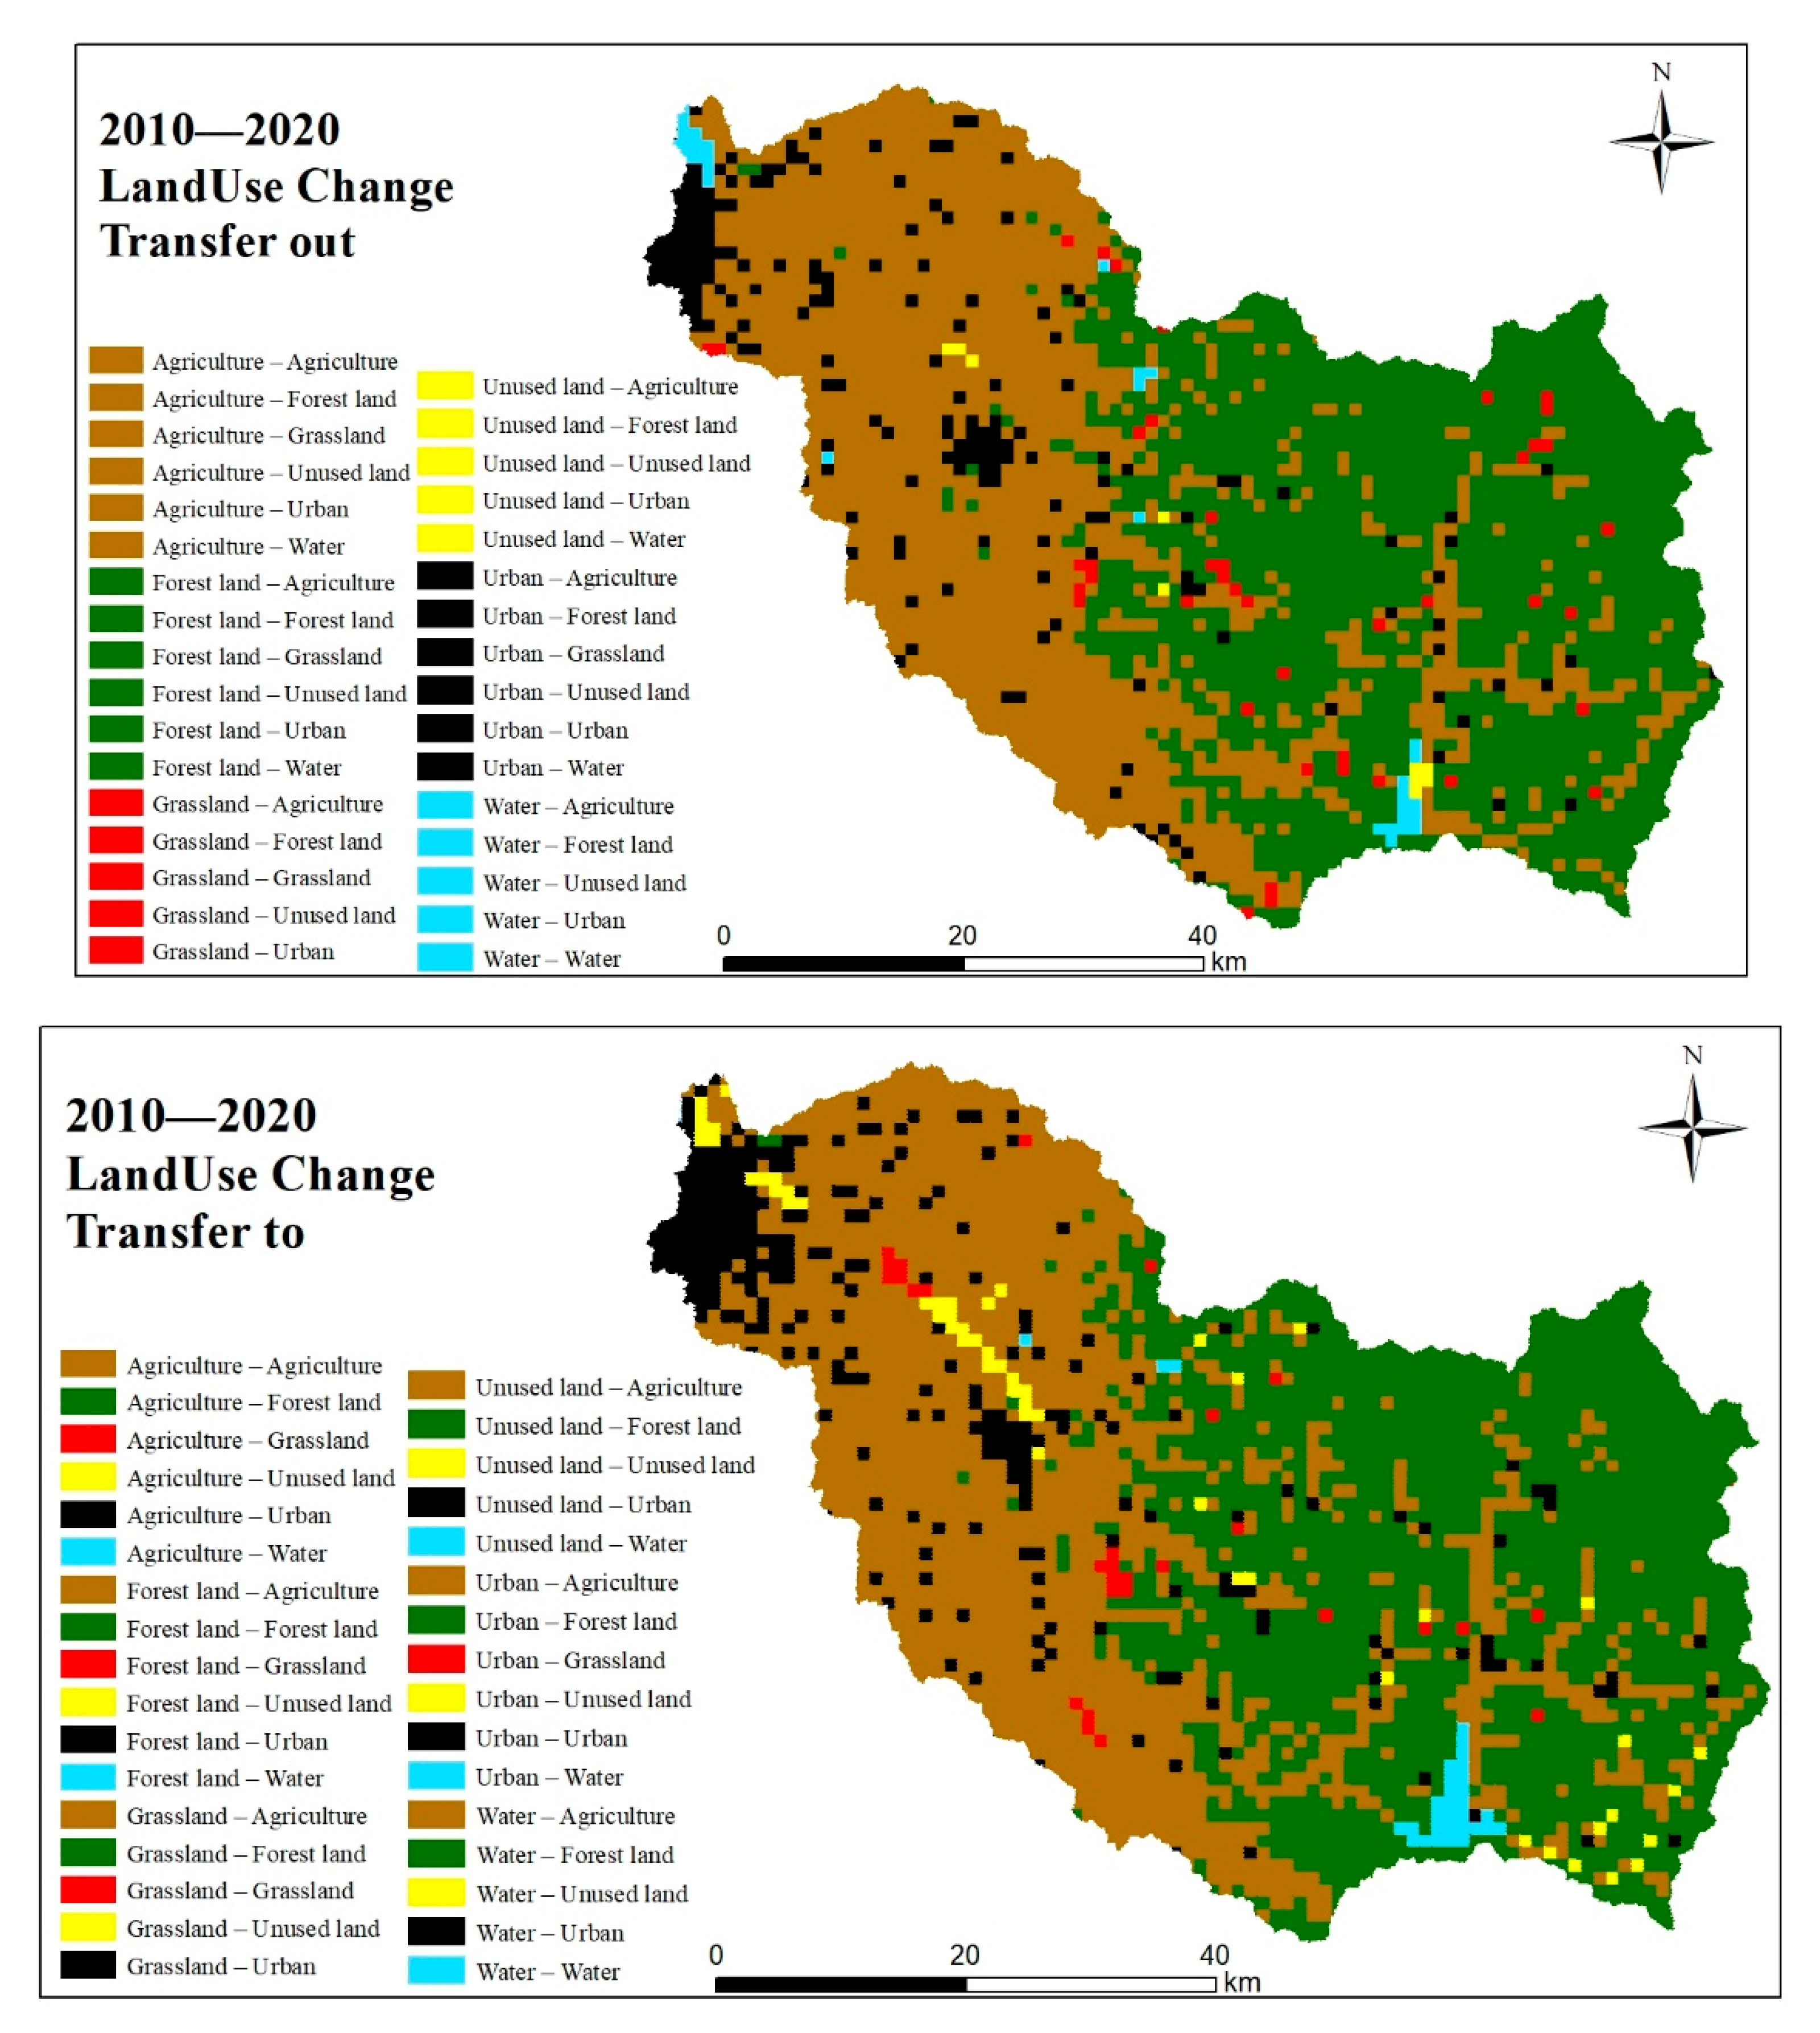
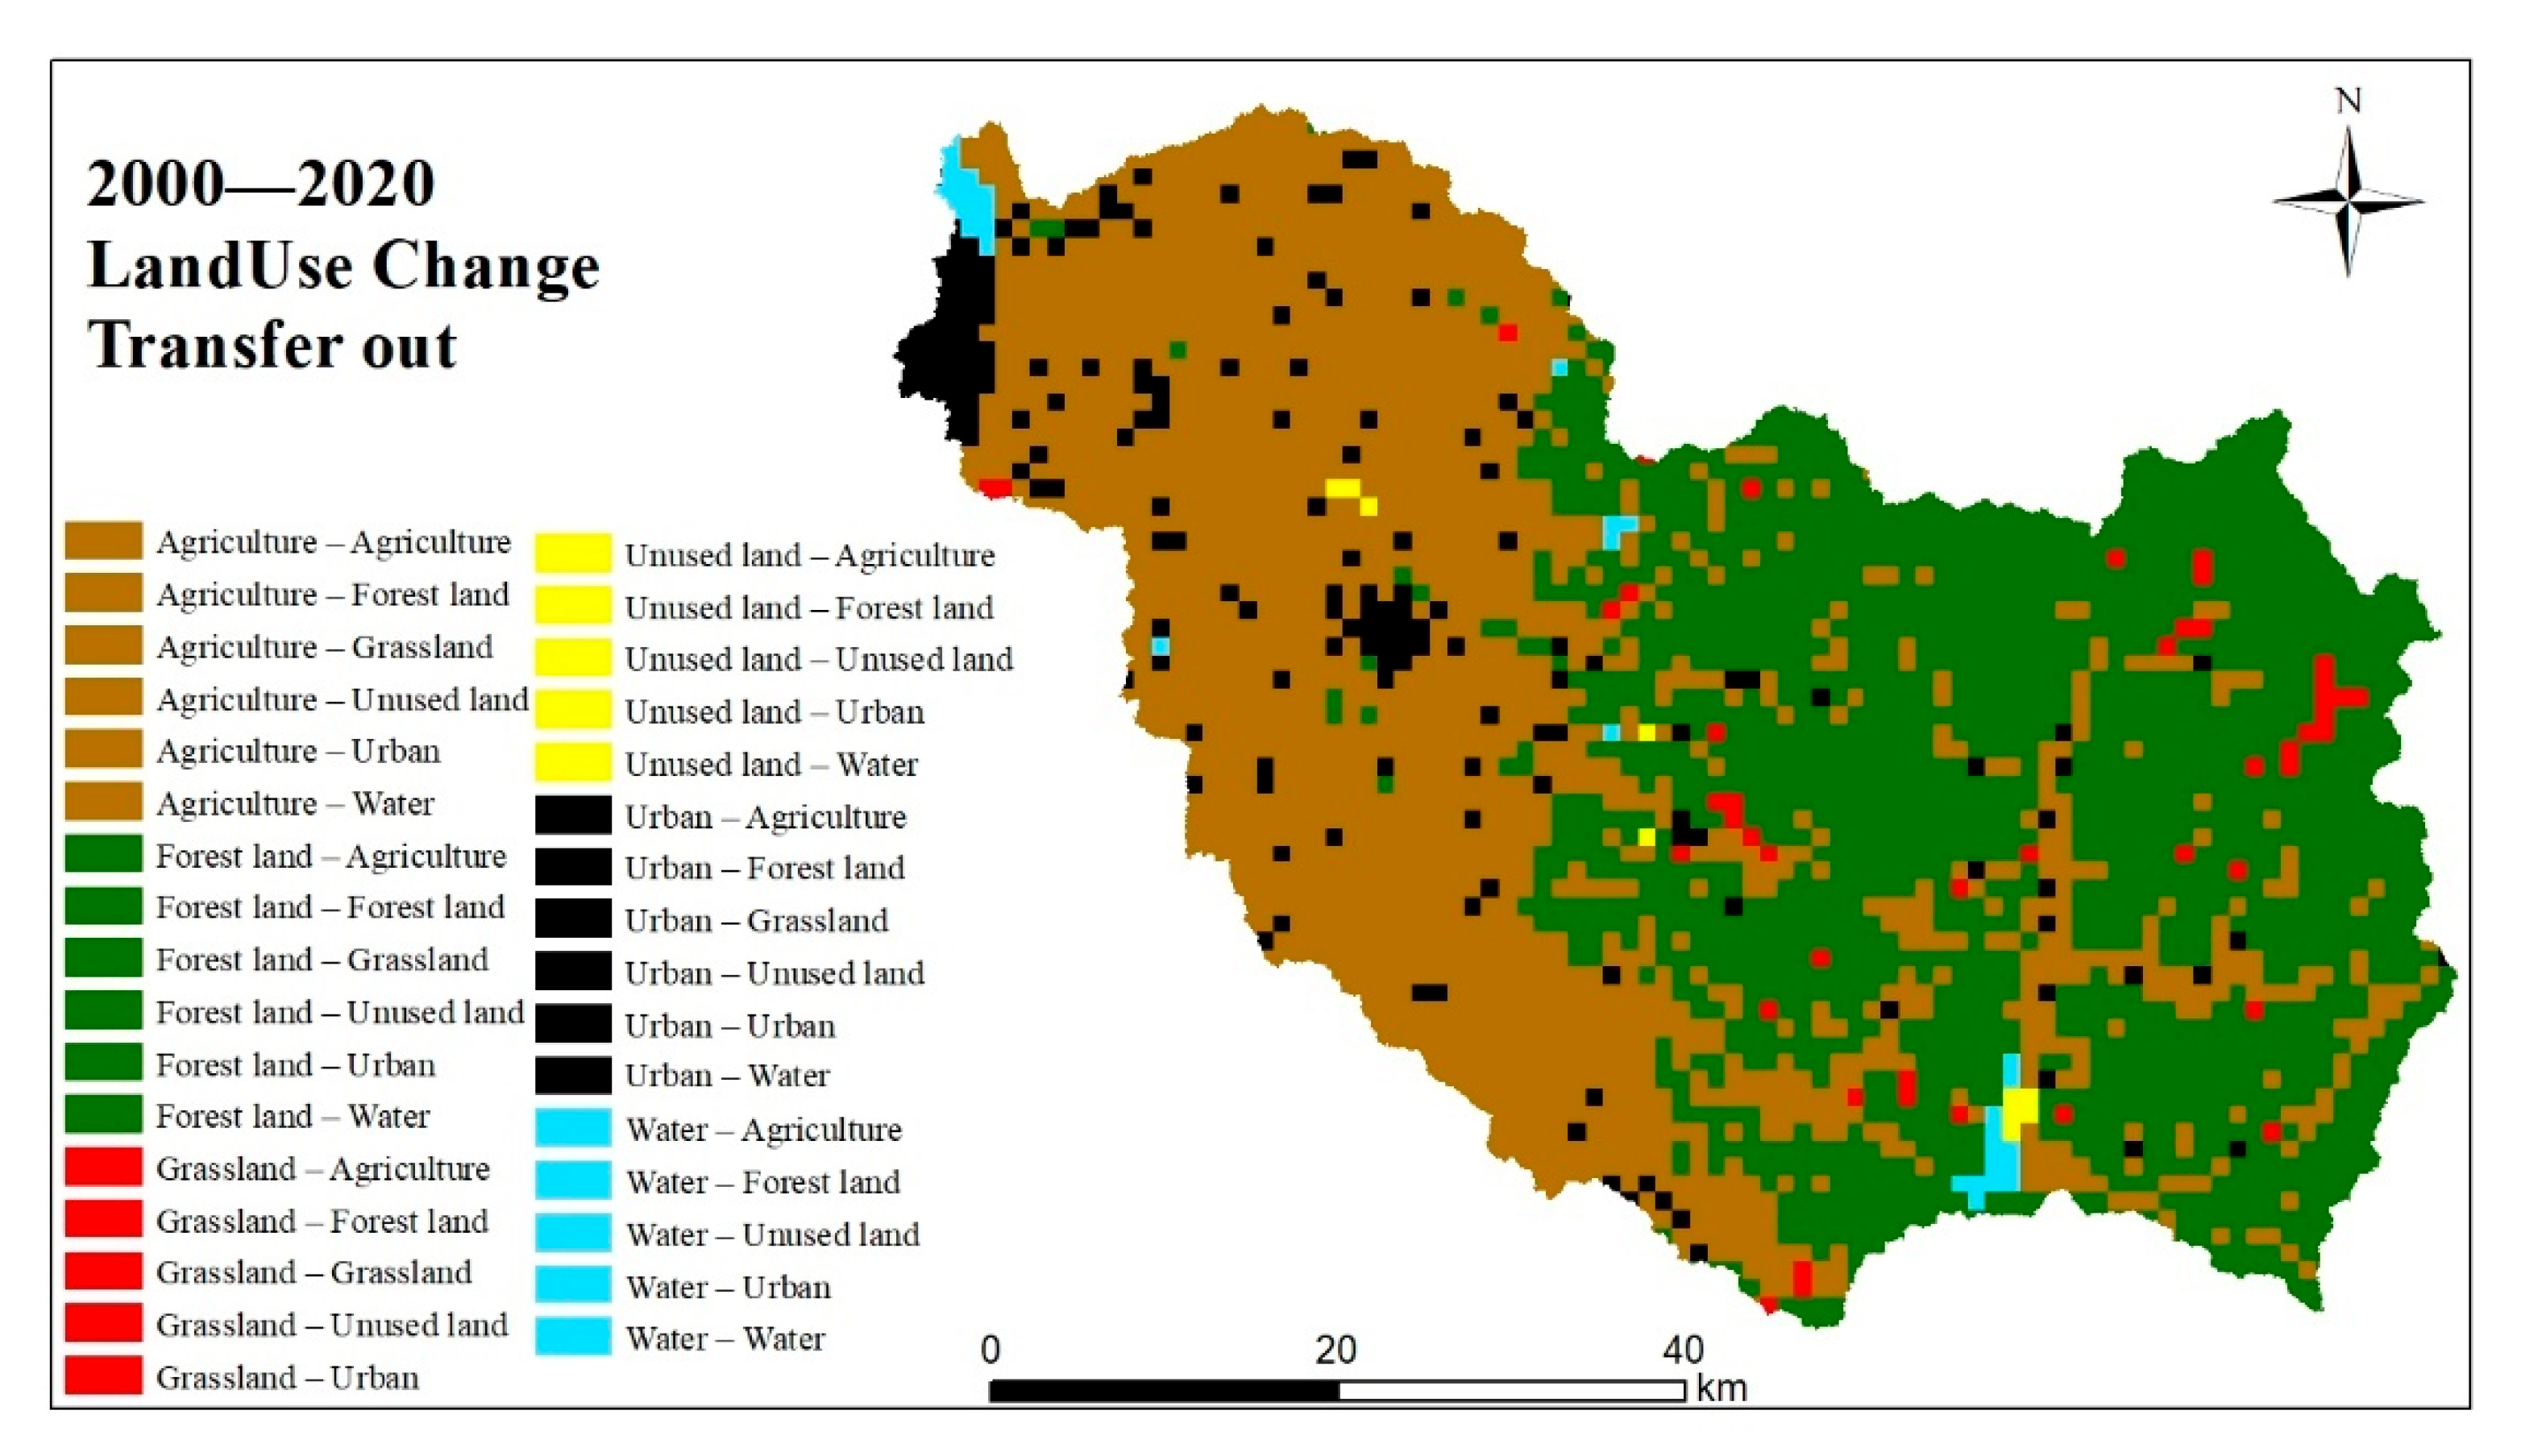
3.2.2. Land Use Transfer Matrix
3.3. Runoff Changes under Different Land Use Scenarios
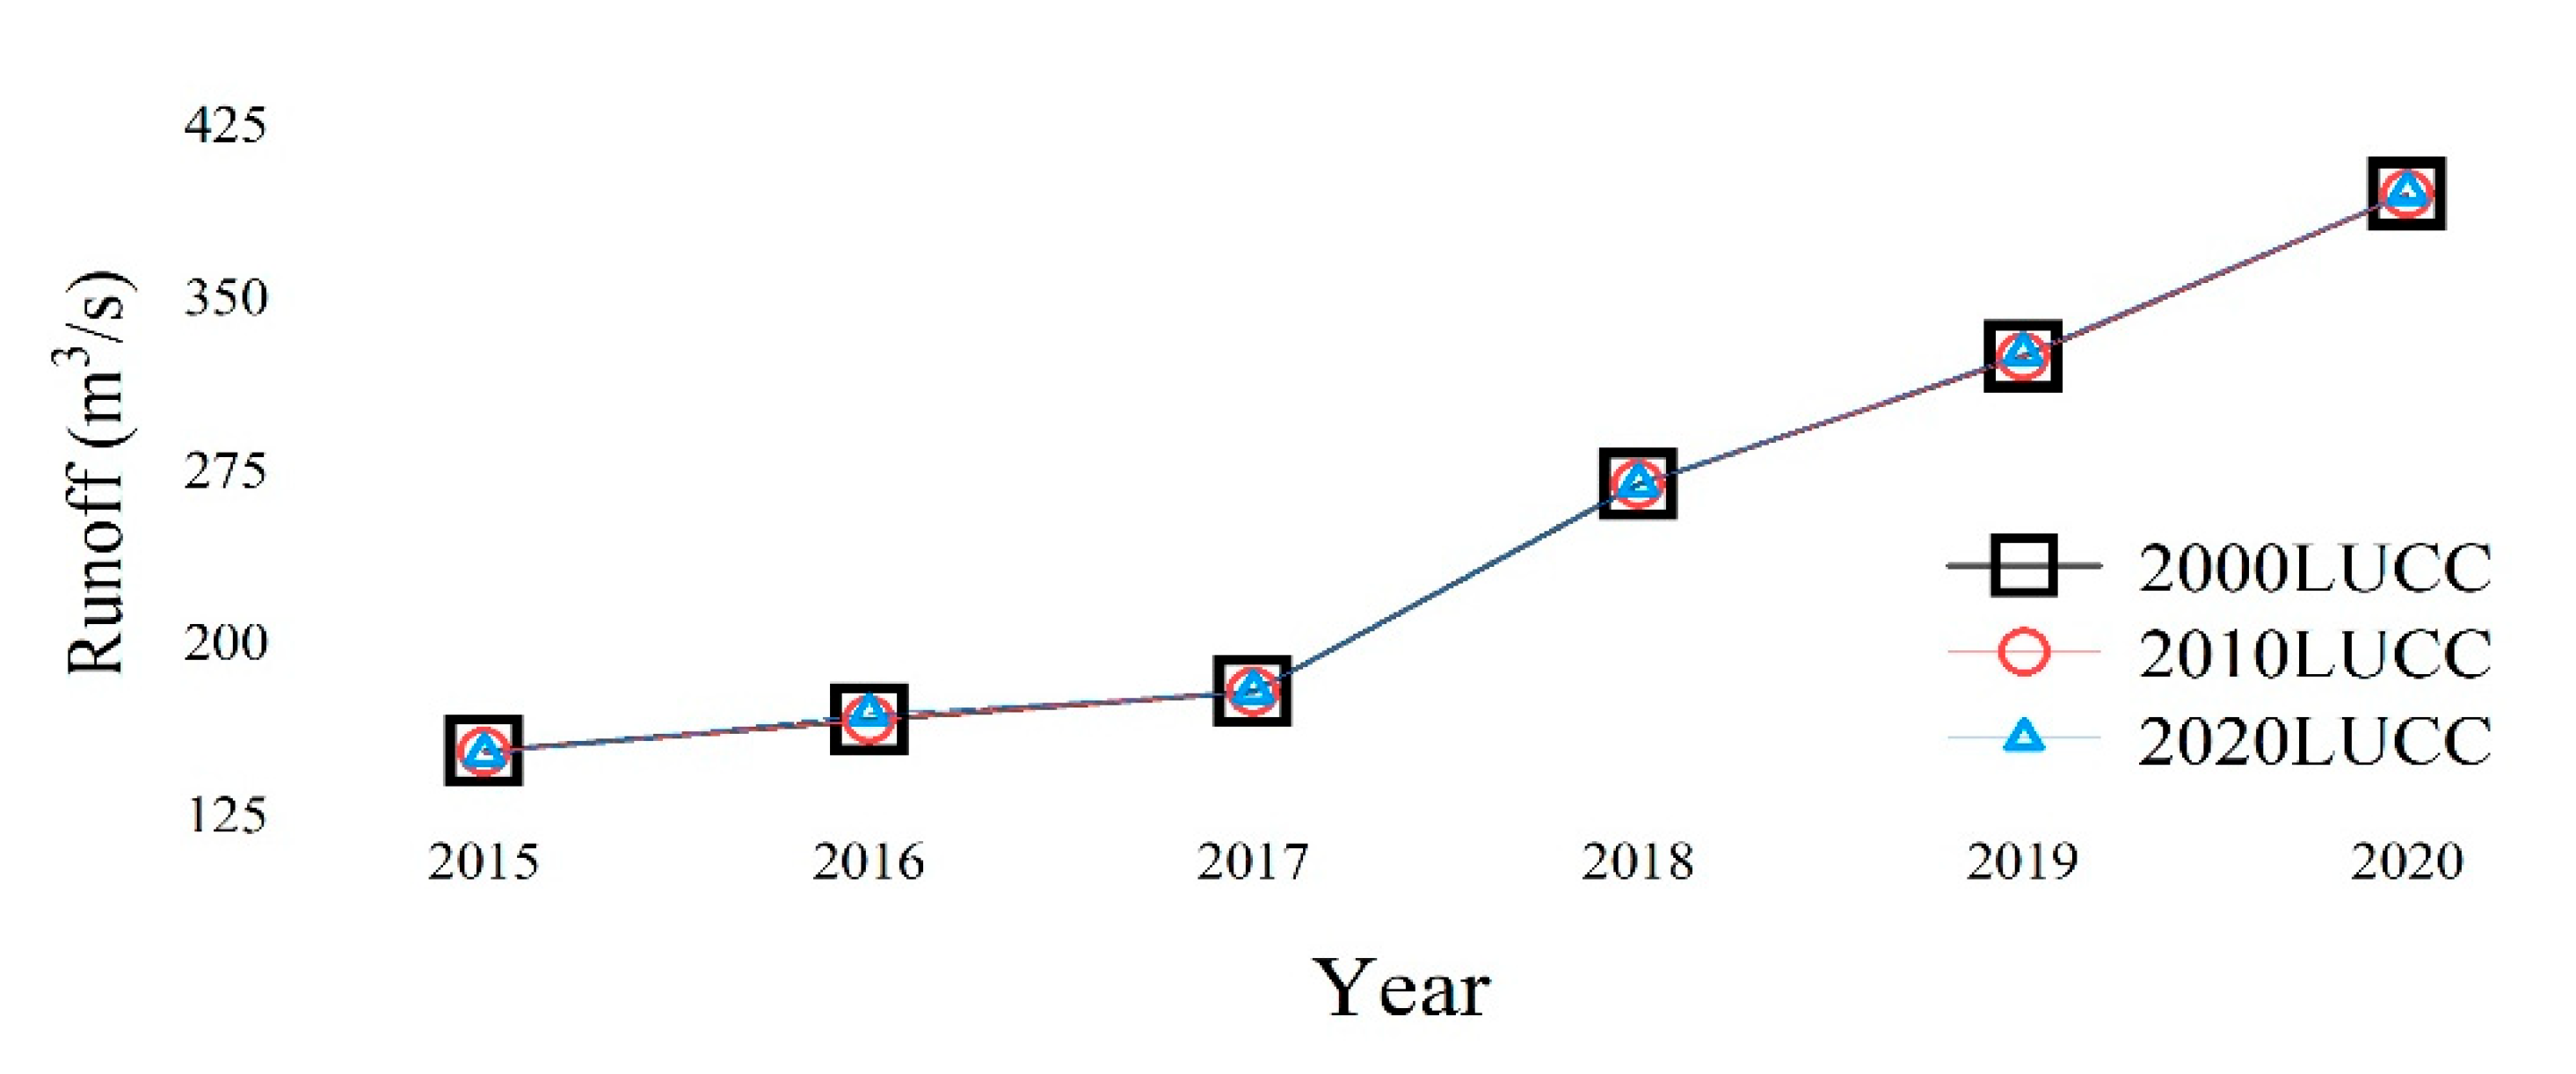
3.3.1. Analysis of Simulation Results at the Annual Scale
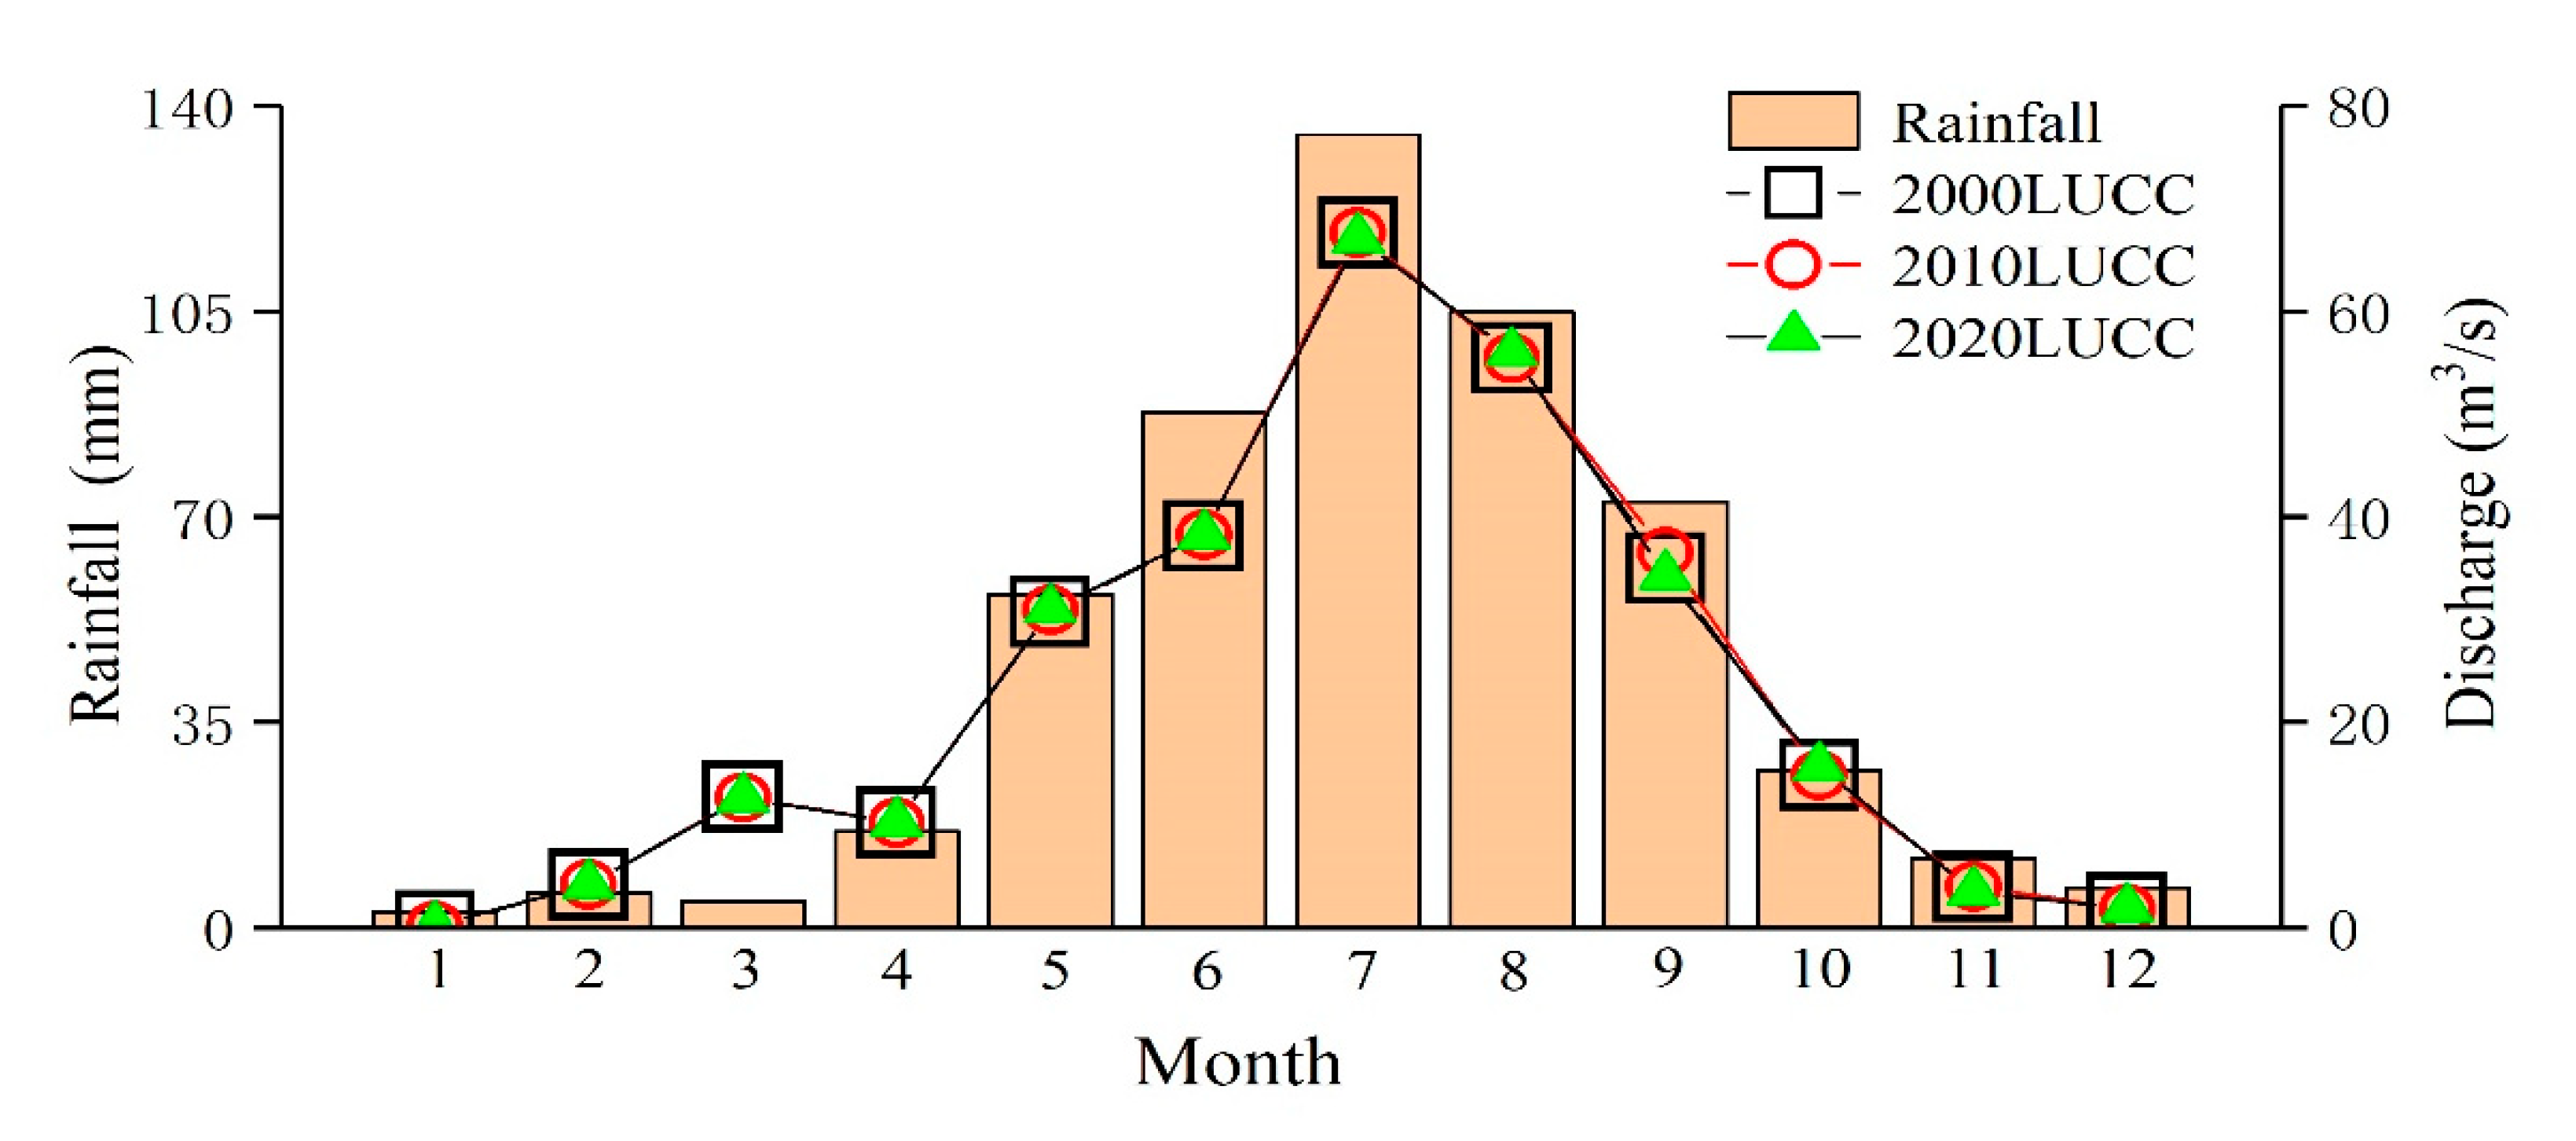
3.3.2. Analysis of Simulation Results at the Monthly Scale
3.4. Changes in Total Nitrogen under Different Land Use Scenarios
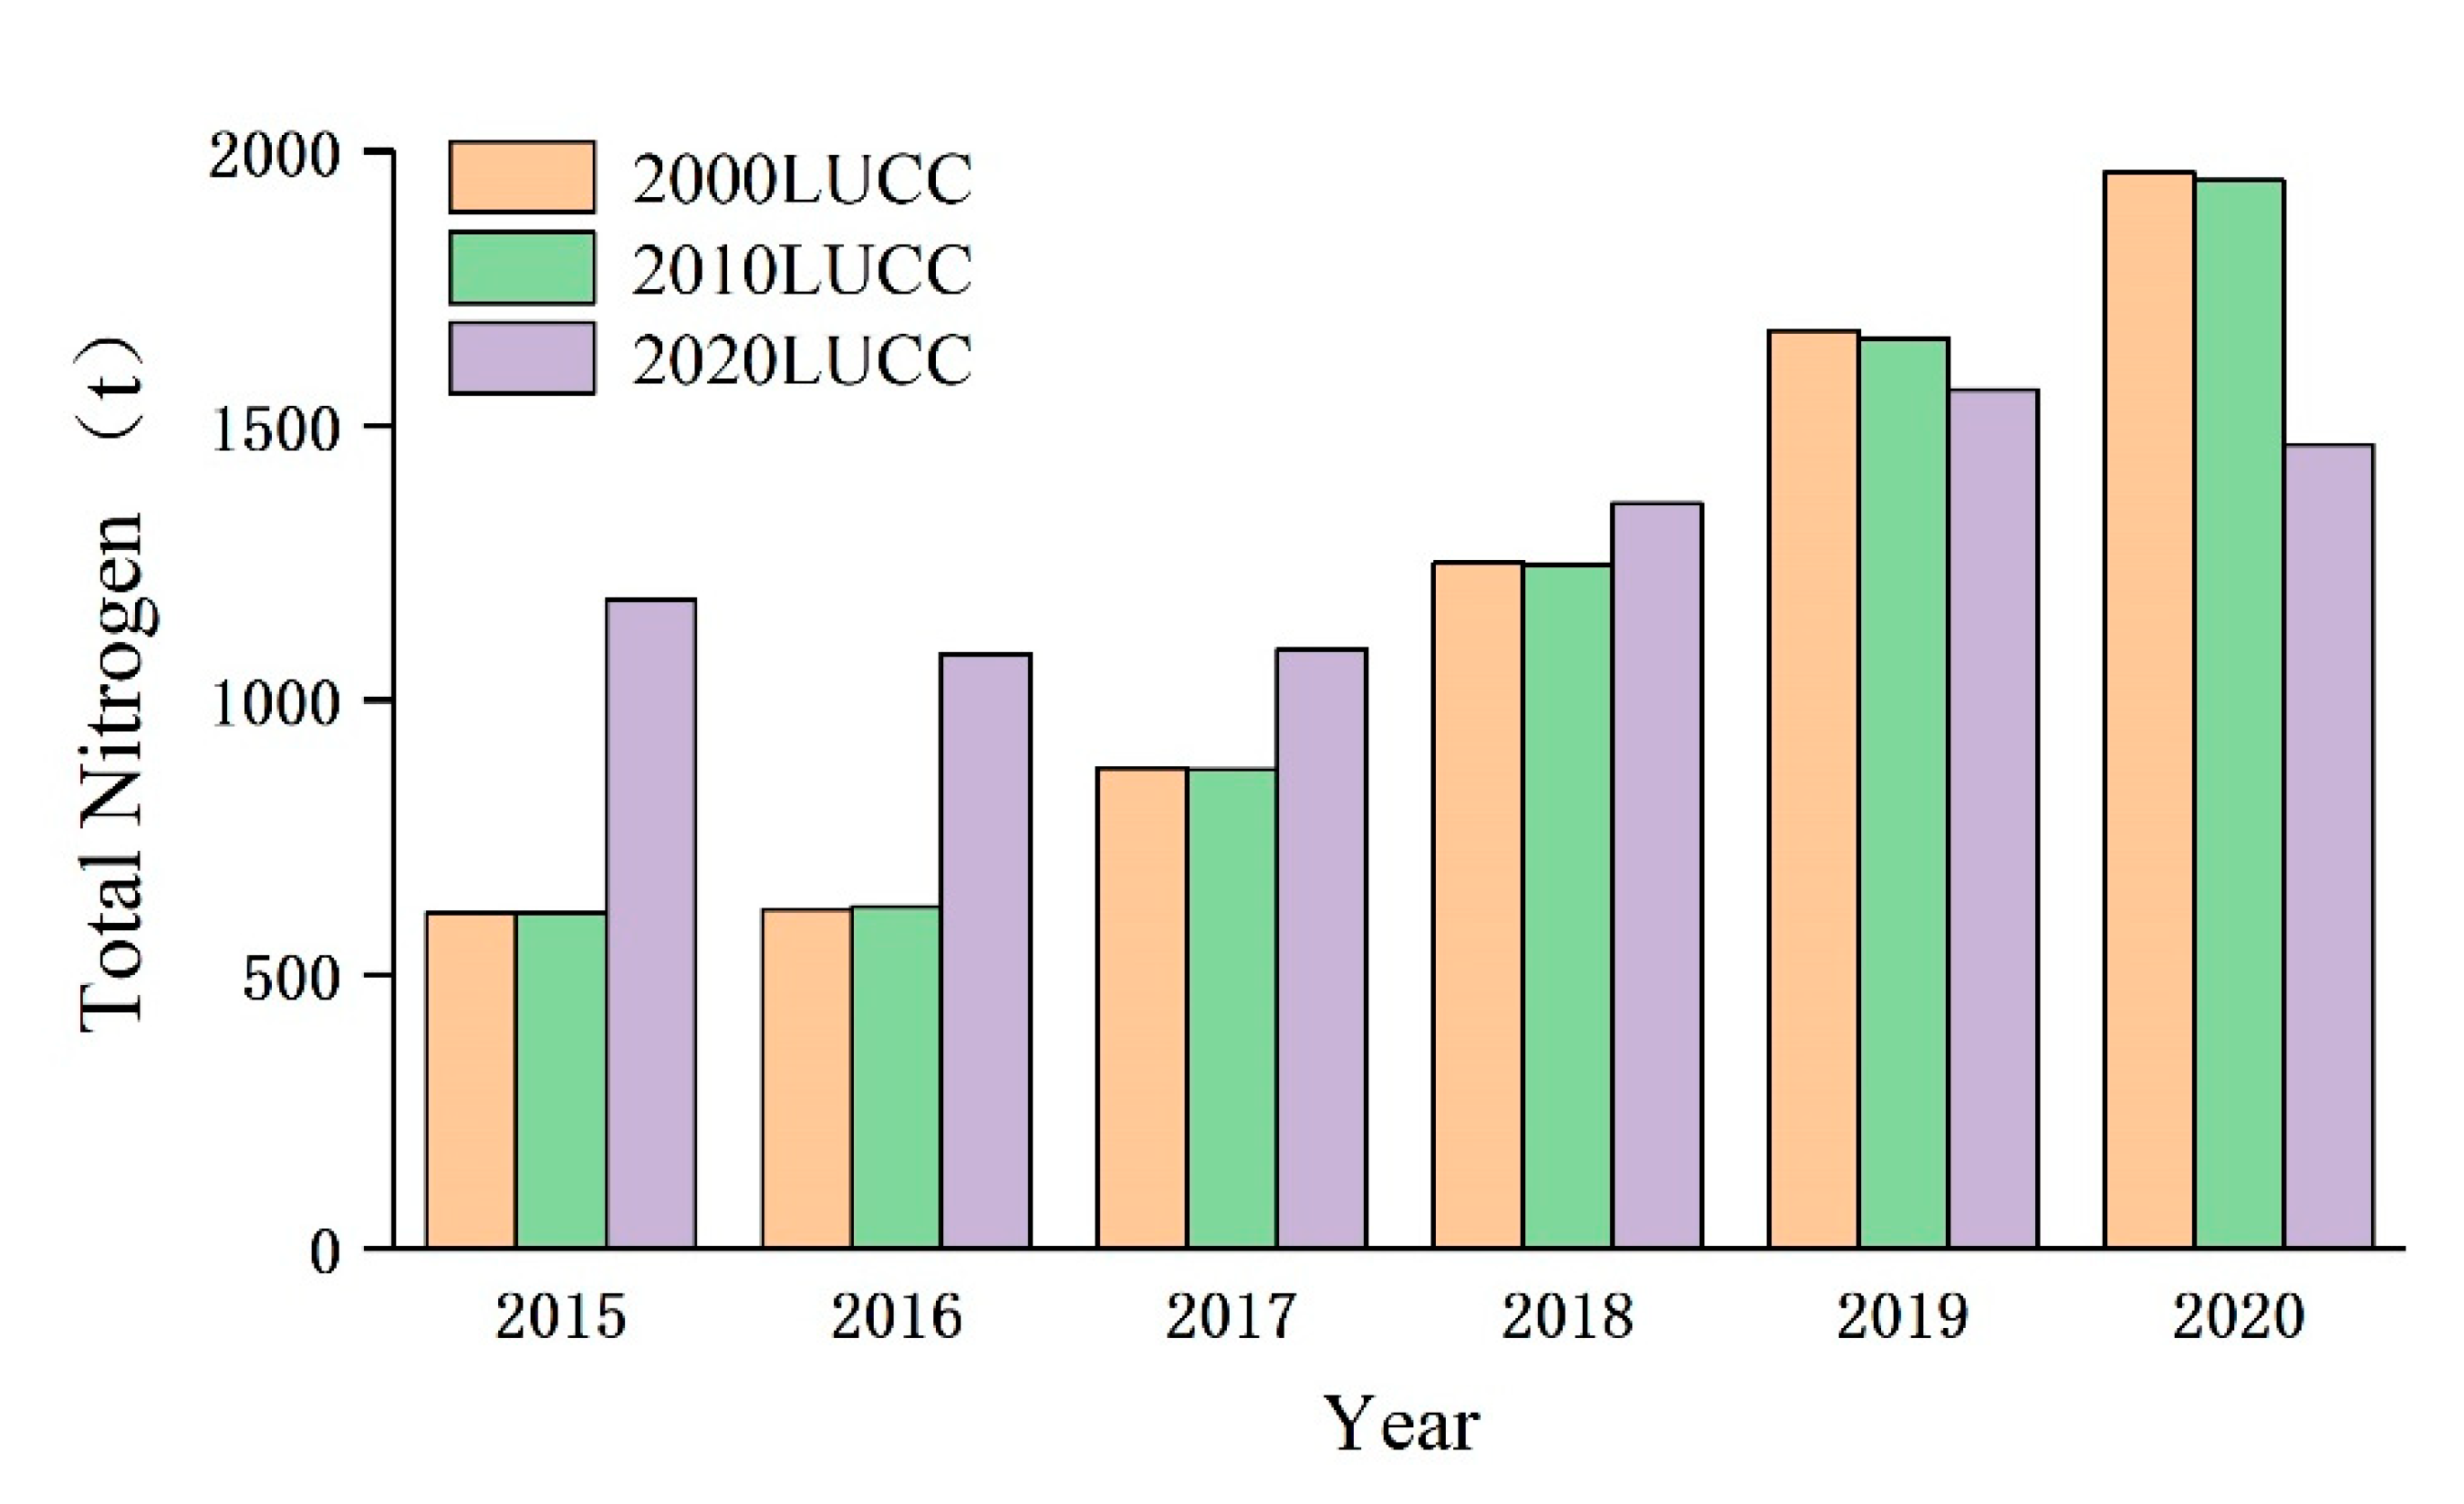
3.4.1. Simulation Analysis of Total Nitrogen at Annual Scale
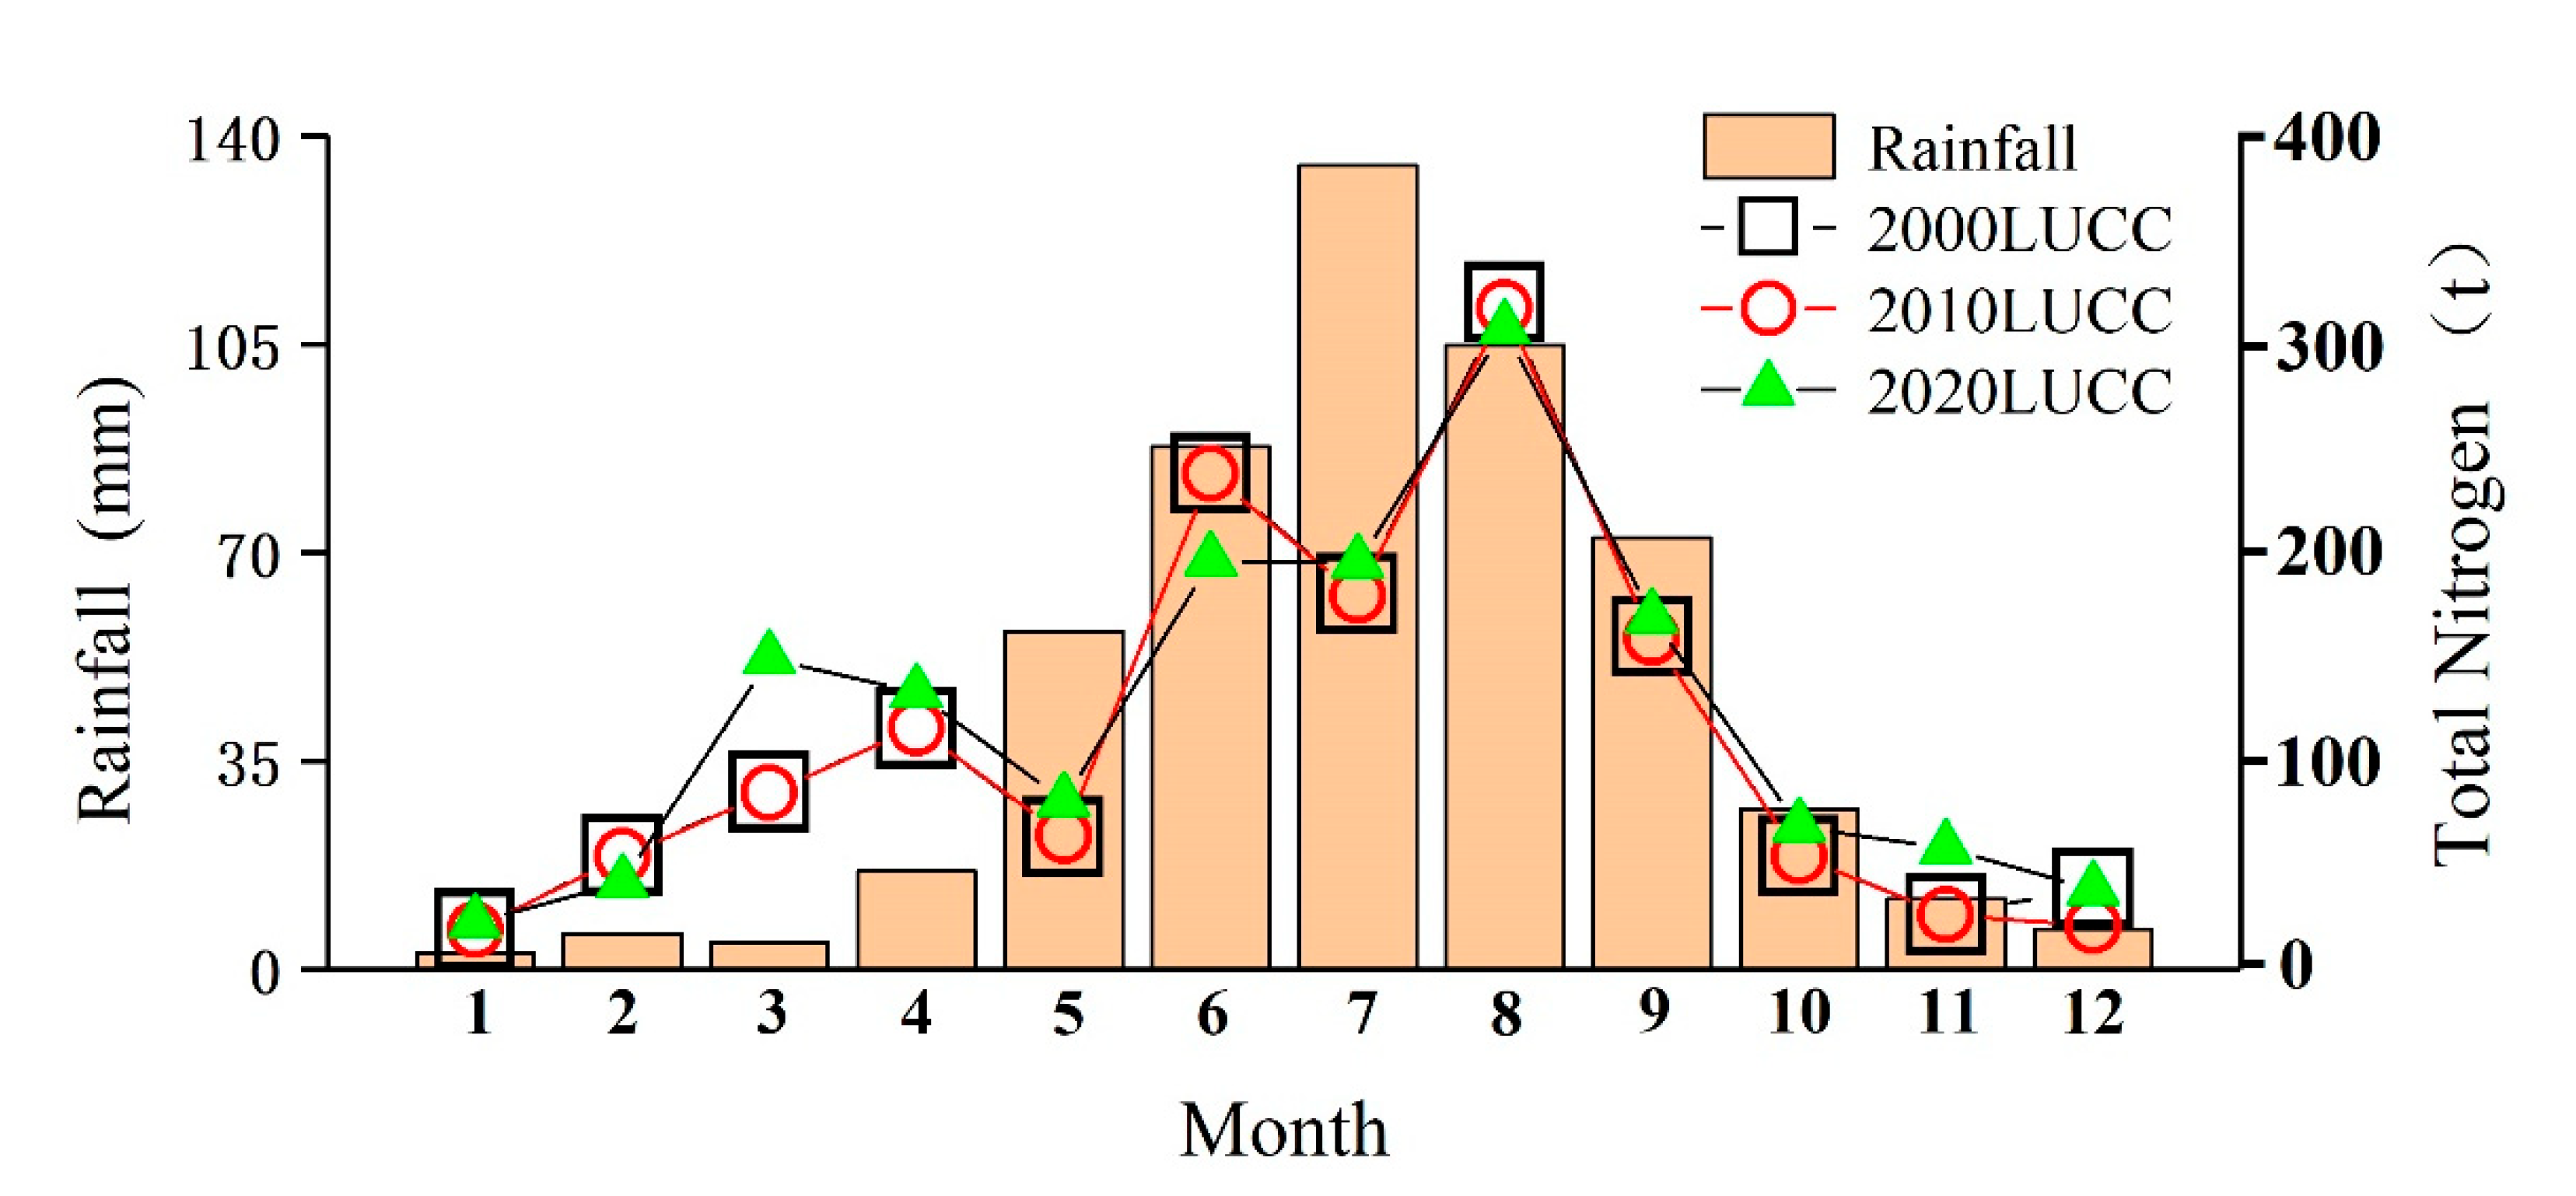
3.4.2. Simulation Analysis of Total Nitrogen at Monthly Scales
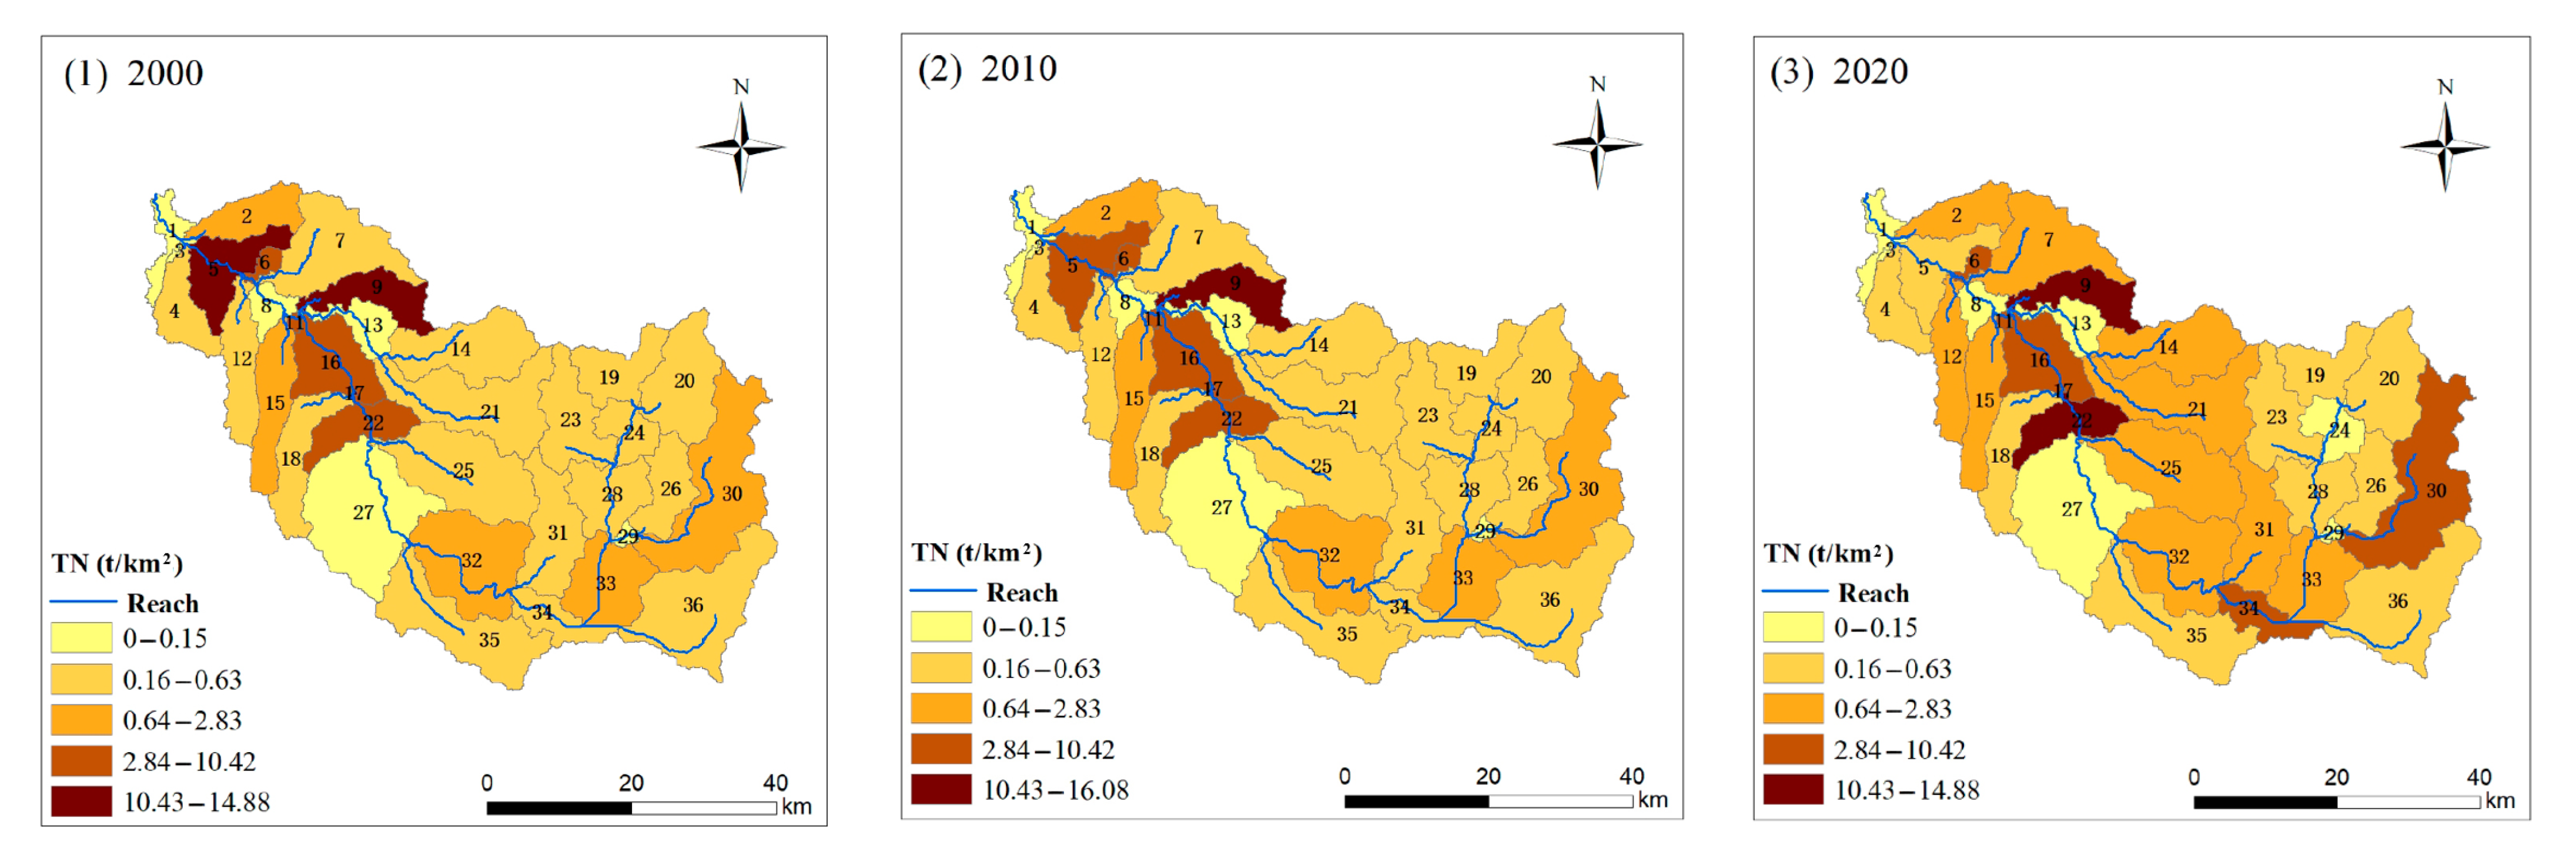
3.4.3. Spatial Distribution Characteristics of Total Nitrogen
3.5. Changes in Total Phosphorus under Different Land Use Scenarios
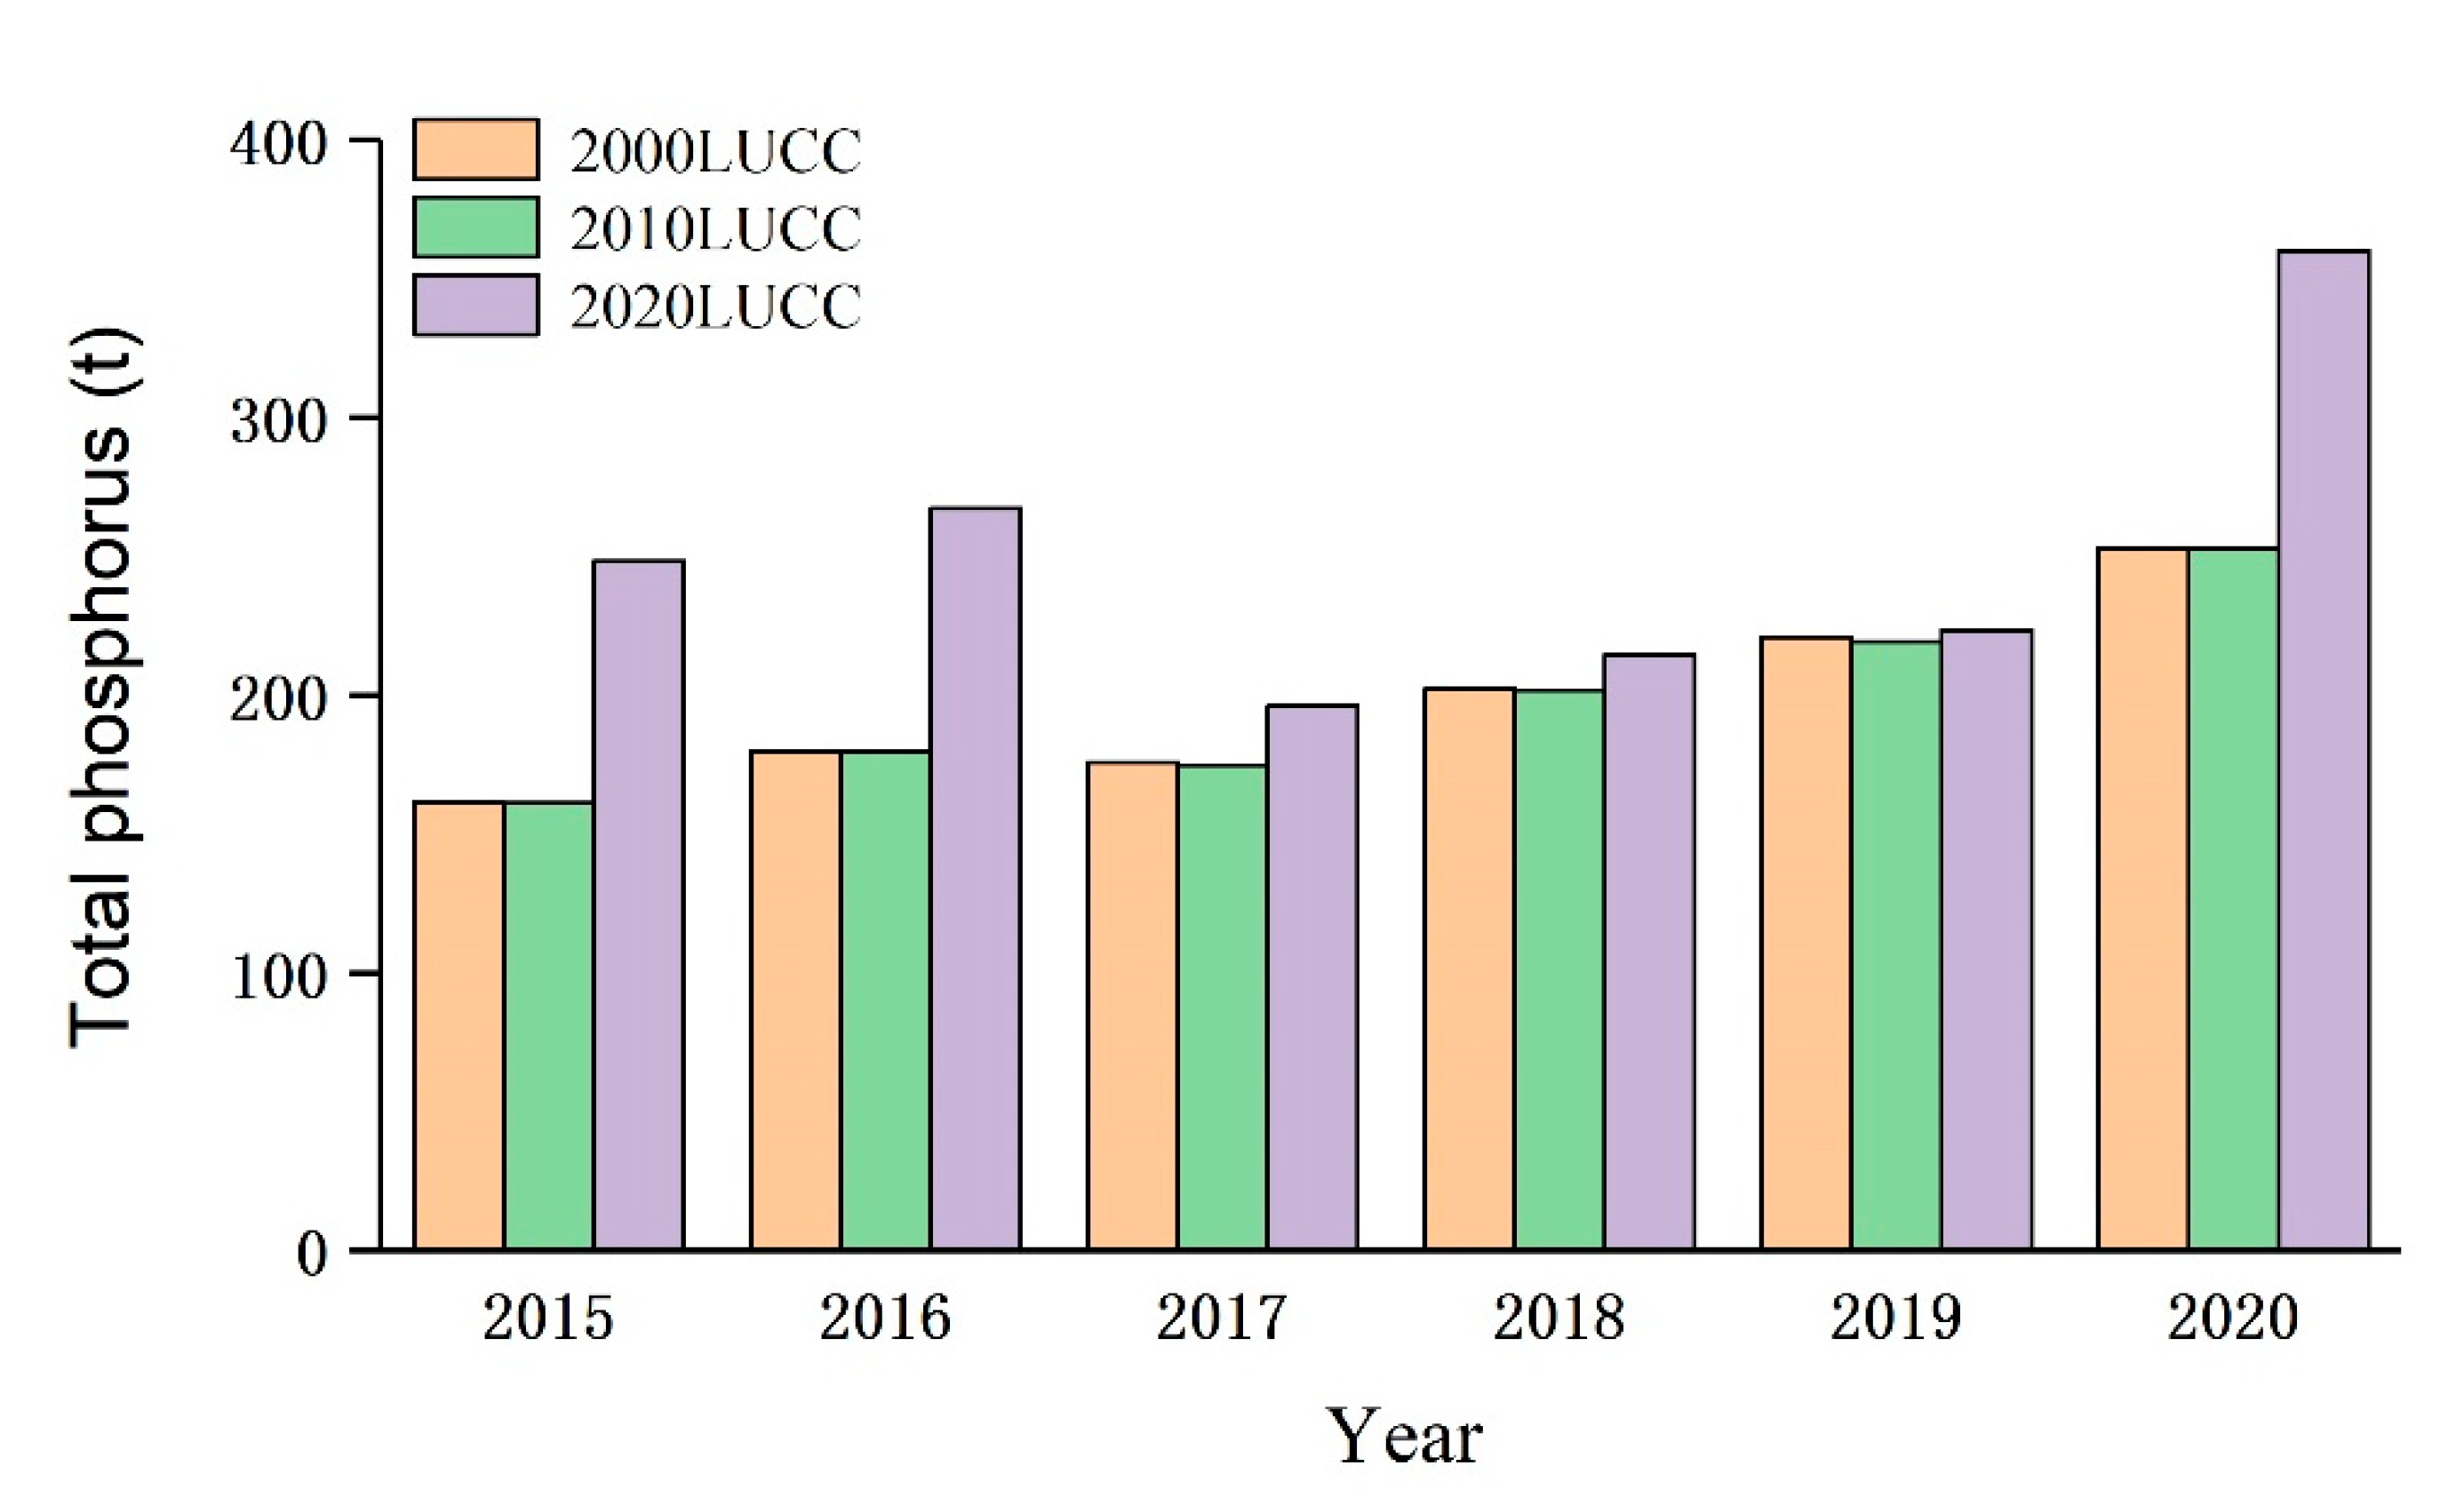
3.5.1. Simulation Analysis of Total Phosphorus at Annual Scale
3.5.2. Simulation Analysis of Total Phosphorus at Monthly Scales
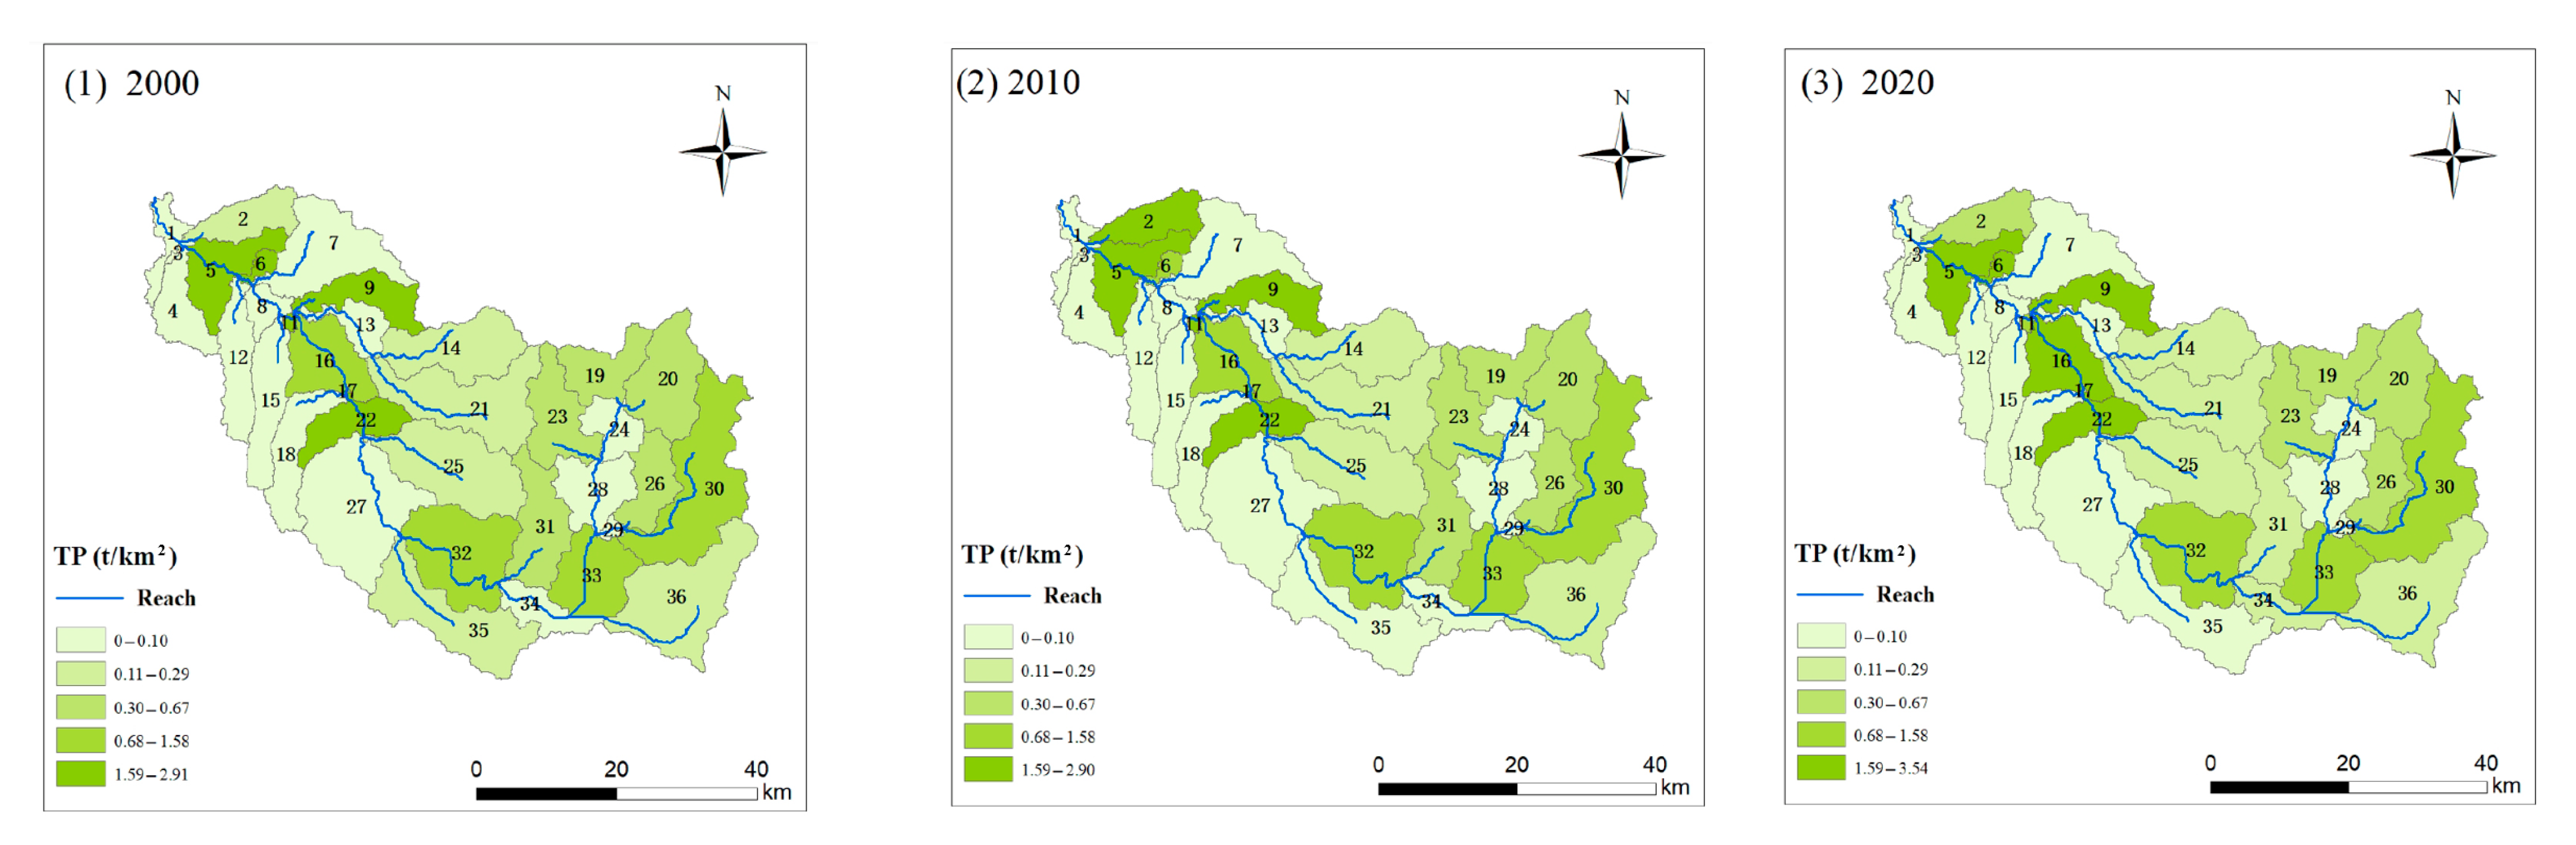
3.5.3. Spatial Distribution Characteristics of Total Phosphorus
4. Discussion
5. Conclusions
Author Contributions
Funding
Institutional Review Board Statement
Informed Consent Statement
Data Availability Statement
Conflicts of Interest
References
- Alvarez, P. The water footprint challenge for water resources management in Chilean arid zones. Water Int. 2018, 43, 846–859. [Google Scholar] [CrossRef]
- Zhang, W.; Wang, X.J. Modeling for point-non-point source effluent trading: Perspective of non-point sources regulation in China. Sci. Total Environ. 2002, 292, 167–176. [Google Scholar] [CrossRef]
- He, C.Y.; Zhang, J.; Liu, Z.; Huang, Q. Characteristics and progress of land use/cover change research during 1990–2018. J. Geogr. Sci. 2022, 32, 537–559. [Google Scholar] [CrossRef]
- Fan, Y.; Yu, G.; He, Z.; Yu, H.; Bai, R.; Yang, L.; Wu, D. Entropies of the Chinese Land Use/Cover Change from 1990 to 2010 at a County Level. Entropy 2017, 19, 51. [Google Scholar] [CrossRef]
- Hunter, P.R. Climate change and waterborne and vector-borne disease. J. Appl. Microbiol. 2003, 94, 37S–46S. [Google Scholar] [CrossRef]
- Han, J.C.; Zhang, Y. Land policy and land engineering. Land Use Policy 2014, 40, 64–68. [Google Scholar] [CrossRef]
- Roebeling, P.C.; Cunha, M.; Arroja, L.; Van Grieken, M.E. Abatement vs. treatment for efficient diffuse source water pollution management in terrestrial-marine systems. Water Sci. Technol. 2015, 72, 730–737. [Google Scholar] [CrossRef]
- Jungho, L.; Park, S.; Kim, D.; Lee, Y.J.; Park, M.J. Correlation Analysis between Rainfall and EMC by Land Use Types based on Monitoring of Nonpoint Source Pollution in Geum River Basin. J. Korean Soc. Hazard Mitig. 2012, 12, 351–358. [Google Scholar]
- Beven, K. How to make advances in hydrological modelling. Hydrol. Res. 2019, 50, 1481–1494. [Google Scholar] [CrossRef] [Green Version]
- Abbaspour, K.C.; Vaghefi, S.A.; Yang, H.; Srinivasan, R. Global soil, landuse, evapotranspiration, historical and future weather databases for SWAT Applications. Sci. Data 2019, 6, 263. [Google Scholar] [CrossRef] [Green Version]
- Krysanova, V.; White, M. Advances in water resources assessment with SWAT-an overview. Hydrol. Sci. J. 2015, 60, 771–783. [Google Scholar] [CrossRef] [Green Version]
- Chanasyk, D.S.; Mapfumo, E.; Willms, W. Quantification and simulation of surface runoff from fescue grassland watersheds. Agric. Water Manag. 2003, 59, 137–153. [Google Scholar] [CrossRef]
- Arnold, J.G.; Allen, P.M.; Bernhardt, G. A comprehensive surface-groundwater flow model. J. Hydrol. 1993, 142, 47–69. [Google Scholar] [CrossRef]
- Wang, Y.; Bian, J.M.; Wang, S.N.; Nie, S.Y. Predicting precipitation on nonpoint source pollutant exports in the source area of the Liao River, China. Water Sci. Technol. 2016, 74, 876–887. [Google Scholar] [CrossRef] [PubMed] [Green Version]
- Shen, Z.Y.; Chen, L.; Liao, Q. Effect of Rainfall Measurement Errors on Nonpoint-Source Pollution Model Uncertainty. J. Environ. Inform. 2015, 26, 14–26. [Google Scholar] [CrossRef]
- Einheuser, M.D.; Nejadhashemi, A.P.; Sowa, S.P.; Wang, L.; Hamaamin, Y.; Woznicki, S. Modeling the effects of conservation practices on stream health. Sci. Total Environ. 2012, 435, 380–391. [Google Scholar] [CrossRef] [PubMed]
- Karki, R.; Srivastava, P.; Veith, T.L. Application of the soil and water assessment tool (swat) at field scale: Categorizing methods and review of applications. Trans. ASABE 2020, 63, 513–522. [Google Scholar] [CrossRef]
- Chirachawala, C.; Shrestha, S.; Babel, M.S.; Virdis, S.G.; Wichakul, S. Evaluation of global land use/land cover products for hydrologic simulation in the Upper Yom River Basin, Thailand. Sci. Total Environ. 2020, 708, 135148. [Google Scholar] [CrossRef]
- Lin, B.Q.; Chen, X.; Yao, H.; Chen, Y.; Liu, M.; Gao, L.; James, A. Analyses of landuse change impacts on catchment runoff using different time indicators based on SWAT model. Ecol. Indic. 2015, 58, 55–63. [Google Scholar] [CrossRef]
- Shrestha, S.; Bhatta, B.; Shrestha, M.; Shrestha, P.K. Integrated assessment of the climate and landuse change impact on hydrology and water quality in the Songkhram River Basin, Thailand. Sci. Total Environ. 2018, 643, 1610–1622. [Google Scholar] [CrossRef]
- Hao, F.-H.; Zhang, X.-S.; Yang, Z.-F. A distributed non-point source pollution model: Calibration and validation in the Yellow River Basin. J. Environ. Sci. 2004, 16, 646–650. [Google Scholar]
- Nie, W.M.; Yuan, Y.; Kepner, W.; Nash, M.S.; Jackson, M.; Erickson, C. Assessing impacts of Landuse and Landcover changes on hydrology for the upper San Pedro watershed. J. Hydrol. 2011, 407, 105–114. [Google Scholar] [CrossRef]
- Lee, J.M.; Shin, Y.; Park, Y.S.; Kum, D.; Lim, K.J.; Lee, S.O.; Kim, H.; Jung, Y. Estimation and assessment of baseflow at an ungauged watershed according to landuse change. J. Wetl. Res. 2014, 16, 303–318. [Google Scholar]
- Yang, S.-L.; Wang, X.-M.; Wang, W.-H.; Hu, X.-Y.; Gao, L.-W.; Sun, X.-B. Distribution and Ecological Risk Assessment of Antibiotics in the Songhua River Basin of the Harbin Section and Ashe River. Huan Jing Ke Xue 2021, 42, 136–146. [Google Scholar] [PubMed]
- Tankpa, V. Hydrological Response to Land Use/Cover Change and Sustainable Use in the Ashe River Basin; Harbin Institute of Technology: Shenzhen, China, 2020. [Google Scholar]
- Mishra, A.; Froebrich, J.; Gassman, P.W. Evaluation of the SWAT model for assessing sediment control structures in a small watershed in India. Trans. ASABE 2007, 50, 469–477. [Google Scholar] [CrossRef]
- Mulungu, D.M.M.; Munishi, S.E. Simiyu River catchment parameterization using SWAT model. Phys. Chem. Earth 2007, 32, 1032–1039. [Google Scholar] [CrossRef]
- Ahmad, H.M.N.; Sinclair, A.; Jamieson, R.; Madani, A.; Hebb, D.; Havard, P.; Yiridoe, E. Modeling Sediment and Nitrogen Export from a Rural Watershed in Eastern Canada Using the Soil and Water Assessment Tool. J. Environ. Qual. 2011, 40, 1182–1194. [Google Scholar] [CrossRef]
- Chen, L.; Xiao, Y.; Sun, C.; Xu, J.; Shen, Z. A Multicriteria Index System for the Selection of Best Management Practices at the Watershed Scale. J. Environ. Account. Manag. 2019, 7, 323–336. [Google Scholar] [CrossRef]
- Zhang, L.; Cheng, L.; Chiew, F.; Fu, B. Understanding the impacts of climate and landuse change on water yield. Curr. Opin. Environ. Sustain. 2018, 33, 167–174. [Google Scholar] [CrossRef]
- Moghadam, N.T.; Abbaspour, K.C.; Malekmohammadi, B.; Schirmer, M.; Yavari, A.R. Spatiotemporal Modelling of Water Balance Components in Response to Climate and Landuse Changes in a Heterogeneous Mountainous Catchment. Water Resour. Manag. 2021, 35, 793–810. [Google Scholar] [CrossRef]
- Mao, A.Q. Study of Land Use Evolution Based On SWAT Model on Non-Point Source Pollution in Fuzhou River Basin; Nanchang University: Nanchang, China, 2020. [Google Scholar]
- Qiao, W.F.; Niu, H.P.; Zhao, T.Q. Spatial and temporal distribution characteristics of agricultural nonpoint source pollution in the Danjiangkou Reservoir watershed based on SWAT model—Yangtze River Basin Resources and Environment. Resour. Environ. Yangtze Basin 2013, 22, 219–225. [Google Scholar]
- Yuan, Y.; Shi, M.M.; Li, H.P.; Shi, B.B.; Wu, M.Z. Identification of non-point source pollution and its critical areas in the North Ru River Basin based on SWAT model. J. Irrig. Drain. 2020, 39, 115–122. [Google Scholar]


| Data Name | Data Source | Data Type | Basic Information |
|---|---|---|---|
| DEM | Geospatial Data Cloud | SRTM | SRTMDEMUTM 90M |
| Land Use Map | Resource and Environmental Science and Data Center | GRID | 1 km Grid data |
| Soil type map | Resource and Environmental Science and Data Center | GRID | HWSD China Soil |
| Watershed map | Google Earth | - | - |
| Meteorology | National Weather Science Data Center | Daily Scale | 2010–2020 |
| Measured runoff data | Harbin Acheng District Hydrology Station | Monthly scale | 2015–2020 |
| Measured nitrogen and phosphorus data | Harbin City Environmental Monitoring Center | Monthly scale | 2015–2020 |
| Number | Full Name | Soil Group |
|---|---|---|
| PHj | Stagnic Phaeozems | PHAEOZEMS |
| PHh | Haplic Phaeozems | PHAEOZEMS |
| PHg | Gleyic Phaeozems | PHAEOZEMS |
| LVh | Haplic Luvisols | LUVISOLS |
| LVg | Gleyic Luvisols | LUVISOLS |
| LVa | Albic Luvsiols | LUVISOLS |
| GLm | Mollic Gleysols | GLEYSOLS |
| ATc | Cumulic Anthrosols | ANTHROSOLS |
| Number | Station Number | Longitude (°) | Latitude (°) |
|---|---|---|---|
| 1 | pcp50851 | 126.05 | 46.41 |
| 2 | pcp50853 | 126.58 | 46.37 |
| 3 | pcp50858 | 125.56 | 46.04 |
| 4 | pcp50859 | 126.17 | 46.17 |
| 5 | pcp50867 | 127.21 | 46.05 |
| 6 | pcp50877 | 129.35 | 46.18 |
| 7 | pcp50953 | 126.34 | 45.56 |
| 8 | pcp50956 | 126.46 | 46.05 |
| 9 | pcp50958 | 126.56 | 45.32 |
| 10 | pcp50960 | 127.23 | 45.44 |
| 11 | pcp50962 | 128.02 | 45.57 |
| 12 | pcp50963 | 128.44 | 45.58 |
| 13 | pcp50964 | 128.48 | 45.50 |
| 14 | pcp50965 | 128.16 | 45.26 |
| 15 | pcp50968 | 127.58 | 45.13 |
| 16 | pcp50979 | 130.14 | 45.16 |
| 17 | pcp54063 | 126.00 | 44.58 |
| 18 | pcp54065 | 125.39 | 44.32 |
| 19 | pcp54069 | 125.48 | 44.10 |
| 20 | pcp54072 | 126.31 | 44.51 |
| 21 | pcp54076 | 126.56 | 44.23 |
| 22 | pcp54080 | 127.09 | 44.54 |
| 23 | pcp54092 | 129.24 | 44.36 |
| 24 | pcp54094 | 129.40 | 44.30 |
| 25 | pcp54098 | 129.28 | 44.20 |
| Performance Ratio | ||
|---|---|---|
| Very good | ||
| Good | ||
| Satisfactory | ||
| Unsatisfactory |
| Number | Parameter | Definition | Mode | Value Range | Target | Value |
|---|---|---|---|---|---|---|
| 1 | CN2 | SCS runoff curve coefficient | v | 0–200 | Runoff | 85.2109 |
| 2 | ALPHA_BF | Base-flow α coefficient | v | 0–1 | Runoff | 0.171 |
| 3 | GW_DELAY | Groundwater hysteresis factor | v | 0–500 | Runoff | 484.5 |
| 4 | GW_REVAP | Groundwater re-evaporation coefficient | v | 0–1 | Runoff | 0.1602 |
| 5 | ESCO | Soil evaporation compensation factor | v | 0–1 | Runoff | 0.201 |
| 6 | CH_N2 | Main river Manning system values | v | 0–0.31 | Runoff | 0.1595 |
| 7 | CH_K2 | Effective hydraulic conductivity of the river | v | 0.01–500 | Runoff | 91.4918 |
| 8 | ALPHA_BNK | River storage factor | v | 0–1 | Runoff | 0.543 |
| 9 | SOL_AWC | Soil water availability | v | 0–1 | Runoff | 0.665 |
| 10 | SOL_K | Saturated hydraulic conductivity | v | 0–250 | Runoff | 186 |
| 11 | SOL_BD | Wet capacity of surface soil | v | 0.5–2.5 | Runoff | 2.2424 |
| 12 | GWQMN | Shallow groundwater net flow coefficient | v | 0–5000 | Runoff | 2085 |
| 13 | SLSUBBSN | Average slope length | v | 10–100 | Runoff | 88.82 |
| 14 | OV_N | Manning factor for slope diffuse flow | v | 0–10 | Runoff | 6.0979 |
| 15 | LAT_TTIME | Soil flow measurement delay index | v | 0–100 | Runoff | 10.26 |
| 16 | NPERCO | Nitrogen permeability coefficient | v | 0–1 | Water Quality | 0.7616 |
| 17 | PPERCO | Phosphorus permeability coefficient | v | 10–17.5 | Water Quality | 12.5375 |
| 18 | PHOSKD | Soil phosphorus partition coefficient | v | 100–200 | Water Quality | 144.8333 |
| 19 | PSP | Index of phosphorus effectiveness | v | 0.01–0.7 | Water Quality | 0.5953 |
| 20 | N_UPDIS | Nitrogen absorption distribution parameters | v | 20–100 | Water Quality | 76.5 |
| 21 | P_UPDIS | Phosphorus absorption distribution parameters | v | 20–100 | Water Quality | 85.1666 |
| 22 | FIXCO | Nitrogen fixation factor | v | 0–1 | Water Quality | 0.9516 |
| 23 | SHALLST_N | Nitrate concentration in groundwater runoff | v | 0–1000 | Water Quality | 715 |
| 24 | GWSOLP | Groundwater soluble phosphorus concentration | v | 0–1000 | Water Quality | 951.6666 |
| 25 | HLIFE_NGW | Half-life of nitrogen | v | 0–200 | Water Quality | 114.3333 |
| 26 | LAT_ORGN | Baseflow organic nitrogen content | v | 0–200 | Water Quality | 1.6666 |
| 27 | LAT_ORGP | Basestream organophosphorus content | v | 0–200 | Water Quality | 3.6666 |
| 28 | BIOMIX | Biomixing efficiency | v | 0–1 | Water Quality | 0.9016 |
| 29 | CH_ONCO | Concentration of organic nitrogen in the river | v | 0–100 | Water Quality | 43.5 |
| 30 | CH_OPCO | Concentration of organic phosphorus in the river | v | 0–100 | Water Quality | 23.1666 |
| 31 | ERORGP | Organic phosphorus enrichment rate | v | 0–5 | Water Quality | 0.2583 |
| 32 | POT_NO3L | Nitrate decay rate in potholes | v | 0–1 | Water Quality | 0.425 |
| 33 | ORGN_CON | Organic nitrogen concentration in runoff | v | 0–100 | Water Quality | 9.5 |
| 34 | ORGP_CON | Organic phosphorus concentration in runoff | v | 0–50 | Water Quality | 14.5833 |
| 35 | ERORGN | Enrichment rate of organic nitrogen | v | 0–5 | Water Quality | 2.255 |
| Land Type | 2000 | 2010 | 2020 | 2000~2010 | 2010~2020 | 2000~2020 | |||
|---|---|---|---|---|---|---|---|---|---|
| Area | Area | Area | Variation | K | Variation | K | Variation | K | |
| Cropland | 1668.11 | 1640.77 | 1567.82 | −27.34 | −0.16% | −72.95 | −0.44% | −100.29 | −0.30% |
| Forest | 1567.72 | 1585.61 | 1547.16 | 17.89 | 0.11% | −38.45 | −0.24% | −20.56 | −0.07% |
| Grassland | 46.03 | 41.72 | 29.01 | −4.31 | −0.94% | −12.71 | −3.05% | −17.02 | −1.85% |
| Water | 31.36 | 30.33 | 32.7 | −1.03 | −0.33% | 2.37 | 0.78% | 1.34 | 0.21% |
| Urban | 177.8 | 192.61 | 269.87 | 14.81 | 0.83% | 77.26 | 4.01% | 92.07 | 2.59% |
| Unused Land | 9.94 | 9.94 | 54.44 | 0 | 0.00% | 44.5 | 44.77% | 44.5 | 22.38% |
| Total area | 3501 | ||||||||
| 2000 Transfer out | ||||||||
|---|---|---|---|---|---|---|---|---|
| Cropland | Forest | Grassland | Water | Urban | Unused Land | 2010 Total | ||
| 2010 Transfer to | Cropland | 1638.69 | 1.04 | 1.04 | 0 | 0 | 0 | 1640.77 |
| Forest | 10.91 | 1564.60 | 10.10 | 0 | 0 | 0 | 1585.61 | |
| Grassland | 5.78 | 1.04 | 34.89 | 0 | 0 | 0 | 41.72 | |
| Water | 0 | 0 | 0 | 30.32 | 0 | 0 | 30.33 | |
| Urban | 12.73 | 1.04 | 0 | 1.04 | 177.80 | 0 | 192.61 | |
| Unused Land | 0 | 0 | 0 | 0 | 0 | 9.94 | 9.94 | |
| 2000 Total | 1668.11 | 1567.72 | 46.03 | 31.36 | 177.80 | 9.94 | 3501 | |
| 2010 Transfer out | ||||||||
|---|---|---|---|---|---|---|---|---|
| Cropland | Forest | Grassland | Water | Urban | Unused Land | 2020 Total | ||
| 2020 Transfer to | Cropland | 1236.47 | 221.86 | 12.60 | 1.93 | 94.57 | 0.37 | 1567.82 |
| Forest | 188.19 | 1316.23 | 23.93 | 6.32 | 10.93 | 1.86 | 1547.16 | |
| Grassland | 12.63 | 10.24 | 2.73 | 0 | 3.40 | 0 | 29.01 | |
| Water | 12.42 | 3.58 | 0 | 11.59 | 0.09 | 5.02 | 32.70 | |
| Urban | 161.90 | 20.57 | 1.51 | 5.39 | 80.50 | 0.01 | 269.87 | |
| Unused Land | 28.48 | 14.94 | 0.86 | 5.03 | 2.74 | 2.69 | 54.44 | |
| 2010 Total | 1640.77 | 1585.61 | 41.71 | 30.33 | 192.61 | 9.94 | 3501 | |
| 2000 Transfer out | ||||||||
|---|---|---|---|---|---|---|---|---|
| Cropland | Forest | Grassland | Water | Urban | Unused Land | 2000 Total | ||
| 2020 Transfer to | Cropland | 1247.24 | 217.01 | 10.29 | 1.93 | 90.97 | 0.37 | 1567.82 |
| Forest | 191.07 | 1305.03 | 33.29 | 6.32 | 9.88 | 1.86 | 1547.16 | |
| Grassland | 15.36 | 10.24 | 0.01 | 0 | 3.40 | 0 | 29.01 | |
| Water | 13.30 | 2.70 | 0 | 11.59 | 0.09 | 5.02 | 32.7 | |
| Urban | 171.82 | 19.77 | 1.51 | 6.27 | 70.50 | 0.01 | 269.87 | |
| Unused Land | 28.65 | 14.77 | 0.88 | 5.19 | 2.58 | 2.69 | 54.44 | |
| 2020 Total | 1668.11 | 1567.72 | 46.03 | 31.36 | 177.80 | 9.94 | 3501 | |
Publisher’s Note: MDPI stays neutral with regard to jurisdictional claims in published maps and institutional affiliations. |
© 2022 by the authors. Licensee MDPI, Basel, Switzerland. This article is an open access article distributed under the terms and conditions of the Creative Commons Attribution (CC BY) license (https://creativecommons.org/licenses/by/4.0/).
Share and Cite
Chen, J.; Du, C.; Nie, T.; Han, X.; Tang, S. Study of Non-Point Pollution in the Ashe River Basin Based on SWAT Model with Different Land Use. Water 2022, 14, 2177. https://doi.org/10.3390/w14142177
Chen J, Du C, Nie T, Han X, Tang S. Study of Non-Point Pollution in the Ashe River Basin Based on SWAT Model with Different Land Use. Water. 2022; 14(14):2177. https://doi.org/10.3390/w14142177
Chicago/Turabian StyleChen, Jiashuo, Chong Du, Tangzhe Nie, Xu Han, and Siyu Tang. 2022. "Study of Non-Point Pollution in the Ashe River Basin Based on SWAT Model with Different Land Use" Water 14, no. 14: 2177. https://doi.org/10.3390/w14142177
APA StyleChen, J., Du, C., Nie, T., Han, X., & Tang, S. (2022). Study of Non-Point Pollution in the Ashe River Basin Based on SWAT Model with Different Land Use. Water, 14(14), 2177. https://doi.org/10.3390/w14142177