Abstract
To investigate the monitoring history and long-term change trends in surface water quality in China since the reform and opening up, the history of surface water environment monitoring is summarized, including monitoring scope, monitoring methods, and technical requirements. Temporal and spatial patterns of surface water quality in China were analyzed based on the monitoring results. In the past 40 years, the monitoring targets for surface water quality have been continuously improved, the frequency of monitoring has become more science-based, and the monitoring indicators are now comprehensive. Overall, the temporal change trend in surface water quality has followed a “fluctuating changes stage—rapid deterioration stage—fluctuations stalemate stage—rapid improvement stage” pattern. However, the current regional surface water quality is still in a polluted status, and there is a gap between surface water quality status and the goal of building a well-off society. At present, China’s surface water pollution is prone to high numbers of incidents and the treatment of surface water pollution has entered a crucial stage. The potential for the continuous reduction of major pollutant discharges has become more challenging, and the marginal cost for pollution control has increased. It is very difficult to comprehensively solve the outstanding water environment problems. In addition to strengthening the existing work on surface water quality control, it is also necessary to strengthen the work of risk identification, early warning, and regulation implementation of the surface water environment. During the 14th year plan period (2021–2025), the overall planning on water resources, water ecology, and water quality will be implemented, and beautiful rivers and lakes will be created.
1. Introduction
Environmental monitoring is an important cornerstone of environmental protection and an important support for the construction of an ecological civilization and beautiful China [1,2,3]. Water quality monitoring is an important branch of environmental monitoring [2], which refers to the process of sampling and measuring various characteristic indexes of water to grasp the water environment quality status and the dynamic changes of pollutants in the water system, as well as to record the process [2]. Monitoring is the basis for water pollution control, environmental management, and scientific research. Through water quality monitoring, we can master the dynamic changes in the water environment and provide first-hand scientific data to support decisions regarding the prevention and control of water pollution and the formulation of environmental protection policies and environmental legislation [2,4].
Many scholars have conducted a great deal of water quality research in China [5,6,7], but most studies conducted to date have focused on one aspect [8,9] or on a single river basin or lake [10,11,12,13]. Studies focused on long-term sequences across the country are rare [12]. The 40th anniversary of China’s reform and opening up was in 2018; accordingly, it is important to summarize the history of water quality monitoring and water environmental protection during the past 40 years, as well as to analyze the trends in surface water quality during this time, which could provide support for precise pollution control and environmental management [11,12].
In this study, the history of surface water quality monitoring and surface water environmental protection is summarized, temporal and spatial variations in surface water quality are analyzed, and the current existing problems and pressure on surface water quality are proposed. The analyses conducted in this study are based on the Eco-Environmental Quality Report of China from 1980 to 2020 [14], the Report on the State of the Eco-environment in China from 1989 to 2020 [15], and other eco-environmental quality reports, related policy norms, and data from the government, combined with water quality monitoring data. The results presented herein will provide a foundation and scientific research support that will facilitate pollution prevention and control and enable the realization of an ecologically friendly civilization in China.
2. Materials and Methods
Due to the availability and integrity of historical monitoring data, our study area focuses on mainland China. All data used in this study were derived from environmental reports, statistical year books, government reports, relevant literature, or professional websites. Environmental reports included the China Eco-Environmental Quality Report (1980–2020) [14], Report on the State of Ecology and the Environment (1989–2020) [15], and the Annual Statistics Report on the Environment in China (1998–2015) [16]. Statistical yearbooks and government reports investigated included the China Statistical Yearbook [17], China Environmental Yearbook [18], government work reports, etc. Relevant literature and professional websites, such as academic literature from the China National Knowledge Internet (CNKI), Elsevier, and relevant data, policies, specifications, and systems published on governmental networks by the Ministry of Ecology and Environment (MEE), China National Environmental Monitoring Center (CNEMC), and the provincial-/city-level Ecology Environment Agency were also investigated.
The spatial distribution of surface water quality monitoring sites and surface water quality were evaluated by ArcGIS 10.0 with a license from the Institute of Geographic Sciences and Natural Resources Research, Chinese Academy of Sciences, and temporal patterns in water quality and pollutants were summarized by Origin 2018.
3. Results and Discussion
3.1. History of Surface Water Quality Monitoring
Surface water quality monitoring in China began in the 1980s. Although this was much later than developed countries, there has been considerable progress in the past 40 years. Currently, China’s water environment monitoring technology covers large rivers, lakes, and other areas such as reservoirs, etc. Moreover, the monitoring techniques and means have been improved year by year.
China’s water quality monitoring is conducted in a radiation mode. Specifically, the water quality monitoring center is the core, and the monitoring points are used as nodes to form the national surface water quality monitoring network, forming an integrated monitoring network covering the national-, provincial-, municipal-, and county-level surface water quality monitoring, and can meet the needs of water quality monitoring in different areas and different regions. At the same time, a combination of fixed-point sampling and mobile sampling is adopted to ensure the real-time accuracy of monitoring data.
3.1.1. Monitoring Scope
In 1988, the former National Environmental Protection Agency (NEPA) first established a national surface water quality monitoring network consisting of 353 sections. In 1993, the NEPA re-examined and certified the monitoring sections in the national control monitoring network and confirmed that the national surface water quality monitoring network consisted of 313 national control sections [14,15].
In 2003, the NEPA further adjusted the national environmental monitoring network and monitoring sections and identified the national surface water quality monitoring network, which includes the Yangtze River, Yellow River, Haihe River, Liaohe River, Songhua River, Pearl River, and Huaihe River, the “Three Lakes” (Taihu Lake, Dianchi Lake, and Chaohu Lake), and the three regional rivers (rivers in Zhejiang and Fujian Province, rivers in northwestern China, and rivers in southwestern China). Overall, the monitoring network has 759 monitoring sections (604 rivers and 155 lakes) covering 320 rivers and 28 lakes [14,15].
In 2012, the NEPA released a new national environmental monitoring basin network consisting of 972 monitoring sections covering 420 rivers and 62 lakes. Water monitoring sections were set in the main stream of China’s main water systems, the primary and secondary tributaries with an annual runoff of more than 500 million cubic meters, national border rivers and provincial rivers with an annual runoff of more than 300 million cubic meters, and large water conservancy facilities [14,15].
In July of 2015, the State Council issued the “Eco-Environmental Monitoring Network Construction Plan,” which clearly defined the national surface water monitoring network during the “13th Five-Year Plan”. The number of national control sections was increased from 972 in the “12th Five-Year Plan” to 1589 in 2015, including 1246 sections in 1366 rivers and 343 sections in 139 lakes. These sections (Figure 1) include 1940 assessment and ranking sections, 195 control sections for evaluation in the estuaries (of which, 85 are evaluation, assessment, and ranking sections), and 717 sections for scientific research. The “13th Five-Year” National Surface Water Quality Monitoring Network covers both the main rivers of the country and important primary and secondary tributaries, as well as the third and fourth tributaries of the key areas, key lakes/reservoirs, etc. Therefore, it has good regional spatial representation and can comprehensively, accurately, and objectively reflect the water quality and temporal–spatial distribution characteristics of pollutants in the water system or region [14,15].
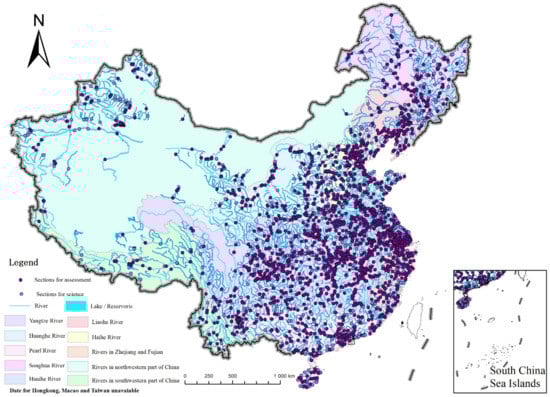
Figure 1.
China national surface water quality monitoring network in 2020.
In summary, China’s national surface water quality monitoring is an organic whole based on monitoring of surface water quality, adherence to water and land planning, land and sea planning, river and lake planning, upper and lower planning, urban and rural planning, and comprehensive monitoring of the national aquatic environment ecosystem.
3.1.2. Monitoring Indicators
The monitoring indicators during the past 40 years were listed in Appendix A. Before 2011, there were 11 monthly monitoring indicators pertaining to water quality in rivers (water temperature, pH, conductivity, dissolved oxygen, permanganate index, five-day biochemical oxygen demand, ammonia nitrogen, petroleum, volatile phenols, mercury, and lead). When monitoring the water quality in lakes and reservoirs, total phosphorus, total nitrogen, chlorophyll a, transparency, and water level were also included [14,15].
After the Measures for the Evaluation of Surface Water Quality was issued in 2011, the monthly monitoring was conducted in accordance with the 24 indicators, as shown in the Surface Water Quality Standards (GB3838-2002) [14,15] (Appendix B).
3.1.3. Monitoring Frequency
The monitoring frequency of surface water quality has increased obviously [14,15]. Before 2003, the monitoring frequency of surface water quality was generally low (about six times per year), and it was monitored according to the water periods, including dryness, flatness, and abundance.
Monthly monitoring has been conducted since the establishment of the monthly reporting mechanism based on the national water quality monitoring system in 2003. Monitoring is conducted for the first 10 days of the month.
Since October 2017, the sampling and laboratory analysis separation mode has been fully implemented, the monitoring frequency has been increased, and the monitoring work now is being conducted quarterly, monthly, weekly, daily, and, even, one time per four hours.
3.1.4. Monitoring Method
Sampling for surface water quality monitoring is mainly conducted manually. Since the beginning of the 21st Century, the state has built 150 automatic surface water quality monitoring stations in the provincial boundary sections of major rivers and important border rivers to provide early warnings regarding water quality. From July 1st 2009, real-time water quality data from national water quality automatic monitoring stations have been released to the public and published online [14,15].
Since October 2017, the 1940 national surface water assessment sections have fully implemented the sampling and laboratory analysis separation mode. By the end of July 2018, 2050 automatic surface water quality monitoring stations were built. Future water quality monitoring will be based on automatic monitoring supplemented by manual monitoring, leading to comprehensive realization of sampling and laboratory analysis separation, automatic monitoring, and data sharing [14,15].
3.1.5. Surface Water Quality Standard
Over the past 40 years, China’s surface water environmental quality standards have undergone four major changes [19]. In 1983, the Environmental Quality Standard for Surface Water (GB 3838-83) was promulgated and implemented for the first time. In 1988, the Environmental Quality Standard for Surface Water was revised to the Environmental Quality Standard for Surface Water (GB 3838-88). In 1999, this was revised to the Environmental Quality Standard for Surface Water (GHZB 1-1999) and, in 2002 to the Environmental Quality Standard for Surface Water (GB 3838-2002) [14,15].
3.2. Spatial Temporal Trends in Surface Water Quality
3.2.1. General Temporal Change Trends
Figure 2 showed the general temporal change trends of surface water quality. In the past four decades, the national surface water quality has shown a trend of fluctuating changes–rapid deterioration–volatility–rapid improvement.
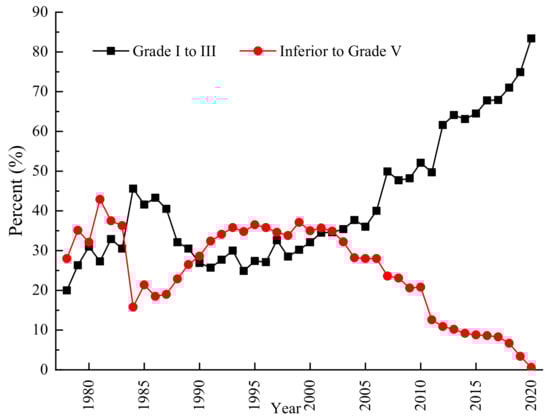
Figure 2.
Annual ratio of water quality in China during 1978–2020.
The period of fluctuating changes was from 1978 to 1983. During this period, the annual ratios of grade I–III sections (sections with water quality between grade I and grade III) ranged from 20.0% to 30.5% and the annual proportions of inferior grade V sections (sections in which water quality failed to meet grade V) were from 28.0% to 36.3%. In this period, the overall situation of China’s surface water quality transitioned from basically clean to partially deteriorating.
The stage of rapid deterioration was from 1984 to 1990. During this time, the annual ratio of grade I–III sections decreased by 18.7% from 45.6% in 1984 to 26.9% in 1990, while the proportion of inferior grade V sections increased by 12.8%, from 15.8% in 1984 to 28.6% in 1990. This stage corresponded to the beginning of reform and opening up, accompanied with fast economic and social development. The eastern part of China, including the Yangtze River Delta and the Pearl River Delta region, had begun to undergo rapid development, foreign enterprises gradually moved in, and local enterprises developed everywhere. The environmental effects caused by the rapid development of industry were gradually emerging, especially in the 7th Five-Year Period (1986–1990), and pressure on the surface water quality in China began to increase. In this period, although the status and role of environmental protection in social and economic development were clarified, the relationship between economic construction and environmental protection had not been rationalized. As a result, the surface water quality generally evolved from partial deterioration to general deterioration.
The phase of volatility was from 1991 to 2001. During this period, the annual ratio of sections that met the water quality standard (water quality in grade I to grade III, grades I–III for short) was from 25.7% to 34.5%, and the proportion of inferior grade V sections was from 32.4% to 35.7%.
The rapid improvement period was from 2002 to 2020, during which time, the annual ratio of grade I–III sections increased by 48.8%, from 34.6% in 2002 to 83.4% in 2020, while the proportion of inferior grade V sections decreased by 34.3% from 34.9% in 2002 to 0.6% in 2020. During the “10th Five-Year Plan” period, water pollution in the country was initially curbed and environmental quality improved in some areas. These improvements were mainly attributable to the initial recognition of the relationship between economic development and the implementation of water environmental protection, strict industrial structure adjustment policies, urban sewage centralized treatment, total control, and key river basin water pollution prevention and control planning systems [20].
During the “11th Five-Year Plan” period, chemical oxygen demand and ammonia nitrogen were introduced as binding indicators in the environmental protection target, and the implementation of the environmental protection target responsibility system greatly improved the construction of pollution control facilities and promoted the improvement of the level of the conventional pollution indicators. During this period, the overall surface water quality of the national water environment was stable, and the water quality improved. The water quality of the main stream in the key river basin was obviously improved. The concentration of the main pollution indicators of the tributaries dropped drastically, and water pollution prevention and control work in the basin made remarkable achievement.
3.2.2. Trends for Major Pollution Indicators
Among the major pollution indicators, the concentrations of permanganate and ammonia nitrogen showed similar temporal patterns (Figure 3), first increasing, then decreasing.
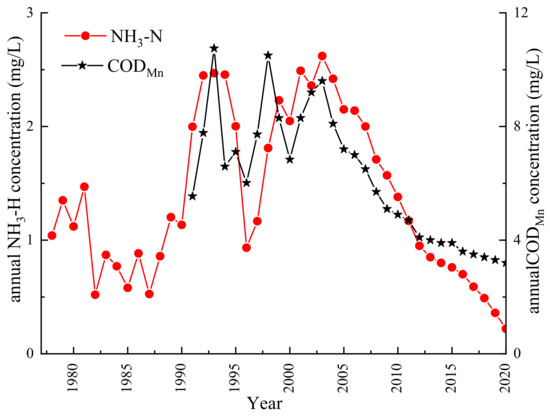
Figure 3.
The annual concentration of NH3-N and CODMn during 1978–2020.
Among these, the annual ammonia nitrogen (NH3-N for short) concentration showed an increasing trend from 1978–1981, followed by a sharp decrease in 1982, then fluctuations in 1983 and 1986 and an obviously increasing trend during 1987 and 1995, which increased from the lowest value of 0.53 mg/L to the highest value of 2.00 mg/L. From 1996 to 2002, the annual concentration fluctuated from 0.93 mg/L to 2.36 mg/L, while it improved from 2003 to 2020, by a decrease in annual concentration from 2.62 mg/L to 0.22 mg/L.
The annual permanganate index (CODMn for short) concentration fluctuated from 1991 to 2002, with annual levels ranging from 5.5 mg/L to 9.2 mg/L, while the concentration improved from 2003 to 2020 when annual concentrations decreased from 9.6 mg/L to 3.2 mg/L.
3.2.3. Spatial Temporal Changes in the Seven Major River Basins
In general, the water quality in the Yangtze River and Pearl River was good comparing with the rest of the basins. Haihe River had the worst water quality, and it was also the only water basin with grade V sections. The water quality rankings in 2020 were Yangtze River > Pearl River > Yellow River > Songhua River > Huaihe River > Liaohe River > Haihe River.
Figure 4 showed the changes of water quality in the major river basins during 2007–2020. During 2007 and 2020, the water quality in Yangtze River experienced an improvement–fluctuating changes–improvement pattern. The Yellow River, Pearl River. and Huaihe River have experienced improvement–deterioration–improvement changing patterns. The Songhua River, Haihe River and Liaohe River have showed fluctuating improvement. Since 2017, the water quality in the seven major river basins showed a rapid improvement, with an obvious increase for the ratio of grade I to III sections and a decreasing trend for the ratio of grade V sections.
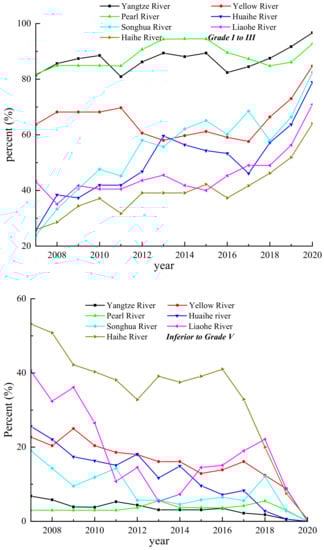
Figure 4.
Changes of water quality in the major river basins during 2007–2020.
3.3. Surface Water Pollution Prevention and Control in China
Analysis of the correlation between river environmental quality and pollutant emissions, national economic development level, and environmental pollution control investment revealed that the reduction of ammonia nitrogen and COD emissions [20] and the increase in GDP and environmental pollution control investment are the main reasons for the improvements that have occurred in surface water quality [21,22].
China’s surface water environmental protection work has been developed from scratch and expanded in scale [23]. During the past four decades, the intensity of surface water pollution control has increased, and the surface water ecological protection work has been strengthened, which has greatly improved the surface water environment in China [24].
Overall, in the past 40 years, China’s environmental protection has experienced four development stages consisting of the initial “three wastes” governance, steady development of pollution prevention, a total quality control stage, and now, a new stage of environmental protection with improvement of environmental quality as the primary goal [25]. Since the founding of the country till the end of the 1970s, during the initial stage of development, China’s surface water protection work has been in a disorderly status. The first national environmental protection work conference held in 1973 marked the beginning of water environment protection in China.
In the steady development stage from the 1980s to the early 21st Century, China’s economy developed rapidly, while its water environmental protection work had achieved remarkable progress. During the “9th Five-Year Plan” period, the “Huaihe River Basin Water Pollution Prevention and Control Plan” was approved and implemented, marking China’s entry into a stage of large-scale water pollution control. During this period, the country launched a comprehensive campaign targeting water pollution control of the Three Rivers and Three Lakes (Huaihe River, Haihe River, and Liaohe River and Taihu Lake, Dianchi Lake, and Chaohu Lake, respectively). Since then, organic matter pollution of surface water and the eutrophication of lakes have been effectively curbed, and the water environmental protection work has made significant progress. The total control led to a quality improvement from 2002 to 2014. In 2002, China issued the “Clean Production Promotion Law”, which officially marked the transition from end-of-pipe treatment to total process control for China’s water environment pollution control, and China’s river environmental protection work entered a new stage.
In the same year, the MEP promulgated a new “Environmental Quality Standard for Surface Water” (GB3838-2002), among which the water quality evaluation indicator increased from 75 to 109, which was more in line with the status quo of surface water environmental protection in China. Since the “11th Five-Year Plan”, target accountability for water quality control was introduced with more stringent and clear targets. The capacity of water quality control improved since then, and the water quality, in particular for the main stream in key river basins, improved significantly.
In the new stage of environmental protection with the improvement of environmental quality as the core (since 2015), the “13th Five-Year Plan” has entered a stage of double constraint on quality improvement and total control. This was marked by the 18th National Congress of the Communist Party of China (CPC). The ecological civilization’s construction is included in the overall layout of the “five in one” plan, and water quality has become an important part of improving people’s livelihood and building a well-off society. As a program of action for the prevention and control of water pollution in China, the “Water pollution prevention action plan” clarifies the quality improvement objectives of various water bodies in different periods, which was, by 2020, for the seven major river basins, the water quality with a good (grades I–III) ratio being above 70%, and by 2030, the ratio should reach 75%. The “13th Five-Year Plan for National Economic and Social Development Outline” also clarifies the dual-binding indicators for water quality improvement and total control, while the “13th Five-Year Plan for Ecological Environmental Protection” further proposes specific requirements for systematic treatment with quality improvement as the core.
The theory of harmonious coexistence between man and nature was introduced for development in China during the “13th Five-Year Plan”, and the Yangtze River economic belt development and high-quality development and ecological protection for the Yellow River Basin were introduced. For the Yangtze River, the eco-environment restoration was put in a stronger position compared to development, and for the Yellow River, a comprehensive management of the eco-environment system, including the environment quality of mountains, rivers, forests, fields, lakes, and grasslands, and the pollution sources was planned, to promote high-quality development.
4. Problems and Pressures
Although water quality in China has improved significantly and an environmental turning point has begun to appear, water quality in some areas is still not improving. As a result, there is still a gap between the quality of the water environment and the goal of building a well-off society [7,10,26,27].
4.1. Surface Water Is Still Polluted
In 2020, the national surface water quality was fairly good. The main pollution indicators were chemical oxygen demand (COD), total phosphorus (TP), and the permanganate index, and the over-standard rates were 9.4%, 7.5%, and 5.8%, respectively. The proportion of the grade I–III section was 83.4%, which indicates that surface water quality in 16.6% of the sections was worse than grade III, while the proportion of sections that were worse than grade V was 0.6%. The Liaohe River and Haihe River were slightly polluted [14,15].
4.2. Total Phosphorus Pollution Has Increased
In 2020, the rate of sections with TP exceeding the national surface water standard was 7.5%, more than that of CODMn, and became the second over-standard indicator affecting the national surface water quality. The TP concentration in 20 lakes and one reservoir exceeded the standard; the TP pollution in the lake was higher than in the reservoir [14,15].
4.3. High Pollutant Emission Intensity and Increasing Pollution from Residential Sources
China’s primary source of water pollution has changed from industrial pollution to domestic pollution, and there is now great pressure to reduce domestic sewage. With increased urbanization, the contribution of domestic pollution sources has become increasingly prominent, and it is now the main source of water pollution. As a result, pollution control of rural life at the township level needs to be strengthened. In 2015, the total discharge of wastewater was 73.53 billion tons in China, which was 2.7% greater than in 2014. However, industrial wastewater discharge was 19.95 billion tons, which was 2.8% lower than in the previous year, accounting for 27.1% of the total wastewater discharge. Domestic sewage discharge was 53.52 billion tons, which represented an increase of 4.9% over 2014 and accounted for 72.8% of the total wastewater discharge. Finally, the discharge of wastewater from centralized pollution control facilities was about 0.6 billion tons, accounting for 0.1% of the total wastewater discharge [14,15].
4.4. The Problem of Lake Eutrophication Is Obvious
In 2020, 76.8% of the 110 major lakes and reservoirs across the country met the grade I–III standard, while 15.2% and 2.7% met the grade IV and V standards, respectively, and 5.4% failed to meet the grade V standard. The main pollution indicators were TP, COD, and CODMn. Of the 110 lakes (reservoirs) being monitored for nutritional status, 10 were oligotrophic, 68 were mesotrophic, 26 were under slight eutrophication, six were under intermediate eutrophication, and one was under heavy eutrophication [14,15].
4.5. Heavy Metal Levels in Surface Water Have Exceeded the Standard
In 2019, there were 28 cases of heavy metals exceeding the standard in 23 surface water sections. The main indicators exceeding the standards were mercury, arsenic, and selenium. Among these, 12 cases exceeded the mercury limit, seven exceeded the arsenic limit, and three exceeded the selenium limit. From the perspective of the river basin, the over-standard sections were mainly distributed in the Yellow River, Haihe River, Yangtze River, and the Pearl River Basin, with 8 cases, 6 cases, 5 cases, and 4 case of heavy metals exceeding the standard, respectively. At the provincial level, the sections exceeding the standard are mainly distributed in Hebei, Inner Mongolia, Hubei, Hunan, Shanxi, and other areas.
5. Conclusions
In the past 40 years, China’s environmental monitoring has made great progress. The monitoring of water quality is developing towards the continuous improvement of monitoring targets, the frequency of monitoring is becoming more reasonable, the monitoring indicators are being comprehensively covered, the technical methods are becoming scientific, and the quality standards are becoming increasingly stringent.
During this same period, the national surface water quality has shown a trend of fluctuating changes–rapid deterioration–volatility–rapid improvement. From 2002 to 2020, the water quality in the main watersheds was generally good, showing a gradual improvement trend, and the pollution was reduced. The main change has been that the proportion of water quality of grade I–III increased annually, while the proportion of inferior water quality of grade V has decreased. During 2002–2020, the proportion of grade I–III water sections increased from 34.6% to 83.4%, while the proportion of inferior grade V sections decreased from 34.9% to 0.6%. Furthermore, the water quality in the main river basins has improved.
The increase in GDP and environmental pollution control investment are the main reasons China’s surface water environmental protection system has been developed from scratch and expanded, the intensity of surface water pollution control has been strengthened, and the surface water ecological protection work has increased, which has greatly improved the surface water environment in China.
However, with the current rapid development of the economy and high consumption of materials and energy, the number of surface water pollution incidents in China has been high, and the treatment of surface water environmental pollution has entered a crucial stage. Moreover, the potential for the continuous reduction of total pollutant discharges has been narrowing, while the marginal costs of governance are continually increasing. Accordingly, it has become very difficult to achieve comprehensive improvement of the water environment quality by focusing on solving the outstanding water environment problems in a short period of time. Therefore, it is necessary to improve risk identification, early warning systems, and regulation of surface water environments.
In the year 2022, the Chinese government released the “14th five-year plan for ecological environment protection”, which enhances the regulations on water quality control. In this plan, specific measures are outlined for water quality monitoring, water ecology monitoring, and water pollution source monitoring. For water quality monitoring, a national water monitoring network will cover key basins and prefecture-level cities, supported mainly by automatic monitoring. The local water monitoring network should cover the major water bodies, major cities and towns, large industrial clusters, planting and breeding areas, and key boundaries. For water ecology monitoring, a water ecology monitoring framework should be established and implemented in the Yangtze River Basin. For water pollution source monitoring, the “water cross section-water quality-pollution source” monitoring traceability technology and three-dimensional monitoring network for surface sources should be established and forecast and warning capacity on water environment should be achieved.
Author Contributions
F.Z.: Conceptualization, Software, Formal analysis, Writing—Original Draft, Review & Editing, Supervision, L.L.: Conceptualization, Software, Formal analysis, Writing—Original Draft, W.L.: Resources, Data Curation, D.F.: Resources, Data Curation, Z.L.: Data Curation, Formal analysis, M.L.: Resources, Data Curation, Visualization, G.M.: Resources, Data Curation, Y.W.: Resources, Supervision, L.W.: Conceptualization, Writing—Review & Editing, Supervision, Funding acquisition, L.H.: Conceptualization, Writing—Review & Editing, Supervision. All authors have read and agreed to the published version of the manuscript.
Funding
The present study was funded by the Science and Technology Project of Beautiful China Ecological Civilization Construction (No. XDA23100400) and the National Natural Science Foundation of China (No. U2243206 and No. 42007414).
Data Availability Statement
All sources of data are cited throughout the paper.
Acknowledgments
The authors wish to thank all the staff members at the China National Environmental Monitoring Center for their strong support of this study.
Conflicts of Interest
All authors declare that they have no conflicts of interest to disclose in the context of this study.
Appendix A. Monitoring Indicators during the Past 40 Years
| Year | Since 1983 | Since 1988 | Since 1999 | Since 2002 | |
| Items | GB3838-83 | GB3838-88 | GHZB 1-1999 | GB3838-2002 | |
| 1 | pH | pH | pH | pH | |
| 2 | DO | DO | DO | DO | |
| 3 | BOD5 | BOD5 | BOD5 | BOD5 | |
| 4 | COD | CODMn | CODMn | CODMn | |
| 5 | NH3-N | / | NH3-N | NH3-N | |
| 6 | NO2-N | Soluble iron | Soluble iron | COD | |
| 7 | Volatile phenols | Volatile phenols | Volatile phenols | Volatile phenols | |
| 8 | CN- | / | / | / | |
| 9 | As | As | As | As | |
| 10 | Hg | Hg | Hg | Hg | |
| 11 | Cr6+ | Cr | Cr | Cr | |
| 12 | Pb | Pb | Pb | Pb | |
| 13 | Cd | Cd | Cd | Cd | |
| 14 | Cu | Cu | Cu | Cu | |
| 15 | Petroleum | Petroleum | Petroleum | Petroleum | |
| 16 | Fecal coliform | Fecal coliform | Fecal coliform | Fecal coliform | |
| 17 | TP | TP | TP | ||
| 18 | Zn | Zn | Zn | ||
| 19 | nitrite | nitrite | TN | ||
| 20 | Anionic surfactant | Anionic surfactant | Anionic surfactant | ||
| 21 | Cyanide | Cyanide | Cyanide | ||
| 22 | Se | Se | Se | ||
| 23 | Sulfide | Sulfide | Sulfide | ||
| 24 | temperature | temperature | temperature | ||
| 25 | CODCr | CODCr | / | ||
| 26 | Kjeldahl nitrogen | Kjeldahl nitrogen | / | ||
| 27 | Mn | Mn | / | ||
| 28 | Chloride | Chloride | / | ||
| 29 | un-ionized ammonia | un-ionized ammonia | / | ||
| 30 | Total fluoride | F− | |||
| 31 | Benzo (a) pyrene | total cyanide | / | ||
Appendix B. Monitoring Indicators for GB3838-2002
| Indicator | Grade I | Grade II | Grade III | Grade IV | Grade V |
| temperature | The artificial change in water temperature shall be limited to a weekly average maximum temperature rise ≤ 1 and a weekly average maximum temperature drop ≤ 2 | ||||
| pH | 6~9 | ||||
| DO≥ | 7.5 | 6 | 5 | 3 | 2 |
| CODMn (mg/L)≤ | 2 | 4 | 6 | 10 | 15 |
| COD (mg/L)≤ | 15 | 15 | 20 | 30 | 40 |
| BOD5 (mg/L)≤ | 3 | 3 | 4 | 6 | 10 |
| NH3-N (mg/L)≤ | 0.15 | 0.5 | 1 | 1.5 | 2 |
| TP (mg/L)≤ | 0.02 | 0.1 | 0.2 | 0.3 | 0.4 |
| TN (mg/L)≤ | 0.2 | 0.5 | 1 | 1.5 | 2 |
| Cu (mg/L)≤ | 0.01 | 1 | 1 | 1 | 1 |
| Zn (mg/L)≤ | 0.05 | 1 | 1 | 2 | 2 |
| F− (mg/L)≤ | 1 | 1 | 1 | 1.5 | 1.5 |
| Se (mg/L)≤ | 0.01 | 0.01 | 0.01 | 0.02 | 0.02 |
| As (mg/L)≤ | 0.05 | 0.05 | 0.05 | 0.1 | 0.1 |
| Hg (mg/L)≤ | 0.00005 | 0.00005 | 0.0001 | 0.001 | 0.001 |
| Cd (mg/L)≤ | 0.001 | 0.005 | 0.005 | 0.005 | 0.01 |
| Cr (mg/L)≤ | 0.01 | 0.05 | 0.05 | 0.05 | 0.1 |
| Pb (mg/L)≤ | 0.01 | 0.05 | 0.05 | 0.05 | 0.1 |
| Cyanide (mg/L)≤ | 0.005 | 0.05 | 0.2 | 0.2 | 0.2 |
| Volatile phenol (mg/L)≤ | 0.002 | 0.002 | 0.005 | 0.01 | 0.1 |
| Petroleum (mg/L)≤ | 0.05 | 0.05 | 0.05 | 0.5 | 1 |
| Anionic surfactant (mg/L)≤ | 0.2 | 0.2 | 0.2 | 0.3 | 0.3 |
| Sulfide (mg/L)≤ | 0.05 | 0.1 | 0.2 | 0.5 | 1 |
| Fecal coliform (number/L)≤ | 200 | 2000 | 10,000 | 20,000 | 40,000 |
References
- Bai, Y.; Niu, H.; Wen, X. The strategy study on the development and innovations of Chinese environmental monitoring: A comparison study. Procedia Environ. Sci. 2012, 13, 2458–2463. [Google Scholar] [CrossRef][Green Version]
- Li, D.; Liu, S. Chapter 1—Sensors in Water Quality Monitoring, Chapter 3—System and Platform for Water Quality Monitoring. In Water Quality Monitoring and Management; Li, D., Liu, S., Eds.; Academic Press: Beijing, China, 2019; pp. 1–112. [Google Scholar]
- Sun, A.Y.; Zhong, Z.; Jeong, H.; Yang, Q. Building complex event processing capability for intelligent environmental monitoring. Environ. Modell. Softw. 2019, 116, 1–6. [Google Scholar] [CrossRef]
- Wang, X.; Berman, E.M.; Chen, D.-Y.; Niu, X. Strategies to improve environmental networks for pollution control: Evidence from eco-compensation programs in China. J. Environ. Manag. 2019, 234, 387–395. [Google Scholar] [CrossRef]
- Zhang, C.; Tian, D.; Yi, X.; Zhang, T.; Ruan, J.; Wu, R.; Chen, C.; Huang, M.; Ying, G. Occurrence, distribution and seasonal variation of five neonicotinoid insecticides in surface water and sediment of the Pearl Rivers, South China. Chemosphere 2019, 217, 437–446. [Google Scholar] [CrossRef]
- Zhang, J.; Li, S.; Dong, R.; Jiang, C.; Ni, M. Influences of land use metrics at multi-spatial scales on seasonal water quality: A case study of river systems in the Three Gorges Reservoir Area, China. J. Clean. Prod. 2019, 206, 76–85. [Google Scholar] [CrossRef]
- Zhu, Y.; Price, O.R.; Kilgallon, J.; Qi, Y.; Tao, S.; Jones, K.C.; Sweetman, A.J. Drivers of contaminant levels in surface water of China during 2000–2030: Relative importance for illustrative home and personal care product chemicals. Environ. Int. 2018, 115, 161–169. [Google Scholar] [CrossRef]
- Tian, Y.; Jiang, Y.; Liu, Q.; Dong, M.; Xu, D.; Liu, Y.; Xu, X. Using a water quality index to assess the water quality of the upper and middle streams of the Luanhe River, northern China. Sci. Total Environ. 2019, 667, 142–151. [Google Scholar] [CrossRef]
- Wang, J.; Fu, Z.; Qiao, H.; Liu, F. Assessment of eutrophication and water quality in the estuarine area of Lake Wuli, Lake Taihu, China. Sci. Total Environ. 2019, 650, 1392–1402. [Google Scholar] [CrossRef]
- Martinsen, G.; Liu, S.; Mo, X.; Bauer-Gottwein, P. Joint optimization of water allocation and water quality management in Haihe River basin. Sci. Total Environ. 2019, 654, 72–84. [Google Scholar] [CrossRef]
- Nukapothuala, S.; Chen, C.; Wu, J. Long-term distribution patterns of remotely sensed water quality variables in Pearl River Delta, China. Estuar. Coast. Shelf Sci. 2019, 221, 90–103. [Google Scholar] [CrossRef]
- Wang, J.-H.; Yang, C.; He, L.-Q.-S.; Dao, G.-H.; Du, J.-S.; Han, Y.-P.; Wu, G.-X.; Wu, Q.-Y.; Hu, H.-Y. Meteorological factors and water quality changes of Plateau Lake Dianchi in China (1990–2015) and their joint influences on cyanobacterial blooms. Sci. Total Environ. 2019, 665, 406–418. [Google Scholar] [CrossRef]
- Xiao, J.; Wang, L.; Deng, L.; Jin, Z. Characteristics, sources, water quality and health risk assessment of trace elements in river water and well water in the Chinese Loess Plateau. Sci. Total Environ. 2019, 650, 2004–2012. [Google Scholar] [CrossRef]
- MEE. Annual Report on Environmental Quality in China (1981 to 2019); China Environment Publishing Group: Beijing, China, 2020.
- MEE. Report on the State of the Ecology and Environment in China 1986–2020; MEE: Beijing, China, 2021. Available online: http://english.mee.gov.cn/Resources/Reports/soe/index.shtml (accessed on 20 April 2022).
- MEE. Annual Statistics Report on Environment in China; China Environment Publishing Group: Beijing, China, 2016.
- NBSPRC. China Statistical Yearbook 1982–2020; China Statistical Press: Beijing, China, 2021.
- Editorial board of China Environment Yearbook. China Environmental Yearbook 1989–2020; China Forum of Environmental Journalists: Beijing, China, 2021.
- Su, J.; Ji, D.; Lin, M.; Chen, Y.; Sun, Y.; Huo, S.; Zhu, J.; Xi, B. Developing surface water quality standards in China. Resour. Conserv. Recycl. 2017, 117, 294–303. [Google Scholar] [CrossRef]
- Wang, C.; Wu, J.; Zhang, B. Environmental regulation, emissions and productivity: Evidence from Chinese COD-emitting manufacturers. J. Environ. Econ. Manag. 2018, 92, 54–73. [Google Scholar] [CrossRef]
- Chen, H.; Hao, Y.; Li, J.; Song, X. The impact of environmental regulation, shadow economy, and corruption on environmental quality: Theory and empirical evidence from China. J. Clean. Prod. 2018, 195, 200–214. [Google Scholar] [CrossRef]
- Zhou, Y.; Ma, J.; Zhang, Y.; Qin, B.; Jeppesen, E.; Shi, K.; Brookes, J.D.; Spencer, R.G.M.; Zhu, G.; Gao, G. Improving water quality in China: Environmental investment pays dividends. Water Res. 2017, 118, 152–159. [Google Scholar] [CrossRef]
- Guttman, D.; Young, O.; Jing, Y.; Bramble, B.; Bu, M.; Chen, C.; Furst, K.; Hu, T.; Li, Y.; Logan, K.; et al. Environmental governance in China: Interactions between the state and “nonstate actors”. J. Environ. Manag. 2018, 220, 126–135. [Google Scholar] [CrossRef]
- Zhang, B.; Cao, C.; Hughes, R.M.; Davis, W.S. China’s new environmental protection regulatory regime: Effects and gaps. J. Environ. Manag. 2017, 187, 464–469. [Google Scholar] [CrossRef]
- Wang, D.Q.; Changbo, M.L.; Wang, J. Research in Reconstructing the System of National Water Quality Management in China. Environ. Prot. 2017, 8, 49–56. (In Chinese) [Google Scholar]
- Cheng, X.; Chen, L.; Sun, R.; Jing, Y. Identification of regional water resource stress based on water quantity and quality: A case study in a rapid urbanization region of China. J. Clean. Prod. 2019, 209, 216–223. [Google Scholar] [CrossRef]
- Li, K.; Fang, L.; He, L. How population and energy price affect China’s environmental pollution? Energy Policy 2019, 129, 386–396. [Google Scholar] [CrossRef]
Publisher’s Note: MDPI stays neutral with regard to jurisdictional claims in published maps and institutional affiliations. |
© 2022 by the authors. Licensee MDPI, Basel, Switzerland. This article is an open access article distributed under the terms and conditions of the Creative Commons Attribution (CC BY) license (https://creativecommons.org/licenses/by/4.0/).