
Environmental and Economic Analysis on Sailing from Taiwan through Arctic Passages


Abstract
:1. Introduction
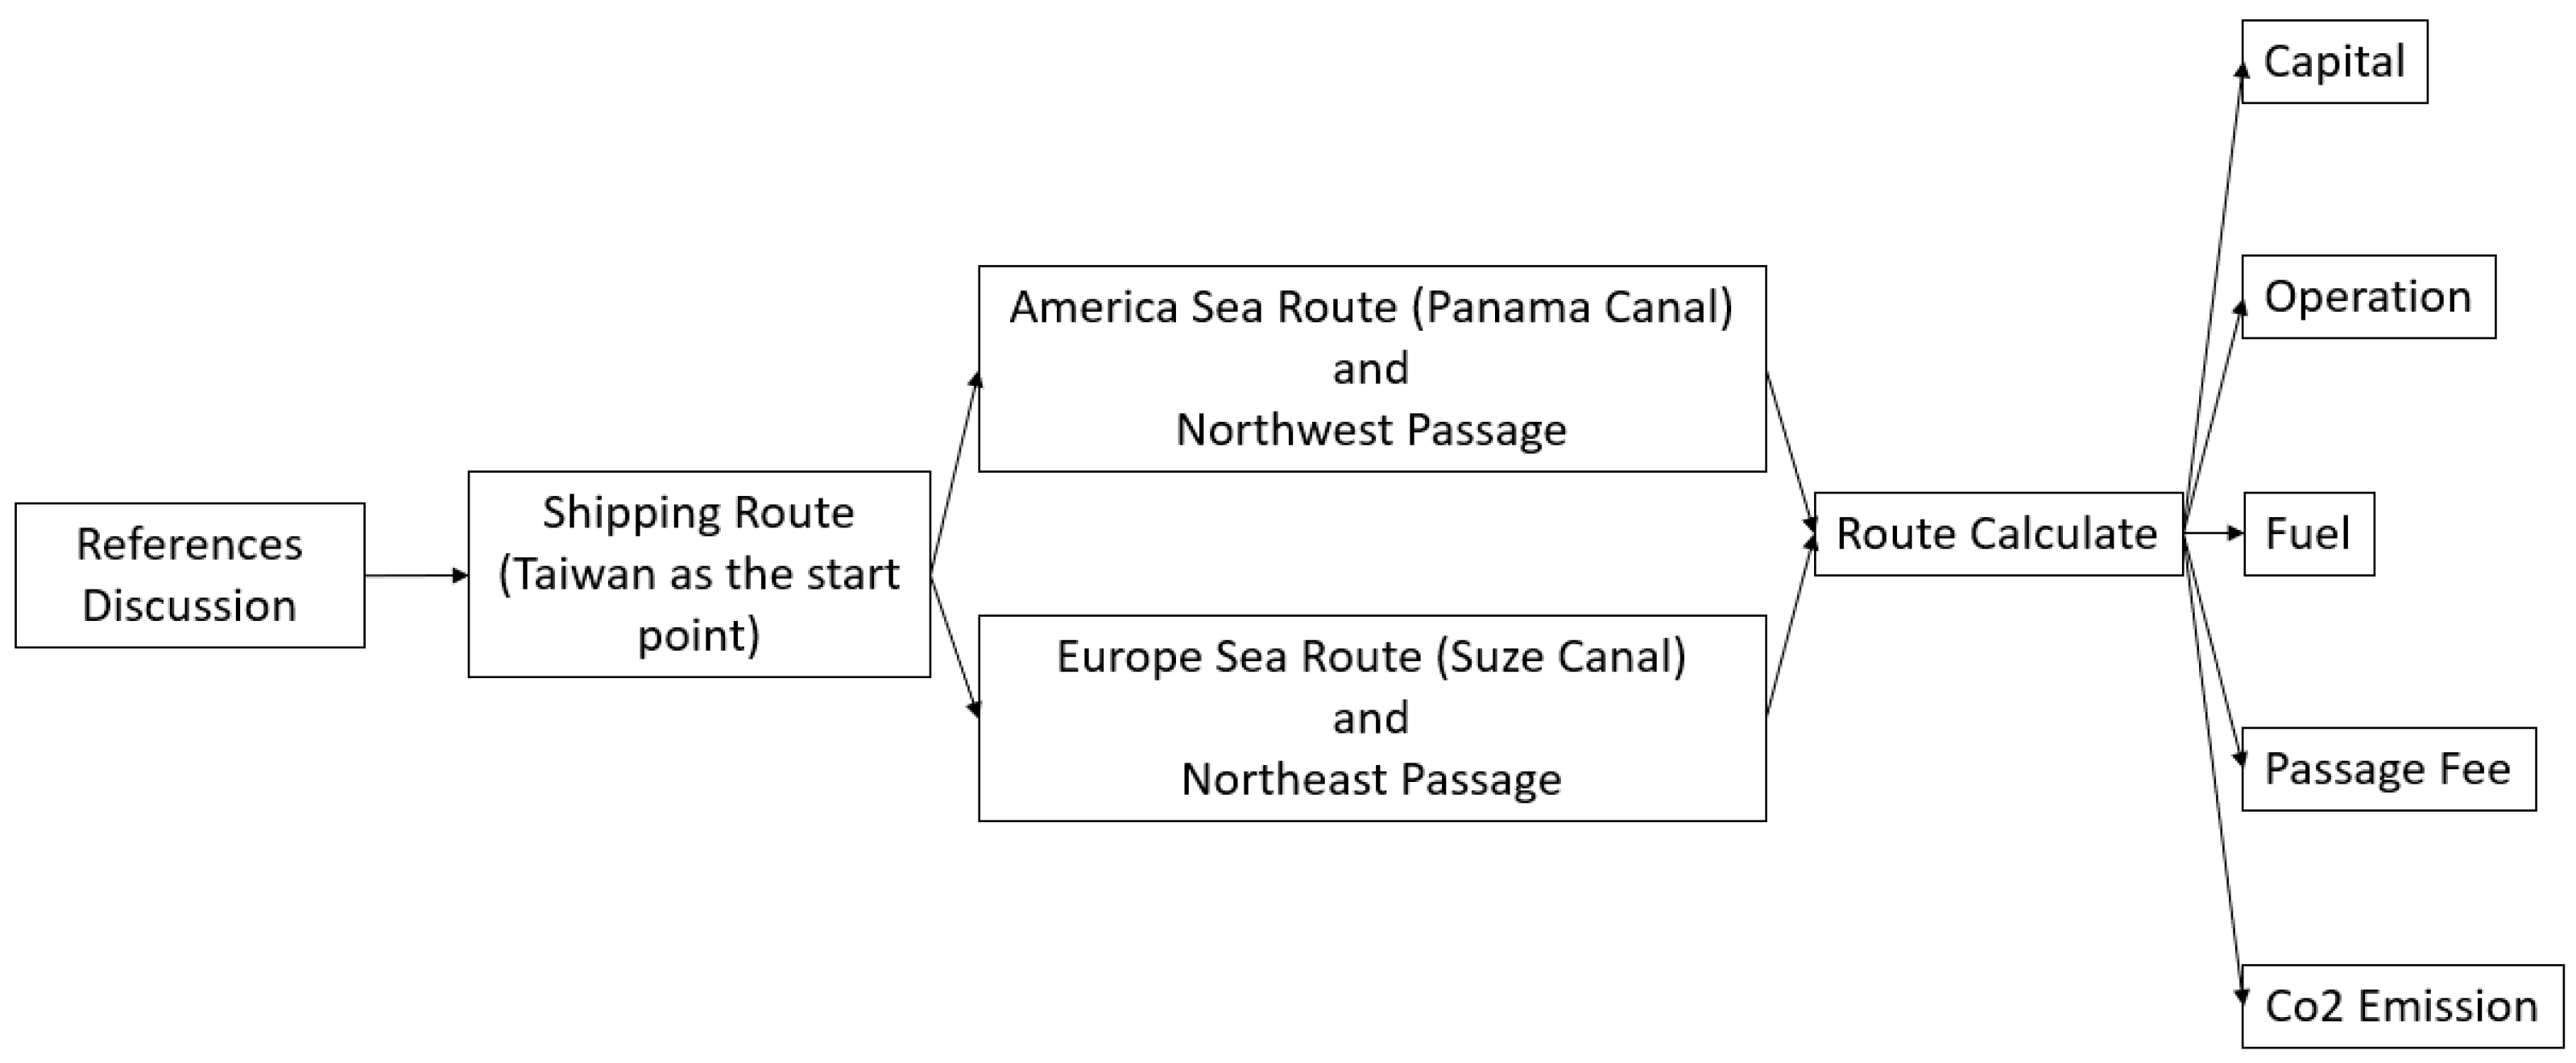
2. Research Method
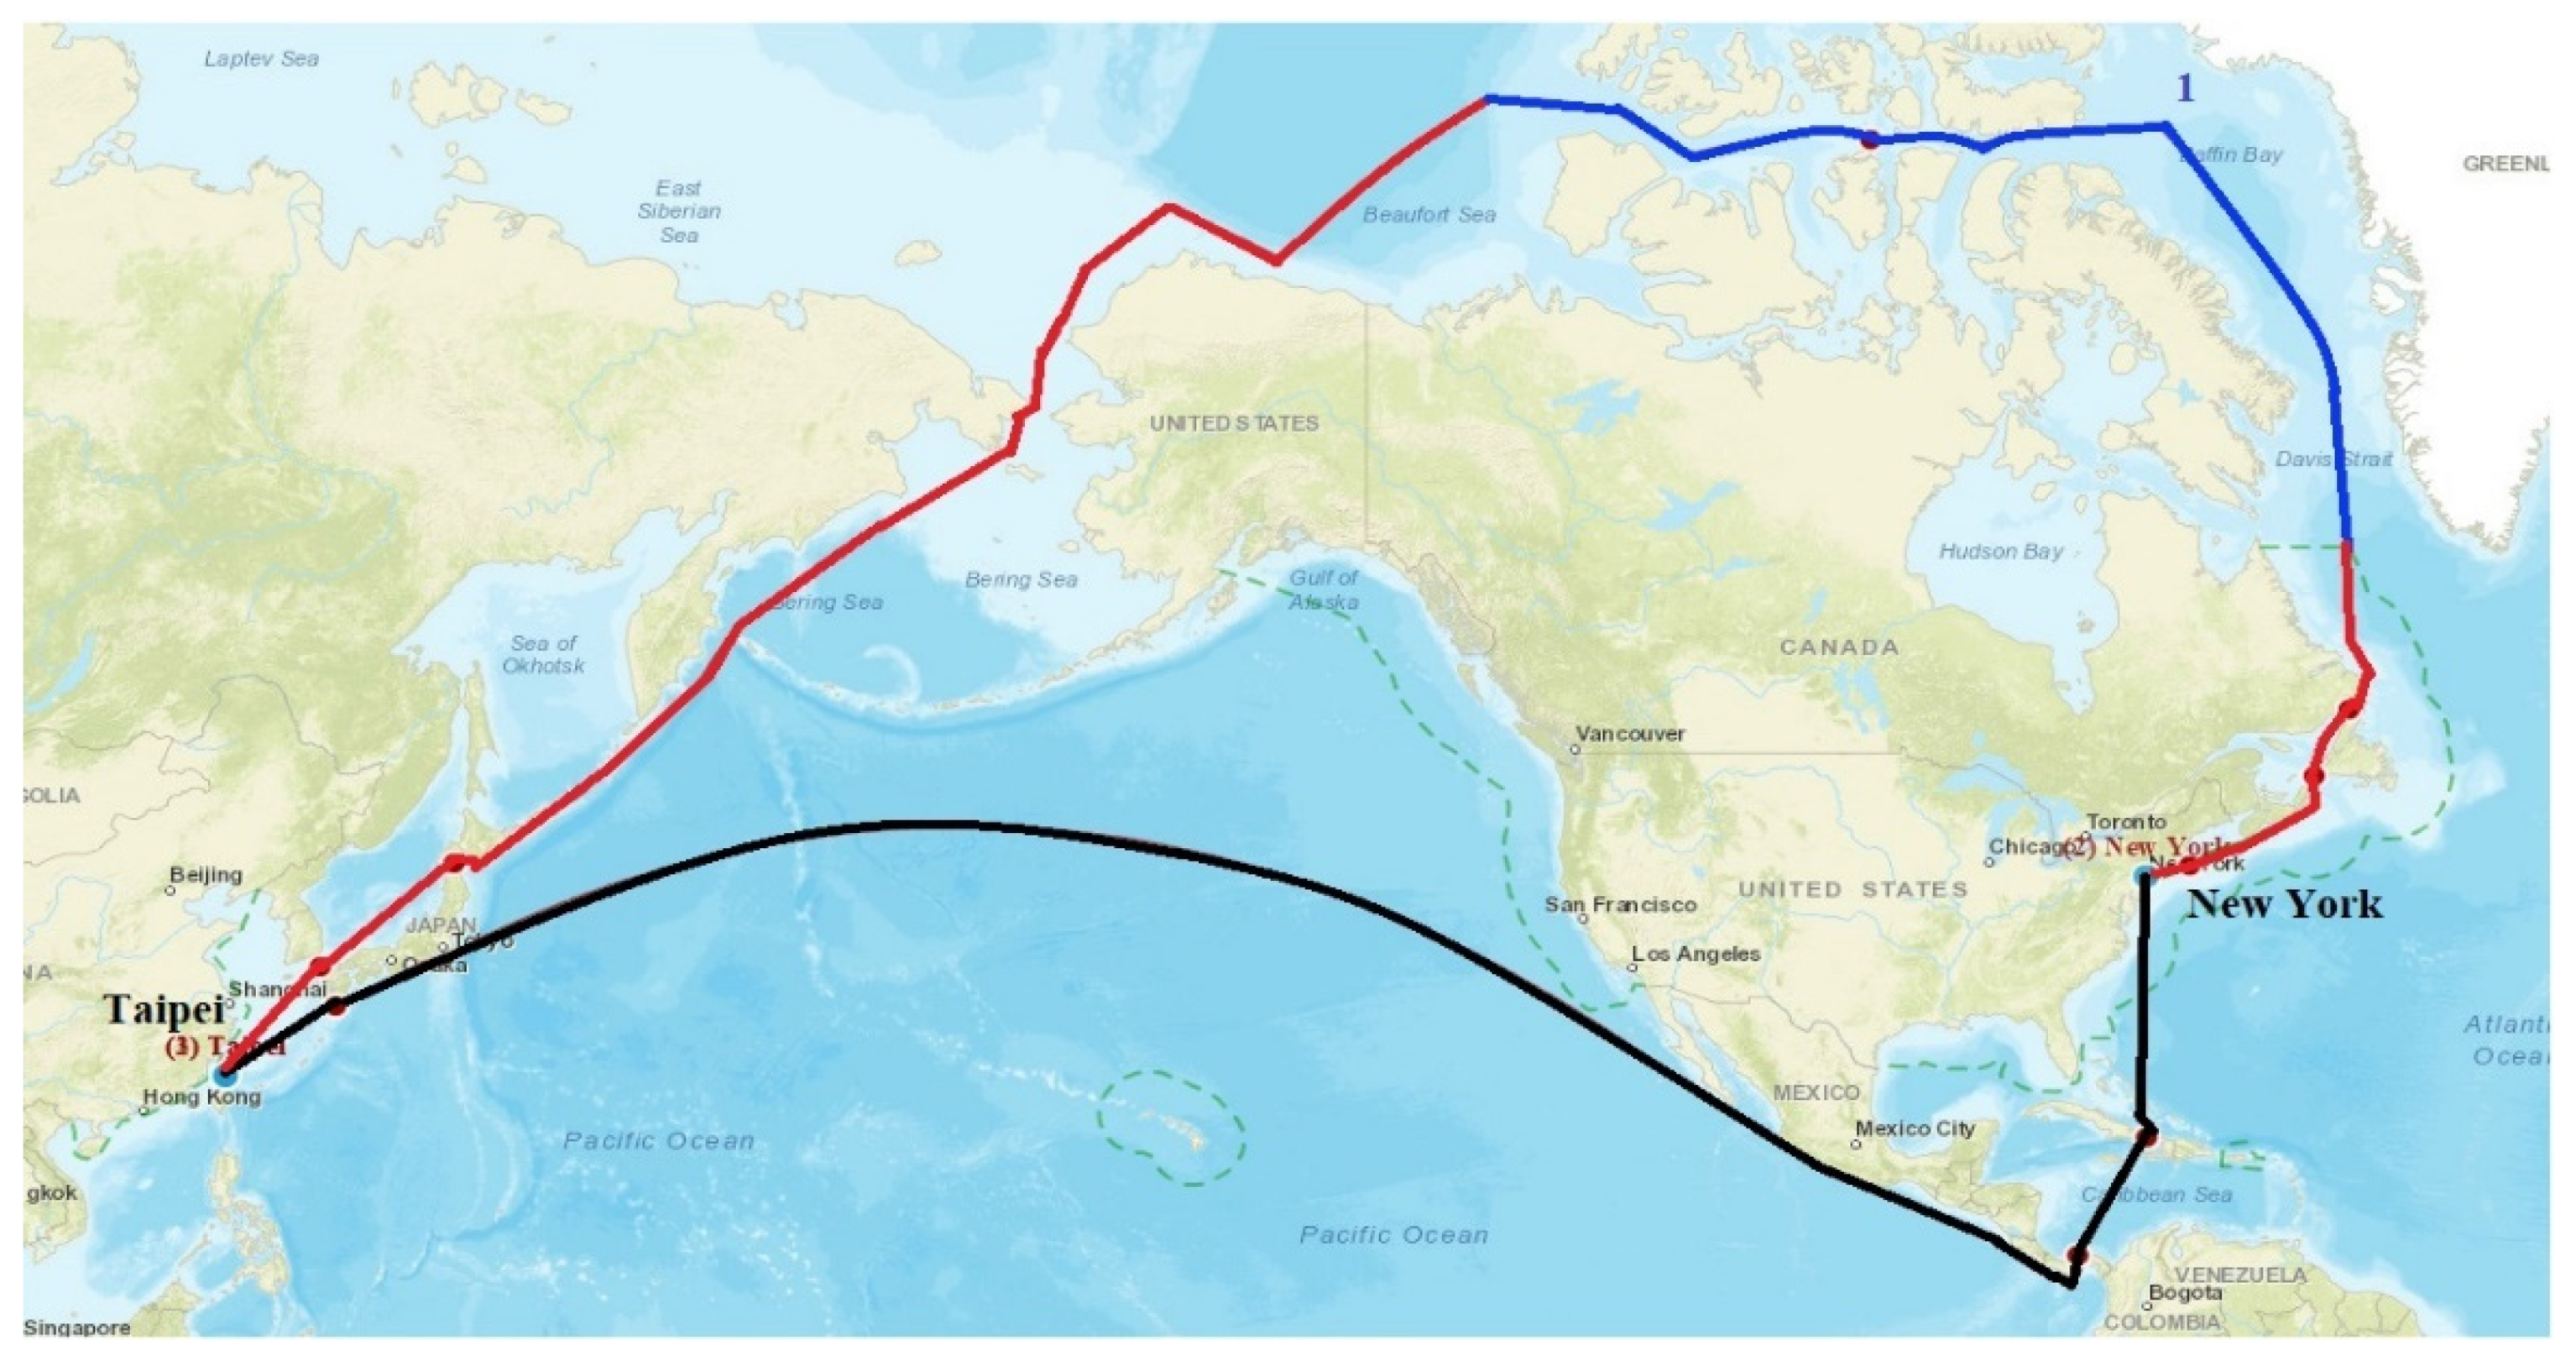
2.1. Ship Characteristics and Route Distance
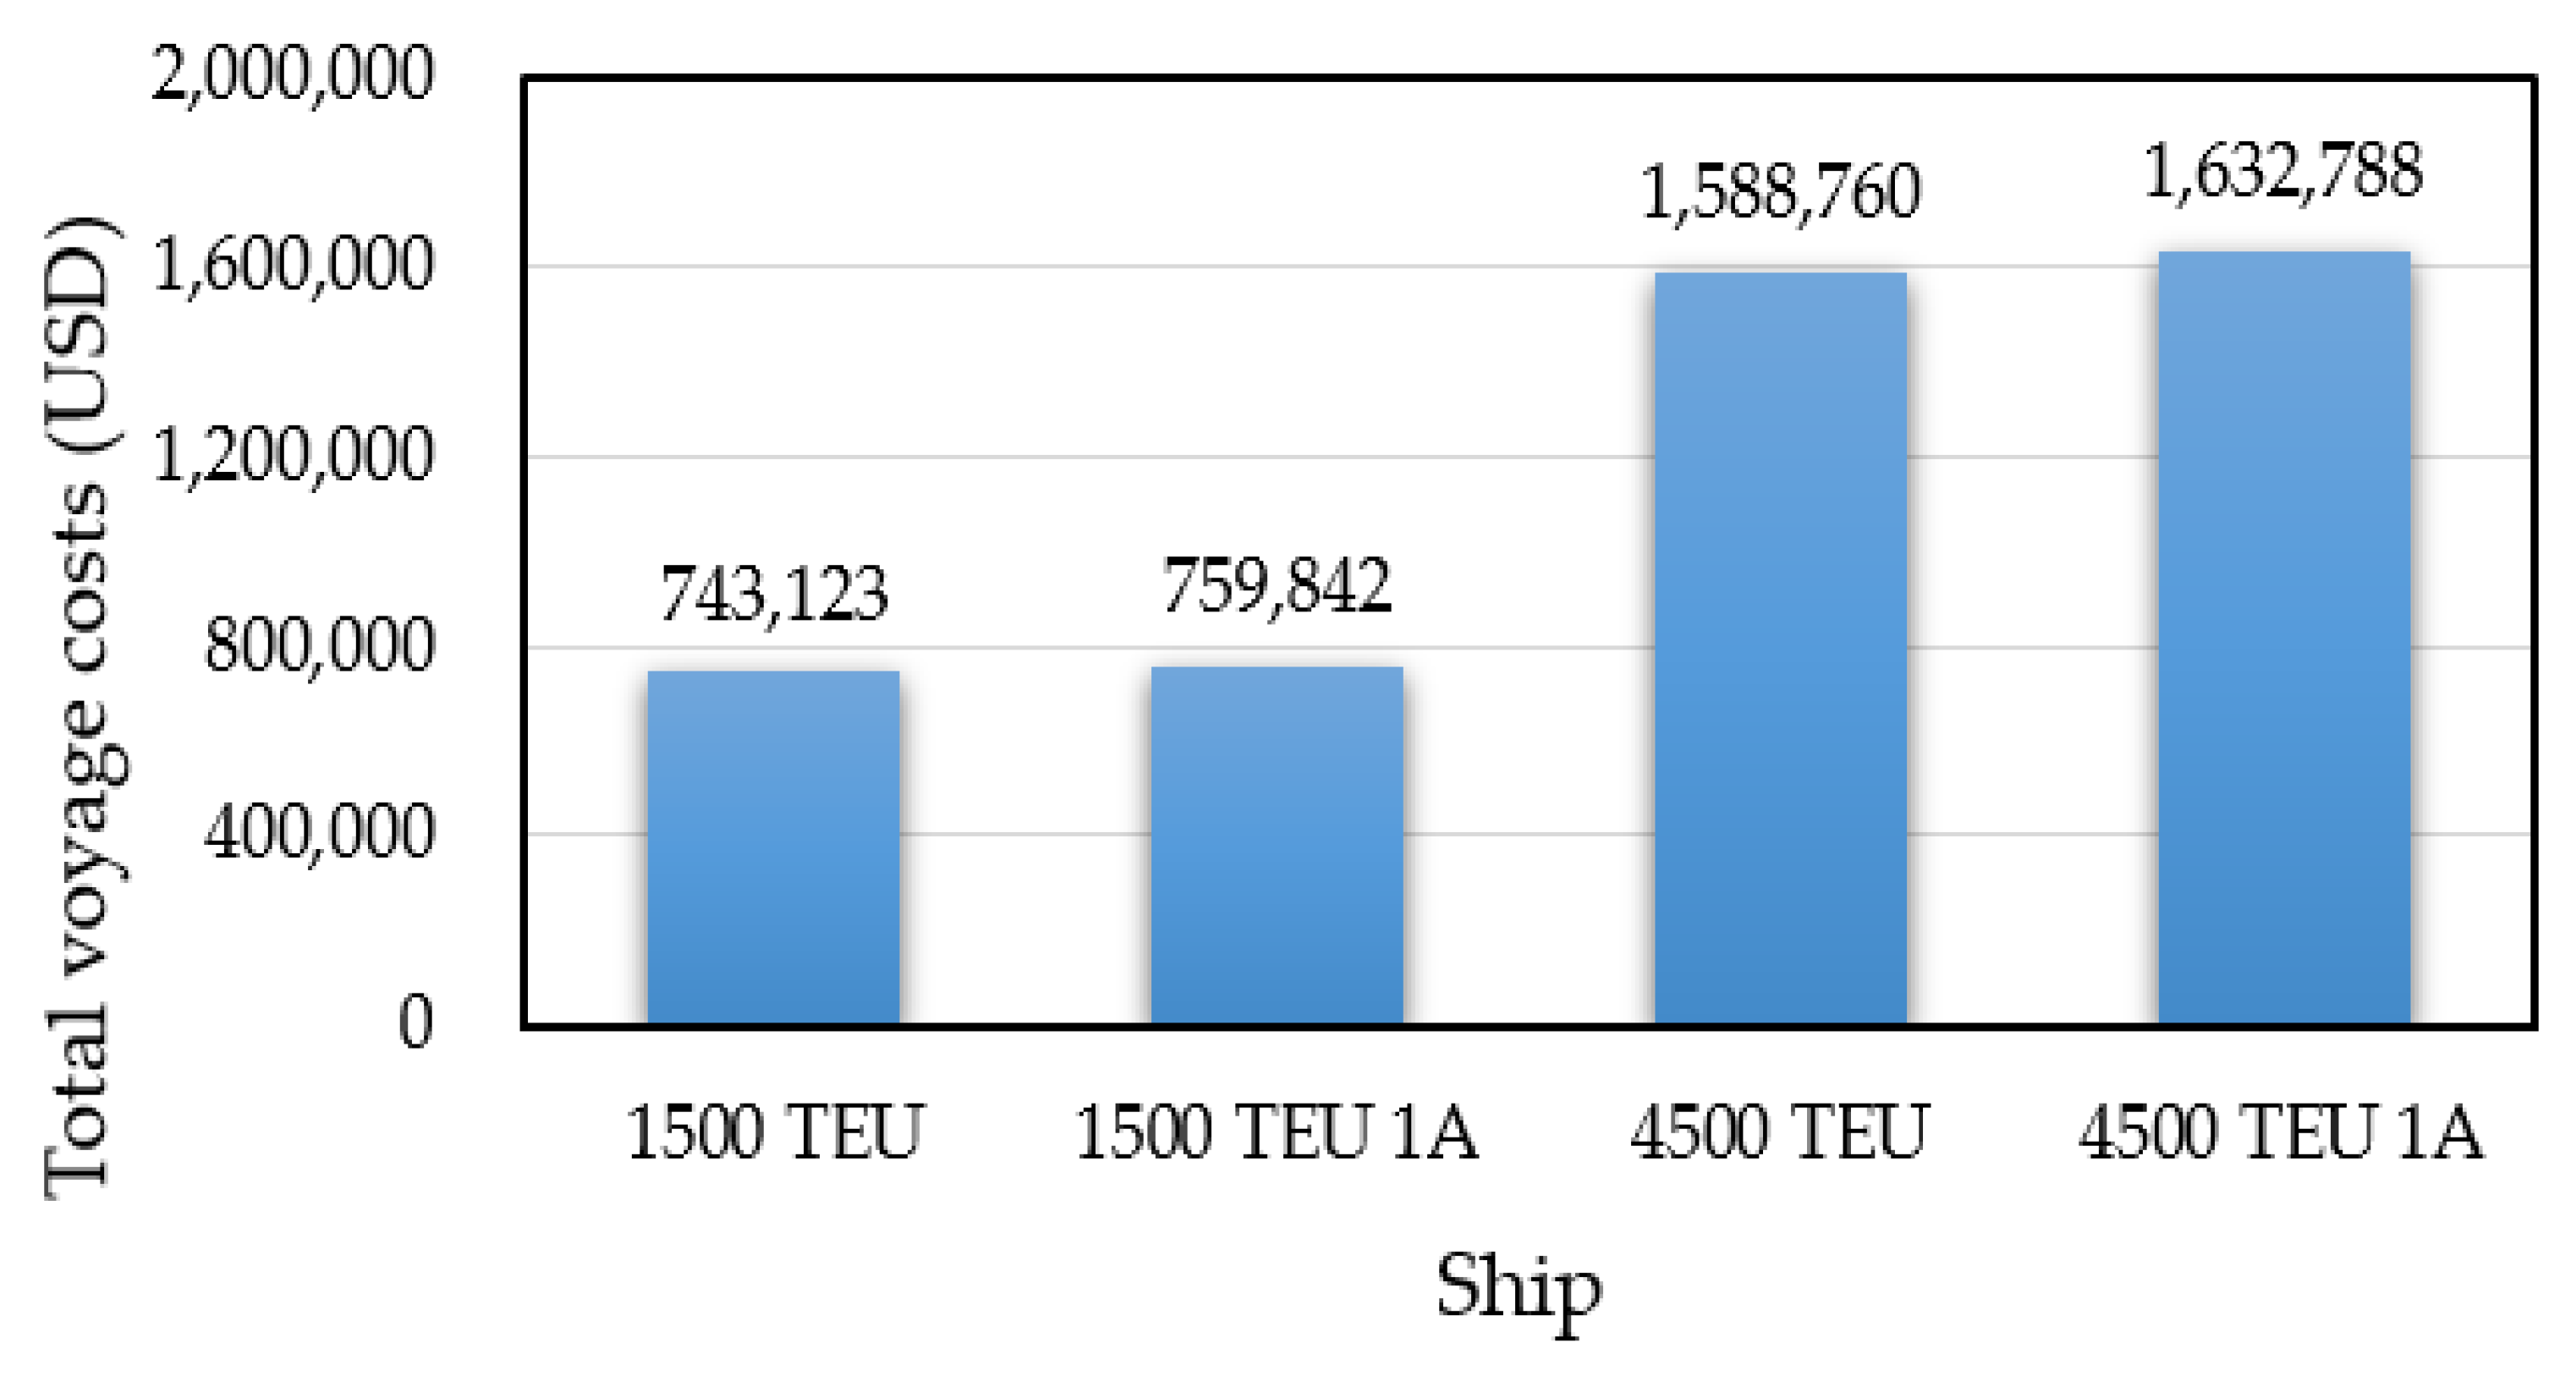
2.2. Shipping Cost
2.2.1. Cost of Voyage Operation (CVO)
- Daily maintenance: Annual maintenance fees typically account for 1.095% of shipbuilding costs [30]. Due to differences in design and specifications, the maintenance costs of ice-class ships can be 5% to 21% higher than those of normal container ships of the same size [15]; this study used the median of this range 13%.
- Ship insurance: Insurances fees for a typical container ship account for approximately 0.343% of shipbuilding costs [30]. However, because the Arctic sea routes are not fully developed and entail adverse weather and navigation conditions, insurance companies typically list Arctic sea routes as high-risk routes. Consequently, the annual insurance fees for an Arctic sea route are 16.7% to 100% higher than those of a conventional route [31]. According to statistics, most insurance companies are reluctant to insure firms that do not have experience in Arctic shipping, and even for cooperated companies, the insurance fees are still 25% to 50% higher than the conventional route [32]; this study used the median of this range 37.5%.
- Crew size and wages: Taiwan’s medium-sized and large container ships are equipped with automated control systems and are crewed by approximately 20 people. According to the website Nautic Jobs, the average monthly wage for a crew member of an international container ship in 2021 was US$3359.6 [33]. However, ship operating companies have indicated that wages for crew members on Arctic sea routes are typically 10% to 20% higher than those for crew members on conventional sea routes because of the expertise required for ice-class ships and the dangers of Arctic sea routes [26]; this study used the median of this range, 15%.
- Company management fees: Company management fees were calculated by referencing Drewry’s [34] and 2020 reviews and forecasts of ship operating costs. Data from ship companies operating on Arctic sea routes have indicated that ice-class ships cost approximately 10% more to operate than does a typical ship [26].
2.2.2. Cost of Voyage Capital (CVC)
2.2.3. Cost of Voyage Fuel (CVF)
2.2.4. Cost of Voyage Transit (CVT)
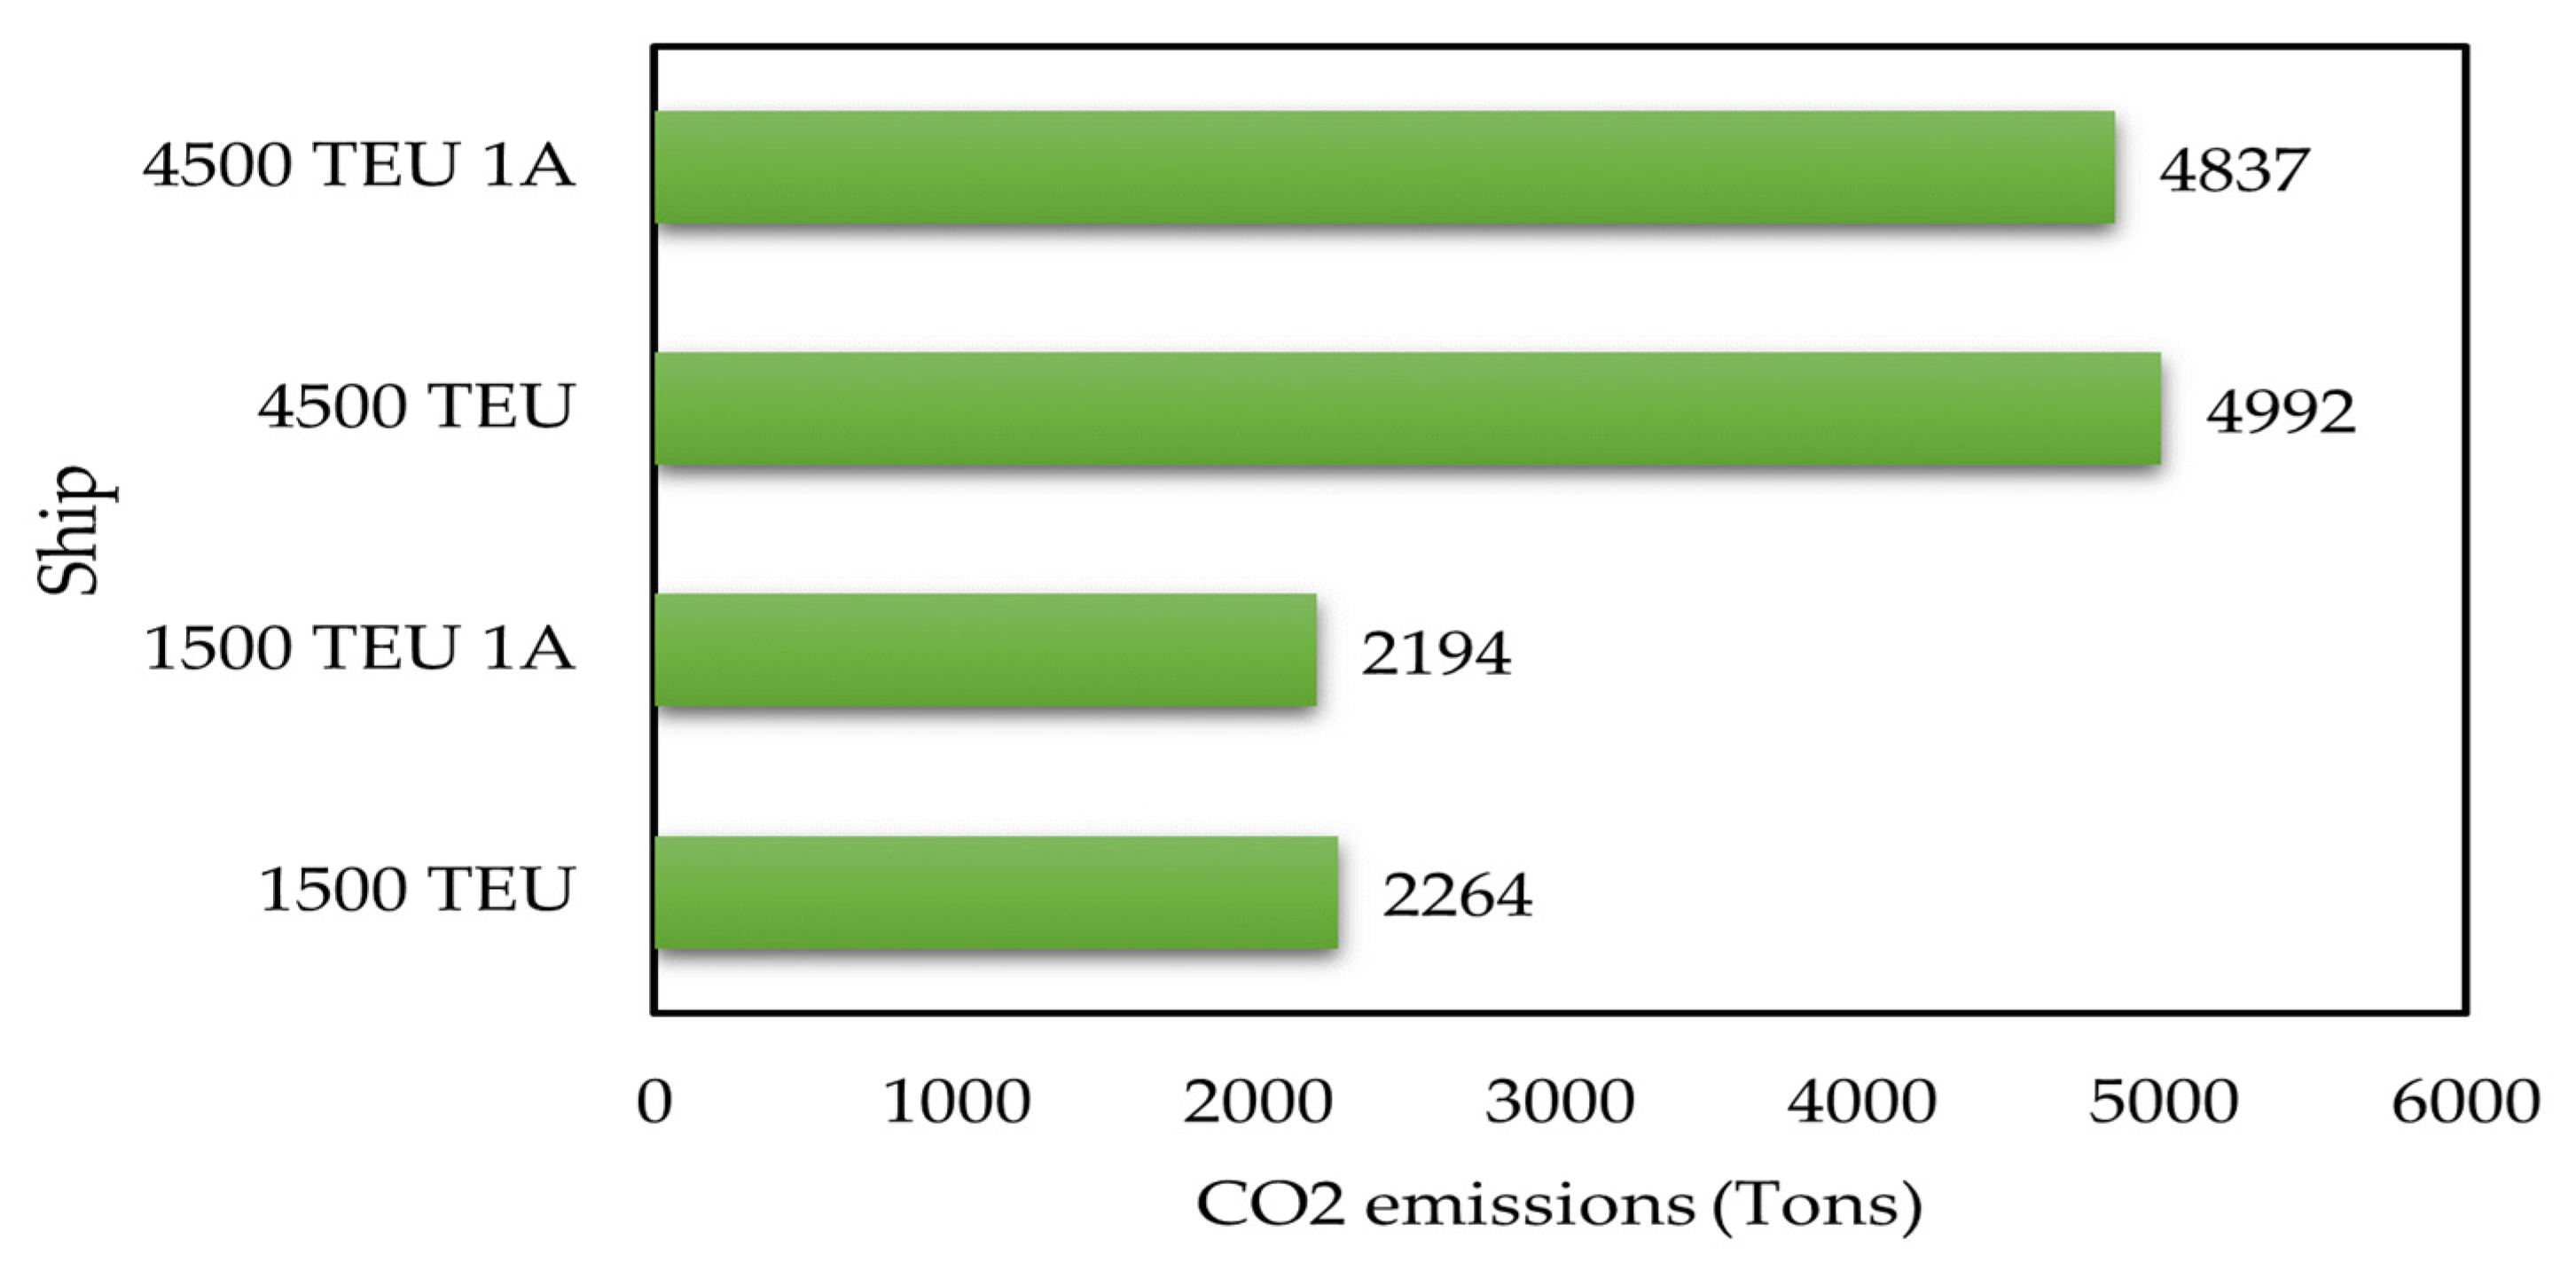
2.3. Carbon Dioxide Emission
3. Results and Discussion
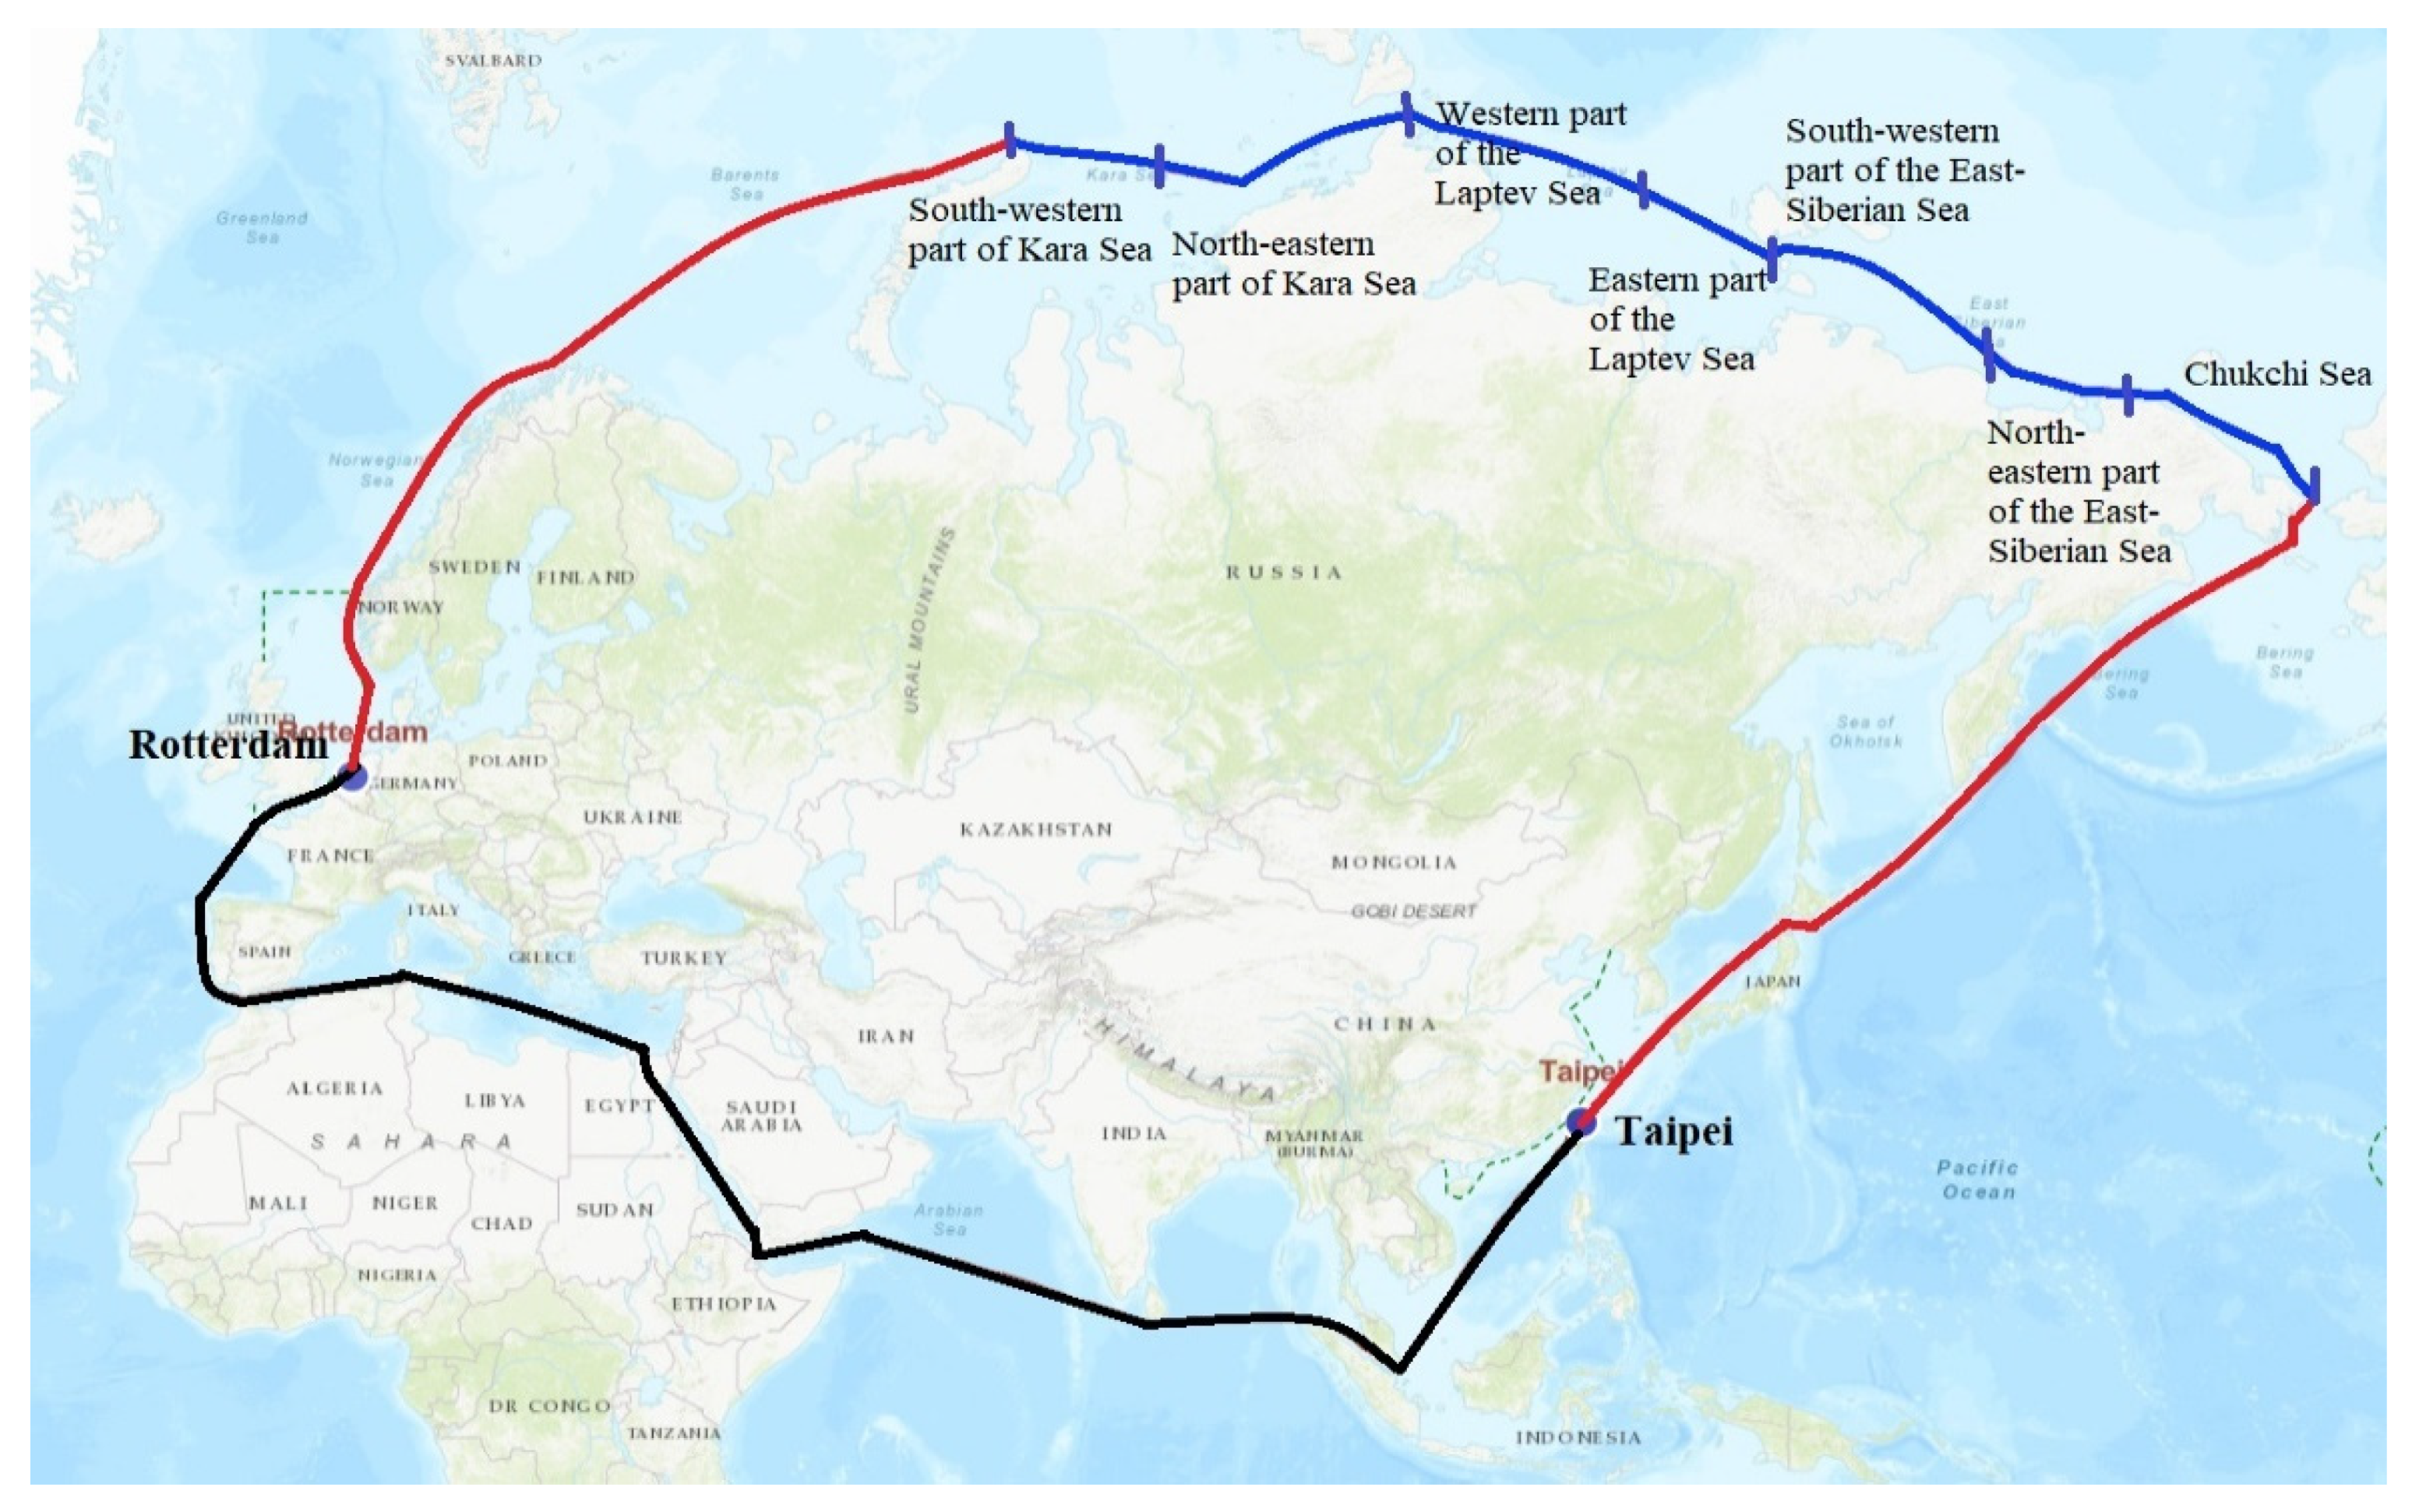
3.1. Distance of the Route
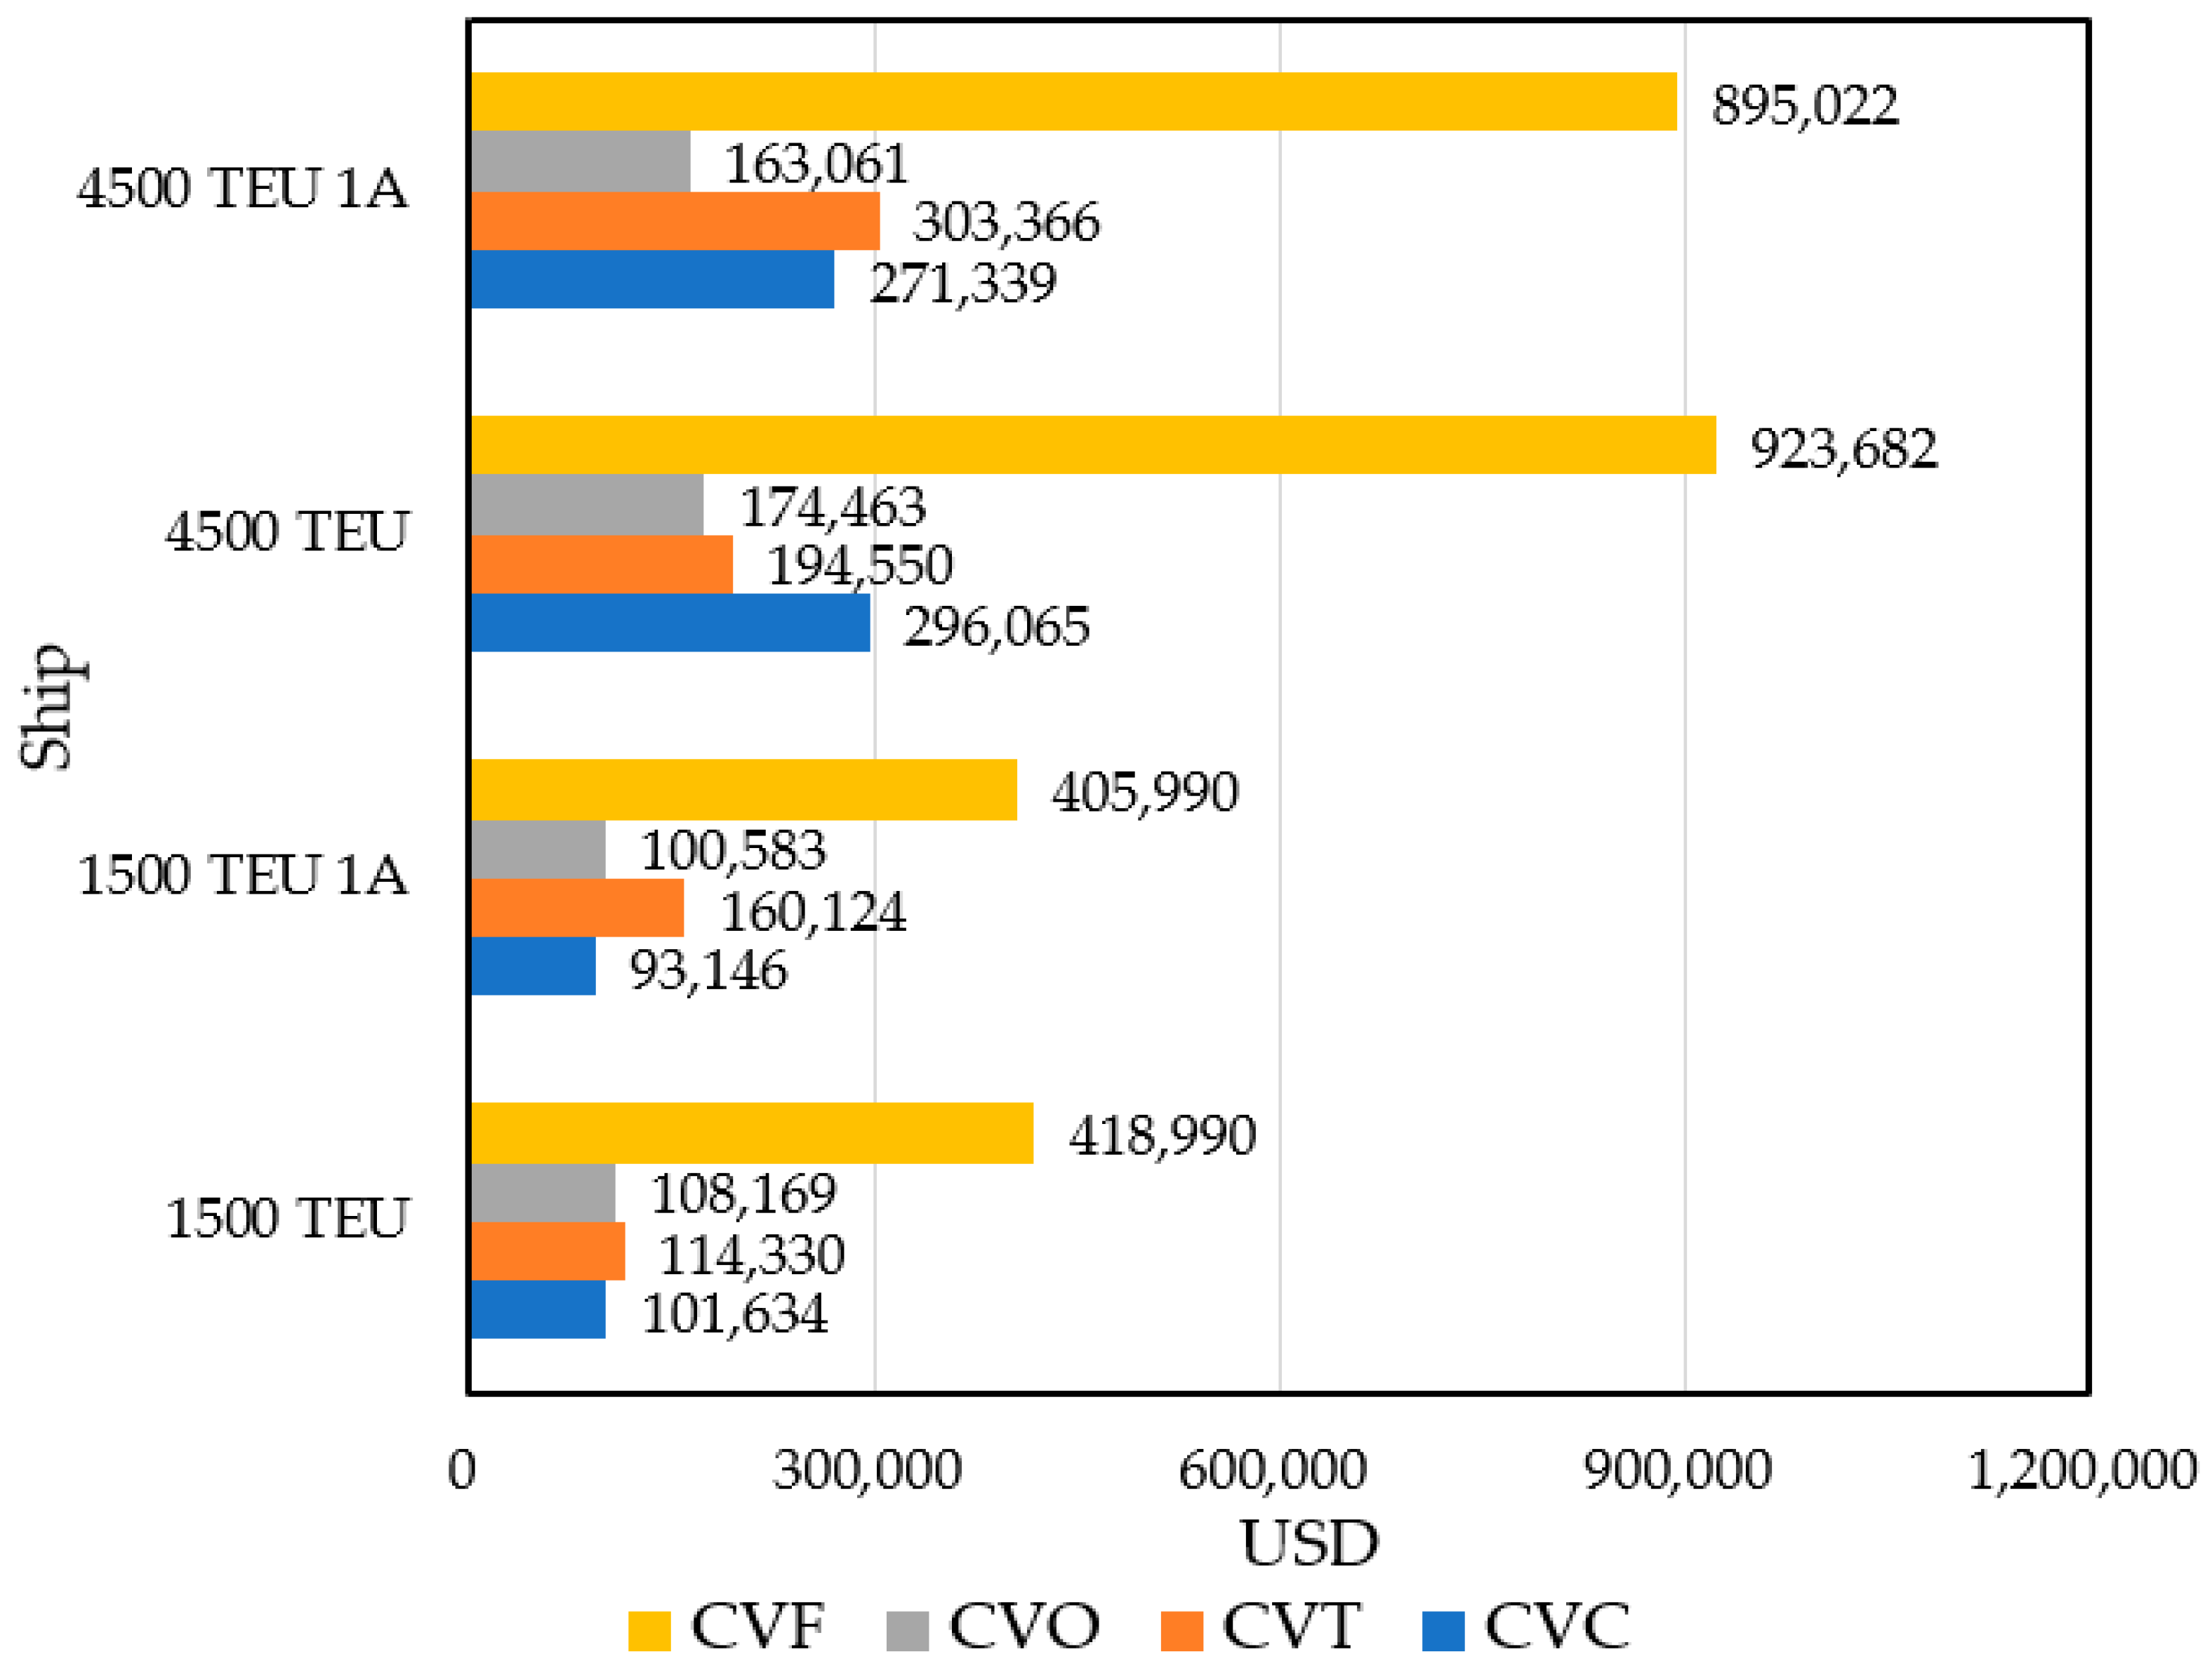
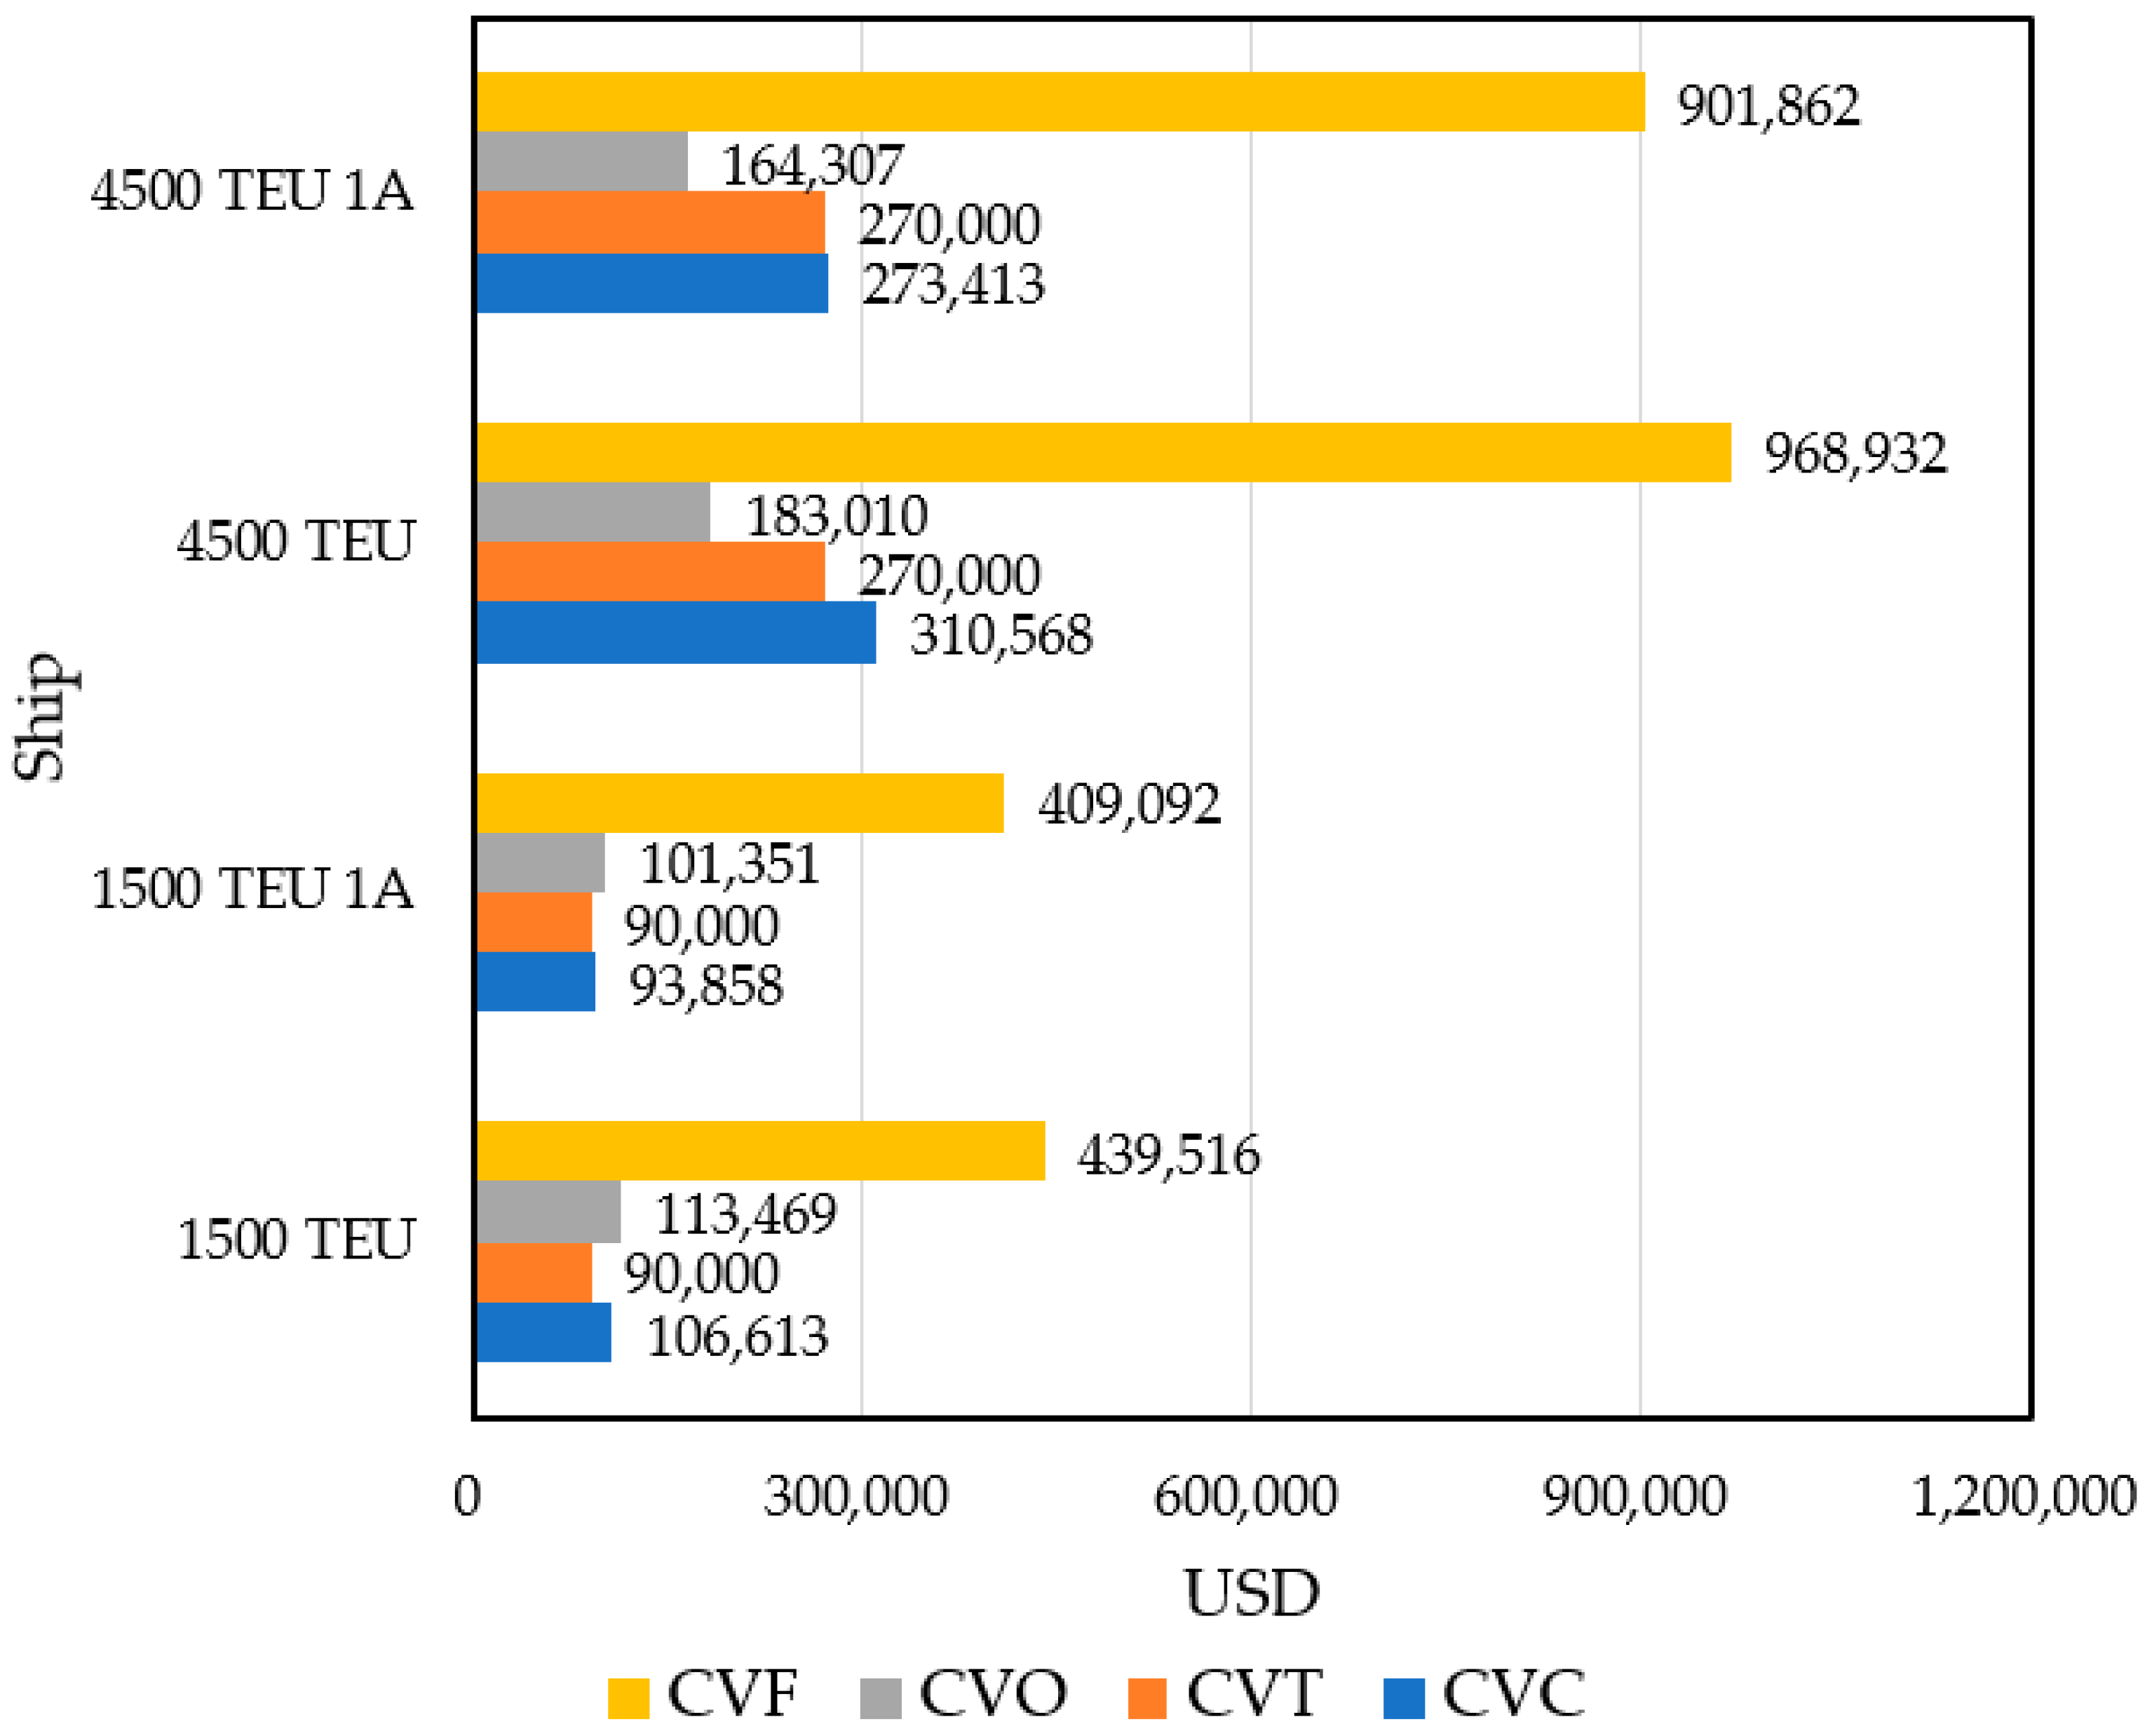
3.2. Calculation of the Shipping Cost
3.2.1. Calculation of CVO
3.2.2. Calculation of CVC
3.2.3. Calculation of CVF
3.2.4. Calculation of CVT
3.3. Calculation of the CO2 Emission
3.4. Discussion
4. Conclusions
Author Contributions
Funding
Institutional Review Board Statement
Informed Consent Statement
Data Availability Statement
Acknowledgments
Conflicts of Interest
References
- United Nations’ Conference on Trade and Development (UNCTAD). Review of Maritime Transport 2020; United Nations Publications: New York, NY, USA, 2020.
- Cristea, A.; Hummels, D.; Puzzello, L.; Avetisyan, M. Trade and the greenhouse gas emissions from international freight transport. J. Environ. Econom. Manag. 2013, 65, 153–173. [Google Scholar] [CrossRef] [Green Version]
- IMO. Fourth IMO GHG Study 2020-Final Report Note by the Secretariat; IMO: London, UK, 2020. [Google Scholar]
- Brandt, J.; Silver, J.D.; Christensen, J.H.; Andersen, M.S.; Bønløkke, J.H.; Sigsgaard, T.; Geels, C.; Gross, A.; Hansen, A.B.; Hansen, K.M.; et al. Assessment of past, present and future health-cost externalities of air pollution in Europe and the contribution from international ship traffic using the EVA model system. Atmos. Chem. Phys. 2013, 13, 7747–7764. [Google Scholar] [CrossRef] [Green Version]
- Lei, R.; Xie, H.; Wang, J.; Leppäranta, M.; Jónsdóttir, I.; Zhang, Z. Changes in sea ice conditions along the Arctic Northeast Passage from 1979 to 2012. Cold Reg. Sci. Technol. 2015, 119, 132–144. [Google Scholar] [CrossRef]
- Hays, B. NOAA: Arctic Warming at Twice the Rate of the Rest of the Planet, UPI. 2018. Available online: https://www.upi.com/Science_News/2018/12/12/NOAA-Arctic-warming-at-twice-the-rate-of-the-rest-of-the-Planet/5141544580754/ (accessed on 18 July 2020).
- Carvalho, K.S.; Wang, S. Sea surface temperature variability in the Arctic Ocean and its marginal seas in a changing climate: Patterns and mechanisms. Glob. Planet. Chang. 2020, 193, 103265. [Google Scholar] [CrossRef]
- Xia, Y.; Bex, V.; Midgley, P.M. Climate Change 2013: The Physical Science Basis; Cambridge University Press: Cambridge, MA, USA, 2013. [Google Scholar] [CrossRef] [Green Version]
- Diebolda, F.X.; Rudebusch, G.D. Probability assessments of an ice-free Arctic: Comparing statistical and climate model projections. J. Econom. 2021; in press. [Google Scholar] [CrossRef]
- Beluga Shipping. Available online: https://en.wikipedia.org/wiki/Beluga_Shipping (accessed on 12 December 2021).
- Arctic Council. Arctic Marine Shipping Assessment (AMSA) 2009 Report; Arctic Council: Tromsø, Norway, 2009.
- IMO. Sub-Committee on Pollution Prevention and Response (PPR 7), 17–21 February 2020; IMO: London, UK, 2020. [Google Scholar]
- Schøyen, H.; Bråthen, S. The Northern sea route versus the Suez Canal: Cases from bulk shipping. J. Transp. Geogr. 2011, 19, 977–983. [Google Scholar] [CrossRef]
- Raza, Z.; Schøyens, H. The commercial potential for LNG shipping between Europe and Asia via the Northern Sea Route. J. Marit. Res. 2014, 11, 67–79. [Google Scholar]
- Faury, O.; Cariou, P. The Northern Sea Route competitiveness for oil tankers. Transp. Res. Part A Policy Pract. 2016, 94, 461–469. [Google Scholar] [CrossRef]
- Theocharis, D.; Rodrigues, V.S.; Pettit, S.; Haider, J. Feasibility of the Northern Sea Route: The role of distance, fuel prices, ice breaking fees and ship size for the product tanker market. Transport. Res. Part E Logist. Transport. Rev. 2019, 129, 111–135. [Google Scholar] [CrossRef]
- Somanathan, S.; Flynn, P.; Szymanski, J. The Northwest Passage: A simulation. Transp. Res. Part A Policy Pract. 2009, 43, 127–135. [Google Scholar] [CrossRef]
- TurgutKoçak, S.; Yercan, F. Comparative cost-effectiveness analysis of Arctic and international shipping routes: A Fuzzy Analytic Hierarchy Process. Transp. Policy 2021, 114, 147–164. [Google Scholar] [CrossRef]
- Gleb, S.; Jin, J.G. Evaluating the feasibility of combined use of the Northern Sea Route and the Suez Canal Route considering ice parameters. Transp. Res. Part A Policy Pract. 2021, 147, 350–369. [Google Scholar] [CrossRef]
- Lasserre, F. Case studies of shipping along Arctic routes. Analysis and profitability perspectives for the container sector. Transp. Res. Part A Policy Pract. 2014, 66, 144–161. [Google Scholar] [CrossRef]
- Xu, H.; Yang, D. LNG-fuelled container ship sailing on the Arctic Sea: Economic and emission assessment. Transp. Res. Part D Trans. Environ. 2020, 87, 102556. [Google Scholar] [CrossRef]
- Directorate General of Budget, Accounting and Statistics, Executive Yuan, ROC. 2021. International Port Cargo Lifting Volume. Available online: https://www.dgbas.gov.tw/public/Data/2210143122YUOZUPXC.pdf (accessed on 28 January 2022).
- Export & Import Value List. Bureau of Foreign Trade, MOEA, R.O.C. 2021. Available online: https://cuswebo.trade.gov.tw/FSCE030F/FSCE030F (accessed on 28 January 2022).
- IMO. MEPC.268(68) (Adopted on 15 May 2015). Designation of the South-West Coral Sea as an Extension of the Great Barrier Reef and Torres Strait Particularly Sensitive Sea Area. Available online: https://www.imo.org/en/KnowledgeCentre/IndexofIMOResolutions/Pages/MEPC-2014-15.aspx (accessed on 12 September 2021).
- Northern Sea Route information Office. Analysis of Shipping Traffic in the NSR Waters in 2020. Available online: https://arctic-lio.com/analysys-of-shipping-traffic-in-the-nsr-waters-in-2020/ (accessed on 8 February 2022).
- Anonymous; An Anonymous Officer from One of the Major Container Operator Companies. Personal Communication.
- Panama Canal Authority. Available online: https://pancanal.com/eng/op/tariff/index.html (accessed on 10 February 2022).
- Lu, D.; Park, G.K.; Choi, K.; Oh, S. An economic analysis of container shipping through Canadian Northwest passage. Int. J. E Navigat. Marit. Econ. 2014, 1, 60–72. [Google Scholar] [CrossRef] [Green Version]
- Xu, H.; Yin, Z. The optimal icebreaking tariffs and the economic performance of tramp shipping on the Northern Sea Route. Transp. Res. Part A Policy Pract. 2021, 49, 76–97. [Google Scholar] [CrossRef]
- Jiang, M.; Hu, M.; Leibrecht, M. Profitability of container shipping via the Arctic Northeast passage: A simulation and regression analysis. Mar. Policy 2021, 133, 104738. [Google Scholar] [CrossRef]
- Lasserre, F. Simulations of shipping along Arctic routes: Comparison, analysis and economic perspectives. Polar Rec. 2014, 51, 239–259. [Google Scholar] [CrossRef]
- Sarrabezoles, A.; Lasserre, F.; Hagouagn’rin, Z. Arctic shipping insurance: Towards a harmonisation of practices and costs? Polar Rec. 2016, 52, 393–398. [Google Scholar] [CrossRef]
- Container Ship Crew Salary Guide 2021. Available online: https://www.nauticjobs.com/blog/2020/10/30/container-ship-crew-salary-guide-2021/ (accessed on 13 February 2022).
- Drewry. Ship Operating Costs Annual Review and Forecast 2019/20; Drewry Shipping Consultants: London, UK, 2019. [Google Scholar]
- Enter the Existing Ship Schedule. In The Law of the Ship; Maritime Port Bureau; MOTC: Taiwan, 2019. Available online: https://www.motcmpb.gov.tw/Information/Detail/4f6b83b4-11e9-4673-8cd2-00d58caa7682?SiteId=1&NodeId=54 (accessed on 16 December 2021).
- Russia Maritime Register of Shipping Website. Available online: https://rs-class.org/ (accessed on 10 February 2022).
- Clarkson Shipping Fuel Price. Available online: https://www.clarksons.com/ (accessed on 7 January 2022).
- SUEZ Canal Authority. Available online: https://www.suezcanal.gov.eg/English/Navigation/Tolls/Pages/TollsTable.aspx (accessed on 7 January 2022).
- Marine Fuel Price of CPC, ROC. Available online: https://www.cpc.com.tw/cp.aspx?n=44 (accessed on 13 February 2022).
- Russian Northern Sea Route Administration. Available online: http://www.nsra.ru/en/ledokolnaya_i_ledovaya_lotsmanskaya_provodka/raschet_stoimosti_ledokolnoy_provodki_v_akvatorii_smp.html (accessed on 19 November 2021).
- Exchange Rate USD/RUB. 2021. Available online: https://invest.cnyes.com/forex/detail/USDRUB/history (accessed on 15 May 2022).
- IMO. UN Body Adopts Climate Change Strategy for Shipping; IMO: London, UK, 2018. [Google Scholar]
- Xue, Y.L. Carbon Dioxide (CO2) emissions from ocean-going vessels and estimation methods. Ship Shipp. Newsl. 2014, 124, 2–12. [Google Scholar]
- Comer, B.; Osipova, L. Accounting for Well-to-wake Carbon Dioxide Equivalent Emissions in Maritime Transportation Climate Policies; ICCT: Washington, DC, USA, 2021. [Google Scholar]
- International Chamber of Shipping, 6 September 2021. International Chamber of Shipping Sets Out Plans for Global Carbon Levy to Expedite Industry Decarbonization. Available online: https://www.ics-shipping.org/press-release/international-chamber-of-shipping-sets-out-plans-for-global-carbon-levy/ (accessed on 10 January 2022).
- Lee, T.C.; Chang, Y.T.; Lee, P.T.W. Economy-wide impact analysis of a carbon tax on international container shipping. Transp. Res. Part A Policy Pract. 2013, 58, 87–102. [Google Scholar] [CrossRef]
- Samenow, J. It Was 84 Degrees near the Arctic Ocean This Weekend as Carbon Dioxide Hit Its Highest Level in Human History. Available online: https://www.washingtonpost.com/weather/2019/05/14/it-was-degrees-near-arctic-ocean-this-weekend-carbon-dioxide-hit-its-highest-level-human-history/ (accessed on 15 February 2022).
- Kikuchi, T.; Nishino, S.; Fujiwara, A.; Onodera, J.; Yamamoto, K.M.; Mizobata, K.; Fukamachi, Y.; Watanabe, E. Status and trends of Arctic Ocean Environmental Change and its Impacts on Marine Biogeochemistry: Findings from the ArCS Project. Polar Sci. 2021, 27, 100639. [Google Scholar] [CrossRef]
- Fahd, F.; Yang, M.; Khan, F.; Veitch, B. A food chain-based ecological risk assessment model for oil spills in the Arctic environment. Mar. Pollut. Bull. 2021, 166, 112164. [Google Scholar] [CrossRef]
- Vincent, W.F.; Whyte, L.G.; Lovejoy, C.; Greer, C.W.; Laurion, I.; Suttle, C.A.; Corbeil, J.; Mueller, D.R. Arctic microbial ecosystems and impacts of extreme warming during the International Polar Year. Polar Sci. 2009, 3, 171–180. [Google Scholar] [CrossRef] [Green Version]
- Tran, N.K.; Lam, J.S.L. Effects of container ship speed on CO2 emission, cargo lead time and supply chain cost. Research in Transp. Bus. Manag. 2022, 43, 100723. [Google Scholar] [CrossRef]
- Hoang, A.T.; Foley, A.M.; Nižetić, S.; Huang, Z.; Ong, H.C.; Ölçer, A.I.; Pham, V.V.; Nguyen, X.P. Energy-related approach for reduction of CO2 emissions: A critical strategy on the port-to-ship pathway. J. Clean. Prod. 2022, 355, 131772. [Google Scholar] [CrossRef]
- Bazaluk, O.; Zhykharieva, V.; Vlasenko, O.; Nitsenko, V.; Streimikiene, D.; Balezentis, T. Optimization of the Equity in Formation of Investment Portfolio of a Shipping Company. Mathematics 2022, 10, 363. [Google Scholar] [CrossRef]


| Passage/Canal | Standard of the Toll |
|---|---|
| Panama Canal | Less than 1000 TEU = USD 60/TEU. Greater than or equal to 1000 TEU and less than 2000 TEU = USD 60/TEU. Greater than or equal to 2000 and less than 3500 TEU = USD 60/TEU. Greater than or equal to 3500 TEU = USD 60/TEU. |
| Northwest Passage | Assumed that similar to Panama Canal |
| Suez Canal | First 5000 tons = USD 7.88/tons. Next 5000 tons = USD 5.41/tons. Next 10,000 tons = USD 4.20/tons. Next 20,000 tons = USD 2.94/tons. Next 30,000 tons = USD 2.73/tons. |
| Northeast Passage | Ice Class: Arc4 or 1A. Season: Summer. Quantity zones: 7. |
| Daily Operating Costs (USD) | 1500 TEU | 1500 TEU (1A) | 4500 TEU | 4500 TEU (1A) |
|---|---|---|---|---|
| Maintenance | 690 | 780 | 2010 | 2271 |
| Crew wages | 2240 | 2576 | 2240 | 2576 |
| Insurance | 216 | 297 | 630 | 866 |
| Management | 580 | 638 | 1130 | 1243 |
| Total | 3726 | 4291 | 6009 | 6956 |
| Cost (USD) | 1500 TEU | 1500 TEU(1A) | 4500 TEU | 4500 TEU (1A) |
|---|---|---|---|---|
| Shipbuilding Cost | 23.0 M | 26.1 M | 67.0 M | 76.0 M |
| Daily depreciation | 3501 | 3973 | 10,198 | 11,575 |
| CVC | 101,634 | 93,146 | 296,065 | 271,339 |
| Fuel Consumption (Tons) | Panama Canal and Northwest Passage | Differences | Suez Canal and Northeast Passage | Differences |
|---|---|---|---|---|
| 1500 TEU | 639 | 20 | 670 | 46 |
| 1500 TEU(1A) | 619 | 624 | ||
| 4500 TEU | 1408 | 44 | 1477 | 102 |
| 4500 TEU(1A) | 1364 | 1375 |
| Passage Fees (USD) | 22,000-Ton/1500 TEU Container Ships | 50,000-Ton/4500 TEU Container Ships |
|---|---|---|
| Panama Canal | 90,000 | 277,000 |
| Northwest Passage | 90,000 * | 277,000 * |
| Suez Canal | 114,330 | 194,550 |
| Northeast Passage | 160,124 | 303,366 |
Publisher’s Note: MDPI stays neutral with regard to jurisdictional claims in published maps and institutional affiliations. |
© 2022 by the authors. Licensee MDPI, Basel, Switzerland. This article is an open access article distributed under the terms and conditions of the Creative Commons Attribution (CC BY) license (https://creativecommons.org/licenses/by/4.0/).
Share and Cite
Chen, P.-H.; Liu, T.-K. Environmental and Economic Analysis on Sailing from Taiwan through Arctic Passages. Water 2022, 14, 2099. https://doi.org/10.3390/w14132099
Chen P-H, Liu T-K. Environmental and Economic Analysis on Sailing from Taiwan through Arctic Passages. Water. 2022; 14(13):2099. https://doi.org/10.3390/w14132099
Chicago/Turabian StyleChen, Po-Hung, and Ta-Kang Liu. 2022. "Environmental and Economic Analysis on Sailing from Taiwan through Arctic Passages" Water 14, no. 13: 2099. https://doi.org/10.3390/w14132099
APA StyleChen, P.-H., & Liu, T.-K. (2022). Environmental and Economic Analysis on Sailing from Taiwan through Arctic Passages. Water, 14(13), 2099. https://doi.org/10.3390/w14132099