Author Contributions
Y.G.: Investigation, Data curation, Visualization, Writing—Original draft preparation, Funding acquisition; Z.Z.: Conceptualization, Validation, Supervision, Reviewing, Project administration, writing—review and editing; H.L.: Visualization, Writing—Original draft preparation, Editing, Funding acquisition; B.H.: Supervision; T.Z.; Project administration. All authors have read and agreed to the published version of the manuscript.
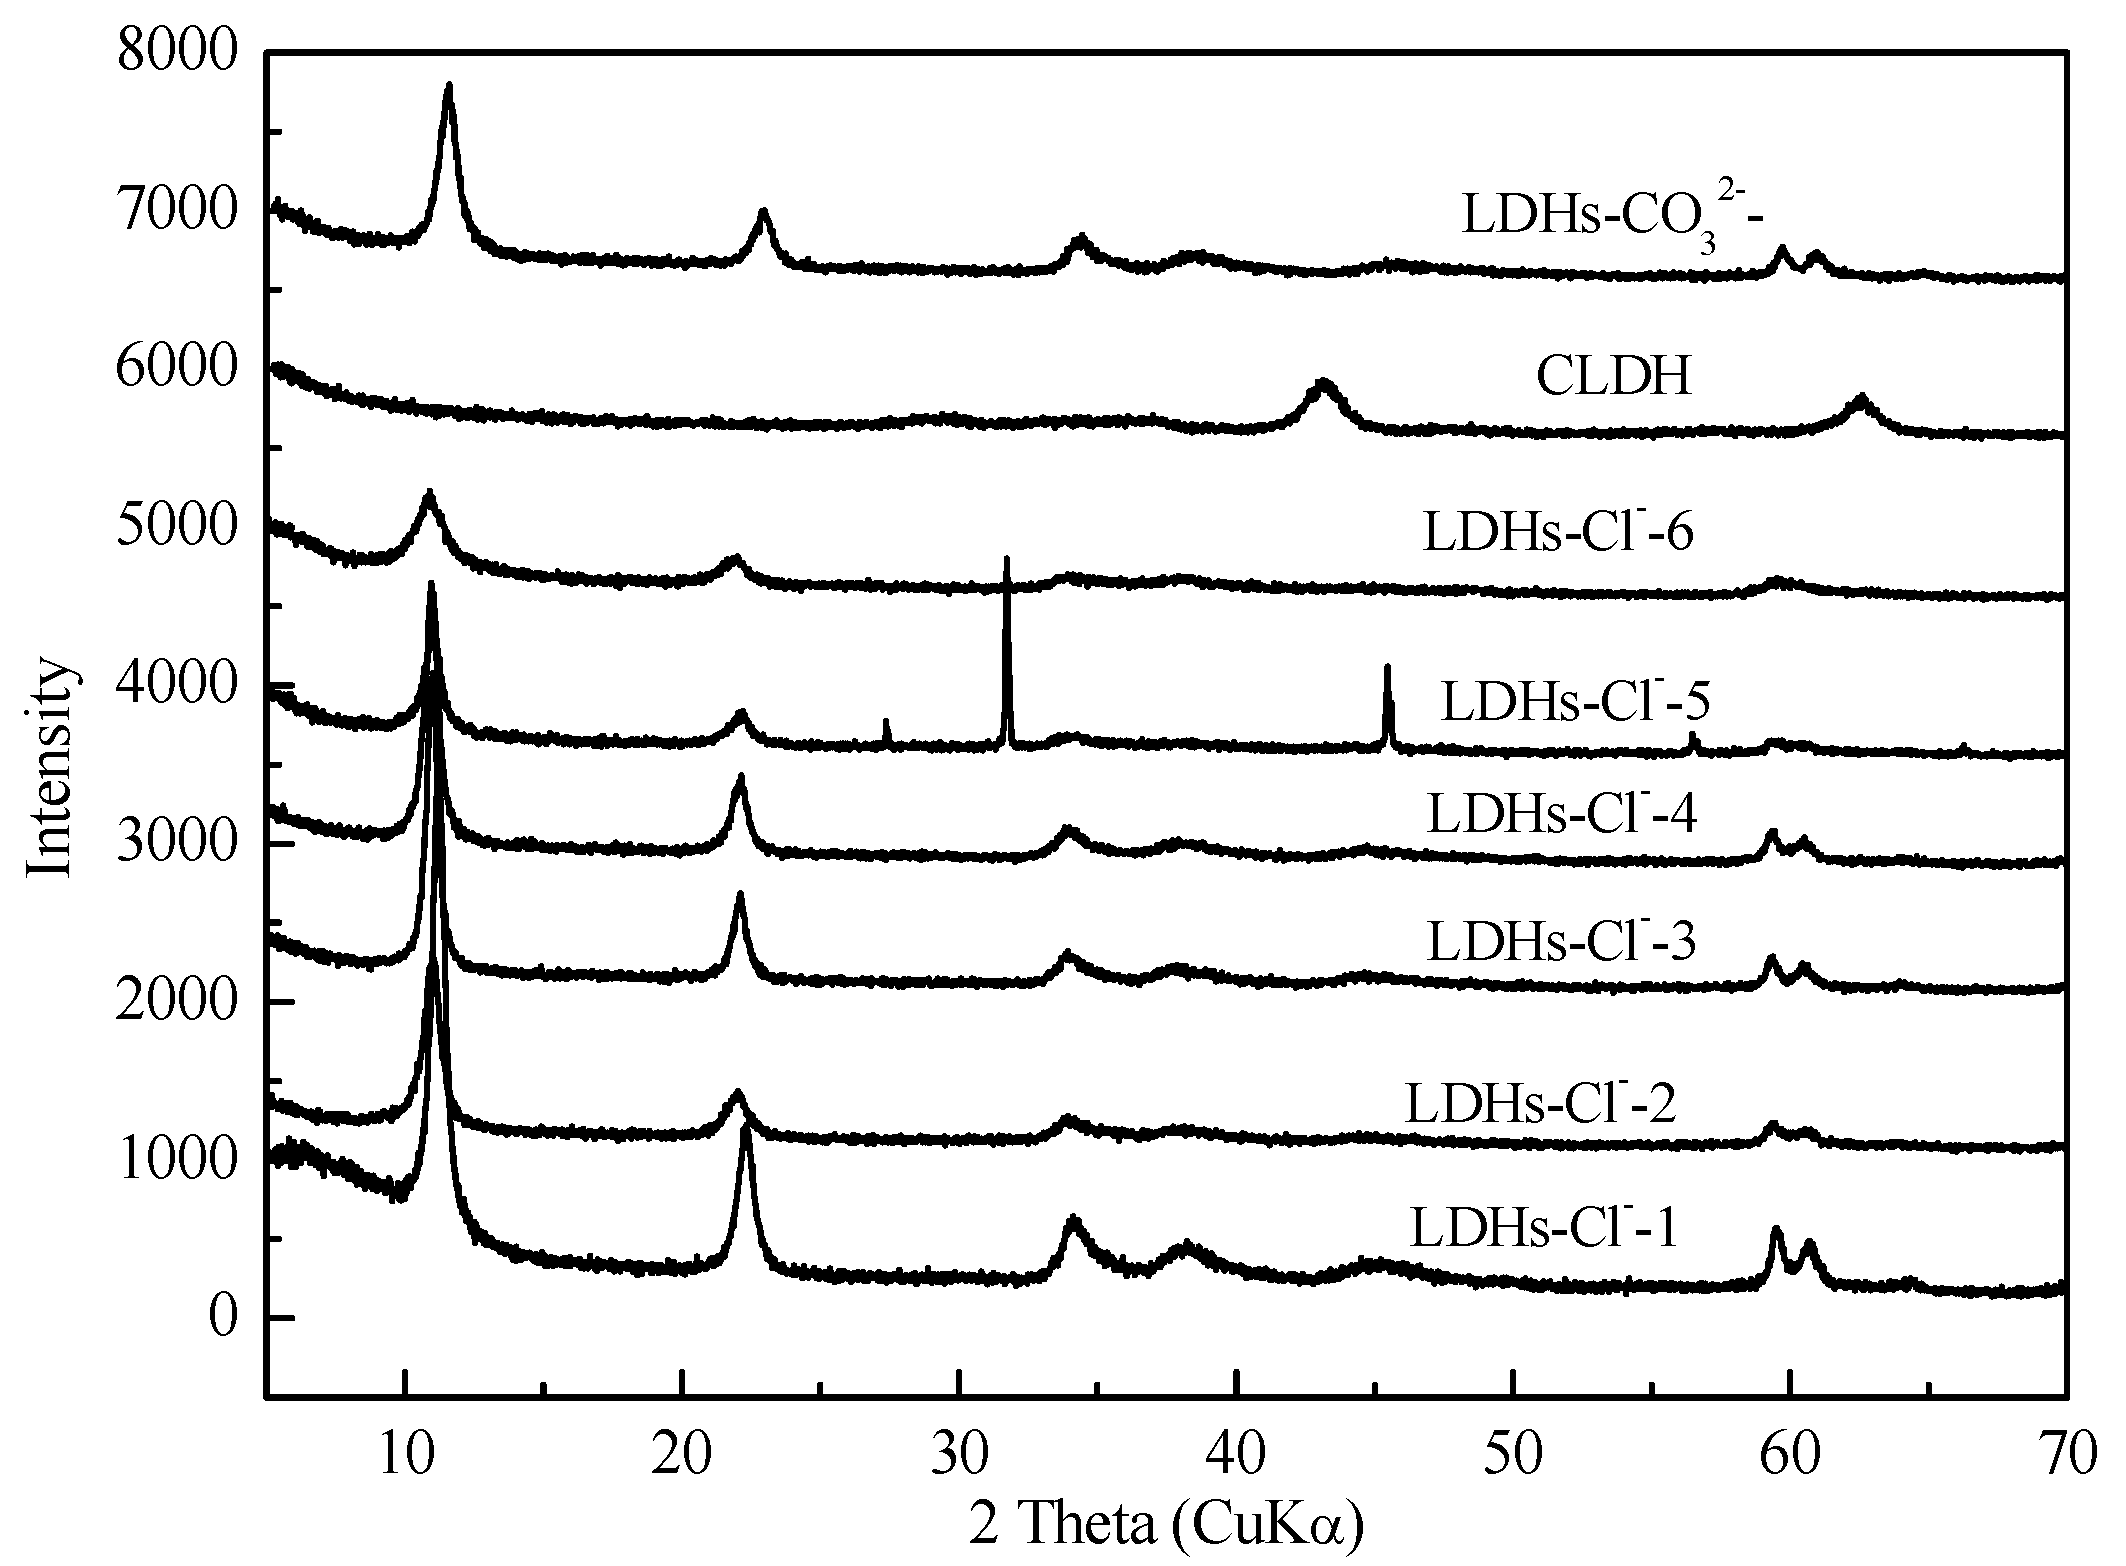
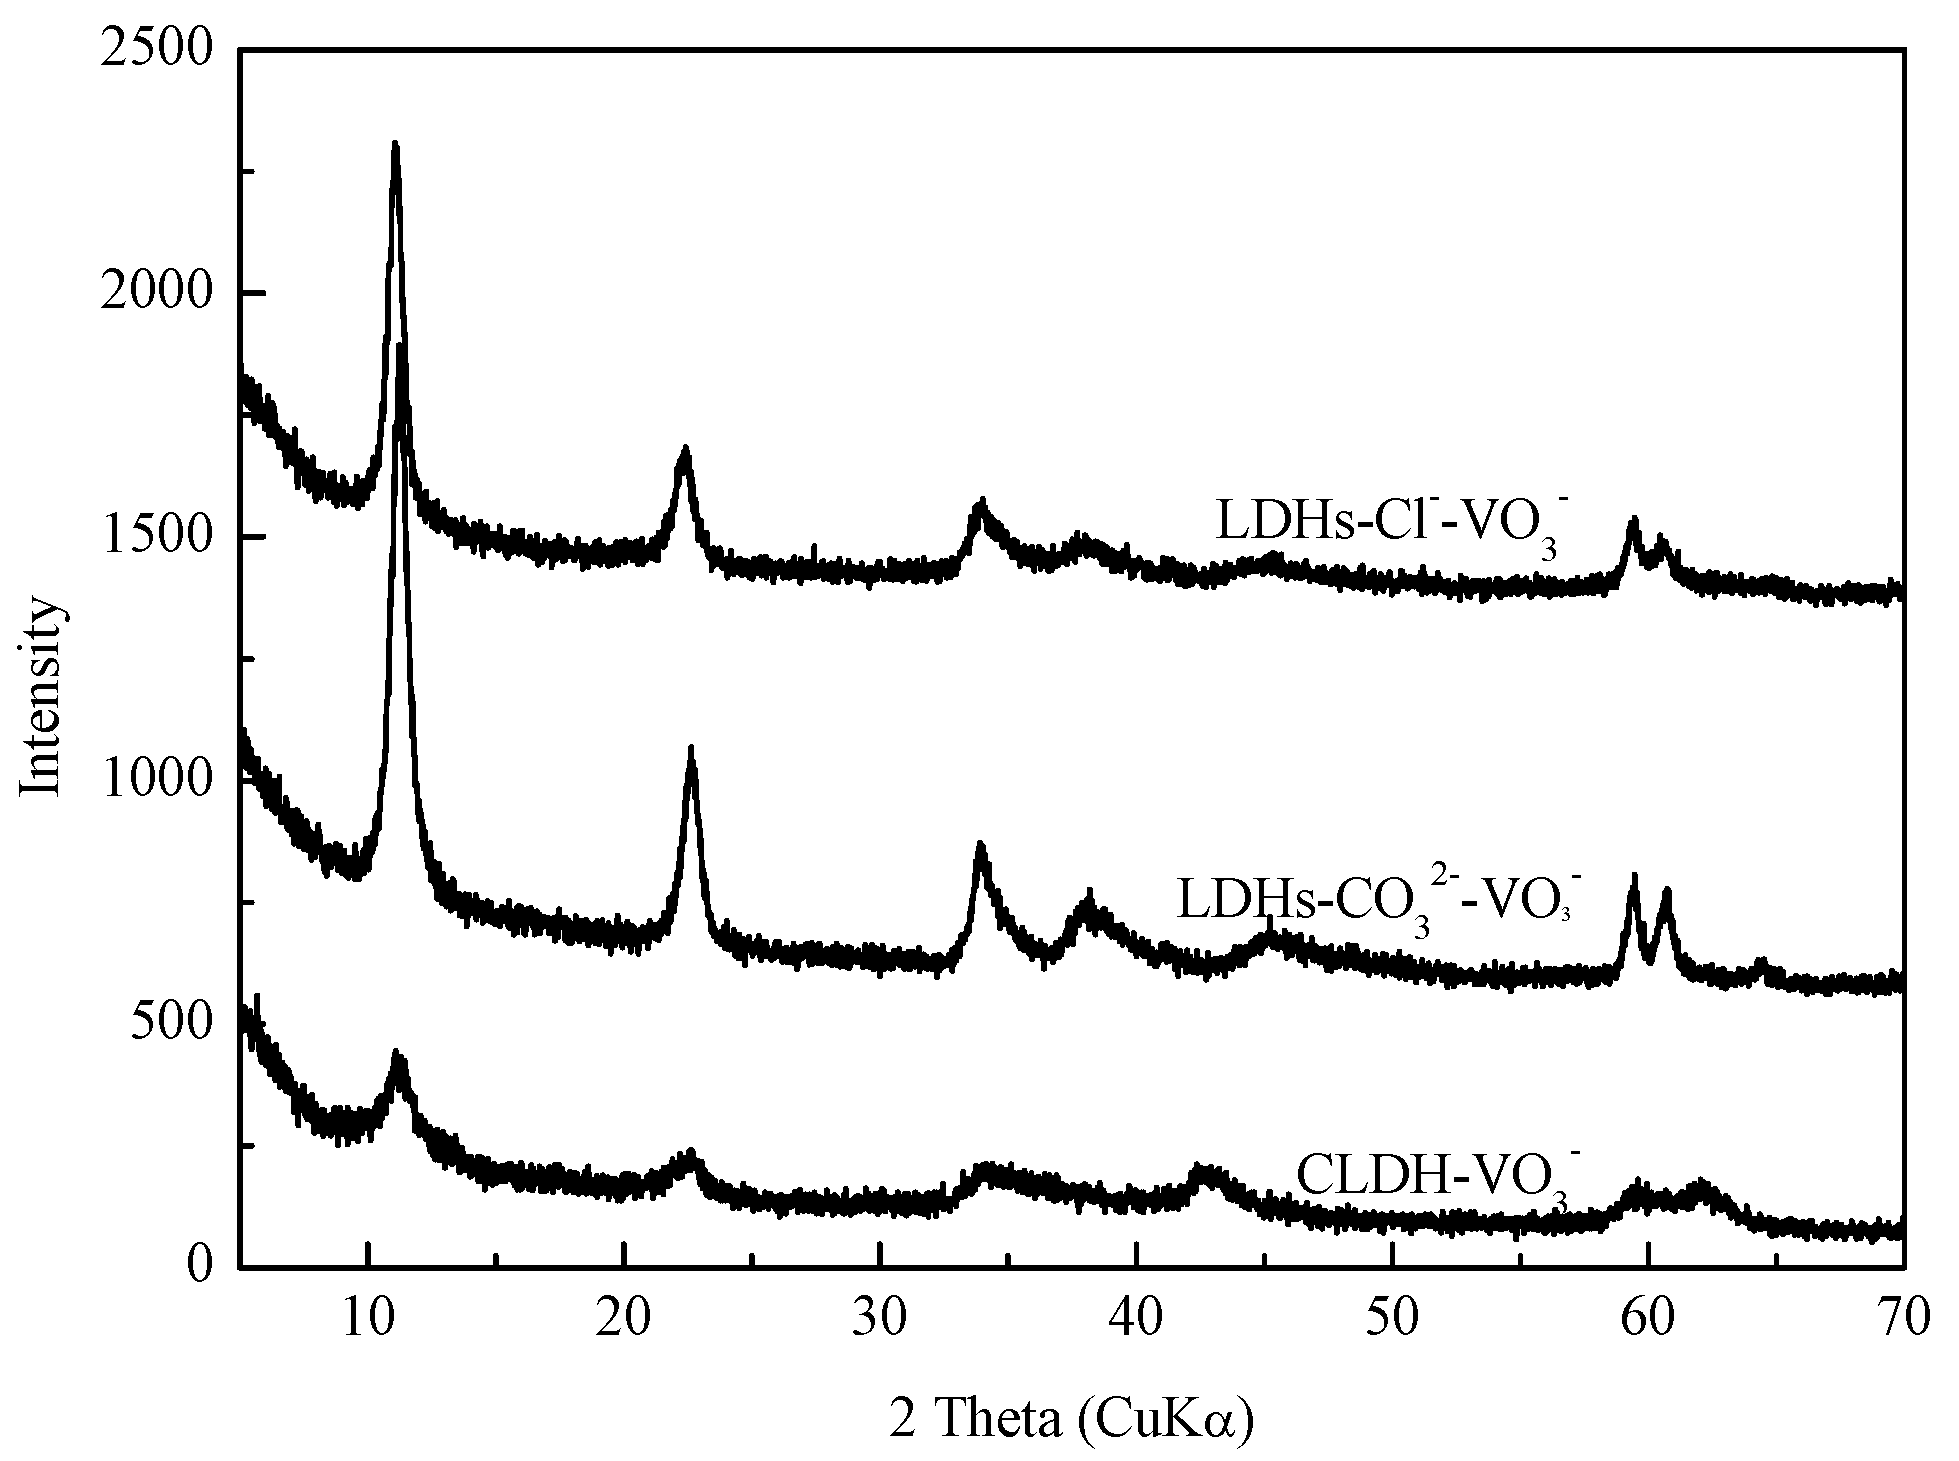
Figure 1.
XRD patterns of Mg-Fe-Ti-LDHs and Mg-Fe-Ti-CLDH.
Figure 1.
XRD patterns of Mg-Fe-Ti-LDHs and Mg-Fe-Ti-CLDH.
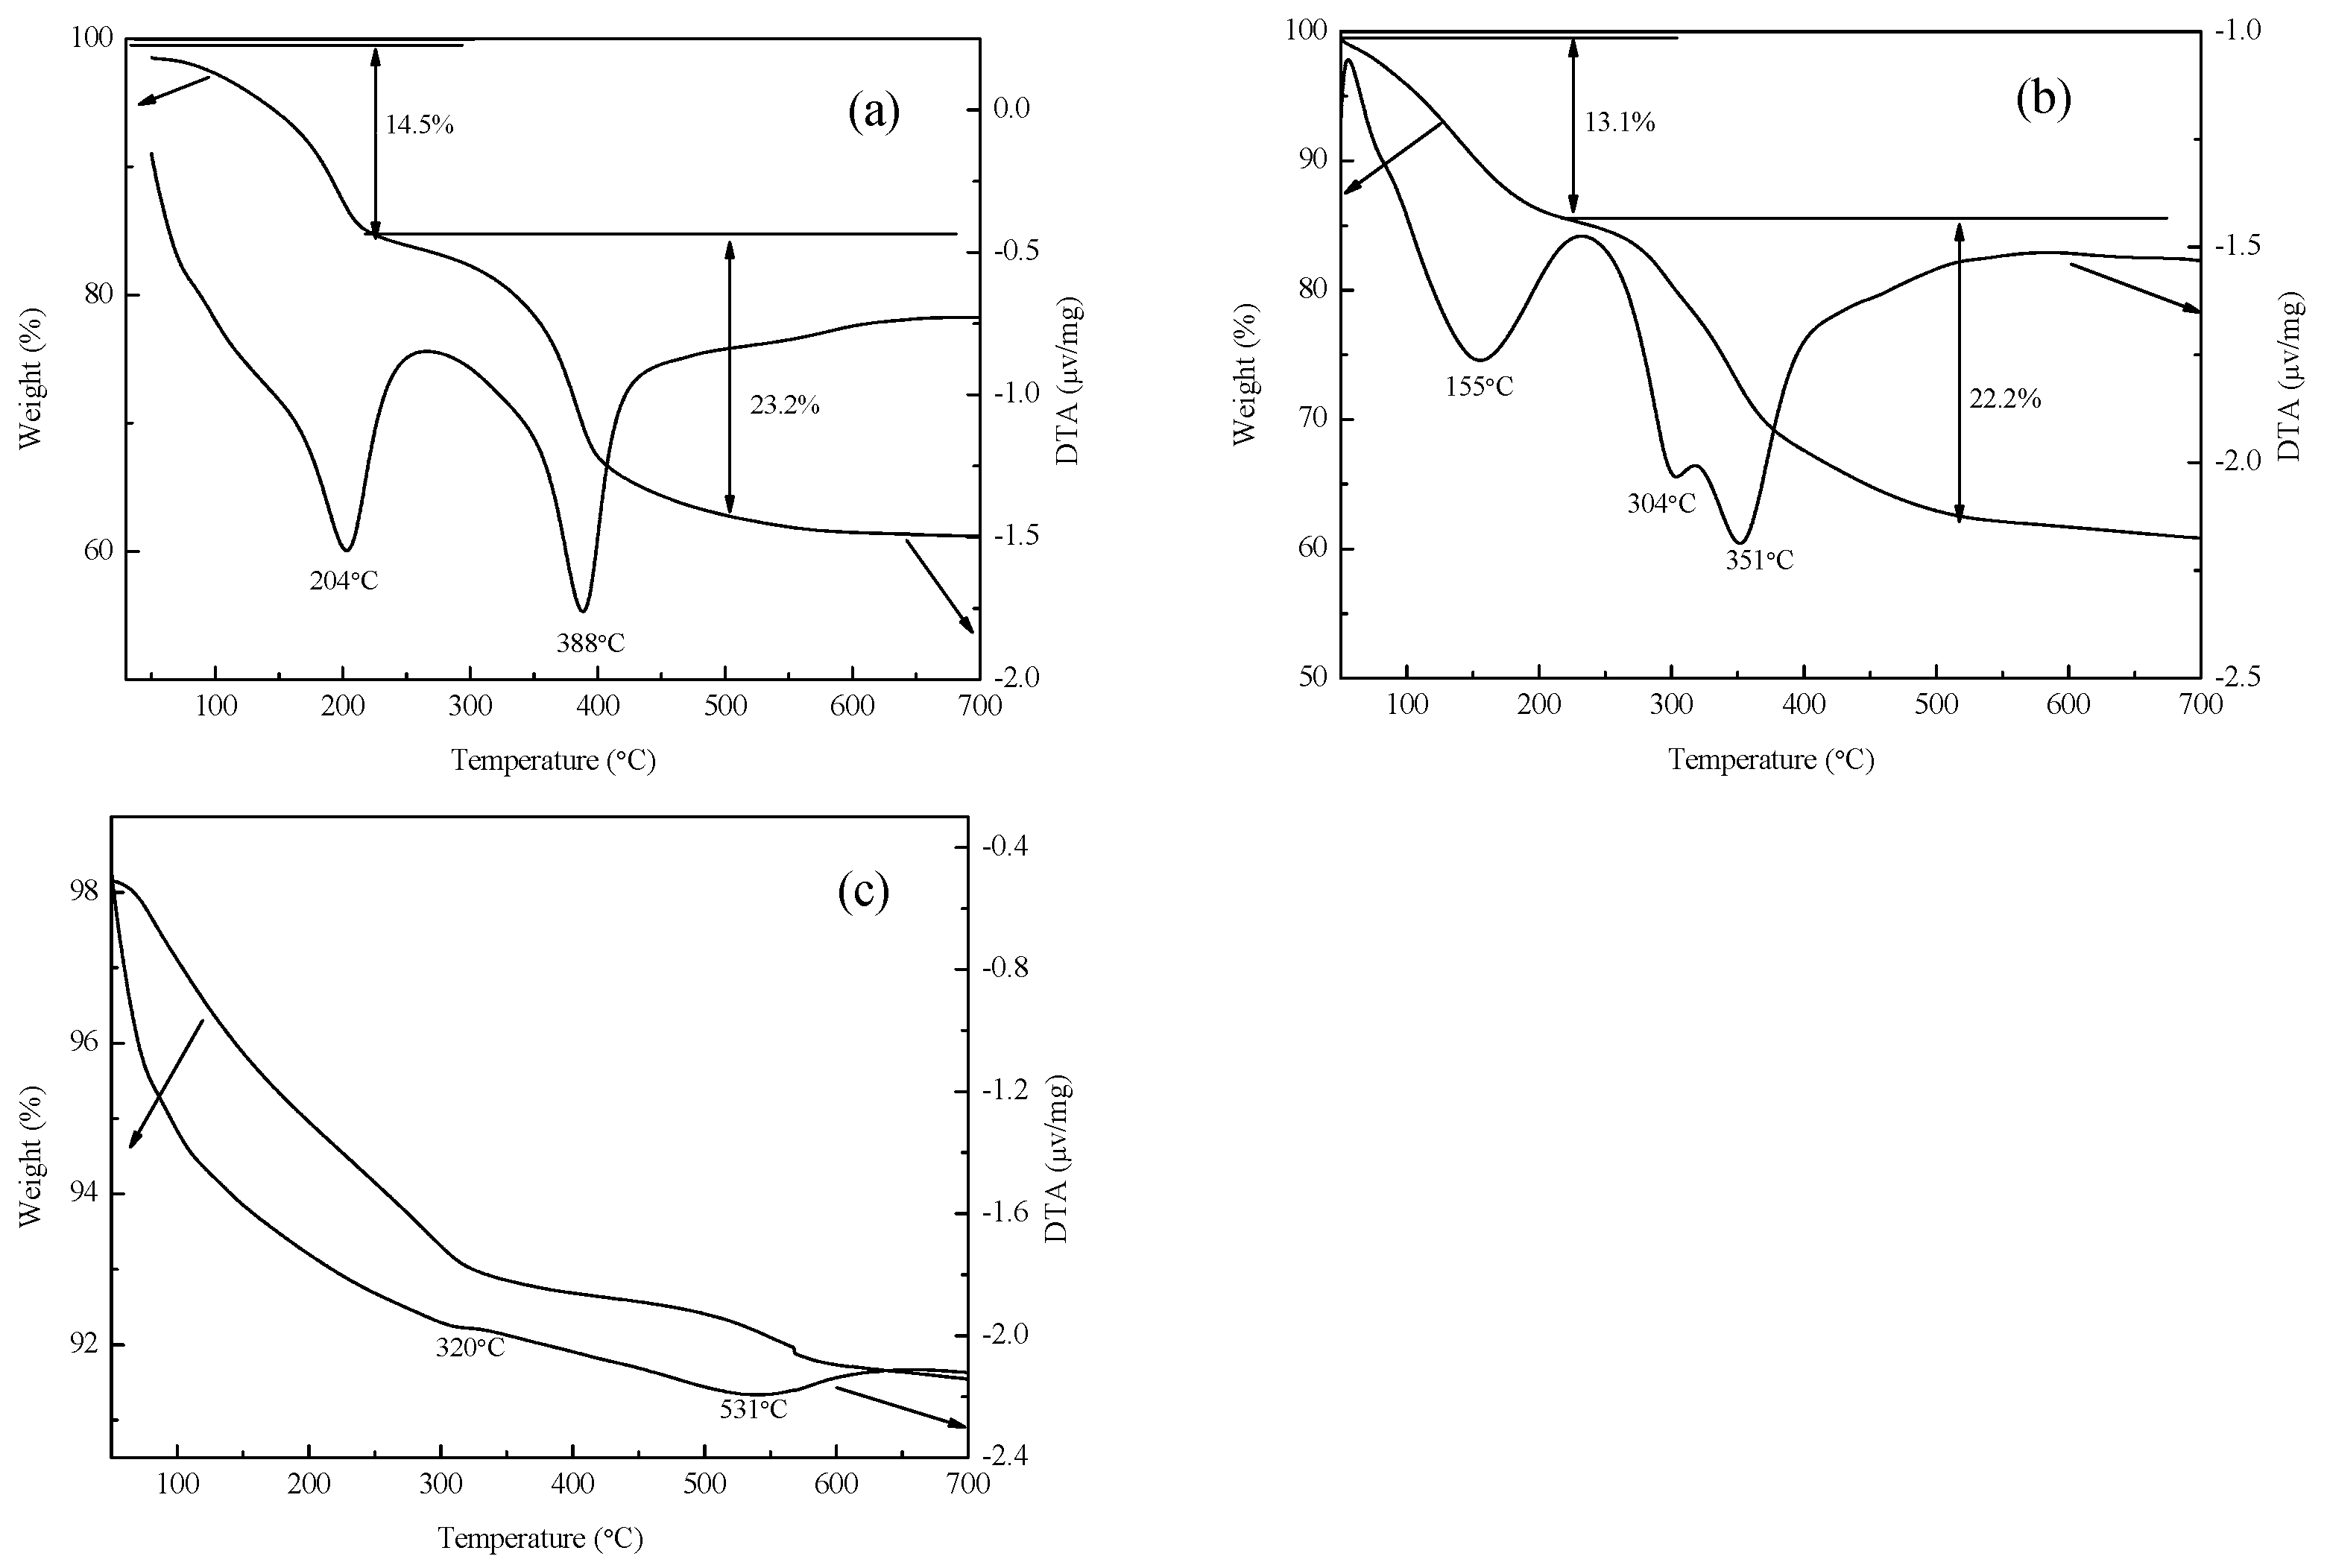
Figure 2.
(a) TG-DTA curves of Mg-Fe-Ti-LDHs-CO32−, (b) Mg-Fe-Ti-LDHs-Cl−-2 and (c) Mg-Fe-Ti-CLDH.
Figure 2.
(a) TG-DTA curves of Mg-Fe-Ti-LDHs-CO32−, (b) Mg-Fe-Ti-LDHs-Cl−-2 and (c) Mg-Fe-Ti-CLDH.
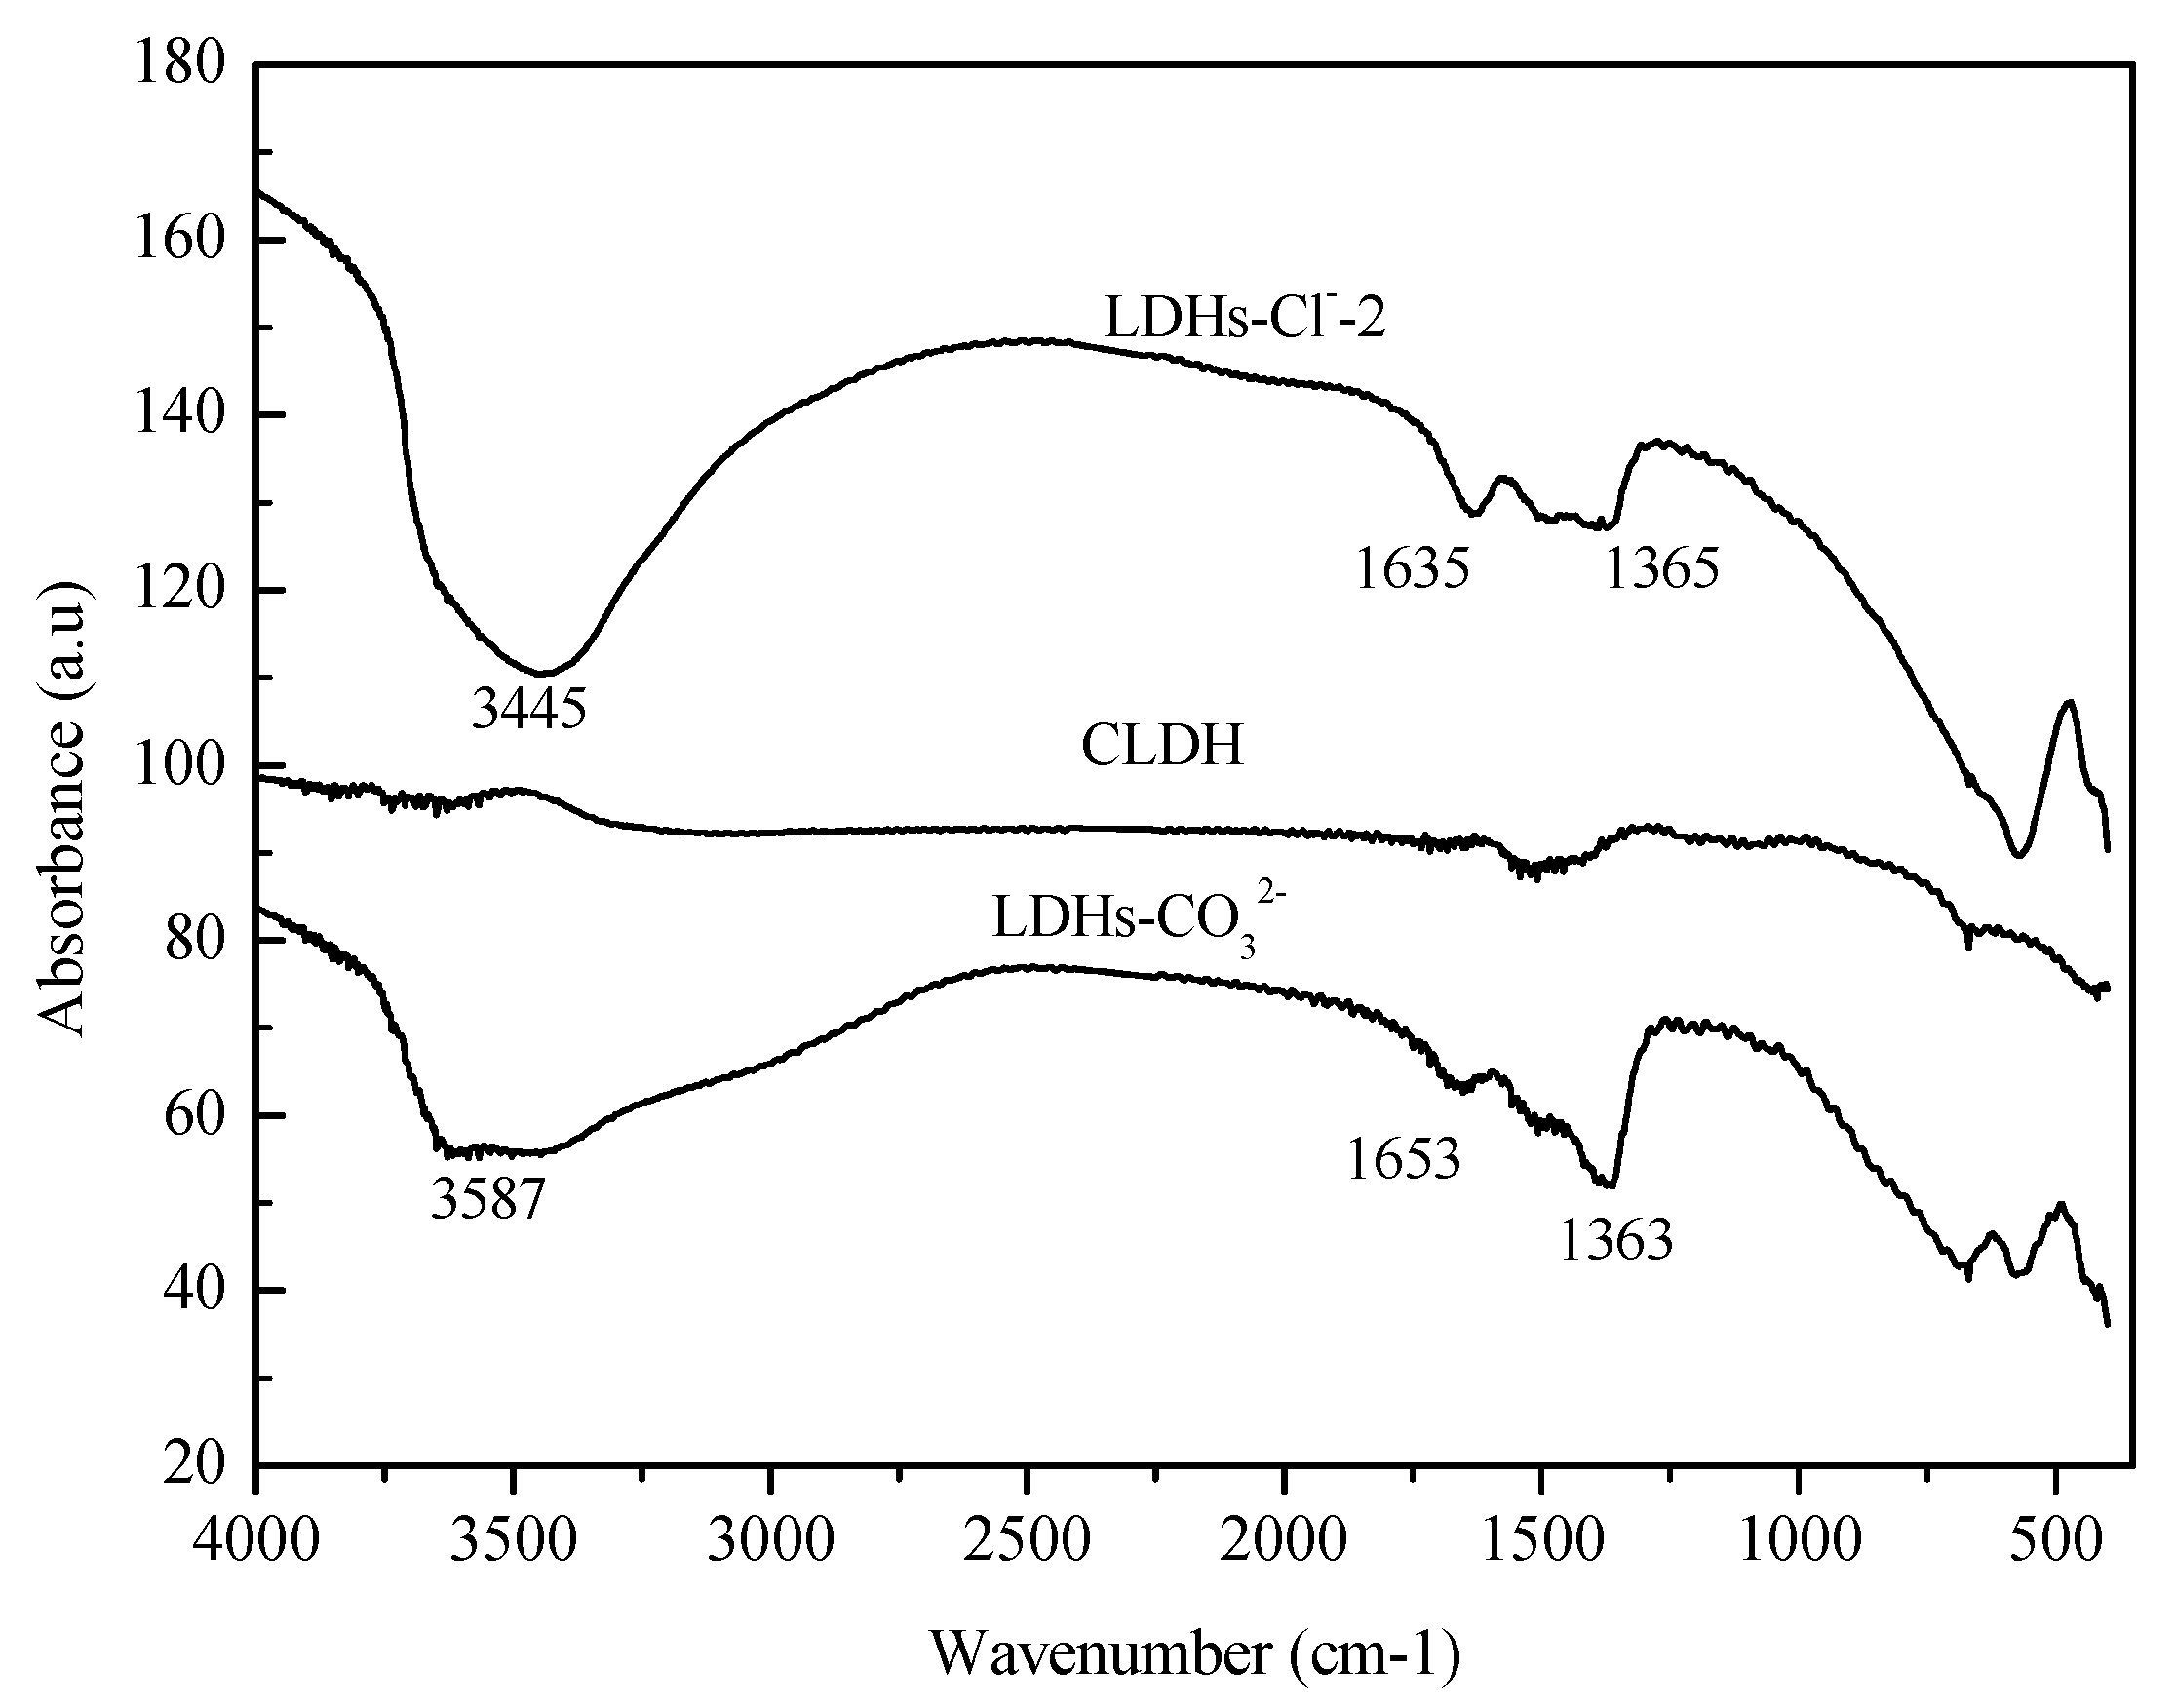
Figure 3.
FTIR patterns of Mg-Fe-Ti-LDHs.
Figure 3.
FTIR patterns of Mg-Fe-Ti-LDHs.
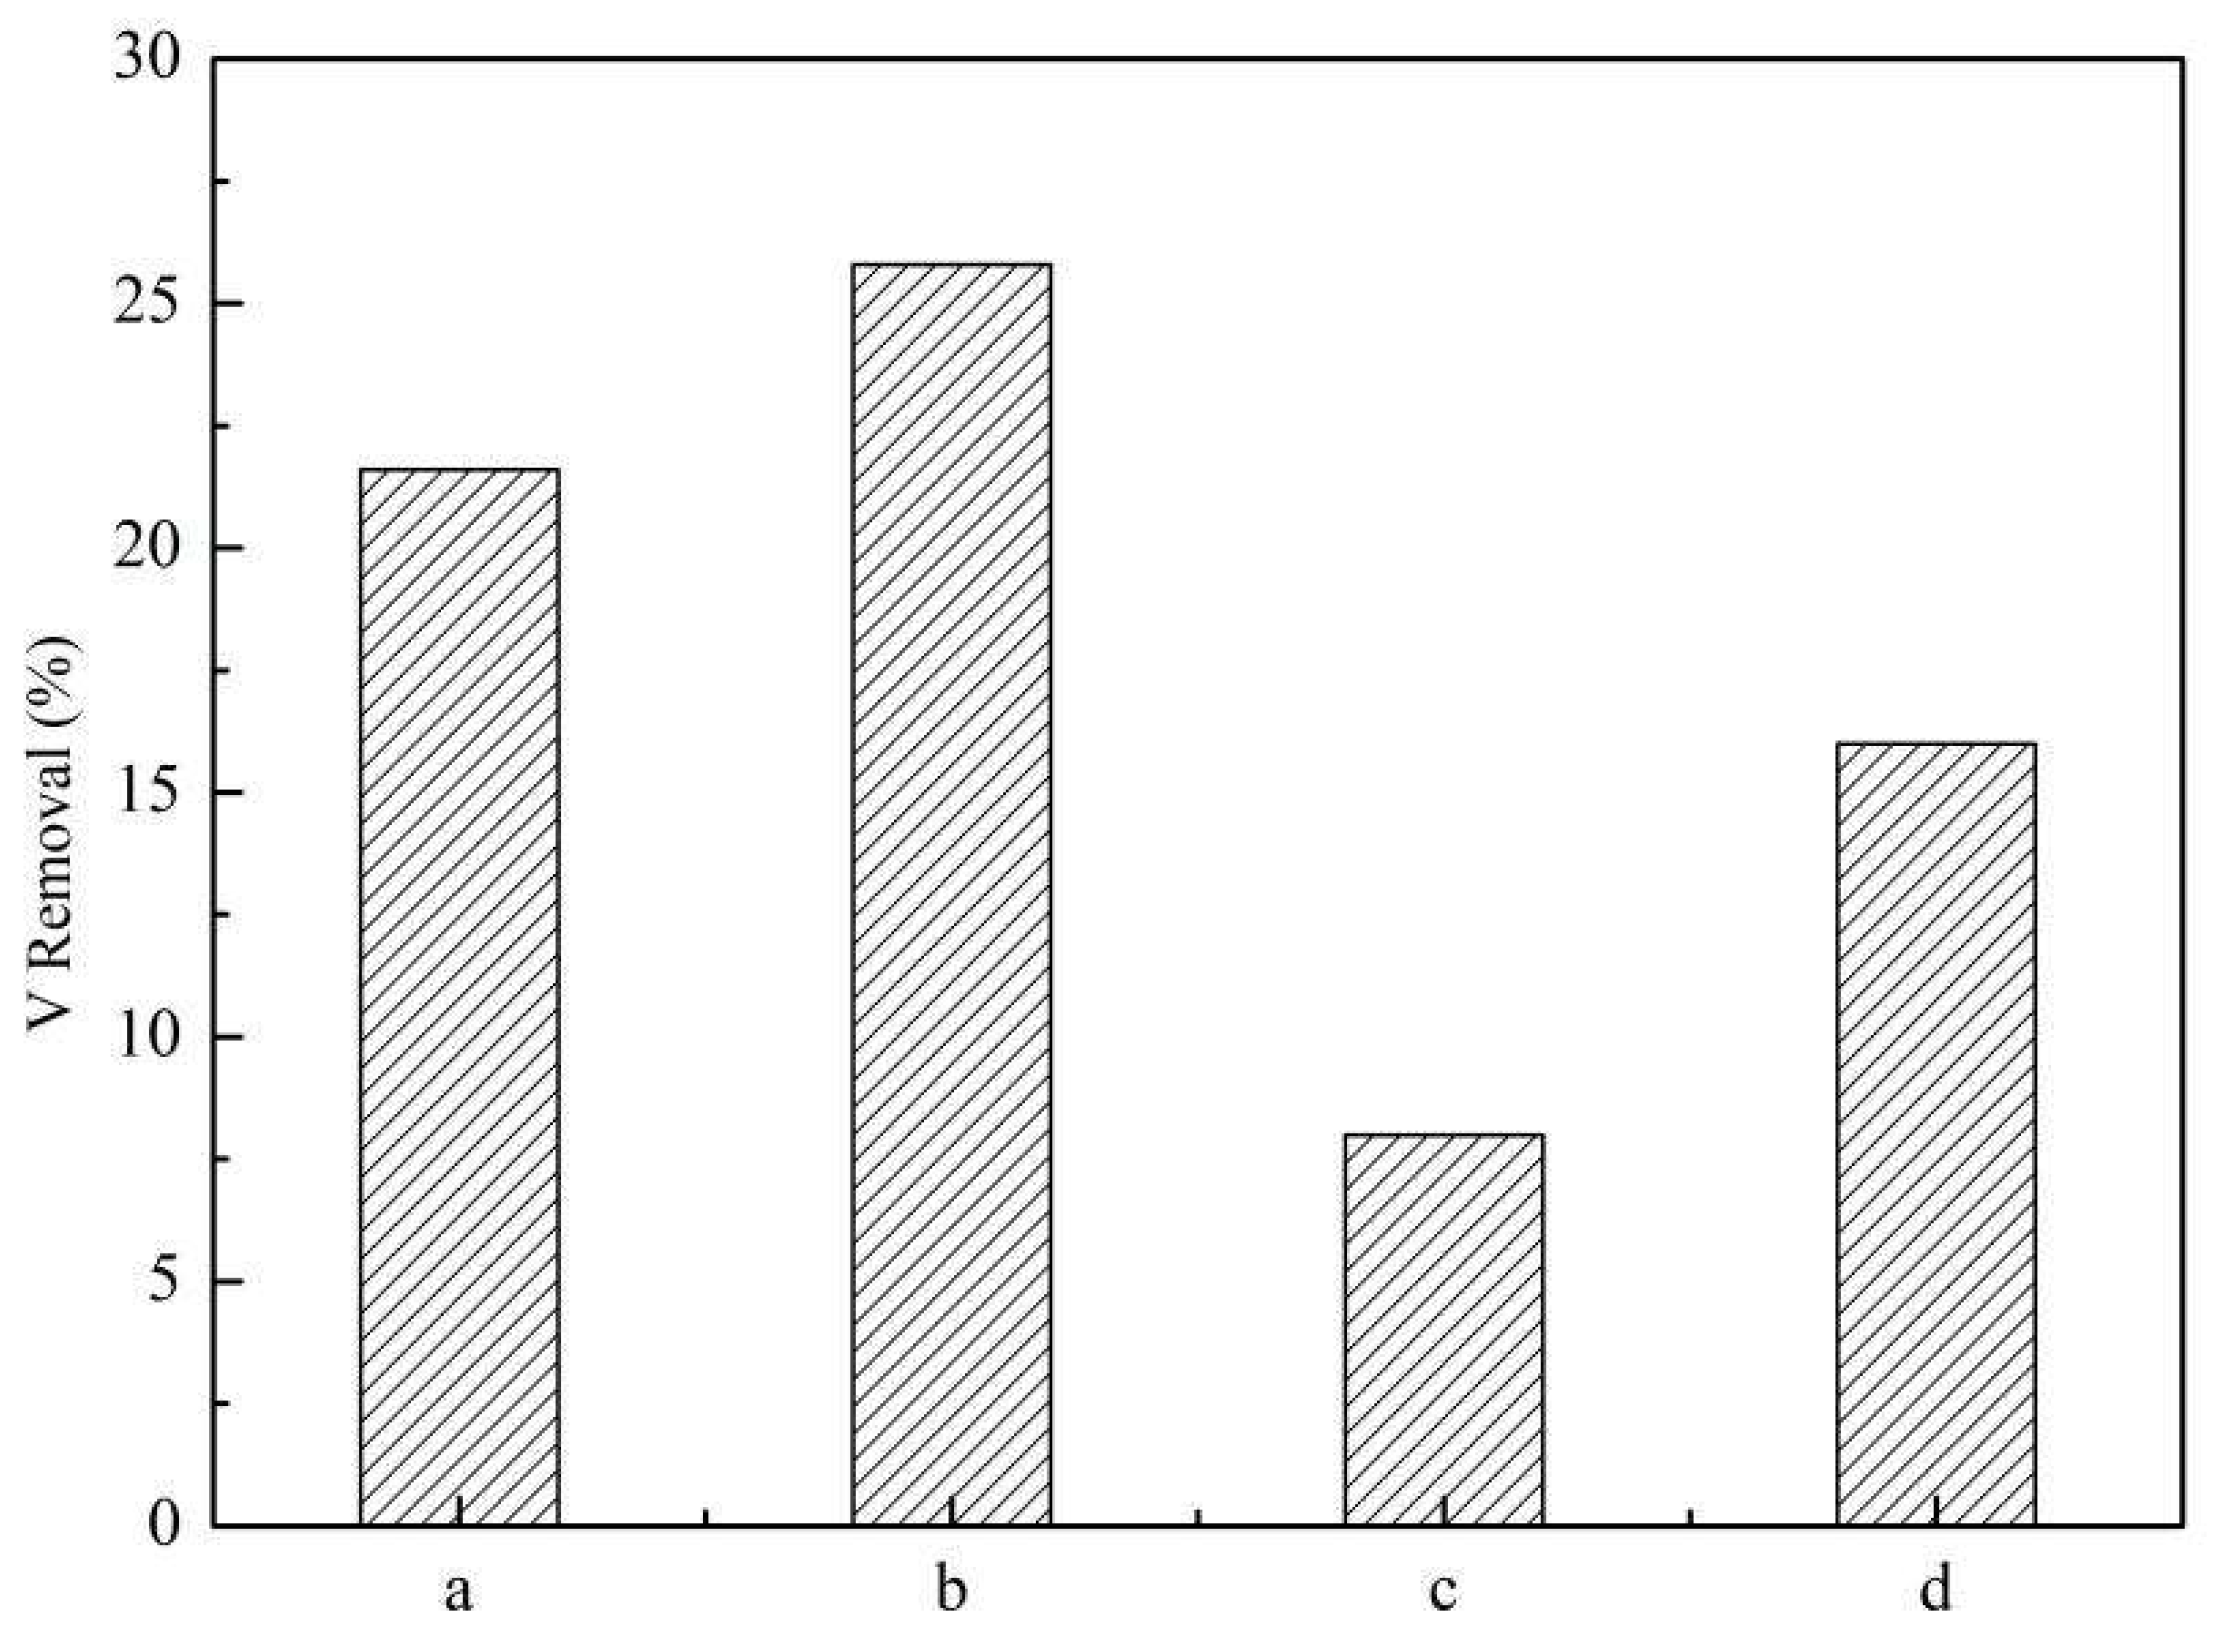
Figure 4.
Removal of vanadate by (a) Mg-Fe-Ti-LDHs-Cl-1, (b)Mg-Fe-Ti-LDHs-Cl-2, (c) Mg-Fe-Ti-LDHs-CO32− and (d) Mg-Fe-Ti-CLDH (experimental conditions: C0 = 50 mg/L, adsorbent dosage = 10 mg, pH = 5.0, contact time = 24 h, T = 298 K).
Figure 4.
Removal of vanadate by (a) Mg-Fe-Ti-LDHs-Cl-1, (b)Mg-Fe-Ti-LDHs-Cl-2, (c) Mg-Fe-Ti-LDHs-CO32− and (d) Mg-Fe-Ti-CLDH (experimental conditions: C0 = 50 mg/L, adsorbent dosage = 10 mg, pH = 5.0, contact time = 24 h, T = 298 K).
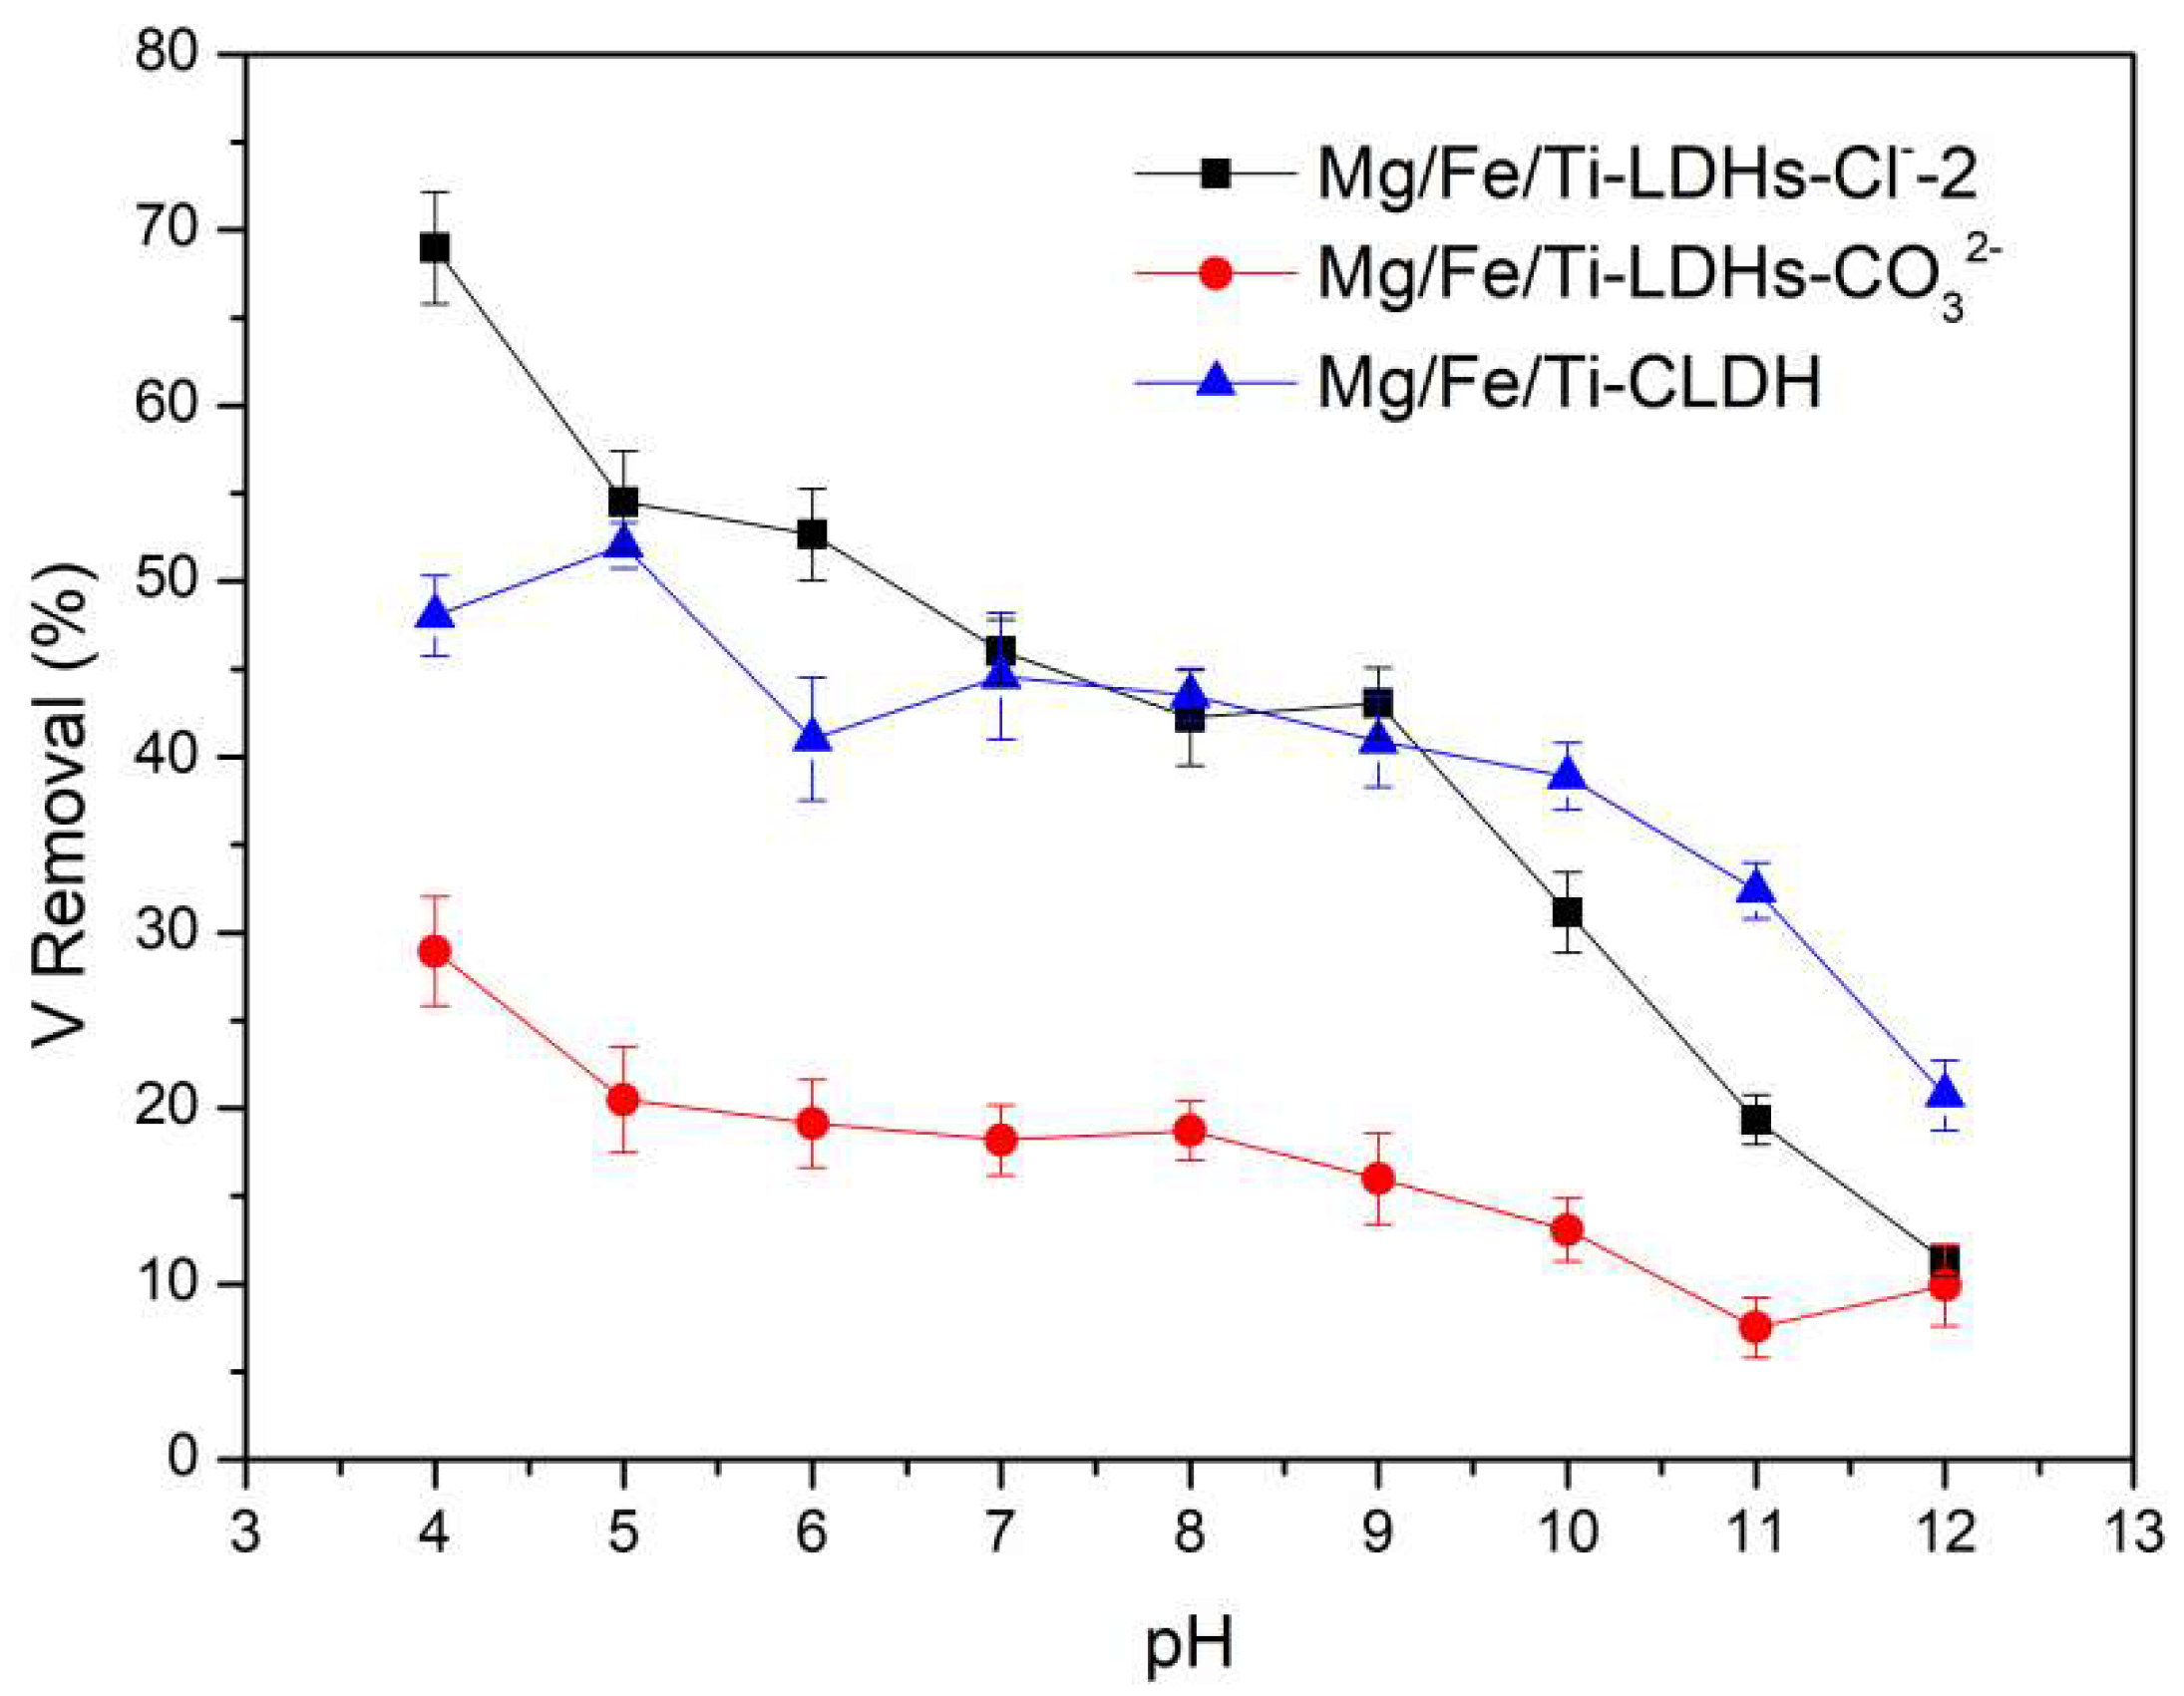
Figure 5.
Effects of initial solution pH on vanadate adsorption onto Mg-Fe-Ti-LDHs-Cl−-2, Mg-Fe-Ti-LDHs-CO32− and Mg-Fe-Ti-CLDH (experimental conditions: C0 = 10 mg/L, adsorbent dosage = 10 mg, pH = 4.0–12.0, contact time = 24 h, T = 298 K).
Figure 5.
Effects of initial solution pH on vanadate adsorption onto Mg-Fe-Ti-LDHs-Cl−-2, Mg-Fe-Ti-LDHs-CO32− and Mg-Fe-Ti-CLDH (experimental conditions: C0 = 10 mg/L, adsorbent dosage = 10 mg, pH = 4.0–12.0, contact time = 24 h, T = 298 K).
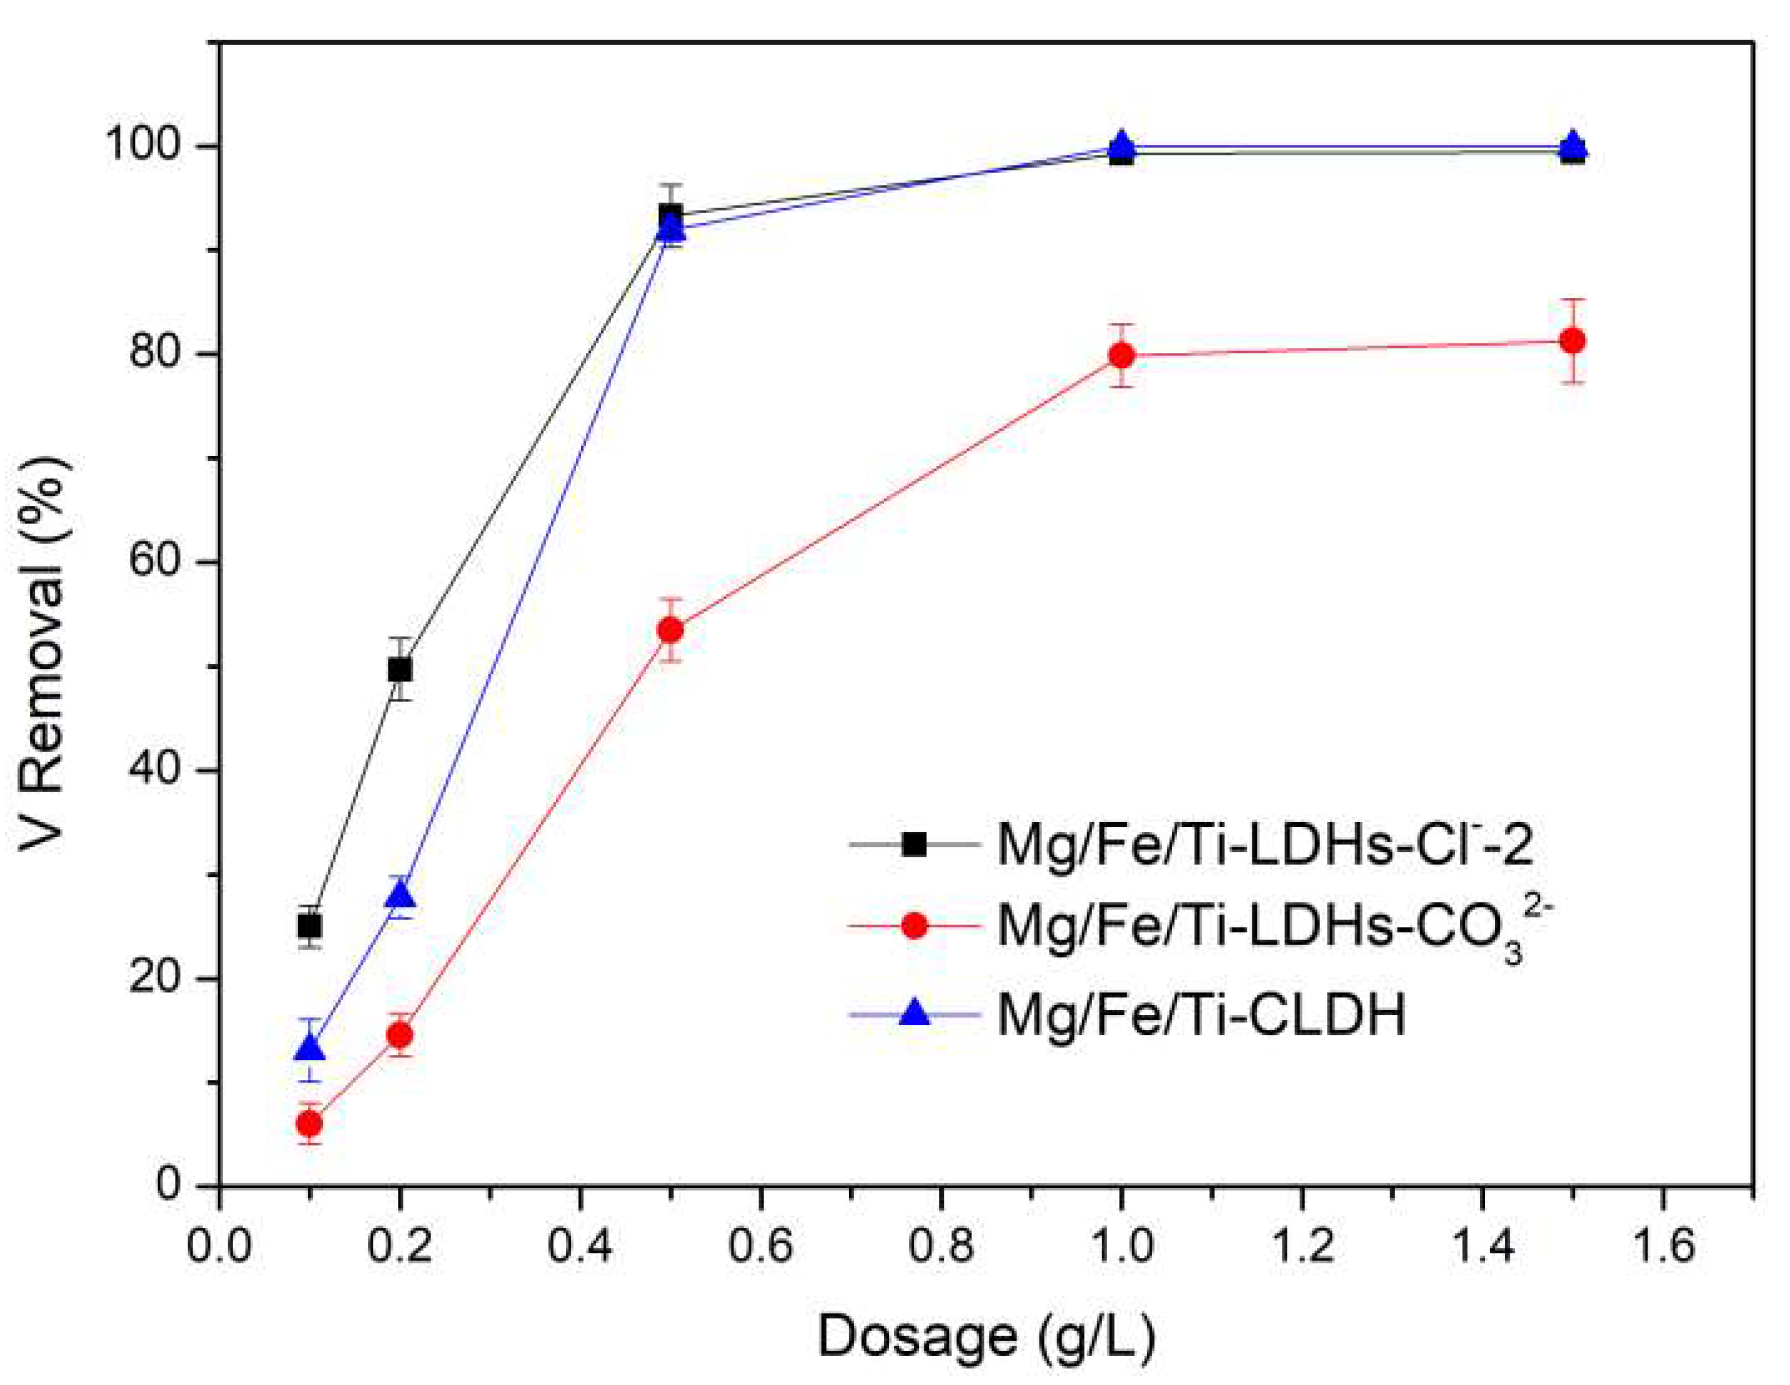
Figure 6.
Adsorbent dosage on vanadate adsorption onto Mg-Fe-Ti-LDHs-Cl−-2, Mg-Fe-Ti-LDHs-CO32− and Mg-Fe-Ti-CLDH (experimental conditions: C0 = 10 mg/L, adsorbent dosage = 5–75 mg, pH = 5, contact time = 24 h, T = 298 K).
Figure 6.
Adsorbent dosage on vanadate adsorption onto Mg-Fe-Ti-LDHs-Cl−-2, Mg-Fe-Ti-LDHs-CO32− and Mg-Fe-Ti-CLDH (experimental conditions: C0 = 10 mg/L, adsorbent dosage = 5–75 mg, pH = 5, contact time = 24 h, T = 298 K).
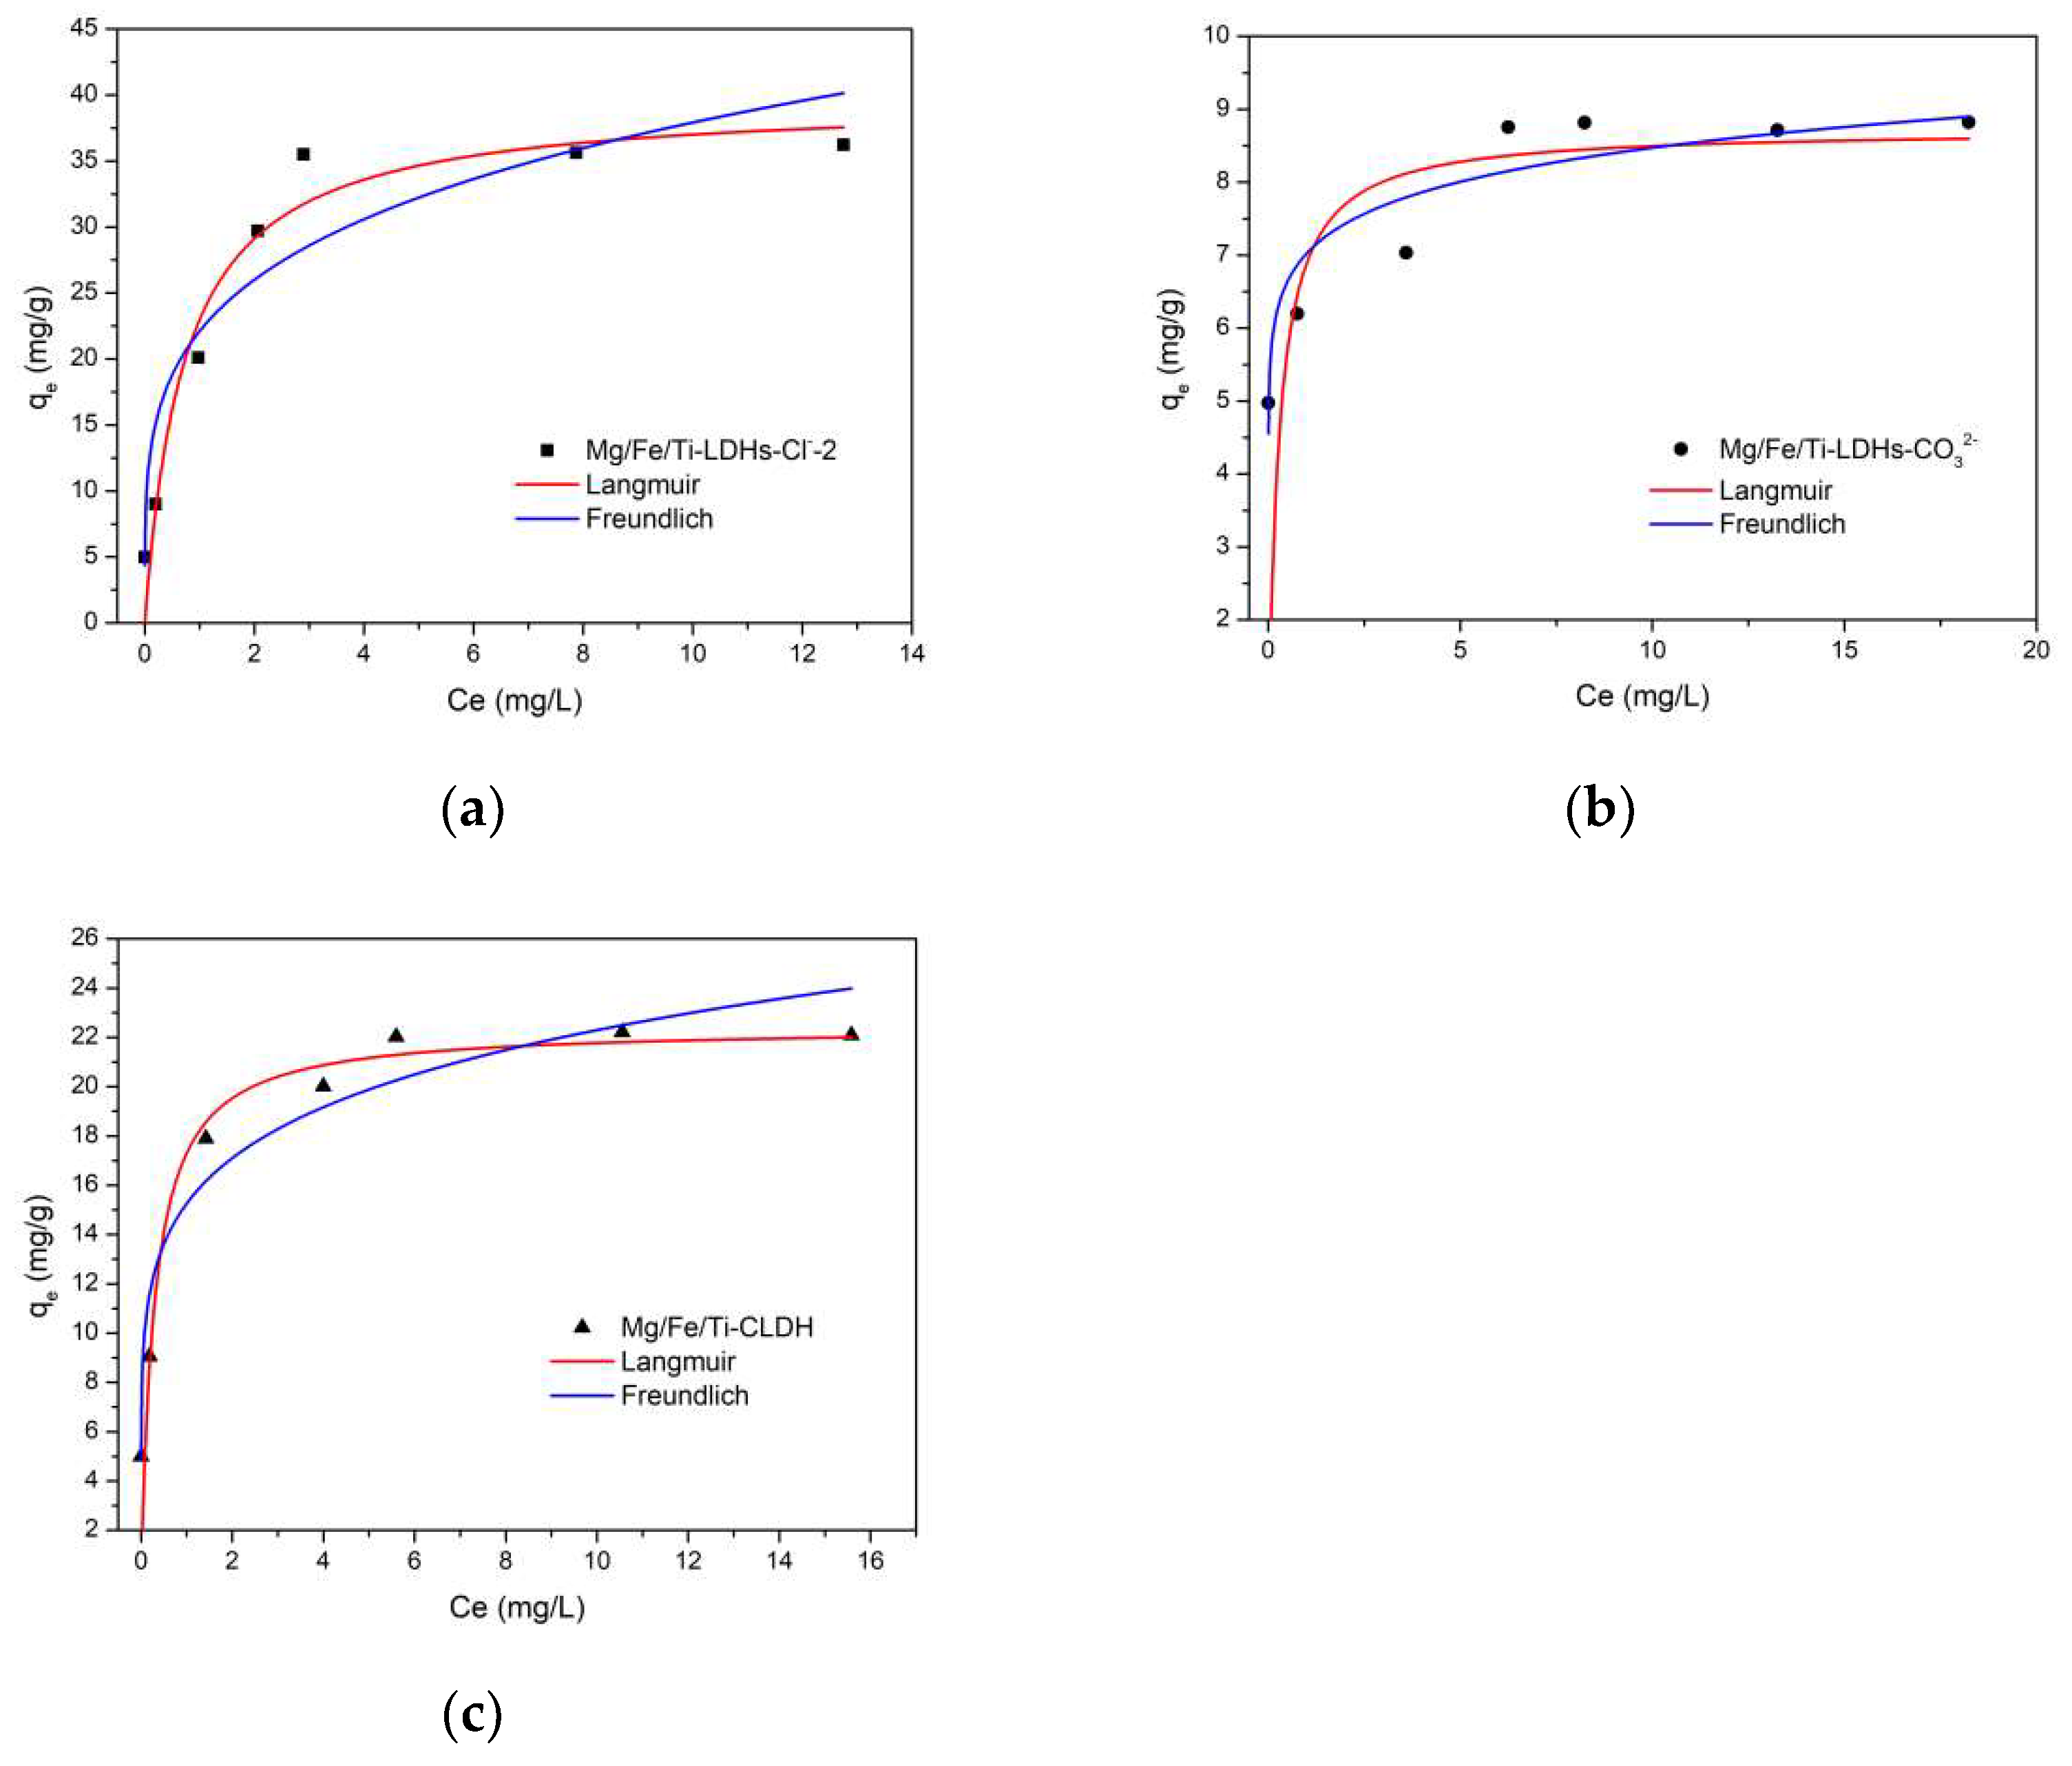
Figure 7.
Adsorption isotherms of vanadate on the synthesized Mg-Fe-Ti-LDHs-Cl—-2 (a), Mg-Fe-Ti-LDHs-CO32− (b) and Mg-Fe-Ti-CLDH (c) (experimental conditions: C0 = 1–20 mg/L, adsorbent dosage = 10 mg, pH = 5.0, contact time = 24 h, T = 298 K).
Figure 7.
Adsorption isotherms of vanadate on the synthesized Mg-Fe-Ti-LDHs-Cl—-2 (a), Mg-Fe-Ti-LDHs-CO32− (b) and Mg-Fe-Ti-CLDH (c) (experimental conditions: C0 = 1–20 mg/L, adsorbent dosage = 10 mg, pH = 5.0, contact time = 24 h, T = 298 K).
Figure 8.
Effect of contact time on vanadate adsorption onto Mg-Fe-Ti-LDHs-Cl−-2, Mg-Fe-Ti-LDHs-CO32− and Mg-Fe-Ti-CLDH (experimental conditions: C0 = 5 mg/L, adsorbent dosage = 10 mg, pH = 5.0, contact time = 10–480 min, T = 298 K).
Figure 8.
Effect of contact time on vanadate adsorption onto Mg-Fe-Ti-LDHs-Cl−-2, Mg-Fe-Ti-LDHs-CO32− and Mg-Fe-Ti-CLDH (experimental conditions: C0 = 5 mg/L, adsorbent dosage = 10 mg, pH = 5.0, contact time = 10–480 min, T = 298 K).
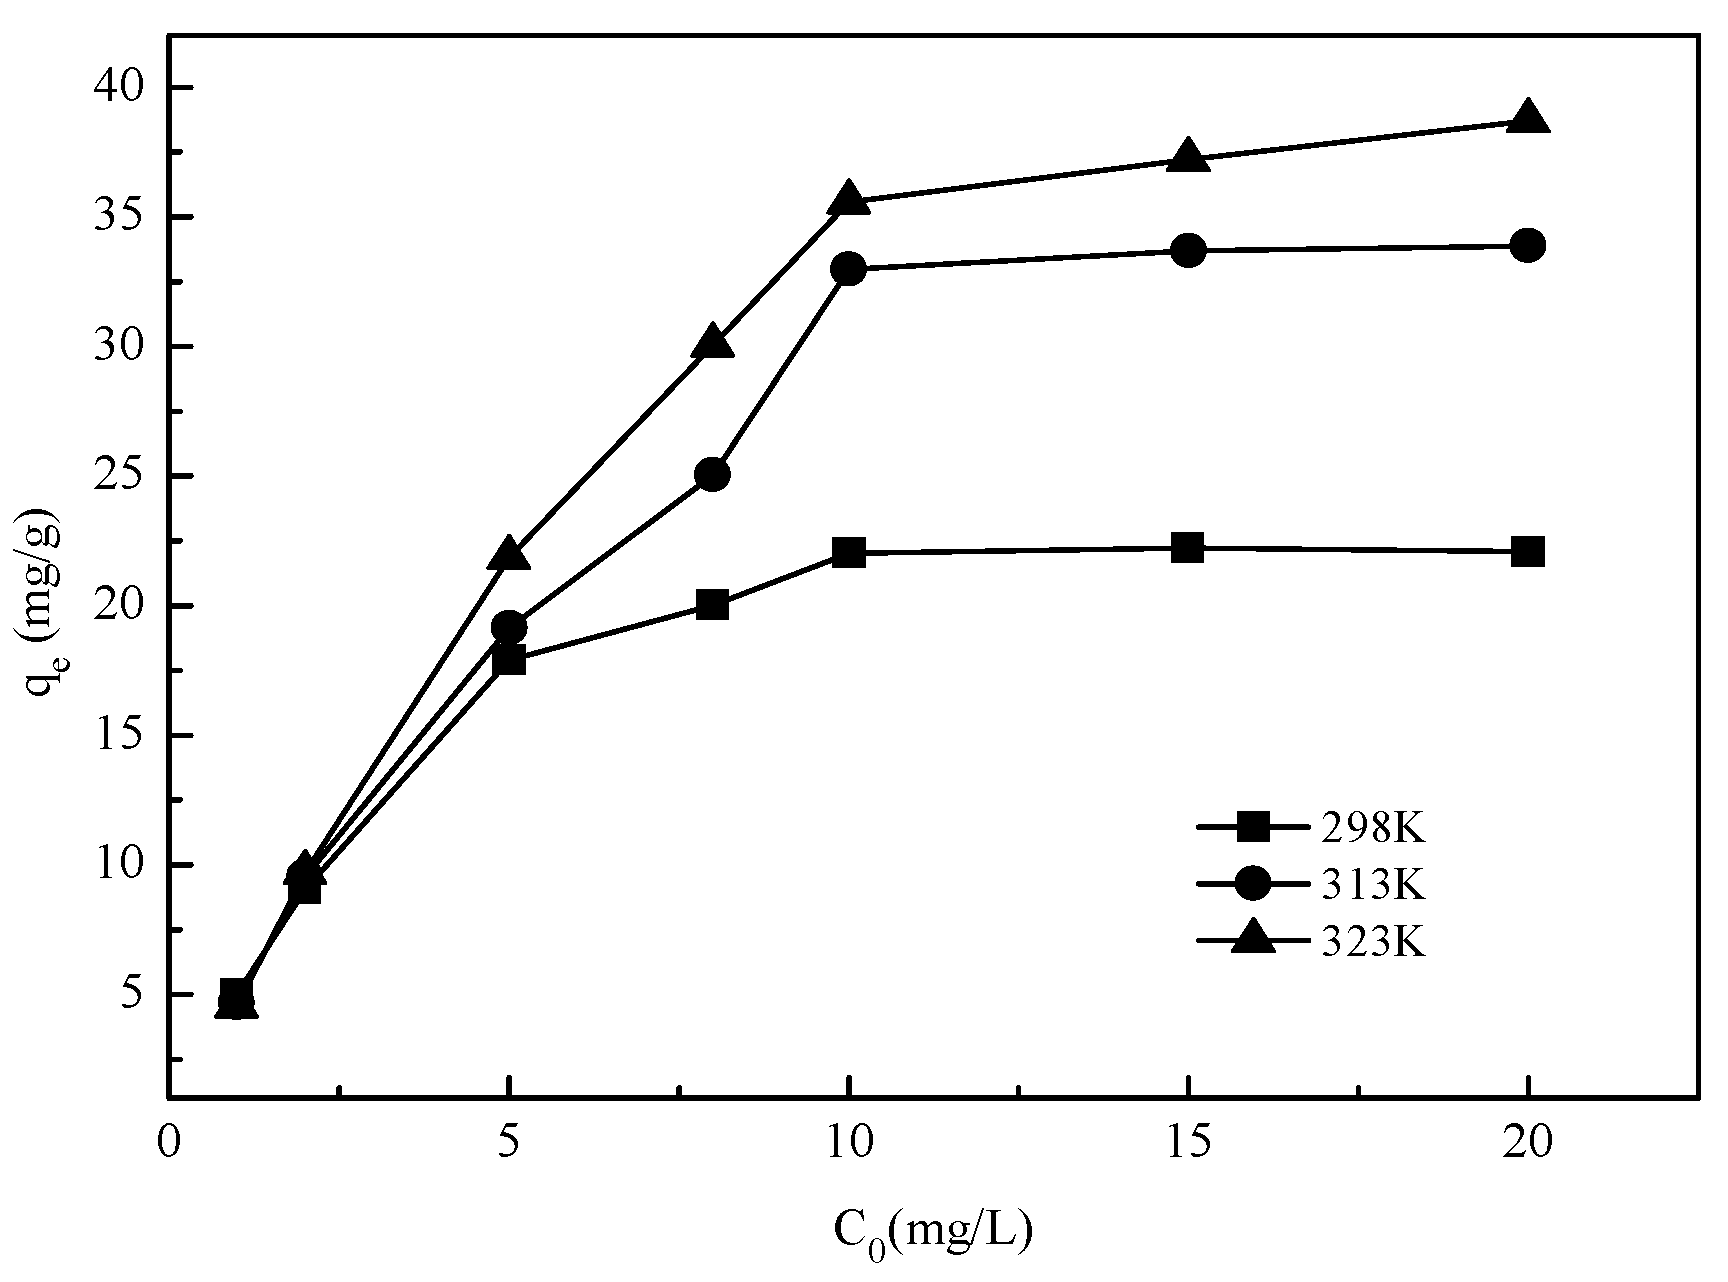
Figure 9.
Effect of temperature on vanadate adsorption onto Mg-Fe-Ti-CLDH (experimental conditions: C0 = 1–20 mg/L, adsorbent dosage = 10 mg, pH = 5.0, contact time = 24 h, T = 298–323 K).
Figure 9.
Effect of temperature on vanadate adsorption onto Mg-Fe-Ti-CLDH (experimental conditions: C0 = 1–20 mg/L, adsorbent dosage = 10 mg, pH = 5.0, contact time = 24 h, T = 298–323 K).
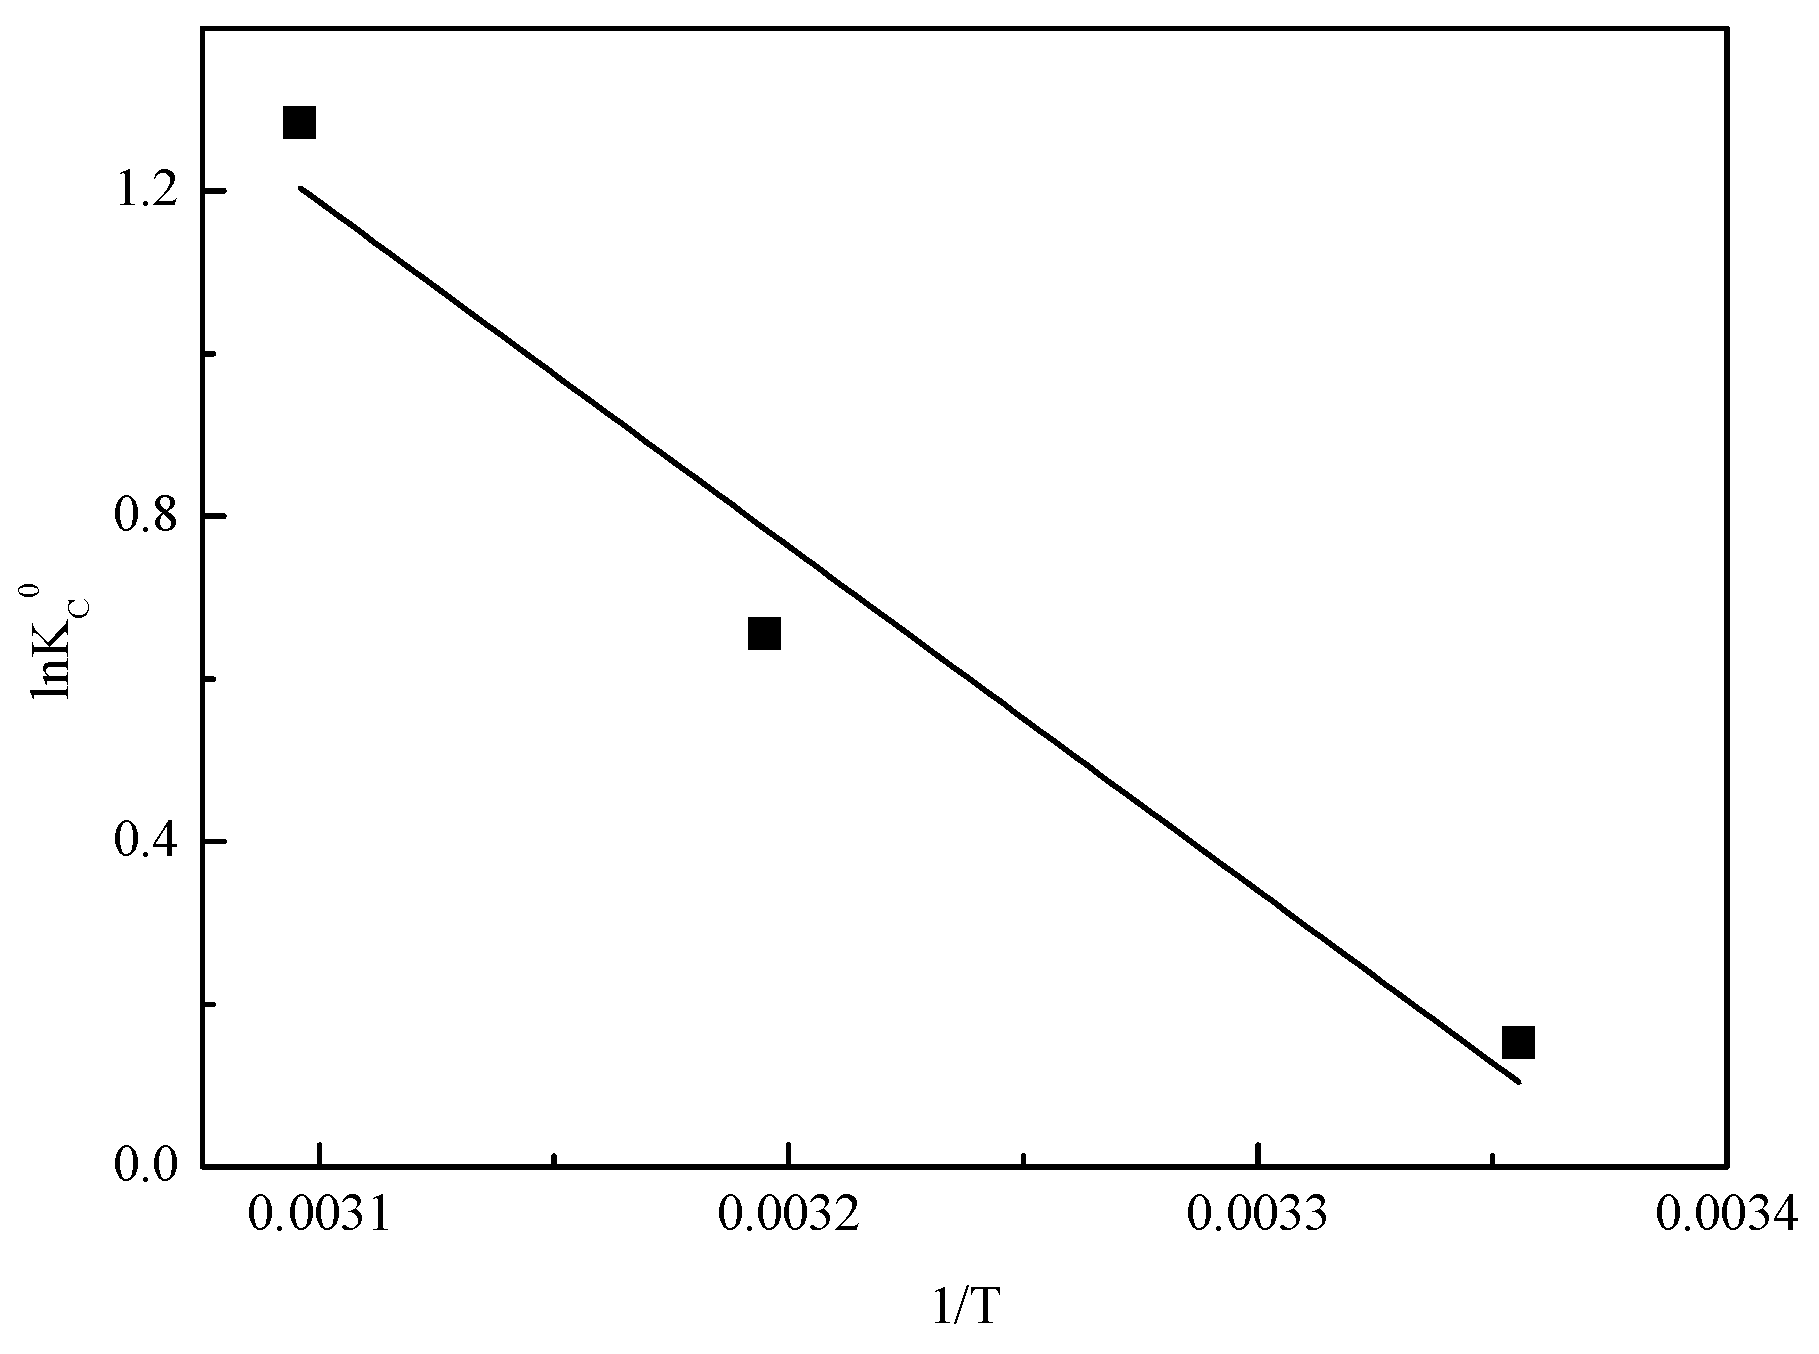
Figure 10.
Plot of lnKc0 versus 1/T on adsorption of VO3− onto Mg-Fe-Ti-CLDH.
Figure 10.
Plot of lnKc0 versus 1/T on adsorption of VO3− onto Mg-Fe-Ti-CLDH.
Figure 11.
XRD pattern of Mg-Fe-Ti-LDHs-Cl−-2, Mg-Fe-Ti-LDHs-CO32− and Mg-Fe-Ti-CLDH after vanadate adsorption.
Figure 11.
XRD pattern of Mg-Fe-Ti-LDHs-Cl−-2, Mg-Fe-Ti-LDHs-CO32− and Mg-Fe-Ti-CLDH after vanadate adsorption.
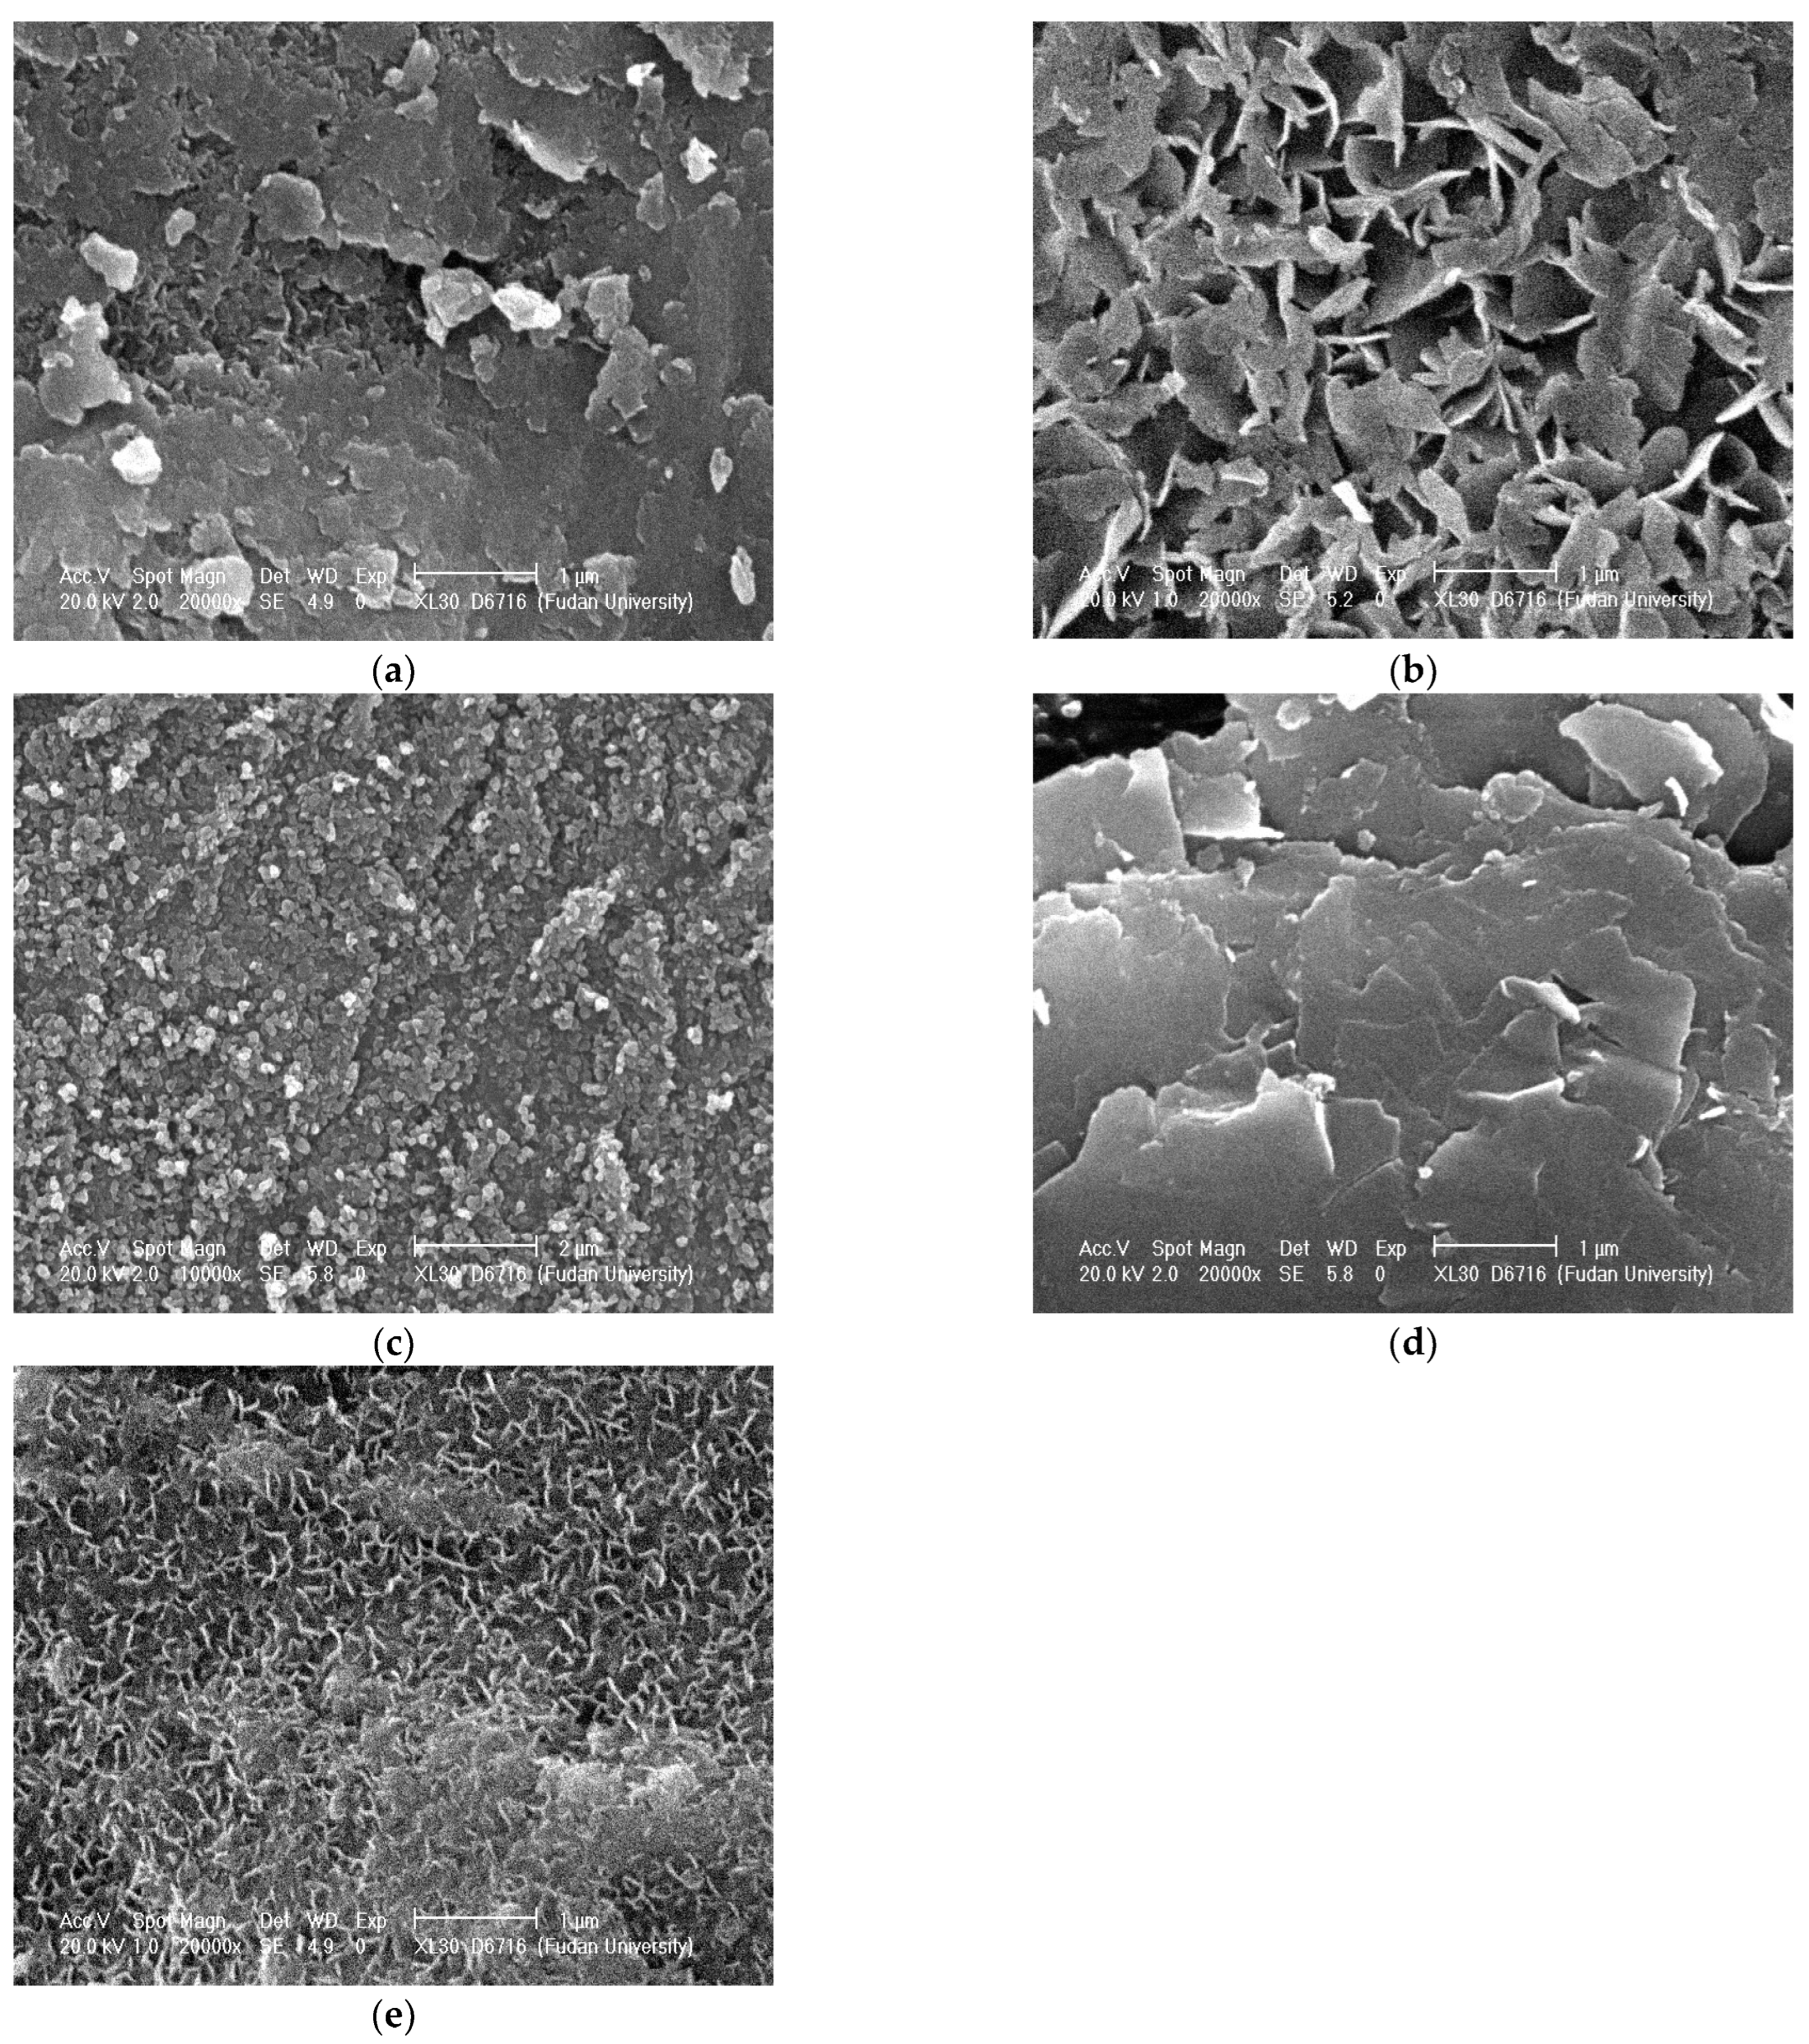
Figure 12.
The SEM images of Mg-Fe-Ti-LDHs before (a) Mg-Fe-Ti-LDHs-Cl−-2, (b) Mg-Fe-Ti-LDHs-CO32−, (c) Mg-Fe-Ti-CLDH) and after (d) Mg-Fe-Ti-LDHs-Cl−-2, (e) Mg-Fe-Ti-CLDH) vanadate adsorption.
Figure 12.
The SEM images of Mg-Fe-Ti-LDHs before (a) Mg-Fe-Ti-LDHs-Cl−-2, (b) Mg-Fe-Ti-LDHs-CO32−, (c) Mg-Fe-Ti-CLDH) and after (d) Mg-Fe-Ti-LDHs-Cl−-2, (e) Mg-Fe-Ti-CLDH) vanadate adsorption.
Table 1.
Adsorption isotherm models of VO3− adsorption onto Mg-Fe-Ti-LDHs-Cl−-2, Mg-Fe-Ti-LDHs-CO32− and Mg-Fe-Ti-CLDH.
Table 1.
Adsorption isotherm models of VO3− adsorption onto Mg-Fe-Ti-LDHs-Cl−-2, Mg-Fe-Ti-LDHs-CO32− and Mg-Fe-Ti-CLDH.
| LDHs Material | Langmuir Isotherm | Freundlich Isotherm |
|---|
| qm | KL | R2 | KF | 1/n | R2 |
|---|
| Mg-Fe-Ti-LDHs-Cl−-2 | 38.5 | 2.60 | 0.996 | 23.4 | 0.233 | 0.903 |
| Mg-Fe-Ti-LDHs-CO32− | 9.01 | 3.00 | 0.997 | 7.06 | 0.074 | 0.887 |
| Mg-Fe-Ti-CLDH | 22.8 | 4.40 | 0.999 | 15.1 | 0.168 | 0.958 |
Table 2.
Comparison of several reported adsorbents for vanadate.
Table 2.
Comparison of several reported adsorbents for vanadate.
| Adsorbent | qm | Reference |
|---|
| Mg-Fe-Ti-LDHs-Cl−-2 | 38.5 (mg/g) | This study |
| Mg-Fe-Ti-LDHs-CO32− | 9.01 (mg/g) | This study |
| Mg-Fe-Ti-CLDH | 22.8 (mg/g) | This study |
| γ-AlOOH | 3.61(mmol/g) | [32] |
| Silica | 81.0 (mg/kg) | [33] |
| HA + silica | 166.7 (mg/kg) | [34] |
| Fe(III)/Cr(III) hydroxide | 11.43 (mg/g) | [35] |
Table 3.
Adsorption kinetic models for vanadate adsorption by Mg-Fe-Ti-LDHs-Cl−-2, Mg-Fe-Ti-LDHs-CO32− and Mg-Fe-Ti-CLDH.
Table 3.
Adsorption kinetic models for vanadate adsorption by Mg-Fe-Ti-LDHs-Cl−-2, Mg-Fe-Ti-LDHs-CO32− and Mg-Fe-Ti-CLDH.
| LDHs Material | Pseudo-First Order Kinetic | Pseudo-Second Order Kinetic |
|---|
| k1 | qe,cal | R2 | k2 | qe | R2 |
|---|
| LDHs-Cl−-2 | 0.0021 | 11.0 | 0.954 | 0.005 | 17.5 | 0.999 |
| LDHs-CO32− | 0.01 | 4.33 | 0.996 | 0.005 | 6.99 | 0.998 |
| Mg-Fe-Ti-CLDH | 0.006 | 9.05 | 0.983 | 0.001 | 12.2 | 0.984 |
Table 4.
Adsorption thermodynamic for vanadate removal from Mg-Fe-Ti-CLDH.
Table 4.
Adsorption thermodynamic for vanadate removal from Mg-Fe-Ti-CLDH.
| ΔH° | ΔS° | ΔG° | R2 |
|---|
| 298 K | 313 K | 323 K |
|---|
| 35.2 | 0.119 | −0.378 | −1.71 | −3.45 | 0.960 |
Table 5.
Crystal parameters of Mg/Fe/Ti-LDHs-Cl−-2, Mg/Fe/Ti-LDHs-CO32− and Mg/Fe/Ti-CLDH after adsorption of VO3−.
Table 5.
Crystal parameters of Mg/Fe/Ti-LDHs-Cl−-2, Mg/Fe/Ti-LDHs-CO32− and Mg/Fe/Ti-CLDH after adsorption of VO3−.
| Material | d (003) (Å) | Metal-Metal Distance (a) (Å) | Interlayer Distance (c) (Å) |
|---|
| Mg-Fe-Ti-LDHs-Cl−-2 before adsorption | 8.06 | 3.11 | 24.2 |
| Mg-Fe-Ti-LDHs-Cl−-2 after adsorption | 7.99 | 3.11 | 24.0 |
| Mg-Fe-Ti-LDHs-CO32− before adsorption | 7.81 | 3.11 | 23.4 |
| Mg-Fe-Ti-LDHs-CO32− after adsorption | 7.87 | 3.11 | 23.6 |
| CLDH after adsorption | 7.86 | 3.11 | 23.6 |
Table 6.
Effect of coexisting ions on Mg-Fe-Ti-LDHs-Cl−-2, Mg-Fe-Ti-LDHs-CO32− and Mg-Fe-Ti-CLDH adsorption of VO3−.
Table 6.
Effect of coexisting ions on Mg-Fe-Ti-LDHs-Cl−-2, Mg-Fe-Ti-LDHs-CO32− and Mg-Fe-Ti-CLDH adsorption of VO3−.
| Materials | Vanadate Removal (%) |
|---|
| No Coexisting Ions | NO3− | SO42− | PO43− |
|---|
| LDHs-Cl−-2 | 80.4 | 67.6 | 60.7 | 45.1 |
| LDHs-CO32− | 28.1 | 26.1 | 24.5 | 10.7 |
| Mg-Fe-Ti-CLDH | 71.6 | 68.6 | 58.5 | 10.2 |
Table 7.
Desorption experiment of Mg-Fe-Ti-LDHs-Cl−-2 and Mg-Fe-Ti-LDHs-CO32−.
Table 7.
Desorption experiment of Mg-Fe-Ti-LDHs-Cl−-2 and Mg-Fe-Ti-LDHs-CO32−.
| LDHs Material | Desorption Solution | PO43− Concentration (mg/L) | Desorption Rate (%) |
|---|
| LDHs-Cl−-2 | Na3PO4 | 500 | 49.7 |
| LDHs-CO32− | Na3PO4 | 500 | 37.5 |


