
Analyzing the Benefit-Cost Ratio of Sediment Resources by Remote Sensing Data in the Ping River Basin, Thailand


Abstract
:1. Introduction
2. Study Area
3. Methods and Materials
4. Results
5. Discussion
6. Conclusions
Author Contributions
Funding
Institutional Review Board Statement
Informed Consent Statement
Data Availability Statement
Acknowledgments
Conflicts of Interest
References
- Carkovic, A.B.; Pastén, P.A.; Bonilla, C.A. Sediment composition for the assessment of water erosion and nonpoint source pollution in natural and fire–affected landscapes. Sci. Total Environ. 2015, 512–513, 26–35. [Google Scholar] [CrossRef]
- Han, L.; Wang, L.; Ding, X.; Wen, H.; Yuan, X.; Zhang, W. Similarity quantification of soil parametric data and sites using confidence ellipses. Geosci. Front. 2022, 13, 101280. [Google Scholar] [CrossRef]
- Liu, D.; Liu, H.; Wu, Y.; Zhang, W.; Wang, Y.; Santosh, M. Characterization of geo-material parameters: Gene concept and big data approach in geotechnical engineering. Geosystems Geoenvironment 2022, 1, 100003. [Google Scholar] [CrossRef]
- Zhang, W.; Gu, X.; Tang, L.; Yin, Y.; Liu, D.; Zhang, Y. Application of machine learning, deep learning and optimization algorithms in geoengineering and geoscience: Comprehensive review and future challenge. Gondwana Res. 2022, 109, 1–17. [Google Scholar] [CrossRef]
- Pimentel, D.; Kounang, N. Ecology of Soil Erosion in Ecosystems. Ecosystems 1998, 1, 416–426. [Google Scholar] [CrossRef]
- Durán Zuazo, V.H.; Rodríguez Pleguezuelo, C.R. Soil-erosion and runoff prevention by plant covers. A review. Agron. Sustain. Dev. 2008, 28, 65–86. [Google Scholar] [CrossRef] [Green Version]
- Gelagay, H.S.; Minale, A.S. Soil loss estimation using GIS and remote sensing techniques: A case of Koga watershed, Northwestern Ethiopia. Int. Soil Water Conserv. Res. 2016, 4, 126–136. [Google Scholar] [CrossRef] [Green Version]
- Noori, H.; Siadatmousavi, S.M.; Mojaradi, B. Assessment of sediment yield using RS and GIS at two sub-basins of Dez Watershed, Iran. Int. Soil Water Conserv. Res. 2016, 4, 199–206. [Google Scholar] [CrossRef] [Green Version]
- Renard, K.; Foster, G.; Weesies, G.; McCool, D.; Yoder, D. Predicting soil erosion by water: A guide to conservation planning with the Revised Universal Soil Loss Equation (RUSLE). USDA Agric. Handb. 1997, 703, 26–35. [Google Scholar]
- Chadli, K. Estimation of soil loss using RUSLE model for Sebou watershed (Morocco). Model. Earth Syst. Environ. 2016, 2, 51. [Google Scholar] [CrossRef] [Green Version]
- Sahu, A.; Baghel, T.; Sinha, M.K.; Ahmad, I.; Verma, M.K. Soil Erosion Modeling using Rusle and GIS on Dudhawa Catchment. Int. J. Appl. Environ. 2017, 12, 1147–1158. [Google Scholar]
- Panditharathne, D.L.D.; Abeysingha, N.S.; Nirmanee, K.G.S.; Mallawatantri, A. Application of Revised Universal Soil Loss Equation (RUSLE) model to assess soil erosion in “Kalu Ganga” River Basin in Sri Lanka. Appl. Environ. Soil Sci. 2019, 2019. 4037379. [Google Scholar] [CrossRef] [Green Version]
- Setegn, S.G.; Srinivasan, R.; Dargahi, B.; Melesse, A.M. Spatial delineation of soil erosion vulnerability in the Lake Tana Basin, Ethiopia. Hydrol. Process 2009, 23, 3738–3750. [Google Scholar] [CrossRef]
- Nigussie, T.; Fanta, A.; Melesse, A.M.; Quraishi, S. Modeling rainfall erosivity from daily rainfall events, Upper Blue Nile Basin, Ethiopia. In Nile River Basin; Springer: Berlin/Heidelberg, Germany, 2014; pp. 307–335. [Google Scholar]
- Esmali Ouri, A.; Golshan, M.; Janizadeh, S.; Cerdà, A.; Melesse, A.M. Soil Erosion Susceptibility Mapping in Kozetopraghi Catchment, Iran: A Mixed Approach Using Rainfall Simulator and Data Mining Techniques. Land 2020, 9, 368. [Google Scholar] [CrossRef]
- Gebreslassie, H.G.; Melesse, A.M.; Bishop, K.; Gebremariam, A.G. Linear spectral unmixing algorithm for modelling suspended sediment concentration of flash floods, upper Tekeze River, Ethiopia. Int. J. Sediment Res. 2020, 35, 79–90. [Google Scholar] [CrossRef]
- Rangsiwanichpong, P.; Kazama, S.; Gunawardhana, L. Assessment of sediment yield in Thailand using revised universal soil loss equation and geographic information system techniques. River Res. Appl. 2018, 34, 1113–1122. [Google Scholar] [CrossRef]
- Chuenchum, P.; Xu, M.; Tang, W. Estimation of soil erosion and sediment yield in the Lancang-Mekong River using the Modified Revised Universal Soil Loss Equation and GIS techniques. Water 2020, 12, 135. [Google Scholar] [CrossRef] [Green Version]
- Chuenchum, P.; Xu, M.; Tang, W. Predicted trends of soil erosion and sediment yield from future land use and climate change scenarios in the Lancang–Mekong River by using the modified RUSLE model. Int. Soil Water Conserv. Res. 2020, 8, 213–227. [Google Scholar] [CrossRef]
- Junakova, N.; Junak, J. Alternative reuse of bottom sediments in construction material: Overview. IOP Conf. Ser. Mater. Sci. Eng. 2019, 549, 012038. [Google Scholar] [CrossRef]
- Millrath, K.; Kozlova, S.; Shimanovich, S.; Meyer, C. Beneficial Use of Dredge Material; Progress report prepared for Echo Environmental, Inc.: New York, NY, USA, 2001. [Google Scholar]
- Hamer, K.; Hadeler, A.; Muschalla, T.; Schroter, J.; Timmer, G. Light weight aggregates made from dredged harbour sediments. Leaching behaviour of inorganic pollutants and constructional characteristics. J. Soils Sediments 2003, 4, 284–291. [Google Scholar] [CrossRef]
- Chen, H.J.; Yang, M.D.; Tang, C.W.; Wang, S.Y. Producing synthetic lightweight aggregates from reservoir sediments. Constr. Build Mater. 2012, 28, 387–394. [Google Scholar] [CrossRef]
- Mezencevova, A.; Yeboah, N.N.; Burns, S.E.; Kahn, L.F.; Kurtis, K.E. Utilization of Savannah harbor river sediment as the primary raw material in production of fired brick. J. Environ. Manag. 2012, 113, 128–136. [Google Scholar] [CrossRef] [PubMed]
- Cappuyns, V.; Deweirt, V.; Rousseau, S. Dredged Sediments as a Resource for Brick Production: Possibilities and Barriers from a Consumers’ Perspective. Waste Manag. 2015, 38, 372–380. [Google Scholar] [CrossRef] [PubMed]
- Romero, M.; Andrés, A.; Alonso, R.; Viguri, J.; Rincón, J.M. Valorisation of contaminated marine sediments to produce ceramic construction materials. In Proceedings of the 1st Spanish National Conference on Advances in Materials Recycling and Eco—Energy, Madrid, Spain, 12–13 November 2009. [Google Scholar]
- Kazi Aoual-Benslafa, F.; Kerdal, D.; Ameur, M.; Mekerta, B.; Semcha, A. Durability of mortars made with dredged sediments. Procedia Eng. 2015, 118, 240–250. [Google Scholar] [CrossRef] [Green Version]
- Junakova, N.; Junak, J. Sustainable use of reservoir sediment through partial application in building material. Sustainability 2017, 9, 852. [Google Scholar] [CrossRef] [Green Version]
- Joseph, S.; McGarry, B.; Sajjakulnukit, B.; Sopchokchai, O. A study of Brick Production in Thailand (Issues on Women, Energy, and Environment). TDRI Q. Rev. 1990, 5, 11–15. [Google Scholar]
- Rangsiwanichpong, P.; Kazama, S.; Ekkawatpanit, C.; Gunawardhana, L. Evaluation of Cost and Benefit of Sediment based on Landslide and Erosion Models. Catena 2019, 173, 194–206. [Google Scholar] [CrossRef]
- JICA. The Feasibility Study on Mangrove Revival and Extension Project in the Kingdom of Thailand; Final Report; Agency (JICA), Japan International Cooperation: Tokyo, Japan, 2000. [Google Scholar]
- Wood, S.H.; Ziegler, A. Floodplain sediment from a 100-year-recurrence flood in 2005 of the Ping River in northern Thailand. Hydrol. Earth Syst. Sci. 2008, 12, 959–973. [Google Scholar] [CrossRef] [Green Version]
- Wuthiwongtyothin, S. Investigating statistical bias correction with temporal subsample of the upper Ping River Basin, Thailand. J. Water Clim. Change 2021, 12, 1631–1653. [Google Scholar] [CrossRef]
- Sharma, D.; Gupta, A.D.; Babel, M. Spatial disaggregation of bias-corrected GCM precipitation for improved hydrologic simulation: Ping River Basin, Thailand. Hessd 2007, 11, 1373–1390. [Google Scholar] [CrossRef] [Green Version]
- Thomas, D.E. Developing watershed management organizations in pilot sub-basins of the Ping river basin; Final Report; Office of Natural Resources and Environmental Policy and Planning, Ministry of Natural Resources and Environment: Bangkok, Thailand, 2005. [Google Scholar]
- Erosivity Factor Equation for Thailand, Land Development of Thailand. Available online: https://www.ldd.go.th/Efiles_project/ldd_plannig/erosion/Erosion_recommModel.html (accessed on 7 March 2022).
- Schwegler, P. Economic Valuation of Environmental Costs of Soil Erosion and the Loss of Biodiversity and Ecosystem Services Caused by Food Wastage. Master’s Thesis, ETH Zürich, Zürich, Switzerland, 2014. [Google Scholar]
- Wischmeier, W.H.; Smith, D.D. Predicting Rainfall Erosion Losses: Guide to Conservation Planning; U.S. Department of Agriculture: Washington, DC, USA, 1978. [Google Scholar]
- Farhan, Y.; Zregat, D.; Farhan, I. Spatial estimation of soil erosion risk using RUSLE approach, RS, and GIS techniques: A case study of Kufranja watershed, Northern Jordan. J. Water Resour. Prot. 2013, 5, 1247–1261. [Google Scholar] [CrossRef] [Green Version]
- Wagari, M.; Tamiru, H. RUSLE model based annual soil loss quantification for soil erosion protection: A case of Fincha Catchment, Ethiopia. Air Soil Water Res. 2021, 14, 11786221211046234. [Google Scholar] [CrossRef]
- Hateffard, F.; Mohammed, S.; Alsafadi, K.; Enaruvbe, G.O.; Heideri, A.; Abdo, H.G.; Rodrigo-Comino, J. CMIP5 climate projections and RUSLE-based soil erosion assessment in the central part of Iran. Sci. Rep. 2021, 11, 17. [Google Scholar] [CrossRef]
- Boussadia-Omari, L.; Ouillon, S.; Hirche, A.; Salamani, M.; Guettoche, M.S.; Ihaddaden, A.; Nedjraoui, D. Contribution of phytoecological data to spatialize soil erosion: Application of the RUSLE model in the Algerian atlas. Int. Soil Water Conserv. Res. 2021, 9, 502–519. [Google Scholar] [CrossRef]
- Kongkhiaw, P.; Yossapol, C.; Tantemsapya, N.; Tran, C.N.; Tanang, S. Quantification prediction soil losses in Nakhon Ratchasima, Thailand. Naresuan Univ. J. Sci. Technol. 2021, 29, 78–95. [Google Scholar]
- Tsegaye, L.; Bharti, R. Soil erosion and sediment yield assessment using RUSLE and GIS-based approach in Anjeb watershed, Northwest Ethiopia. SN Appl. Sci. 2021, 3, 19. [Google Scholar] [CrossRef]
- Sirikaew, U.; Seeboonruang, U.; Tanachaichoksirikun, P.; Wattanasetpong, J.; Chulkaivalsucharit, V.; Chen, W. Impact of Climate Change on Soil Erosion in the Lam Phra Phloeng Watershed. Water 2020, 12, 3527. [Google Scholar] [CrossRef]
- Thapa, P. Spatial estimation of soil erosion using RUSLE modeling: A case study of Dolakha district, Nepal. Environ. Syst. Res. 2020, 9, 10. [Google Scholar] [CrossRef]
- Rajbanshi, J.; Bhattacharya, S. Assessment of soil erosion, sediment yield and basin specific controlling factors using RUSLE-SDR and PLSR approach in Konar river basin, India. J. Hydrol. 2020, 587, 124935. [Google Scholar] [CrossRef]
- Olorunfeni, I.E.; Komolafe, A.A.; Fasinmirin, J.T.; Olufayo, A.A.; Akande, S.O. A GIS-based assessment of the potential soil erosion and flood hazard zones in Ekiti State, Southwestern Nigeria using integrated RUSLE and HAND models. Catena 2020, 194, 15. [Google Scholar]
- Hu, S.; Li, L.; Chen, L.; Cheng, L.; Yuan, L.; Huang, X.; Zhang, T. Estimation of Soil Erosion in the Chaohu Lake Basin through Modified Soil Erodibility Combined with Gravel Content in the RUSLE Model. Water 2019, 11, 1806. [Google Scholar] [CrossRef] [Green Version]
- Kidane, M.; Bezie, A.; Kesete, N.; Tolessa, T. The impact of land use and land cover (LULC) dynamics on soil erosion and sediment yield in Ethiopia. Heliyon 2019, 5, 13. [Google Scholar] [CrossRef] [PubMed] [Green Version]
- Belayneh, M.; Yirgu, T.; Tsegaye, D. Potential soil erosion estimation and area prioritization for better conservation planning in Gumara watershed using RUSLE and GIS techniques’. Environ. Syst. Res. 2019, 8, 17. [Google Scholar] [CrossRef] [Green Version]
- Woldemariam, G.W.; Iguala, A.D.; Tekalign, S.; Reddy, R.U. Spatial Modeling of Soil Erosion Risk and Its Implication for Conservation Planning: The Case of the Gobele Watershed, East Hararghe Zone, Ethiopia. Land 2018, 7, 25. [Google Scholar] [CrossRef] [Green Version]
- El Jazouli, A.; Barakat, A.; Ghafiri, A.; El Moutaki, S.; Ettaqy, A.; Khellouk, R. Soil erosion modeled with USLE, GIS, and remote sensing: A case study of Ikkour watershed in Middle Atlas (Morocco). Geosci. Lett. 2017, 4, 12. [Google Scholar] [CrossRef] [Green Version]
- Ganasri, B.P.; Ramesh, H. Assessment of soil erosion by RUSLE model using remote sensing and GIS—A case study of Nethravathi Basin. Geosci. Front. 2016, 7, 953–961. [Google Scholar] [CrossRef] [Green Version]
- Baharawi, J.A.; Elhag, M.; Aldhebiani, A.Y.; Galal, H.K.; Hegazy, A.K.; Alghailani, E. Soil erosion estimation using remote sensing techniques in Wadi Yalamlam Basin, Saudi Arabia. Adv. Mater. Sci. Eng. 2016, 8, 9585962. [Google Scholar]
- Bahadur, K.C.K. Mapping soil erosion susceptibility using remote sensing and GIS: A case of the Upper Nam Wa Watershed, Nan Province, Thailand. Environ. Geol. 2009, 57, 695–705. [Google Scholar] [CrossRef]
- Nam, P.T.; Yang, D.; Kanae, S.; Oki, T.; Musiake, K. Global soil loss estimate using RUSLE model: The use of global spatial datasets on estimating erosive parameters. Geoinformatics 2003, 14, 49–53. [Google Scholar] [CrossRef] [Green Version]
- Bowker, M.A.; Belnap, J.; Chaudhary, V.B.; Johnson, N.C. Revisiting classic water erosion models in drylands: The strong impact of biological soil crusts. Soil Biol. Biochem. 2008, 40, 2309–2319. [Google Scholar] [CrossRef]
- Ostovari, Y.; Moosavi, A.A.; Mozaffari, H.; Poppiel, R.R.; Tayebi, M.; Dematte, J.A.M. Soil Erodibility and Its Influential Factors in the Middle East, Computers in Earth and Environmental Sciences; Elsevier: Amsterdam, The Netherlands, 2022; pp. 441–454. [Google Scholar]
- Goldscheider, N.; Chen, Z.; Auler, A.S.; Bakalowicz, M.; Broda, S.; Drew, D.; Hartman, J.; Jiang, G.; Moosdorf, N.; Stevanovic, Z.; et al. Global distribution of carbonate rocks and karst water resources. Hydrogeol. J. 2020, 28, 1661–1677. [Google Scholar] [CrossRef] [Green Version]
- Clements, R.; Sodhi, N.S.; Schilthuizen, M.; Ng, P.K.L. Limestone Karsts of Southeast Asia: Imperiled Arks of Biodiversity. Bioscience 2006, 56, 733–742. [Google Scholar] [CrossRef] [Green Version]
- Pham, T.G.; Degener, J.; Kappas, M. Integrated universal soil loss equation (USLE) and Geographical Information System (GIS) for soil erosion estimation in A Sap basin: Central Vietnam. Int. Soil Water Conserv. Res. 2018, 6, 99–110. [Google Scholar] [CrossRef]
- Nut, N.; Mihara, M.; Jeong, J.; Ngo, B.; Sigua, G.; Prasad, P.V.V.; Reyes, M.R. Land Use and Land Cover Changes and Its Impact on Soil Erosion in Stung Sangkae Catchment of Cambodia. Sustainability 2021, 13, 9276. [Google Scholar] [CrossRef]
- Sediment Price for Each Province of Thailand, Ministry of Commerce (Thailand). Available online: https://data.moc.go.th/OpenData/CSIProductIndexes (accessed on 15 March 2022).
- Mcdonough, F.M.; Boehm, G.A.; Douglas, W.S. Dredged material management in New Jersey: A multifaceted approach for meeting statewide dredging needs in the 21st century. In Proceedings of the 31st Annual Dredging Seminar, Western Dredging Association, Louisville Kentucky, KY, USA, 16–18 May 1999. [Google Scholar]
- Ali, M.; Robert, M.; Roya, N. Evaluation of Long-Term Performance of Stabilized Sediment for Beneficial Use; Rutgers University: New Brunswick, NJ, USA, 2020. [Google Scholar]
- Braga, B.B.; de Carvalho, T.R.A.; Brosinsky, A.; Foerster, S.; Medeiros, P.H.A. From waste to resource: Cost-benefit analysis of reservoir sediment reuse for soil fertilization in a semiarid catchment. Sci. Total Environ. 2019, 670, 158–169. [Google Scholar] [CrossRef]


| No | Type of Data | Data Description | Name of Service that Provides the Data |
|---|---|---|---|
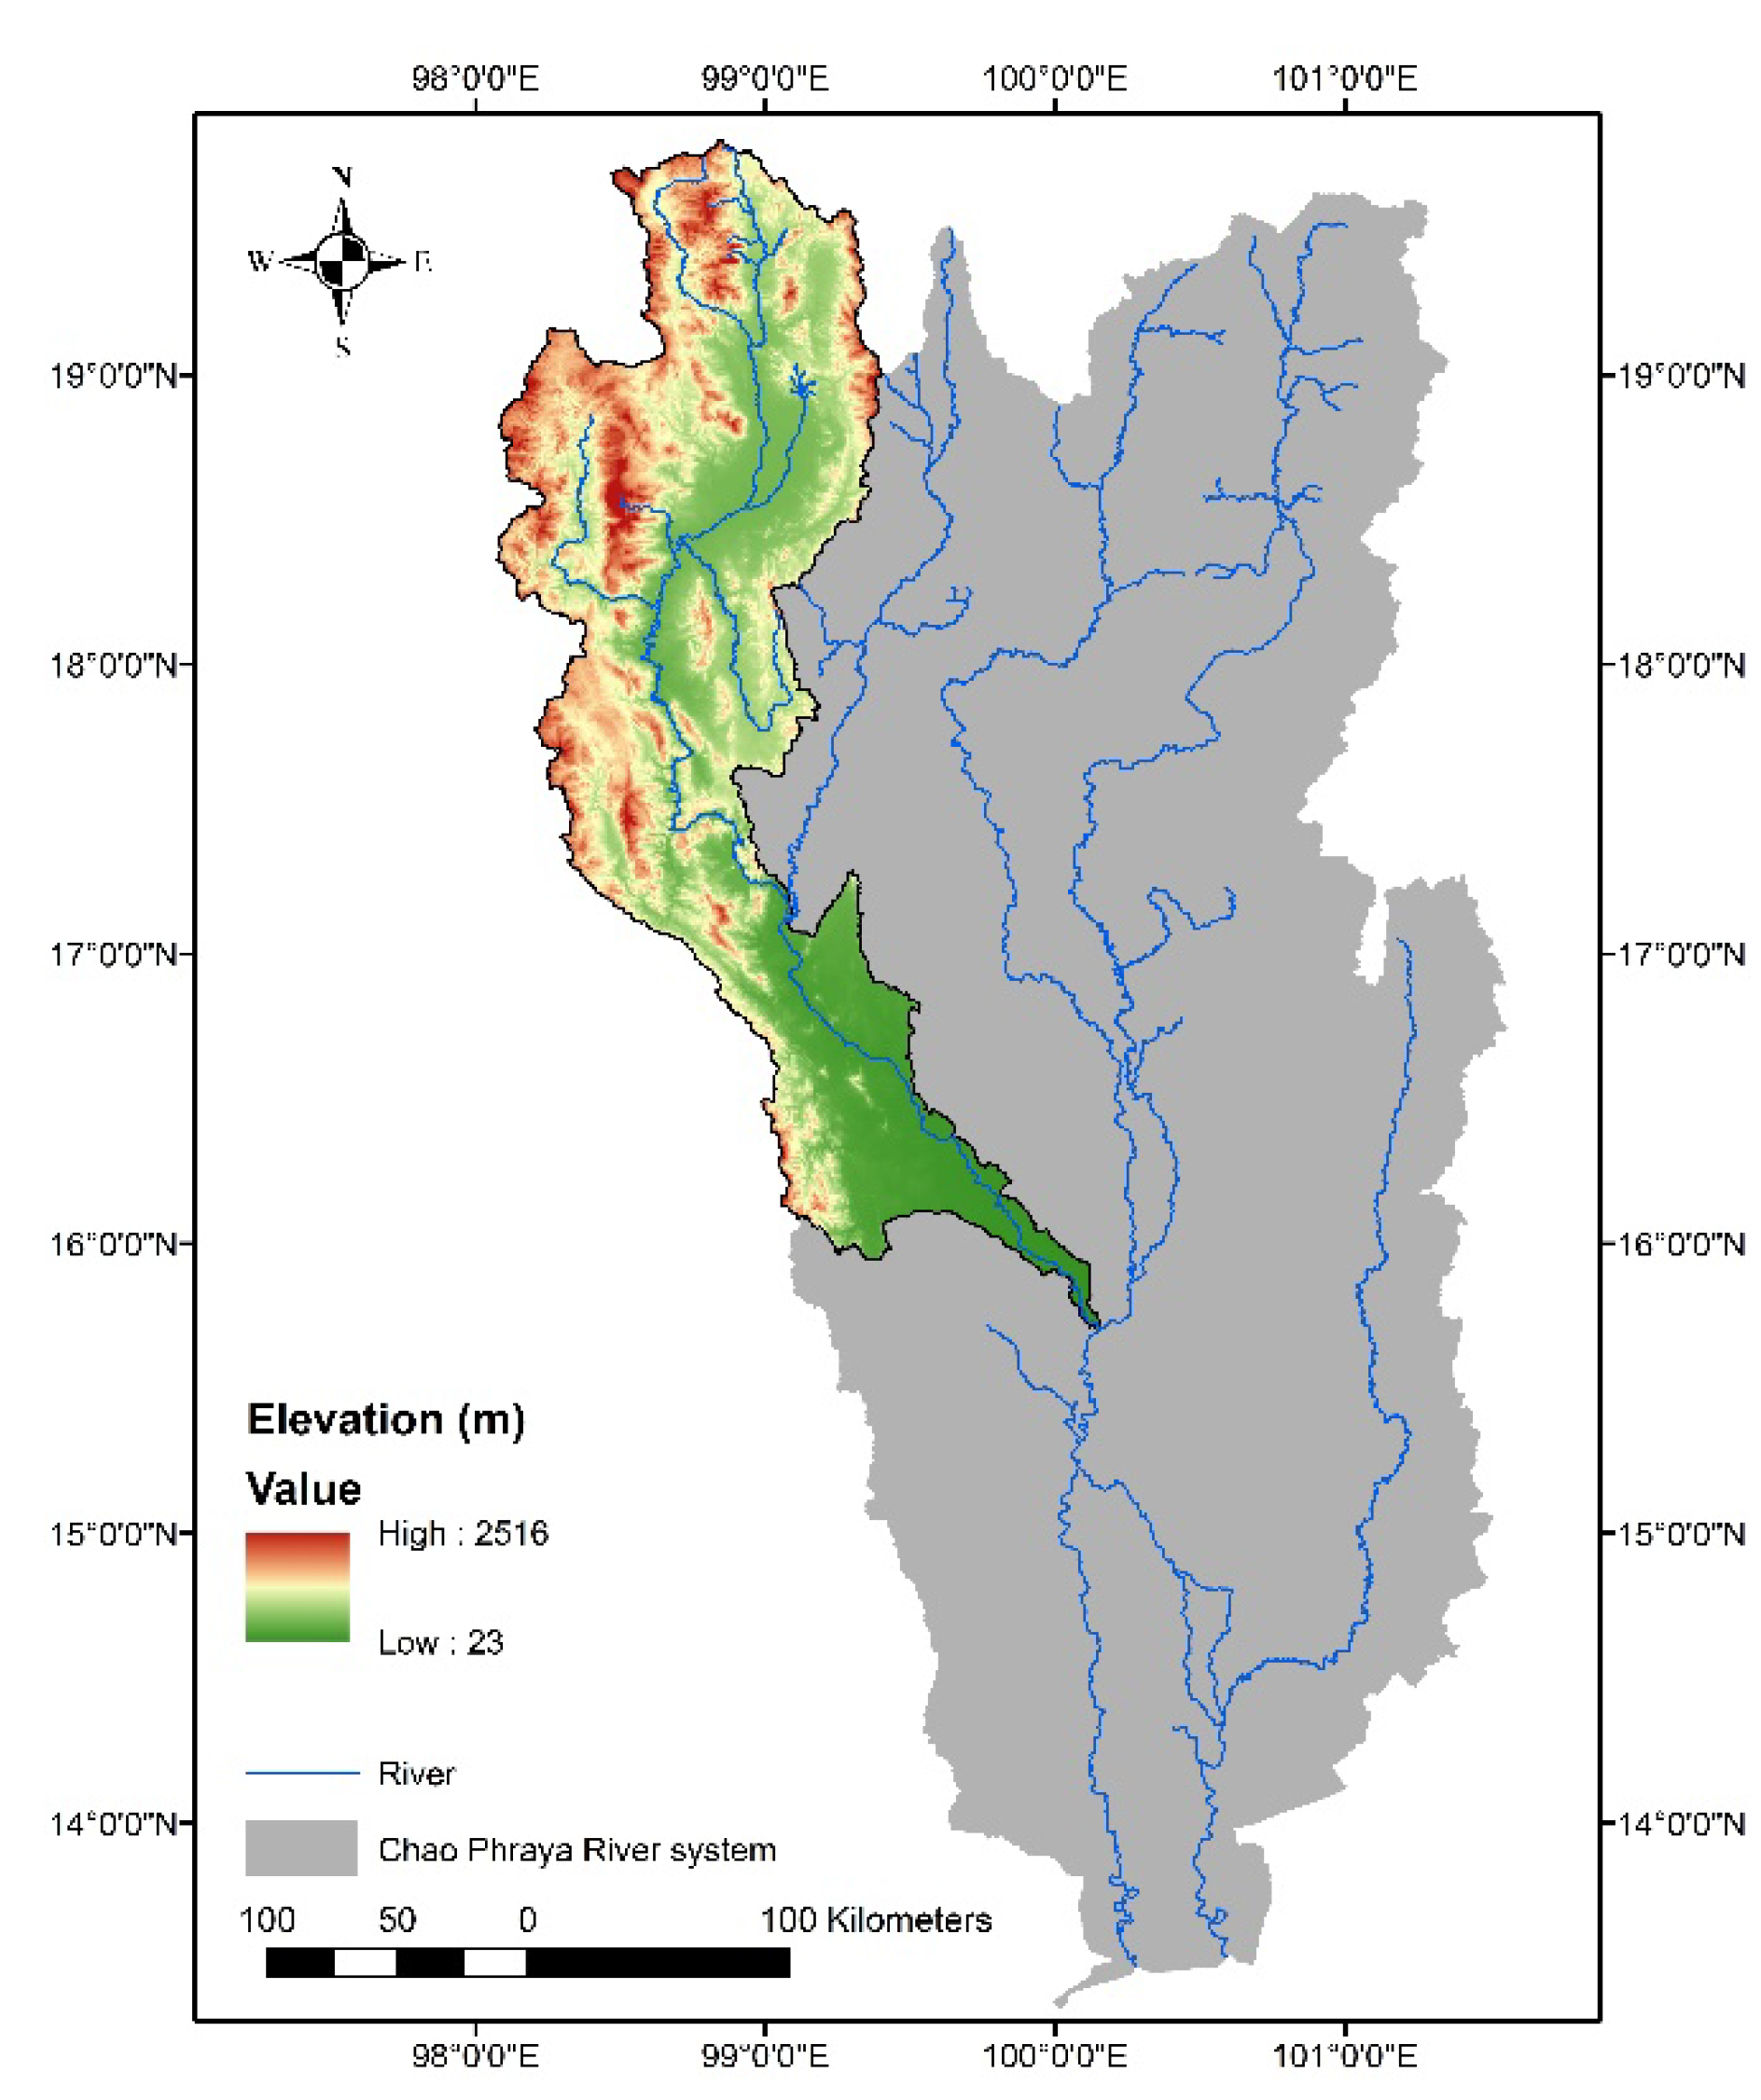
| 1 | Digital elevation model (DEM) | 1 km2 resolution. | U.S. Geological Survey. |
| 2 | Land use data | Land use map for the year 2018 was obtained in GIS format. | Land Development Department of Thailand (LDD). |
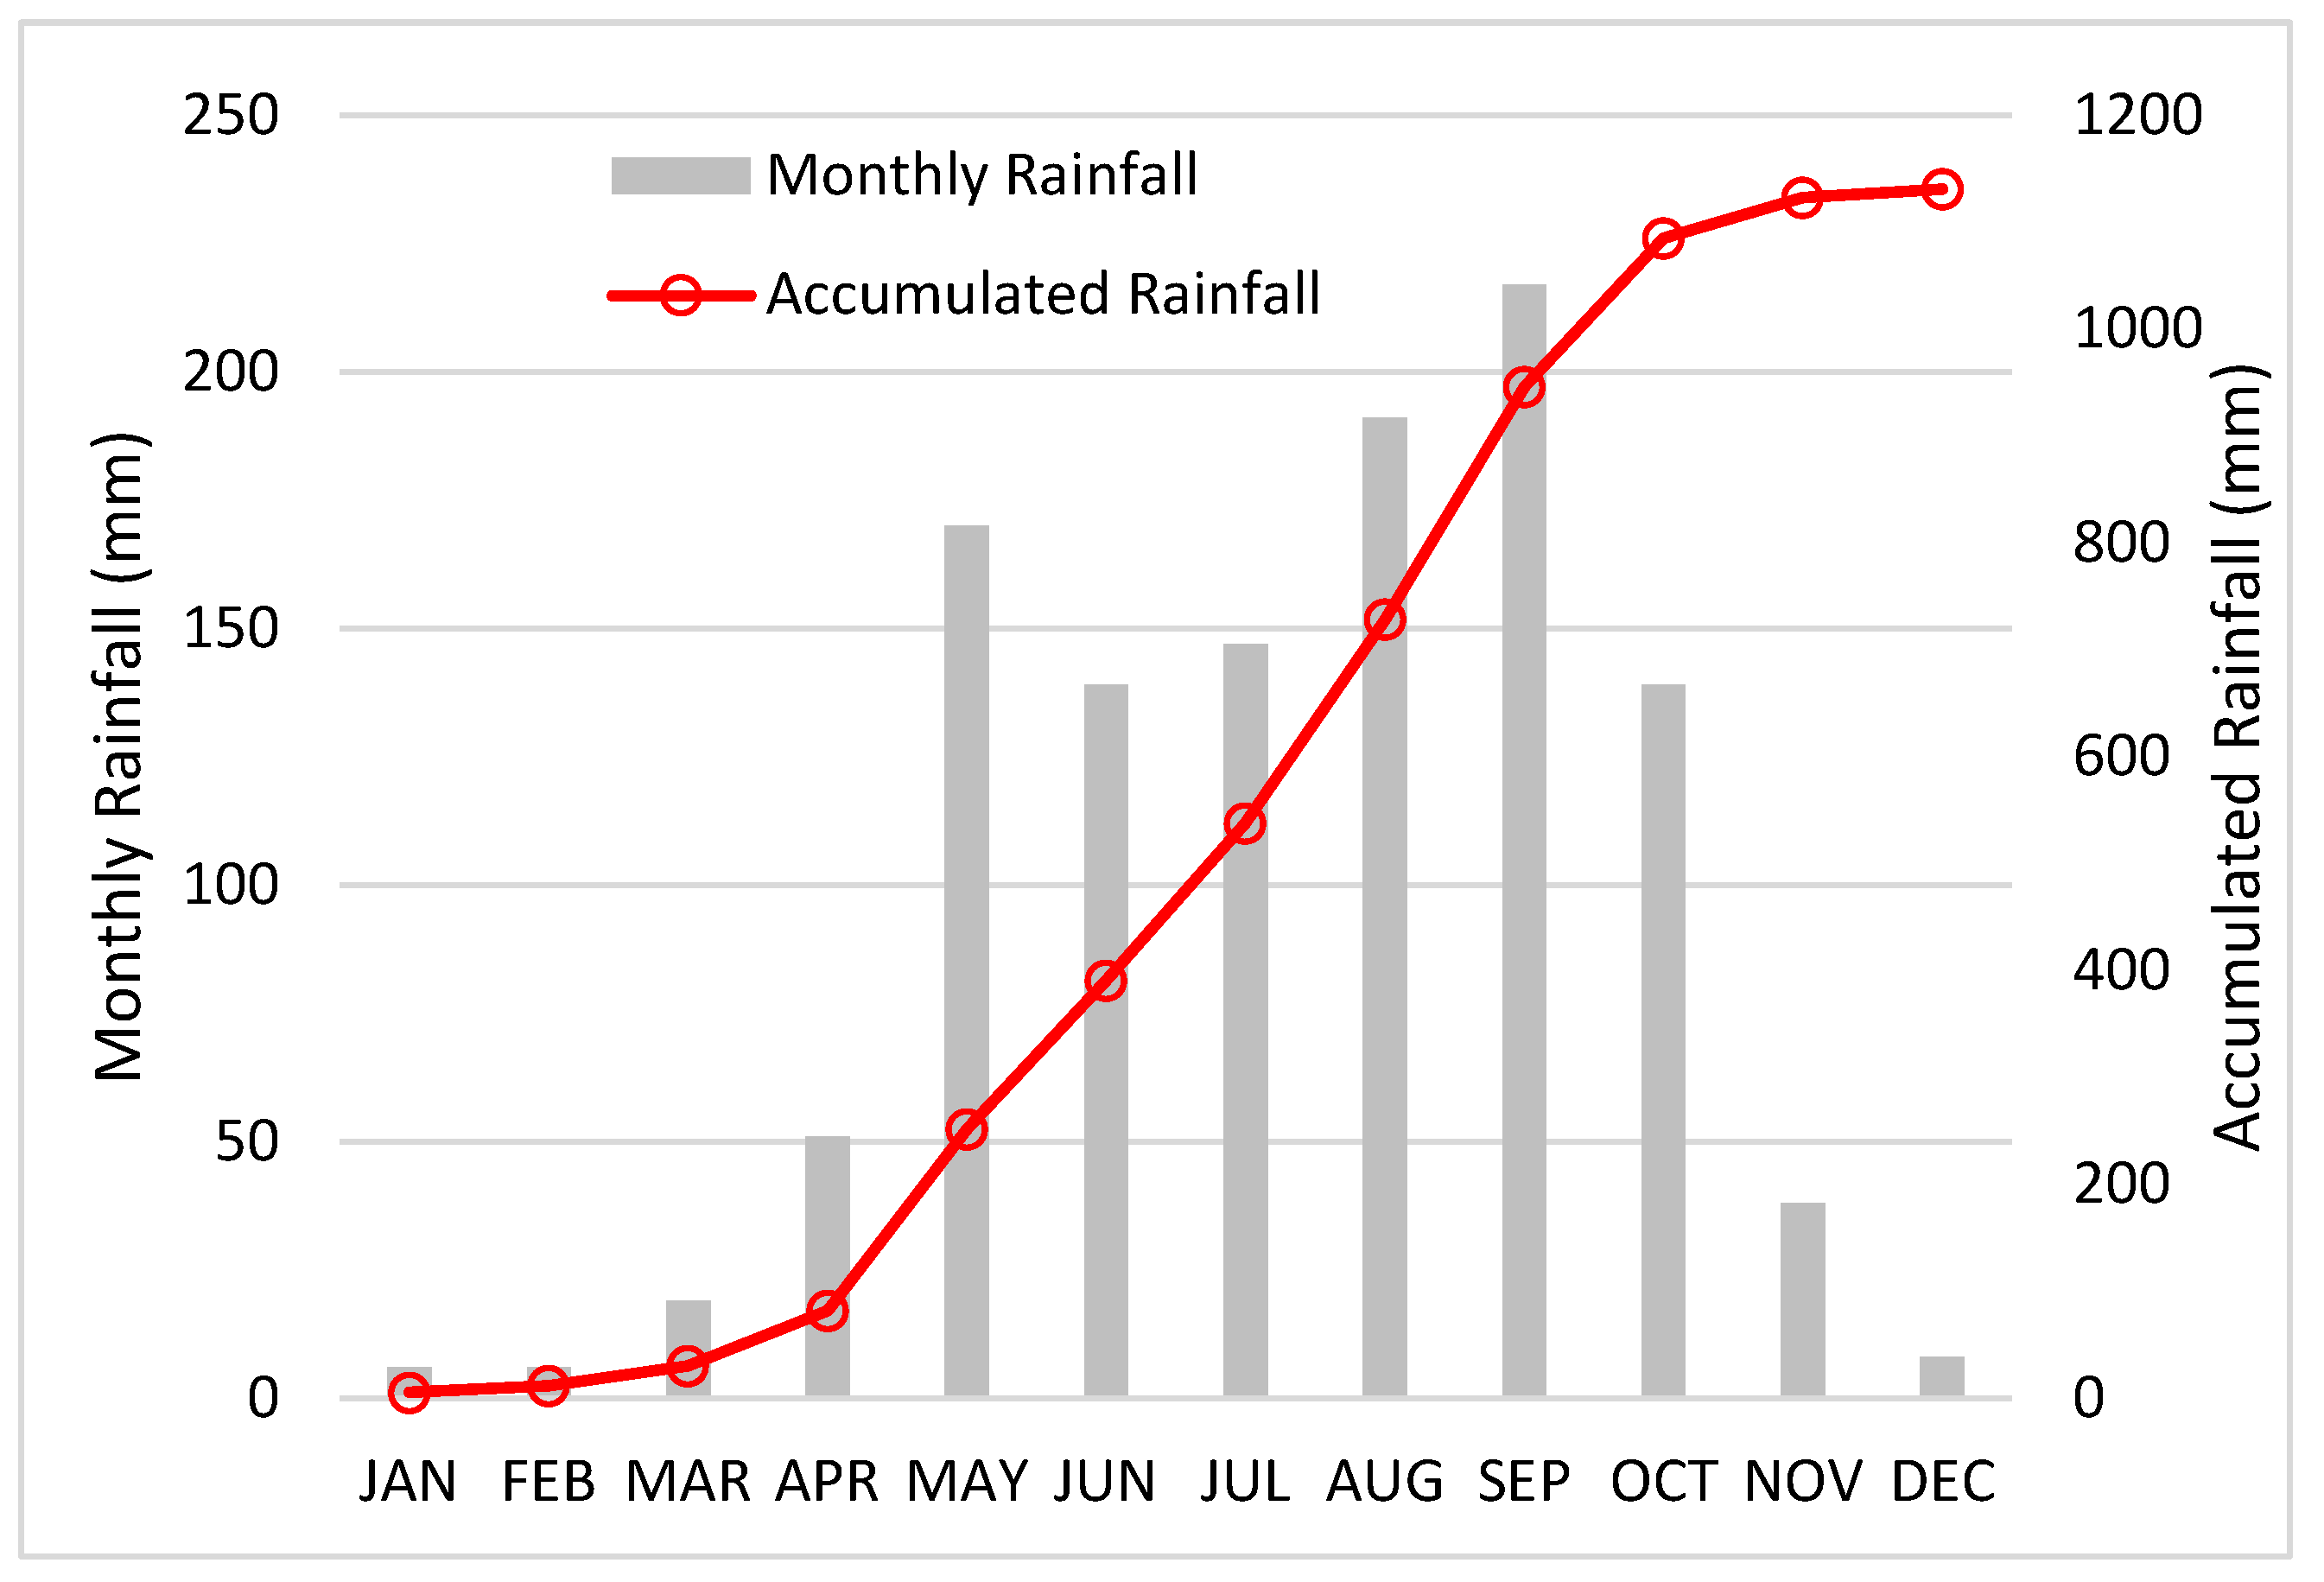
| 3 | Rainfall data | Monthly rainfall data during 2000–2020. | Thai Meteorological Department (TMD). |
| 4 | Normalized Difference Vegetation Index data (NDVI) | MODIS, MOD13A2 data during 2000–2020. | National Aeronautics and Space Administration (NASA). |
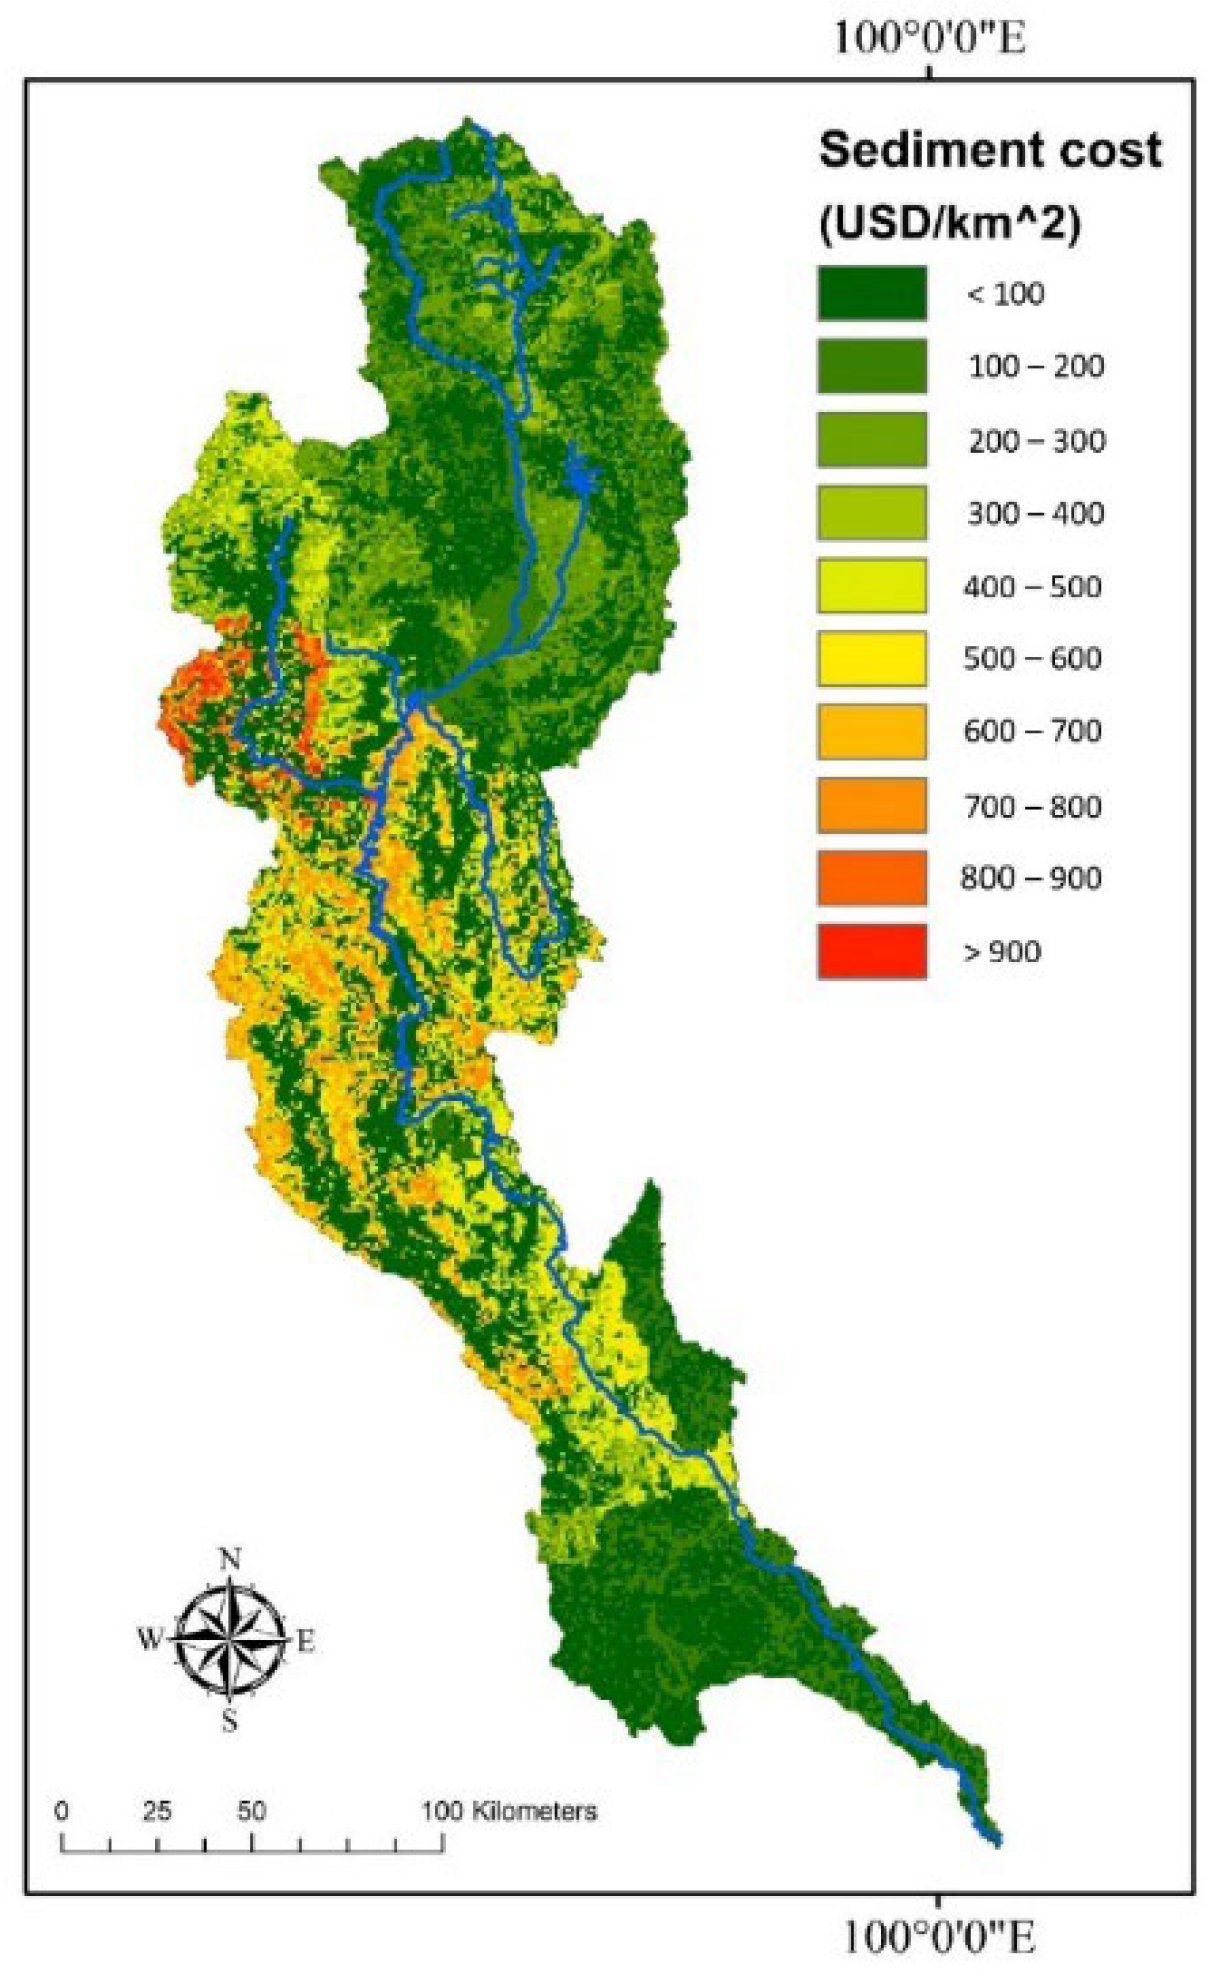
| 5 | Sediment costs | Dredging costs. Water erosion costs. | Royal Irrigation Department of Thailand (RID). Based on research of Schwegler [36]. |
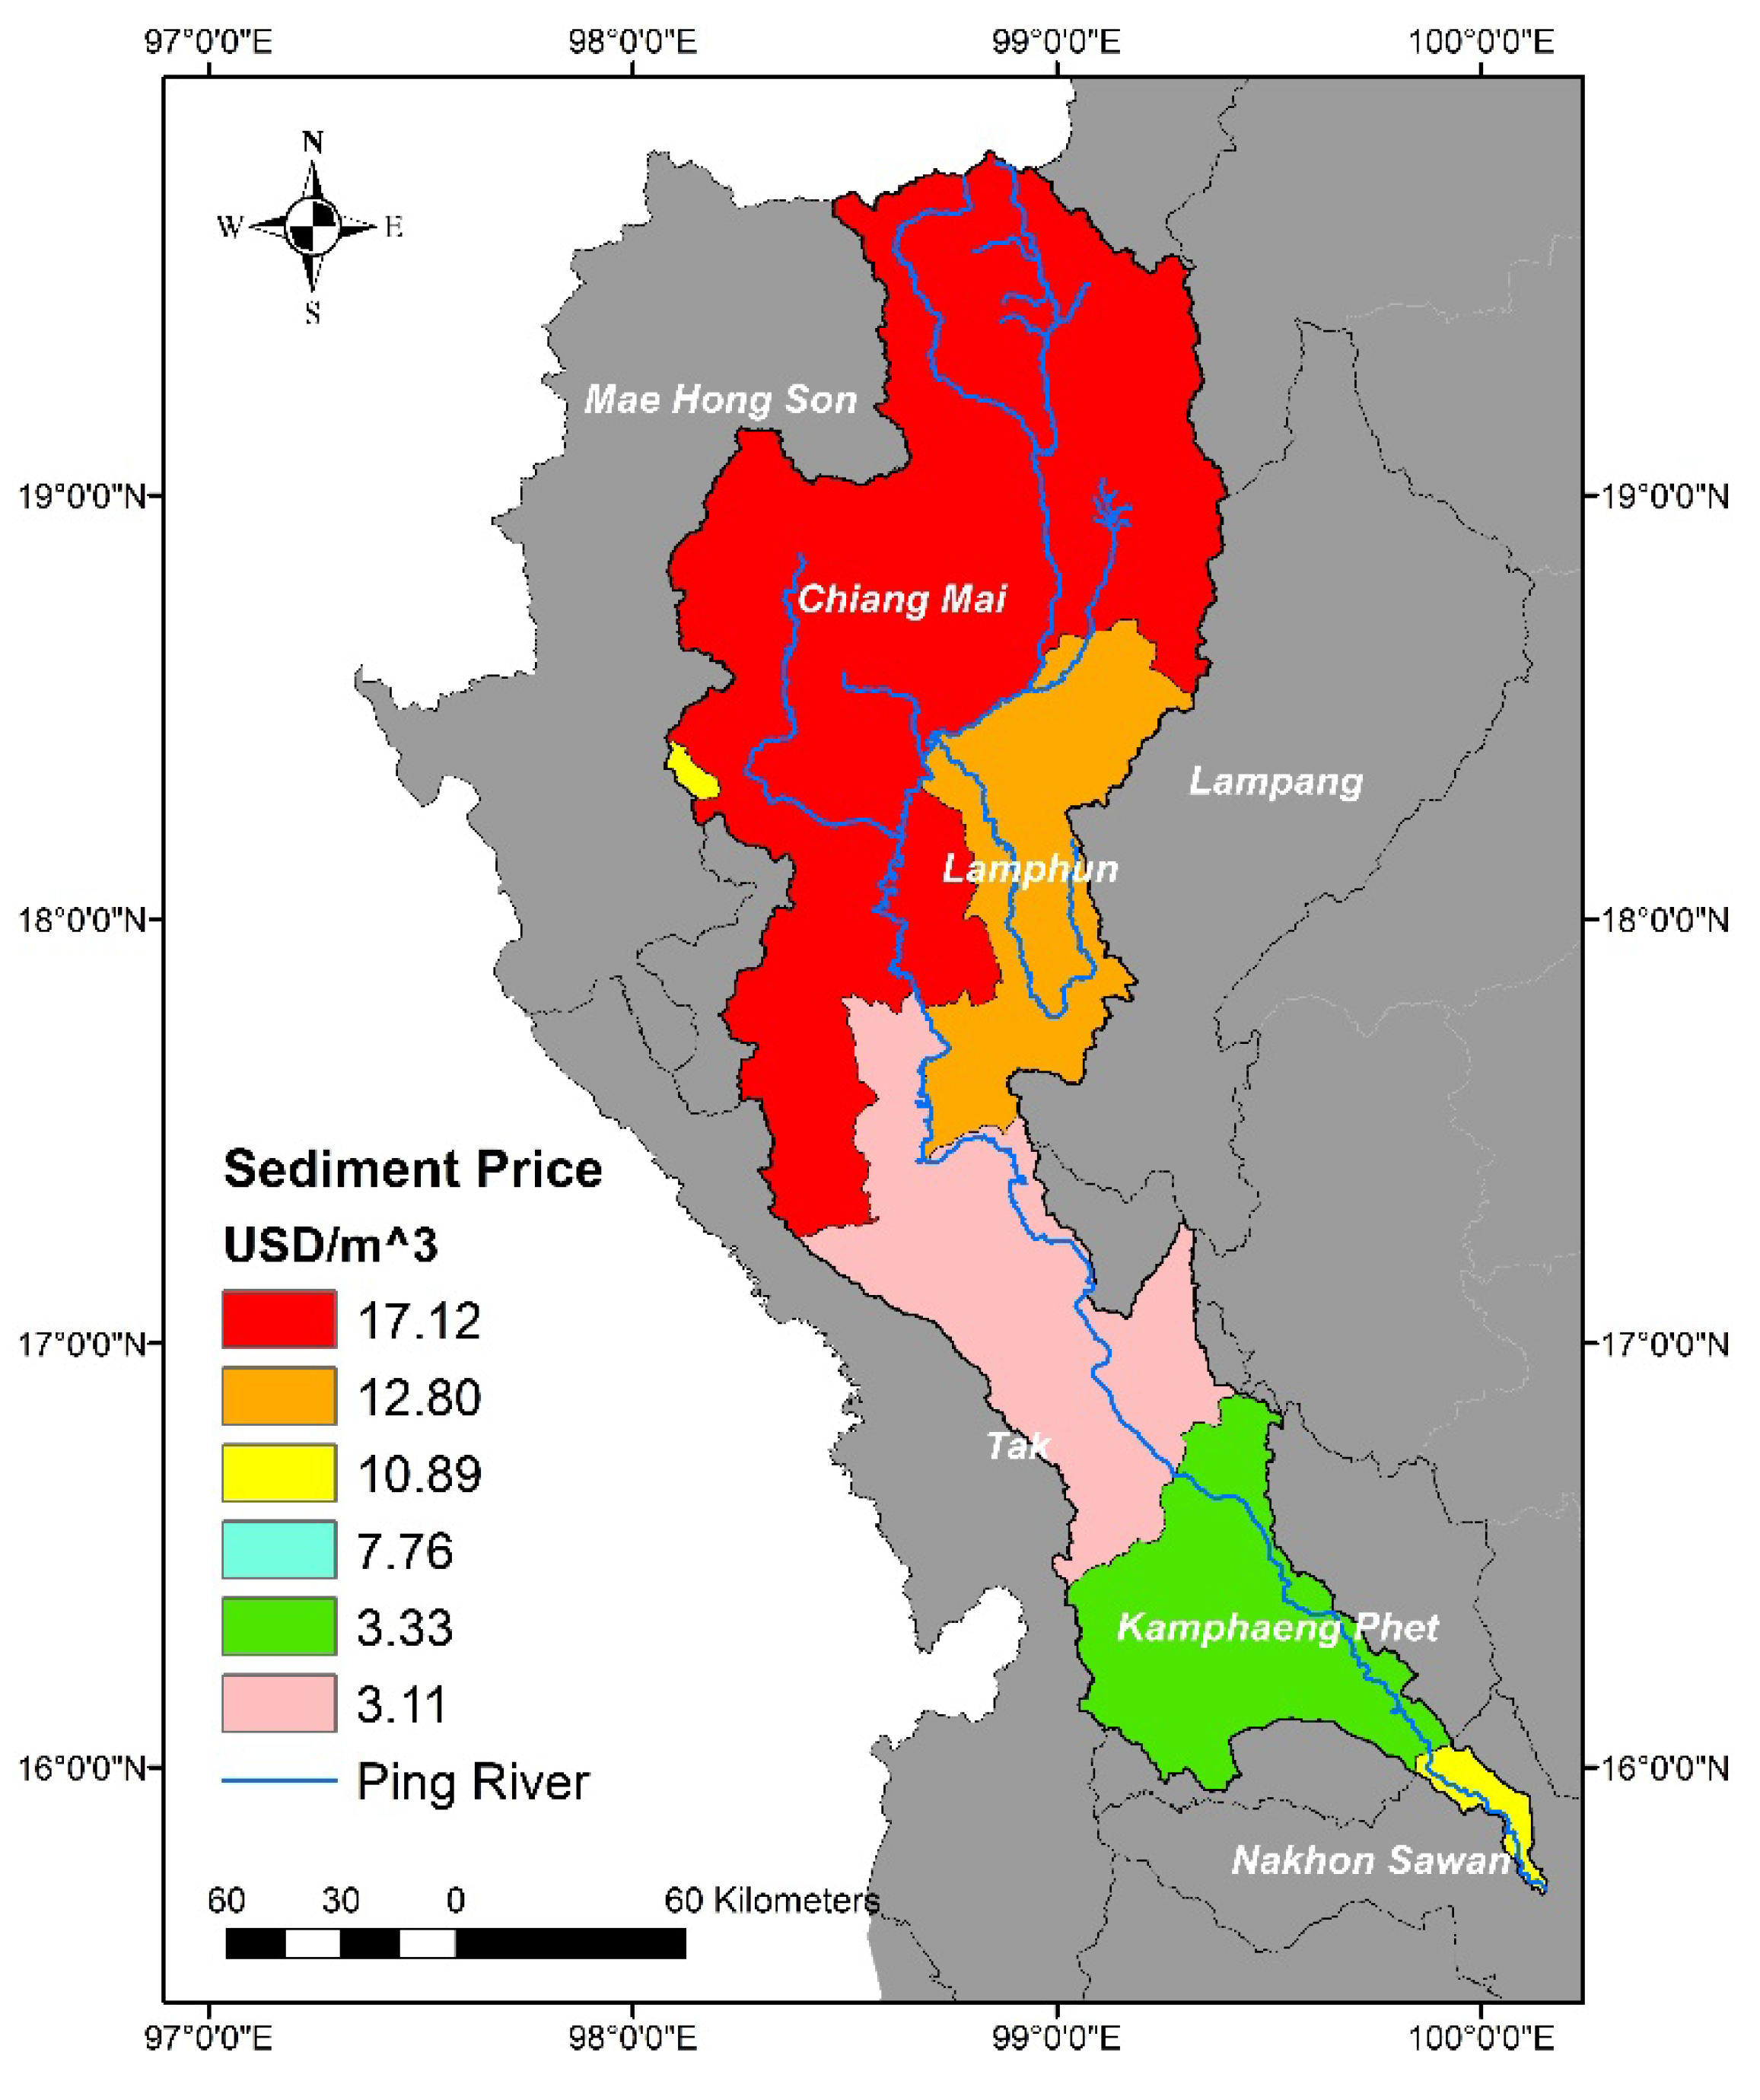
| 6 | Sediment benefits | Sediment price in each province. | The Ministry of Commerce (Thailand). |
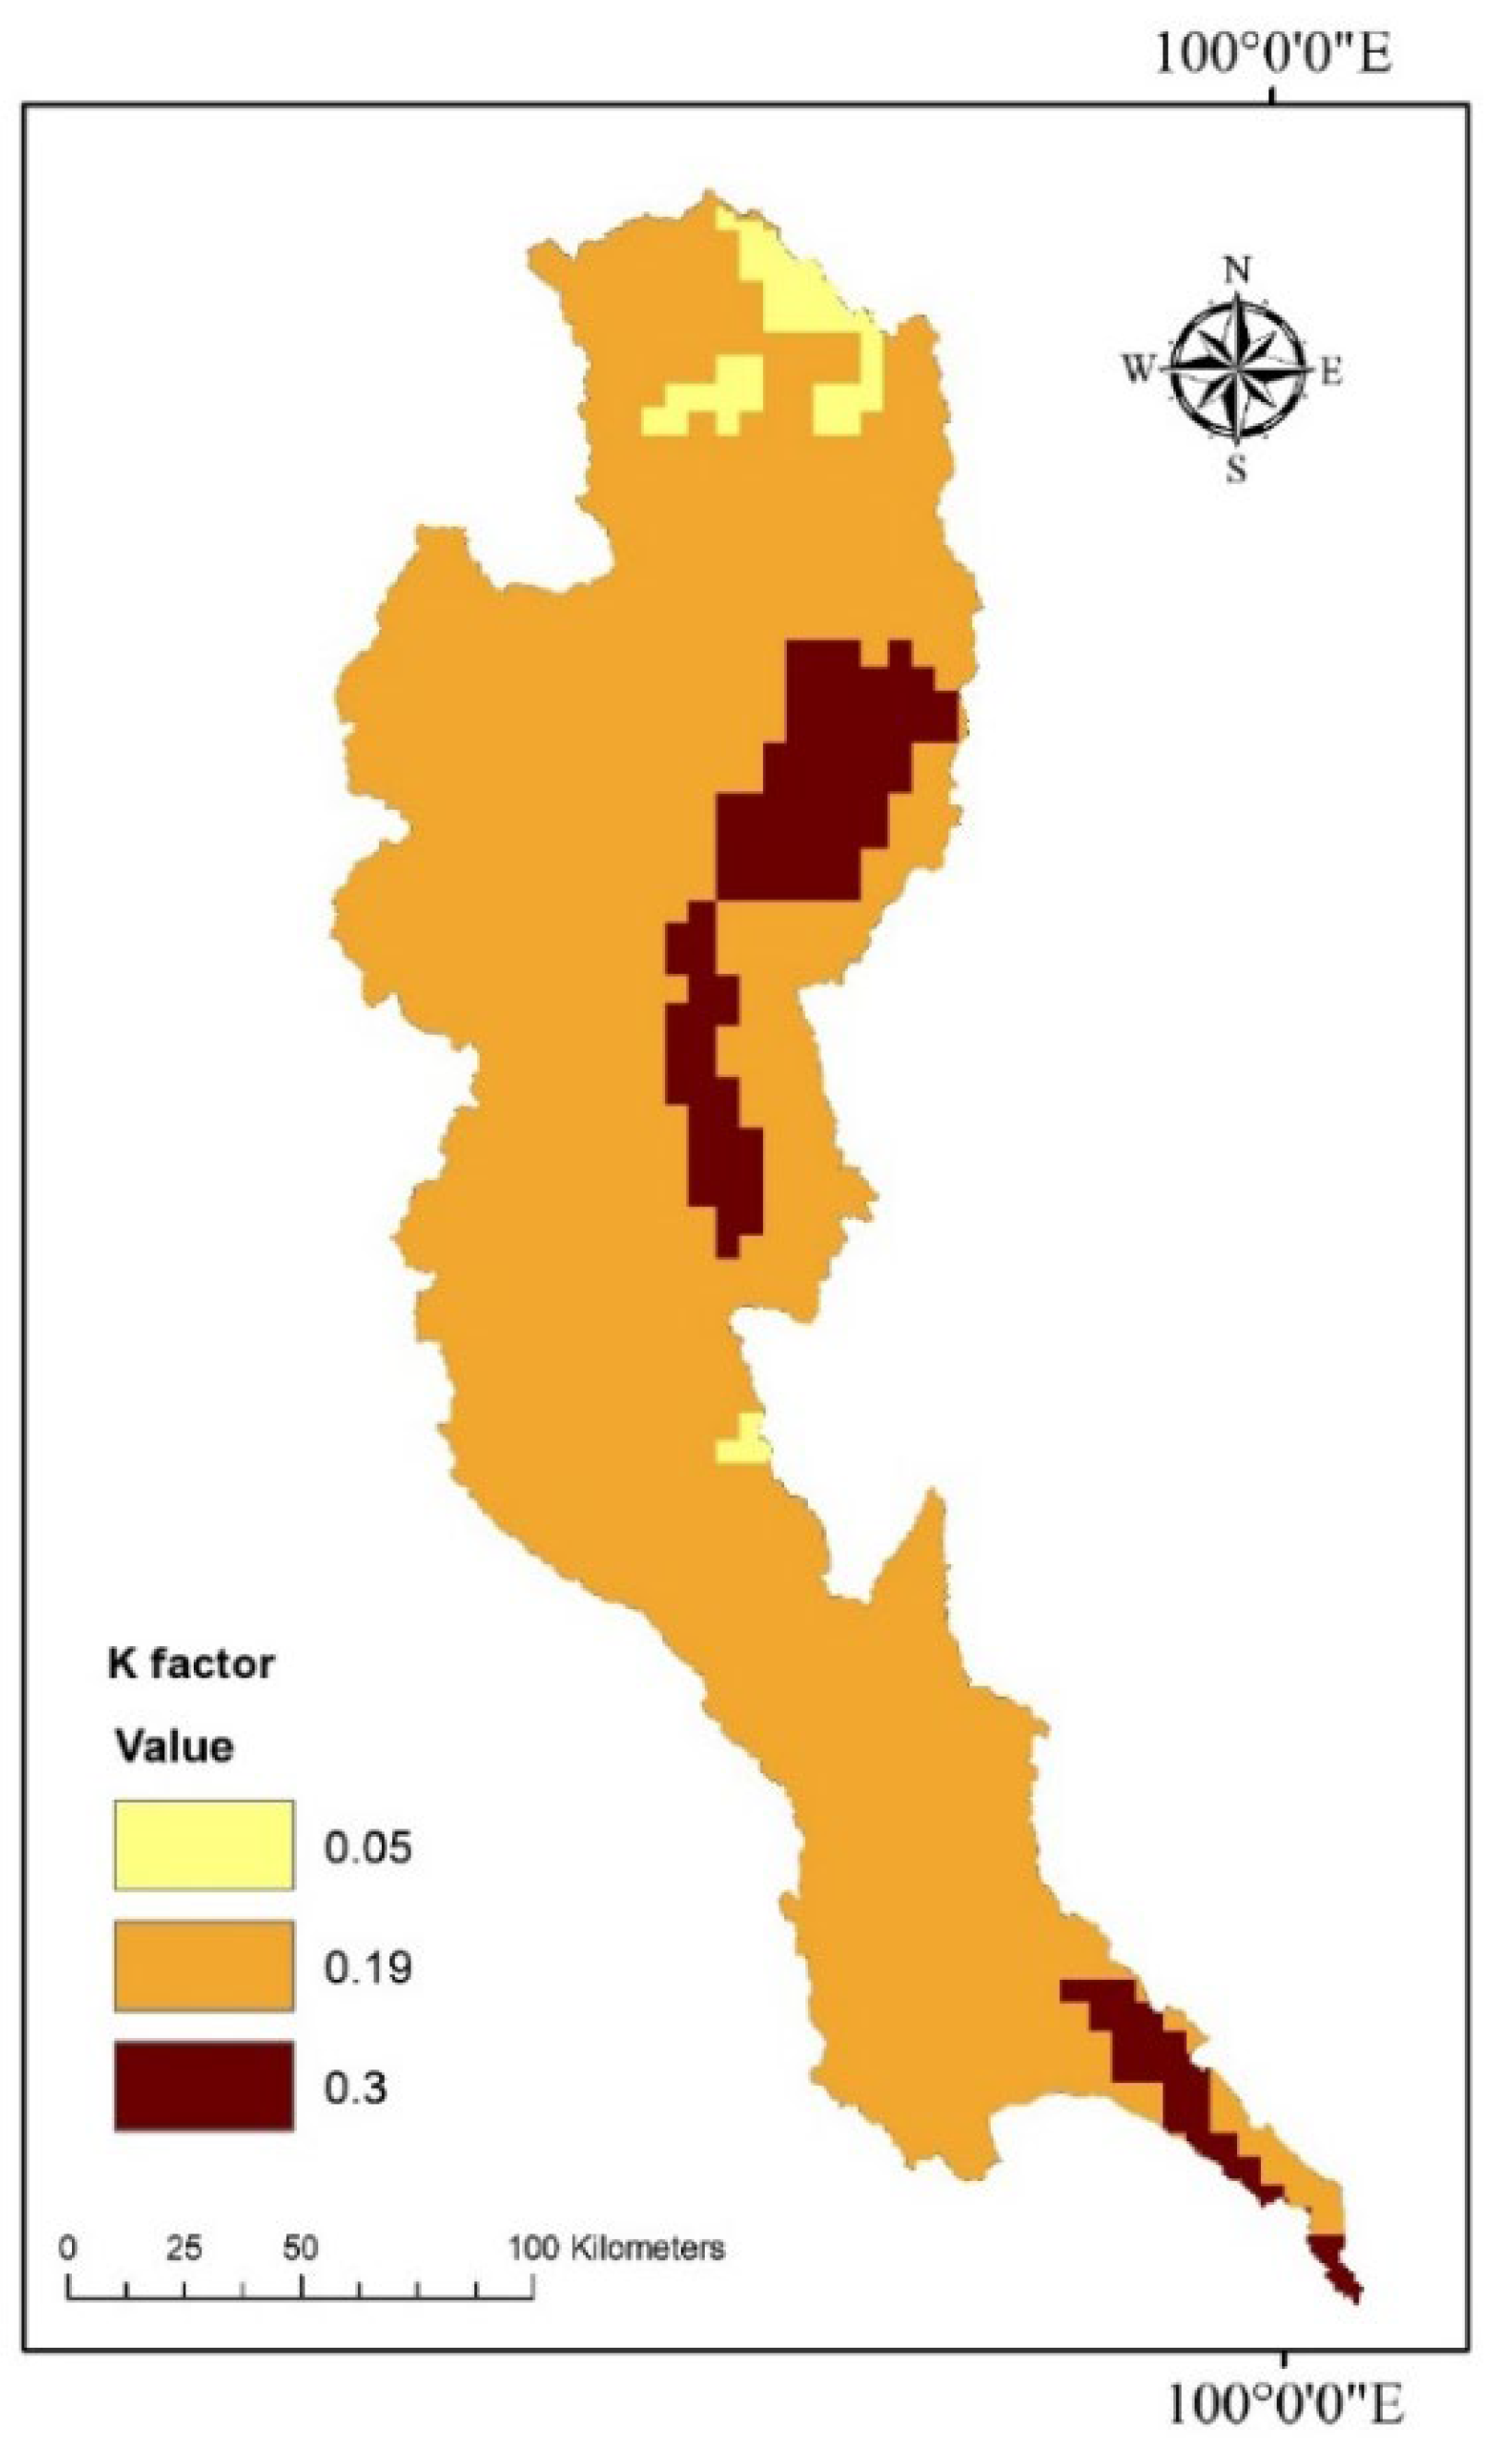
| 7 | K factor values | Standard K factor values based on soil type of Thailand (clay: 0.05, silt: 0.19, and sand: 0.3) (5 km2 resolutions). | Land Development Department of Thailand (LDD). |
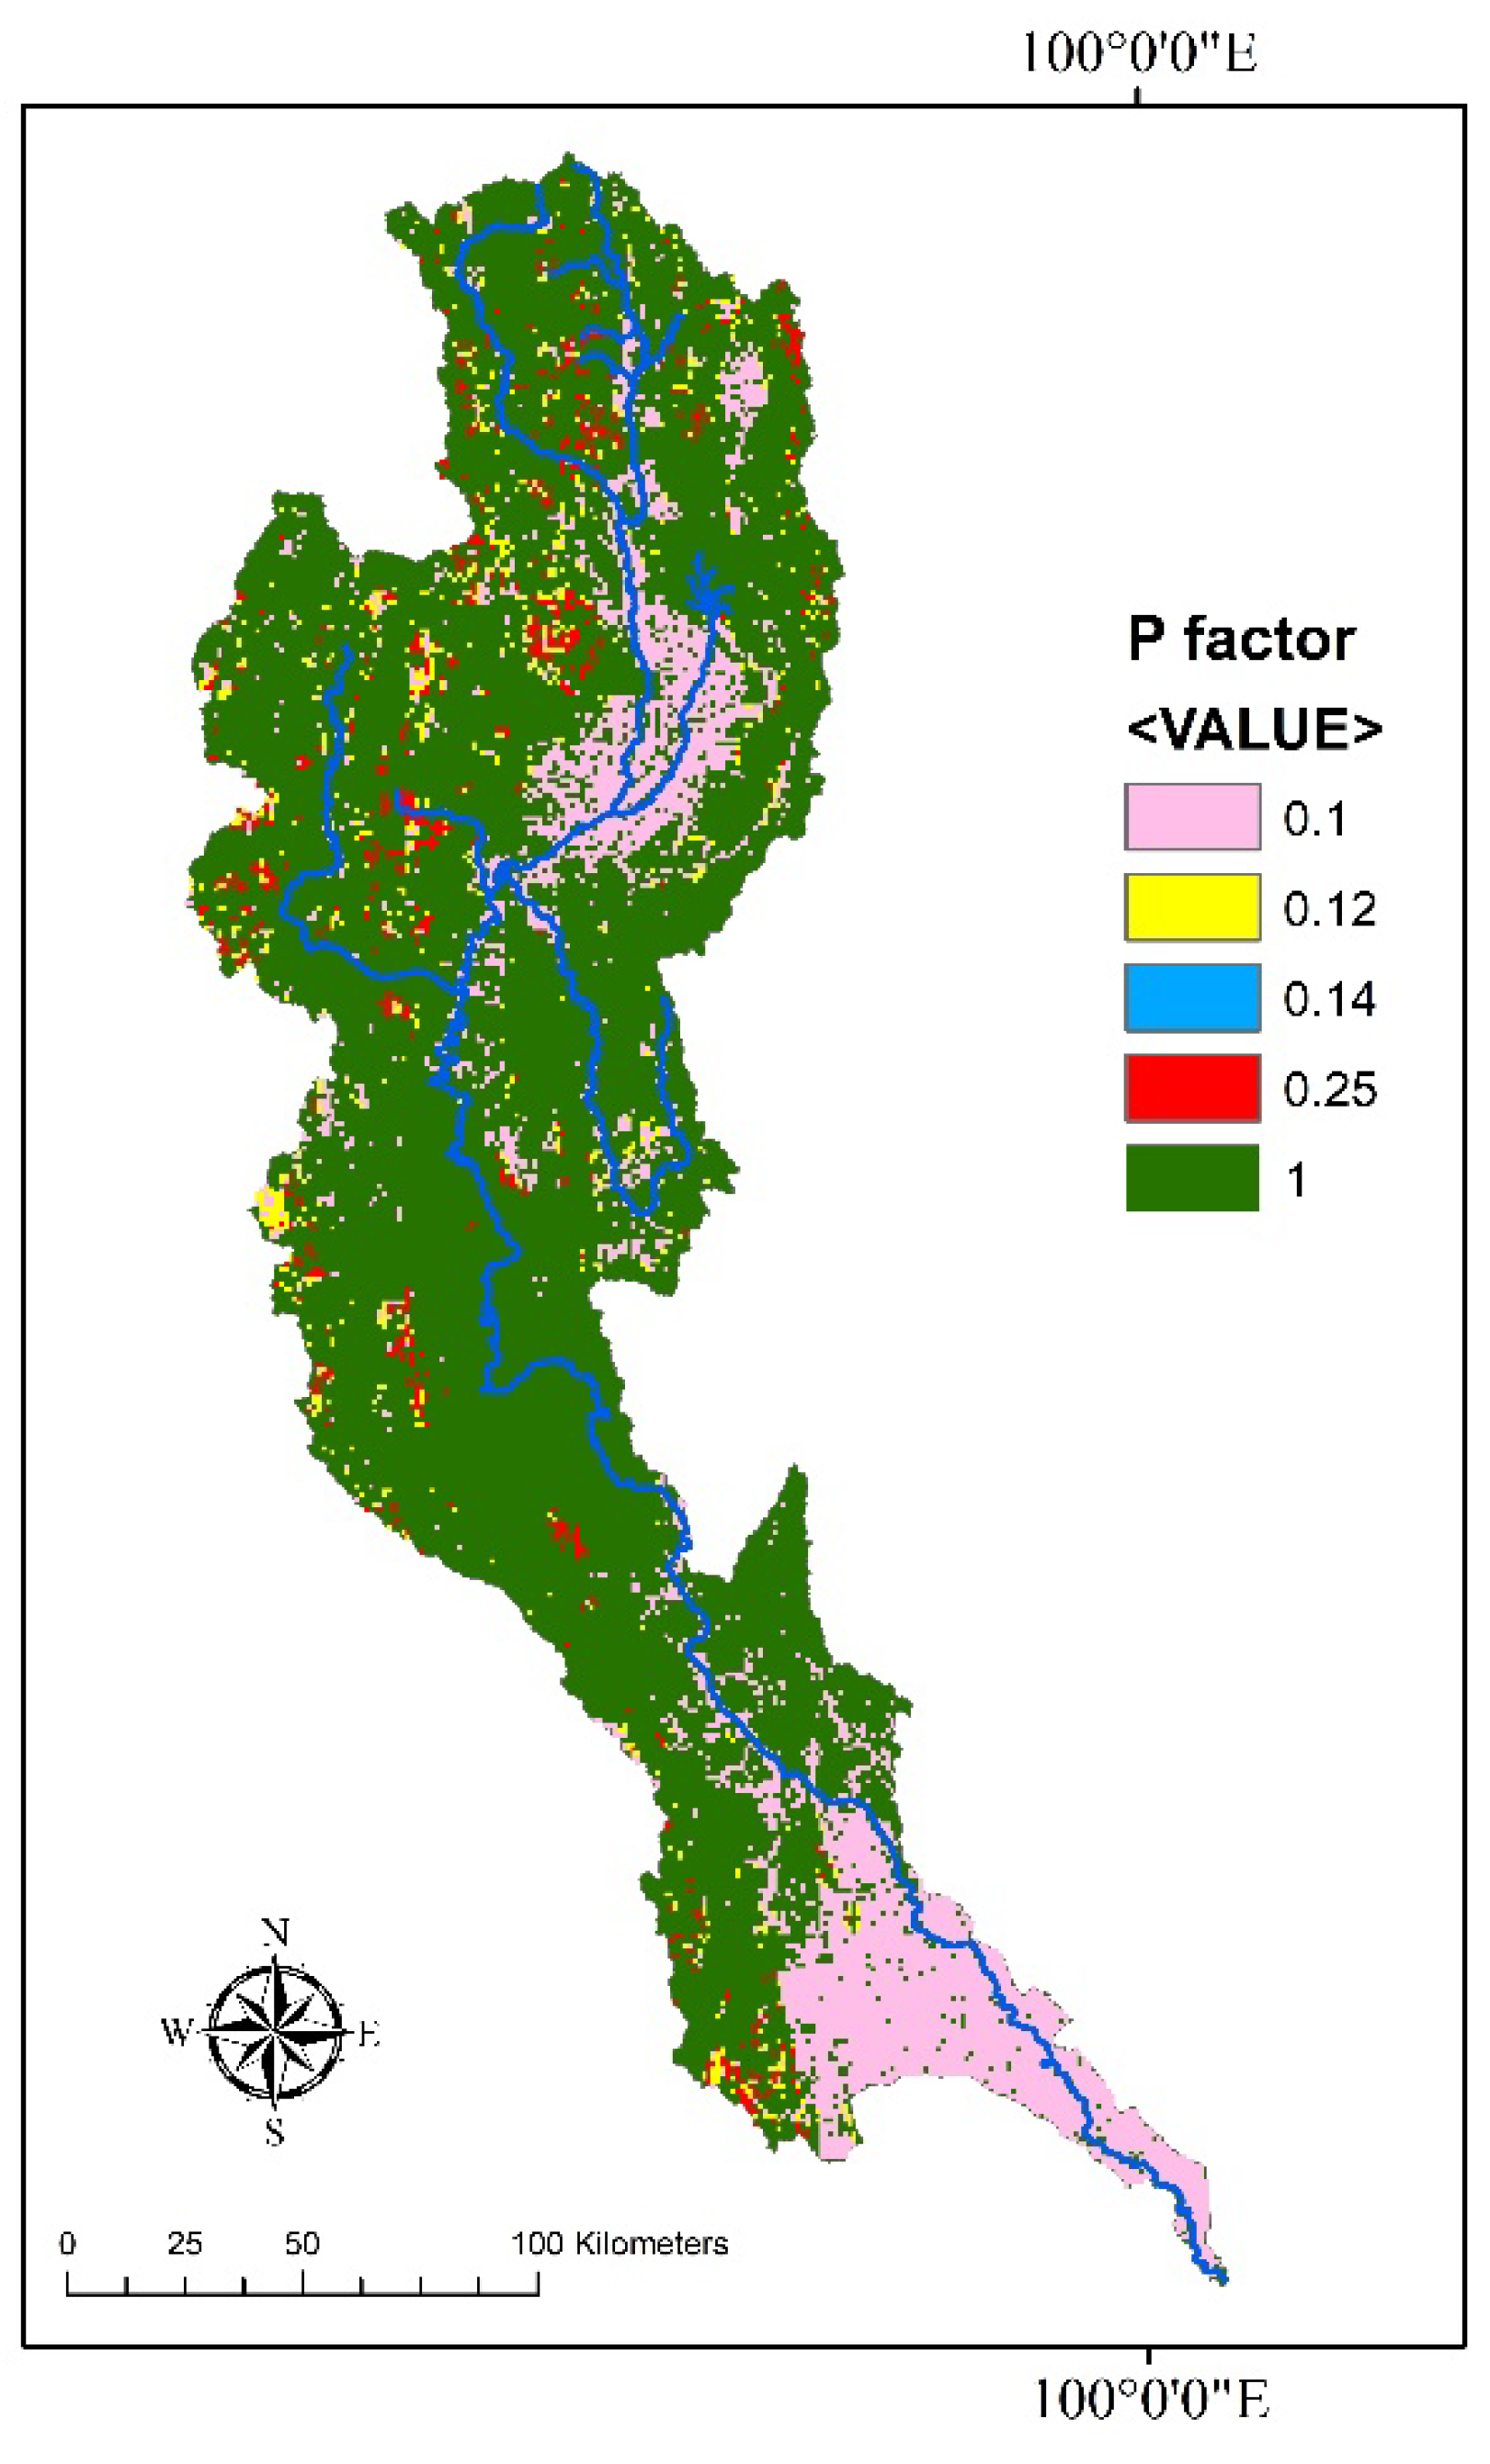
| 8 | P factor values | P factor values were classified into six slope categories for crop areas. | Based on experiment of Wischmeier and Smith [37]. |
| Land Use Type | Slope (%) | P Factor |
|---|---|---|
| Crop Areas | 0–5 | 0.1 |
| Crop Areas | 5–10 | 0.12 |
| Crop Areas | 10–20 | 0.14 |
| Crop Areas | 20–30 | 0.19 |
| Crop Areas | 30–50 | 0.25 |
| Crop Areas | 50–100 | 0.33 |
| Other | All | 1 |
| Provinces | Price of Sediment (USD/m3) |
|---|---|
| Chiang Mai | 17.12 |
| Lampang | 7.76 |
| Lamphun | 12.80 |
| Mae Hong Son | 10.89 |
| Tak | 3.11 |
| Kamphaeng Phet | 3.33 |
| Nakhon Sawan | 10.89 |
Publisher’s Note: MDPI stays neutral with regard to jurisdictional claims in published maps and institutional affiliations. |
© 2022 by the authors. Licensee MDPI, Basel, Switzerland. This article is an open access article distributed under the terms and conditions of the Creative Commons Attribution (CC BY) license (https://creativecommons.org/licenses/by/4.0/).
Share and Cite
Rangsiwanichpong, P.; Melesse, A.M. Analyzing the Benefit-Cost Ratio of Sediment Resources by Remote Sensing Data in the Ping River Basin, Thailand. Water 2022, 14, 2071. https://doi.org/10.3390/w14132071
Rangsiwanichpong P, Melesse AM. Analyzing the Benefit-Cost Ratio of Sediment Resources by Remote Sensing Data in the Ping River Basin, Thailand. Water. 2022; 14(13):2071. https://doi.org/10.3390/w14132071
Chicago/Turabian StyleRangsiwanichpong, Prem, and Assefa M. Melesse. 2022. "Analyzing the Benefit-Cost Ratio of Sediment Resources by Remote Sensing Data in the Ping River Basin, Thailand" Water 14, no. 13: 2071. https://doi.org/10.3390/w14132071
APA StyleRangsiwanichpong, P., & Melesse, A. M. (2022). Analyzing the Benefit-Cost Ratio of Sediment Resources by Remote Sensing Data in the Ping River Basin, Thailand. Water, 14(13), 2071. https://doi.org/10.3390/w14132071