
Use of Multi-Criteria Decision Analysis (MCDA) for Mapping Erosion Potential in Gulf of Mexico Watersheds


Abstract
:1. Introduction
2. Materials and Methods
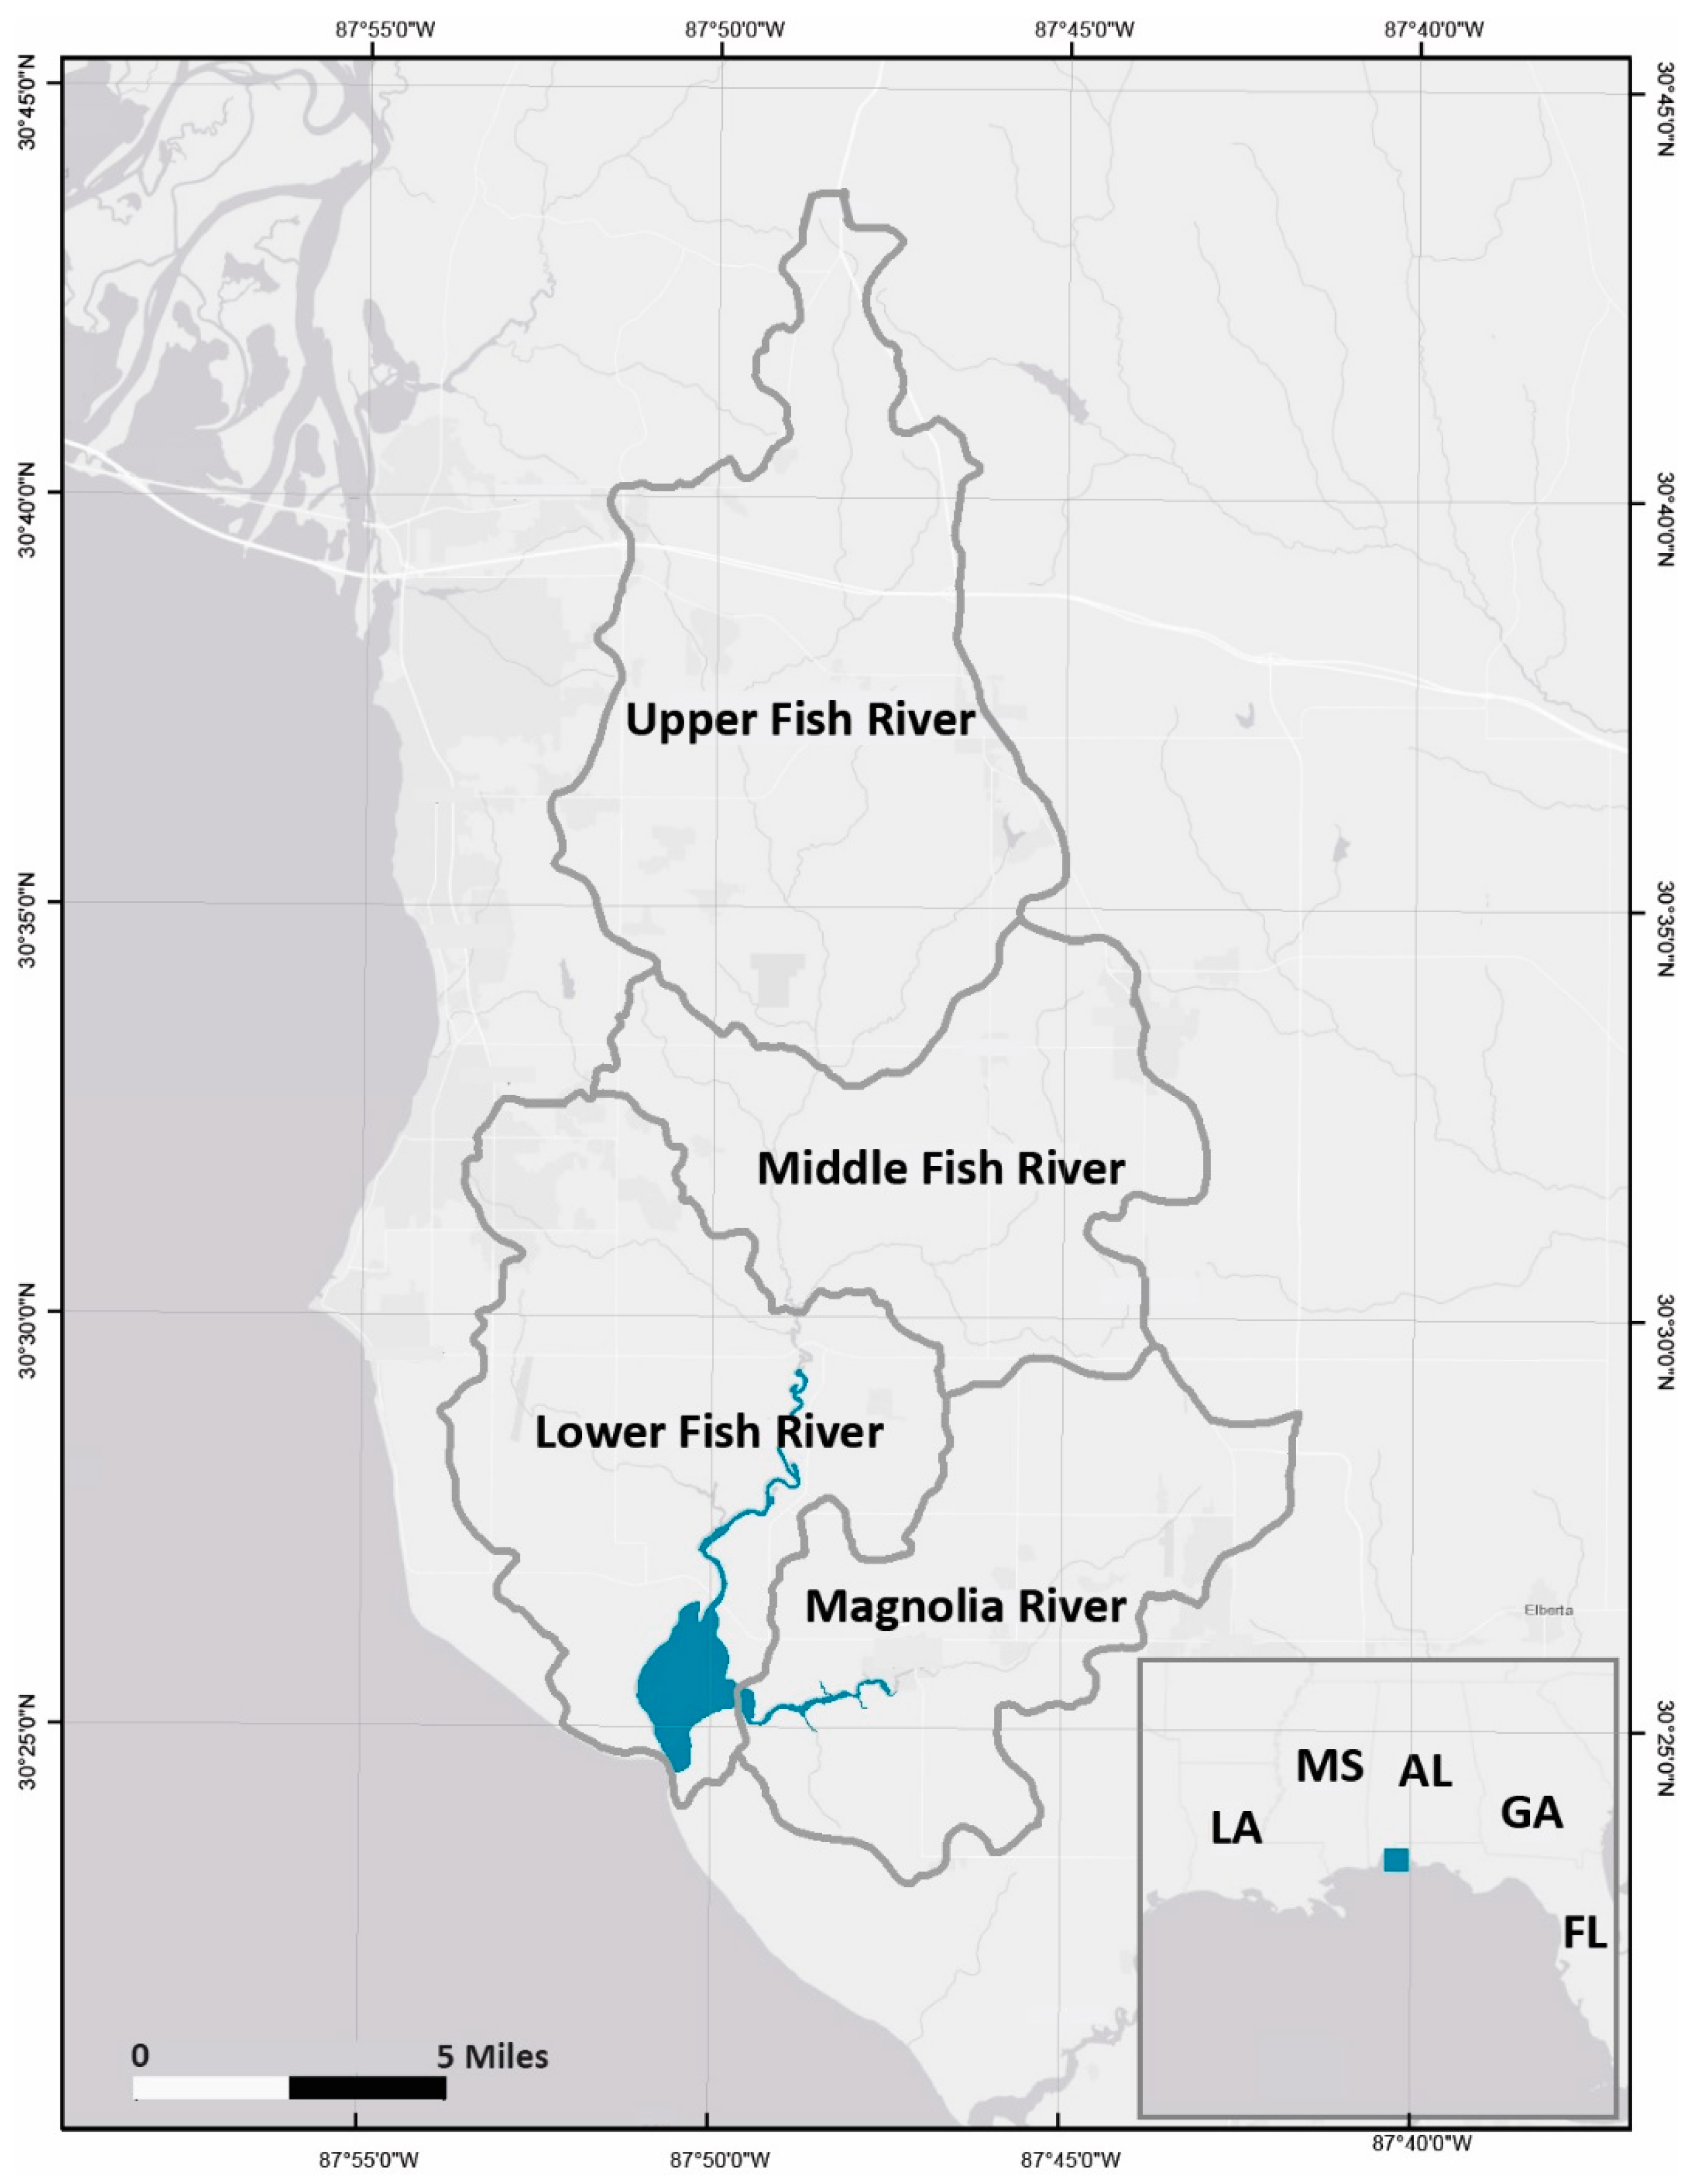
2.1. Study Area
2.2. Data Collection and Processing
2.2.1. Slope
2.2.2. Soil Erodibility
2.2.3. Stream Density
2.2.4. Soil Brightness
2.2.5. Precipitation
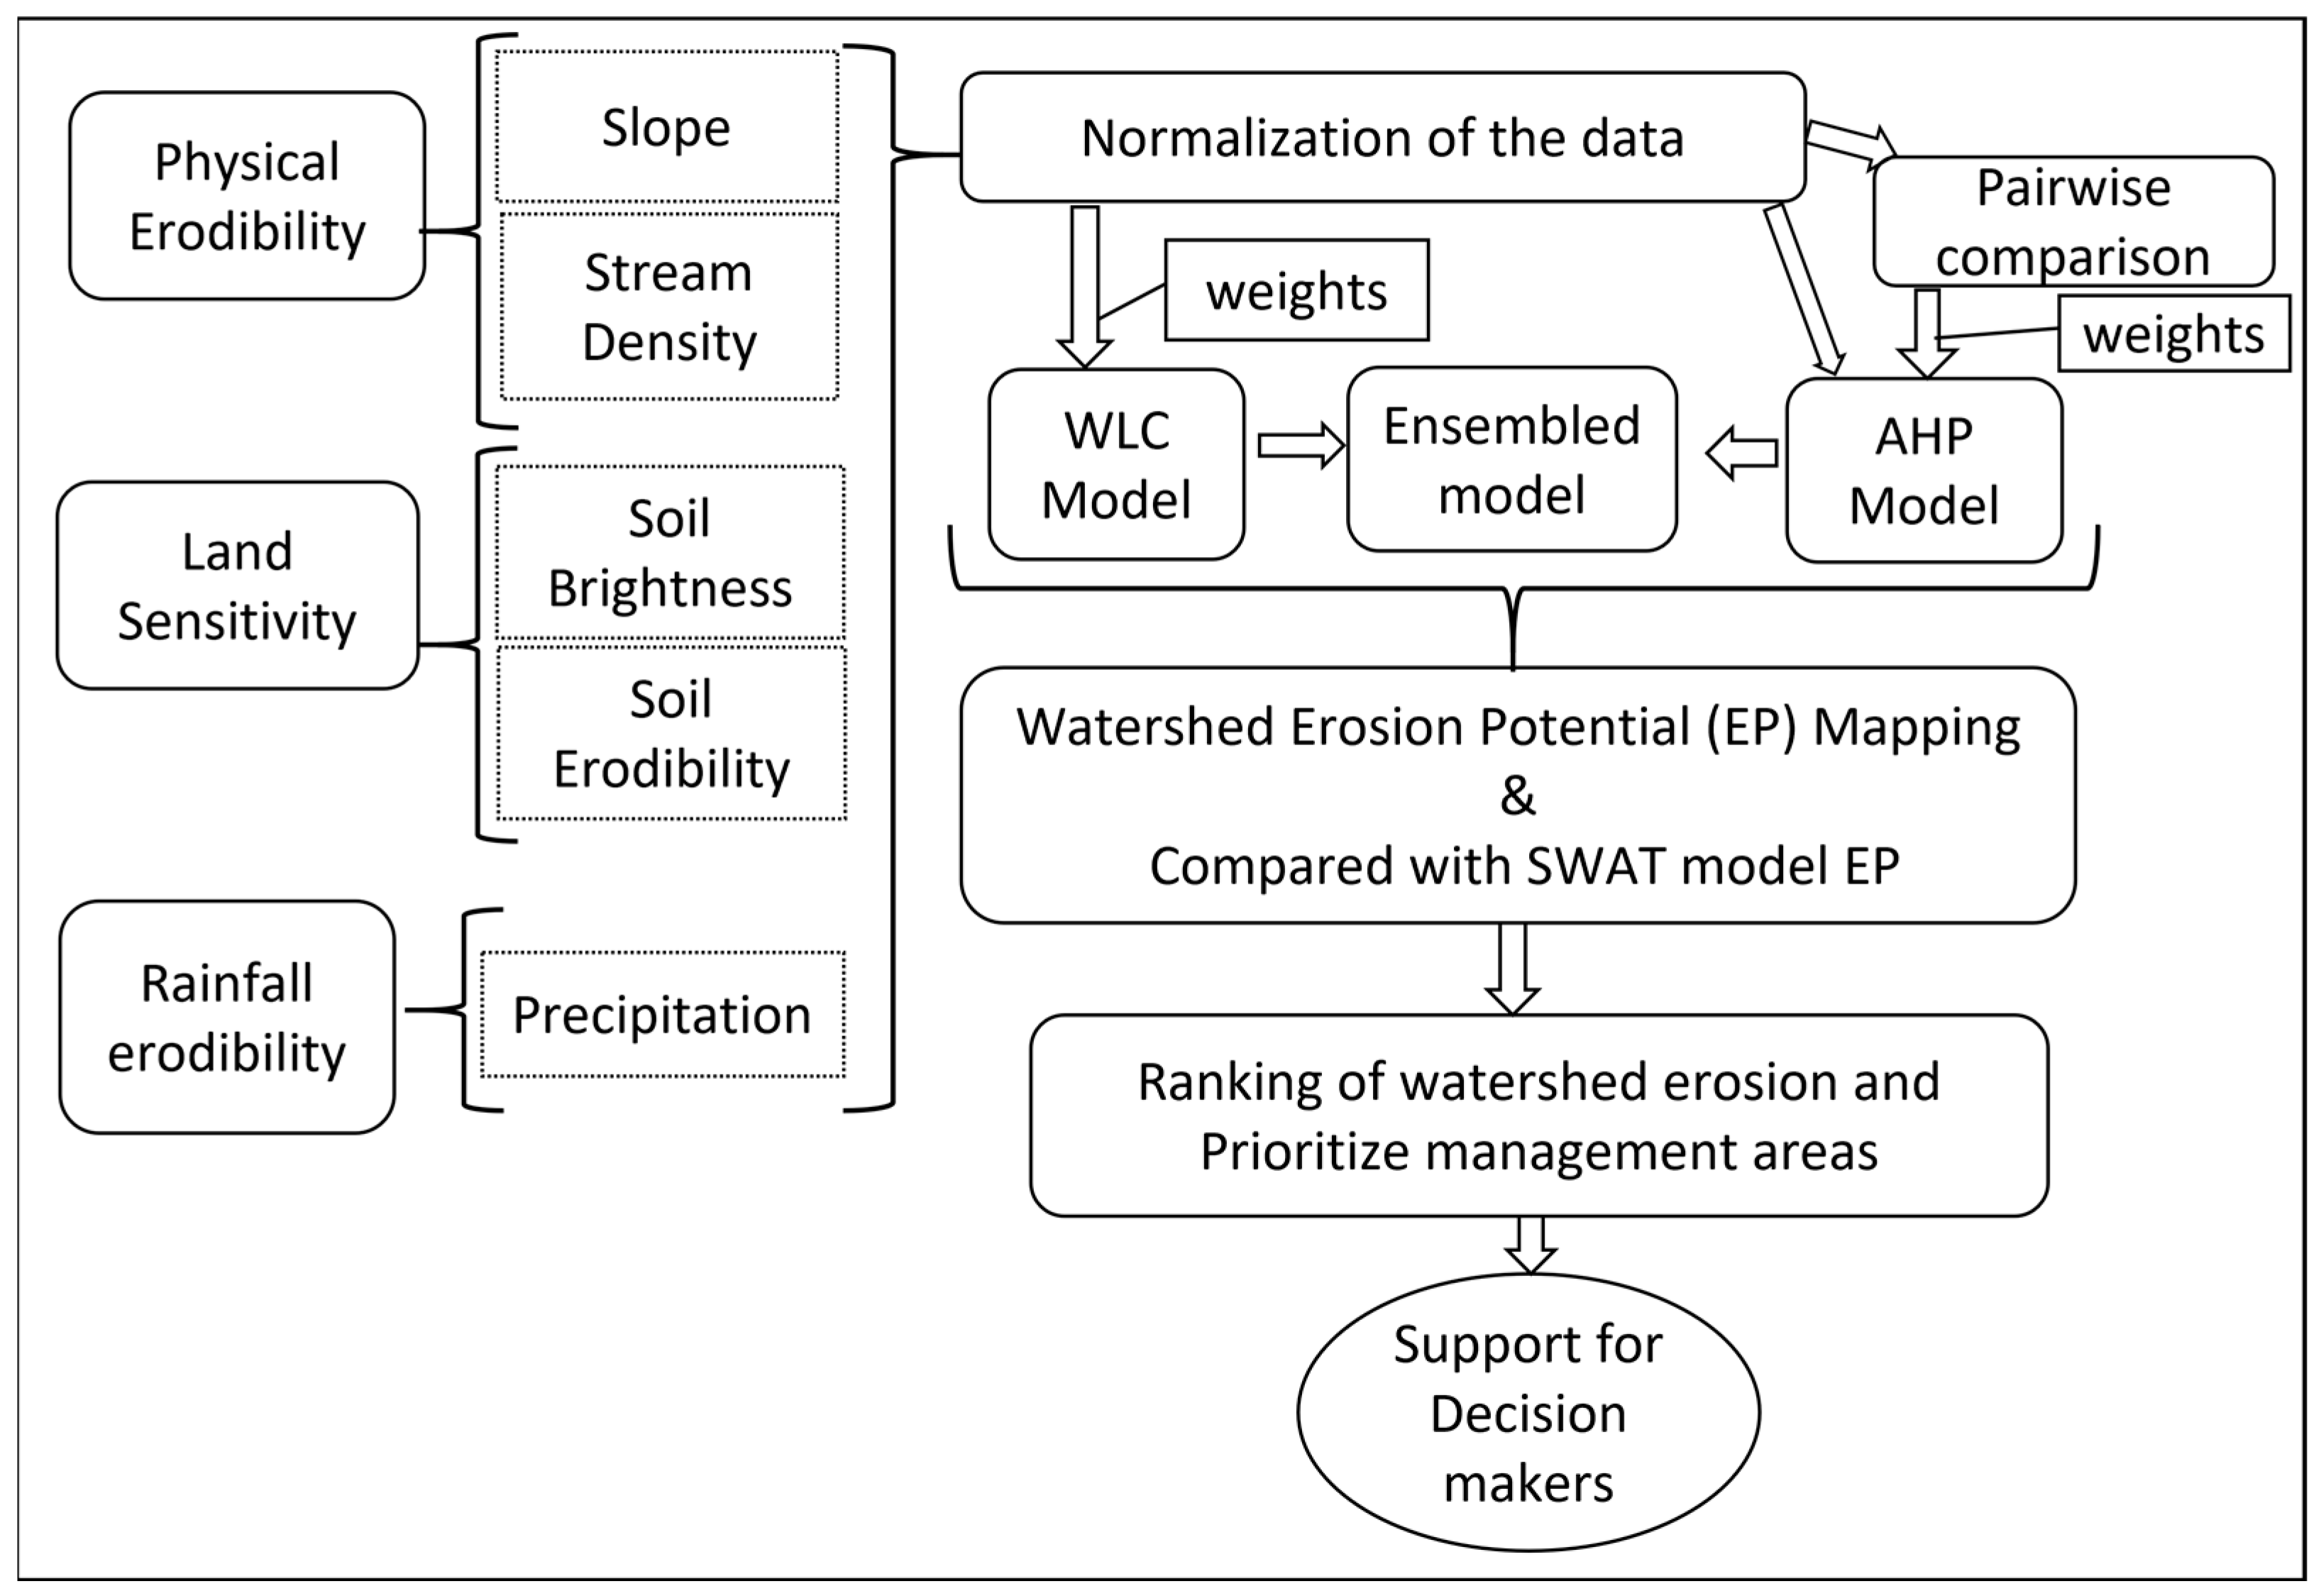
2.3. Model Description
2.4. Sensitivity Analysis
2.5. Ranking of the Management Area
3. Results
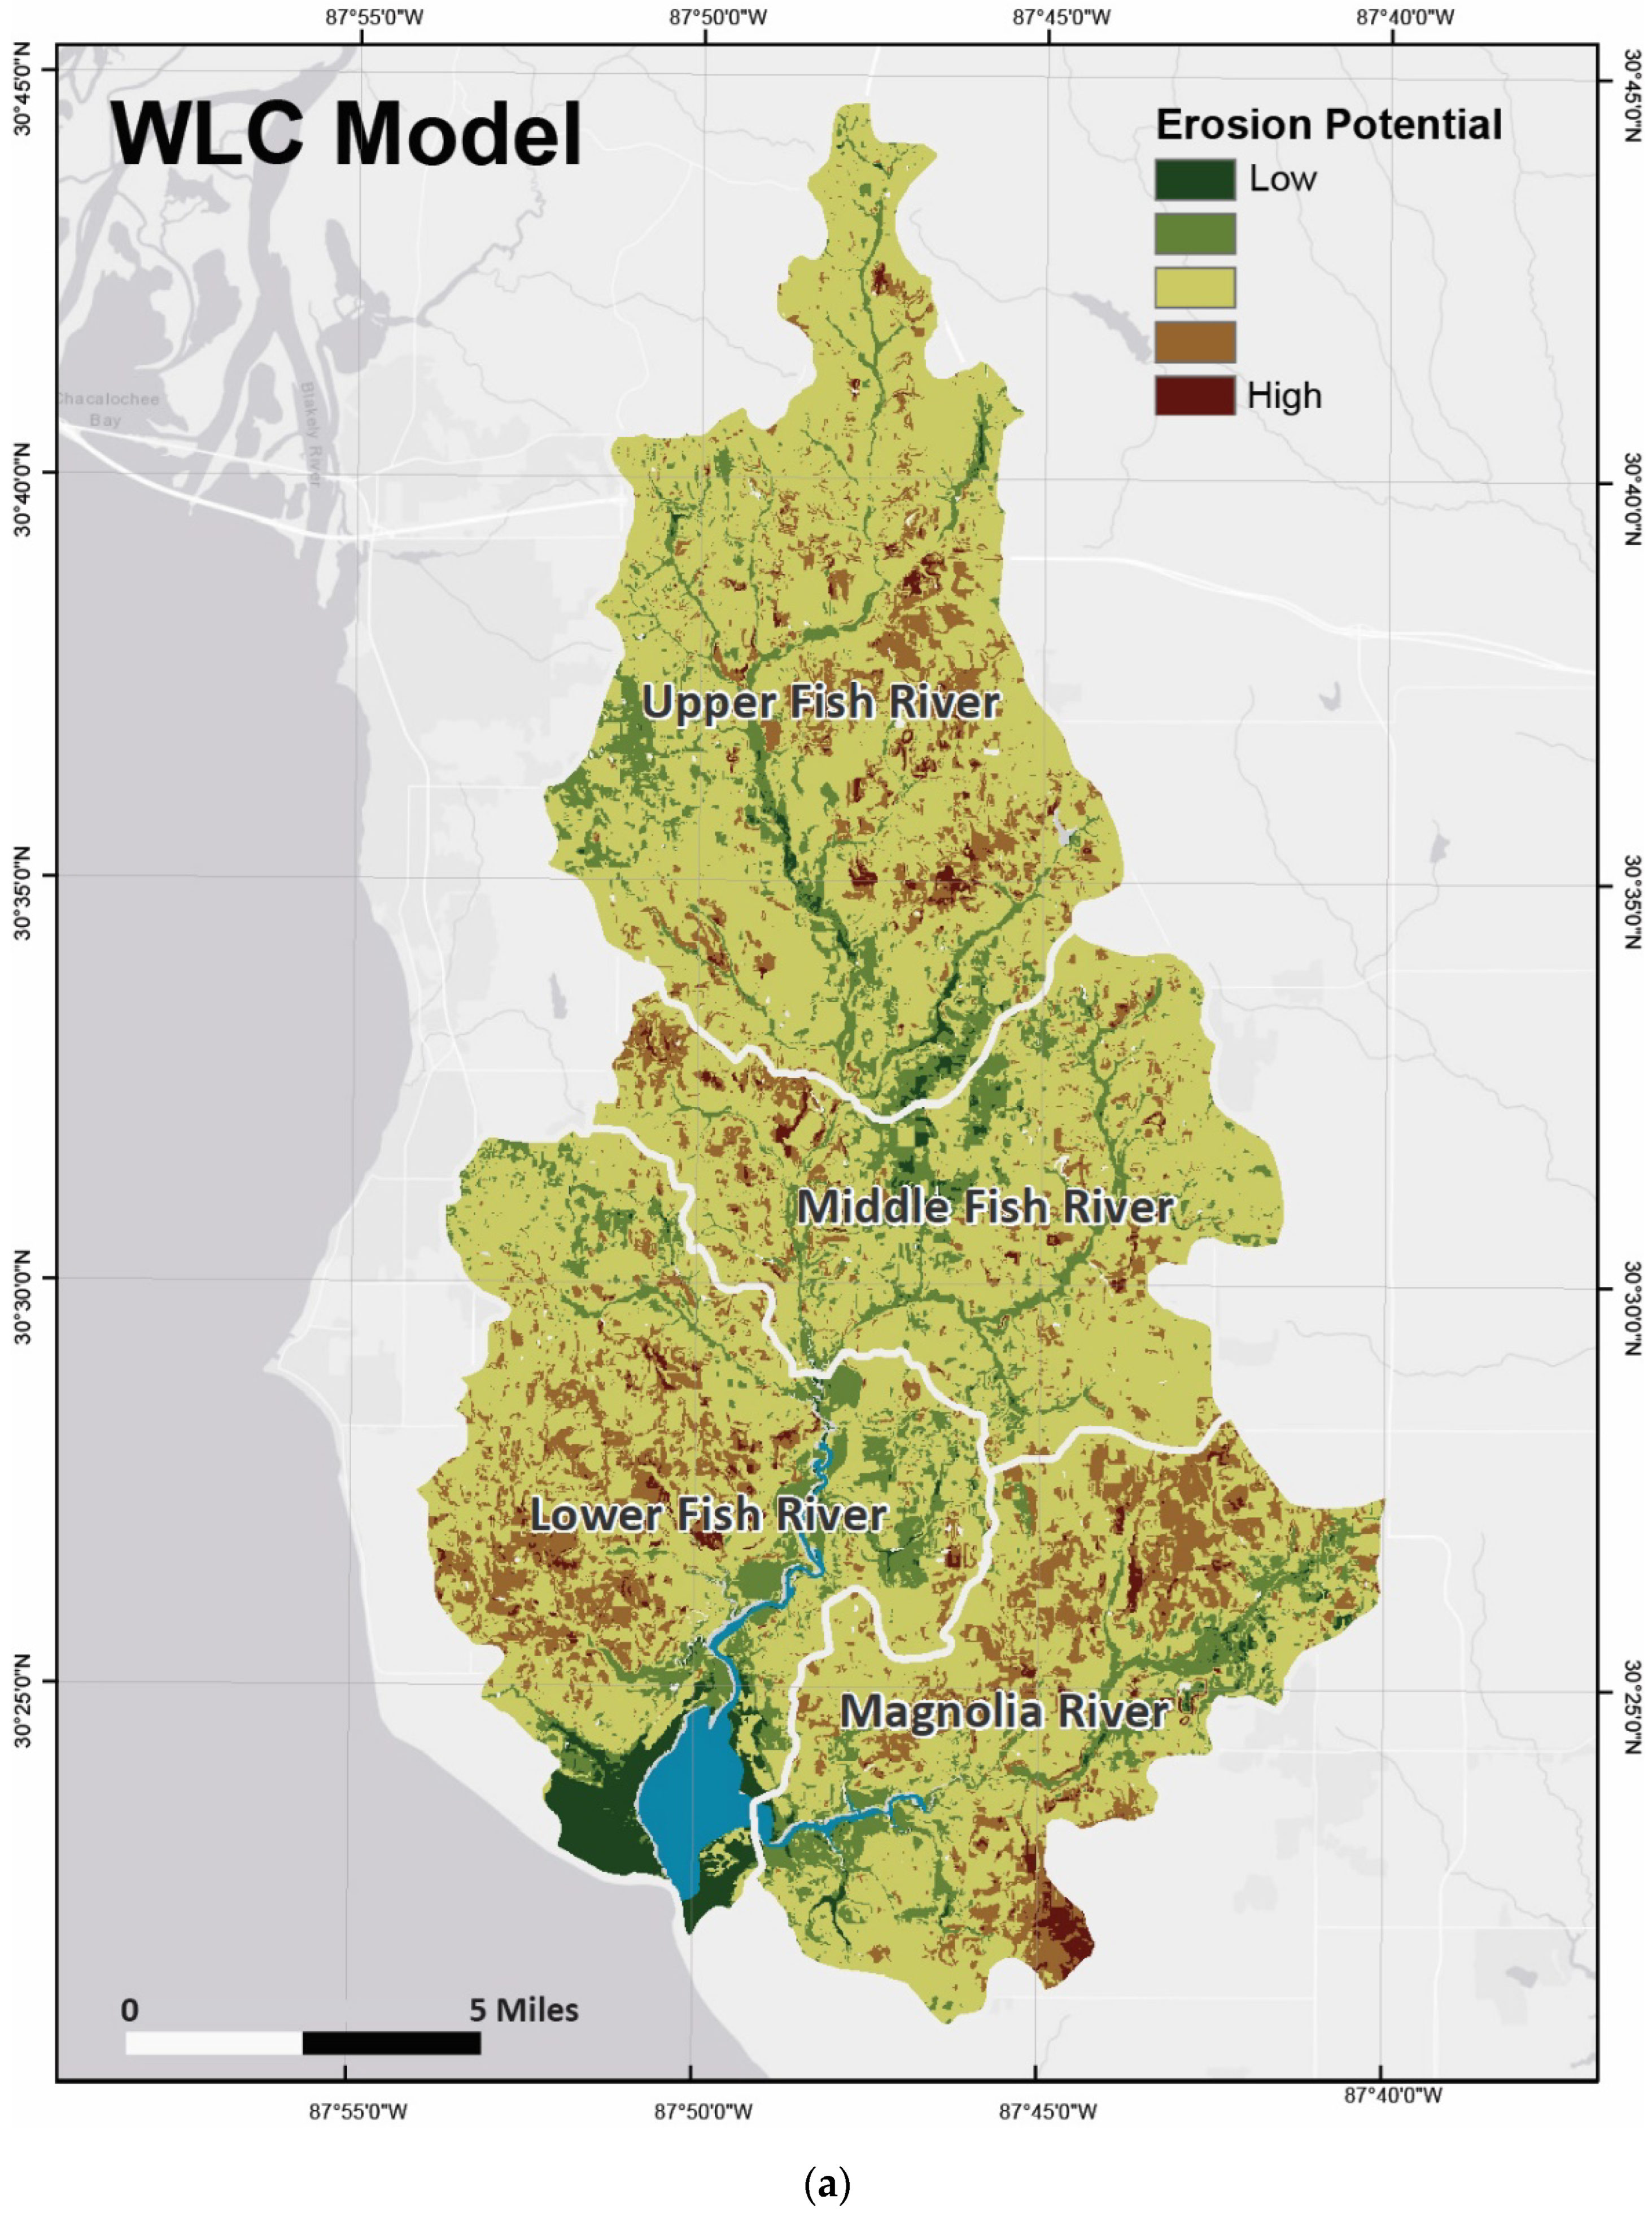
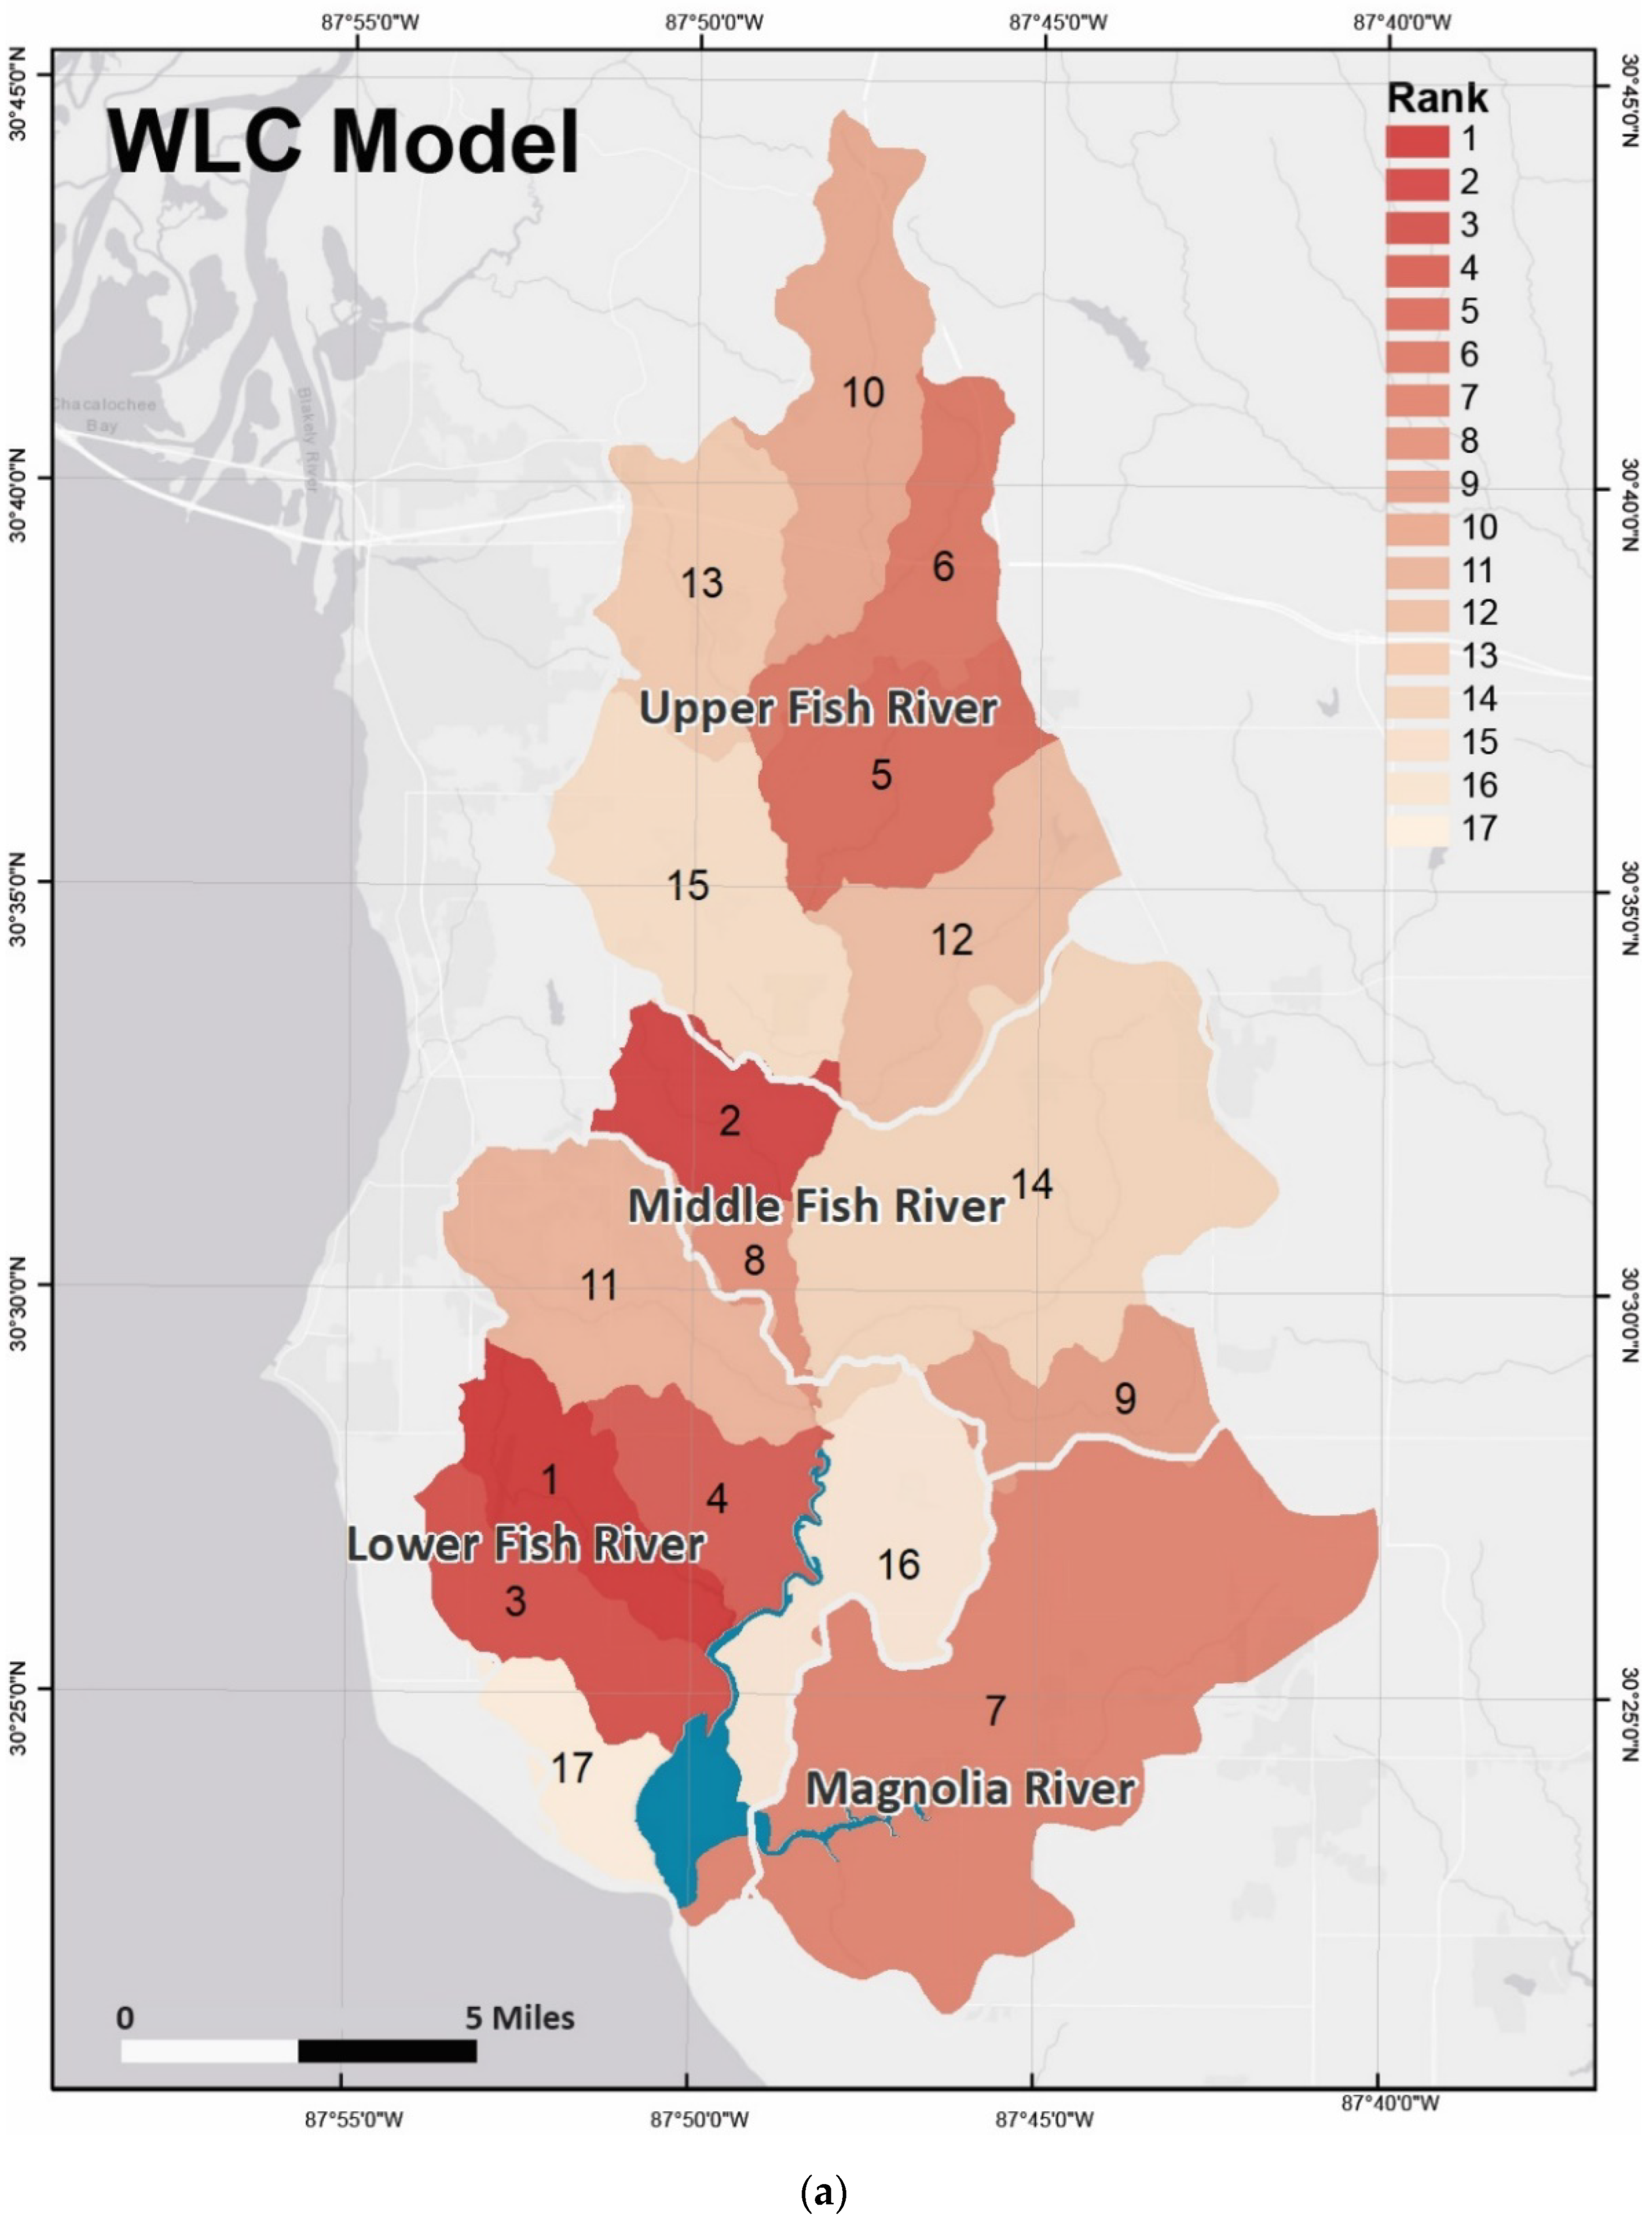
3.1. WLC Model
3.2. WLC Model Criteria Sensitivity Assessment
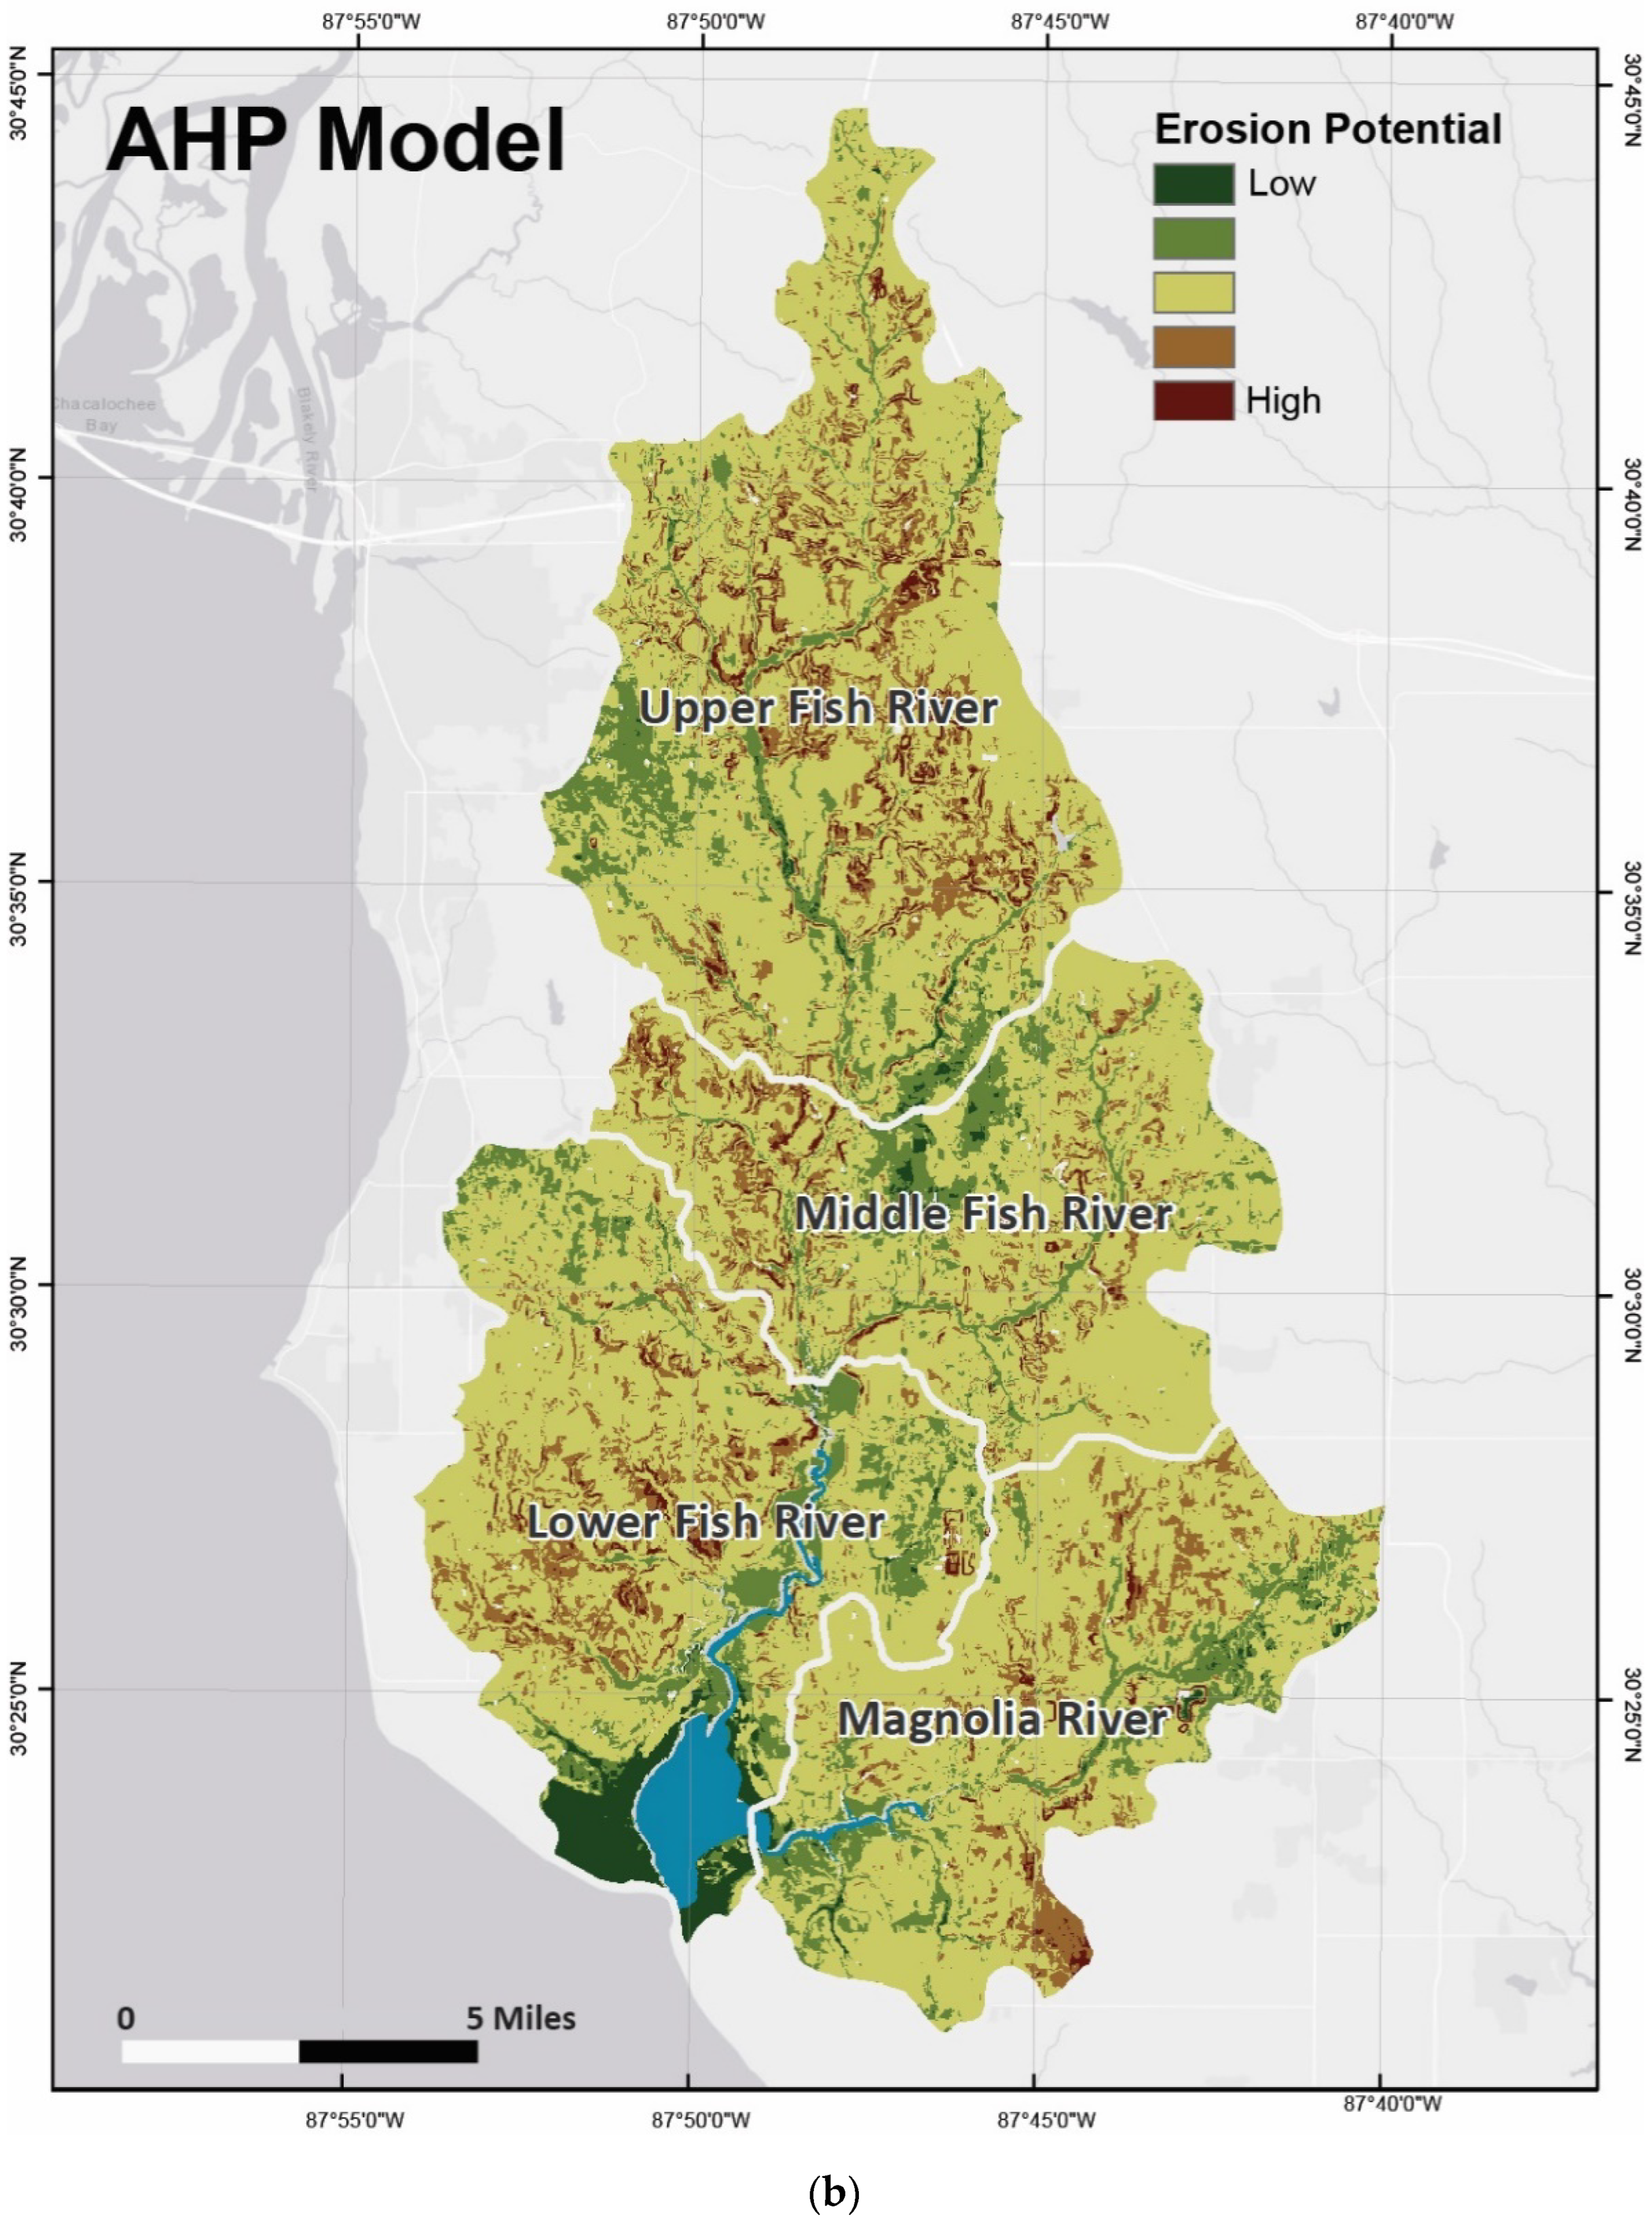
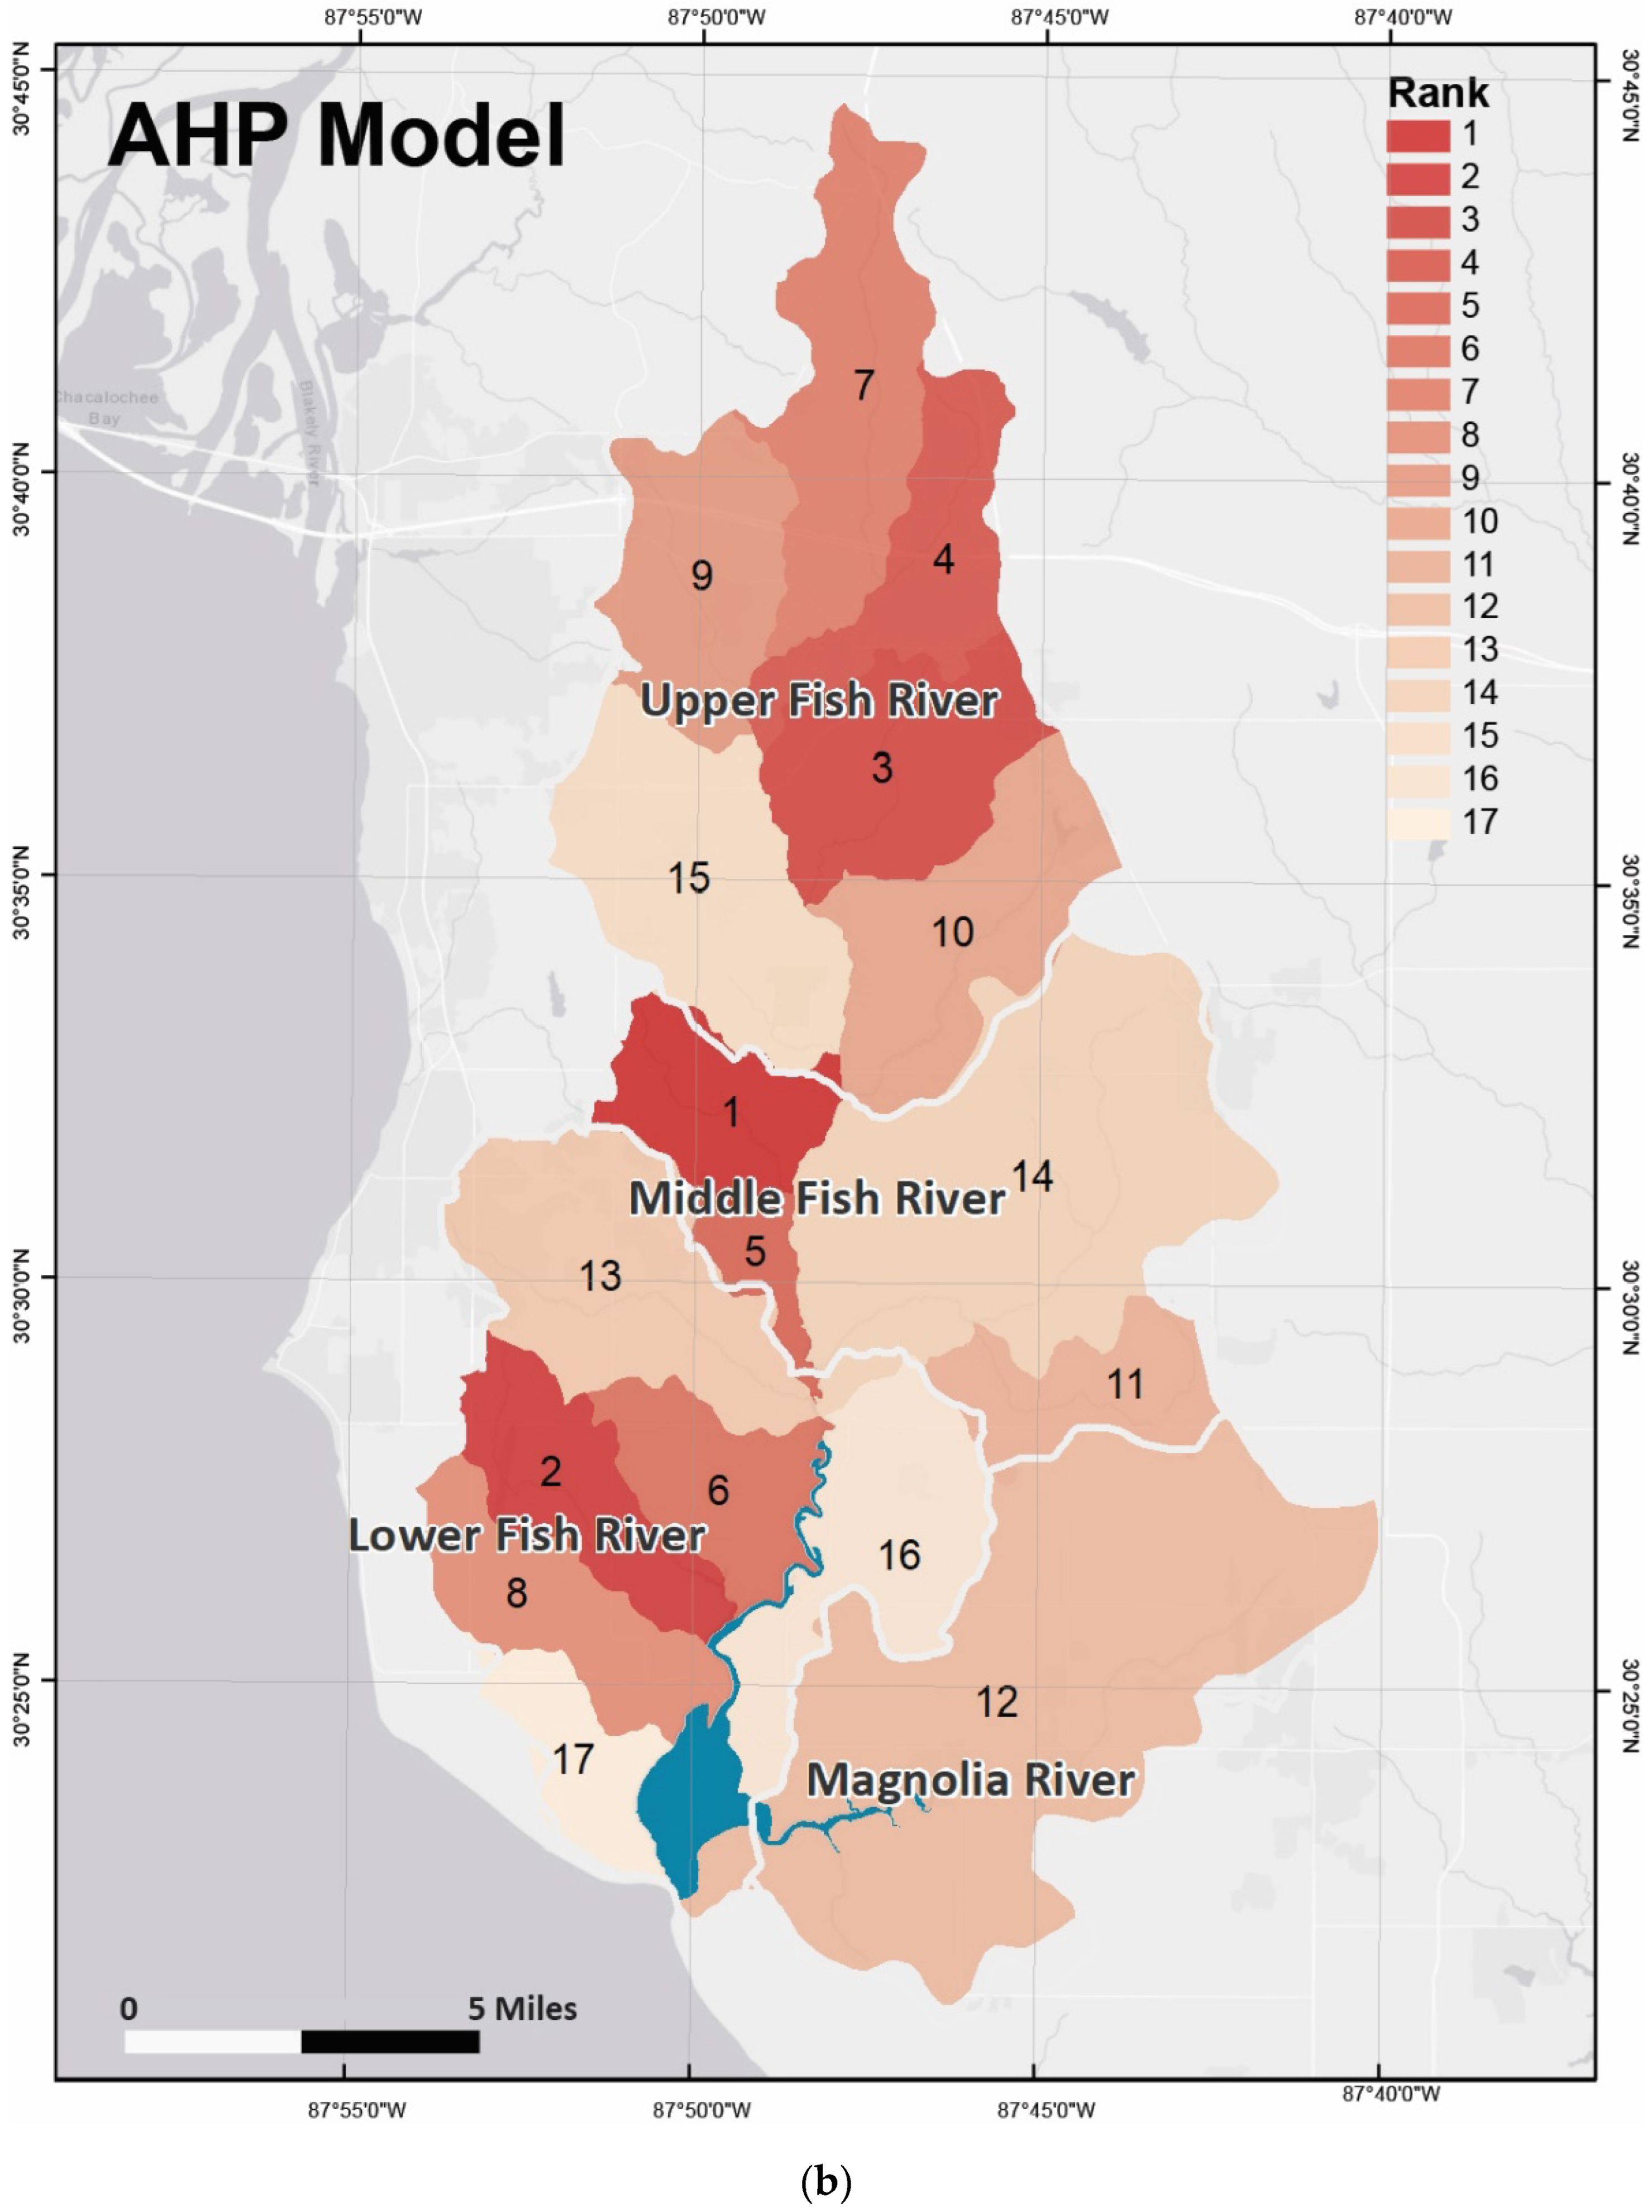
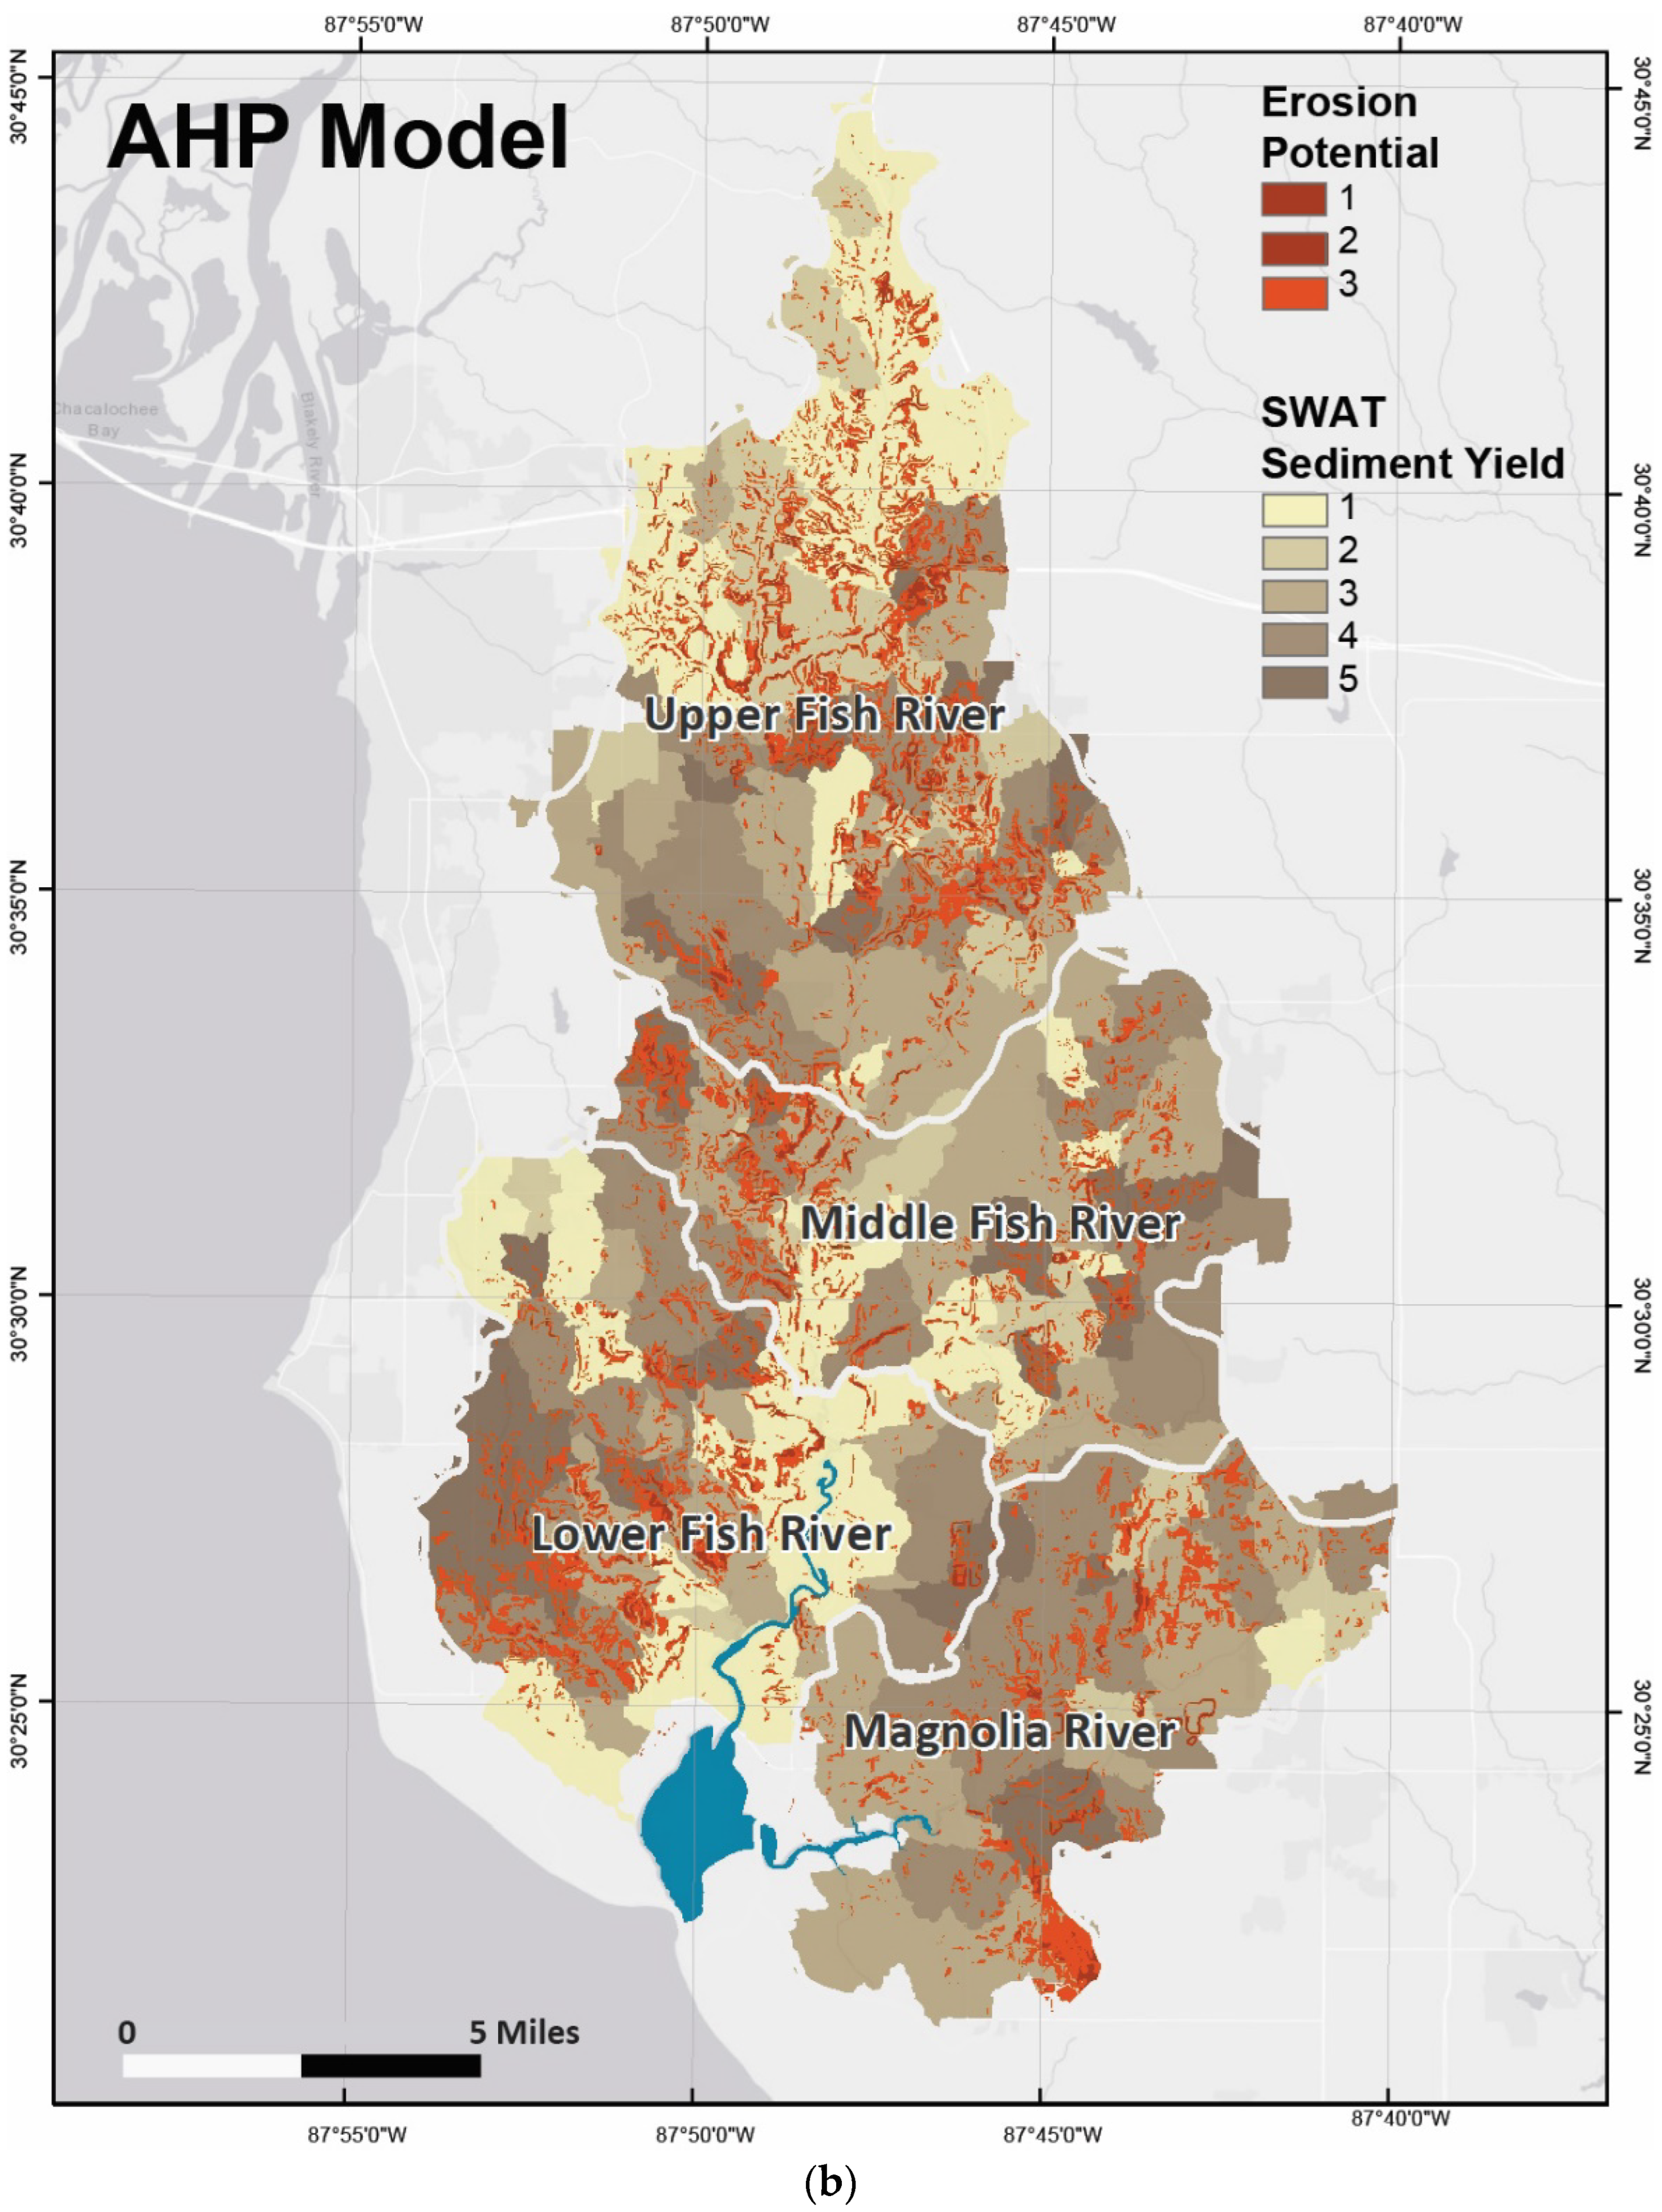
3.3. AHP Model
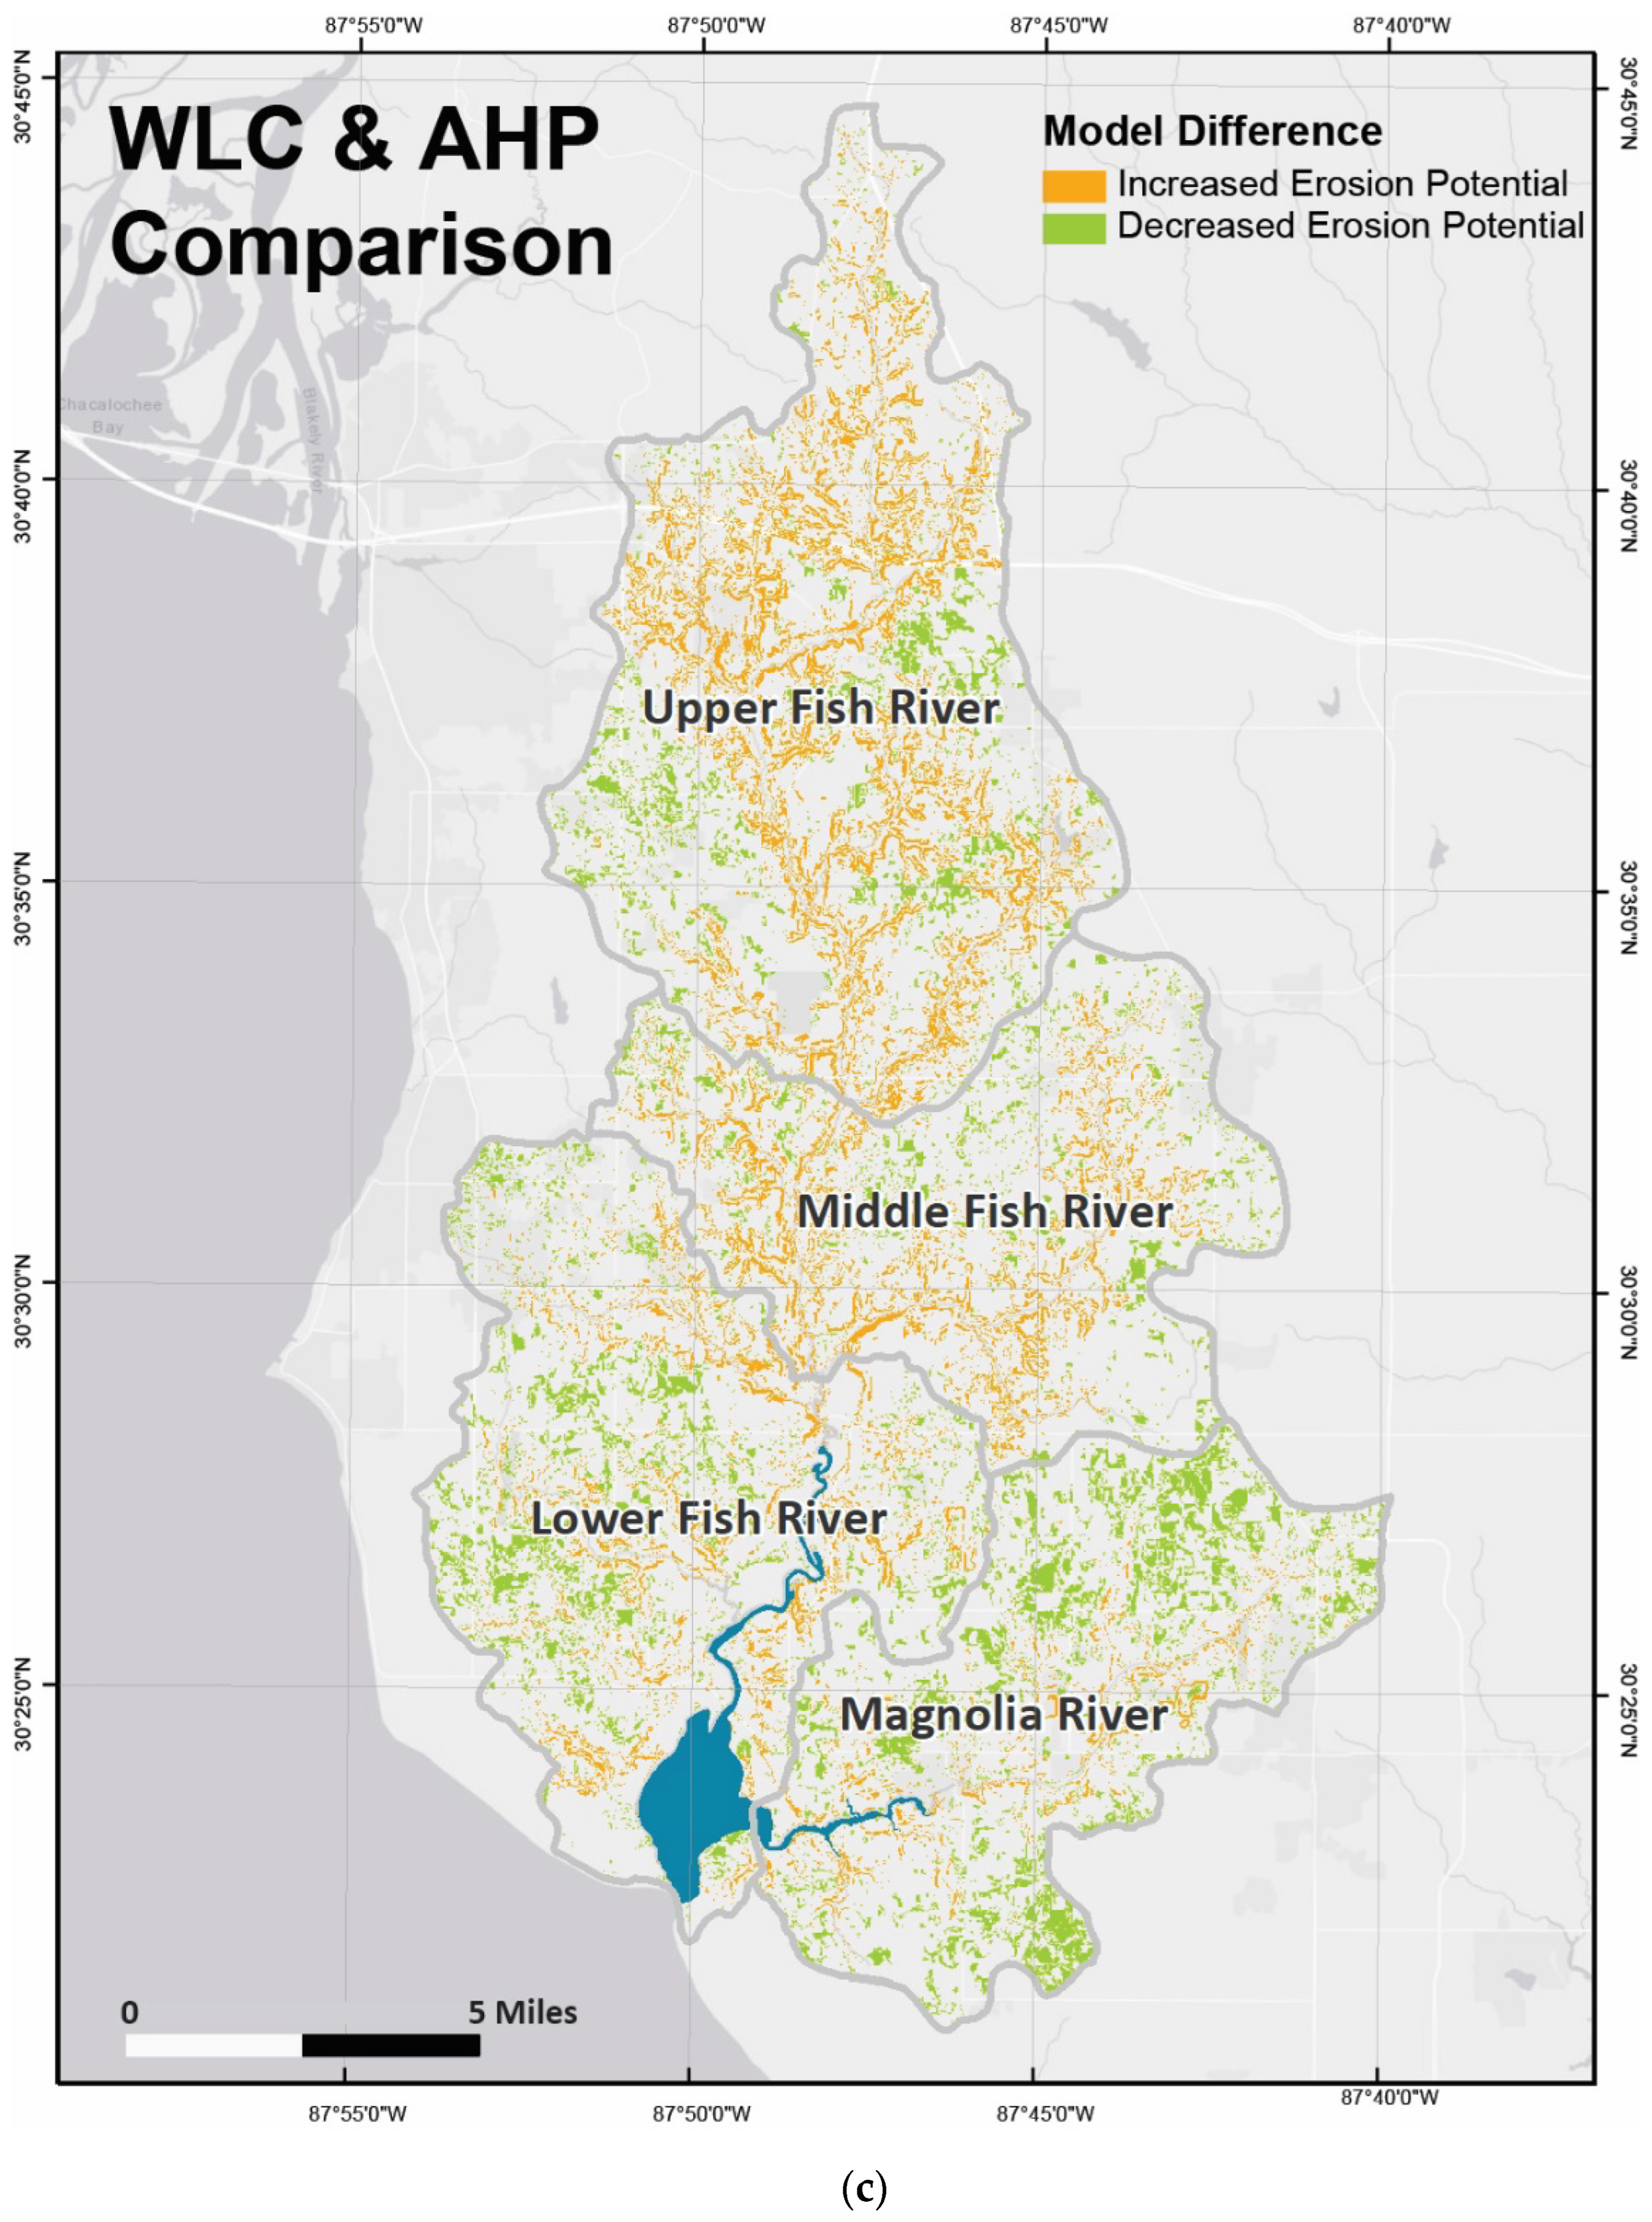
3.4. WLC and AHP Model Comparison
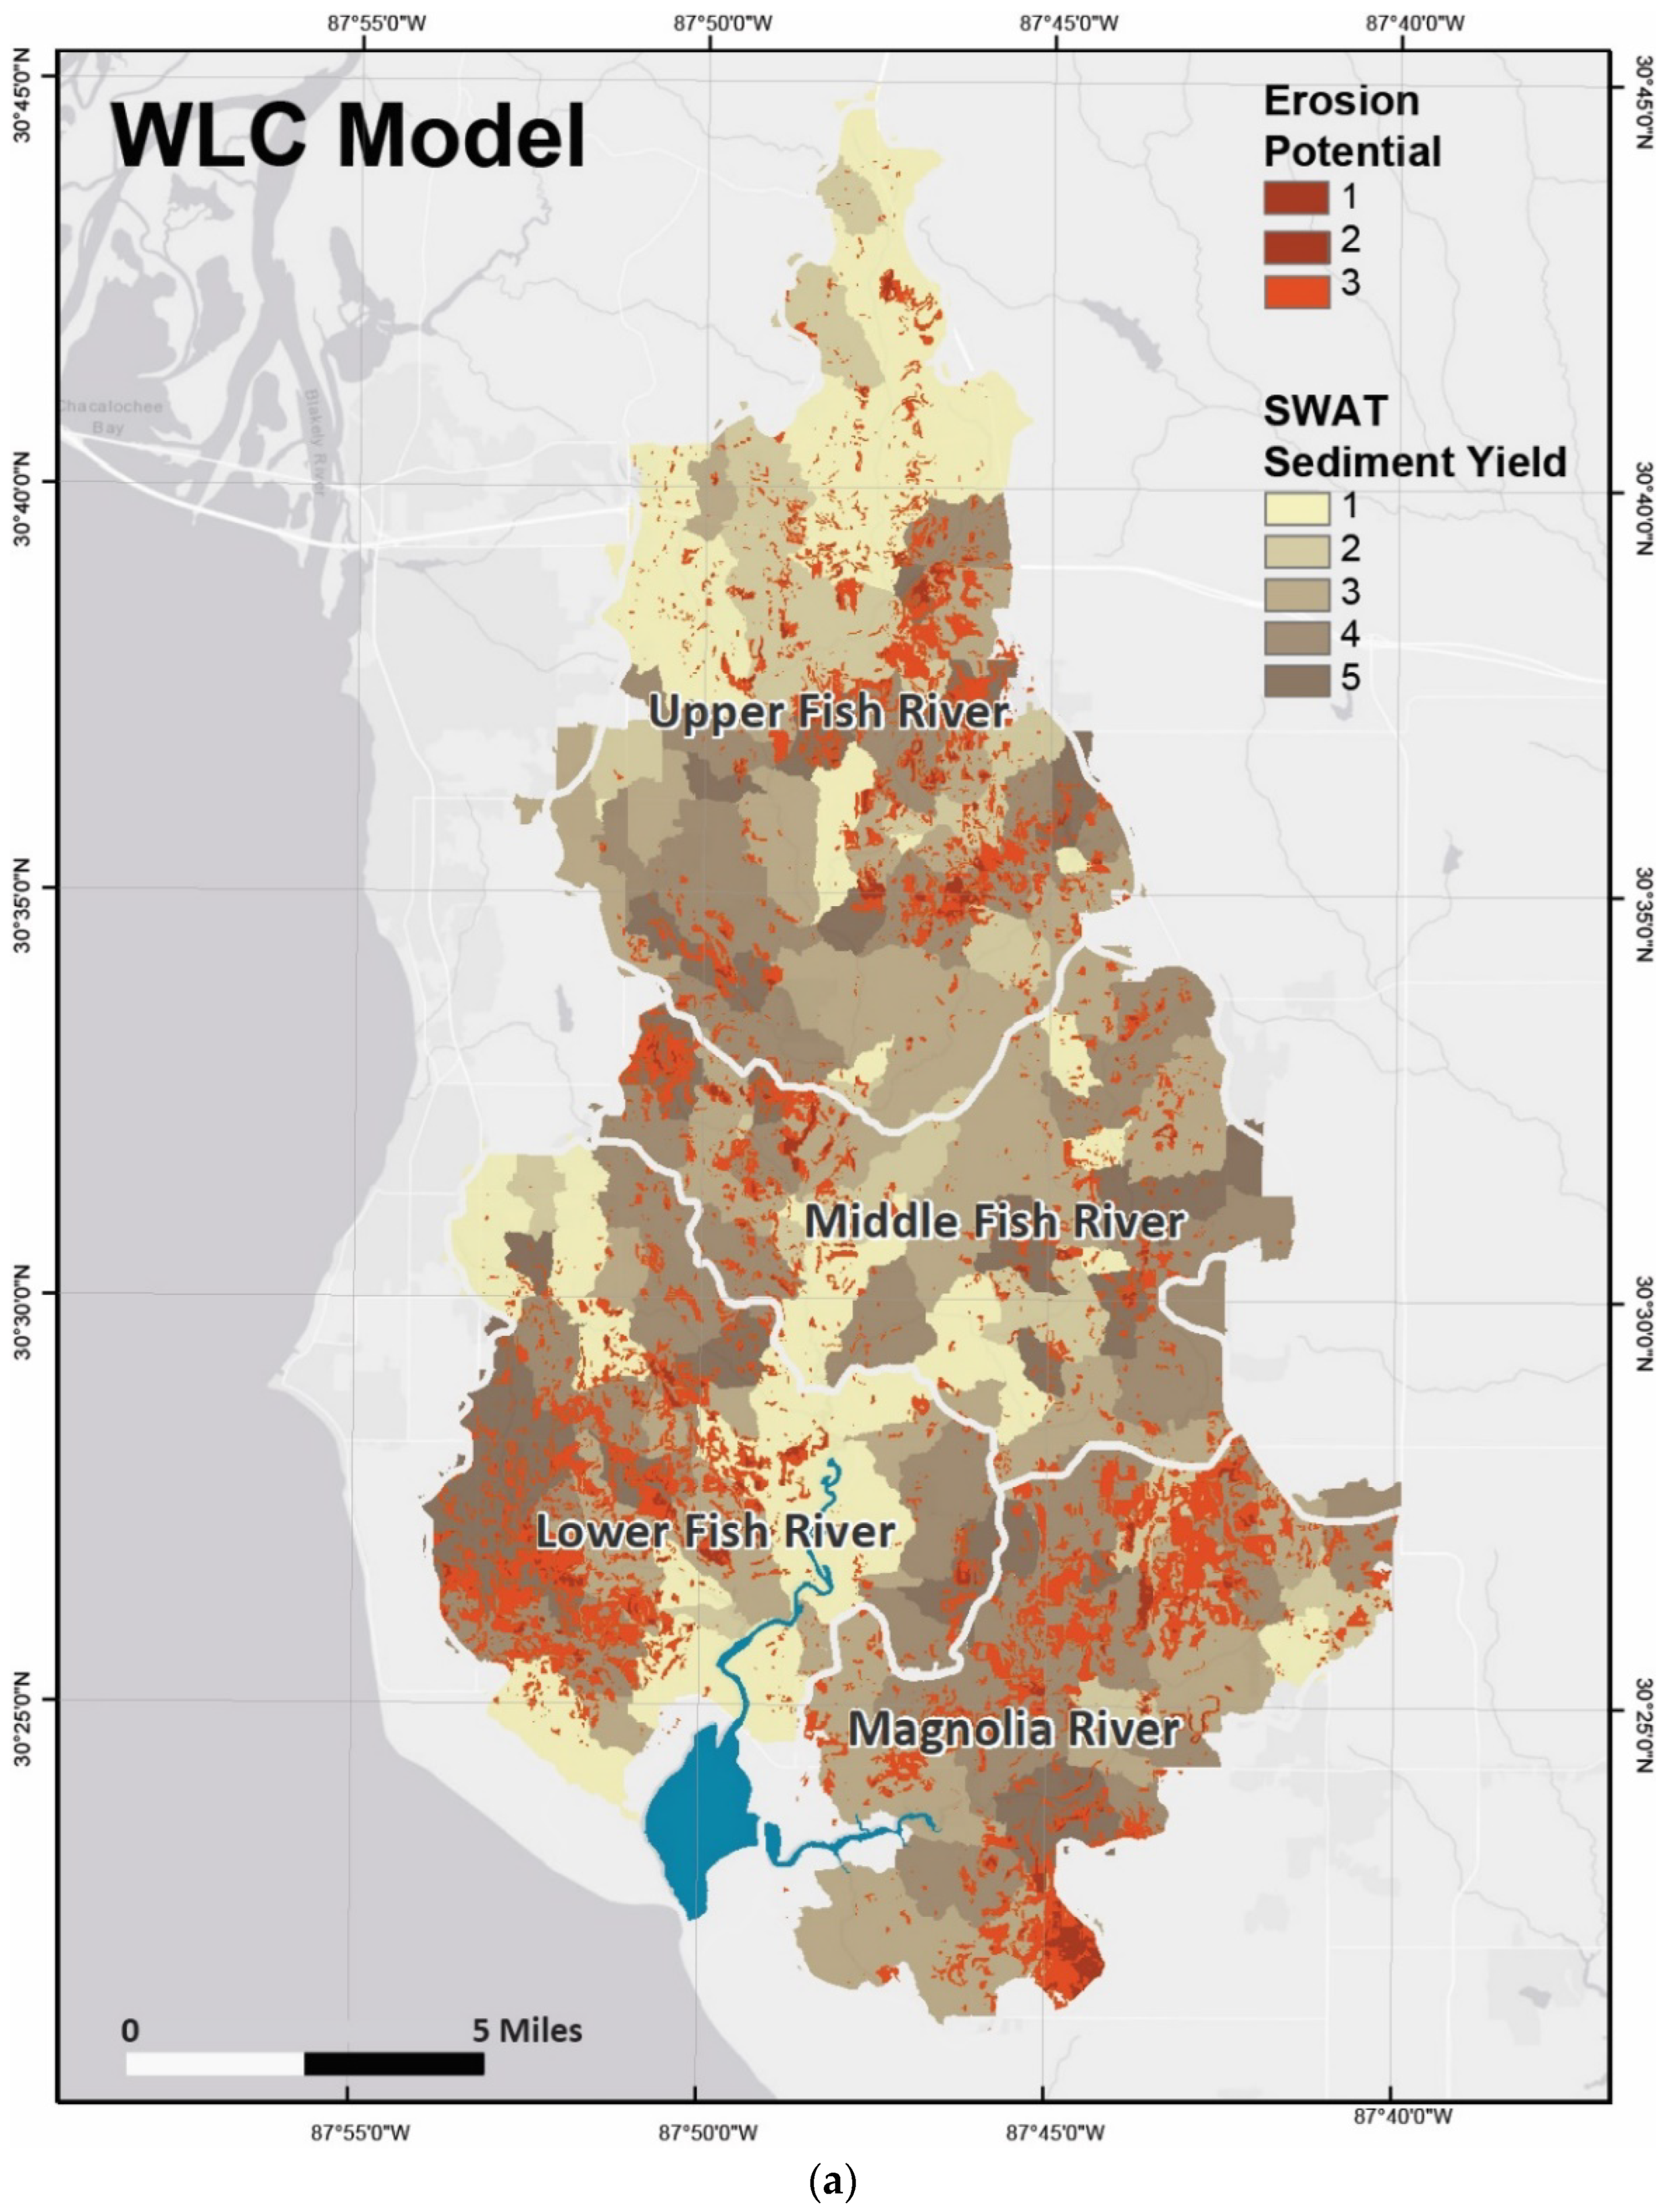
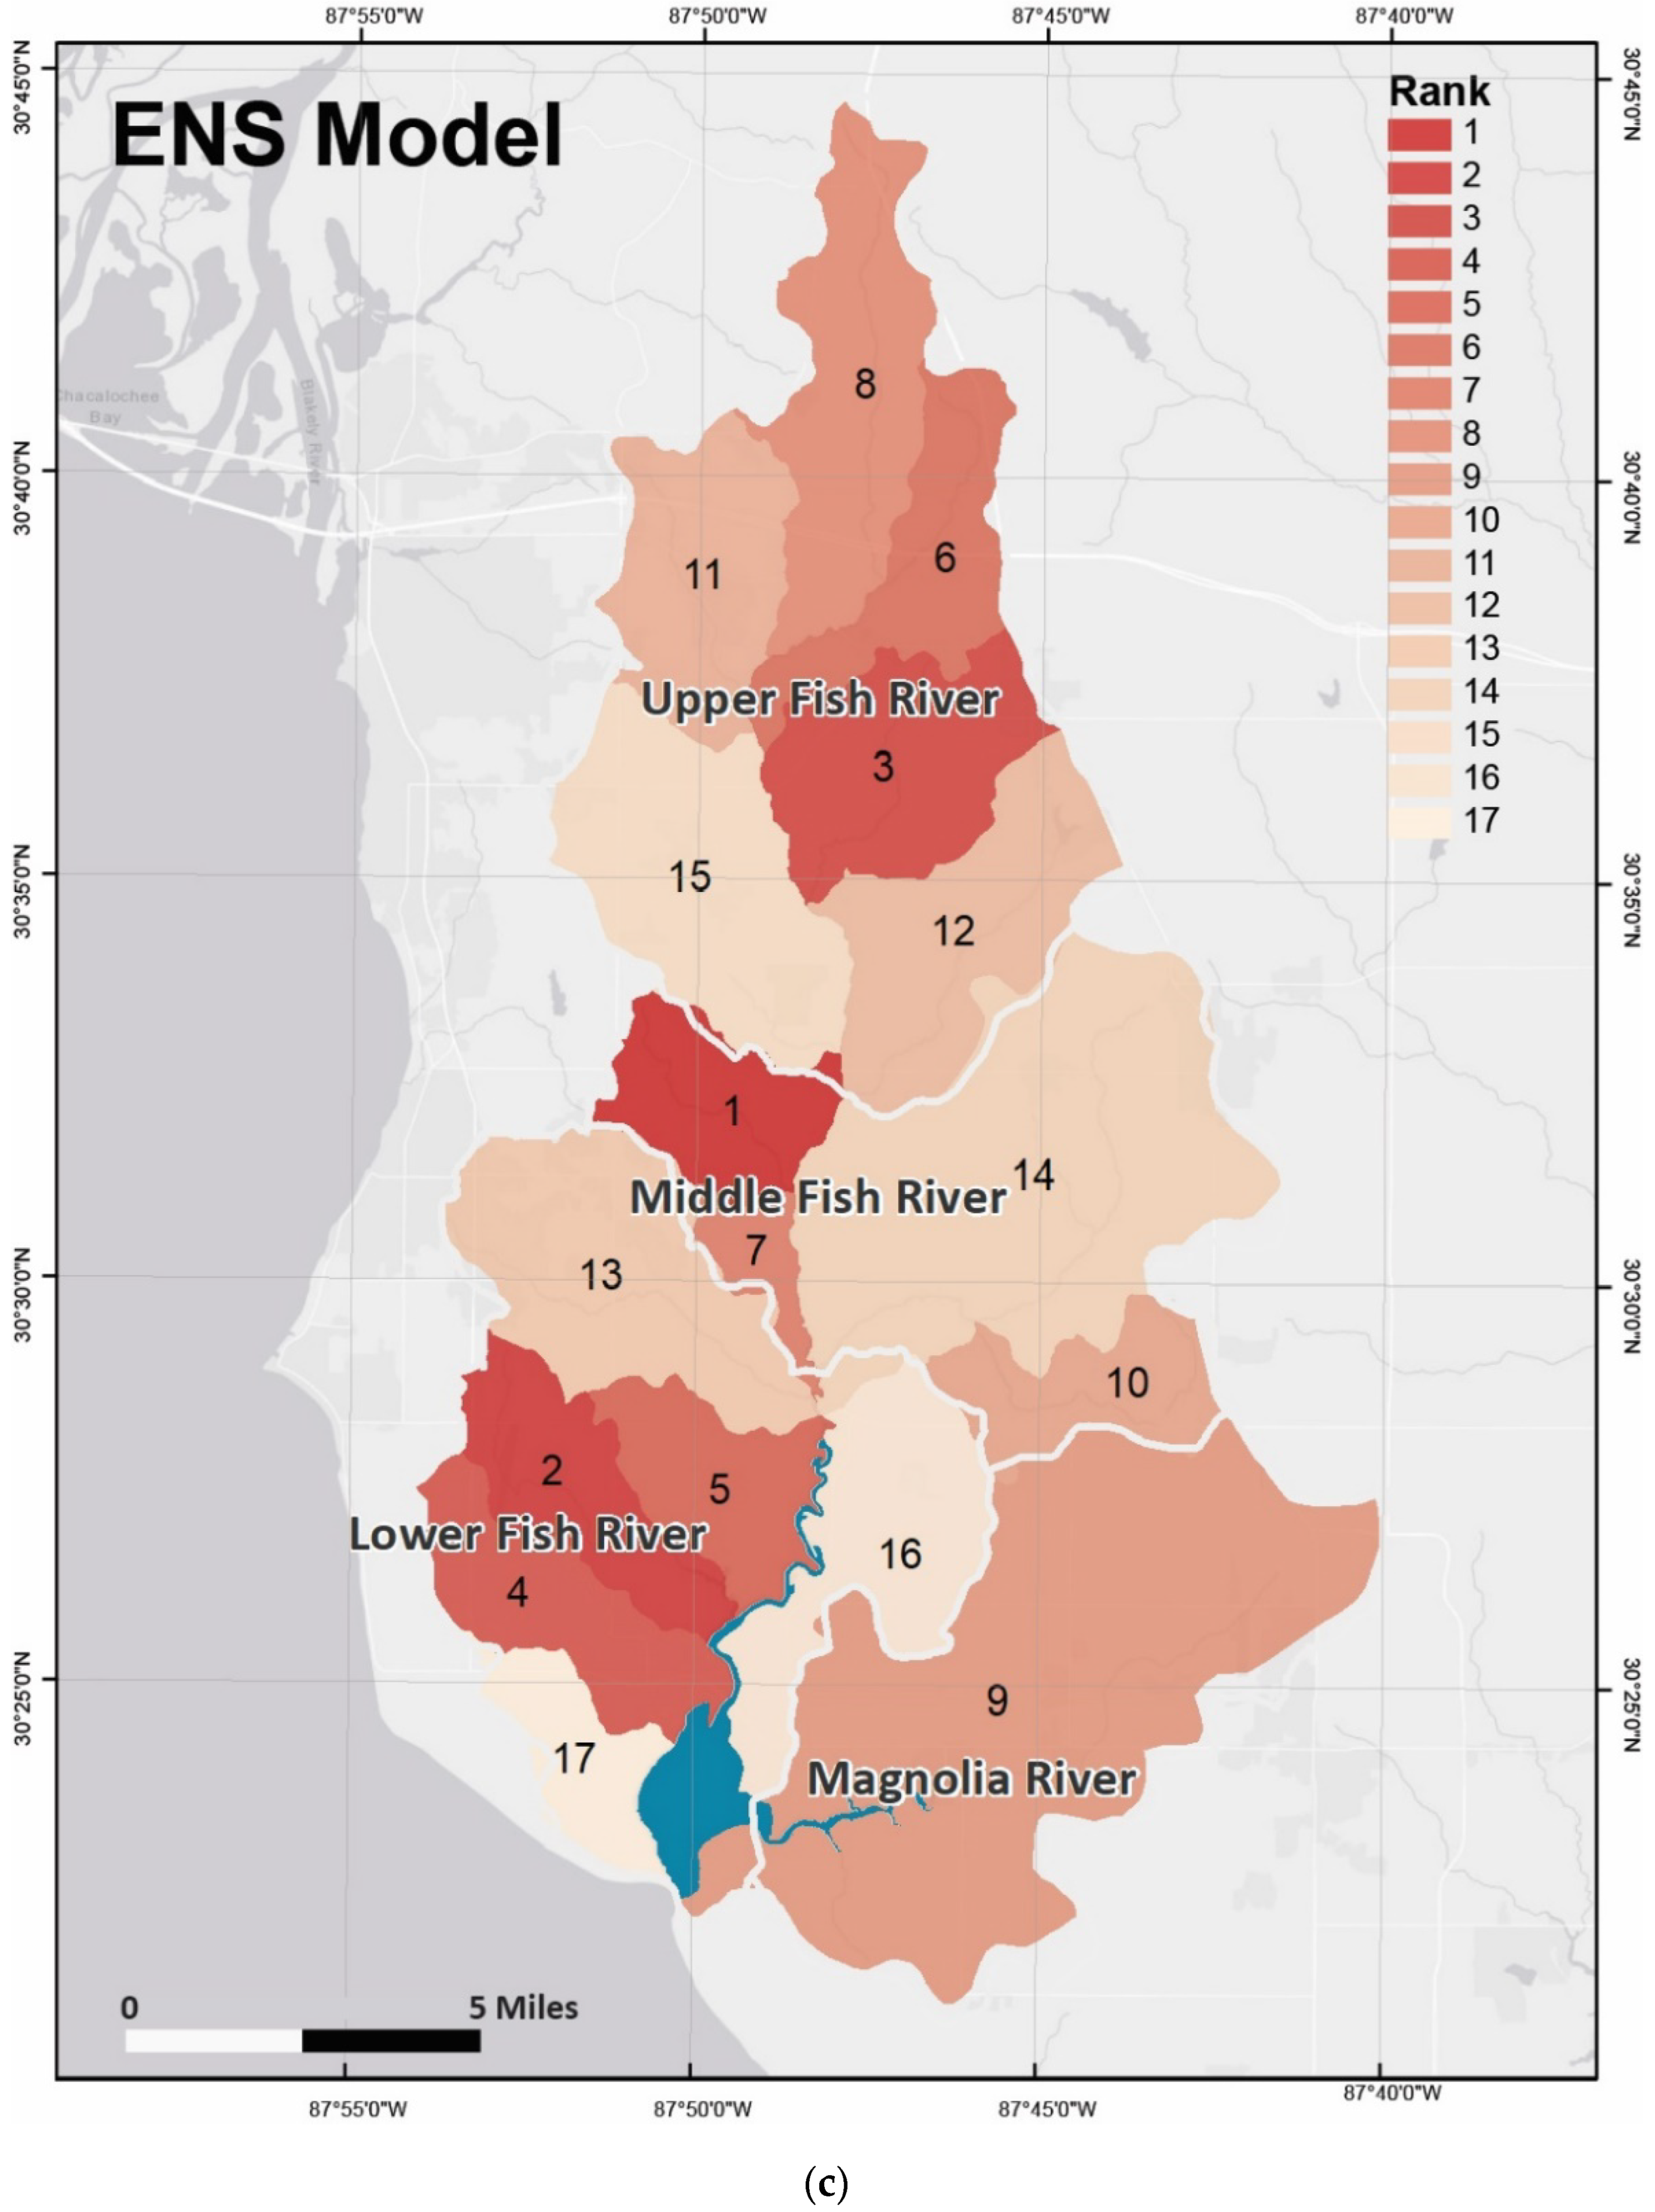
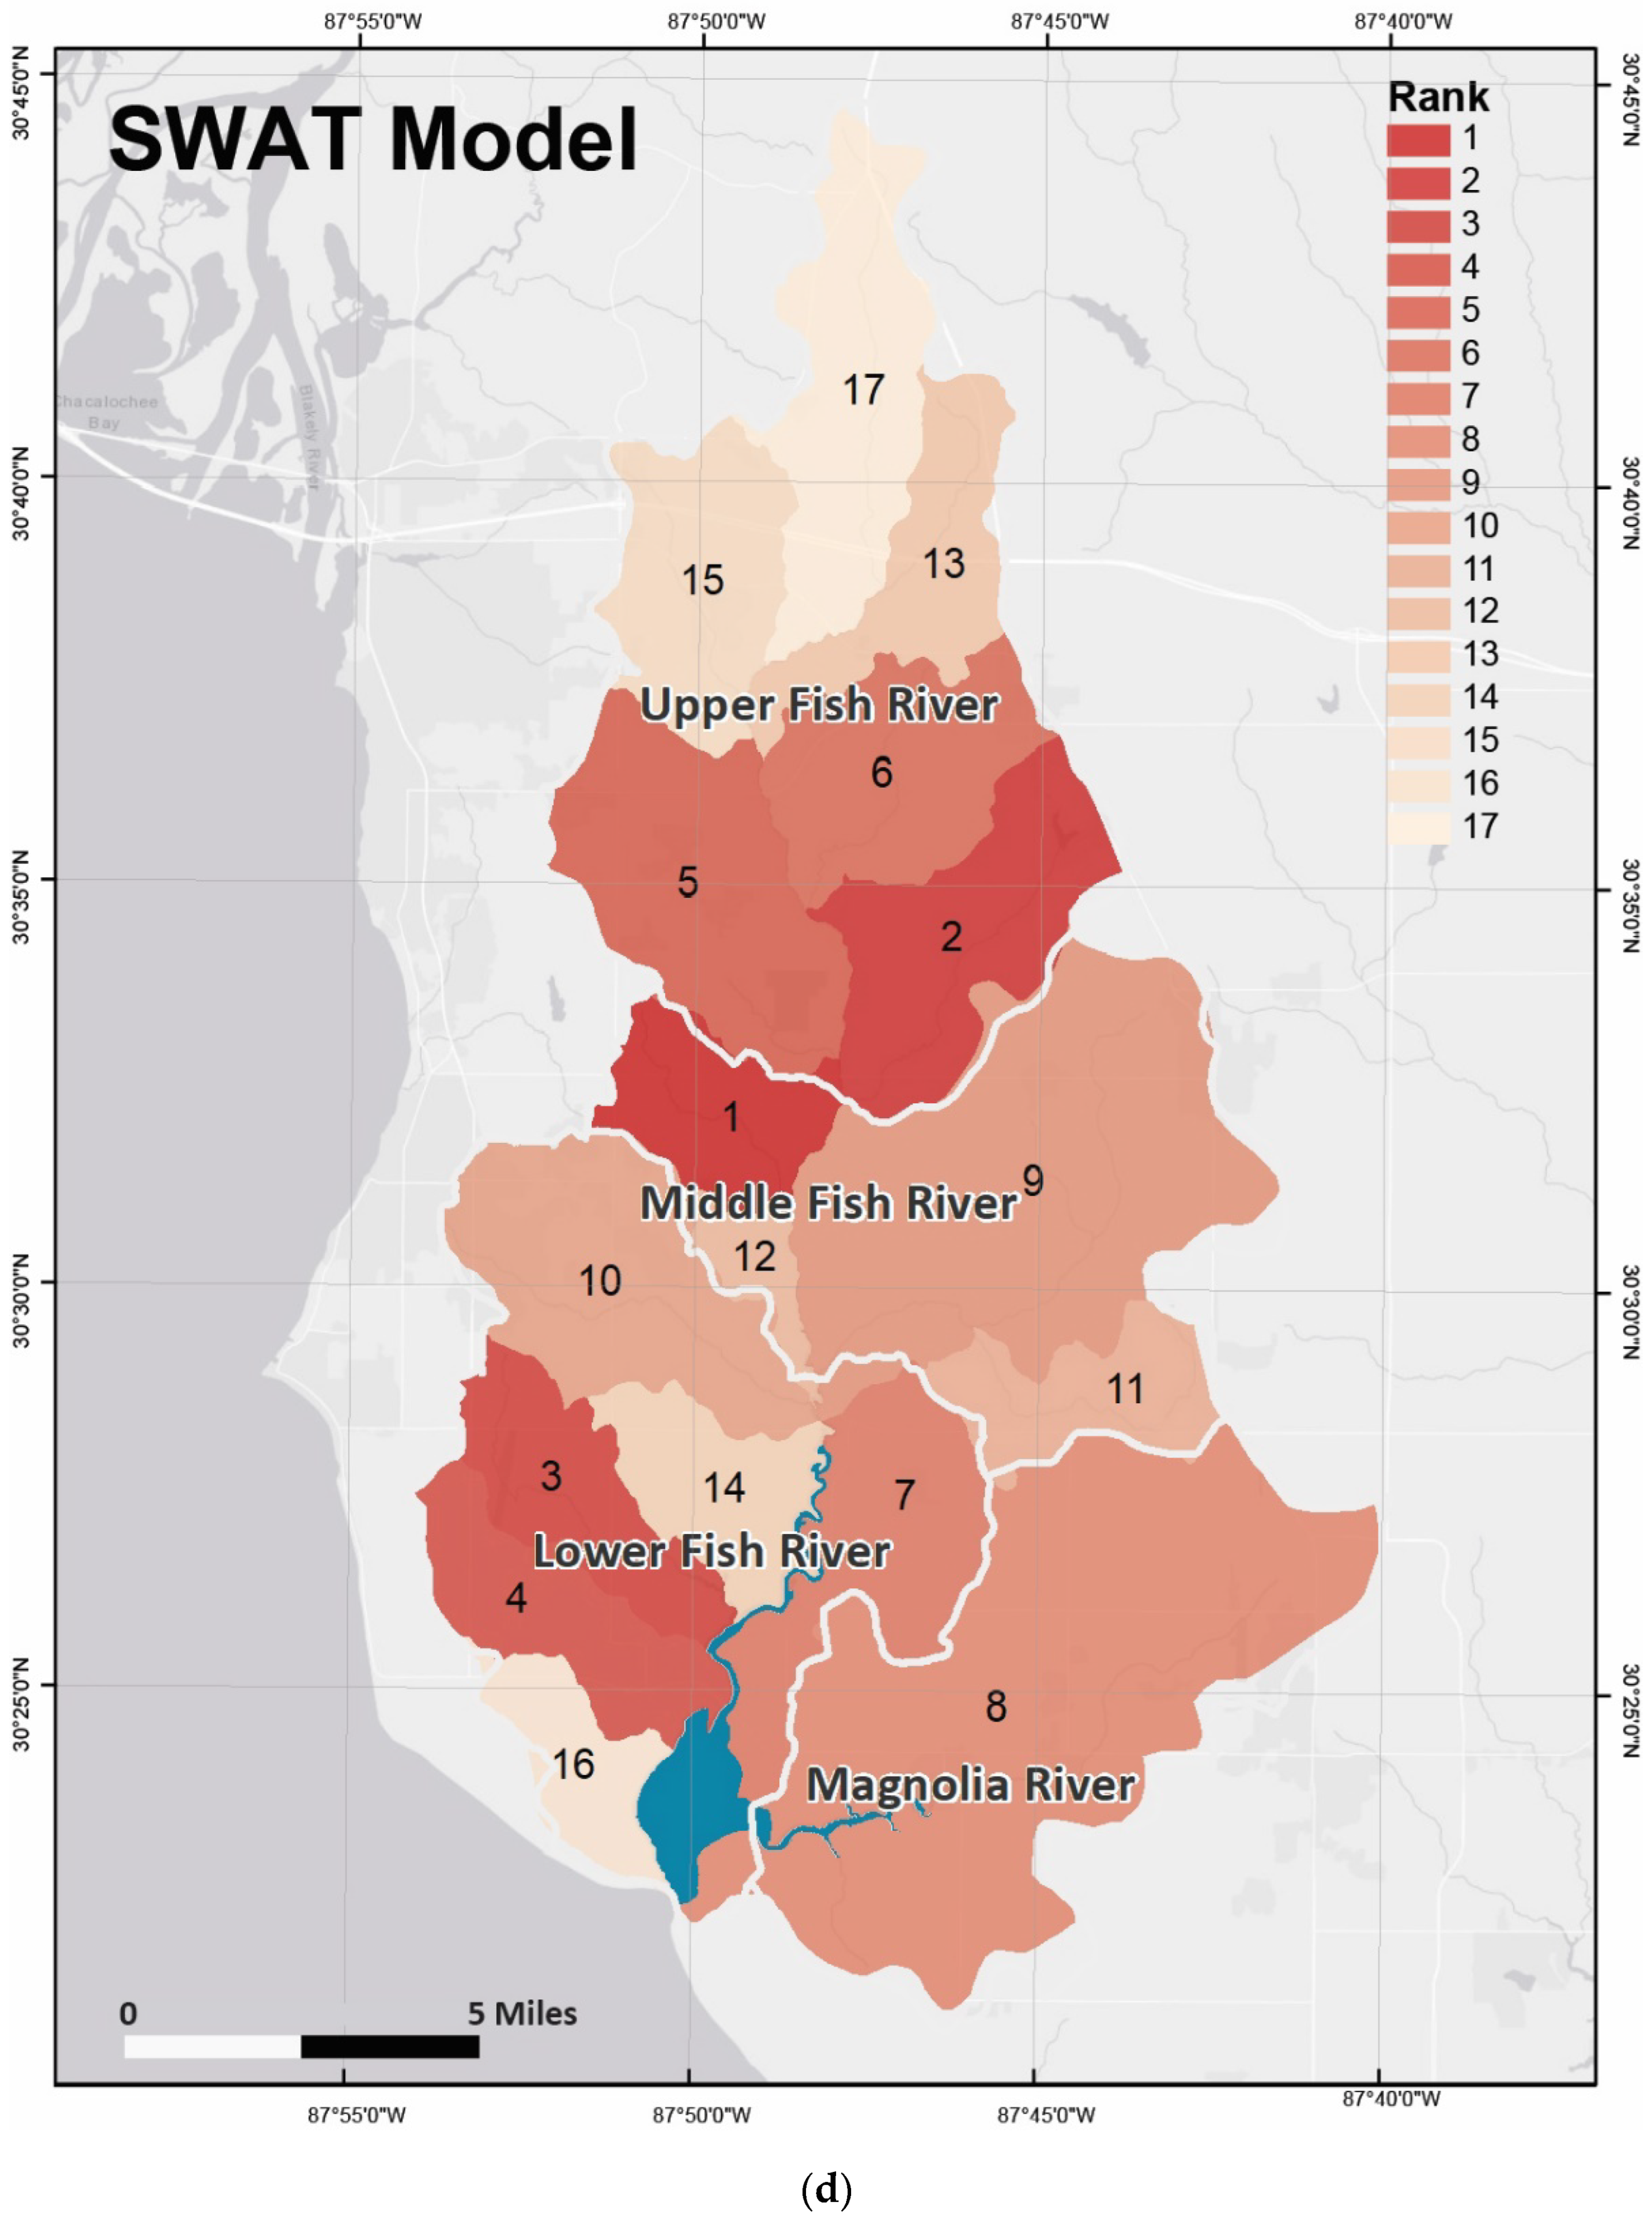
3.5. Management-Priority Area Ranking
4. Discussion
5. Conclusions
Author Contributions
Funding
Conflicts of Interest
Appendix A

| No. of Iterations | Slope | Stream Density | K-Factor | Soil Brightness | Precipitation |
|---|---|---|---|---|---|
| −20 | 0.270 | 0.184 | 0.166 | 0.158 | 0.222 |
| −19 | 0.274 | 0.183 | 0.165 | 0.157 | 0.221 |
| −18 | 0.277 | 0.182 | 0.164 | 0.156 | 0.220 |
| −17 | 0.281 | 0.181 | 0.164 | 0.155 | 0.219 |
| −16 | 0.284 | 0.180 | 0.163 | 0.154 | 0.219 |
| −15 | 0.287 | 0.180 | 0.162 | 0.154 | 0.218 |
| −14 | 0.291 | 0.179 | 0.161 | 0.153 | 0.217 |
| −13 | 0.294 | 0.178 | 0.160 | 0.152 | 0.216 |
| −12 | 0.297 | 0.177 | 0.159 | 0.151 | 0.215 |
| −11 | 0.301 | 0.176 | 0.158 | 0.150 | 0.214 |
| −10 | 0.304 | 0.175 | 0.158 | 0.149 | 0.213 |
| −9 | 0.308 | 0.175 | 0.157 | 0.148 | 0.213 |
| −8 | 0.311 | 0.174 | 0.156 | 0.148 | 0.212 |
| −7 | 0.314 | 0.173 | 0.155 | 0.147 | 0.211 |
| −6 | 0.318 | 0.172 | 0.154 | 0.146 | 0.210 |
| −5 | 0.321 | 0.171 | 0.153 | 0.145 | 0.209 |
| −4 | 0.324 | 0.170 | 0.153 | 0.144 | 0.208 |
| −3 | 0.328 | 0.169 | 0.152 | 0.143 | 0.208 |
| −2 | 0.331 | 0.169 | 0.151 | 0.143 | 0.207 |
| −1 | 0.335 | 0.168 | 0.150 | 0.142 | 0.206 |
| 0 | 0.338 | 0.167 | 0.149 | 0.141 | 0.205 |
| 1 | 0.341 | 0.166 | 0.148 | 0.140 | 0.204 |
| 2 | 0.345 | 0.165 | 0.147 | 0.139 | 0.203 |
| 3 | 0.348 | 0.164 | 0.147 | 0.138 | 0.202 |
| 4 | 0.352 | 0.164 | 0.146 | 0.137 | 0.202 |
| 5 | 0.355 | 0.163 | 0.145 | 0.137 | 0.201 |
| 6 | 0.358 | 0.162 | 0.144 | 0.136 | 0.200 |
| 7 | 0.362 | 0.161 | 0.143 | 0.135 | 0.199 |
| 8 | 0.365 | 0.160 | 0.142 | 0.134 | 0.198 |
| 9 | 0.368 | 0.159 | 0.142 | 0.133 | 0.197 |
| 10 | 0.372 | 0.158 | 0.141 | 0.132 | 0.197 |
| 11 | 0.375 | 0.158 | 0.140 | 0.132 | 0.196 |
| 12 | 0.379 | 0.157 | 0.139 | 0.131 | 0.195 |
| 13 | 0.382 | 0.156 | 0.138 | 0.130 | 0.194 |
| 14 | 0.385 | 0.155 | 0.137 | 0.129 | 0.193 |
| 15 | 0.389 | 0.154 | 0.137 | 0.128 | 0.192 |
| 16 | 0.392 | 0.153 | 0.136 | 0.127 | 0.191 |
| 17 | 0.395 | 0.153 | 0.135 | 0.127 | 0.191 |
| 18 | 0.399 | 0.152 | 0.134 | 0.126 | 0.190 |
| 19 | 0.402 | 0.151 | 0.133 | 0.125 | 0.189 |
| 20 | 0.406 | 0.150 | 0.132 | 0.124 | 0.188 |
References
- Basnyat, P.; Teeter, L.D.; Flynn, K.M.; Lockaby, B.G. Relationships between landscape characteristics and nonpoint source pollution inputs to coastal estuaries. Environ. Manag. 1999, 23, 539–549. [Google Scholar] [CrossRef] [PubMed]
- Wang, Y.; Yu, X.; He, K.; Li, Q.; Zhang, Y.; Song, S. Dynamic simulation of land use change in Jihe watershed based on CA-Markov model. Trans. Chin. Soc. Agric. Eng. 2011, 27, 330–336. [Google Scholar]
- Zhang, X.; Zhou, L.; Zheng, Q. Prediction of landscape pattern changes in a coastal river basin in south-eastern China. Int. J. Environ. Sci. Technol. 2019, 16, 6367–6376. [Google Scholar] [CrossRef]
- Neary, D.G.; Swank, W.T.; Riekerk, H. An overview of nonpoint source pollution in the Southern United States. In Proceedings of the symposium The Forested Wetlands of the Southern United States, Orlando, FL, USA, 12–14 July 1988; pp. 1–7. [Google Scholar]
- Wang, S.; Zhang, Z.; Wang, X. Land use change and prediction in the Baimahe Basin using GIS and CA-Markov model. In IOP Conference Series: Earth and Environmental Science; IOP Publishing: Bristol, UK, 2014; Volume 17, p. 012074. [Google Scholar]
- Ward, N.D.; Bianchi, T.S.; Medeiros, P.M.; Seidel, M.; Richey, J.E.; Keil, R.G.; Sawakuchi, H.O. Where carbon goes when water flows: Carbon cycling across the aquatic continuum. Front. Mar. Sci. 2017, 4, 7. [Google Scholar] [CrossRef] [Green Version]
- Jones, B.G.; Killian, H.E.; Chenhall, B.E.; Sloss, C.R. Anthropogenic effects in a coastal lagoon: Geochemical characterization of Burrill Lake, NSW, Australia. J. Coast. Res. 2003, 19, 621–632. [Google Scholar]
- Reusser, L.; Bierman, P.; Rood, D. Quantifying human impacts on rates of erosion and sediment transport at a landscape scale. Geology 2015, 43, 171–174. [Google Scholar] [CrossRef]
- Sanger, D.; Blair, A.; Di Donato, G.; Washburn, T.; Jones, S.; Riekerk, G.; Holland, A.F. Impacts of coastal development on the ecology of tidal creek ecosystems of the US Southeast including consequences to humans. Estuaries Coasts 2015, 38, 49–66. [Google Scholar] [CrossRef]
- Turner, R.E. Of manatees, mangroves, and the Mississippi River: Is there an estuarine signature for the Gulf of Mexico? Estuaries 2001, 24, 139–150. [Google Scholar] [CrossRef]
- Kennish, M.J. Environmental threats and environmental future of estuaries. Environ. Conserv. 2002, 29, 78–107. [Google Scholar] [CrossRef]
- Sivapalan, M.; Kalma, J.D. Scale problems in hydrology: Contributions of the Robertson Workshop. Hydrol. Processes 1995, 9, 243–250. [Google Scholar] [CrossRef]
- Sanzana, P.; Gironás, J.; Braud, I.; Branger, F.; Rodriguez, F.; Vargas, X.; Hitschfeld, N.; Muñoz, J.F.; Vicuña, S.; Mejía, A.; et al. A GIS-based urban and peri-urban landscape representation toolbox for hydrological distributed modeling. Environ. Model. Softw. 2017, 91, 168–185. [Google Scholar] [CrossRef] [Green Version]
- Briak, H.; Moussadek, R.; Aboumaria, K.; Mrabet, R. Assessing sediment yield in Kalaya gauged watershed (Northern Morocco) using GIS and SWAT model. Int. Soil Water Conserv. Res. 2016, 4, 177–185. [Google Scholar] [CrossRef] [Green Version]
- Maidment, D.R. GIS and hydrologic modeling. Environ. Modeling GIS 1993, 147, 167. [Google Scholar]
- Patino-Gomez, C. GIS for Large-Scale Watershed Observational Data Model. Ph.D. Dissertation, University of Texas, Austin, TX, USA, 2005. [Google Scholar]
- Hancock, G.R.; Coulthard, T.J.; Martinez, C.; Kalma, J.D. An evaluation of landscape evolution models to simulate decadal and centennial scale soil erosion in grassland catchments. J. Hydrol. 2011, 398, 171–183. [Google Scholar] [CrossRef]
- Coulthard, T.J.; Neal, J.C.; Bates, P.D.; Ramirez, J.; de Almeida, G.A.; Hancock, G.R. Integrating the LISFLOOD—FP 2D hydrodynamic model with the CAESAR model: Implications for modelling landscape evolution. Earth Surf. Processes Landf. 2013, 38, 1897–1906. [Google Scholar] [CrossRef]
- Renard, K.G.; Foster, G.R.; Yoder, D.C.; McCool, D.K. RUSLE revisited: Status, questions, answers, and the future. J. Soil Water Conserv. 1994, 49, 213–220. [Google Scholar]
- Patowary, S.; Sarma, A.K. GIS-based estimation of soil loss from hilly urban area incorporating hill cut factor into RUSLE. Water Resour. Manag. 2018, 32, 3535–3547. [Google Scholar] [CrossRef]
- Laflen, J.M.; Elliot, W.J.; Simanton, J.R.; Holzhey, C.S.; Kohl, K.D. WEPP: Soil erodibility experiments for rangeland and cropland soils. J. Soil Water Conserv. 1991, 46, 39–44. [Google Scholar]
- Laflen, J.M.; Flanagan, D.C. The development of US soil erosion prediction and modeling. Int. Soil Water Conserv. Res. 2013, 1, 1–11. [Google Scholar] [CrossRef] [Green Version]
- Yousuf, A.; Singh, M.J. Runoff and soil loss estimation using hydrological models, remote sensing and GIS in Shivalik foothills: A review. J. Soil Water Conserv. 2016, 15, 205–210. [Google Scholar] [CrossRef]
- Terranova, O.; Antronico, L.; Coscarelli, R.; Iaquinta, P. Soil erosion risk scenarios in the Mediterranean environment using RUSLE and GIS: An application model for Calabria (Southern Italy). Geomorphology 2009, 112, 228–245. [Google Scholar] [CrossRef]
- Zhang, H.; Zhang, J.; Zhang, S.; Yu, C.; Sun, R.; Wang, D.; Zhu, C.; Zhang, J. Identification of Priority Areas for Soil and Water Conservation Planning Based on Multi-Criteria Decision Analysis Using Choquet Integral. Int. J. Environ. Res. Public Health 2020, 17, 1331. [Google Scholar] [CrossRef] [PubMed] [Green Version]
- Yang, X.; Liu, Z. Using satellite imagery and GIS for land-use and land-cover change mapping in an estuarine watershed. Int. J. Remote Sens. 2005, 26, 5275–5296. [Google Scholar] [CrossRef]
- Euán-Avila, J.I.; Liceaga-Correa, M.A.; Rodríguez-Sánchez, H. GIS for Assessing Land-Based Activities That Pollute Coastal Environments. In GIS For Coastal Zone Management; CRC Press: Boca Raton, FL, USA, 2004; pp. 229–238. [Google Scholar]
- Hassen, M.B.; Prou, J. A GIS-Based assessment of potential aquacultural nonpoint source loading in an Atlantic bay (France). Ecol. Appl. 2001, 11, 800–814. [Google Scholar] [CrossRef]
- Zhang, Q.; Ball, W.P.; Moyer, D.L. Decadal-scale export of nitrogen, phosphorus, and sediment from the Susquehanna River basin, USA: Analysis and synthesis of temporal and spatial patterns. Sci. Total Environ. 2016, 563, 1016–1029. [Google Scholar] [CrossRef] [PubMed] [Green Version]
- Al-Ghobari, H.; Dewidar, A.Z. Integrating GIS-Based MCDA Techniques and the SCS-CN Method for Identifying Potential Zones for Rainwater Harvesting in a Semi-Arid Area. Water 2021, 13, 704. [Google Scholar] [CrossRef]
- Valkanou, K.; Karymbalis, E.; Papanastassiou, D.; Soldati, M.; Chalkias, C.; Gaki-Papanastassiou, K. Assessment of Neotectonic Landscape Deformation in Evia Island, Greece, Using GIS-Based Multi-Criteria Analysis. ISPRS Int. J. Geo.-Inf. 2021, 10, 118. [Google Scholar] [CrossRef]
- Broniewicz, E.; Ogrodnik, K. A Comparative Evaluation of Multi-Criteria Analysis Methods for Sustainable Transport. Energies 2021, 14, 5100. [Google Scholar] [CrossRef]
- Lombardi Netto, A.; Salomon, V.A.P.; Ortiz Barrios, M.A. Multi-Criteria Analysis of Green Bonds: Hybrid Multi-Method Applications. Sustainability 2021, 13, 10512. [Google Scholar] [CrossRef]
- Chen, Y.; Yu, J.; Khan, S. Spatial sensitivity analysis of multi-criteria weights in GIS-based land suitability evaluation. Environ. Model. Softw. 2010, 25, 1582–1591. [Google Scholar] [CrossRef]
- Rahmati, O.; Tahmasebipour, N.; Haghizadeh, A.; Pourghasemi, H.R.; Feizizadeh, B. Evaluating the influence of geo-environmental factors on gully erosion in a semi-arid region of Iran: An integrated framework. Sci. Total Environ. 2017, 579, 913–927. [Google Scholar] [CrossRef] [PubMed]
- Romano, G.; Dal Sasso, P.; Liuzzi, G.T.; Gentile, F. Multi-criteria decision analysis for land suitability mapping in a rural area of Southern Italy. Land Use Policy 2015, 48, 131–143. [Google Scholar] [CrossRef]
- Malczewski, J. On the use of weighted linear combination method in GIS: Common and best practice approaches. Trans. GIS 2000, 4, 5–22. [Google Scholar] [CrossRef]
- Malczewski, J. GIS—Based multicriteria decision analysis: A survey of the literature. Int. J. Geogr. Inf. Sci. 2006, 20, 703–726. [Google Scholar] [CrossRef]
- Yalew, S.G.; Van Griensven, A.; Mul, M.L.; Van der Zaag, P. Land suitability analysis for agriculture in the Abbay basin using remote sensing, GIS and AHP techniques. Modeling Earth Syst. Environ. 2016, 2, 101. [Google Scholar] [CrossRef] [Green Version]
- Jankowski, P. Integrating geographical information systems and multiple criteria decision-making methods. Int. J. Geogr. Inf. Syst. 1995, 9, 251–273. [Google Scholar] [CrossRef]
- Jankowski, P.; Andrienko, N.; Andrienko, G. Map-centred exploratory approach to multiple criteria spatial decision making. Int. J. Geogr. Inf. Sci. 2001, 15, 101–127. [Google Scholar] [CrossRef]
- Malczewski, J.; Rinner, C. Exploring multicriteria decision strategies in GIS with linguistic quantifiers: A case study of residential quality evaluation. J. Geogr. Syst. 2005, 7, 249–268. [Google Scholar] [CrossRef]
- Akıncı, H.; Özalp, A.Y.; Turgut, B. Agricultural land use suitability analysis using GIS and AHP technique. Comput. Electron. Agric. 2013, 97, 71–82. [Google Scholar] [CrossRef]
- Tudes, S.; Yigiter, N.D. Preparation of land use planning model using GIS based on AHP: Case study Adana-Turkey. Bull. Eng. Geol. Environ. 2010, 69, 235–245. [Google Scholar] [CrossRef]
- Mosadeghi, R.; Warnken, J.; Tomlinson, R.; Mirfenderesk, H. Comparison of Fuzzy-AHP and AHP in a spatial multi-criteria decision making model for urban land-use planning. Comput. Environ. Urban Syst. 2015, 49, 54–65. [Google Scholar] [CrossRef] [Green Version]
- Saaty, T.L. Fundamentals of Decision Making and Priority Theory with the Analytic Hierarchy Process; RWS Publications: Pittsburg, PA, USA, 2000; Volume 6. [Google Scholar]
- Wu, Q.; Wang, M. A framework for risk assessment on soil erosion by water using an integrated and systematic approach. J. Hydrol. 2007, 337, 11–21. [Google Scholar] [CrossRef]
- Kachouri, S.; Achour, H.; Abida, H.; Bouaziz, S. Soil erosion hazard mapping using Analytic Hierarchy Process and logistic regression: A case study of Haffouz watershed, central Tunisia. Arab. J. Geosci. 2015, 8, 4257–4268. [Google Scholar] [CrossRef]
- Feick, R.; Hall, B. A method for examining the spatial dimension of multi-criteria weight sensitivity. Int. J. Geogr. Inf. Sci. 2004, 18, 815–840. [Google Scholar] [CrossRef]
- Zhao, D.; Wang, J.; Zhao, X.; Triantafilis, J. Clay Content Mapping and Uncertainty Estimation Using Weighted Model Averaging; Catena: Gzira, Malta, 2022; Volume 209, p. 105791. ISSN 0341-8162. [Google Scholar] [CrossRef]
- Malone, P.B.; Minasny, B.; Odgers, P.N.; McBratney, B.A. Using model averaging to combine soil property rasters from legacy soil maps and from point data. Geoderma 2014, 232–234, 34–44. [Google Scholar] [CrossRef]
- Mobile Bay National Estuary Program (MBNEP). Weeks Bay Watershed Management Plan; Thompson Engineering Project No.: 16–1101–0012; Mobile Bay National Estuary Program: Mobile, AL, USA, 2017. [Google Scholar]
- United States Department of Agriculture (USDA). Land Resource Regions and Major land Resource Areas of the United States, the Caribbean and the Pacific Basin; Major Land Resources Regions. 2008, USDA Agriculture Handbook 296; United States Government Printing: Washington, DC, USA, 2017.
- Horn, B.K. Hill shading and the reflectance map. Proc. IEEE 1981, 69, 14–47. [Google Scholar] [CrossRef] [Green Version]
- Clubb, F.J.; Mudd, S.M.; Attal, M.; Milodowski, D.T.; Grieve, S.W. The relationship between drainage density, erosion rate, and hilltop curvature: Implications for sediment transport processes. J. Geophys. Res. Earth Surf. 2016, 121, 1724–1745. [Google Scholar] [CrossRef]
- Kheir, R.B.; Abdallah, C.; Khawlie, M. Assessing soil erosion in Mediterranean karst landscapes of Lebanon using remote sensing and GIS. Eng. Geol. 2008, 99, 239–254. [Google Scholar] [CrossRef]
- Tucker, G.; Lancaster, S.; Gasparini, N.; Bras, R. The channel-hillslope integrated landscape development model (CHILD). In Landscape Erosion and Evolution Modeling; Springer: Boston, MA, USA, 2001; pp. 349–388. [Google Scholar]
- Silverman, B.W. Density Estimation for Statistics and Data Analysis; CRC Press: Boca Raton, FL, USA, 1986; Volume 26. [Google Scholar]
- Kauth, R.J.; Lambeck, P.F.; Richardson, W.; Thomas, G.S.; Pentland, A.P. Feature extraction applied to agricultural crops as seen by Landsat. In Proceedings of the Large Area Crop Inventory Experiment (LACIE) Symposium, Houston, TX, USA, July 1979; pp. 705–721. [Google Scholar]
- Hajigholizadeh, M.; Melesse, A.M.; Fuentes, H.R. Erosion and Sediment Transport Modelling in Shallow Waters: A Review on Approaches, Models and Applications. Int. J. Environ. Res. Public Health 2018, 15, 518. [Google Scholar] [CrossRef] [Green Version]
- Cea, L.; Costabile, P. Flood Risk in Urban Areas: Modelling, Management and Adaptation to Climate Change. A Review. Hydrology 2022, 9, 50. [Google Scholar] [CrossRef]


| Scale | Definition | |
|---|---|---|
| 9 | Extremely | More Important |
| 7 | Very Strongly | |
| 5 | Strongly | |
| 3 | Moderately | |
| 1 | Equally Important | |
| 1/3 | Moderately | Less Important |
| 1/5 | Strongly | |
| 1/7 | Very Strongly | |
| 1/9 | Extremely |
| Class Name | Upper Fish | Middle Fish | Lower Fish | Magnolia | Weeks Bay |
|---|---|---|---|---|---|
| Class 1 | 0 | 1 | 5279 | 50 | 5330 |
| Class 2 | 1436 | 825 | 5225 | 1335 | 8821 |
| Class 3 | 22,586 | 16,072 | 19,899 | 15,938 | 74,495 |
| Class 4 | 141,679 | 89,391 | 90,602 | 71,948 | 393,620 |
| Class 5 | 21,206 | 12,331 | 22,433 | 23,872 | 79,842 |
| Class 6 | 2287 | 1147 | 1908 | 2788 | 8130 |
| Class 7 | 109 | 26 | 62 | 188 | 385 |
| Minimum | 0.356 | 0.353 | 0.231 | 0.294 | 0.231 |
| Maximum | 0.801 | 0.770 | 0.771 | 0.787 | 0.801 |
| Range | 0.445 | 0.417 | 0.540 | 0.493 | 0.570 |
| Mean | 0.527 | 0.526 | 0.520 | 0.537 | 0.527 |
| S.D. | 0.050 | 0.050 | 0.069 | 0.059 | 0.057 |
| Statistical Parameter | WLC Model | Variable Removed from the WLC Model | ||||
|---|---|---|---|---|---|---|
| Slope | Stream Density | K-Factor | Soil Brightness | Precipitation | ||
| Mean | 0.527 | 0.634 | 0.539 | 0.511 | 0.540 | 0.411 |
| Median | 0.529 | 0.635 | 0.542 | 0.513 | 0.542 | 0.414 |
| Mode | 0.518 | 0.573 | 0.398 | 0.520 | 0.552 | 0.444 |
| S.D. | 0.057 | 0.072 | 0.061 | 0.052 | 0.061 | 0.072 |
| Variance | 0.003 | 0.005 | 0.004 | 0.003 | 0.004 | 0.005 |
| Kurtosis | 0.467 | −0.033 | −0.103 | 0.724 | 0.418 | 0.416 |
| Skewness | −0.328 | −0.152 | −0.103 | −0.292 | −0.184 | −0.304 |
| Range | 0.570 | 0.632 | 0.611 | 0.560 | 0.544 | 0.711 |
| Minimum | 0.231 | 0.288 | 0.269 | 0.277 | 0.270 | 0.046 |
| Maximum | 0.801 | 0.920 | 0.881 | 0.837 | 0.814 | 0.757 |
| Count | 570,623 | 570,623 | 570,623 | 570,623 | 570,623 | 570,623 |
| Pearson Correlation | - | 0.940 | 0.882 | 0.788 | 0.881 | 1.000 |
| Class Name | WLC Model | AHP Model | Change |
|---|---|---|---|
| Class 1 | 5330 | 4927 | −403 |
| Class 2 | 8821 | 8012 | −809 |
| Class 3 | 74,495 | 72,206 | −2289 |
| Class 4 | 393,620 | 404,415 | 10,795 |
| Class 5 | 79,842 | 68,674 | −11,168 |
| Class 6 | 8130 | 10,482 | 2352 |
| Class 7 | 385 | 1907 | 1522 |
| Name of the Management Area | Sub-Basin Name | Rank in Ensemble Model | Rank in SWAT Model |
|---|---|---|---|
| Pensacola Branch | Middle Fish | 1 | 1 |
| Perone Branch | Upper Fish | 12 | 2 |
| Waterhole Branch | Lower Fish | 2 | 3 |
| Turkey Branch | Lower Fish | 4 | 4 |
| Picard Branch | Upper Fish | 15 | 5 |
| Corn Branch | Upper Fish | 3 | 6 |
| Barner | Lower Fish | 16 | 7 |
| Magnolia River | Magnolia | 9 | 8 |
| Polecat Creek | Middle Fish | 14 | 9 |
| Cowpen Creek | Lower Fish | 13 | 10 |
| Baker Branch | Middle Fish | 10 | 11 |
| Unknown | Middle Fish | 7 | 12 |
| Three Mile Creek | Upper Fish | 6 | 13 |
| Green Creek | Lower Fish | 5 | 14 |
| Bay Branch | Upper Fish | 11 | 15 |
| Weeks Branch | Lower Fish | 17 | 16 |
| Upper Fish River | Upper Fish | 8 | 17 |
| Weeks Bay | Lower Fish | 18 | 18 |
Publisher’s Note: MDPI stays neutral with regard to jurisdictional claims in published maps and institutional affiliations. |
© 2022 by the authors. Licensee MDPI, Basel, Switzerland. This article is an open access article distributed under the terms and conditions of the Creative Commons Attribution (CC BY) license (https://creativecommons.org/licenses/by/4.0/).
Share and Cite
Cartwright, J.H.; Shammi, S.A.; Rodgers, J.C., III. Use of Multi-Criteria Decision Analysis (MCDA) for Mapping Erosion Potential in Gulf of Mexico Watersheds. Water 2022, 14, 1923. https://doi.org/10.3390/w14121923
Cartwright JH, Shammi SA, Rodgers JC III. Use of Multi-Criteria Decision Analysis (MCDA) for Mapping Erosion Potential in Gulf of Mexico Watersheds. Water. 2022; 14(12):1923. https://doi.org/10.3390/w14121923
Chicago/Turabian StyleCartwright, John H., Sadia Alam Shammi, and John C. Rodgers, III. 2022. "Use of Multi-Criteria Decision Analysis (MCDA) for Mapping Erosion Potential in Gulf of Mexico Watersheds" Water 14, no. 12: 1923. https://doi.org/10.3390/w14121923
APA StyleCartwright, J. H., Shammi, S. A., & Rodgers, J. C., III. (2022). Use of Multi-Criteria Decision Analysis (MCDA) for Mapping Erosion Potential in Gulf of Mexico Watersheds. Water, 14(12), 1923. https://doi.org/10.3390/w14121923