Article

Quantify Runoff Reduction in the Zhang River Due to Water Diversion for Irrigation

1
School of Civil Engineering, Tianjin University, Tianjin 300072, China
2
State Key Laboratory of Hydrology-Water Resources and Hydraulic Engineering, Nanjing Hydraulic Research Institute, Nanjing 210098, China
3
Yangtze Institute for Conservation and Development, Nanjing 210098, China
4
Research Center for Climate Change of Ministry of Water Resources, Nanjing 210029, China
*
Author to whom correspondence should be addressed.
Water 2022, 14(12), 1918; https://doi.org/10.3390/w14121918
Submission received: 21 April 2022 / Revised: 6 June 2022 / Accepted: 11 June 2022 / Published: 14 June 2022

Abstract

:
In order to systematically analyze the impacts of climate change and human activities on runoff, this paper takes the Zhanghe River Basin, which is greatly affected by human activities, as the research object, constructs an attribution analysis model of runoff changes based on historical data and the SWAT (Soil and Water Assessment Tool) model. The results show that the runoff of the watershed has significantly decreased in the past 60 years, in which the contribution rate of climate change is 36.2% and that of human activities is 63.8%. Among the climate change factors, precipitation is the main contributing factor and canal diversion is the main contributing factor among human activities. In addition, with the decrease in precipitation during the flood season and the increase in the crop planting area in the catchment, the distribution of canal water diversion has also changed, and the water consumption of summer crops has gradually become the main factor affecting canal water diversion.

1. Introduction

Water is a basic resource in nature on the one hand, and an important strategic resource in human society on the other [1]. In the context of climate change, regional water issues are starting to become more prominent [2,3]. River runoff is an important component of water resource systems and an important expression of surface water resources. Over the past decades, river runoff has changed significantly around the world due to various factors [4,5,6,7,8,9,10]. The changes in river runoff are mainly influenced by both climate change and human activities, and distinguishing and defining the contribution of both and the main components is not only a requirement for a scientific understanding of the impact of environmental changes on runoff processes but is also of great importance for the planning and management of future water resources [11,12,13].
The Haihe River basin is one of the most severely reduced river runoff rivers in northern China. Runoff changes and attribution analysis in this watershed have been studied from different perspectives. Yang examined the mutation points and runoff trends in eight sub-basins of the Haihe River Basin and analyzed the relationship between agricultural water use and runoff changes [14] and Bin developed the Runoff Landscape Index (RLI) to assess the influence of watershed landscape factors on surface runoff [15]. Wang analyzed the sensitivity of the runoff to climate variability and land use change in a typical sub-basin of the Haihe River Basin and quantified the impact rate of precipitation and subsurface change [16]. Zhang divided the catchments of different sub-basins of the Haihe River basin into three groups by area and used stepwise regression and path analysis to obtain the dominant factors affecting the runoff at different scales [17]. Zhang used the SWAT model to simulate the runoff process in the Haihe River basin under different subsurface scenarios and explored the main factors of variability [18]. Li quantified the non-stationarity of runoff frequencies in the Luan River basin of the Haihe sub-basin using a generalized additive model combining location, scale and shape (GAMLSS) and a downscaling model [19]. However, the above studies are limited to an analysis of the overall impact of climate change and human activities, and there is a lack of analysis of the impact of engineering facilities in the watershed, among other factors.
The SWAT model, as a common distributed hydrological model in the field of hydrology, has a wide range of applications in simulating historical runoff and reducing runoff under different scenarios. Luan used the SWAT model to calculate the field-scale water footprint of the river-loop irrigation area in China and explored the spatial heterogeneity of the crop water footprint [19]. Viviane verified the reduction in the SWAT model for the operation of the Furnas Hydroelectric Power Plant (HPP) reservoir in the Rio Grande basin [20]. Aznarez used the SWAT model in conjunction with CMIP5 data to analyze the response relationships between natural hazard protection, erosion control, water supply, and flow regulation [21]. Meshesha extended the SWAT module to predict groundwater quality [22]. The application of the above SWAT model fully demonstrates its reliability as a runoff reduction and simulation tool, which can be used for runoff reduction in changing environments and runoff simulation applications in specific contexts.
The analysis of agricultural water use in watersheds has been a popular issue in the field of water resources research, and scholars have analyzed the water demand and water allocation in agriculture from different perspectives. For example, Qi analyzed the impact of climate change on the carrying capacity of agricultural water resources by the cross-wavelet method and the Pearson correlation analysis, and studied the impact of wheat, soybean and rice planting ratio on water resources [23]. Hoshiyar analyzed the water allocation in the northern irrigation areas of Iran and made recommendations to improve the overall performance of the canal [24]. Dai studied the effect of water allocation on the quality of agricultural water supply and the extent of canal water utilization in the People’s Victory Canal Irrigation District (PVCID) in the lower Yellow River, China, and proposed a compensation scheme for the adverse effects of agricultural water transfer [25]. Nishida quantified the resistance to water flow in the path from the tillage layer to the drainage channel through the aging subsurface drainage system of clayey paddy fields [26]. Yousaf analyzed the existing irrigation management system in Pakistan using a combination of remote sensing and GIS to calculate the crop water deficit and the crop water deficit period [27]. From the above studies, it can be seen that it is always necessary to use hydrological models and remote sensing data to analyze the results, which shows that the analysis of water allocation and agricultural water consumption in agricultural areas by means of models and GIS is a more effective research tool.
The above studies have analyzed agricultural water use from different perspectives using various models and methods, but the quantitative analysis process of basin runoff changes and the analysis of major canals in the basin are generally missing. Based on the problems and current situation, this paper selects the Zhanghe River basin, where human activities have been more significant in recent decades, as the research object, and mainly explores the following aspects: (1) SWAT model for runoff reduction in the Zhanghe River basin; (2) the contribution of climate change and human activities to runoff changes in the Zhanghe River basin; (3) water diversion distribution and water diversion changes in the main canal in the basin and (4) climate change and canal diversion in response to the crop cultivation tendency in the basin.

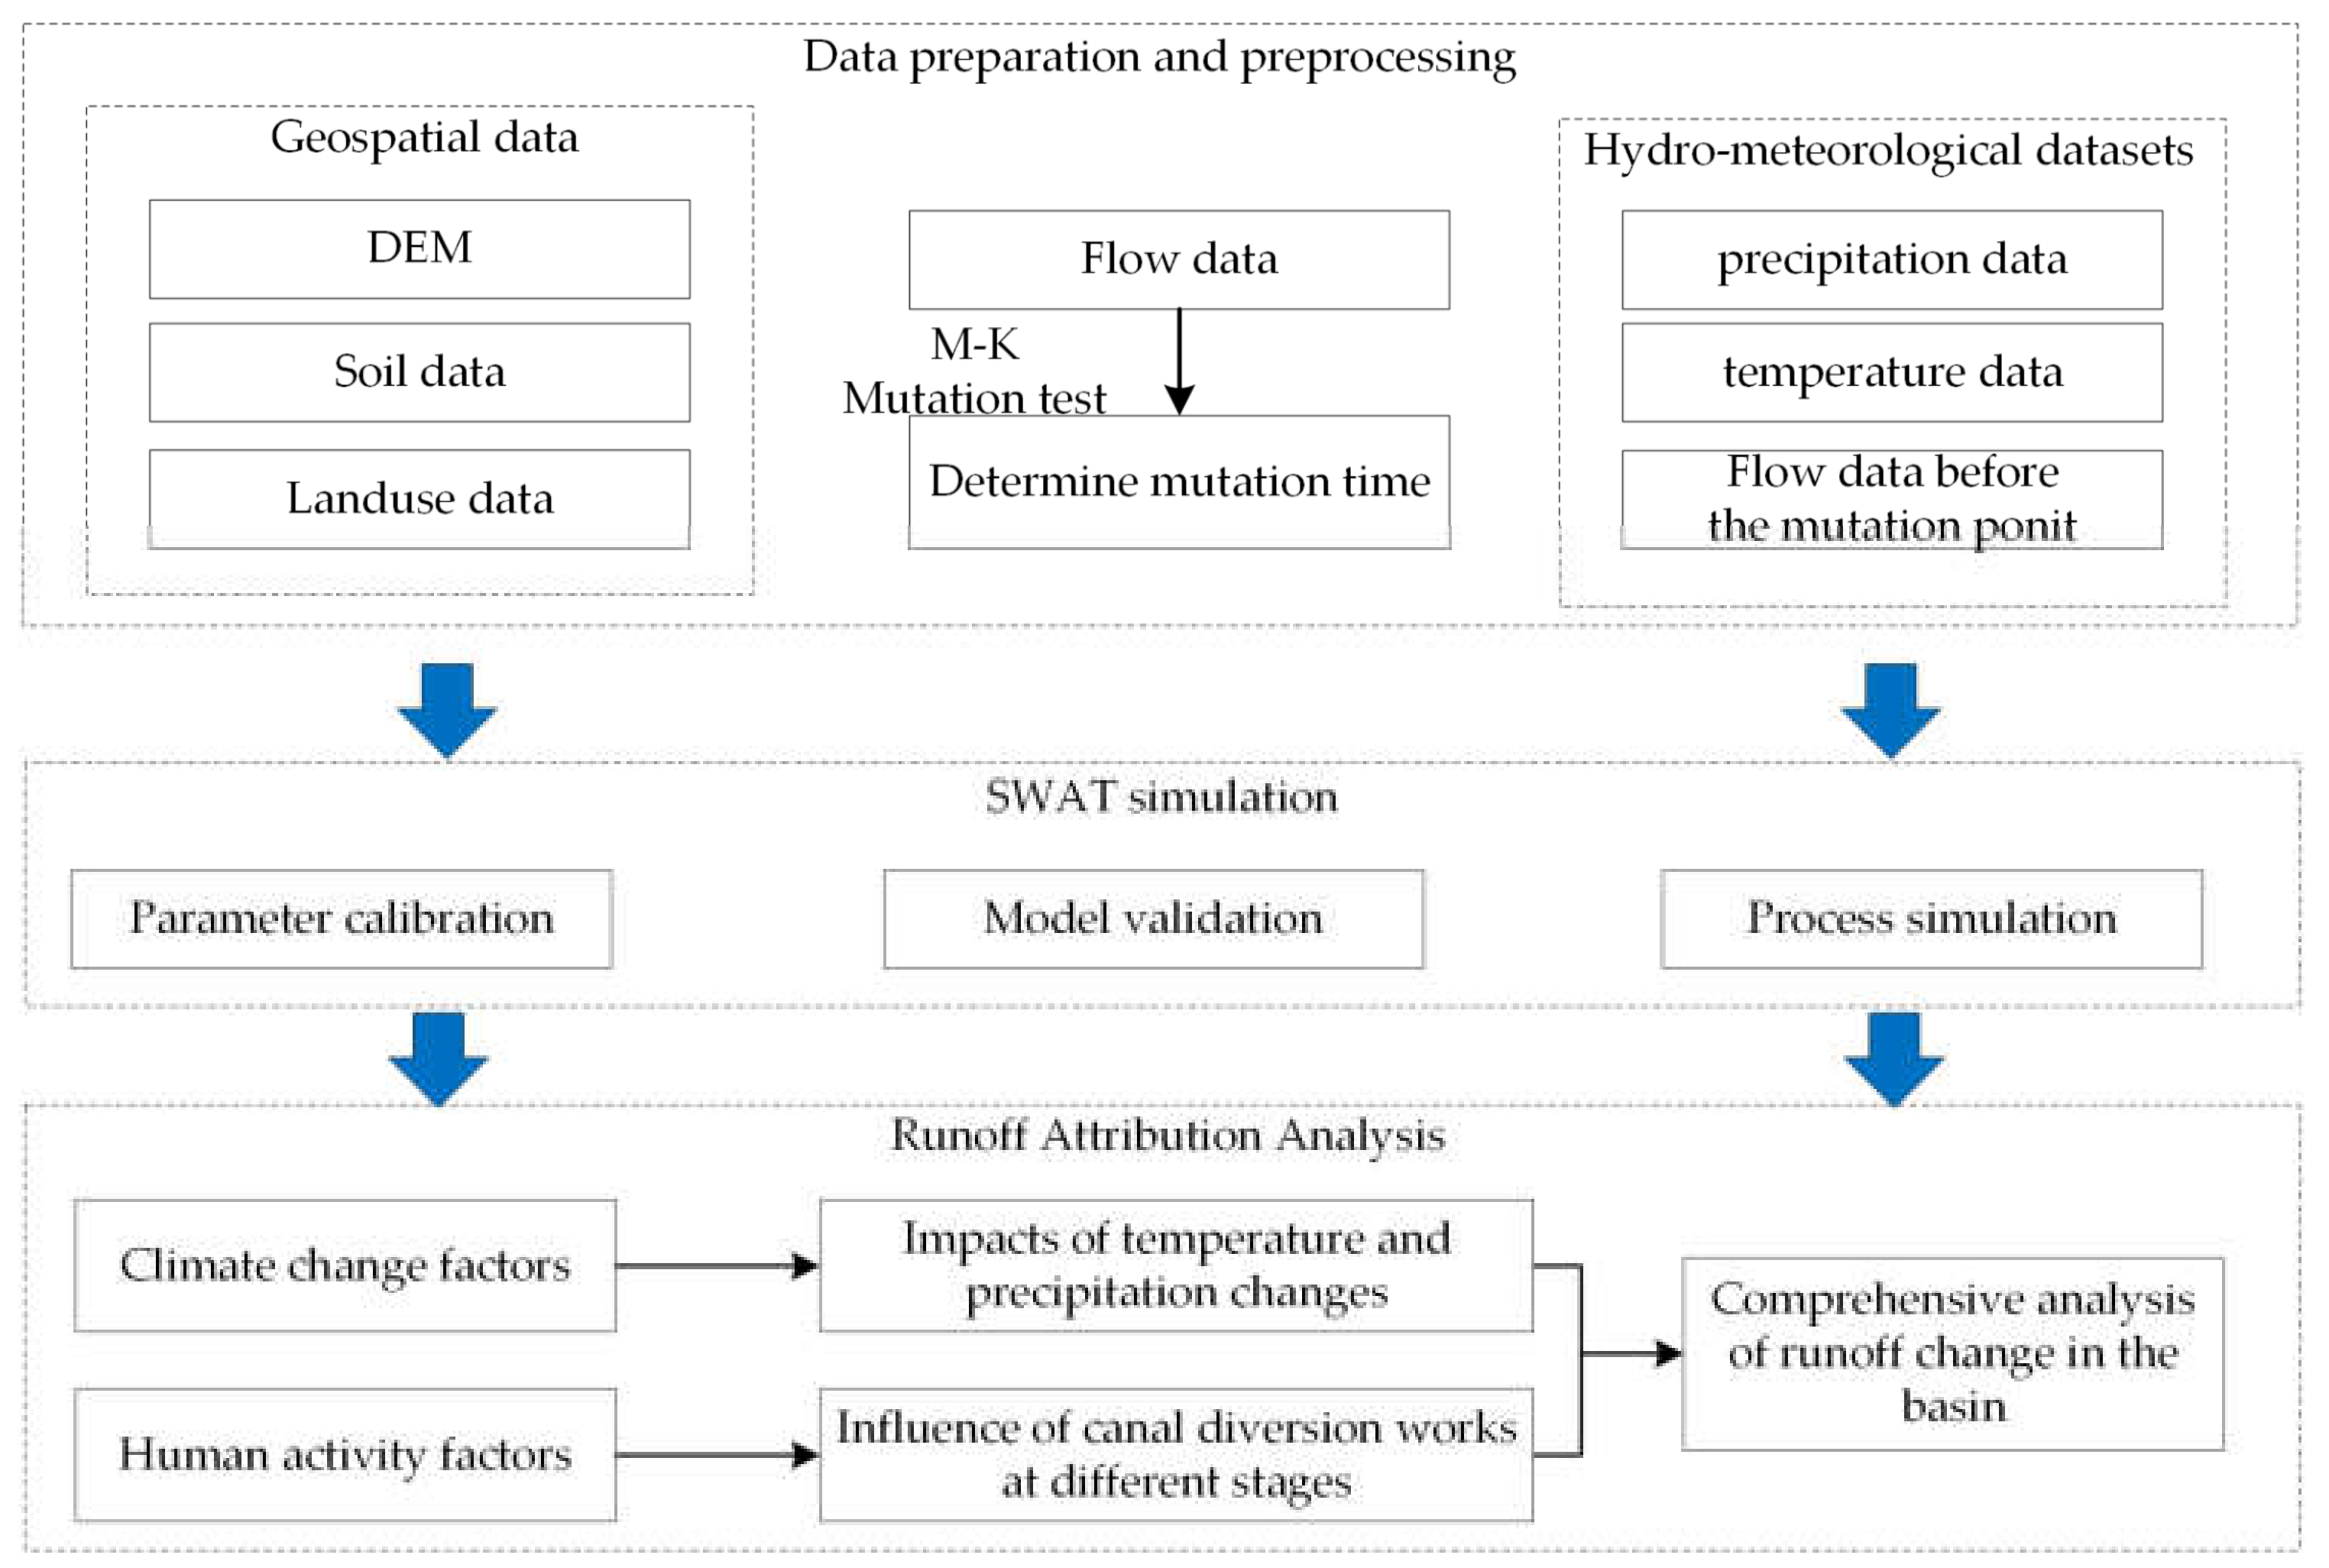
2. Materials and Methods
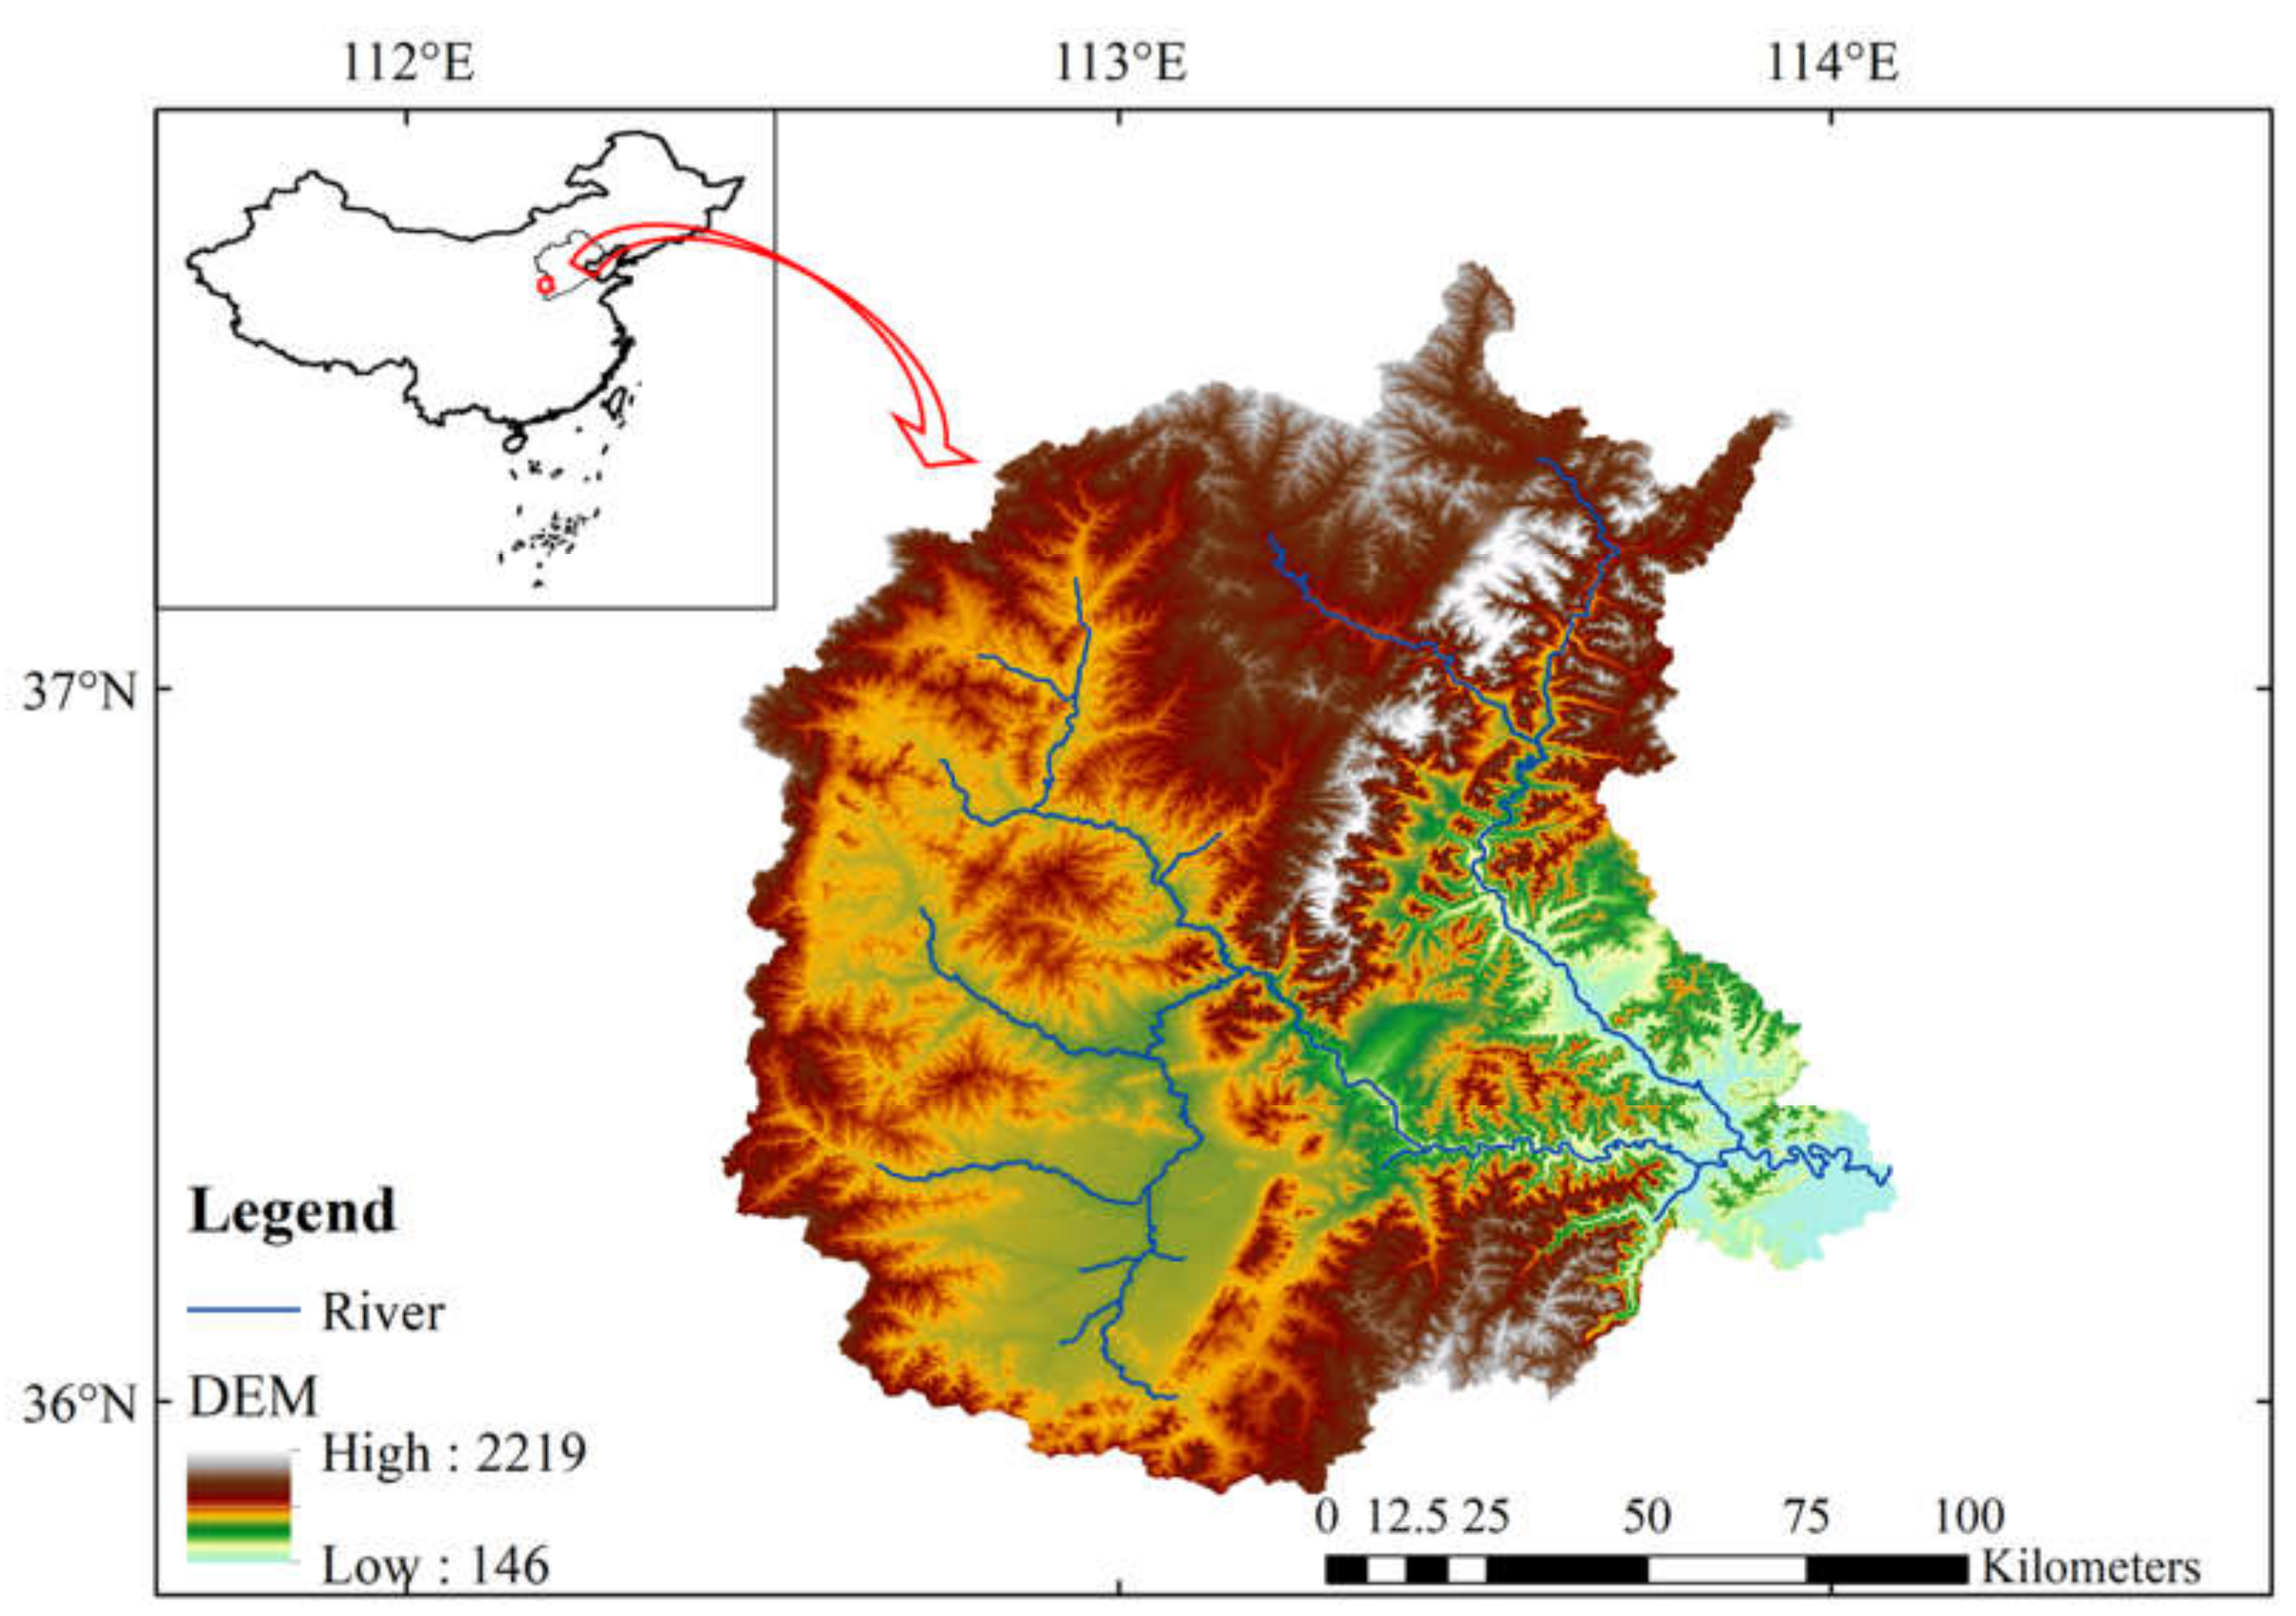
2.1. Study Area

The Zhanghe River (Figure 1) belongs to the southwestern tributary of China’s Haihe River Basin, located between 112°16′ E~114°16′ E, 35°50′ N~37°33′ N, with a total length of 460 km, a basin area of 18,200 km2, an average annual precipitation of 565.9 mm and an average annual runoff of 11.05 × 10⁸ m3. As the topography of the basin is high in the northwest and low in the southeast, the water flow is also oriented from the northwest to the southeast. The Zhanghe River basin is also one of the more water scarce areas in China [28], with a dense population and developed agriculture, and the exploitation of water resources in the basin has far exceeded the carrying capacity of water resources. The total diversion capacity of the Hongqi canal, the Yuejin canal, the Dayuefeng canal and the Xiaoyuefeng canal in the basin is 105 m3/s. Since 1996, the base flow of the river has been less than 5 m3/s. Moreover, due to the uneven distribution of water resources and water use in the basin, the inter-regional water use problems are prominent, and it is one of the areas where water conflicts occur frequently in China.

2.2. Geospatial Data

Digital elevation model (DEM), land use data (LUCC), and soil data are the main geospatial data sets for SWAT model inputs. Among them, DEM data are the products of the 90 m elevation DEM dataset published by STRM (https://srtm.csi.cgiar.org/srtmdata/, accessed on 1 January 2022). The land use data were obtained from the Chinese land use status dataset published by the Institute of Geographical Sciences and Resources, Chinese Academy of Sciences (https://www.resdc.cn/data.aspx, accessed on 1 January 2022). Soil data are from the Harmonized World Soil Database (HWSD) constructed by the Food and Agriculture Organization of the United Nations (FAO) and the International Institute of Applied Systems (IIASA), Vienna, which has been released in version 1.2 with a data resolution of 1 km and the adopted soil classification system of FAO-90.

2.3. Hydro-Meteorological Datasets

The daily precipitation data and the daily maximum and minimum temperatures used in the study are ground station data provided by the National Meteorological Center of China (http://data.cma.cn, accessed on 1 January 2021). The flow data of Guantai station is from 1951 to 2010, and the discharge data of the four irrigation canals in the basin is from 1995 to 2010. The above data are provided by the local hydrological department, and the data are complete without missing measurements, all site information is shown in Table 1 Compared with the previous research results of the basin [29], the quality of the data can be guaranteed.

2.4. Mann–Kendall Mutation Test

The Mann–Kendall mutation detection method [30] is a nonparametric statistical test with the following details:
(1) Let the original time series be y1, y2, y3, …, yn, with mi denoting the cumulative number of samples yi greater than yj (1 ≤ j ≤ i) for the ith sample, and define the statistics:
d k = i = 1 k mi , ( 2 k n )
(2) Under the assumption of the random independence of the original series, the mean and variance of dk are:
E ( d k ) = k ( k 1 ) / 4
var ( d k ) = k ( k 1 ) ( 2 k + 5 ) / 72
(3) Normalizing the dk can obtain UFk as:
UF k = d k E ( d k ) var ( d k )
(4) UFk forms a UF curve, and a reliability test can be used to determine whether there is a significant trend.
(5) Introducing this method to the inverse series, another curve UB is calculated and the intersection of the two curves in the confidence interval is determined as the mutation point.
(6) Given a significance level α = 0.05, the critical value of the statistic UF and UB is ±1.96. If UF > 0, it indicates an upward trend in the series, and vice versa indicates a downward trend, and if UF exceeds the critical value, it indicates a significant upward or downward trend.

2.5. Runoff Attribution Analysis Method

For a hydrological sequence, the causes of its runoff changes are diverse, and in terms of broad categories, they are generally divided into two aspects: changes in which climate change is the influencing factor and changes in which human activities are the main influencing factor. The influence of climate change is mainly concentrated in the production stage, which mainly affects the amount of water resources that the basin obtains from the natural water cycle; the influence of human activities is mainly concentrated after the confluence stage, which mainly affects the amount of water stored and transported in the basin [30].
Based on the above theoretical analysis, the core steps of the attribution analysis of runoff changes can be divided into the following steps: (1) The hydrological sequence is divided by identifying the natural period of runoff as well as the mutation point of the human-influenced period. (2) Using the mutation point as the boundary, the natural runoff after the mutation point is simulated by the hydrological model, and then the natural runoff after the cut-off point without human influence is obtained. (3) The natural runoff is compared with the measured runoff, and appropriate methods and variables are selected to distinguish between climatic and anthropogenic factors. The attribution method of the runoff change is combined with the simulation results of the hydrological model, i.e., the time point of the sudden change in the natural runoff series can be used as the boundary, the mean values of the simulated runoff and measured runoff before and after the sudden change point can be deduced, the change in the measured runoff is used as the total change in runoff, the change in the simulated runoff is used as the change caused by climate change and the difference between the two is used as the change caused by human activities. Finally, the total amount of runoff change is used as the benchmark to deduce the contribution of the two influencing factors. The two components are calculated as:
Δ Q = Q n Q h
Δ Q c = Q n Q c
Δ Q h = Q h Q c
W c = Δ Q c Δ Q
W h = Δ Q h Δ Q
where the mean value of runoff before the mutation point is Qn, the mean value of the simulated runoff after the mutation point is Qc, the actual runoff is Qh, the degree of change in the mean value due to climate change is ΔQc, the contribution rate is Wc, the degree of change in the mean value due to human activities is ΔQh and the contribution rate is Wh.

2.6. SWAT Model

The SWAT (Soil and Water Assessment Tool) model was developed by Dr. Jeff Arnold of the USDA Agricultural Research Center in 1994 [31]. It has been refined and developed in several versions since then, and is widely used in the United States, Canada, Australia, European countries and some Asian countries and regions. It has been widely used in the United States, Canada, Australia, Europe and parts of Asia. The SWAT model is widely used at home and abroad because of its ability to consider a variety of influencing factors such as climate, land use and hydraulic engineering, to predict hydrology, water quality, nutrients, sediment and other elements and because its source code is open source, users can improve the model according to their actual needs. The simulation of hydrological process by the SWAT model can be divided into two main parts: the land surface hydrological model circulation module and the confluence calculation. The land surface hydrological cycle mainly includes precipitation, evaporation, surface runoff, seepage and groundwater. The calculation part of the confluence mainly includes the hydrological cycle process of water flowing into and out of the river basin. During the simulation process, the SWAT model is based on the water balance principle of the river basin. The water balance equation used in the SWAT model is as follows:
SW t = SW o + ( R day Q surf E α W seep Q gw )
where SWt is the final soil water content (mm), SWo is the initial soil water content (mm), Rday is the precipitation, Qsurf is the surface runoff, Eα is the evapotranspiration, Wseep is the percolation and Qgw is the amount of return flow (in millimeters on a daily basis).
Based on the application basis of the SWAT model in the Haihe River basin [32,33,34,35], the SWAT model was also selected for the hydrological simulation in the two typical basins of this study. Moreover, the coefficient of determination(R2) and the Nash–Sutcliffe efficiency coefficient (NSE) were selected as the criteria to evaluate the simulation effect of the model. These two coefficients are often used to evaluate the simulation effect of the hydrological model.
R 2 = 1 SSE SSR + SSE
NSE = 1 t = 1 T ( Q o t Q m t ) 2 t = 1 T ( Q o t Q o ¯ ) 2
where SSE is the sum of squares for error, SSR is the sum of squares for regression, Qo is the observed data series, Qm is the simulate data and Qot is the observed data value at time t.
According to the above theoretical basis of the research and the research methods, combined with the characteristics of the research area, the flow chart of this paper is as Figure 2.

3. Results

3.1. Mutation Test Result

The change of the outlet flow of the basin can reflect the change of the overall water conveyance capacity of the basin [36]. It can be seen from Figure 3a that the runoff of the basin has shown a significant downward trend in the past 60 years. The Mann–Kendall catastrophe test and trend analysis were carried out on the time runoff series of the Guantai station at the outlet of the Zhanghe River Basin. The results are shown in Figure 3b. It can be seen that the catastrophe occurred between 1973 and 1974. In order to further analyze whether the runoff state of the watershed before and after the abrupt change point had changed, the monthly average flow before and after the abrupt change point (Figure 3c) and the correlation between rainfall and runoff (Figure 3d) were compared and analyzed. The results show that the precipitation after the mutation point showed a significant decline compared with that before the abrupt change point, especially in the flood season (June–October) of the watershed. At the same time, due to the large-scale development of agriculture in the watershed, the remaining water volume of the river canal was reduced, and the correlation between rainfall and runoff in the basin also changed significantly. Therefore, combined with the previous studies of scholars and the construction time of canals in the basin, it can be concluded that the mutation point in the Zhanghe River Basin was in 1974.

3.2. Runoff Simulation

After determining the time point of the sudden change in the runoff in the basin, the model can be used to simulate and restore the runoff sequence before the mutation point in order to find the parameter set applicable to the basin [37,38]. In this paper, after a sensitivity analysis of the parameters, 10 parameters were selected as calibration objects. In the Zhanghe River basin, due to the frequent human activities, the relative degree of vegetation cover is low, and the catchment and sink processes of simulated runoff are mainly influenced by the groundwater process and soil water content, so the parameters selected were mostly soil water parameters and groundwater process parameters.
Table 2 indicates that the initial SCS runoff curve number for moisture condition Ⅱ value (CN2), the baseflow alpha-factor (ALPHA_BF) and the baseflow alpha factor for bank storage (ALPHA_BNK) are among the most sensitive parameters for streamflow; these parameters improved the model simulations in terms of infiltration rate [39], land use and soil moisture status, and baseflow response to recharge changes, respectively. For the ground water delay (GW_DELAY) and the threshold depth of water in the shallow aquifer required for return flow to occur (GWQMN), these two parameters were corrected for the production and sink processes from a groundwater perspective [40]. The parameters of saturated hydraulic conductivity (SOL_K), available water capacity of the soil layer (SOL_AWC) and moist bulk density (SOL_BD) changed the simulation results in terms of soil water supply [41]. Soil evaporation compensation factor (ESCO) and average slope length (SLSUBBSN) were corrected for the slope of the lower bedding surface and evaporation on runoff from the perspective of HRU [42].
Combined with the sensitivity of the parameters, the runoff state before the mutation point was simulated and reduced using the SWAT model, and the results are shown in Figure 4. From the performance of the SWAT model, most of the months in the calibration period of Guantai Station were close to the measured value, the NSE result was 0.75, R2 was 0.75, and the overall performance was good, but in the process of flood period in 1954, 1956 and 1963, the simulated value was smaller than the measured flow, and in the flood period of 1958 and 1960, the simulated value was higher than the measured flow.In a comprehensive view, the simulated average value of the calibration period is slightly. The relative error between the simulated and measured mean values was 6.8%. In the validation period, the NSE results improved to 0.85 and R2 improved to 0.88. Compared with the foreseeing period, the simulation effect in the flood period improved significantly compared with the foreseeing period due to the reduced storm time in the validation period. Combining the simulation results of the two periods, it can be seen that the SWAT model can better restore the runoff time series of the Zhanghe River basin before the abrupt change point, and the parameter set obtained from the rate determination had good applicability in this basin.

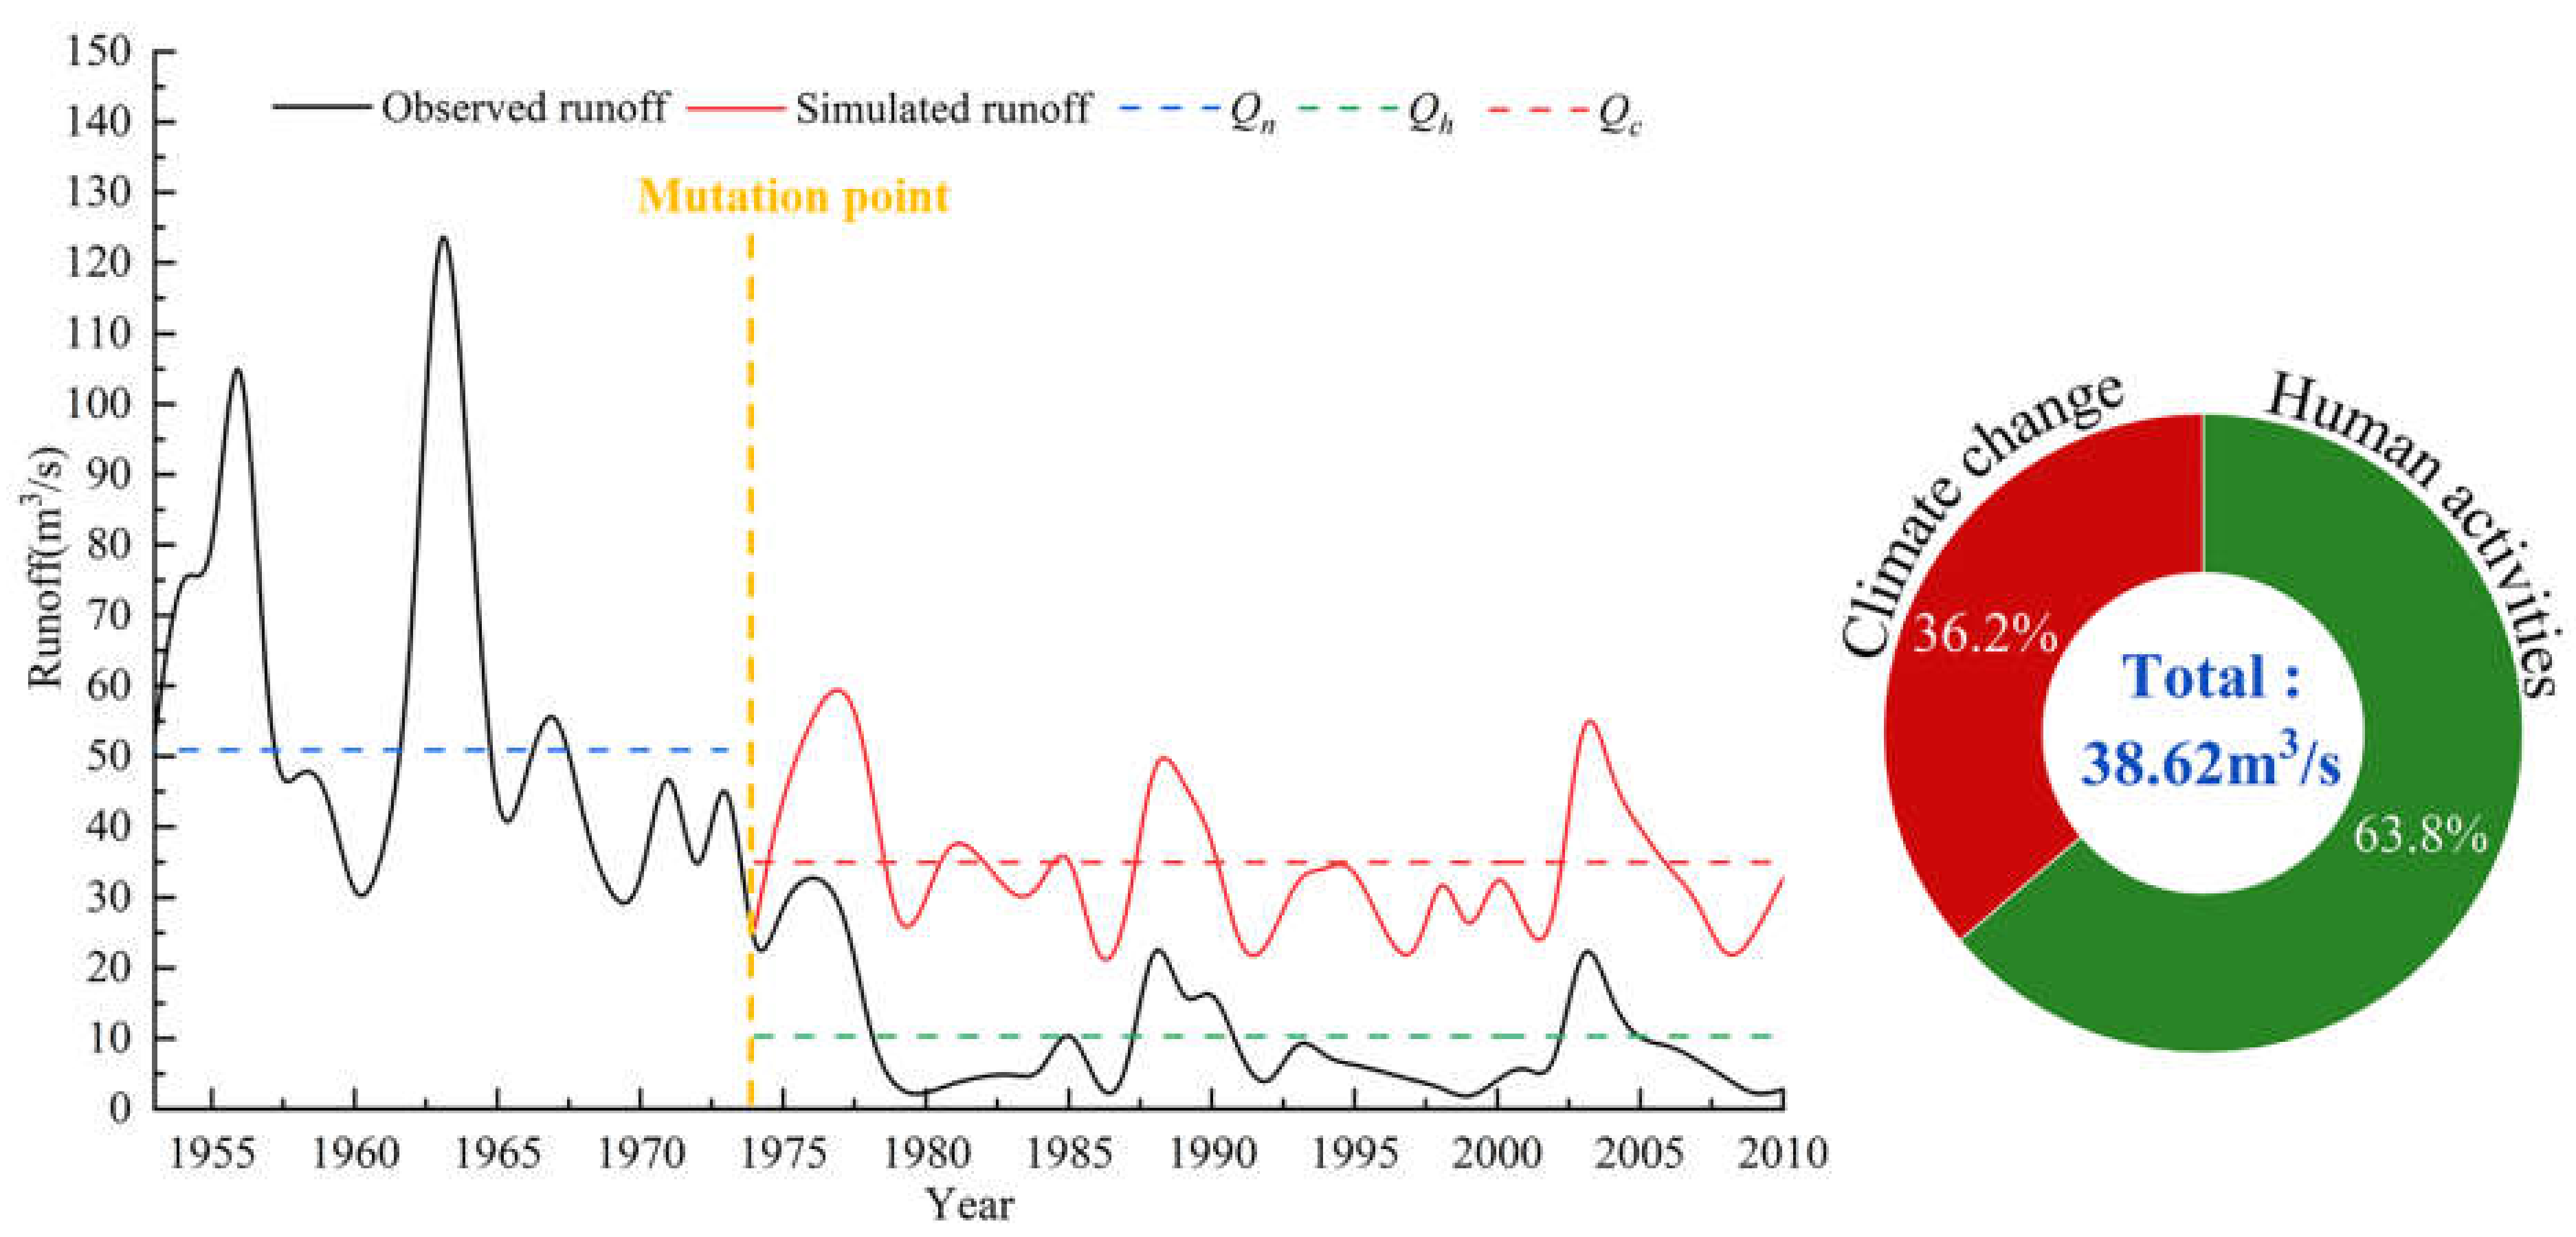
3.3. Runoff Attribution Analysis

Based on the parameter results obtained from SWAT, the runoff data after the abrupt change point of runoff can be simulated, and combined with the impact evaluation model, the runoff process under a single climate change condition and the corresponding proportion of the impact of runoff change, as well as the proportion of the impact of runoff change under the shaved climate change, can be obtained [43]. The results of the impact evaluation model are shown in Figure 5. It can be seen that the impact of climate change accounted for 36.2% and the impact of human activities accounted for 63.8% in the past 60 years, and the synergistic effect of both caused the average flow in the Zhanghe River basin to decrease by 38.62 m3/s, with a decrease of 80.5%.
  • Climate change
Among the effects of climate change on runoff processes, changes in precipitation, temperature and evaporation are among the key factors influencing basin flow [40]. The changes in precipitation and temperature before and after the mutation point in the Zhanghe River basin are shown in Figure 6. After analyzing the mean values of monthly precipitation before and after the mutation point, it can be seen that the precipitation from June to September, which was the main contribution to the basin water, had a significant decrease of 41.5%, and the total precipitation decreased by 25.8%, and combined with the influence of climate change factors in the runoff attribution analysis, we can conclude that the change of precipitation was the main meteorological factor affecting the change in the runoff. Meanwhile, from the evaporation results simulated by the model and the maximum and minimum temperatures between the mutation point, the average increase in maximum temperature after the mutation point was 0.45 °C, the average increase in minimum temperature was 0.9 °C and the average annual evaporation change was 3.81%. From the variation in average evaporation, the range of monthly average evaporation variation was 2.4–12.7%, with the most significant variation in evaporation in November–February, which was similar to the variation in the maximum and minimum temperature. For the total evapotranspiration change, the difference in evapotranspiration before and after the mutation point was only 15.41 mm/year, and its influence on runoff was relatively slight compared with the change in the flow and precipitation before and after the mutation point. From the results of changes in the three elements and runoff, it is clear that changes in rainfall have a more significant effect on runoff than changes in temperature. The results show that climate change is not the cause of the abrupt change of runoff in the Zhanghe River basin. This also verifies the result that climate factors do not account for much in the runoff attribution.
  • Human activities
In recent decades, due to the development of agriculture and production needs, several water conservancy facilities have been built in the Zhanghe River basin, combined with the presence of a large number of canals and croplands in the basin, so that the canal diversion is the main contributor to the part of human activity that occupies the main impact factor. From the perspective of water diversion and irrigation area, the four irrigation canals with the largest water diversions in the basin are the Dayuefeng canal, the Xiaoyuefeng canal, the Yuejin canal and the Hongqi canal. In order to systematically analyze the proportion of canal drinking water to the reduction in basin runoff, this paper used the time series of runoff and four major canal diversions from 1995 to 2010 as the research object to analyze the runoff change factors of human activities. From the total amount of water diverted by the canals each year and the percentage of the total amount of water shown in Table 3, it can be seen that since 1995, the average percentage of water diverted from the canal was 63.39%. Except for a very few years when the canal diversion was less than 50%, for most of the years the four main canals were above 60% of the water diversion and some years the water diversion was up to more than 85%. From the results of the model simulation, the multi-year average flow after the abrupt change point under the influence of a single climate model was 33.954 m3/s, but only the average flow in 1995was higher than this value after deducting the influence of various factors such as canal diversions.
From the interannual variation of canal diversions, the variation in the diversions of the four main irrigation canals can be divided into two stages: 1995–2001 as the first period, when the annual average canal diversion was 12.84 m3/s, and after 2002 as the second period, when the annual average canal diversion was 20.57 m3/s, an increase of 60%. Comparing the average monthly canal diversions of the two phases (Figure 7), it can be seen that after the second phase in 2002, the diversions of the four main canals increased, with the most significant changes in the Dayuefeng canal, with a 68.82% increase in monthly average canal diversions, a 57% increase in the Hongqi canal, a 50% increase in the Xiaoyuefeng canal and a 21.32% increase in the Yuejin canal. Changes in water use in the aqueducts also reflect the changes in the arable land area and changes in major crop types in the watershed. Combining the changes in land use in the basin over the two periods, agricultural land increased by 37.78% and grassland decreased by 25.85%, while urban land increased by 42.86%. Considering that farmland and grassland are the most important land use types in the Zhanghe River basin, the change in canal water use due to agricultural development is the root cause of the change in export flow for the Zhanghe River basin.
Maize and wheat are the most important summer and fall/winter crops in the basin and nearby irrigation areas. These two crops are grown in rotation, so the monthly water use changes in each canal can be roughly judged from the changes in water use for different crops in the irrigation areas. For Dayuefeng canal, water use in this canal rose by 86.4% during the maize growing period and by 56.9% during the wheat growing period. The water use in the Xiaoyuefeng canal rose by 67.27% during the maize growing period and by 32.4% during the wheat growing period, similar to the performance of Dayuefeng canal. The water use in the Hongqi canal rose by 58.18% during the maize growing period and by 60.19% during the wheat growing period, suggesting that water use in the basin gradually tilted towards wheat cultivation. Moreover, the water use in the Yuejin canal did not change much before and after, mainly shifting from water use in the fall and winter seasons to water use in the spring and summer seasons, which basically corresponded to the sowing time of maize, indicating that the farmland involved in the canal experienced a change in the major crops. From the change in the monthly water consumption in the four canals, except for the Hongqi canal irrigation area, the tendency of irrigation in the remaining three regions is to use water for corn cultivation.
From the geographical location and irrigation area of the four canals in the Zhanghe River Basin, the Dayuefeng and Xiaoyuefeng canals mainly provide irrigation water for Hebei Province, while the Yuejin and Hongqi canals mainly provide irrigation water for Henan Province. Moreover, from the change of interannual water diversions in the two periods, the proportion of water used in Hebei Province increased from 36.48% to 47.67%, the proportion of water used in Henan Province increased from 19.37% to 23.07% and the remaining water resources in Shanxi Province decreased from 44.14% to 29.26% (Figure 8) Hebei Province’s water demand has risen to twice that of Henan Province.

4. Discussion

From the changes in the water use ratio for different crop cultivation periods, the water use in each canal increased in the second stage because the overall flow in the basin was higher in that stage, but the water allocation for wheat in both stages was maintained at the same ratio, which shows that there was no major change in the wheat cultivation area and water demand. In terms of water allocation ratio during the maize planting period, there is an obvious difference between the two stages, of which the change of Dayuefeng canal is the most obvious. From the point of view of water diversion, the monthly average water diversion during the second stage of Dayuefeng canal increased by 4.32 m3/s and the total water resources occupancy increased from 20% to 33.5%. For the Xiaoyuefeng canal, the monthly average water diversion increased by 1.28 m3/s and the total water resources occupancy increased from 8.8% to 13.2%. The diversion volume of the Hongqi canal increased by 1.93 m3/s, the total water resources occupancy increased from 14.1% to 19.6% and the diversion volume of the Yuejin canal increased by 0.73 m3/s, with the total occupancy of the water resources increasing from 5.3% to 7.3%. Combining the change of water diversion ratio in the two stages and the change in the overall runoff in the catchment, it can be seen that the change of water diversion in the catchment gradually changed from winter food mainly consisting of wheat to summer crops mainly consisting of corn. According to the annual water consumption change of canal in two stages, the change in the land use area and irrigation area of each irrigation canal, the increase in the summer crop water consumption mainly based on corn was the main reason for the change of water diversion of each canal in the catchment, and the change of water consumption of this crop was mainly based on the increase in planting water demand in Hebei Province.
Current research on the attribution of runoff change and water consumption change in the catchment area has mainly focused on the following aspects: attribution identification of different influencing factors, including an attribution analysis of the dominant factors such as the climate [44,45], the underlying surface [46], and human activities [47] and an analysis of the impact of synergies between different elements. Besides an attribution analysis of the influencing factors of runoff change, the main causes of runoff change affected by different factors and the allocation of water resources after runoff change should also be the focus of researchers, especially in areas where human activities account for a large proportion. For watersheds with large irrigation needs, a consideration of the impact of different crops on runoff changes and changes in the water requirements of different crops can adequately design the future distribution of water resources in the watershed [48]. For areas with urban and industrial water intake, an analysis of water demand of different industries at different times is also important for future urban planning and design [49]. Compared with the traditional runoff analysis in the past, this paper not only analyzed the difference between the change of water requirement and area of two main food crops, but also identified the change in the planting structure in the catchment by using the change in the canal diversion and irrigation time of the main crops in the catchment. This method of analyzing the change in the water consumption structure in the catchment based on the change of water consumption in different time and fields has a certain reference value for the attribution analysis of runoff in other catchments. It has certain significance and value for the follow-up water resource allocation and for decision makers to make policies.

5. Conclusions

Based on the SWAT model to simulate and restore the historical runoff series of the Zhanghe River basin, and combined with the runoff change analysis model with canal water use data to study the causes of runoff changes in the basin, we can now draw the following conclusions:
(1)
Under the influence of both climate change and human activities, the runoff volume in the Zhanghe River basin has decreased significantly. The average flow change in the basin before and after the abrupt change point was 38.62 m3/s. The analysis results of the SWAT model simulation and the runoff reversion model showed that the percentage of runoff change caused by climate change in the basin was 36.2%, while the percentage of runoff change under the influence of human activities was 63.8%.
(2)
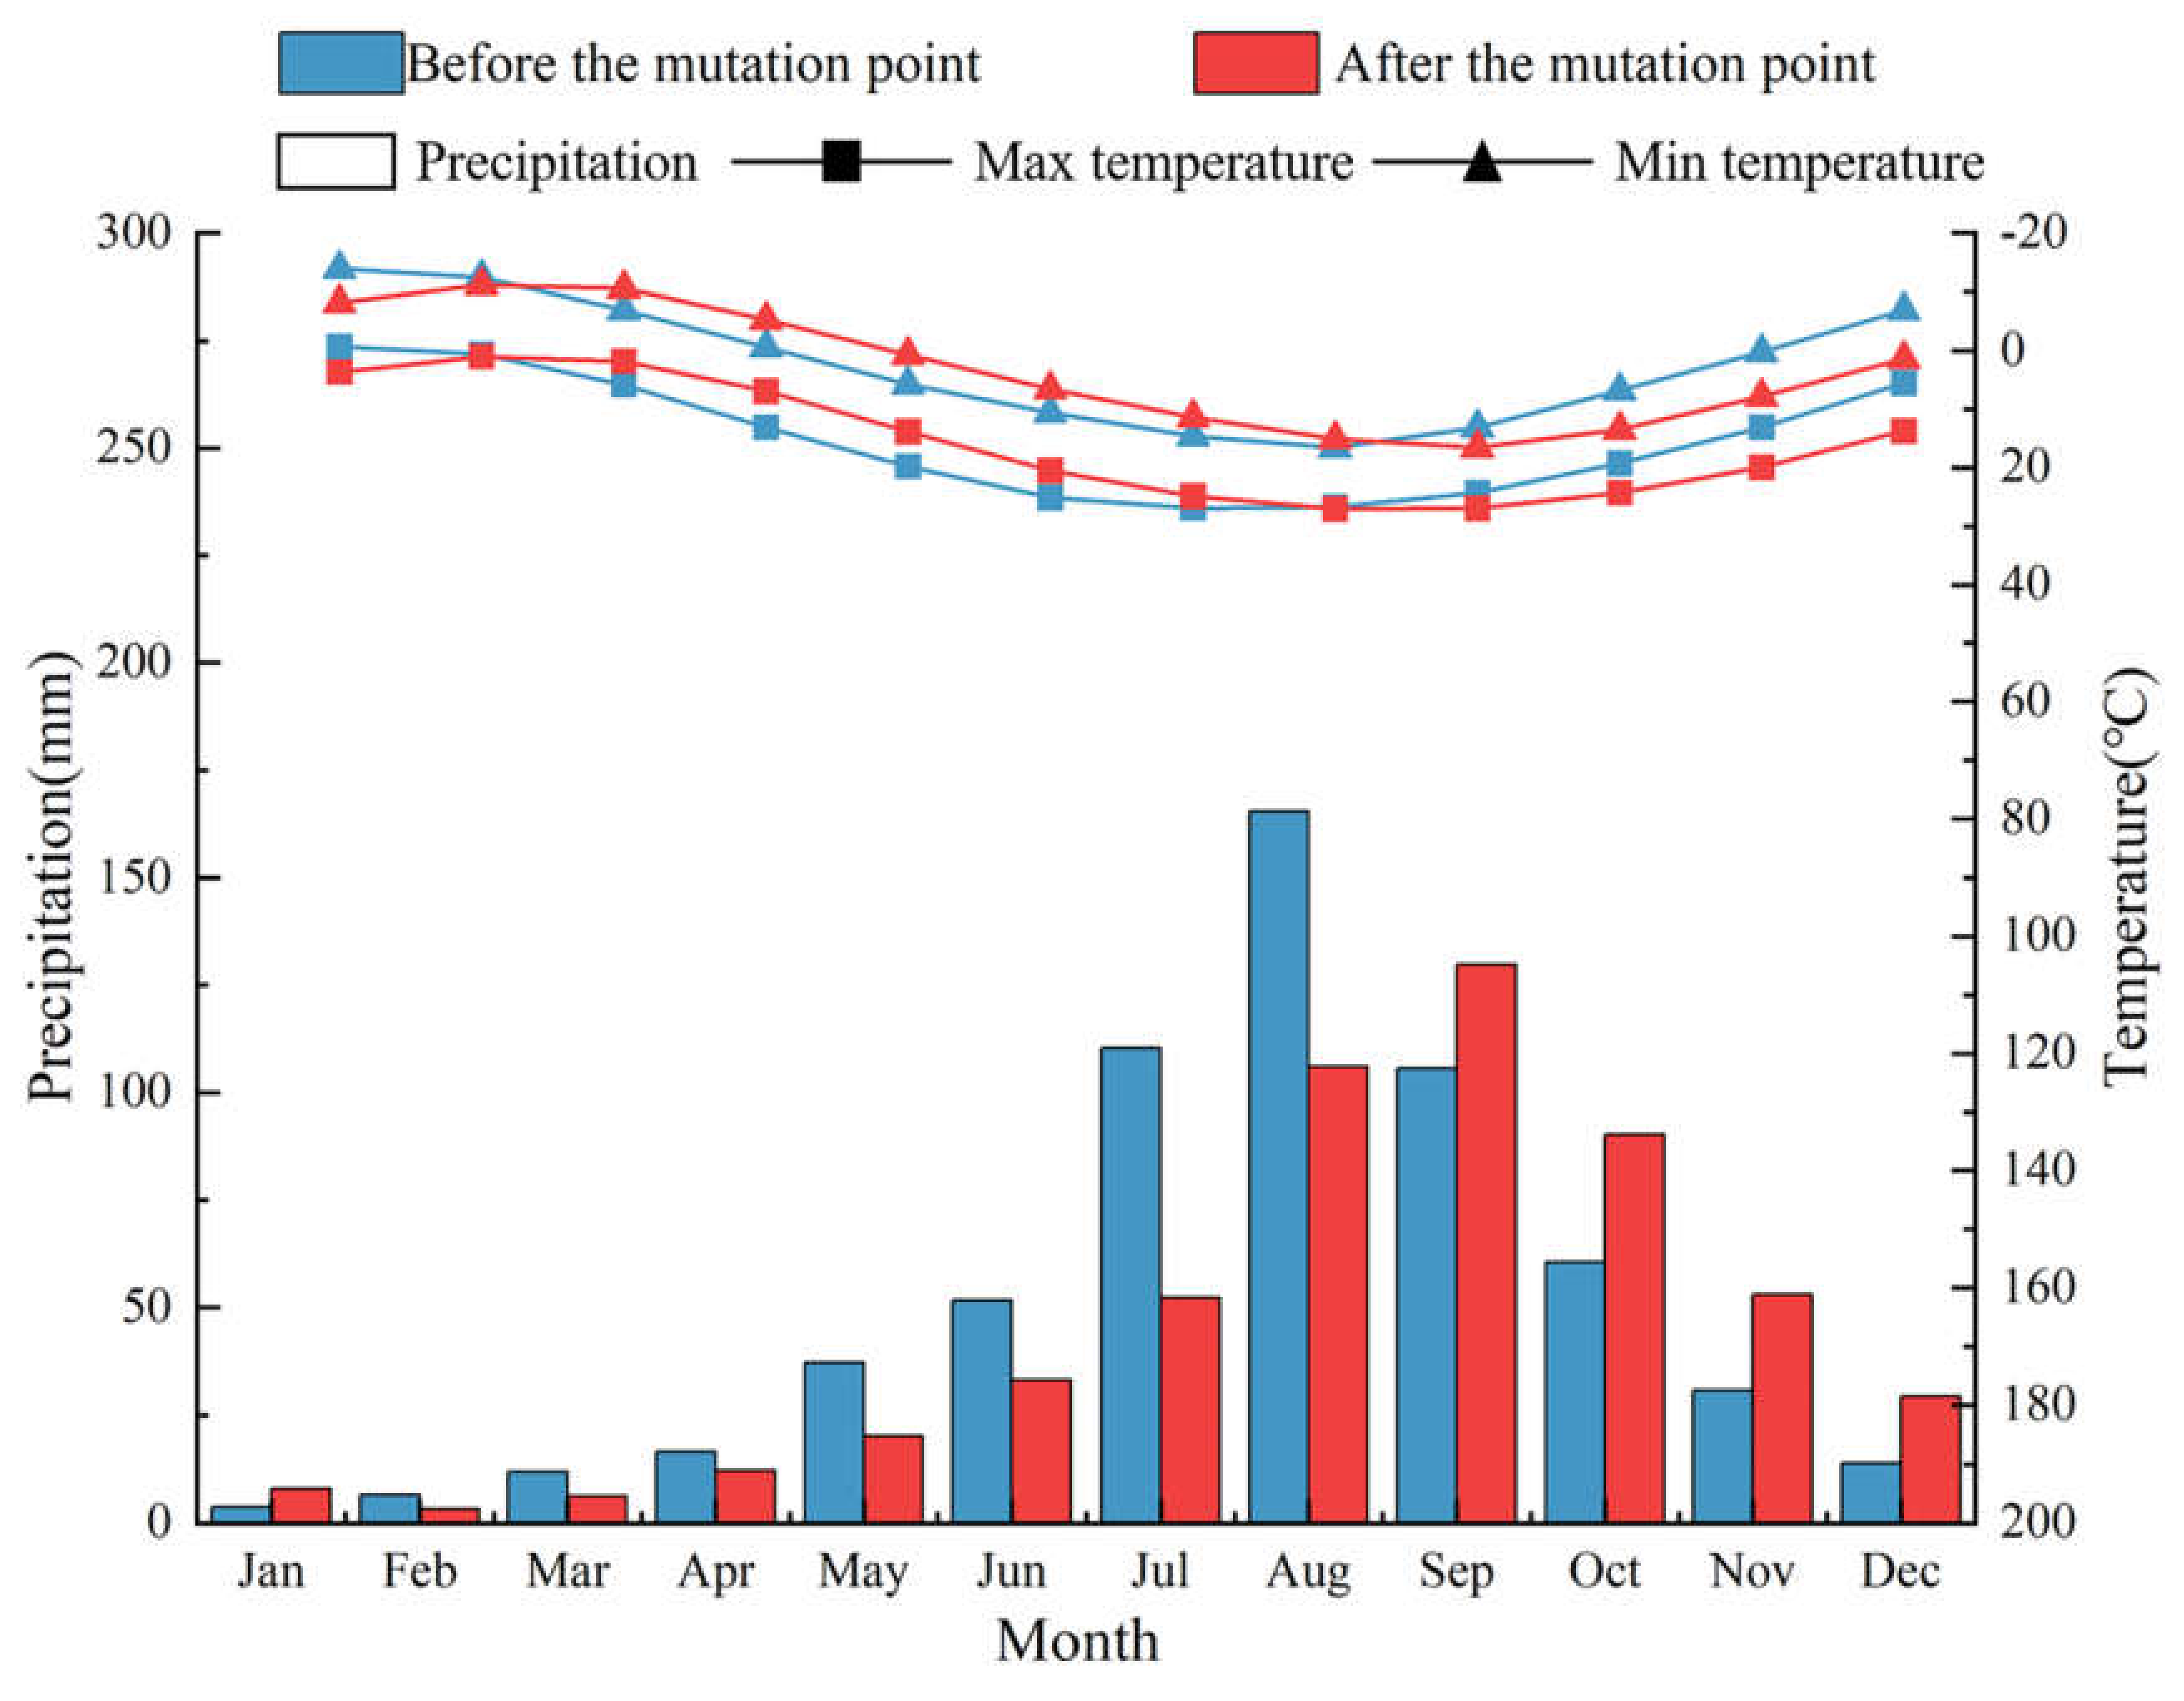
The main influencing factor of meteorological elements is the change in precipitation. For this watershed, the decrease in flood precipitation was the main climatic factor, which also led to more canal diversions for the irrigation of summer crops. Among the influencing factors of human activities, agricultural production is the main target of water consumption in Zhanghe River Basin, with an average water consumption ratio of 63.39%.
(3)
It can be seen that the dominant factor of canal diversions is gradually changing from the water supply of wheat-based winter cereals to the water supply of maize-based summer crops, and the overall water diversions have risen with the growth of agricultural land and the rise of river runoff. Moreover, from the ratios between different canal diversions and their irrigation areas, irrigation water for summer crops in Hebei Province has gradually become one of the dominant factors affecting the overall outflow of the basin.

Author Contributions

Conceptualization, X.C. and Y.L.; methodology, Y.L.; software, X.C.; validation, Y.L.; formal analysis, T.G.; investigation, J.J.; resources, Y.L.; data curation, X.C. and Y.L.; writing—original draft preparation, X.C.; writing—review and editing, Y.L.; visualization, Z.S.; supervision, J.Z., G.W., C.L. and Z.B.; project administration, Y.L.; funding acquisition, Y.L. All authors have read and agreed to the published version of the manuscript.

Funding

This research was funded by the National Natural Science Foundation of China (52079079), the National Key Research and Development Program of China (2018YFC1508104), the Natural Science Foundation of Jiangsu Province (BK20191129), and the Natural Science Foundation of Zhejiang Province (2021C03017).

Institutional Review Board Statement

Not applicable.

Informed Consent Statement

Not applicable.

Data Availability Statement

The data presented in this study are available on request from the corresponding author.

Conflicts of Interest

The authors declare no conflict of interest.

References

  1. Li, P.; Qian, H. Water resource development and protection in loess areas of the world: A summary to the thematic issue of water in loess. Environ. Earth Sci. 2018, 77, 796. [Google Scholar] [CrossRef]
  2. Zheng, H.; Zhang, L.; Zhu, R.; Liu, C.; Sato, Y.; Fukushima, Y. Responses of streamflow to climate and land surface change in the headwaters of the Yellow River Basin. Water Resour. Res. 2009, 45, 7. [Google Scholar] [CrossRef]
  3. Erler, A.R.; Frey, S.K.; Khader, O.; D’Orgeville, M.; Park, Y.; Hwang, H.; Lapen, D.R.; Peltier, W.R.; Sudicky, E.A. Simulating Climate Change Impacts on Surface Water Resources Within a Lake-Affected Region Using Regional Climate Projections. Water Resour. Res. 2019, 55, 130–155. [Google Scholar] [CrossRef]
  4. Wu, J.; Miao, C.; Wang, Y.; Duan, Q.; Zhang, X. Contribution analysis of the long-term changes in seasonal runoff on the Loess Plateau, China, using eight Budyko-based methods. J. Hydrol. 2017, 545, 263–275. [Google Scholar] [CrossRef]
  5. Lotz, T.; Opp, C.; He, X. Factors of runoff generation in the Dongting Lake basin based on a SWAT model and implications of recent land cover change. Quat. Int. 2018, 475, 54–62. [Google Scholar] [CrossRef]
  6. Hasan, E.; Tarhule, A.; Kirstetter, P.-E.; Clark, R.; Hong, Y. Runoff sensitivity to climate change in the Nile River Basin. J. Hydrol. 2018, 561, 312–321. [Google Scholar] [CrossRef]
  7. Feng, X. Characteristics of Runoff Variation in Dalinghe River Basin in Recent 50 Years. J. China Hydrol. 2017, 37, 84–90. (In Chinese) [Google Scholar]
  8. Hu, J.; Ma, J.; Nie, C.; Xue, L.; Zhang, Y.; Ni, F.; Deng, Y.; Liu, J.; Zhou, D.; Li, L.; et al. Attribution Analysis of Runoff Change in Min-Tuo River Basin based on SWAT model simulations, China. Sci. Rep. 2020, 10, 2900. [Google Scholar] [CrossRef] [Green Version]
  9. Coles, A.; McConkey, B.; McDonnell, J. Climate change impacts on hillslope runoff on the northern Great Plains, 1962–2013. J. Hydrol. 2017, 550, 538–548. [Google Scholar] [CrossRef]
  10. Lv, A.; Qi, S.; Wang, G. Multi-model driven by diverse precipitation datasets increases confidence in identifying dominant factors for runoff change in a subbasin of the Qaidam Basin of China. Sci. Total Environ. 2021, 802, 149831. [Google Scholar] [CrossRef]
  11. Triet, N.V.K.; Dung, N.V.; Hoang, L.P.; Le Duy, N.; Tran, D.D.; Anh, T.T.; Kummu, M.; Merz, B.; Apel, H. Future projections of flood dynamics in the Vietnamese Mekong Delta. Sci. Total Environ. 2020, 742, 140596. [Google Scholar] [CrossRef] [PubMed]
  12. Tran, D.D.; van Halsema, G.; Hellegers, P.J.G.J.; Hoang, L.P.; Tran, T.Q.; Kummu, M.; Ludwig, F. Assessing impacts of dike construction on the flood dynamics of the Mekong Delta. Hydrol. Earth Syst. Sci. 2018, 22, 1875–1896. [Google Scholar] [CrossRef] [Green Version]
  13. Dang, V.H.; Tran, D.D.; Cham, D.D.; Hang, P.T.T.; Nguyen, H.T.; Van Truong, H.; Tran, P.H.; Duong, M.B.; Nguyen, N.T.; Van Le, K.; et al. Assessment of Rainfall Distributions and Characteristics in Coastal Provinces of the Vietnamese Mekong Delta under Climate Change and ENSO Processes. Water 2020, 12, 1555. [Google Scholar] [CrossRef]
  14. Yang, Y.; Tian, F. Abrupt change of runoff and its major driving factors in Haihe River Catchment, China. J. Hydrol. 2009, 374, 373–383. [Google Scholar] [CrossRef]
  15. Bin, L.; Xu, K.; Xu, X.; Lian, J.; Ma, C. Development of a landscape indicator to evaluate the effect of landscape pattern on surface runoff in the Haihe River Basin. J. Hydrol. 2018, 566, 546–557. [Google Scholar] [CrossRef]
  16. Wang, D.; Yu, X.; Jia, G.; Wang, H. Sensitivity analysis of runoff to climate variability and land-use changes in the Haihe Basin mountainous area of north China. Agric. Ecosyst. Environ. 2018, 269, 193–203. [Google Scholar] [CrossRef]
  17. Zhang, Q.; Liu, J.; Yu, X.; Chen, L. Scale effects on runoff and a decomposition analysis of the main driving factors in Haihe Basin mountainous area. Sci. Total Environ. 2019, 690, 1089–1099. [Google Scholar] [CrossRef]
  18. Zhang, L.; Karthikeyan, R.; Bai, Z.; Srinivasan, R. Analysis of streamflow responses to climate variability and land use change in the Loess Plateau region of China. Catena 2017, 154, 1–11. [Google Scholar] [CrossRef]
  19. Luan, X.; Wu, P.; Sun, S.; Wang, Y.; Gao, X. Quantitative study of the crop production water footprint using the SWAT model. Ecol. Indic. 2018, 89, 1–10. [Google Scholar] [CrossRef]
  20. Dias, V.D.S.; da Luz, M.P.; Medero, G.M.; Nascimento, D.T.F.; De Oliveira, W.N.; Merelles, L.R.D.O. Historical Streamflow Series Analysis Applied to Furnas HPP Reservoir Watershed Using the SWAT Model. Water 2018, 10, 458. [Google Scholar] [CrossRef] [Green Version]
  21. Aznarez, C.; Jimeno-Sáez, P.; López-Ballesteros, A.; Pacheco, J.; Senent-Aparicio, J. Analysing the Impact of Climate Change on Hydrological Ecosystem Services in Laguna del Sauce (Uruguay) Using the SWAT Model and Remote Sensing Data. Remote Sens. 2021, 13, 2014. [Google Scholar] [CrossRef]
  22. Meshesha, T.W.; Wang, J.; Melaku, N.D.; McClain, C.N. Modelling groundwater quality of the Athabasca River Basin in the subarctic region using a modified SWAT model. Sci. Rep. 2021, 11, 13574. [Google Scholar] [CrossRef] [PubMed]
  23. Qi, P.; Xia, Z.; Zhang, G.; Zhang, W.; Chang, Z. Effects of climate change on agricultural water resource carrying capacity in a high-latitude basin. J. Hydrol. 2021, 597, 126328. [Google Scholar] [CrossRef]
  24. Hoshiyar, S.M.S.; Pirmoradian, N.; Ashrafzadeh, A.; Rizi, A.P. Performance Assessment of a Water Delivery Canal to Improve Agricultural Water Distribution. Water Resour. Manag. 2021, 35, 2487–2501. [Google Scholar] [CrossRef]
  25. Dai, X.; Han, Y.; Zhang, X.; Li, D.; Chen, J.; Keshavarz, M.; García-García, P.L.; Ruelas-Monjardín, L.; Marín-Muñíz, J.L.; De, I.; et al. Impacts on the utilization degree of canal water caused by agricultural water reallocation: A case study from China. Water Policy 2015, 17, 815–830. [Google Scholar] [CrossRef]
  26. Nishida, K.; Harashima, T.; Yoshida, S.; Ohno, S. Water flow resistance along the pathway from the plow layer to the drainage canal via subsurface drainage in a paddy field. Agric. Water Manag. 2020, 242, 106391. [Google Scholar] [CrossRef]
  27. Yousaf, W.; Awan, W.K.; Kamran, M.; Ahmad, S.R.; Bodla, H.U.; Riaz, M.; Umar, M.; Chohan, K. A paradigm of GIS and remote sensing for crop water deficit assessment in near real time to improve irrigation distribution plan. Agric. Water Manag. 2020, 243, 106443. [Google Scholar] [CrossRef]
  28. Liu, J.; Yang, T.; Chen, Q.; Liu, F.; Wang, B. Distribution and potential ecological risk of heavy metals in the typical eco-units of Haihe River Basin. Front. Environ. Sci. Eng. 2014, 10, 103–113. [Google Scholar] [CrossRef]
  29. Bao, Z.; Zhang, J.; Wang, G.; Fu, G.; He, R.; Yan, X.; Jin, J.; Liu, Y.; Zhang, A. Attribution for decreasing streamflow of the Haihe River basin, northern China: Climate variability or human activities? J. Hydrol. 2012, 460–461, 117–129. [Google Scholar] [CrossRef]
  30. Kendall, M.G. Rank correlation methods. Brit. J. Psychol. 1990, 25, 86–91. [Google Scholar] [CrossRef]
  31. Arnold, J.; Allen, P. Estimating hydrologic budgets for three Illinois watersheds. J. Hydrol. 1996, 176, 57–77. [Google Scholar] [CrossRef]
  32. Sun, C.; Ren, L. Assessment of surface water resources and evapotranspiration in the Haihe River basin of China using SWAT model. Hydrol. Process. 2012, 27, 1200–1222. [Google Scholar] [CrossRef]
  33. Sun, C.; Ren, L. Assessing crop yield and crop water productivity and optimizing irrigation scheduling of winter wheat and summer maize in the Haihe plain using SWAT model. Hydrol. Process. 2013, 28, 2478–2498. [Google Scholar] [CrossRef]
  34. Bu, J.; Lu, C.; Niu, J.; Gao, Y. Attribution of Runoff Reduction in the Juma River Basin to Climate Variation, Direct Human Intervention, and Land Use Change. Water 2018, 10, 1775. [Google Scholar] [CrossRef] [Green Version]
  35. Zhang, X.; Ren, L. Simulating and assessing the effects of seasonal fallow schemes on the water-food-energy nexus in a shallow groundwater-fed plain of the Haihe River basin of China. J. Hydrol. 2021, 595, 125992. [Google Scholar] [CrossRef]
  36. Jin, J.; Wang, G.; Zhang, J.; Yang, Q.; Liu, C.; Liu, Y.; Bao, Z.; He, R. Impacts of climate change on hydrology in the Yellow River source region, China. J. Water Clim. Chang. 2018, 11, 916–930. [Google Scholar] [CrossRef]
  37. Johnston, R.; Smakhtin, V. Hydrological Modeling of Large river Basins: How Much is Enough? Water Resour. Manag. 2014, 28, 2695–2730. [Google Scholar] [CrossRef] [Green Version]
  38. Nguyen, H.H.; Peche, A.; Venohr, M. Modelling of sewer exfiltration to groundwater in urban wastewater systems: A critical review. J. Hydrol. 2021, 596, 126130. [Google Scholar] [CrossRef]
  39. Singh, A.; Jha, S.K. Identification of sensitive parameters in daily and monthly hydrological simulations in small to large catchments in Central India. J. Hydrol. 2021, 601, 126632. [Google Scholar] [CrossRef]
  40. Mosbahi, M.; Benabdallah, S.; Boussema, M.R. Sensitivity analysis of a GIS-based model: A case study of a large semi-arid catchment. Earth Sci. Inform. 2014, 8, 569–581. [Google Scholar] [CrossRef]
  41. Mourad, A.; El Messari, J.E.; Ismail, H.; Abdelmounim, B.; Gabriel, M.J.; Loubna, B.; Reda, A.M. Assessment of the SWAT Model and the Parameters Affecting the Flow Simulation in the Watershed of Oued Laou (Northern Morocco). J. Ecol. Eng. 2019, 20, 104–113. [Google Scholar] [CrossRef]
  42. Yesuf, H.M.; Assen, M.; Alamirew, T.; Melesse, A. Modeling of sediment yield in Maybar gauged watershed using SWAT, northeast Ethiopia. Catena 2015, 127, 191–205. [Google Scholar] [CrossRef]
  43. Wei, L.; Changxing, S.; Yuanyuan, Z. Trends and attribution of runoff changes in the upper and middle reaches of the Yellow River in China. J. Hydro-Environ. Res. 2021, 37, 57–66. [Google Scholar] [CrossRef]
  44. Bhatti, A.Z.; Farooque, A.A.; Krouglicof, N.; Peters, W.; Acharya, B.; Li, Q.; Ahsan, M.S. Climate change impacts on precipitation and temperature in Prince Edward Island, Canada. World Water Policy 2021, 7, 9–29. [Google Scholar] [CrossRef]
  45. Escanilla-Minchel, R.; Alcayaga, H.; Soto-Alvarez, M.; Kinnard, C.; Urrutia, R. Evaluation of the Impact of Climate Change on Runoff Generation in an Andean Glacier Watershed. Water 2020, 12, 3547. [Google Scholar] [CrossRef]
  46. Huntington, J.L.; Niswonger, R.G. Role of surface-water and groundwater interactions on projected summertime streamflow in snow dominated regions: An integrated modeling approach. Water Resour. Res. 2012, 48. [Google Scholar] [CrossRef] [Green Version]
  47. Li, Y.; He, D.; Li, X.; Zhang, Y.; Yang, L. Contributions of Climate Variability and Human Activities to Runoff Changes in the Upper Catchment of the Red River Basin, China. Water 2016, 8, 414. [Google Scholar] [CrossRef] [Green Version]
  48. Zhao, X.; Huang, J.; Wu, P.; Gao, X. The dynamic effects of pastures and crop on runoff and sediments reduction at loess slopes under simulated rainfall conditions. Catena 2014, 119, 1–7. [Google Scholar] [CrossRef]
  49. Hu, Y.; Moiwo, J.P.; Yang, Y.; Han, S.; Yang, Y. Agricultural water-saving and sustainable groundwater management in Shijiazhuang Irrigation District, North China Plain. J. Hydrol. 2010, 393, 219–232. [Google Scholar] [CrossRef]
Figure 1. Location map of the study area.
Water 14 01918 g001
Figure 2. Flow chart of this paper.
Water 14 01918 g002
Figure 3. Mutation point test of the meteorological and hydrological elements. (a). Time series variation of Guantai runoff; (b). Mann–Kendall mutation test result of Guantai runoff; (c). Change in mean runoff before and after the mutation point; (d). Changes in rainfall runoff correlation before and after the mutation point.
Water 14 01918 g003
Figure 4. SWAT simulation result of Guantai station.
Water 14 01918 g004
Figure 5. Runoff attribution analysis result.
Water 14 01918 g005
Figure 6. Change in precipitation and temperature before and after the mutation point.
Water 14 01918 g006
Figure 7. Changes in average monthly diversions for two periods in the four canals. (a). Dayuefeng canal; (b). Xiaoyuefeng canal; (c). Hongqi canal; (d). Yuejin canal.
Water 14 01918 g007aWater 14 01918 g007b
Figure 8. Radar map of water use changes in two periods.
Water 14 01918 g008
Table 1. The hydrological and meteorological station information used in this paper.
Station NameStarting TimeTypeTime Scale
Guantai1951Hydrological stations&
Meteorological stations
daily
Shexian1950Meteorological stationsdaily
Liujiazhuang1953Meteorological stationsdaily
Kuangmenkou1953Meteorological stationsdaily
Tianqiaoduan1958Meteorological stationsdaily
Yincheng1952Meteorological stationsdaily
Changzi1953Meteorological stationsdaily
Guxian1953Meteorological stationsdaily
Shipan1953Meteorological stationsdaily
Quandian1953Meteorological stationsdaily
Panlong1953Meteorological stationsdaily
Xihandan1952Meteorological stationsdaily
Shiliang1952Meteorological stationsdaily
Hengling1951Meteorological stationsdaily
Xiajiaozhang1952Meteorological stationsdaily
Table 2. The parameter calibration results of Guantai.
ParameterRangesCalibration Value
r__CN2.mgt−0.2–0.2−0.083
v__ALPHA_BF.gw0–10.600
v__GW_DELAY.gw0–50085.118
v__GWQMN.gw0–5000608.789
v__ESCO.hru0–10.635
v__ALPHA_BNK.rte0–10.551
v__SOL_AWC.sol0–10.671
v__SOL_K.sol0–2000173.191
v__SOL_BD.sol0.9–2.51.308
v__SLSUBBSN.hru10–150101.439
Table 3. Total annual diversions of the canals.
YearTotal Diversion FlowRemaining FlowDiversion Ratio
199514.2147.0223.20%
199615.437.6266.94%
199714.395.5172.31%
199812.203.2978.76%
19998.914.4666.64%
200010.059.5551.28%
200114.716.3469.88%
200217.1824.940.83%
200319.3918.6950.92%
200425.0210.6870.08%
200520.8613.1361.37%
200627.5412.3369.07%
200728.509.9574.12%
200820.753.7184.83%
200910.695.0867.79%
201016.0328.16466.26%
Publisher’s Note: MDPI stays neutral with regard to jurisdictional claims in published maps and institutional affiliations.

