Article

Analysis of Future Meteorological Drought Changes in the Yellow River Basin under Climate Change

1
State Key Laboratory of Hydrology-Water Resources and Hydraulic Engineering, Nanjing Hydraulic Research Institute, Nanjing 210029, China
2
Yangtze Institute for Conservation and Development, Nanjing 210098, China
3
Research Center for Climate Change, Nanjing 210029, China
4
Research Centre of Fluid Machinery Engineering and Technology, Jiangsu University, Zhenjiang 212013, China
*
Author to whom correspondence should be addressed.
Water 2022, 14(12), 1896; https://doi.org/10.3390/w14121896
Submission received: 18 April 2022 / Revised: 28 May 2022 / Accepted: 5 June 2022 / Published: 13 June 2022

Abstract

:
The Yellow River Basin is an important economic belt and key ecological reservation area in China. In the context of global warming, it is of great significance to project the drought disaster risk for ensuring water security and improving water resources management measures in practice. Based on the five Global Climate Models (GCMs) projections under three scenarios of the Shared Socioeconomic Pathways (SSP) (SSP126, SSP245, SSP585) released in the Sixth Coupled Model Intercomparison Project (CMIP6), this study analyzed the characteristics of meteorological drought in the Yellow River Basin in combination with SPEI indicators over 2015–2100. The result indicated that: (1) The GCMs from CMIP6 after bias correction performed better in reproducing the spatial and temporal variation of precipitation. The precipitation in the Yellow River Basin may exhibit increase trends from 2015 to 2100, especially under the SSP585 scenario. (2) The characteristics of meteorological drought in the Yellow River Basin varied from different combination scenarios. Under the SSP126 scenario, the meteorological drought will gradually intensify from 2040 to 2099, while the drought intensity under SSP245 and SSP585 scenarios will likely be higher than SSP126. (3) The spatial variation of meteorological drought in the Yellow River Basin is heterogeneous and uncertain in different combination scenarios and periods. The drought tendency in the Loess Plateau will increase significantly in the future, and the drought frequency and duration in the main water conservation areas of the Yellow River Basin was projected to increase.

1. Introduction

Global warming has accelerated the water cycle, led to the globally redistribution of water resources at different scales, and aggravated the probability and frequency of extreme hydrological events (especially the flood and drought disasters). Thus, the drought events have become one of the most serious climate disasters affecting human society, and it is also a hot spot of research in the field of climatology and hydrology [1,2]. The Yellow River Basin is located in an arid and semi-arid climate zone, and its runoff has reduced due to the decreasing precipitation and its uneven spatiotemporal distribution. In recent years, the intensifying and continuous drought caused serious damage to the production, living, and ecology of the basin [3,4]. Therefore, analyzing the characteristics of precipitation in the Yellow River Basin under future scenarios and forecasting the development of meteorological drought has important practical significance for the rational management and allocation of regional water resources as well as the improvement of regional economic and social development planning [5,6].
The Global Climate Model (GCM) is an important tool to predict future potential climate change, and it has been widely used in the impact of climate change on future drought processes [7,8]. The latest GCMs were from the Sixth Coupled Model Intercomparison Project (CMIP6) developed by the World Climate Research Program (WCRP), and more than 100 models have released their results and detailed data, which include the seven combined scenarios of SSP1-1.9, SSP1-2.6, SSP2-4.5, SSP3-7.0, SSP4-3.4, SSP4-6.0, and SSP5-8.5 [9]. Unlike the typical concentration pathways (RCPs) scenarios in CMIP5, the scenarios in CMIP6 are combined scenarios of different shared socioeconomic pathways (SSPs) and RCPs, which contain implications for future socio-economic development [10]. At the 2012 IPCC AR5 special meeting, five basic SSPs (SSP1–SSP5) were identified: sustainable development path (SSP1), intermediate path (SSP2), and regional competition path (SSP3), unbalanced path (SSP4), and traditional fossil fuel-based path (SSP5). Moreover, the CMIP6 inherits four RCP scenarios (RCP2.6, RCP4.5, RCP6.0, and RCP8.5) from CMIP5 and adds three emission pathways (RCP1.9, RCP3.4, and RCP7.0) [11,12]. Although the GCMs from CMIP6 provide the basis for regional climate changes under different scenarios in the future, due to the differences in the simulation mechanism, initial condition settings, parameterization scheme settings, and spatial resolution of each model, the performance of each GCM varies from different regions. Consequently, it is particularly important to correct the errors between the GCMs and observation [13,14,15]. Smitha et al. proposed a probability distribution function method based on quantile mapping (Daily Bias correction, DBC), which corrected the future climate elements by using the difference between the cumulative distribution characteristics of climate elements simulated by GCMs and regional observation. It could effectively capture the extreme values of climatic elements, thereby improving the its simulation accuracy, which has received more and more attention in recent years [16,17].
Droughts are generally classified into meteorological, agricultural, hydrological, and socioeconomic droughts [18]. It is indisputable that the meteorological droughts caused by the deficit in atmospheric precipitation usually appear first, so the analysis of it is the basis for monitoring and early warning of other types of droughts [19]. Nevertheless, the drought index is an effective technical means to quantitatively evaluate and characterize drought events [20]; the commonly used indicators for meteorological drought are the Standardized Precipitation Index (SPI) [21], Palmer Drought Severity Index (PDSI) [22], and Standardized Precipitation Evapotranspiration Index (SPEI) [23] and so on. Among them, SPEI has been widely used to assess the global and regional meteorological drought due to its simple calculation, multiple time scales, and spatial comparison [24].
In recent years, the impact of climate change on drought by combining GCM, hydrological models, and drought indices has been analyzed by many scholars. Tian et al. [25] analyzed the characteristics of global drought based on CMIP6 and SPI, SPEI, and SRI (Standardized Runoff Index) indices, and the results indicated that in the 21st century, the duration and spatial extent of global drought will increase in most regions, and the drought tendency is gradually intensifying, especially for the extreme drought event. Sung et al. [26] adopted 28 GCMs of CMIP5 at 60 stations in South Korea to calculate the meteorological drought indices on five time scales in the future and found that SPI showed greater uncertainty than SPEI. Xu et al. [27] explored the variation of drought events in historical and future periods based on CMIP6 and used the three-dimensional clustering method. It reflected that the duration, severity, and affected area of meteorological drought in China have increased compared with the historical period, according to the CMIP6 forecast. For the Yellow River Basin, Ma et al. [28] investigated the spatiotemporal patterns and possible changes of future droughts in the Yellow River Basin, and the observations and simulations from three CMIP5 climate models were used as inputs to the VIC hydrological model to calculate the Joint Drought Index (SPDI-JDI) based on the PDSI. It was concluded that the moderate drought in the Yellow River Basin would be alleviated in the future, but the risk of extreme drought might increase. Wang et al. [29] found that SPEI index performs better to describe meteorological drought in the Yellow River Basin.
At present, there are relatively few studies on the drought situation in the Yellow River Basin under the future climate change scenarios projected by CMIP6, mainly on a large scale, such as global and national scales. Particular attention needs to be paid to forecast the future drought conditions in key regions. Therefore, the Yellow River Basin was selected as the study area in this research and based on the three combining scenarios, SSP1-RCP2.6 (SSP126), SSP2-RCP4.5 (SSP245), and SSP5-RCP8.5 (SSP585), which are from the five GCMs released by the CMIP6 to build the climate data for historical periods (1961–2014) and future periods (2040–2099). Then, we combined the observation data to evaluate the simulation accuracy before and after bias correction over the historical period and analyzed the variation of temperature and precipitation in the basin over the future period. Finally, the SPEI index was applied to explore the meteorological drought characteristics of the Yellow River Basin under different scenarios in the future period in order to provide a basis for the formulation of future water resources management measures and the guarantee of water security in the basin.

2. Materials and Methods

2.1. Study Area and Data Description

The Yellow River Basin is located at 31°10′–41°50′ N and 95°53′–119°05′ E in the central and northern parts of China, with a total drainage area of 795,000 km2. (Figure 1). It belongs to the temperate monsoon climate, with annual average precipitation of 144–843 mm, and the precipitation is distributed more in the southeast and less in the northwest. Most of the Yellow River Basin is in arid and semi-arid regions, which are extremely sensitive to climate change [30,31]. In recent years, under the combined influence of climate warming and human activities, natural disasters have occurred more frequently in the Yellow River Basin. Therefore, the drought events are the main meteorological disasters in the basin, which have brought huge losses to the local social economy and people’s lives. In this study, the Yellow River Basin was divided into eight regions according to water resource utilization zoning standards (Table 1).
The observation data used in this study are the daily precipitation and daily maximum and minimum temperature data from 1961 to2014 in the Yellow River Basin. They come from the CN05.1 data set provided by the National Meteorological Center with the spatial resolution of 0.5° × 0.5°, which has good applicability after strictly quality control and standardization [32]. The future forecast data applied in this research were from the CMIP6 (https://pcmdi.llnl.gov/CMIP6) (accessed on 11 March 2020). Considering the large differences in the simulation capabilities of different models, in order to reduce the uncertainty of the results, 19 GCMs were selected, and their applicability in the Yellow River Basin was comprehensively evaluated in previous studies [33]. Finally, the following five GCMs with better performance were picked (Table 2). The temporal resolution of all models was daily, the spatial resolution was processed by bilinear interpolation to a resolution of 0.5° × 0.5°, and the time series was 1961–2100, of which 1961–2014 was the historical period, while 2015–2100 was the future period. The future period was divided into three periods: the near future was 2040–2059, the middle future was 2060–2079, and the far future was 2080–2099.

2.2. Methodology

2.2.1. Data Bias Correction

Although the GCMs from CMIP6 could be effectively adopted to analyze the regional climate elements changes under different scenarios in the future, due to the lack of in-depth understanding of complex atmospheric processes, when applied in GCM at this stage, it is relatively simple. Thus, there would be some deviations between the simulation and observation, and it is very necessary to perform bias correction of the model before the application of GCM [34,35]. The daily bias correction method (DBC) based on quantile mapping is an effective method commonly used to correct systematic biases in GCMs’ output data. It assumed that the climate variables in the historical period and the future period have the same simulation error in each quantile firstly. Then, combining the two methods of local intensity scaling (LOCI) and quantile mapping (QM), the occurrence frequency and magnitude of the daily precipitation series were corrected in turn [36]. The specific calculation formula is as follows:
P G , m c o r = P G , m r a w × ( F o b s P , m 1 [ F G P , m ( P G , m ) ] / P G , m T G , m c o r = T G , m r a w × ( F o b s T , m 1 [ F G T , m ( T G , m ) ] T G , m
where P G , m c o r and T G , m c o r are the corrected daily precipitation and temperature series of the mth month, respectively. P G , m r a w and T G , m r a w are the raw daily precipitation and temperature series of the m month, respectively. F o b s P , m , F G P , m and F o b s T , m , F G T , m are the cumulative distribution functions of the observed and simulated series of daily precipitation (temperature) in the historical period, respectively [37].

2.2.2. Drought Index

The SPEI is developed on the basis of the SPI, which comprehensively considers the effects of temperature, precipitation, and evapotranspiration and is an ideal meteorological drought indicator [38,39]. SPEI can be divided into the monthly scale (SPEI-1), seasonal scale (SPEI-3), and annual scale (SPEI-12). This study mainly considered the impact of long-term climate changes on the meteorological drought in the Yellow River Basin, so SPEI-12 was selected as the drought index, and its calculation method is as follows:
(1)
The water vapor balance between monthly precipitation and potential evapotranspiration D i was calculated as:
D i = P i E T i
where i is the ith month, and P i is the precipitation of ith month. E T i is the monthly potential evapotranspiration, which was calculated by the Hargreaves formula:
E T H = C × R ( T max T min ) E ( T max + T min 2 + T )
C, E, and T are the three parameters of the Hargreaves formula, and their suggested values are 0.0023, 0.5, and 17.8, respectively. R is the monthly total solar radiation. Many studies have pointed out that the parameters C, T, and E all have regional variability [40,41]. Therefore, this study corrected the parameters based on the observation data and the Penman–Monteith formula and then calculated the monthly potential evapotranspiration under different scenarios in the future [42].
(2)
The three-parameter log-logistic probability distribution function was employed to calculate the probability density function f(x) of the monthly precipitation series and then obtain its probability distribution function F(x):
F ( x ) = 0 x f ( t ) d t = [ 1 + ( α x γ ) β ] 2
Among them, α ,   β ,   γ are the scale parameter, the shape parameter, and the position parameter, respectively, and these parameters are estimated by the linear moment method.
Therefore, the SPEI was calculated by standardizing the probability distribution function F(x):
{ S P E I = W c 0 + c 1 W + c 2 W 2 1 + d 1 W + d 2 W 2 + d 3 W 3 ,   ( P 0.5 ,   W = 2 ln P ) S P E I = c 0 + c 1 W + c 2 W 2 1 + d 1 W + d 2 W 2 + d 3 W 3 W ,   ( P > 0.5 ,   W = 2 ln ( 1 P )
The values of other parameters is c 0 = 2.515517, c 1 = 0.802853, c 2 = 0.010328, d 1 = 1.432788, d 2 = 0.189269, and d 3 = 0.001308.

2.2.3. Drought Identification

In this study, we chose the drought frequency, drought duration, drought tendency, drought intensity as the characteristic of drought events. In the identification of drought events, a drought event is defined as starting from the value of drought index less than −0.5 until the drought index is greater than 0. The drought frequency is the ratio of the time of drought events to the total time series; the drought duration is the time of continuous occurrence of drought events, that is, the duration of SPEI is less than −0.5 and continues to the SPEI more than −0.5; and the drought intensity is the minimum SPEI value of the corresponding drought duration [43]. In this study, we followed the classification criteria as Table 3 showed and selected SPEI for 12 months (SPEI-12) to reflect the annual drought; it is in a drought state when SPEI is less than −0.5 [44].
For the trend characteristics of drought events, the Mann–Kendall (M-K) test method recommended by the World Meteorological Organization was used. The M-K method is a good nonparametric test method and is widely used in trend analysis of hydro-meteorological events [45]. When |Z| ≥ 1.96 ( α = 0.05 ) , it indicated that the sequence has a significant trend of wetting or drying with the corresponding confidence level, the positive values are increasing trends, and negative values are decreasing trends. In this study, the smaller the Z value, the greater the drought trend.

3. Results

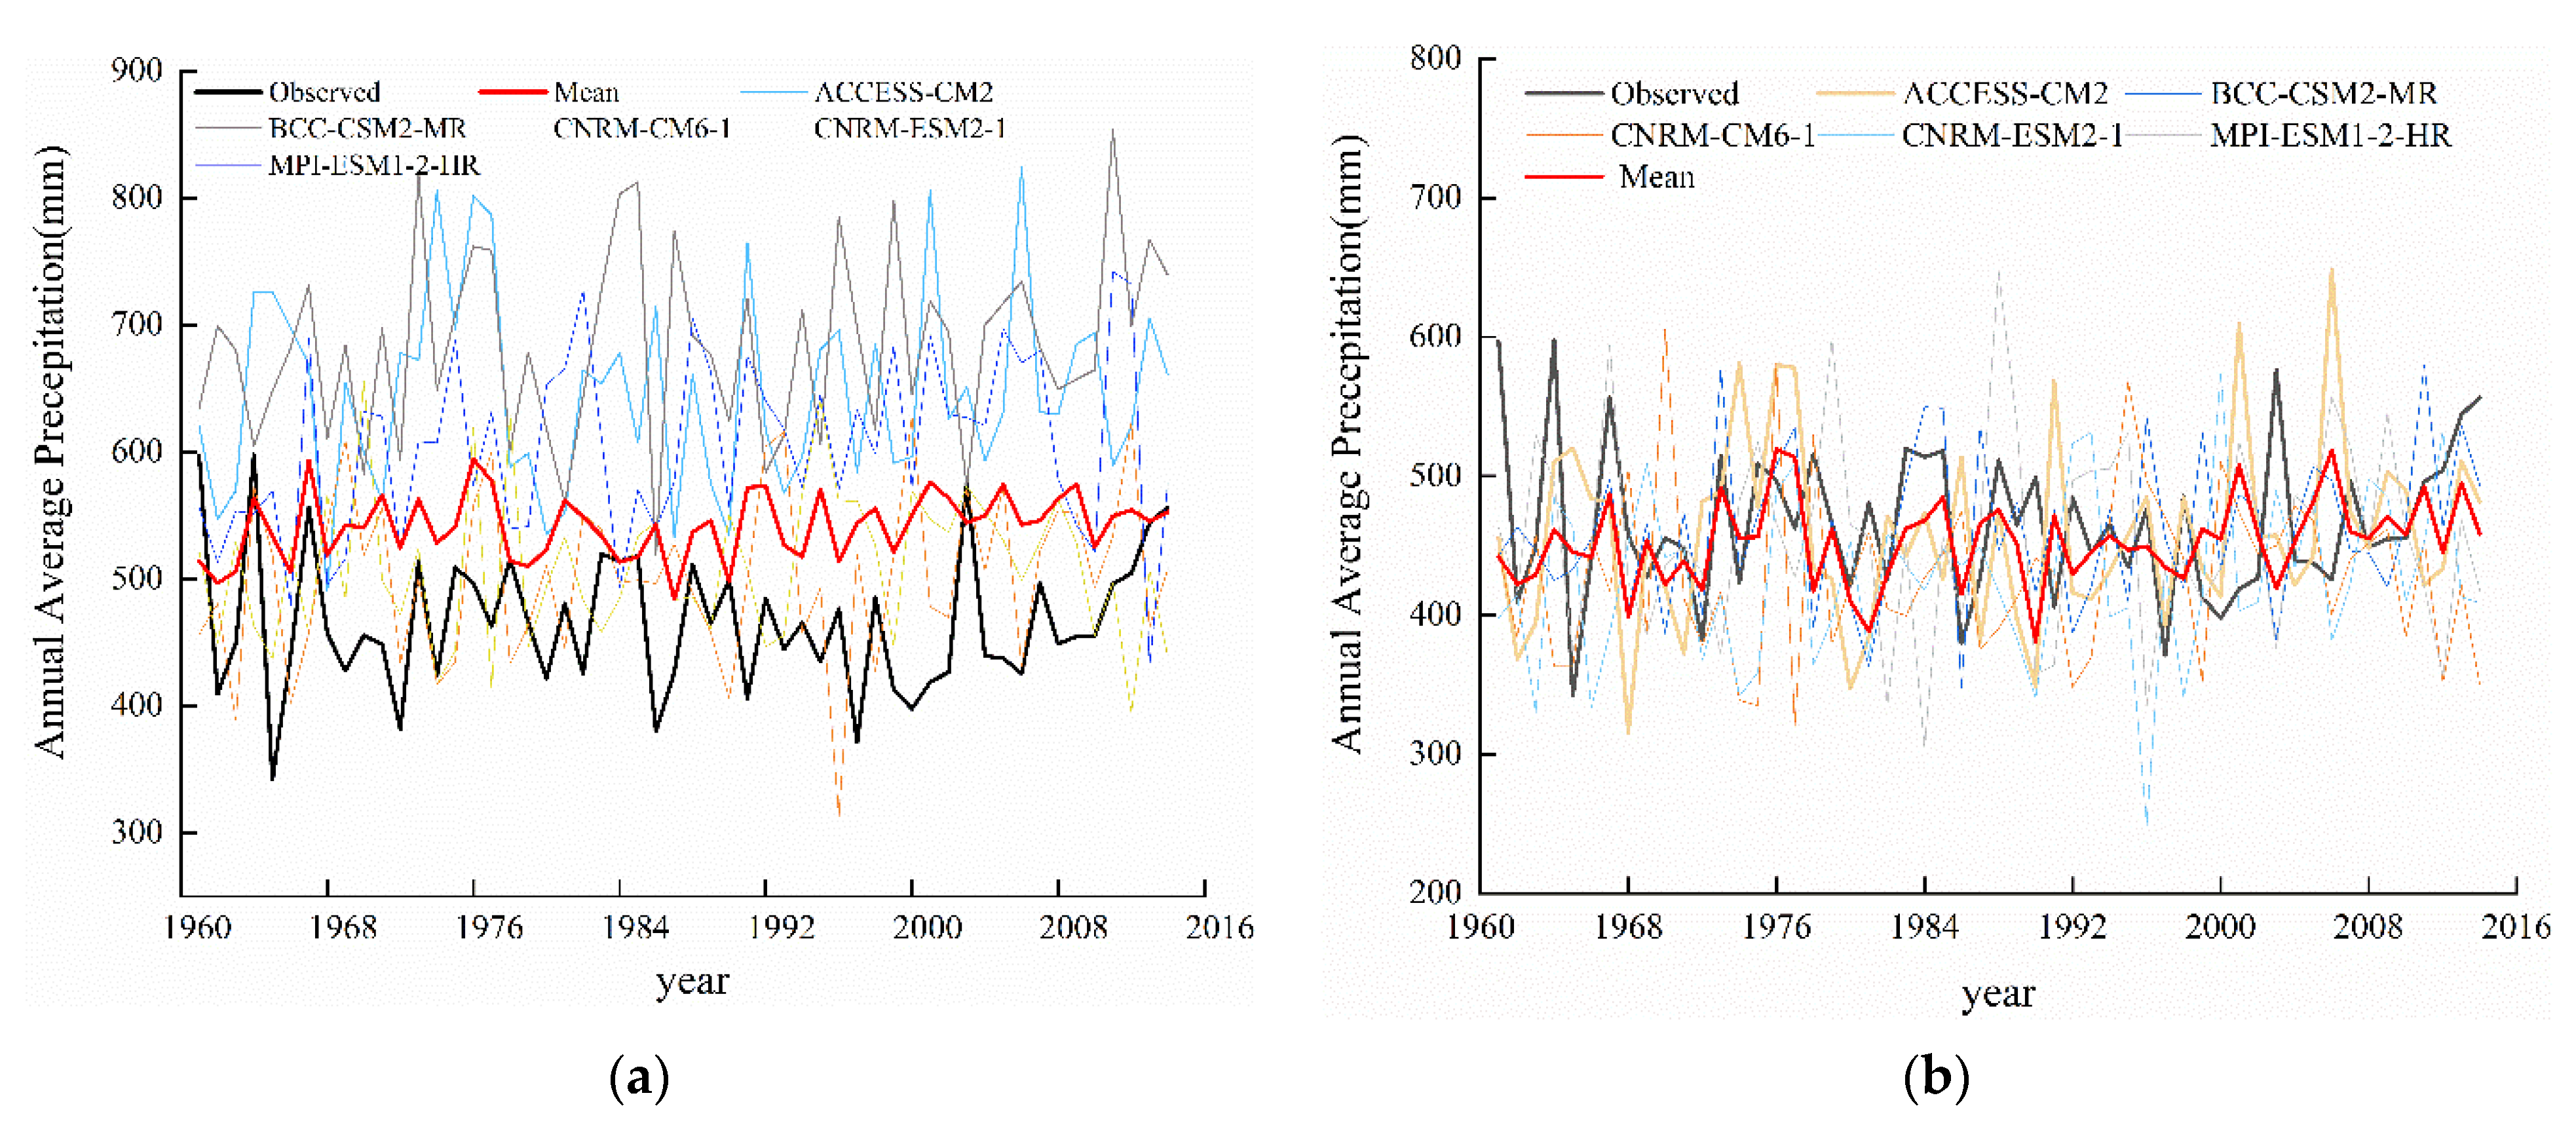
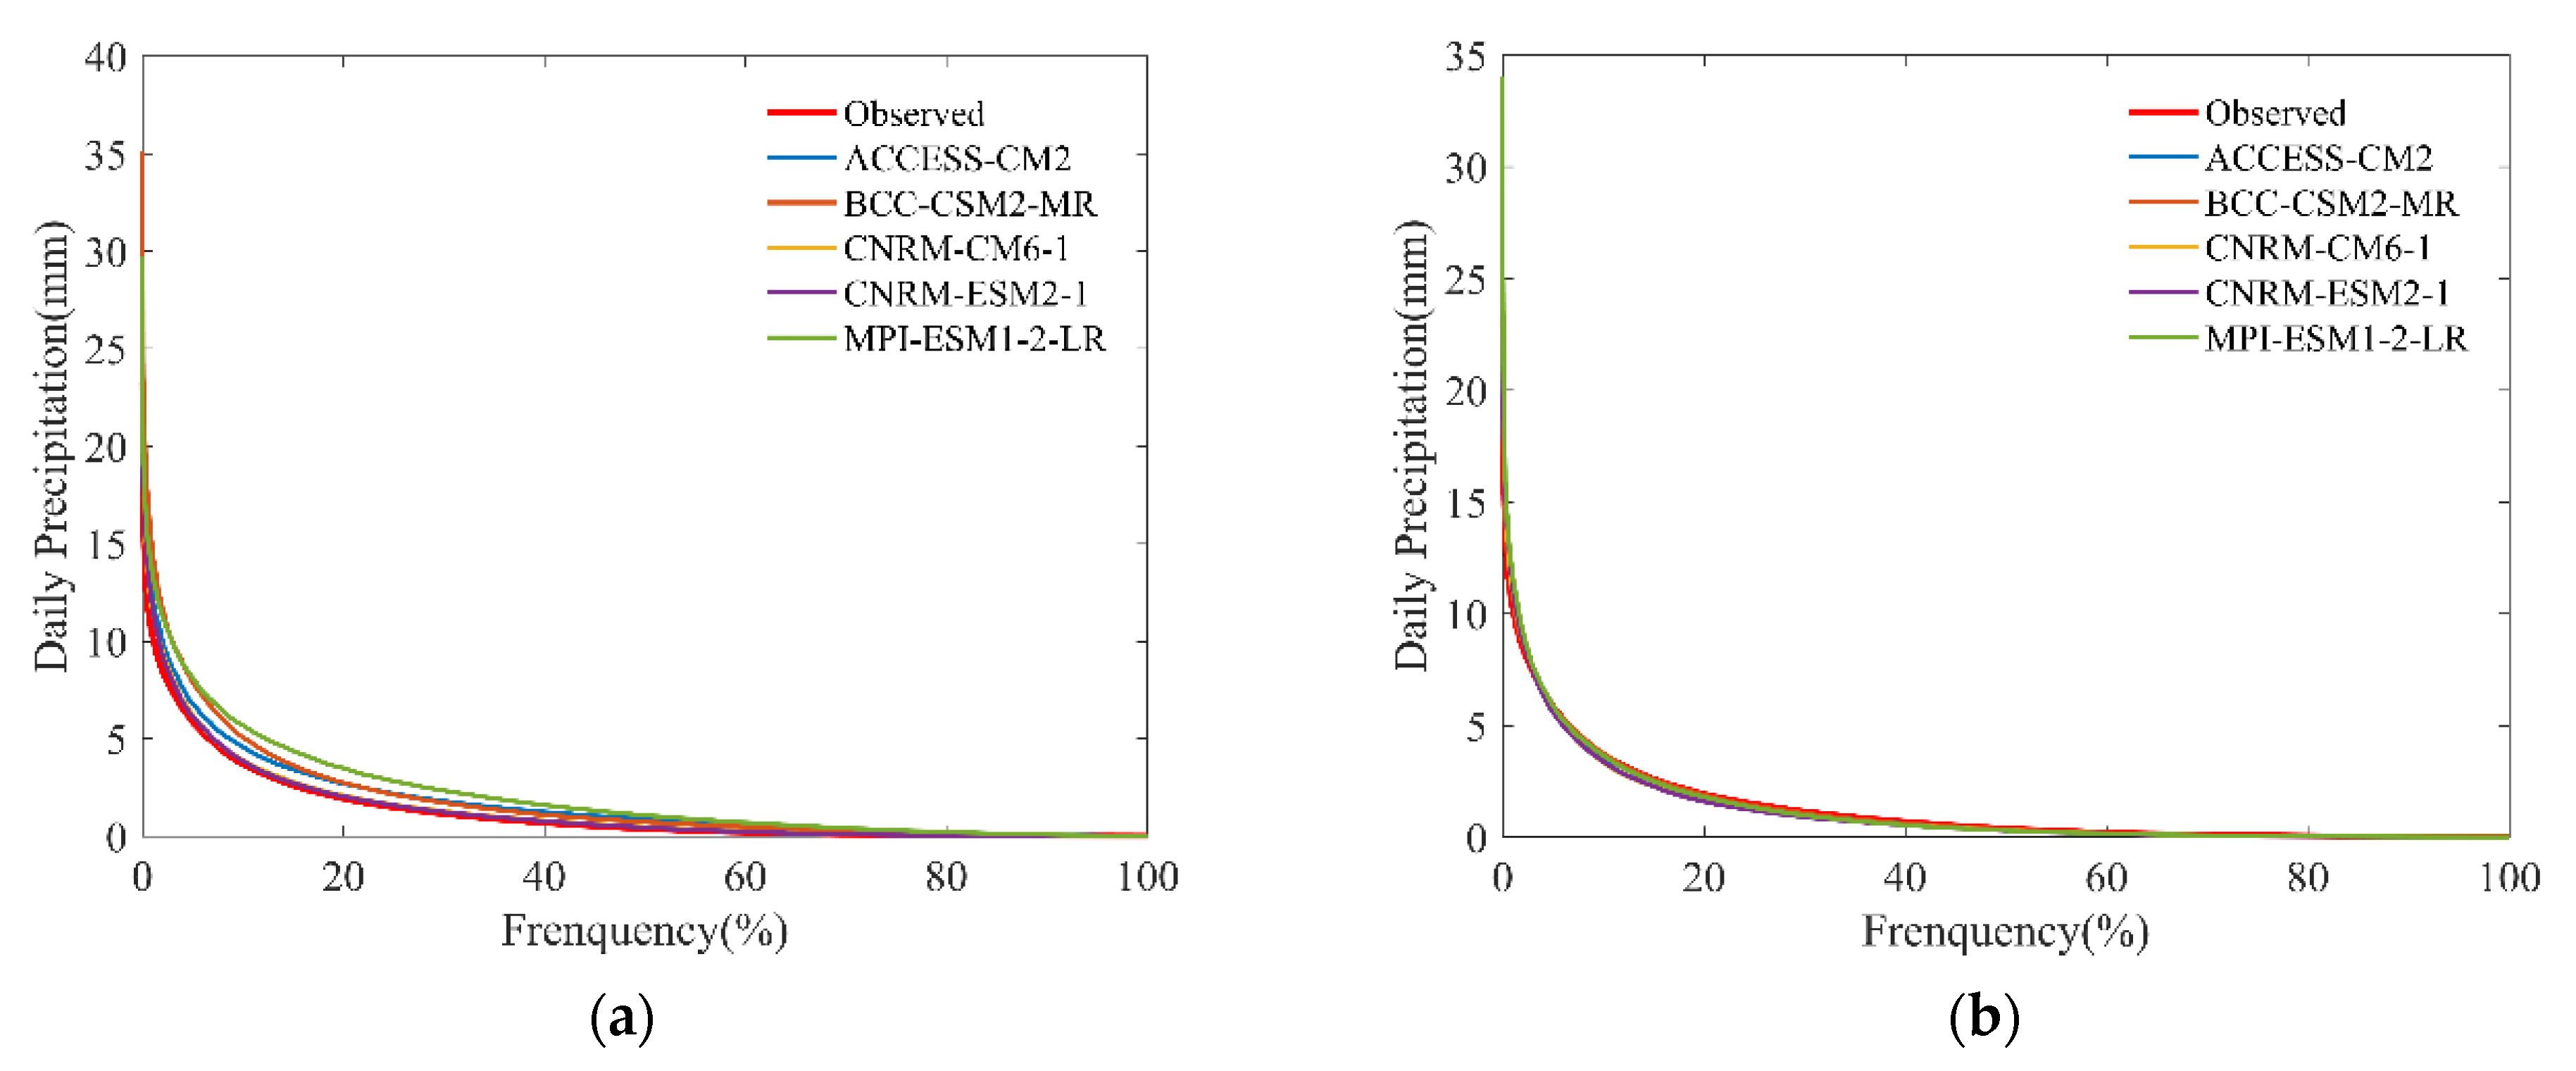
3.1. Dataset Filtering

The annual average precipitation of five uncorrected models in the historical period of the Yellow River Basin (Figure 2a) reflected that almost all models overestimated the precipitation in the basin. The relative deviation between the annual average precipitation simulated by the model and observation is 27%, while it that between the average ensemble model and observation is 21%. Consequently, it indicated that the average ensemble model could effectively reduce the simulation uncertainty caused by the model error. After bilinear interpolation and bias correction, the relative deviation between the simulated and observation was greatly reduced, which was less than 5% (Figure 2b). Moreover, the relative deviation between the average ensemble model and observation is only 2%, and the simulated mean annual precipitation is 447.7 mm, which is very close to the observation, 444.7 mm. Thus, the results of bilinear interpolation combined with the deviation correction method are in good agreement with the observed data. In addition, this study compared the spatial distribution of precipitation simulated by the average ensemble model after corrected and observation (Figure 3); the range of lattice deviation is −2–10%, and the average deviation is 6%. Therefore, it could be concluded that the GCMs after the bias correction and model ensemble performed better to reproduce the spatial distribution pattern of precipitation in the Yellow River Basin.
Besides that, to further assess the ability of GCMs to simulate precipitation on predicting future drought conditions, we compared the changes in the cumulative distribution function (CDF) of the five GCMs before and after correction on the daily scale with the observed data (Figure 4). The results indicated that the CDF distribution of the original GCMs data is quite different from that of the measured data (Figure 4a), the simulation of the peak distribution of precipitation is too high, and the overall average deviation is 4 mm/d. However, almost all models could better simulate the CDF distribution of the observed data after correction (Figure 4b), and the overall average deviation is 0.19 mm/d. Therefore, the DBC method applied in this study performs well on the daily scale and is suitable for evaluating the drought status of the basin in the future.
Moreover, in order to evaluate the simulation of the drought characteristics of the study basin by the raw and corrected products, the drought characteristics of the raw products, corrected products, and the measured data during the historical period (1961–2014) were analyzed and compared, namely drought duration, drought intensity, drought trend, and drought frequency, as shown in Figure 5. The results indicated the simulation deviations of drought duration, intensity, trend, and drought frequency between the raw products and observed data are 9.12%, −2.14%, 6.3%, and 14.3%. However, the simulation deviations of drought duration, intensity, trend, and drought frequency are divided into 6.74%, 2.48%, 0.3%, and 1.6%, which means the corrected product performs better in reproducing the variation characteristics of meteorological drought in the Yellow River Basin. Therefore, the corrected GCMs could be applied to the further study.

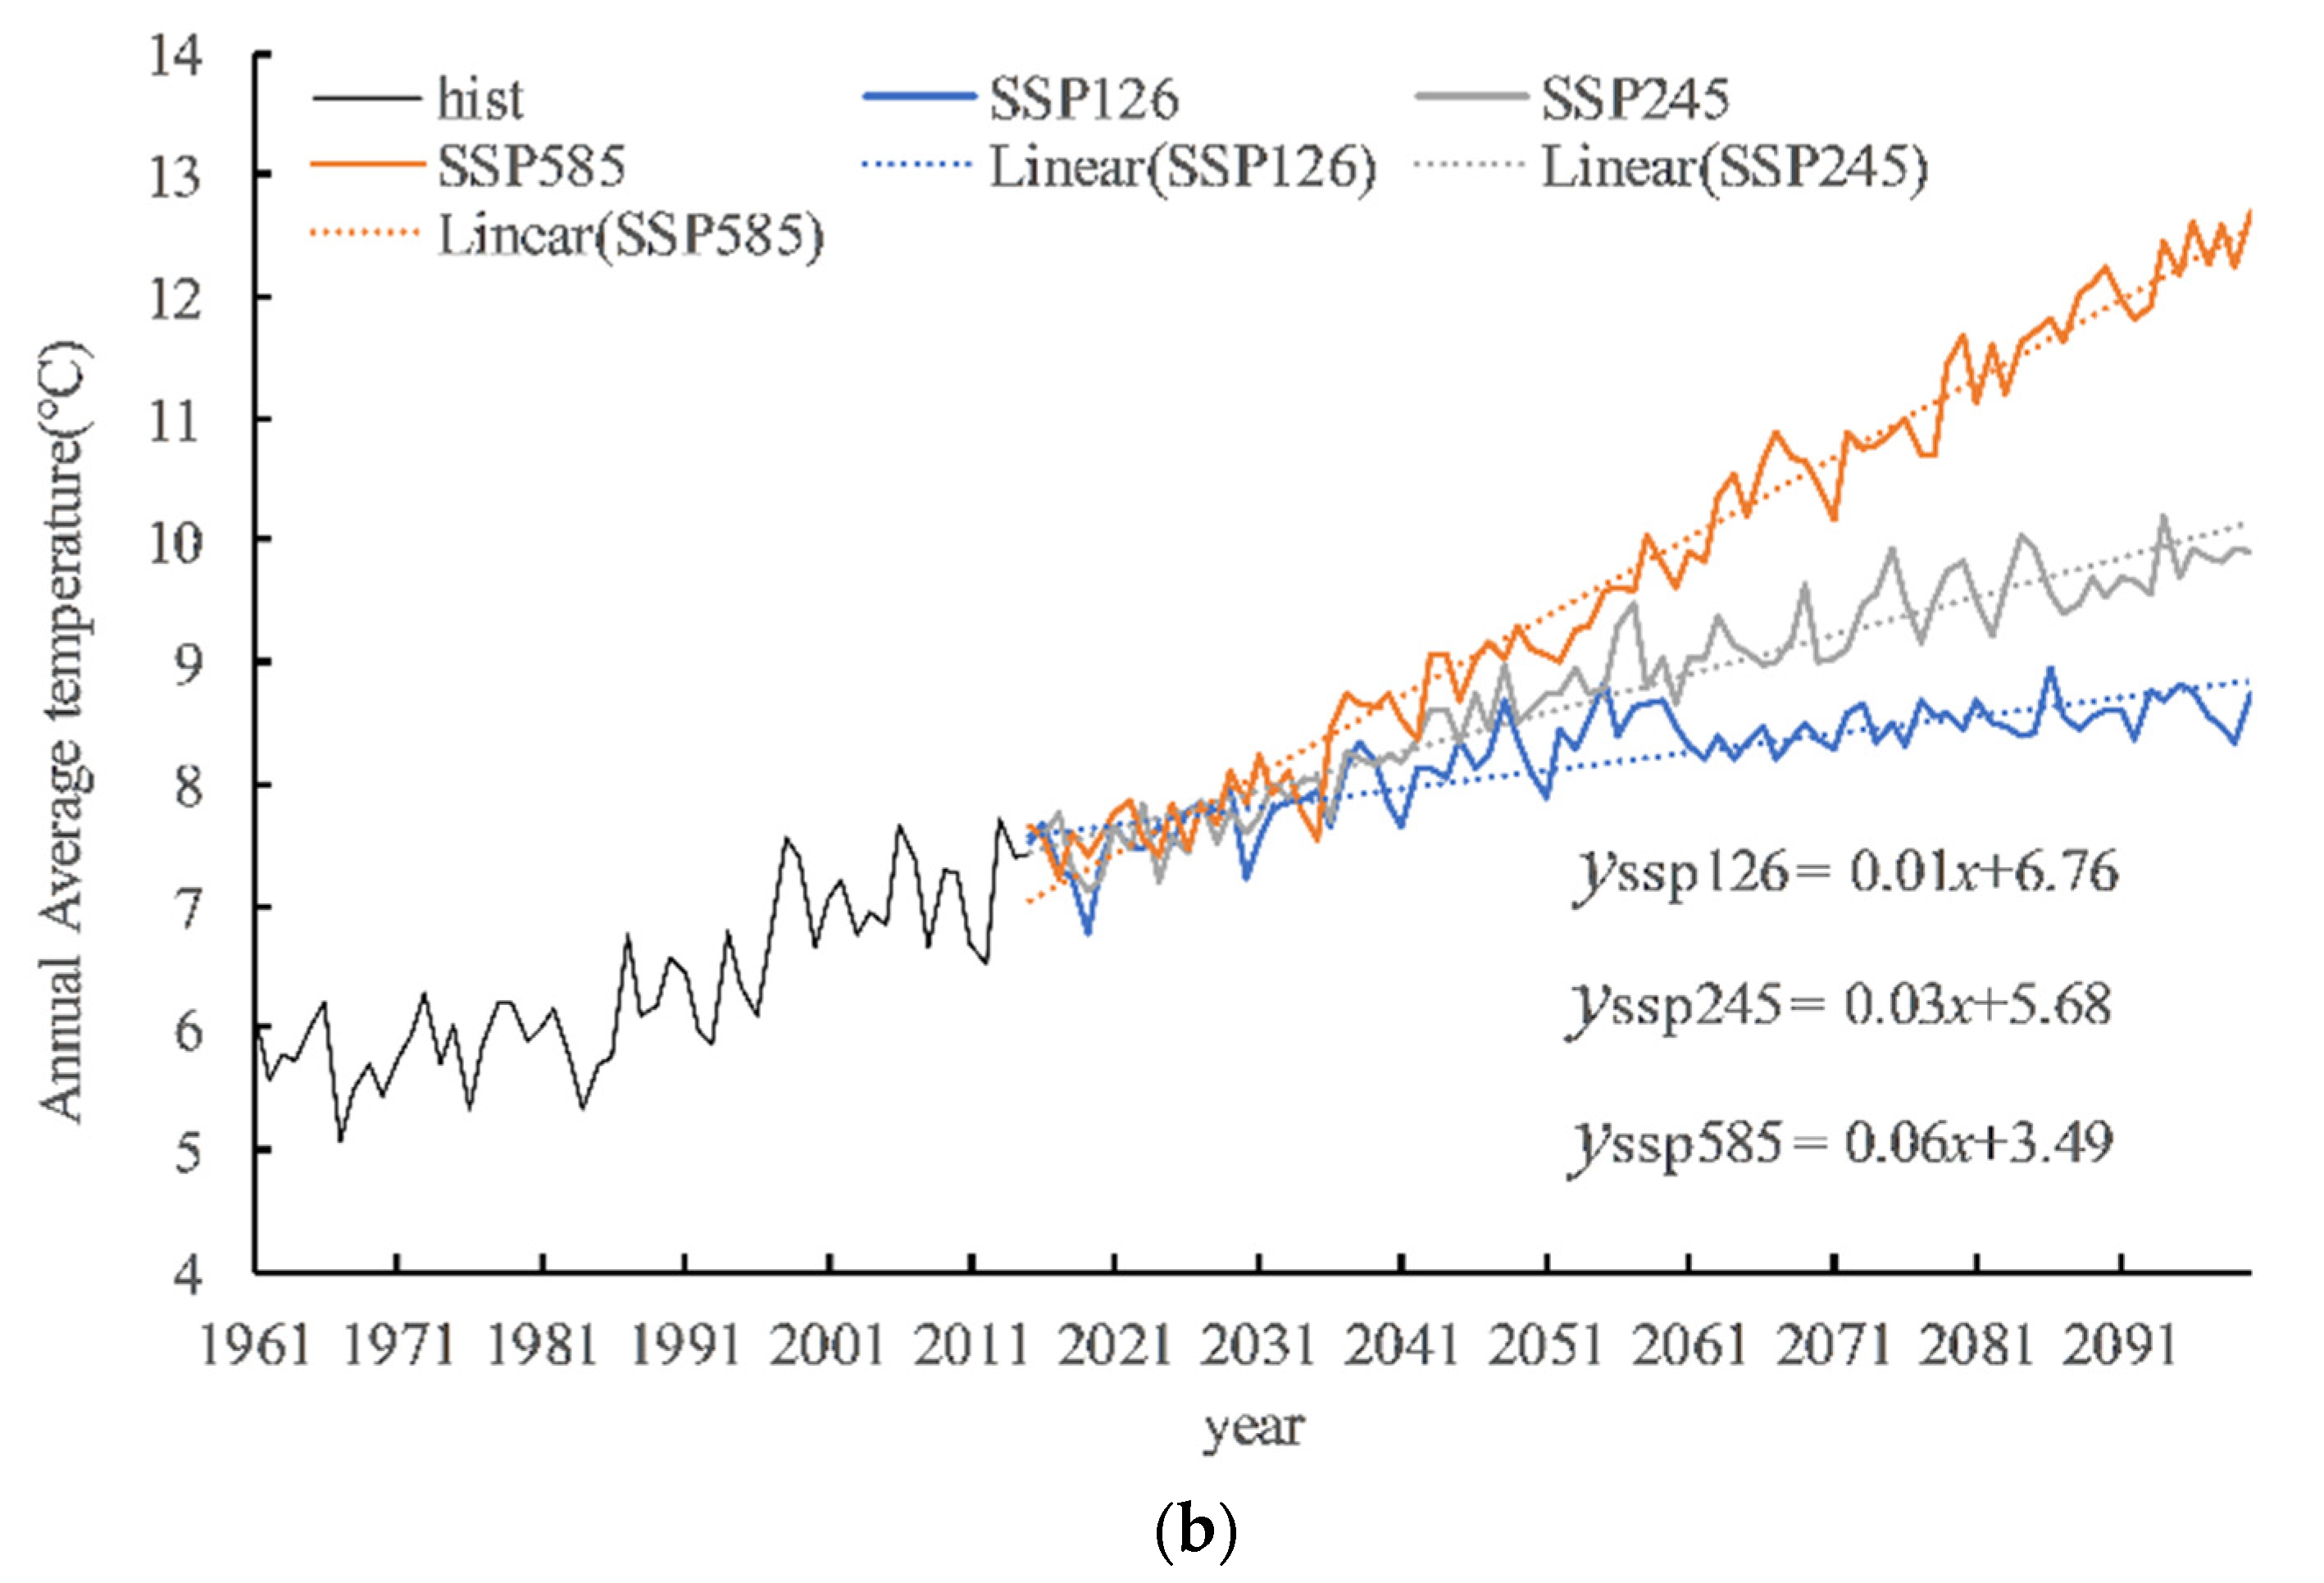
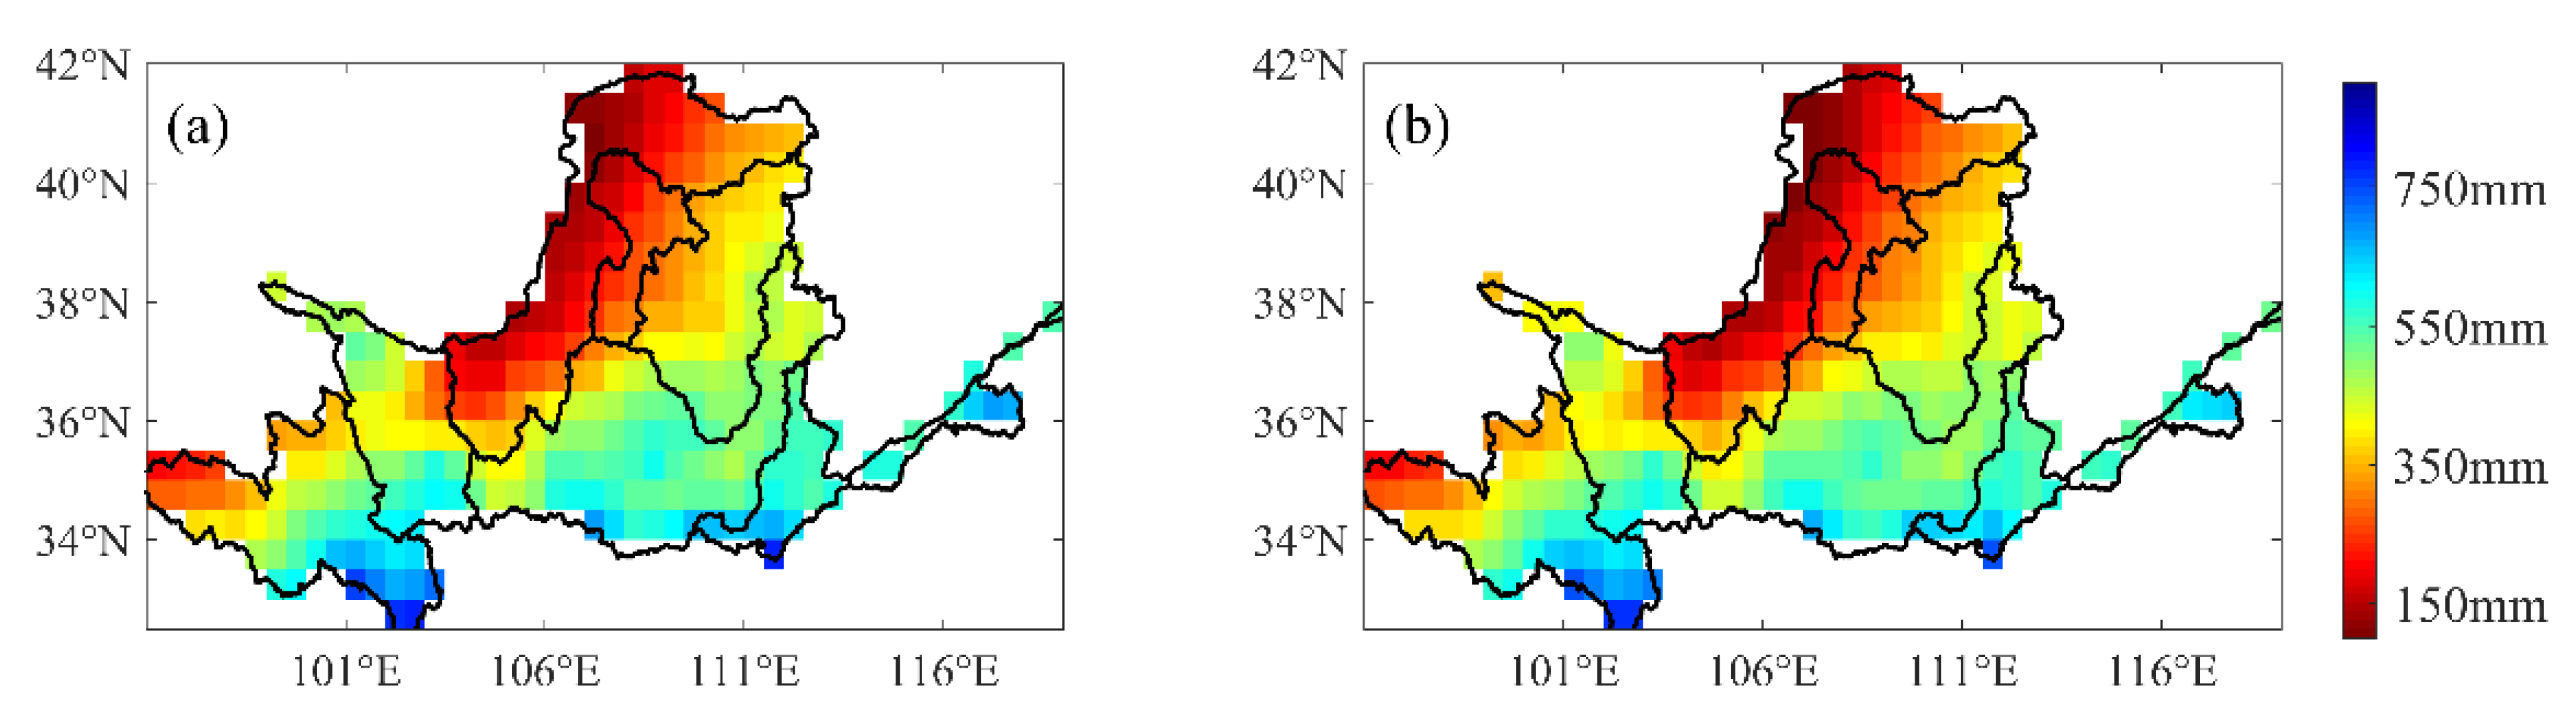
3.2. The Projection of Future Precipitation

Figure 6 depicted the average temperature and precipitation changes under three scenarios (SSP126, SSP245, and SSP585) during 1961–2100. Figure 6a demonstrated that the precipitation in the future period of the Yellow River Basin tends to increase relatively to the historical period. The linear increase rates of the three scenarios are 0.55 mm/annual, 0.61 mm/annual, and 1.5 mm/annual, respectively. Therefore, the most significant increasing trend in precipitation is the SSP585 scenarios. Furthermore, the difference in precipitation change between the three scenarios is not obvious from 2014 to 2060, and the annual average precipitation amounts re close to each other. After 2060, the precipitation of SSP585 scenario will become significantly higher than that of the other two scenarios. Meanwhile, the temperature in the historical period was 5–7.8 °C, and the temperature would also rise significantly in the future period under the three scenarios of the Yellow River Basin (Figure 6b). For instance, the temperature range of SSP126 is likely to be 6.8–8.9 °C, and SSP245 and SSP585 are 7.1–10.2 °C and 7.2–12.7 °C, respectively. According to the Clausius–Clapeyron relation, the increase in temperature affects the air–water vapor capacity then accelerates the water vapor cycle and finally causes the increase in precipitation [46,47]. At the same time, the findings of the Working Group I report of the Sixth Assessment Report of IPCC (IPCC AR6) indicated that precipitation in the mid-latitudes is likely to increase, with a further increase in the frequency of extreme events [48]. Therefore, the increasing trend will likely be the highest for the SSP585 scenario both for precipitation and temperature in the future.

3.3. Implications for Future Drought Changes

In this study, the future period was divided into three periods, namely the near future, 2040–2059; the middle future, 2060–2079; and the far future, 2080–2099. Figure 7a reveals the SPEI-12 changes of the Yellow River Basin during baseline. The results depicted that SPEI-12 of the three scenarios in the future period will show an increasing trend. According to the drought classification in Table 3, the smaller the SPEI, the more serious the drought is. Consequently, it indicates that the meteorological drought of the Yellow River Basin in the future period is likely be alleviated and, especially under the SSP585 scenario, was more obvious. Moreover, Table 4 shows the drought characteristics of the future period under the three scenarios and the base period. It proves that the drought duration will increase under SSP126 and SSP245 scenarios, while the drought intensity and frequency were projected to decrease in the future period. Furthermore, the drought tendency and frequency all changed the most relative to the base period under the SSP585 scenario: they are 12% and 18%, respectively. Overall, the trend of aridification in the basin under the SSP126 scenario will be more significant than in the other two scenarios, while the SSP585 with the highest greenhouse gas emission pathway is likely to have higher drought intensity and shorter drought duration. In the future period, both precipitation and temperature in the Yellow River Basin will show an increasing trend, among which the SSP585 scenario performs the most significantly. Ji et al. and Wang et al. [49,50] found that the main influencing factors of meteorological drought are precipitation and evaporation, and the increase in temperature in the future will accelerate the regional water cycle process, which will increase the regional evaporation. However, the increase in precipitation tends to alleviate the severity of meteorological drought to a certain extent. Therefore, in the SSP585 scenario, which is the highest emission pathway of greenhouse gases, precipitation will increase with rising temperature, which has a certain mitigation effect on future meteorological droughts.
Figure 7b–d reveals the SPEI-12 changes of the Yellow River Basin during 2040–2099 under the three scenarios. In the near future, the SPEI is likely to show a trend of aridification, with a linear trend rate of −0.8/a under SSP126 scenario. However, the aridification of SSP245 and SSP585 scenarios is not obvious, but their drought intensity may be higher than that of SSP126, especially the maximum SPEI of SSP585 scenario, which is −1.89. Additionally, the drought frequency was projected to be the highest in SSP126 with 22.9%. In the middle future period, the whole drought tendency is not significant in the three scenarios. Relatively speaking, the drought intensity of SSP245 scenario will be the highest, which is −1.41, and the drought frequency may also the highest, which is 22%. In the far future, the SSP126 and SSP245 scenario models will increase in comparison with the baseline; the linear tendency rate is −0.04a and −0.02a, while their drought frequency is lower at 6% and 8%, respectively.

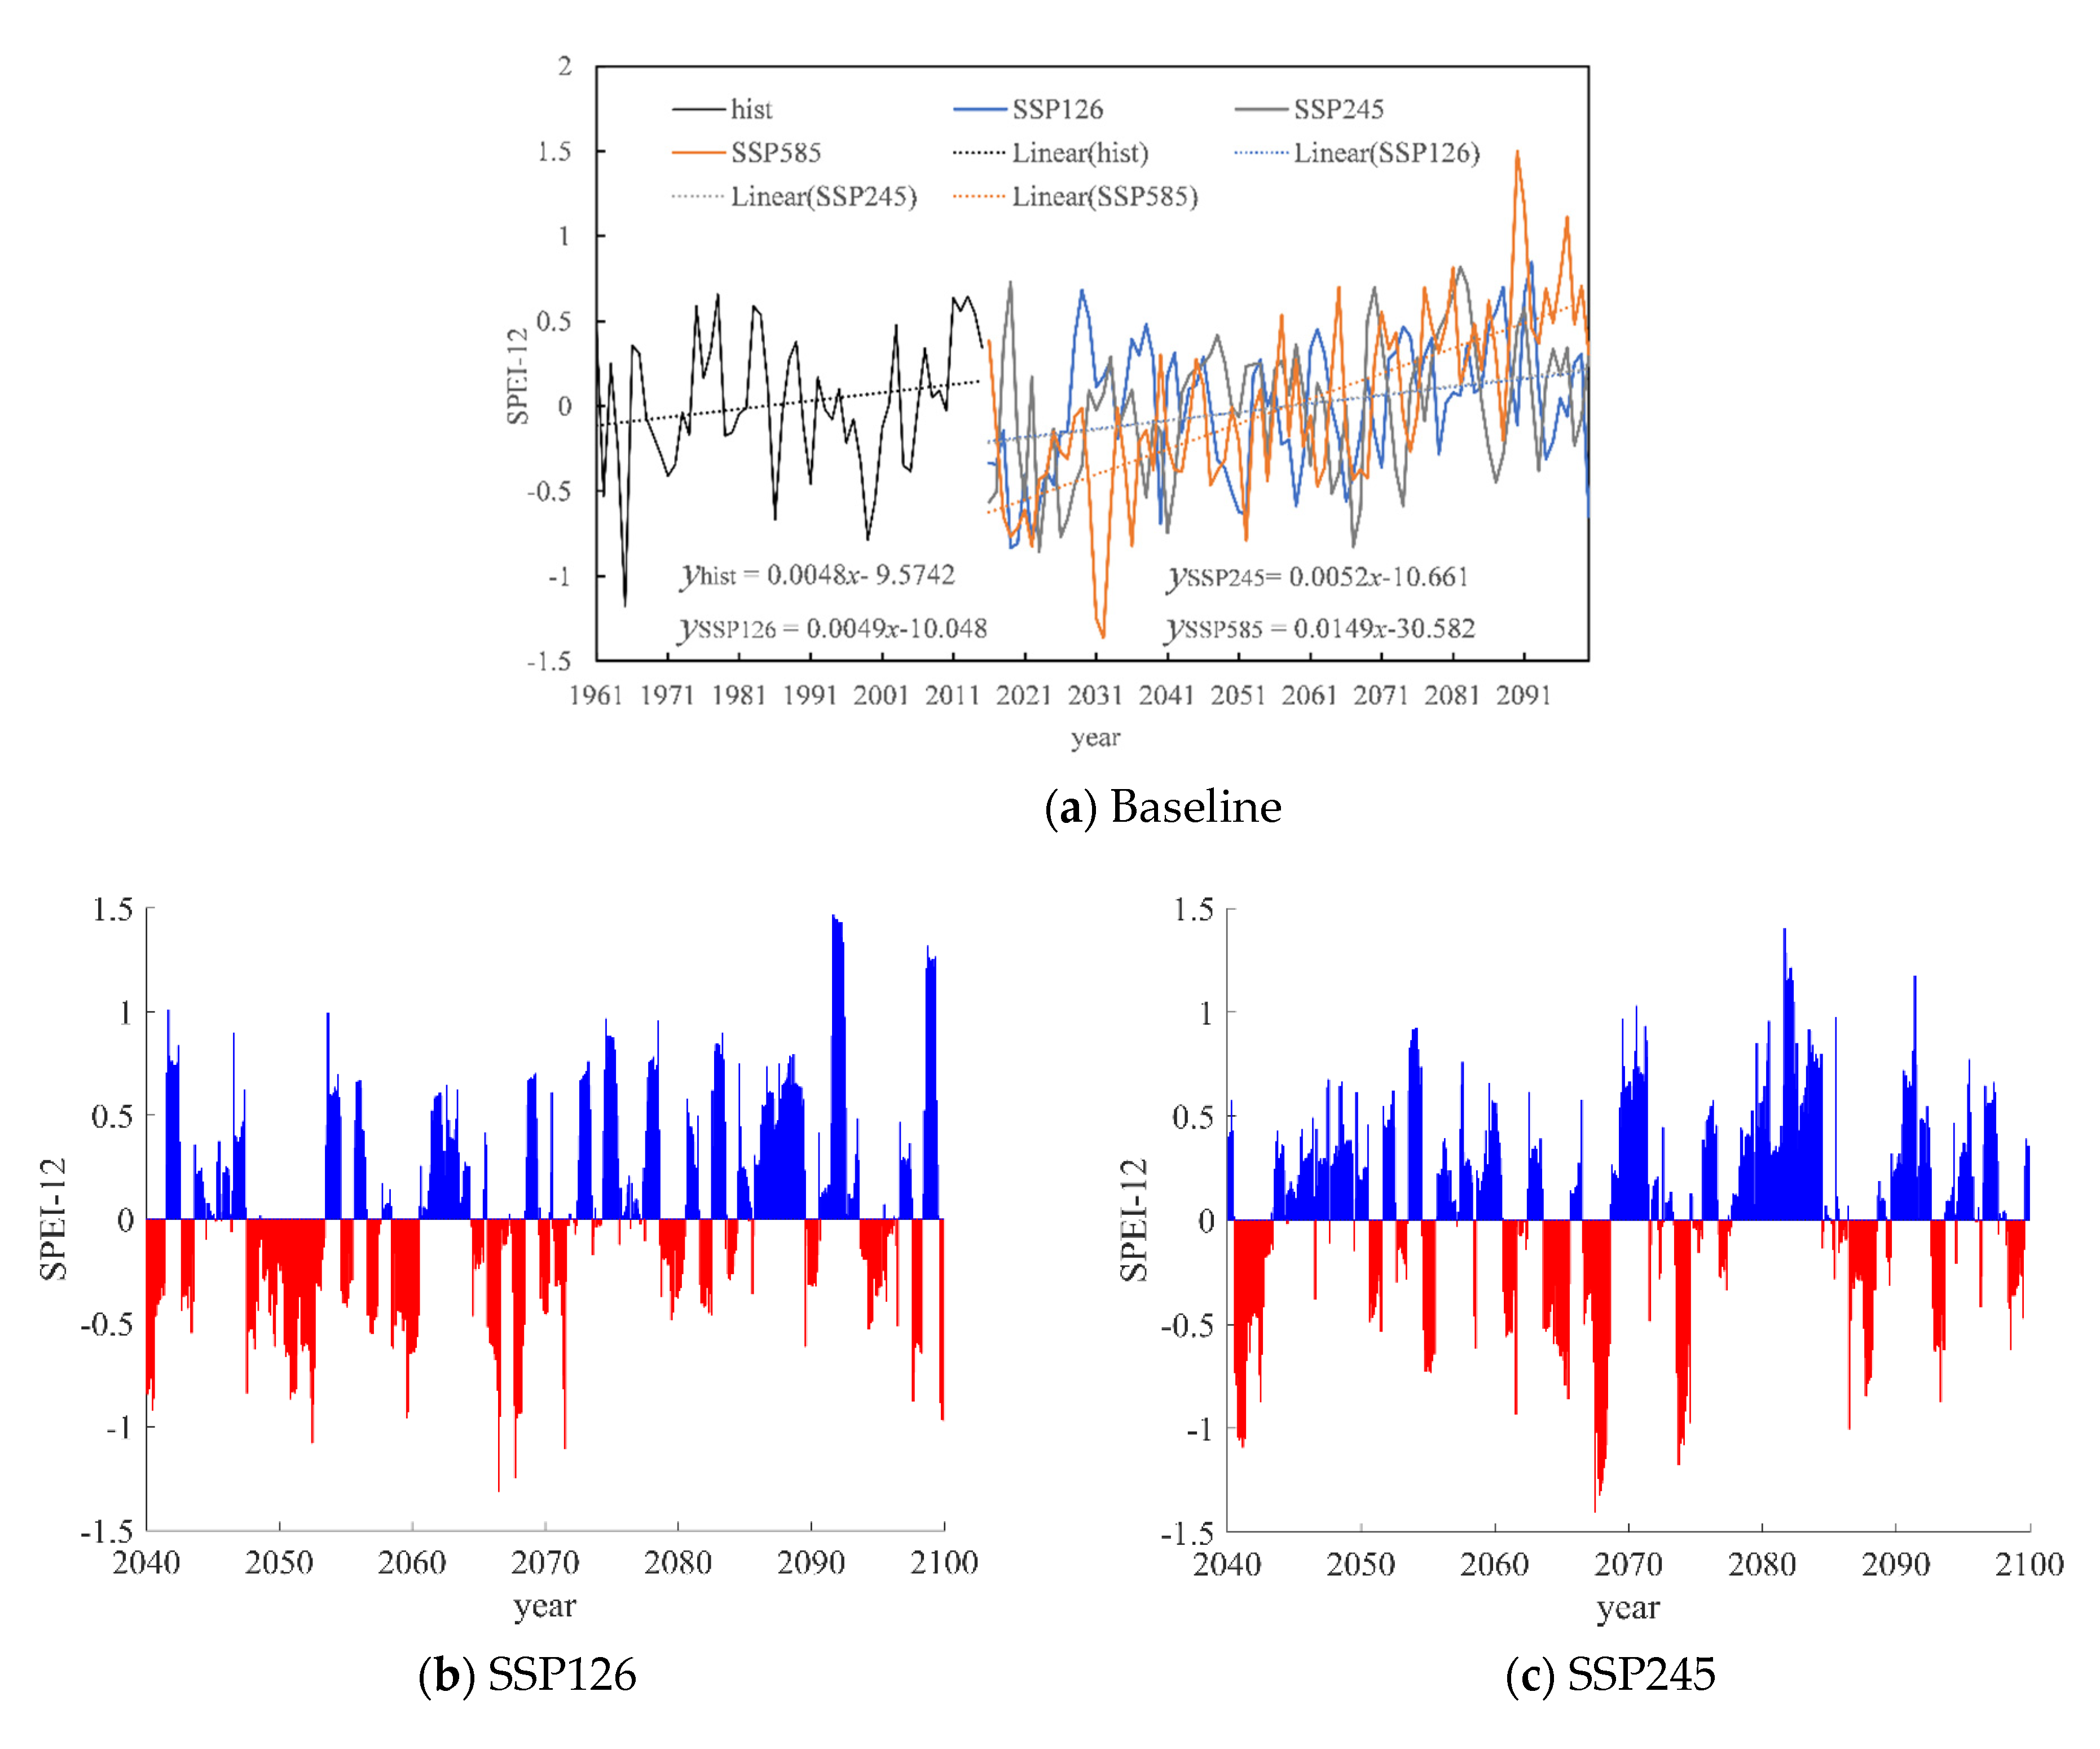
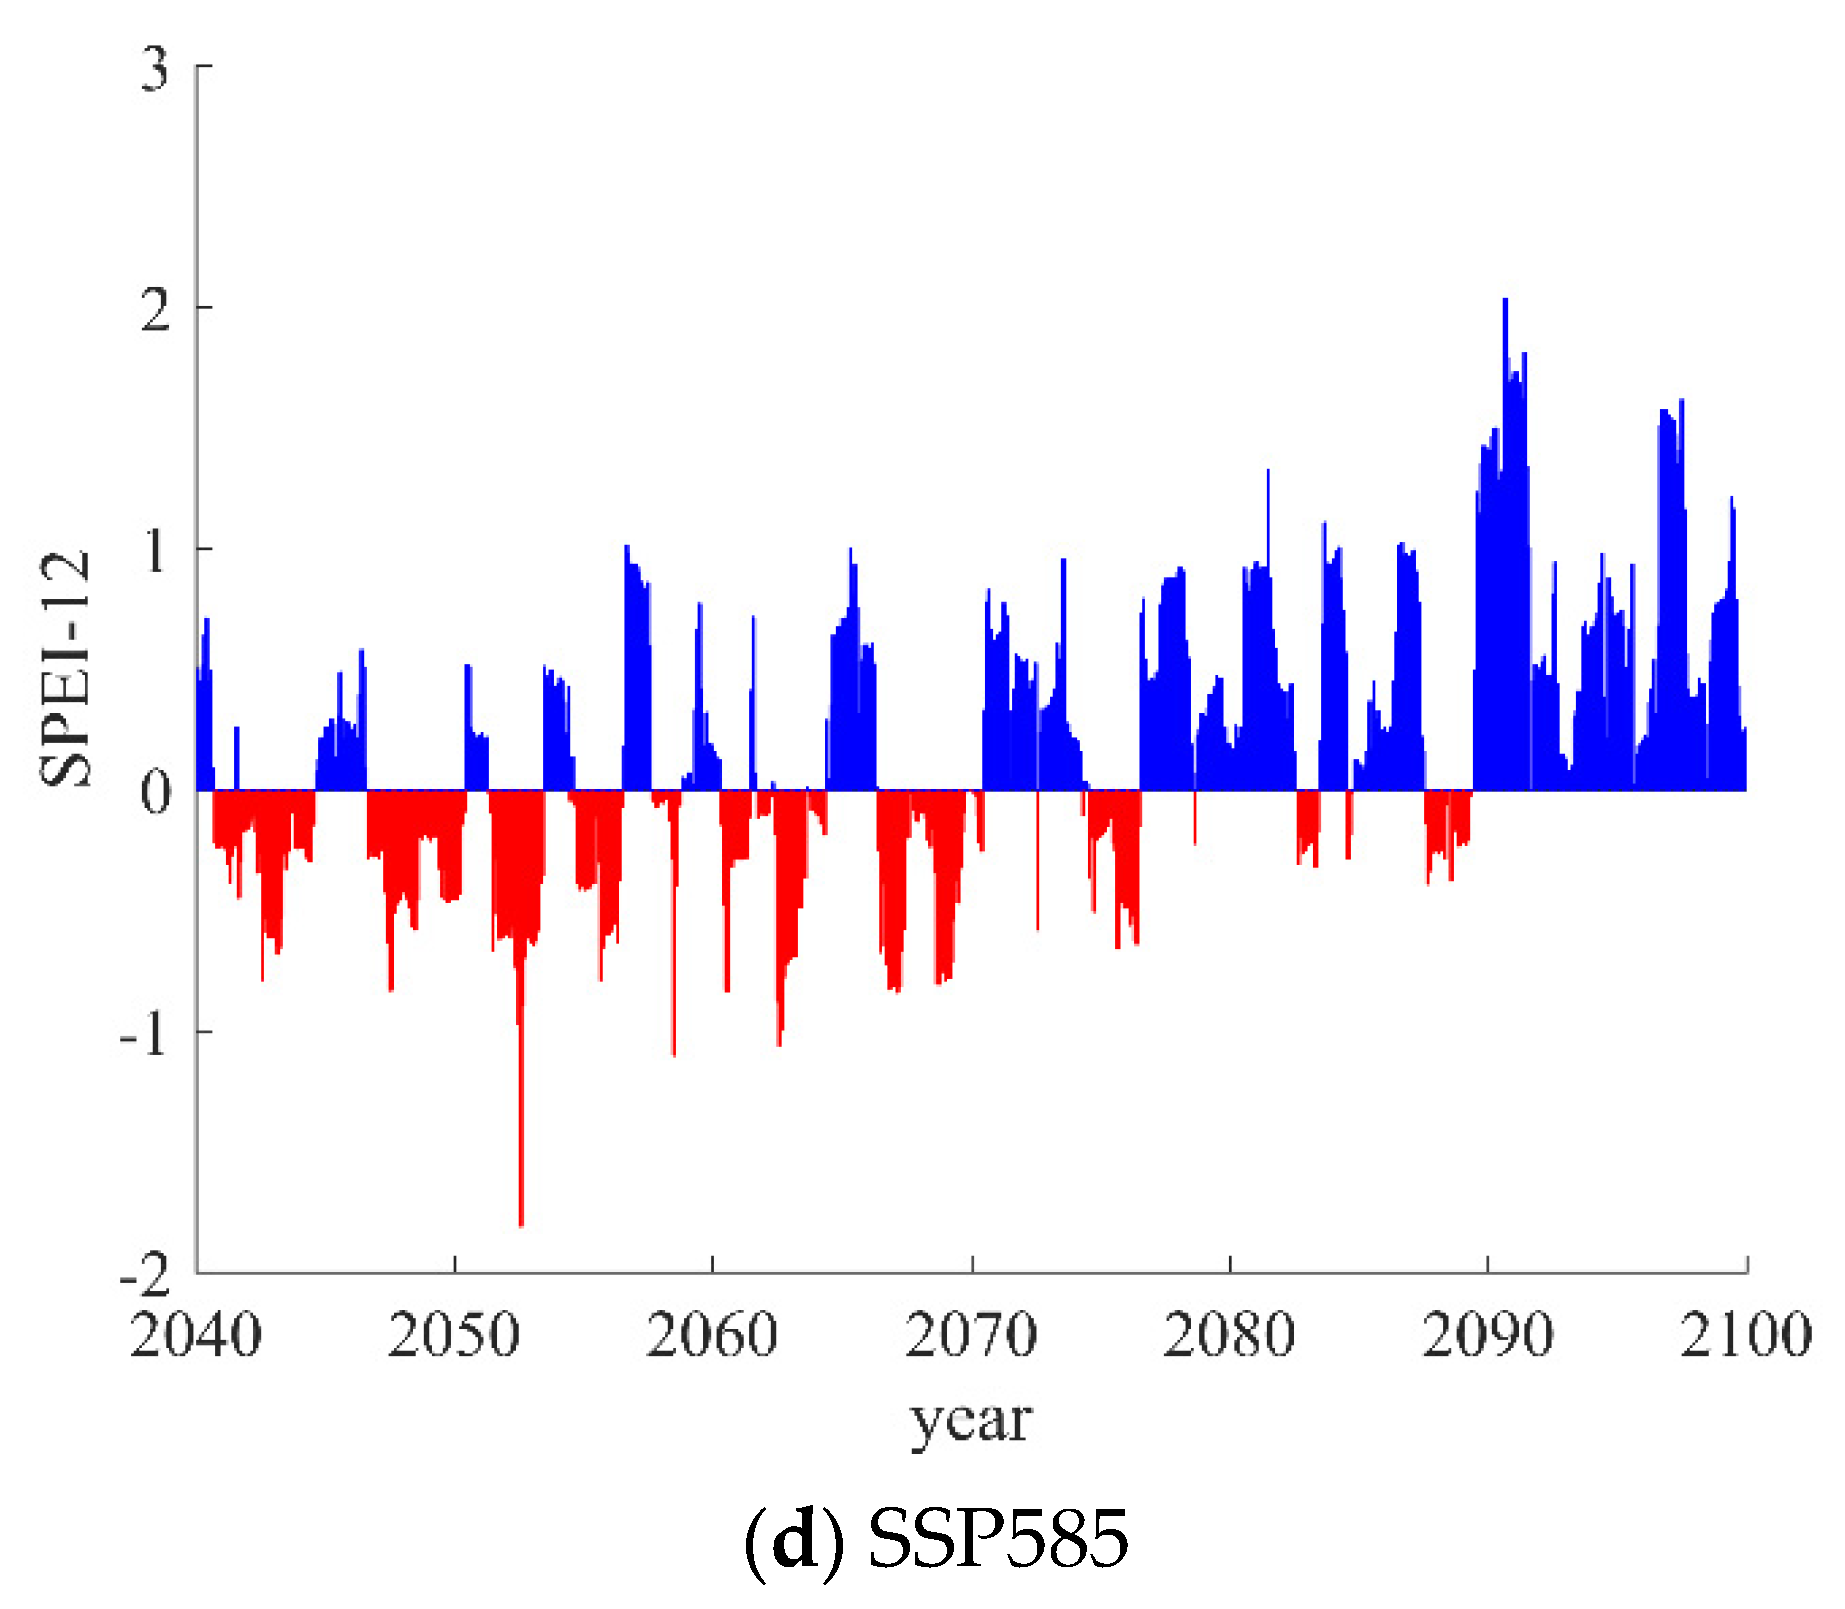
3.3.1. Drought Tendency

Figure 8 reflects the spatial characteristics of meteorological drought in the Yellow River Basin in the three periods under the three scenarios. In the near future, Lanzhou to Hekou area and the interior region under SSP126 scenario do not reveal a significantly arid trend; the average regional test value Z = −0.84 > −1.96, and the maximum test value is −7.07, which is likely to appear in the interior region of the basin. Under the SSP245 scenario, the regions from Longyang Gorge to Lanzhou and Longmen to Sanmenxia will reflect the arid trend, while under the SSP585 scenario, the source region of the Yellow River and the northern part of the basin might reveal a weak arid trend, with an average regional test value of Z = −0.56 > −1.96. In the middle future, the drought tendency under SSP245 scenario will be more obvious. Except for the southern area above Longyang Gorge and Sanmenxia to Huayuankou area, other areas of the basin all tend to show the arid tendency to different degrees, and the regional average test value Z = −2.74 < −1.96. However, the northwest area of the basin will reflect no significant drought trend under SSP126 and SSP585 scenarios. In the far future, the more obvious drought tendency of the basin is likely to be presented under the SSP245 scenario, which is mainly in the central and eastern regions, and the regional test value Z = −2.74 < −1.96. Moreover, the weak drought trend may be found in the southwest region of the basin, Z = −0.38 < −1.96. However, the significantly humid trend with Z = 1.97 > 1.96 was projected to occur under the SSP585 scenario in most of the basin, and the obviously arid trend will be explored in the western region above Longyang Gorge; the maximum value of the regional test value is −6.8. Overall, the regional aridification trend under the SSP585 scenario may not be significant. On the one hand, the climatic characteristics and the future precipitation and temperature changes of different regions in the Yellow River Basin are different. On the other hand, under the SSP585 scenario, the increase of greenhouse gases will not only increase the surface air temperature but also increase the evapotranspiration, thereby accelerating the regional water cycle. Due to the increase in climatic factors and evapotranspiration, regional precipitation is also increasing, which tends to alleviate the severity of future meteorological drought in the Yellow River Basin to a certain extent [51,52].

3.3.2. Drought Frequency

Table 5 provides the frequency of drought events in different grades under three scenarios in the future. In the near future, the main drought events in the basin will to be light drought and medium drought events, among which the drought frequency of SSP126 and SSP585 scenarios is 34.88% and 34.34%, respectively, while that in SSP245 scenario will be lower than those in the others. In the middle future, the drought frequency of SSP126 and SSP585 scenarios tends to be lower than that of the near future period, while the drought frequency of SSP245 scenario increases obviously, and the frequency of extreme drought increases to 3.13%. Therefore, it is necessary to prevent the occurrence of sudden drought events. In the far future, the drought frequency of the three scenarios will be further reduced and is likely to be dominated by light drought and medium drought events in the basin. Specifically, the frequency of severe drought and extreme drought events in SSP245 scenario may be relatively higher than others, while the drought frequency of all types of drought events tends to be lower than that in the near and middle future.
The spatial distribution of drought frequency in the three periods of the Yellow River Basin is revealed in Figure 9. In the near future, the drought frequency of the Longmen to Sanmenxia area is likely to higher than in other areas under SSP126 scenario, and the highest drought frequency would reach 43.7%. Meanwhile, the drought frequency from Longyang Gorge to Lanzhou maybe higher than in other areas under SSP245 scenario, and the highest drought frequency is likely to reach 36.6%. Under SSP585 scenario, the overall drought frequency in the whole basin is very close, approximately 20–30%. In the middle future, the drought frequency from the source area of the Yellow River to the interior region of the basin will increase gradually, and the highest one may reach 31%, but it tends to be lower than that in the near future under the scenario of SSP126. At the same time, the drought extent of the whole basin tends to decrease under the SSP245 scenario, and the relatively higher drought frequency would be found in the main inland areas. Moreover, under the SSP585 scenario, the drought frequency in the upper reaches of the Yellow River Basin will be higher, and the highest drought frequency may reach 40%, which reflects a decreasing trend from upstream to downstream. In the far future, the drought frequency in all scenarios would be reduced. Under the SSP126 scenario, drought events may mainly occur in the northwest area of the basin, the highest drought frequency is 31%, and the drought frequency would be reduced in turn under SSP245 to SSP585; the drought range is likely to narrow.

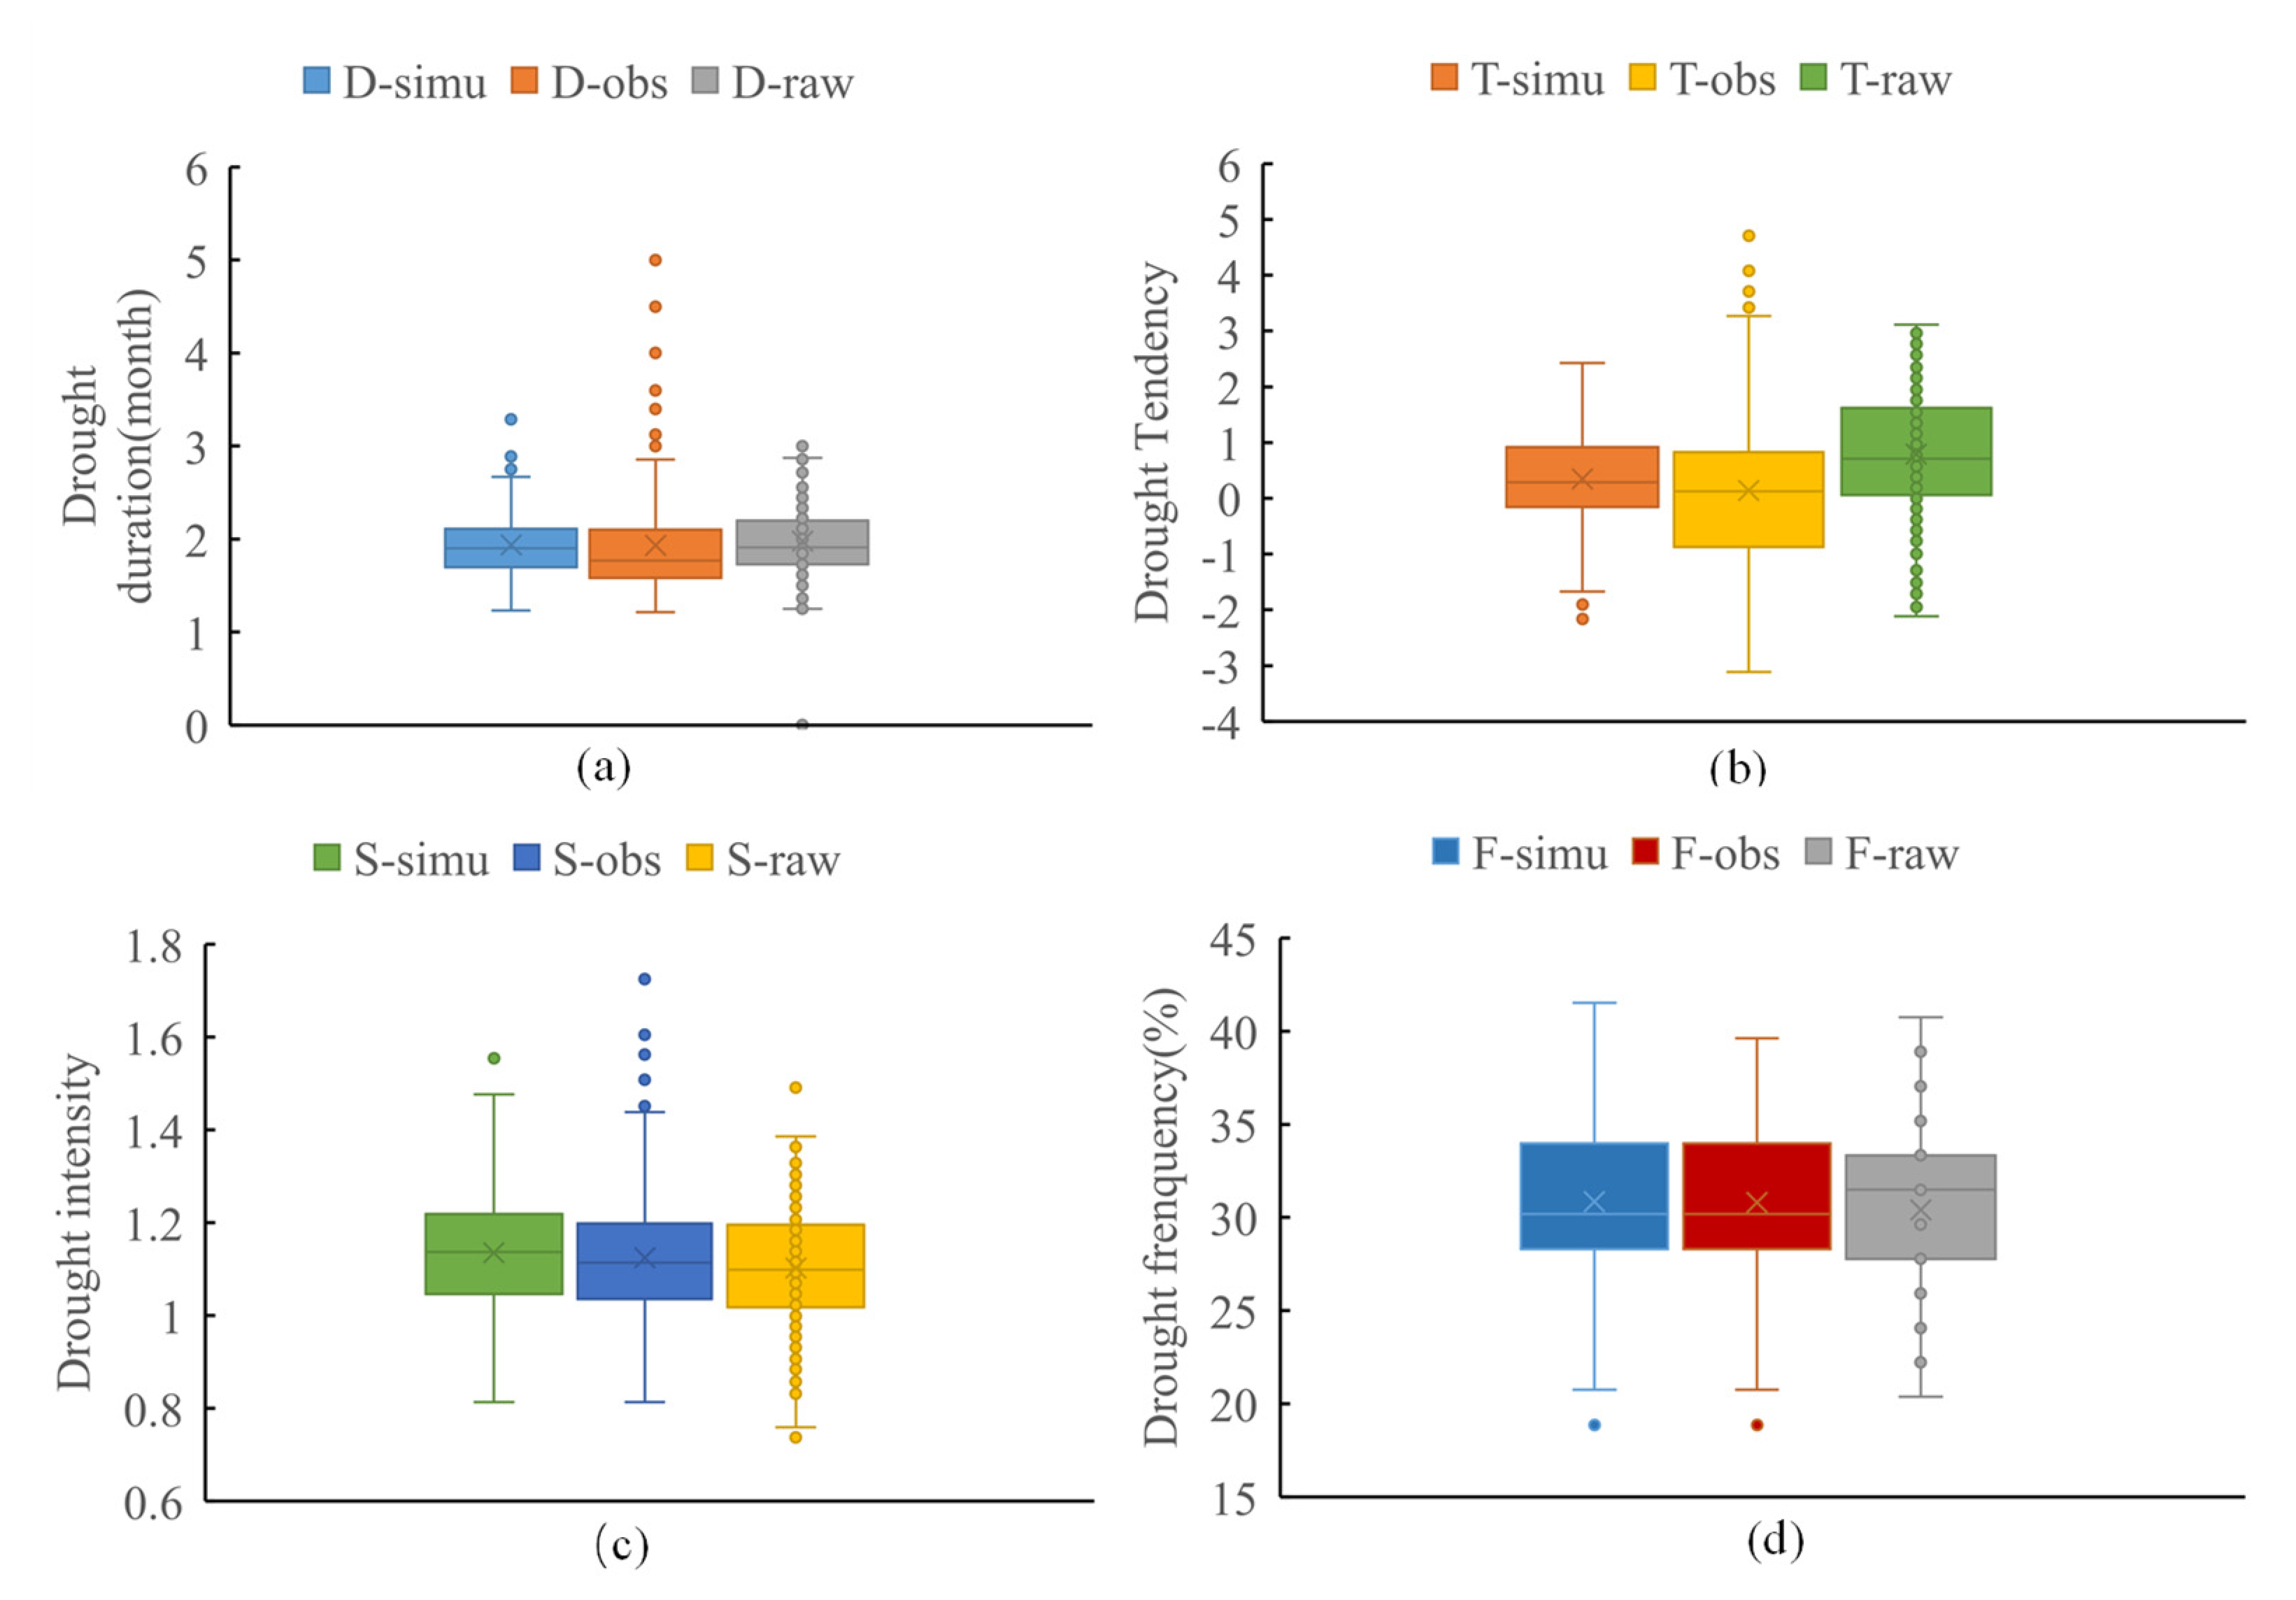
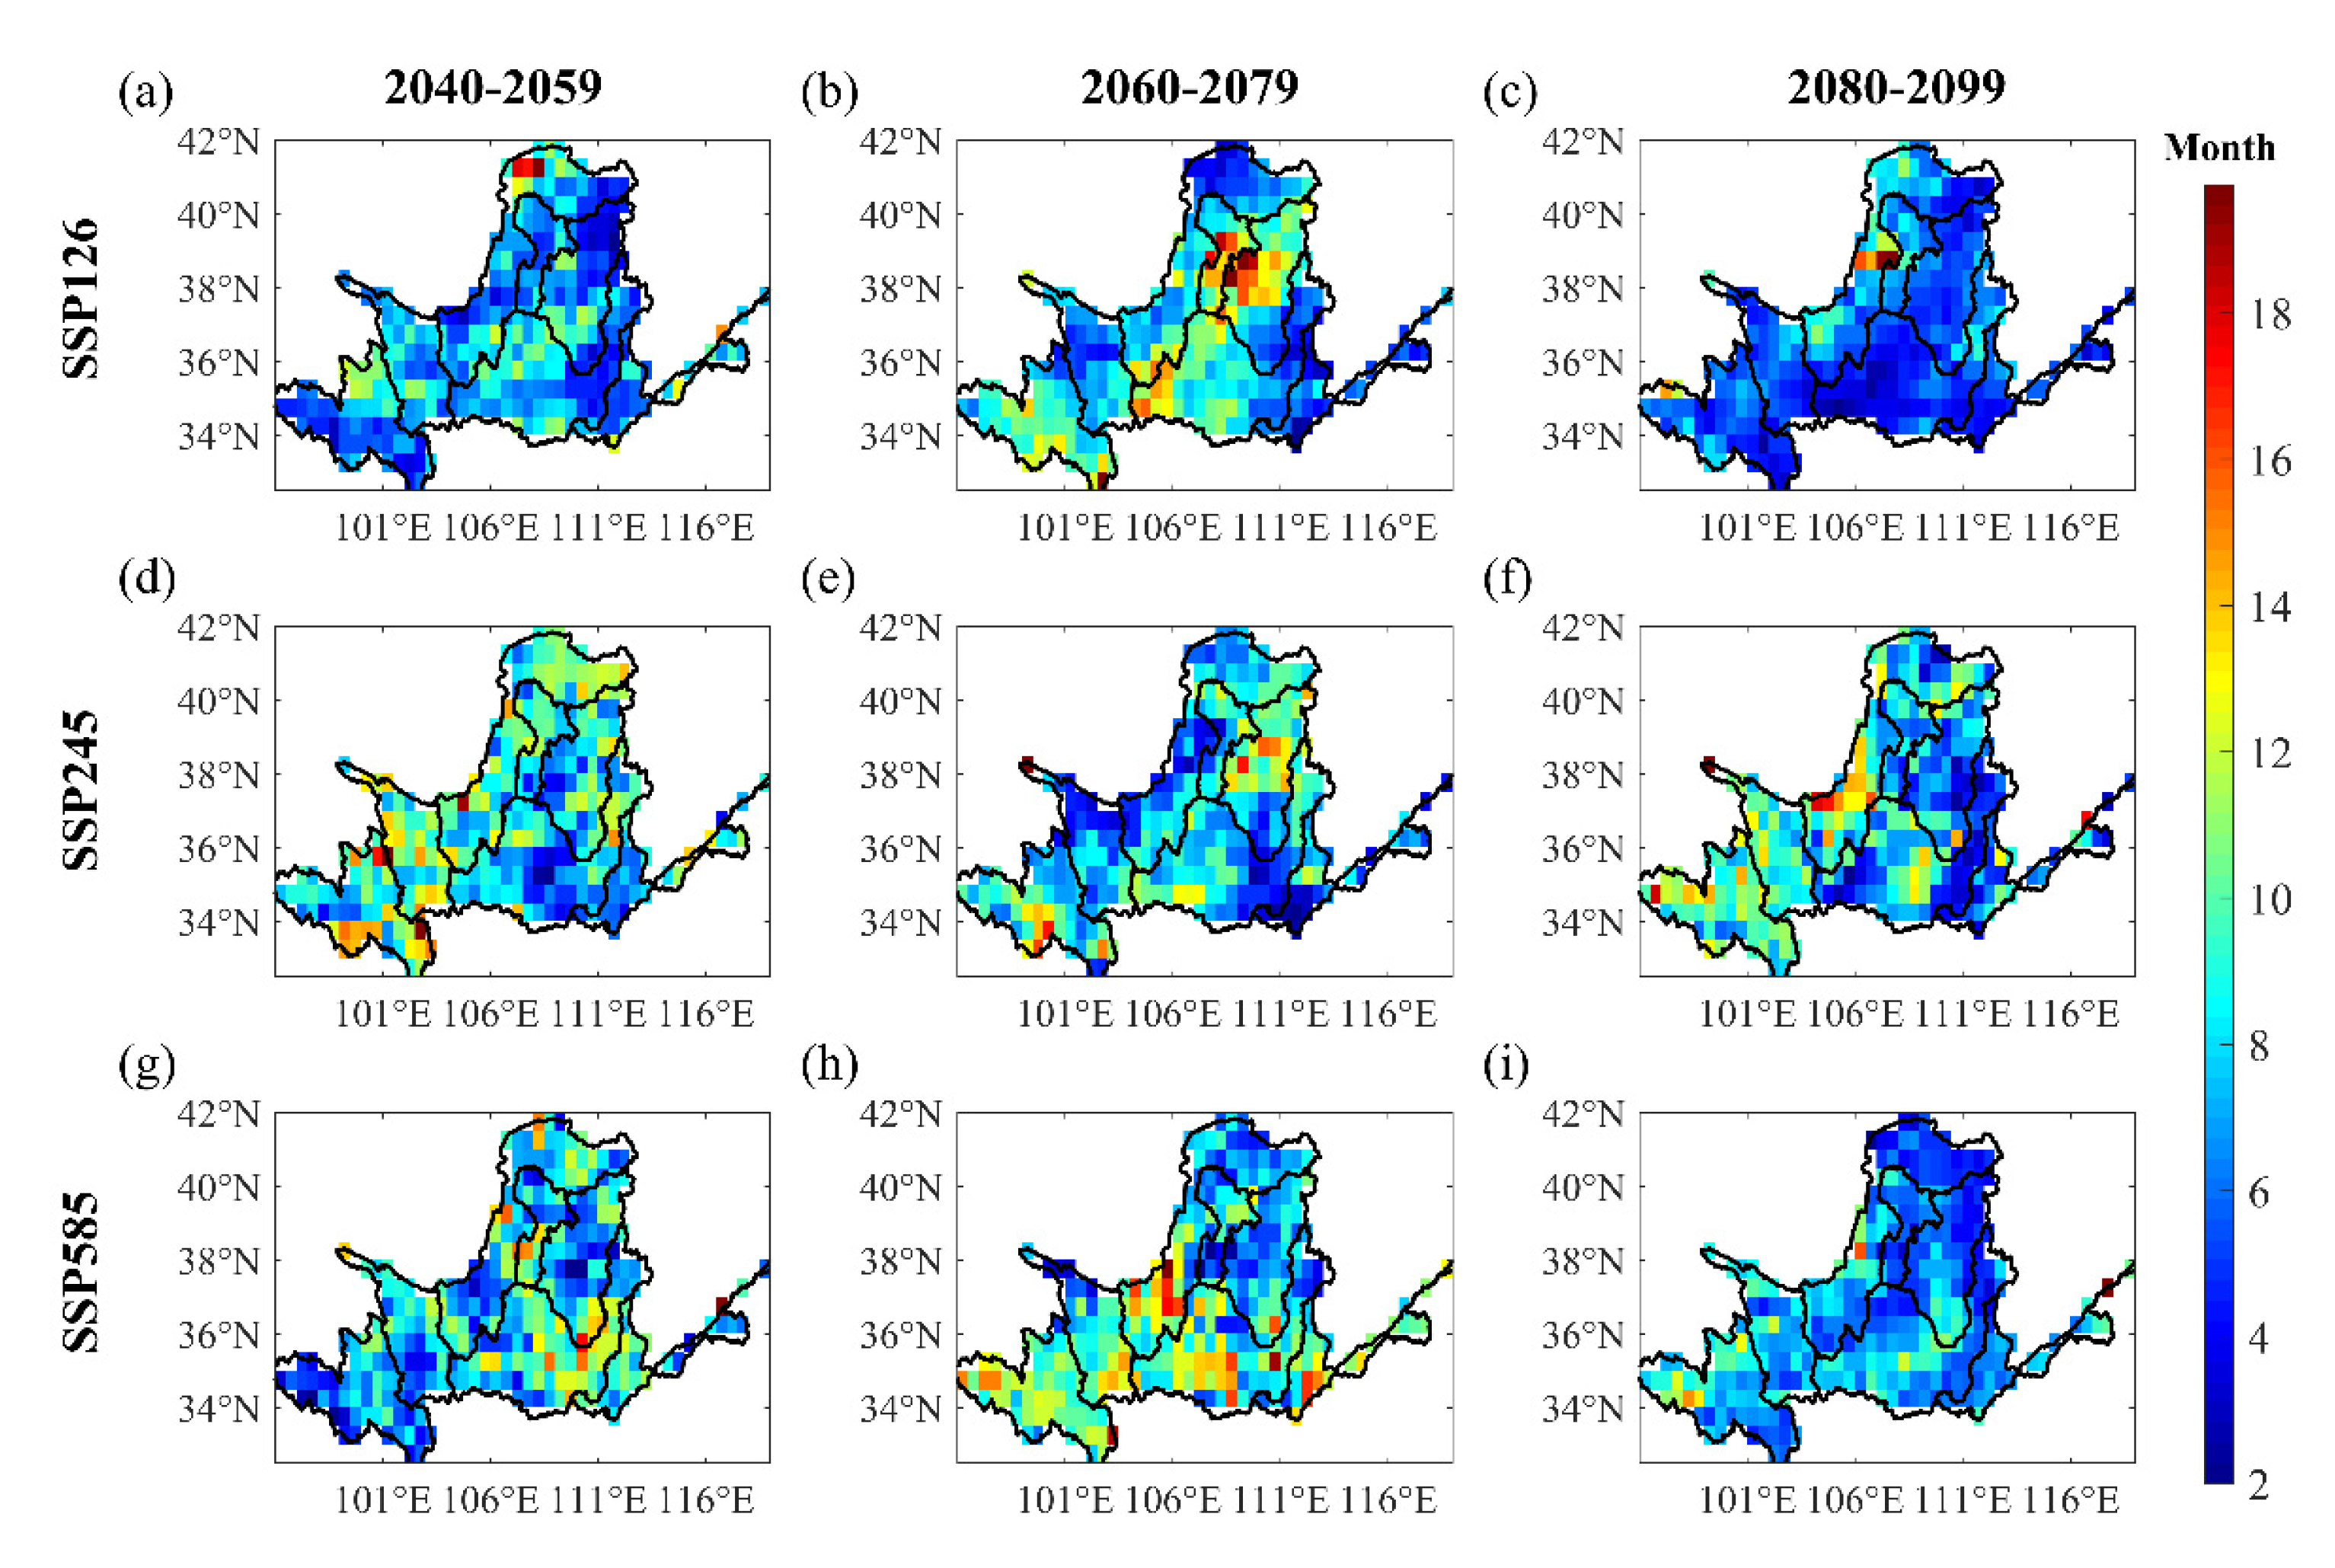
3.3.3. Drought Duration and Intensity

The drought duration in different scenarios in the future over the Yellow River Basin was depicted in Figure 10. As a whole, the average drought duration of the basin will increase at first and then will tend to decrease. Under the SSP126 scenario, the average drought duration of the basin maybe the longest under the middle future, which is 12.1 months. Although the shortest drought duration tends to occur in the far future, the drought duration in the interior region will reach 26.2 months in this period. Under the SSP245 scenario, the drought duration in the middle and far future will be higher than that in the SSP126 scenario. The longest average drought duration is 12.3 months in the middle future periods, and the highest drought duration in the interior region of the basin is as long as 26.6 months. Under the SSP585 scenario, the drought duration from the source region of the Yellow River to the middle reaches of the basin in the middle future is 12.6 months, which is higher than that of SSP126 and SSP245. However, the drought duration in the far future maybe the shortest at 6.9 months, which is smaller than that of SSP126 and SSP585 scenarios. In general, the three scenarios may have longer drought durations in the middle-future period. After calculation and analysis, it is found that the precipitation in this period may be lower than that in the near future and far future periods. For example, under SSP585 scenario, the average precipitation in the near future period will be 520.9 mm, while the multi-year average precipitation in the mid-future period will be 509.1 mm. However, the temperatures in the middle-future period will significantly higher than in the near-future period and close to the far-future period. Thus, under the dual influence of the insignificant increase in precipitation and the continuous rise in temperature, the mitigating effect of precipitation on meteorological drought will be weakened, the drought in the middle-future period is longer than the other two periods.
The drought intensity in different scenarios in the future was presented in Figure 11. Under the SSP126 scenario, the drought duration will increase from 2040–2099, and the highest drought intensity also tends to increase. In the far future, the average drought intensity will be the highest (1.48), the highest drought intensity in the basin may reach 2.09, and the drought intensity in the northeast and southern regions of the basin will be relatively high. Under SSP245 scenario, the drought intensity of the basin decreased gradually. The average drought intensity and regional highest drought intensity will be found in the near future at 1.51 and 2.09, respectively, and mainly presented in the central region. Moreover, the average drought intensity and the highest drought intensity in the middle and far future will likely be lower than those in the SSP126 scenario. Under SSP585 scenario, the overall drought intensity of the basin will increase, and the drought intensity and the highest drought intensity of the basin in the middle and far future may be higher than those in SSP126 and SSP245 scenarios. The spatial trend of drought intensity in the basin will gradually move from the source region of the Yellow River to the eastern part of the basin.

4. Discussion

The trend of SPEI will be significantly different under different combined scenarios, which indicated that the future drought characteristics depend upon along which centralized path the climate develops. In the scenario of high carbon emissions, SPEI tends to obviously present a downward trend. Although the future meteorological drought over the Yellow River basin would be weakened under SSP245 and SSP585 scenarios, which revealed that the increase of precipitation in the basin has effectively alleviated the meteorological drought situation. However, the drought intensity under both scenarios is increasing, which reflected that the frequency of high intensity and serious drought events in the Yellow River basin will still increase under the climate change scenario in the future. Ma et al. [53] found that the overall increase of precipitation in the future may be the main driver of expected mitigation of meteorological drought, but the extreme drought is more likely to occur in future climate scenarios, which is consistent with the conclusions of this study. Frankly speaking, the change of non-rainy days has a more significant impact on drought compared with annual precipitation. In the DBC deviation method applied in this study, the LOCI method was used to fully consider the influence of non-rainy days, and the conclusions drawn are also close to those of previous studies. In addition to this, increased evapotranspiration due to warmer temperatures in future periods may also exacerbate drought intensity [54,55].
From the point of view of spatial difference, the temporal trend of SPEI reflected obvious variability in different regions. Under the SSP245 scenario, the drought tendency in the Loess Plateau was projected to be significantly increase, the drought frequency in the Loess Plateau may rise obviously in the middle future of the SSP126 scenario, and the drought intensity in the Loess Plateau is likely to elevate notably in the far future of the SSP585 scenario. On the whole, the drought situation in the Loess Plateau will be aggravated under the future scenario. The Loess Plateau is a fragile area of the ecological environment over the Yellow River, which has high intensity of human activities, mainly represented by afforestation in recent years [56]. The results revealed that the expansion of vegetation will lead to the increase in regional evaporation, which will counteract the mitigation effect of precipitation on meteorological drought in the future [52,57]. At the same time, in the high carbon emissions scenario, the precipitation will increase under the influence of climate warming, while evaporation will also increase significantly due to the rise of temperature. Under the background of temperature continuously rising in the future, the drought situation on the Loess Plateau will intensify, which will not be conducive to soil and water conservation and vegetation restoration in the Yellow River Basin. Li et al. found [58] that the Loess plateau will continue the drought trend in the future, but the seasonal intensity is different. Based on CMIP5, Shi et al. [59] predicted the meteorological drought situation in the Loess Plateau from 2018 to 2100. The results showed that the areas with significant aggravation of meteorological drought trend in the future accounted for 51.62−99.90% of the loess plateau area, and climate change would increase the frequency of extreme drought events, which was basically consistent with the conclusion of our study.
The source region of the Yellow River to Lanzhou is the main water conservation area of the Yellow River basin, and only 30% of the area bears 60% of the water supply, which is of great significance to ensuring the water security of the Yellow River Basin [60,61]. In the middle future of SSP585 scenario, the drought frequency and duration of the main water conservation areas in the Yellow River Basin would increase obviously, which might threaten the soil and water conservation function of the water conservation areas. Therefore, in the further study, the climate change characteristics and drought response in the main water conservation areas of the Yellow River Basin and the Loess Plateau are worthy of investigation. At the same time, it is also necessary to conduct a comprehensive analysis of the drought conditions in the Yellow River Basin in the future in combination with hydrological and agricultural droughts. Besides that the impact of human activities on drought cannot be ignored, how to quantitatively analyze the impact of climate change and human activities on drought in the Yellow River Basin is an interesting direction.

5. Conclusions

Based on the five excellent GCMs provided by CMIP6 combined with SPEI index, this study analyzed the drought tendency, drought frequency, drought intensity, and drought duration of meteorological drought in the Yellow River Basin from 2040 to 2099, and the conclusions were as follows:
(1)
The GCMs from CMIP6 after bias correction performs better to reproduce the temporal and spatial characteristics of precipitation in the Yellow River Basin, and the phase average deviation of temporal and spatial scales is less than 2% and 6%, respectively. The precipitation in the Yellow River Basin would increase in the future period, and the precipitation growth trend in SSP585 scenario is the most significant with the rate of 1.5 mm/a.
(2)
Under the SSP126 scenario, the meteorological drought in the Yellow River Basin showed a gradually increasing trend. Although the drought trend showed a weakening trend under the SSP245 and SSP585 scenarios, their drought intensity will increase more significantly than SSP126. It is necessary to prevent the occurrence of extreme drought events in the future.
(2)
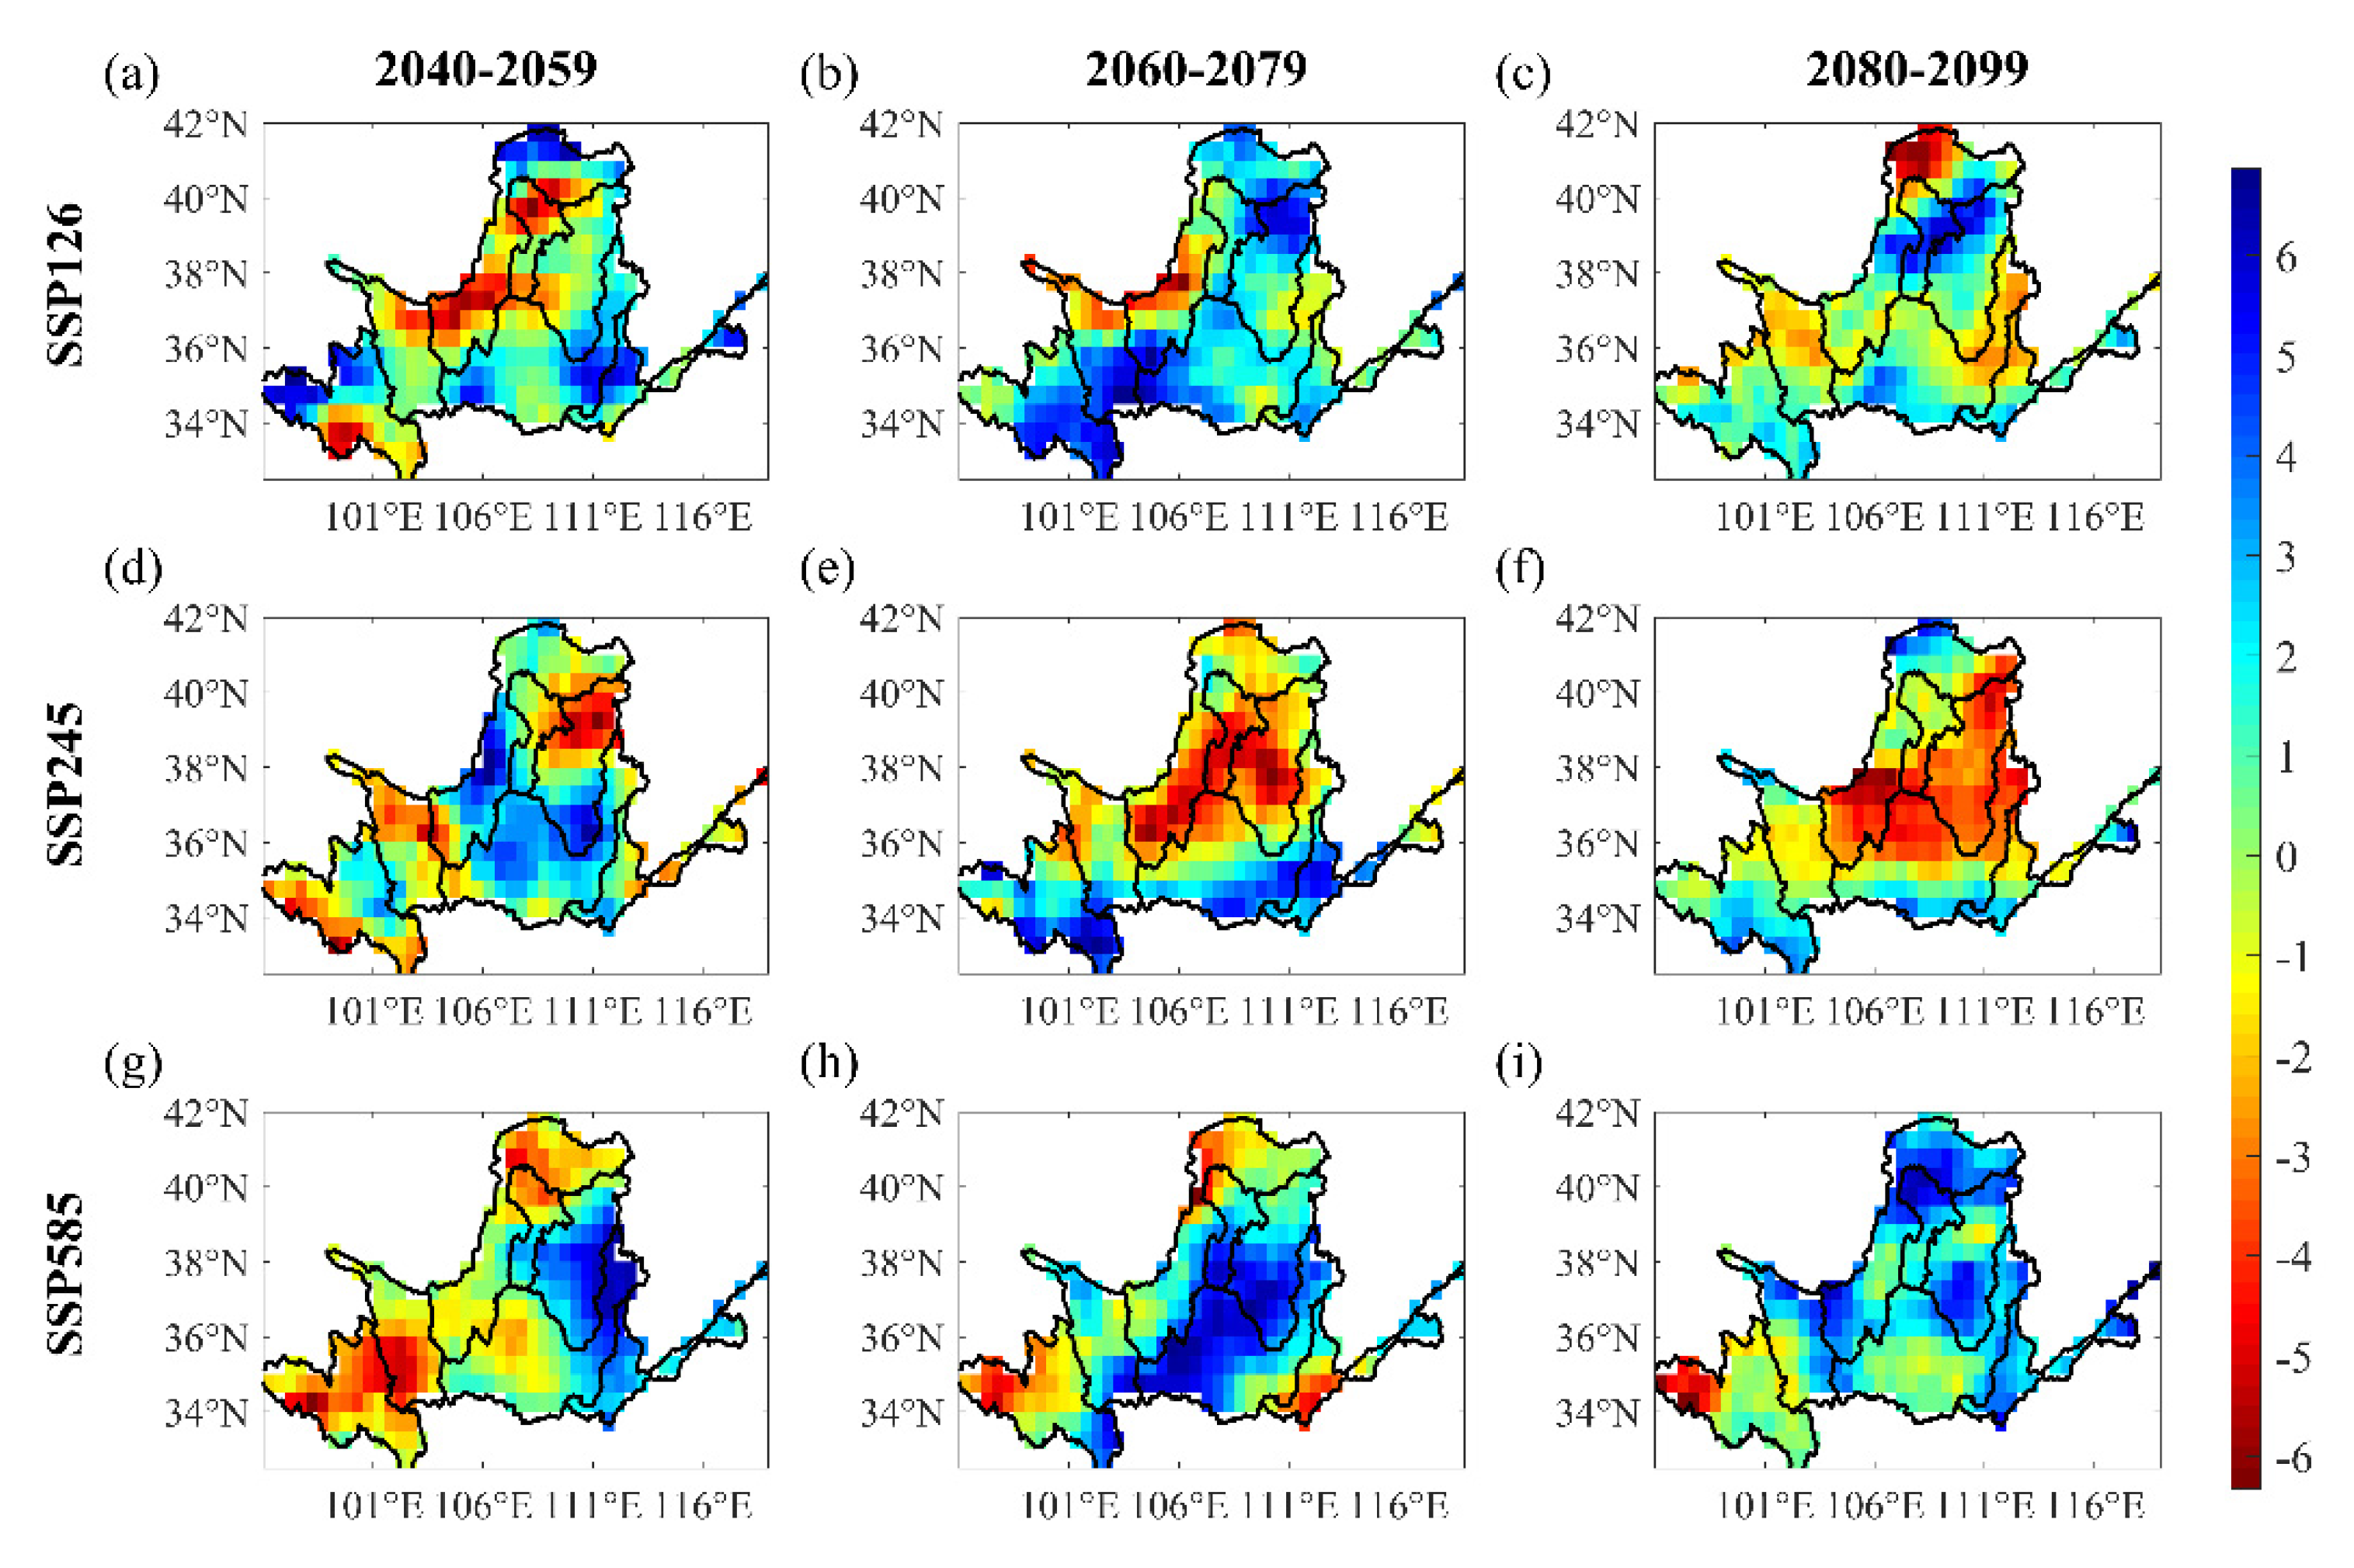
The spatial variation of meteorological drought is heterogeneous in different emission scenarios and periods. In the middle future period of SSP126 scenario, the drought frequency of the Loess Plateau would increase significantly. Moreover, the drought tendency of the Loess Plateau would aggravate in the middle and far future of the SSP245 scenario. Besides that, the drought frequency and drought duration of the water conservation area in the upper reaches of the Yellow River might enhance obviously in the middle future of the SSP585 scenario. In addition, the drought intensity of the Loess Plateau in the Yellow River Basin in the far future period of the SSP585 scenario is the highest compared with other scenarios and periods.

Author Contributions

Conceptualization, H.Y. and G.W.; methodology, L.W. and Z.S. (Zhangkang Shu); data curation, Z.S. (Zhouliang Sun) and L.W.; writing—original draft preparation, L.W. and Z.S. (Zhangkang Shu); review and funding acquisition, Z.B. All authors have read and agreed to the published version of the manuscript.

Funding

This study has been financially supported by the National Key Research and Development Programs of China, China (2017YFA0605002, 2021YFC3201100), the National Natural Science Foundation of China, China (41961124007, 52121006, 41830863, 51879164, 92047301, 52079026), and the Belt and Road Fund on Water and Sustainability of the State Key Laboratory of Hydrology-Water Resources and Hydraulic Engineering, China (2020nkzd01, 2021490211), “Six top talents” in Jiangsu province (grant no. RJFW-031).

Institutional Review Board Statement

Not applicable.

Informed Consent Statement

Not applicable.

Acknowledgments

Thanks for the CMIP6 model data provided by the CMIP6 official website; thanks for the CN05 grid point precipitation data provided by the China National Climate Center; thanks for all the co-authors for their efforts in this paper; and thanks for the editorial department and reviewers for their support and help in this paper.

Conflicts of Interest

The authors declare no conflict of interest.

References

  1. Chiang, F.; Mazdiyasni, O.; Aghakouchak, A. Evidence of anthropogenic impacts on global drought frequency, duration, and intensity. Nat. Commun. 2021, 12, 2754. [Google Scholar] [CrossRef] [PubMed]
  2. Franke, J. Changing drought risks. Nat. Clim. Chang. 2022, 12, 118. [Google Scholar] [CrossRef]
  3. Wang, F.; Wang, Z.; Yang, H.; Zhao, Y. Study of the temporal and spatial patterns of drought in the Yellow River basin based on SPEI. Sci. China Earth Sci. 2018, 61, 1098–1111. [Google Scholar] [CrossRef]
  4. Zhang, H.; Ding, J.; Wang, Y.; Zhou, D.; Zhu, Q. Investigation about the correlation and propagation among meteorological, agricultural and groundwater droughts over humid and arid/semi-arid basins in China. J. Hydrol. 2021, 603, 127007. [Google Scholar] [CrossRef]
  5. Wang, Y.; Yang, J.; Chang, J.; Ran, Z. Assessing the drought mitigation ability of the reservoir in the downstream of the Yellow River. Sci. Total Environ. 2018, 646, 1327–1335. [Google Scholar] [CrossRef]
  6. Omer, A.; Zhuguo, M.; Zheng, Z.; Saleem, F. Natural and anthropogenic influences on the recent droughts in Yellow River Basin, China. Sci. Total Environ. 2020, 704, 135428. [Google Scholar] [CrossRef]
  7. Shen, M.; Chen, J.; Zhuan, M.; Chen, H.; Xu, C.-Y.; Xiong, L. Estimating uncertainty and its temporal variation related to global climate models in quantifying climate change impacts on hydrology. J. Hydrol. 2018, 556, 10–24. [Google Scholar] [CrossRef]
  8. Zheng, H.; Chiew, F.H.; Charles, S.; Podger, G. Future climate and runoff projections across South Asia from CMIP5 global climate models and hydrological modelling. J. Hydrol. Reg. Stud. 2018, 18, 92–109. [Google Scholar] [CrossRef]
  9. Meehl, G.A.; Senior, C.A.; Eyring, V.; Flato, G.; Lamarque, J.-F.; Stouffer, R.J.; Taylor, K.E.; Schlund, M. Context for interpreting equilibrium climate sensitivity and transient climate response from the CMIP6 Earth system models. Sci. Adv. 2020, 6, eaba1981. [Google Scholar] [CrossRef]
  10. Fujimori, S.; Hasegawa, T.; Masui, T.; Takahashi, K.; Herran, D.S.; Dai, H.; Hijioka, Y.; Kainuma, M. SSP3: AIM implementation of shared socioeconomic pathways. Glob. Environ. Chang. 2017, 42, 268–283. [Google Scholar] [CrossRef]
  11. O’Neill, B.C.; Kriegler, E.; Riahi, K.; Ebi, K.L.; Hallegatte, S.; Carter, T.R.; Mathur, R.; Vuuren, D.V. A new scenario framework for climate change research: The concept of shared socioeconomic pathways. Clim. Chang. 2013, 122, 387–400. [Google Scholar] [CrossRef] [Green Version]
  12. Van Vuuren, D.P.; Stehfest, E.; Gernaat, D.E.; Doelman, J.C.; Van den Berg, M.; Harmsen, M.; de Boer, H.S.; Bouwman, L.F.; Daioglou, V.; Edelenbosch, O.Y. Energy, land-use and greenhouse gas emissions trajectories under a green growth paradigm. Glob. Environ. Chang. 2017, 42, 237–250. [Google Scholar] [CrossRef] [Green Version]
  13. Xu, Z.; Han, Y.; Tam, C.-Y.; Yang, Z.-L.; Fu, C. Bias-corrected CMIP6 global dataset for dynamical downscaling of the historical and future climate (1979–2100). Sci. Data 2021, 8, 293. [Google Scholar] [CrossRef] [PubMed]
  14. Ajjur, S.B.; Al-Ghamdi, S.G. Global hotspots for future absolute temperature extremes from CMIP6 models. Earth Space Sci. 2021, 8, e2021EA001817. [Google Scholar] [CrossRef]
  15. Kadkhodazadeh, M.; Valikhan Anaraki, M.; Morshed-Bozorgdel, A.; Farzin, S. A new methodology for reference evapotranspiration prediction and uncertainty analysis under climate change conditions based on machine learning, multi criteria decision making and Monte Carlo methods. Sustainability 2022, 14, 2601. [Google Scholar] [CrossRef]
  16. Smitha, P.; Narasimhan, B.; Sudheer, K.; Annamalai, H. An improved bias correction method of daily rainfall data using a sliding window technique for climate change impact assessment. J. Hydrol. 2018, 556, 100–118. [Google Scholar] [CrossRef]
  17. Li, N.; Li, Y.; Yao, N. Bias correction of the observed daily precipitation and re-division of climatic zones in China. Int. J. Climatol. 2018, 38, 3369–3387. [Google Scholar] [CrossRef]
  18. Zhou, Z.; Shi, H.; Fu, Q.; Ding, Y.; Li, T.; Wang, Y.; Liu, S. Characteristics of propagation from meteorological drought to hydrological drought in the Pearl River Basin. J. Geophys. Res. Atmos. 2021, 126, e2020JD033959. [Google Scholar] [CrossRef]
  19. Wang, L.; Zhang, J.; Elmahdi, A.; Shu, Z.; Wang, G. Evolution Characteristics and Relationship of Meteorological and Hydrological Droughts from 1961 to 2018 in Hanjiang River Basin, China. J. Water Clim. Chang. 2021, 13, 224–246. [Google Scholar] [CrossRef]
  20. Yihdego, Y.; Vaheddoost, B.; Al-Weshah, R.A. Drought indices and indicators revisited. Arab. J. Geosci. 2019, 12, 69. [Google Scholar] [CrossRef]
  21. Livada, I.; Assimakopoulos, V. Spatial and temporal analysis of drought in Greece using the Standardized Precipitation Index (SPI). Theor. Appl. Climatol. 2007, 89, 143–153. [Google Scholar] [CrossRef]
  22. Heddinghaus, T.R.; Sabol, P. A review of the Palmer Drought Severity Index and where do we go from here. In Proc. 7th Conf. on Applied Climatology; American Meteorological Society: Boston, MA, USA, 1991; pp. 242–246. [Google Scholar]
  23. Vicente-Serrano, S.M.; Beguería, S.; López-Moreno, J.I. A multiscalar drought index sensitive to global warming: The standardized precipitation evapotranspiration index. J. Clim. 2010, 23, 1696–1718. [Google Scholar] [CrossRef] [Green Version]
  24. Beguería, S.; Vicente-Serrano, S.M.; Reig, F.; Latorre, B. Standardized precipitation evapotranspiration index (SPEI) revisited: Parameter fitting, evapotranspiration models, tools, datasets and drought monitoring. Int. J. Climatol. 2014, 34, 3001–3023. [Google Scholar] [CrossRef] [Green Version]
  25. Wang, T.; Tu, X.; Singh, V.P.; Chen, X.; Lin, K. Global data assessment and analysis of drought characteristics based on CMIP6. J. Hydrol. 2021, 596, 126091. [Google Scholar] [CrossRef]
  26. Sung, J.H.; Park, J.; Jeon, J.-J.; Seo, S.B. Assessment of Inter-Model Variability in Meteorological Drought Characteristics Using CMIP5 GCMs over South Korea. KSCE J. Civ. Eng. 2020, 24, 2824–2834. [Google Scholar] [CrossRef]
  27. Xu, Y.; Zhang, X.; Hao, Z.; Hao, F.; Li, C. Projections of future meteorological droughts in China under CMIP6 from a three-dimensional perspective. Agric. Water Manag. 2021, 252, 106849. [Google Scholar] [CrossRef]
  28. Ma, M.; Yuan, F.; Cui, H.; Ren, L.; Liu, Y. A comprehensive analysis of meteorological drought stress over the Yellow River basin (China) for the next 40 years. Int. J. Climatol. 2020, 41, E2927–E2948. [Google Scholar] [CrossRef]
  29. Wang, F.; Wang, Z.; Yang, H.; Di, D.; Zhao, Y.; Liang, Q.; Hussain, Z. Comprehensive evaluation of hydrological drought and its relationships with meteorological drought in the Yellow River basin, China. J. Hydrol. 2020, 584, 124751. [Google Scholar] [CrossRef]
  30. Lv, X.; Zuo, Z.; Ni, Y.; Sun, J.; Wang, H. The effects of climate and catchment characteristic change on streamflow in a typical tributary of the Yellow River. Sci. Rep. 2019, 9, 14535. [Google Scholar] [CrossRef] [Green Version]
  31. Zhang, L.; Yang, X. Applying a multi-model ensemble method for long-term runoff prediction under climate change scenarios for the Yellow River Basin, China. Water 2018, 10, 301. [Google Scholar] [CrossRef] [Green Version]
  32. Shu, Z.; Zhang, J.; Jin, J.; Wang, L.; Wang, G.; Wang, J.; Sun, Z.; Liu, J.; Liu, Y.; He, R. Evaluation and Application of Quantitative Precipitation Forecast Products for Mainland China Based on TIGGE Multimodel Data. J. Hydrometeorol. 2021, 22, 1199–1219. [Google Scholar] [CrossRef]
  33. Wang, L.; Zhang, J.; Shu, Z.; Wang, Y.; Bao, Z.; Liu, C.; Zhou, X.; Wang, G. Evaluation of the ability of CMIP6 global climate models to simulate precipitation in the Yellow River Basin, China. Front. Earth Sci. 2022, 9, 744462190. [Google Scholar] [CrossRef]
  34. Chadwick, C.; Gironás, J.; Vicuña, S.; Meza, F.; McPhee, J. Using a statistical preanalysis approach as an ensemble technique for the unbiased mapping of GCM changes to local stations. J. Hydrometeorol. 2018, 19, 1447–1465. [Google Scholar] [CrossRef]
  35. Try, S.; Tanaka, S.; Tanaka, K.; Sayama, T.; Khujanazarov, T.; Oeurng, C. Comparison of CMIP5 and CMIP6 GCM performance for flood projections in the Mekong River Basin. J. Hydrol. Reg. Stud. 2022, 40, 101035. [Google Scholar] [CrossRef]
  36. Panjwani, S.; Naresh Kumar, S.; Ahuja, L. Bias correction of gcm data using quantile mapping technique. In Proceedings of International Conference on Communication and Computational Technologies; Springer: Singapore, 2021; pp. 617–621. [Google Scholar]
  37. Frei, A.; Mukundan, R.; Chen, J.; Gelda, R.K.; Owens, E.M.; Gass, J.; Ravindranath, A. A cascading bias correction method for global climate model simulated multi-year precipitation variability. J. Hydrometeorol. 2022, 23, 697–713. [Google Scholar] [CrossRef]
  38. Liu, C.; Yang, C.; Yang, Q.; Wang, J. Spatiotemporal drought analysis by the standardized precipitation index (SPI) and standardized precipitation evapotranspiration index (SPEI) in Sichuan Province, China. Sci. Rep. 2021, 11, 1280. [Google Scholar] [CrossRef]
  39. Gurrapu, S.; Hodder, K.R.; Sauchyn, D.J.; Jacques, J.M.S. Assessment of the ability of the standardized precipitation evapotranspiration index (SPEI) to model historical streamflow in watersheds of Western Canada. Can. Water Resour. J. Rev. Can. Des Ressour. Hydr. 2021, 46, 52–72. [Google Scholar] [CrossRef]
  40. Zarei, A.R.; Mahmoudi, M.R. Assessment of the effect of PET calculation method on the Standardized Precipitation Evapotranspiration Index (SPEI). Arab. J. Geosci. 2020, 13, 182. [Google Scholar] [CrossRef]
  41. Polong, F.; Chen, H.; Sun, S.; Ongoma, V. Temporal and spatial evolution of the standard precipitation evapotranspiration index (SPEI) in the Tana River Basin, Kenya. Theor. Appl. Climatol. 2019, 138, 777–792. [Google Scholar] [CrossRef]
  42. Zhou, J.; Wang, Y.; Su, B.; Wang, A.; Tao, H.; Zhai, J.; Kundzewicz, Z.W.; Jiang, T. Choice of potential evapotranspiration formulas influences drought assessment: A case study in China. Atmos. Res. 2020, 242, 104979. [Google Scholar] [CrossRef]
  43. Yao, N.; Li, Y.; Lei, T.; Peng, L. Drought evolution, severity and trends in mainland China over 1961–2013. Sci. Total Environ. 2018, 616, 73–89. [Google Scholar] [CrossRef] [PubMed]
  44. Hao, Z.; Hao, F.; Singh, V.P.; Xia, Y.; Ouyang, W.; Shen, X. A theoretical drought classification method for the multivariate drought index based on distribution properties of standardized drought indices. Adv. Water Resour. 2016, 92, 240–247. [Google Scholar] [CrossRef]
  45. Mann, H.B. Nonparametric test against trend. Econometrica 1945, 13, 245–259. [Google Scholar] [CrossRef]
  46. Wang, G.; Wang, D.; Trenberth, K.E.; Erfanian, A.; Yu, M.; Bosilovich, M.G.; Parr, D.T. The peak structure and future changes of the relationships between extreme precipitation and temperature. Nat. Clim. Chang. 2017, 7, 268–274. [Google Scholar] [CrossRef]
  47. Pfahl, S.; O’Gorman, P.A.; Fischer, E.M. Understanding the regional pattern of projected future changes in extreme precipitation. Nat. Clim. Chang. 2017, 7, 423–427. [Google Scholar] [CrossRef]
  48. Zhongming, Z.; Linong, L.; Xiaona, Y.; Wangqiang, Z.; Wei, L. AR6 Climate Change 2021: The Physical Science Basis. 2021. Available online: https://www.unep.org/resources/report/climate-change-2021-physical-science-basis-working-group-i-contribution-sixth (accessed on 17 April 2022).
  49. Ji, G.; Lai, Z.; Yan, D.; Wu, L.; Wang, Z. Spatiotemporal patterns of future meteorological drought in the Yellow River Basin based on SPEI under RCP scenarios. Int. J. Clim. Chang. Strateg. Manag. 2021, 14, 39–53. [Google Scholar] [CrossRef]
  50. Wang, Y.; Wang, S.; Zhao, W.; Liu, Y. The increasing contribution of potential evapotranspiration to severe droughts in the Yellow River basin. J. Hydrol. 2022, 605, 127310. [Google Scholar] [CrossRef]
  51. Liu, Q. Drought variation and its sensitivity coefficients to climatic factors in the Yellow River Basin. Chin. J. Agrometeorol. 2016, 37, 623–632. [Google Scholar]
  52. Wu, J.; Miao, C.; Zheng, H.; Duan, Q.; Lei, X.; Li, H. Meteorological and hydrological drought on the Loess Plateau, China: Evolutionary characteristics, impact, and propagation. J. Geophys. Res. Atmos. 2018, 123, 11–569. [Google Scholar] [CrossRef]
  53. Ma, M.; Cui, H.; Wang, W.; Huang, X.; Tu, X. Projection of spatiotemporal patterns and possible changes of drought in the Yellow River basin, China. Theor. Appl. Climatol. 2019, 138, 1971–1989. [Google Scholar] [CrossRef]
  54. Park, S.Y.; Sur, C.; Kim, J.S.; Choi, S.J.; Lee, J.H.; Kim, T.W. Projected drought risk assessment from water balance perspectives in a changing climate. Int. J. Climatol. 2021, 41, 2765–2777. [Google Scholar] [CrossRef]
  55. Dai, A.; Zhao, T.; Chen, J. Climate change and drought: A precipitation and evaporation perspective. Curr. Clim. Chang. Rep. 2018, 4, 301–312. [Google Scholar] [CrossRef]
  56. Han, Z.; Huang, Q.; Huang, S.; Leng, G.; Bai, Q.; Liang, H.; Wang, L.; Zhao, J.; Fang, W. Spatial-temporal dynamics of agricultural drought in the Loess Plateau under a changing environment: Characteristics and potential influencing factors. Agric. Water Manag. 2021, 244, 106540. [Google Scholar] [CrossRef]
  57. Han, Z.; Huang, S.; Huang, Q.; Bai, Q.; Leng, G.; Wang, H.; Zhao, J.; Wei, X.; Zheng, X. Effects of vegetation restoration on groundwater drought in the Loess Plateau, China. J. Hydrol. 2020, 591, 125566. [Google Scholar] [CrossRef]
  58. Li, Y.; Xie, Z.; Qin, Y.; Xia, H.; Zheng, Z.; Zhang, L.; Pan, Z.; Liu, Z. Drought Under Global Warming and Climate Change: An Empirical Study of the Loess Plateau. Sustainability 2019, 11, 1281. [Google Scholar] [CrossRef] [Green Version]
  59. Shi, Y.F.; Peng, S. Spatiotemporal changes in drought across the Loess Plateau from 2018 to 2100. J. Lanzhou Univ. Nat. Sci. 2020, 56, 785–792. [Google Scholar] [CrossRef]
  60. Wang, M.; Fu, J.E.; Wu, Z.; Pang, Z. Spatiotemporal variation of NDVI in the vegetation growing season in the source region of the Yellow River, China. ISPRS Int. J. Geo-Inf. 2020, 9, 282. [Google Scholar] [CrossRef] [Green Version]
  61. Ren, Y.; Liu, J.; Shalamzari, M.J.; Arshad, A.; Liu, S.; Liu, T.; Tao, H. Monitoring Recent Changes in Drought and Wetness in the Source Region of the Yellow River Basin, China. Water 2022, 14, 861. [Google Scholar] [CrossRef]
Figure 1. Division of the eight water resource zones in YRB.
Water 14 01896 g001
Figure 2. Annual average precipitation before and after bias correction from model simulation and observation during the historical period (1961–2014) over Yellow River Basin. (a) Before the bias correction and (b) after the bias correction; the “Mean” is the average ensemble model, and “Observed” is the observation.
Water 14 01896 g002
Figure 3. Spatial distribution of average annual precipitation from observation and model simulation after bias correction during the historical period (1961–2014) over Yellow River Basin. (a) Observation and (b) after the bias correction.
Water 14 01896 g003
Figure 4. Daily precipitation before and after bias correction from model simulation and observation on daily scale. (a) Raw GCMs data and (b) corrected GCMs data.
Water 14 01896 g004
Figure 5. The drought characteristics of raw GCMs, corrected GCMs, and observed data; (a) Drought Duration, (b) Drought Tendency, (c) Drought intensity, (d) Drought frequency. The “D”, ”T”, ”S”, and ”F” is drought duration, drought intensity, drought trend, and drought frequency, respectively. The “sim” means the corrected GCMs; the “obs” means the observed data.
Water 14 01896 g005
Figure 6. Annual average precipitation and temperature under SSP126, SSP245, and SSP585 from 1961 to 2099 over the Yellow River Basin; (a) the annual average precipitation and (b) the annual average temperature.
Water 14 01896 g006aWater 14 01896 g006b
Figure 7. SPEI-12 of SSP126, SSP245, and SSP585 over 2040–2099 for the Yellow River Basin.
Water 14 01896 g007aWater 14 01896 g007b
Figure 8. Spatial distribution of drought tendency from SSP126, SSP245, and SSP585 over 2040–2099 in the Yellow River basin. (ac) are the drought tendency of near future, middle future, far future under SSP126, (df) are the drought tendency of near future, middle future, far future under SSP245, (gi) are the drought tendency of near future, middle future, far future under SSP585.
Water 14 01896 g008
Figure 9. Spatial distribution of drought frequency from SSP126, SSP245, and SSP585 over 2040–2099 in the Yellow River basin. (ac) are the drought frequency of near future, middle future, far future under SSP126, (df) are the drought frequency of near future, middle future, far future under SSP245, (gi) are the drought frequency of near future, middle future, far future under SSP585.
Water 14 01896 g009
Figure 10. Spatial distribution of drought duration from SSP126, SSP245, and SSP585 over 2040–2099 in the Yellow River basin. (ac) are the drought duration of near future, middle future, far future under SSP126, (df) are the drought duration of near future, middle future, far future under SSP245, (gi) are the drought duration of near future, middle future, far future under SSP585.
Water 14 01896 g010
Figure 11. Spatial distribution of drought intensity from SSP126, SSP245, and SSP585 over 2040–2099 in the Yellow River basin. (ac) are the drought intensity of near future, middle future, far future under SSP126, (df) are the drought intensity of near future, middle future, far future under SSP245, (gi) are the drought intensity of near future, middle future, far future under SSP585.
Water 14 01896 g011
Table 1. Range of eight sub-regions.
NumberArea Range
IAbove Longyangxia
IILongyangxia~Lanzhou
IIILanzhou~Hekou town
IVInterior region
VLongmen~SanMenXia
VIHekou town~Longmen
VIISanMenXia~HuaYuanKou
VIIIBelow HuaYuanKou
Table 2. Detailed information on the five CMIP6 climate models. The “lon” means longitude, the “lat” means latitude, and the “lon × lat” means the spatial resolution of each model.
NumberModelCountryAtmospheric Resolution (lon × lat)
1ACCESS-CM2Australia1.875° × 1.25°
2BCC-CSM2-MRChina1.125° × 1.125°
3CNRM-CM6-1France1.40625° × 1.40625°
4CNRM-ESM2-1France1.40625° × 1.40625°
5MPI-ESM1-2-LRGermany1.875° × 1.8652°
Table 3. Classification of Standardized Drought Index.
SPEIDrought Level
0.5 S P E I < 0 Light Drought
1.5 S P E I < 1 Moderate Drought
2 S P E I < 1.5 Severe Drought
S P E I < 2 Extreme Drought
Table 4. Comparison of drought characteristics between the future scenarios (2015–2100) and baseline (1961–2014). The “m” is month.
Duration (m)IntensityTendencyFrequency (%)
Baseline1.121.930.1430.91
SSP1261.411.39−0.02928.97
SSP2451.321.430.19526.51
SSP5851.011.511.8425.07
Table 5. The average probability of drought events on different grades for SSP126, SSP245, and SSP585 in the future over the Yellow River Basin; the unit is (%).
TimeScenariosLight DroughtModerate DroughtSevere DroughtExtreme DroughtDrought Frequency
2040–2059SSP12615.6210.355.423.5034.88
SSP24513.296.263.142.2924.98
SSP58519.409.653.911.3734.34
2060–2079SSP12613.837.984.211.9427.96
SSP24513.779.795.913.1332.60
SSP58513.817.863.851.8927.41
2080–2099SSP12613.467.032.441.1324.07
SSP24511.016.713.251.3022.28
SSP5858.223.361.510.3813.46
Publisher’s Note: MDPI stays neutral with regard to jurisdictional claims in published maps and institutional affiliations.

