
Water Markets: Mapping Scientific Knowledge


 ,
,  and
and 
Abstract
1. Introduction
2. Theoretical Framework
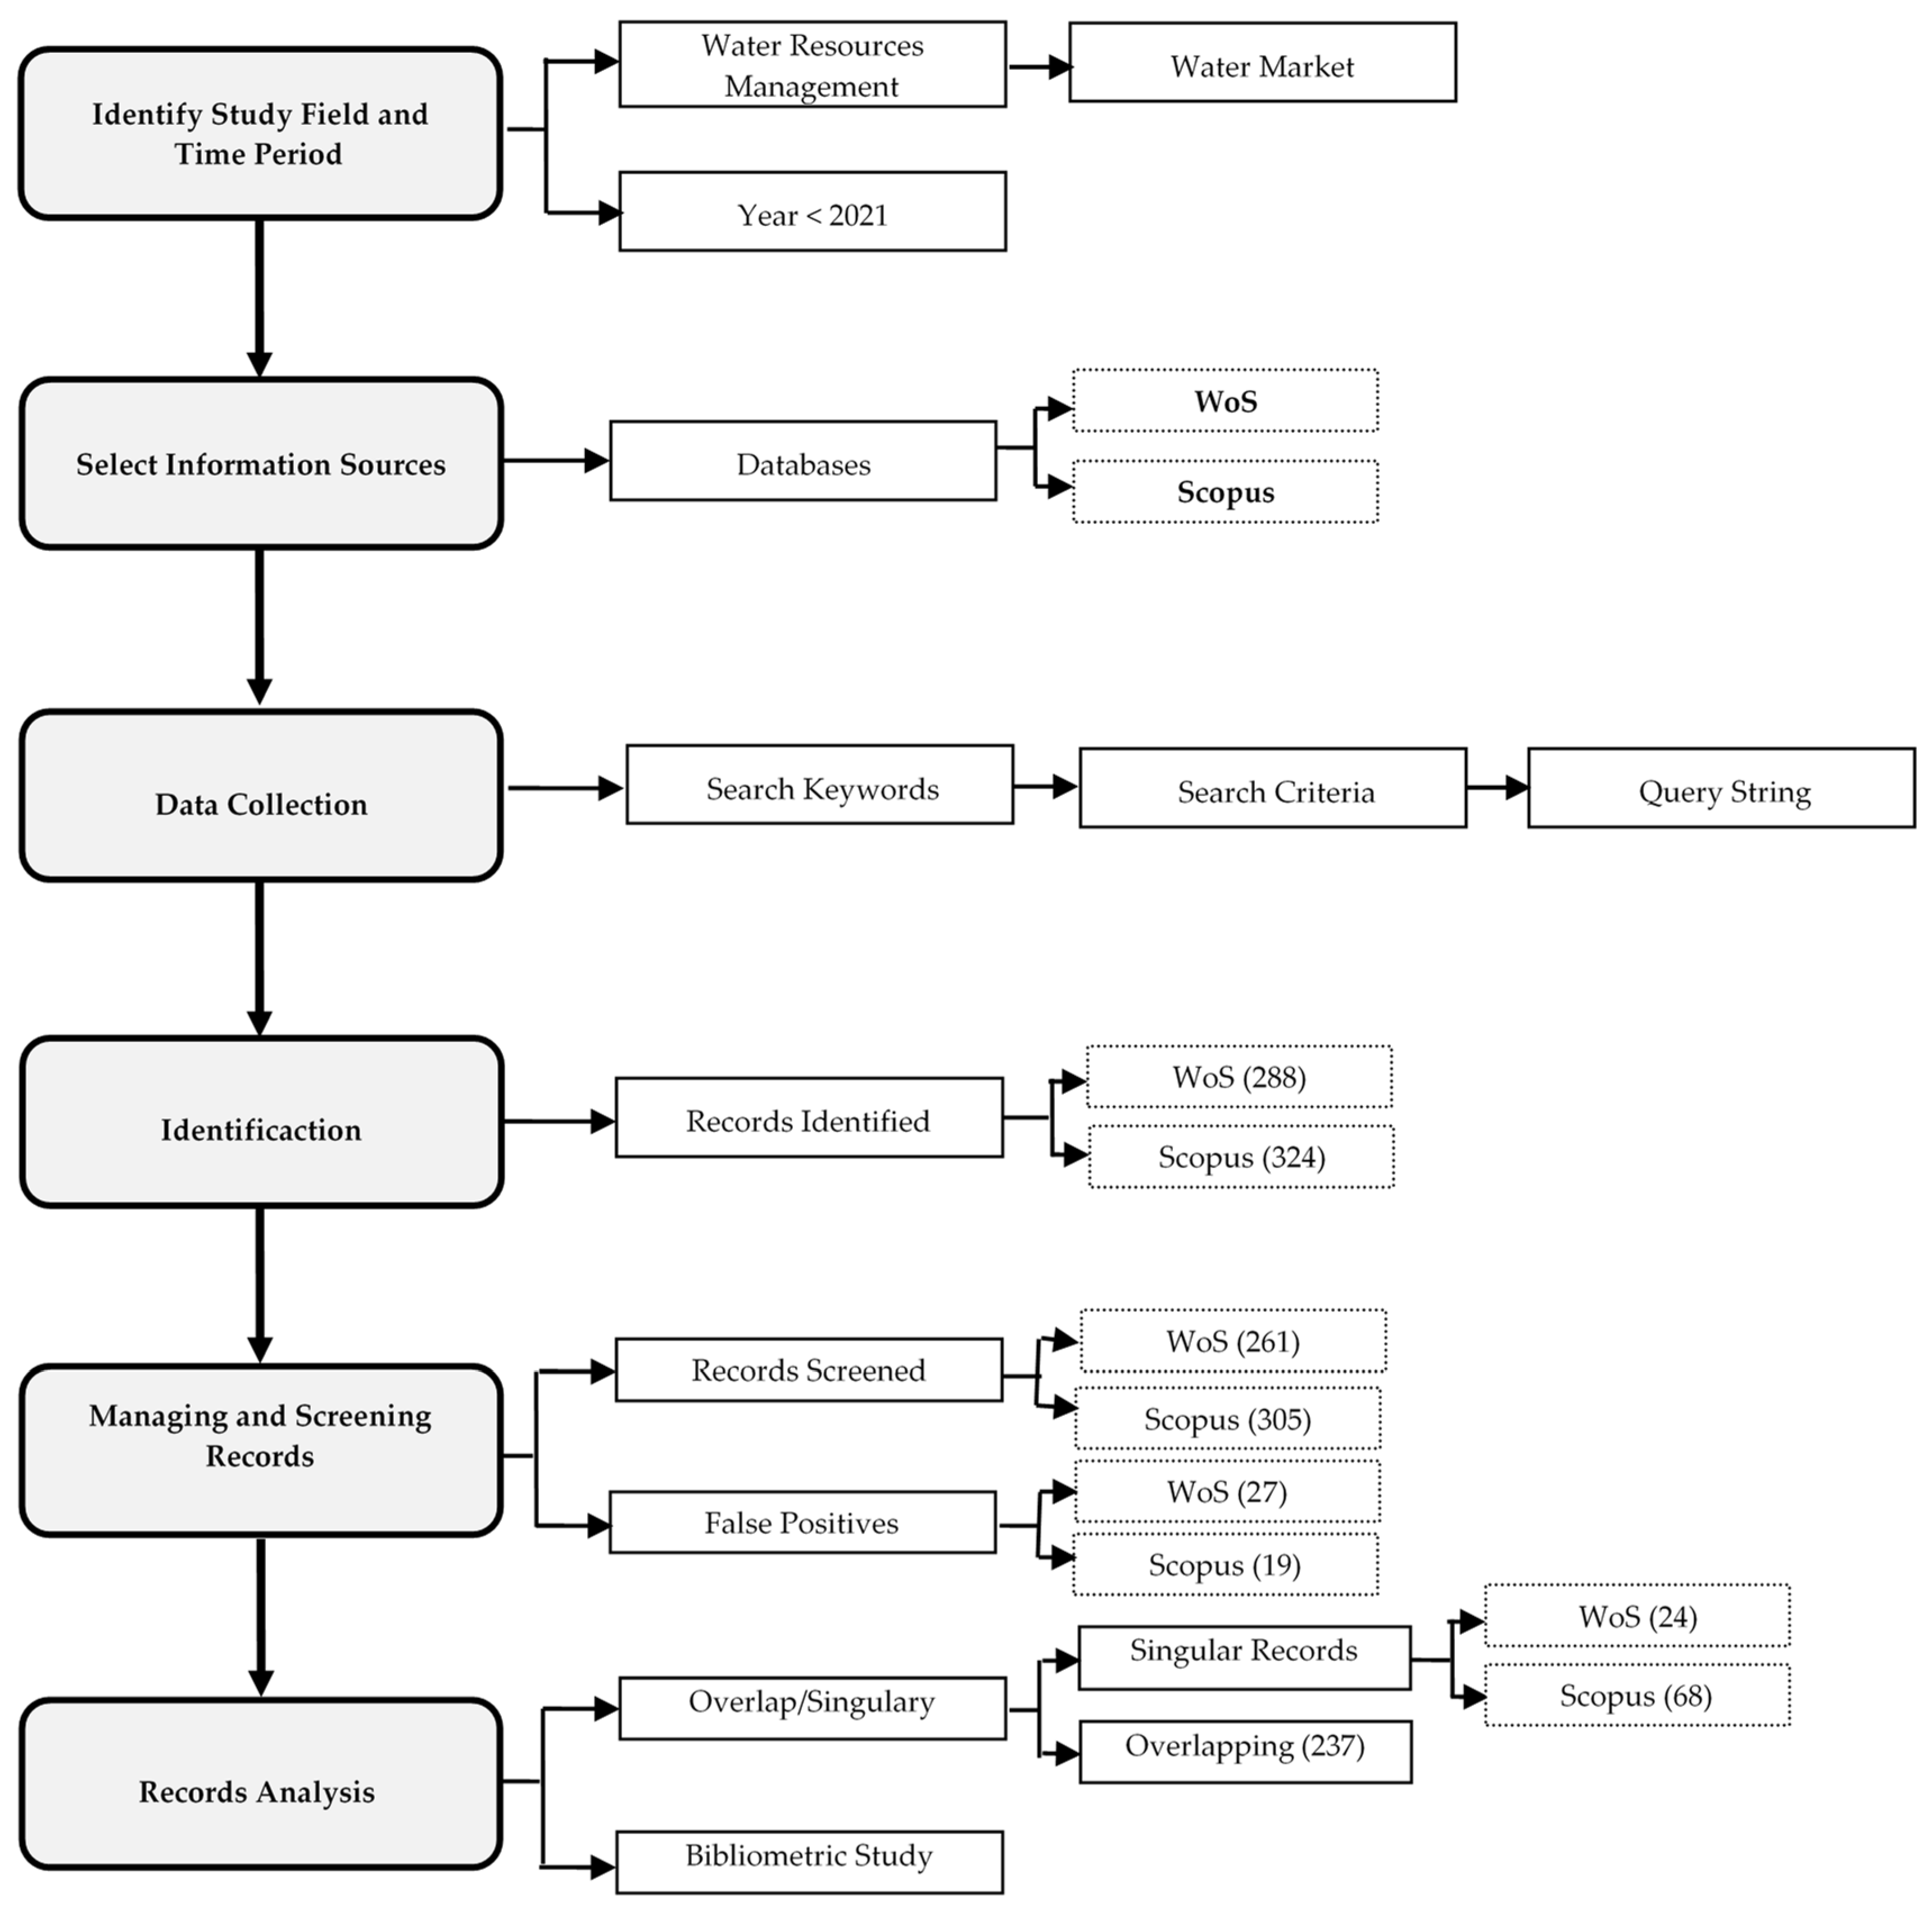
3. Methodology
4. Results
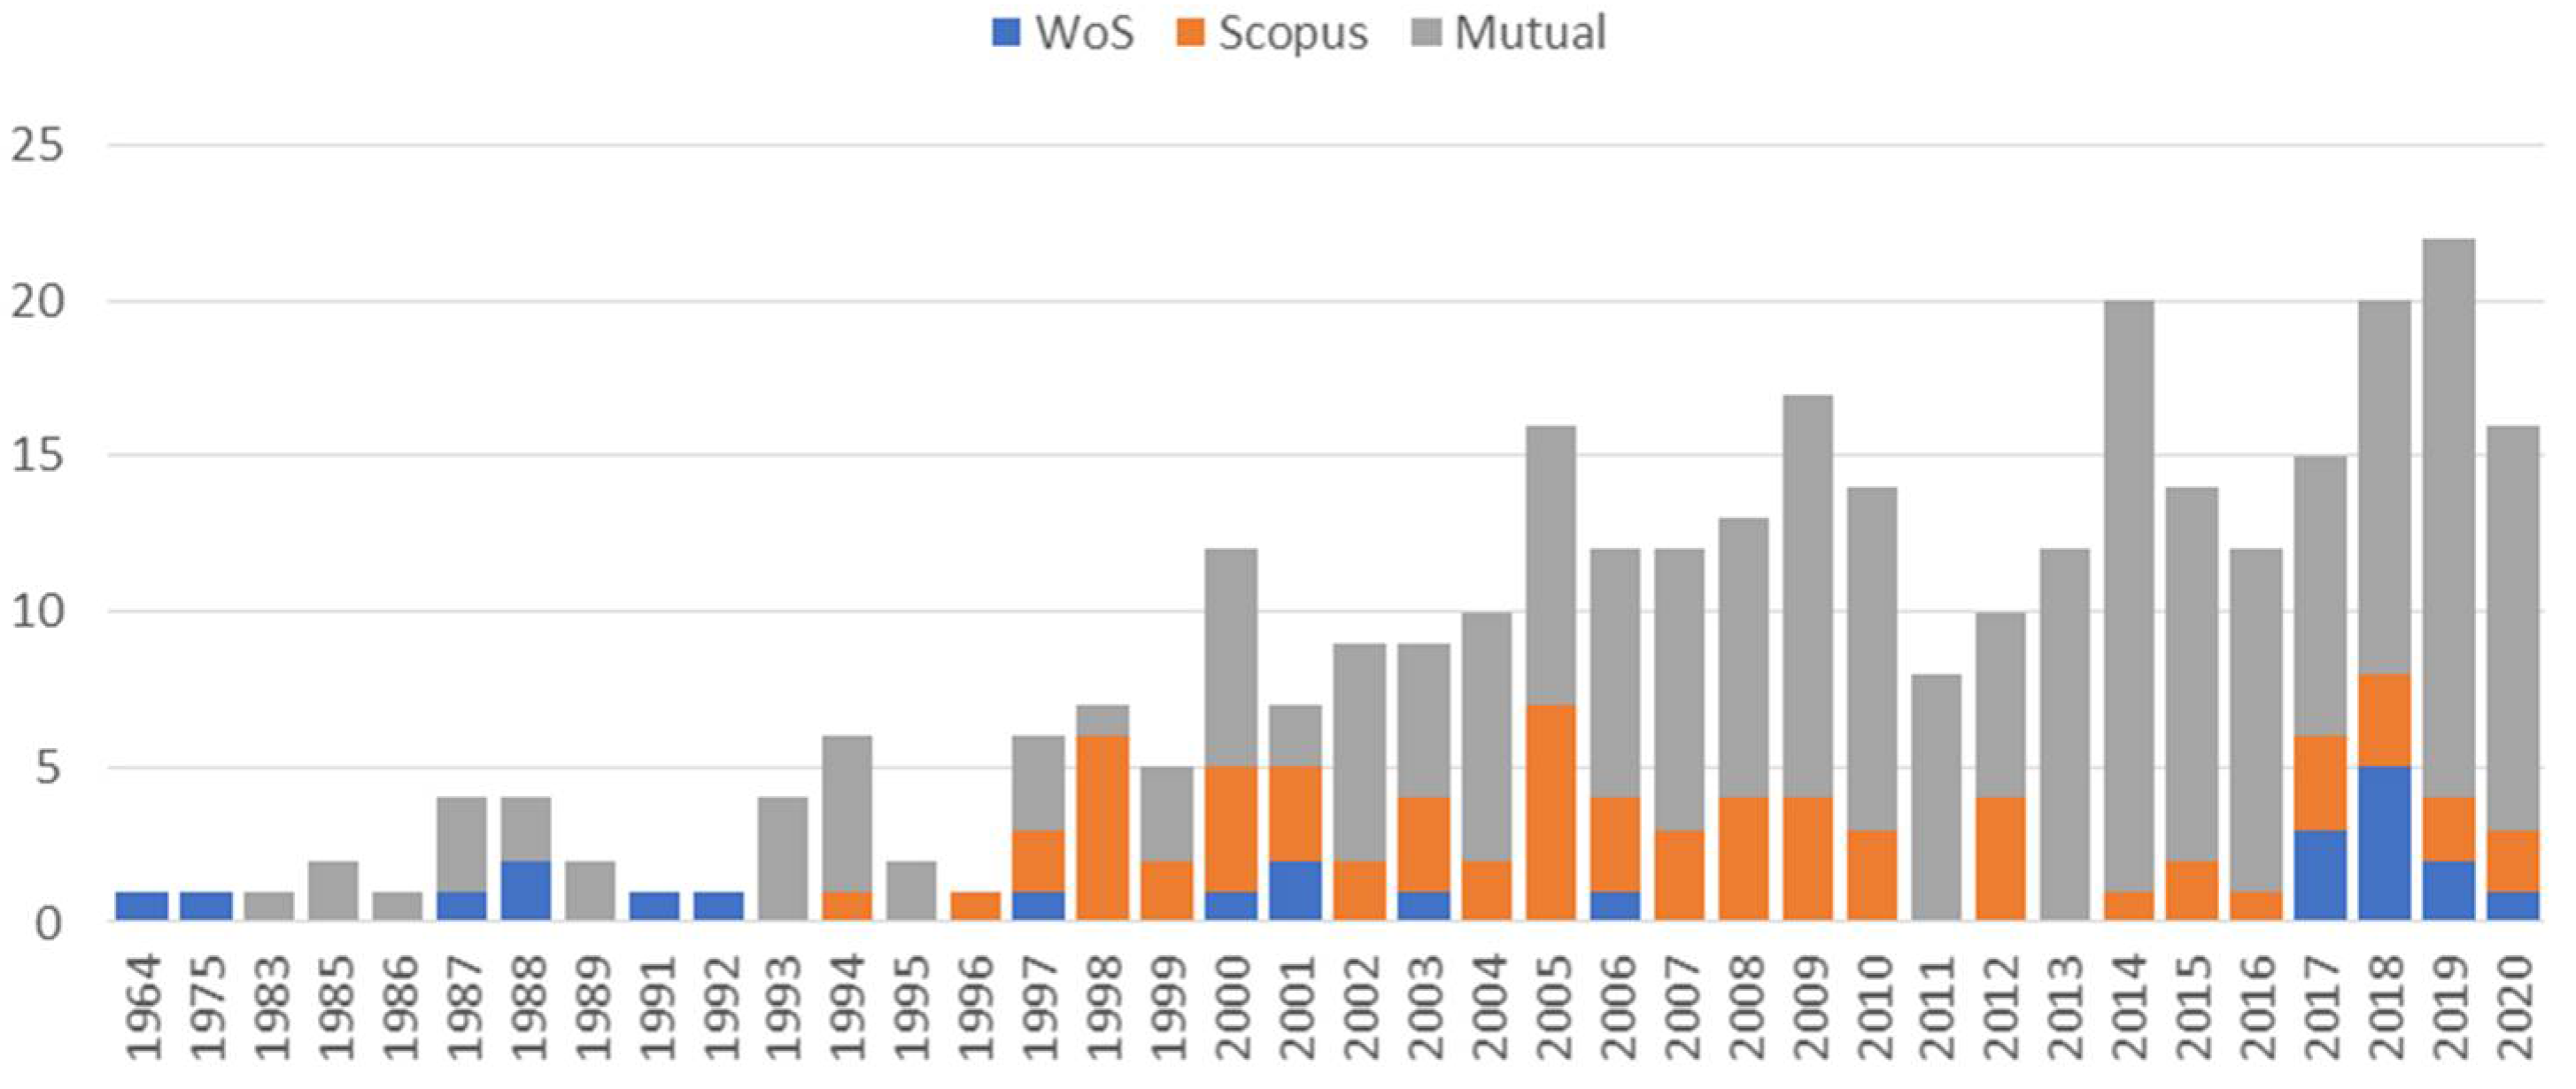
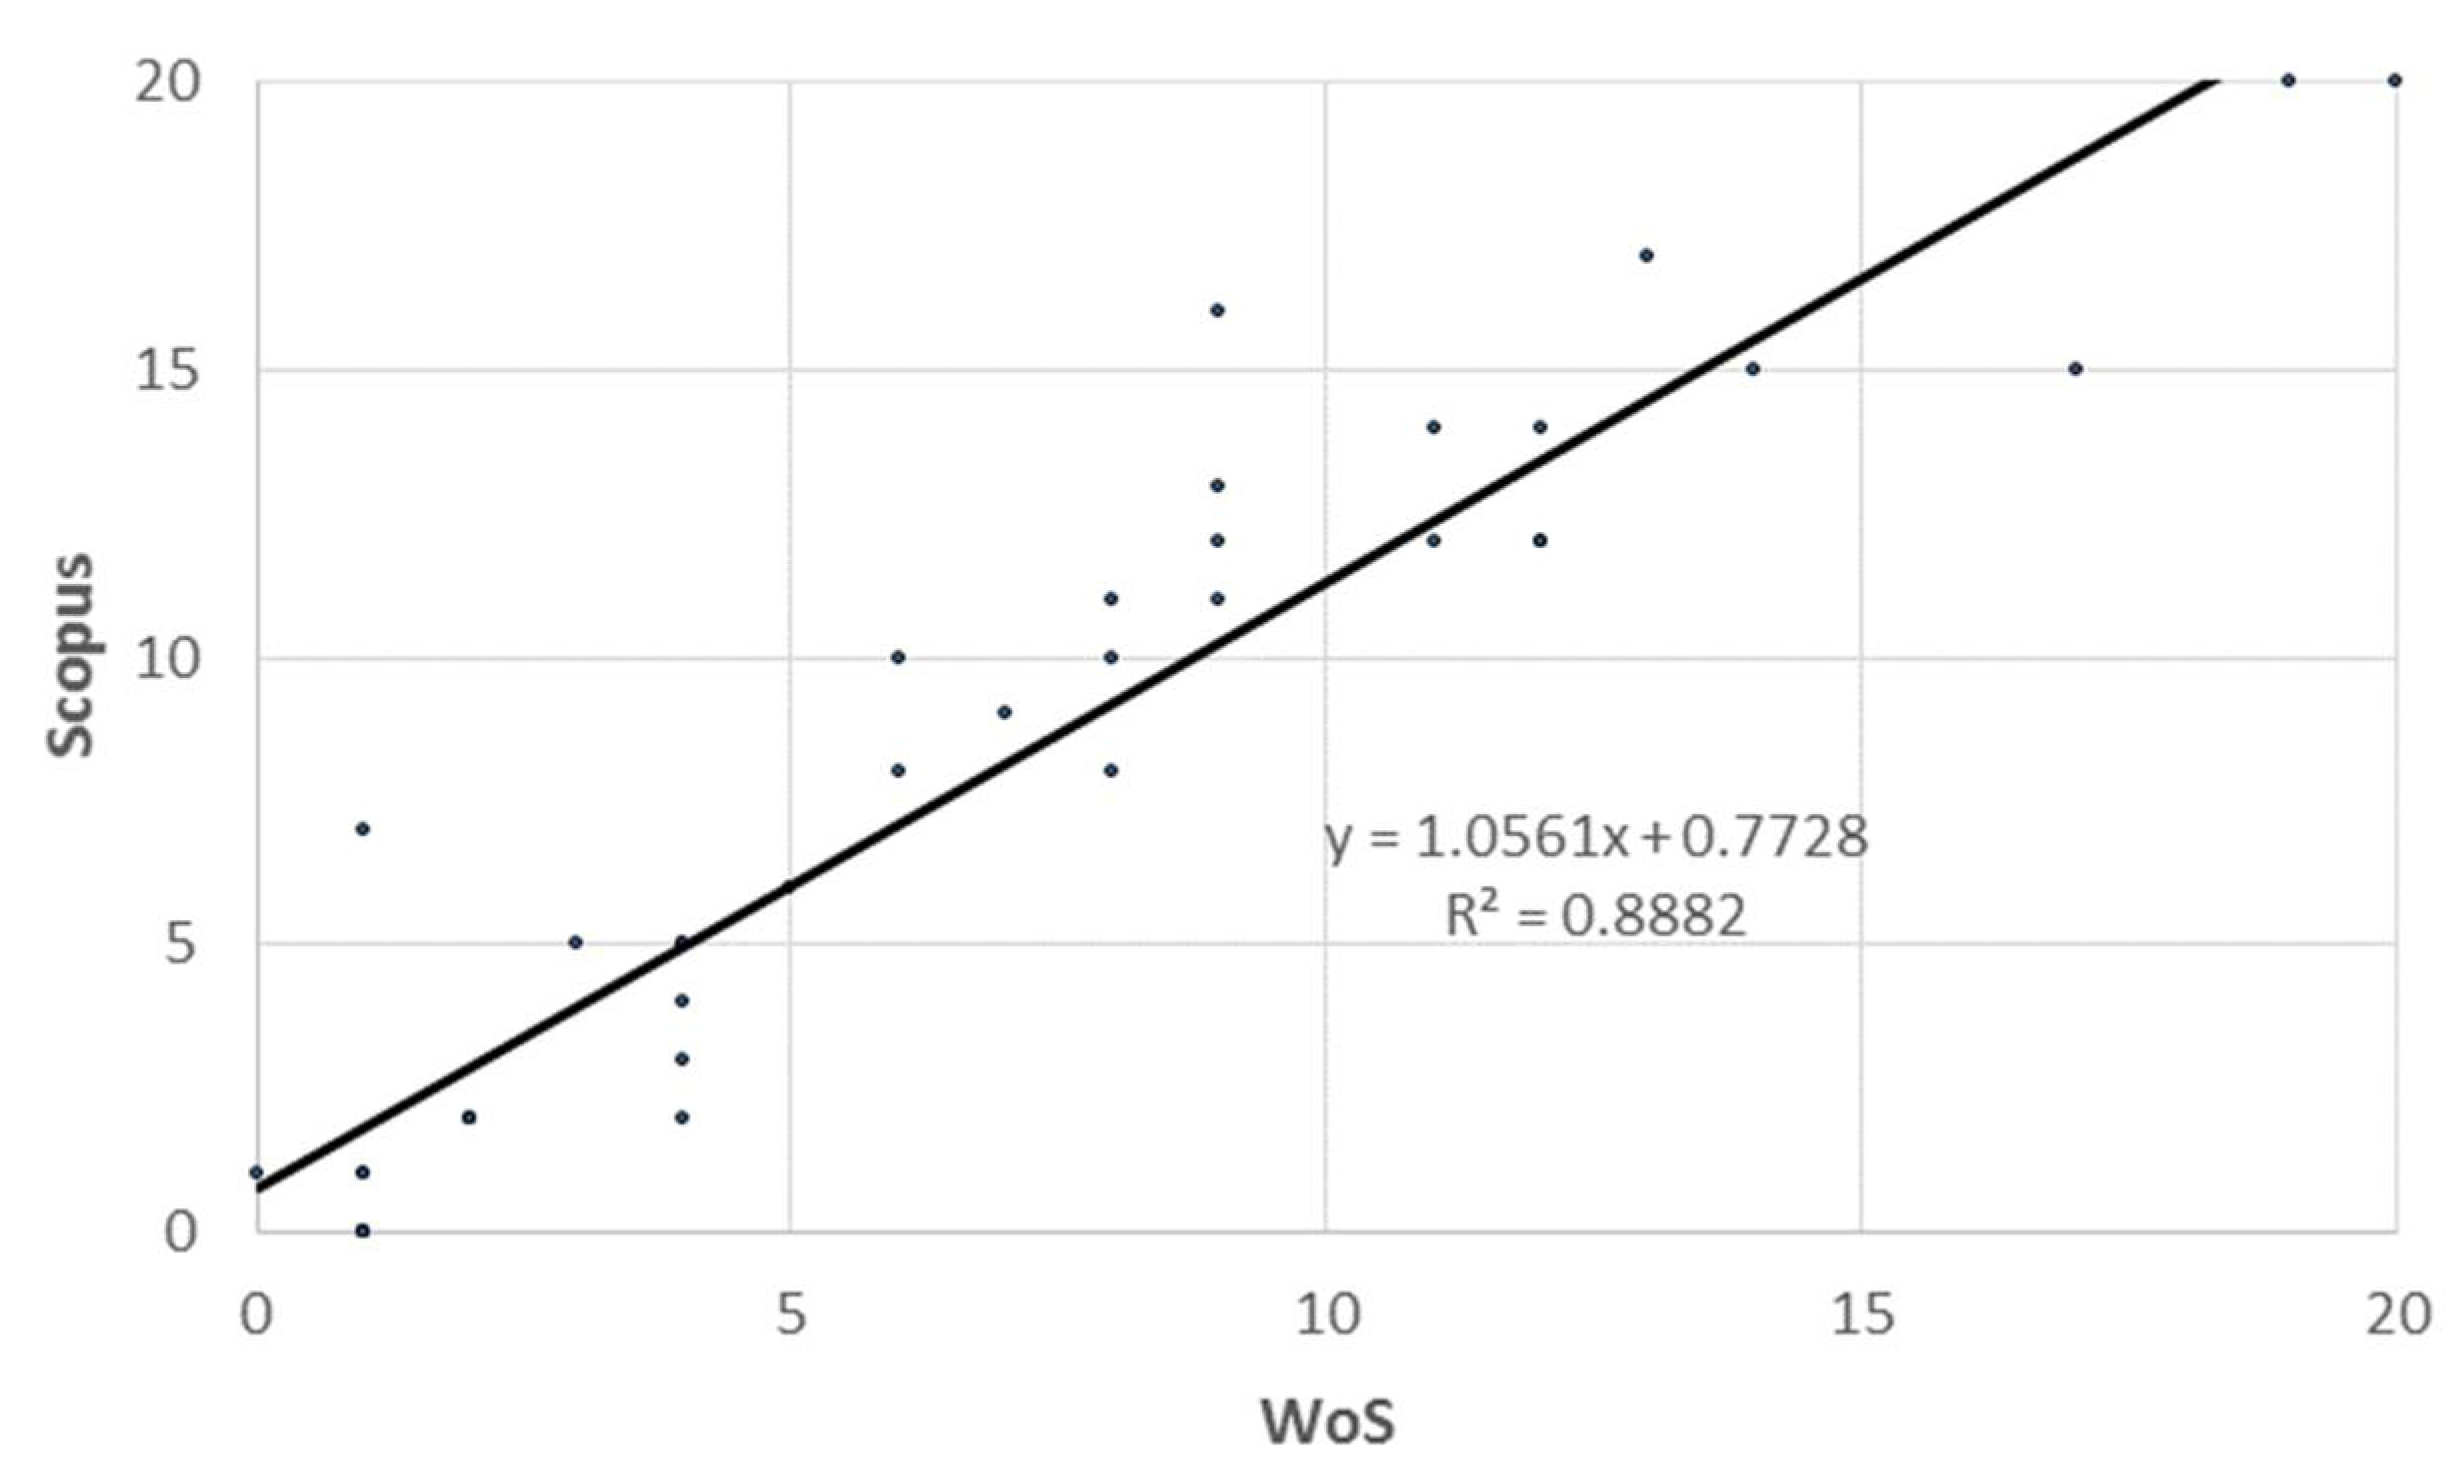
4.1. Database Overlap and Singularity
4.2. Open Access
- WoS
- Scopus
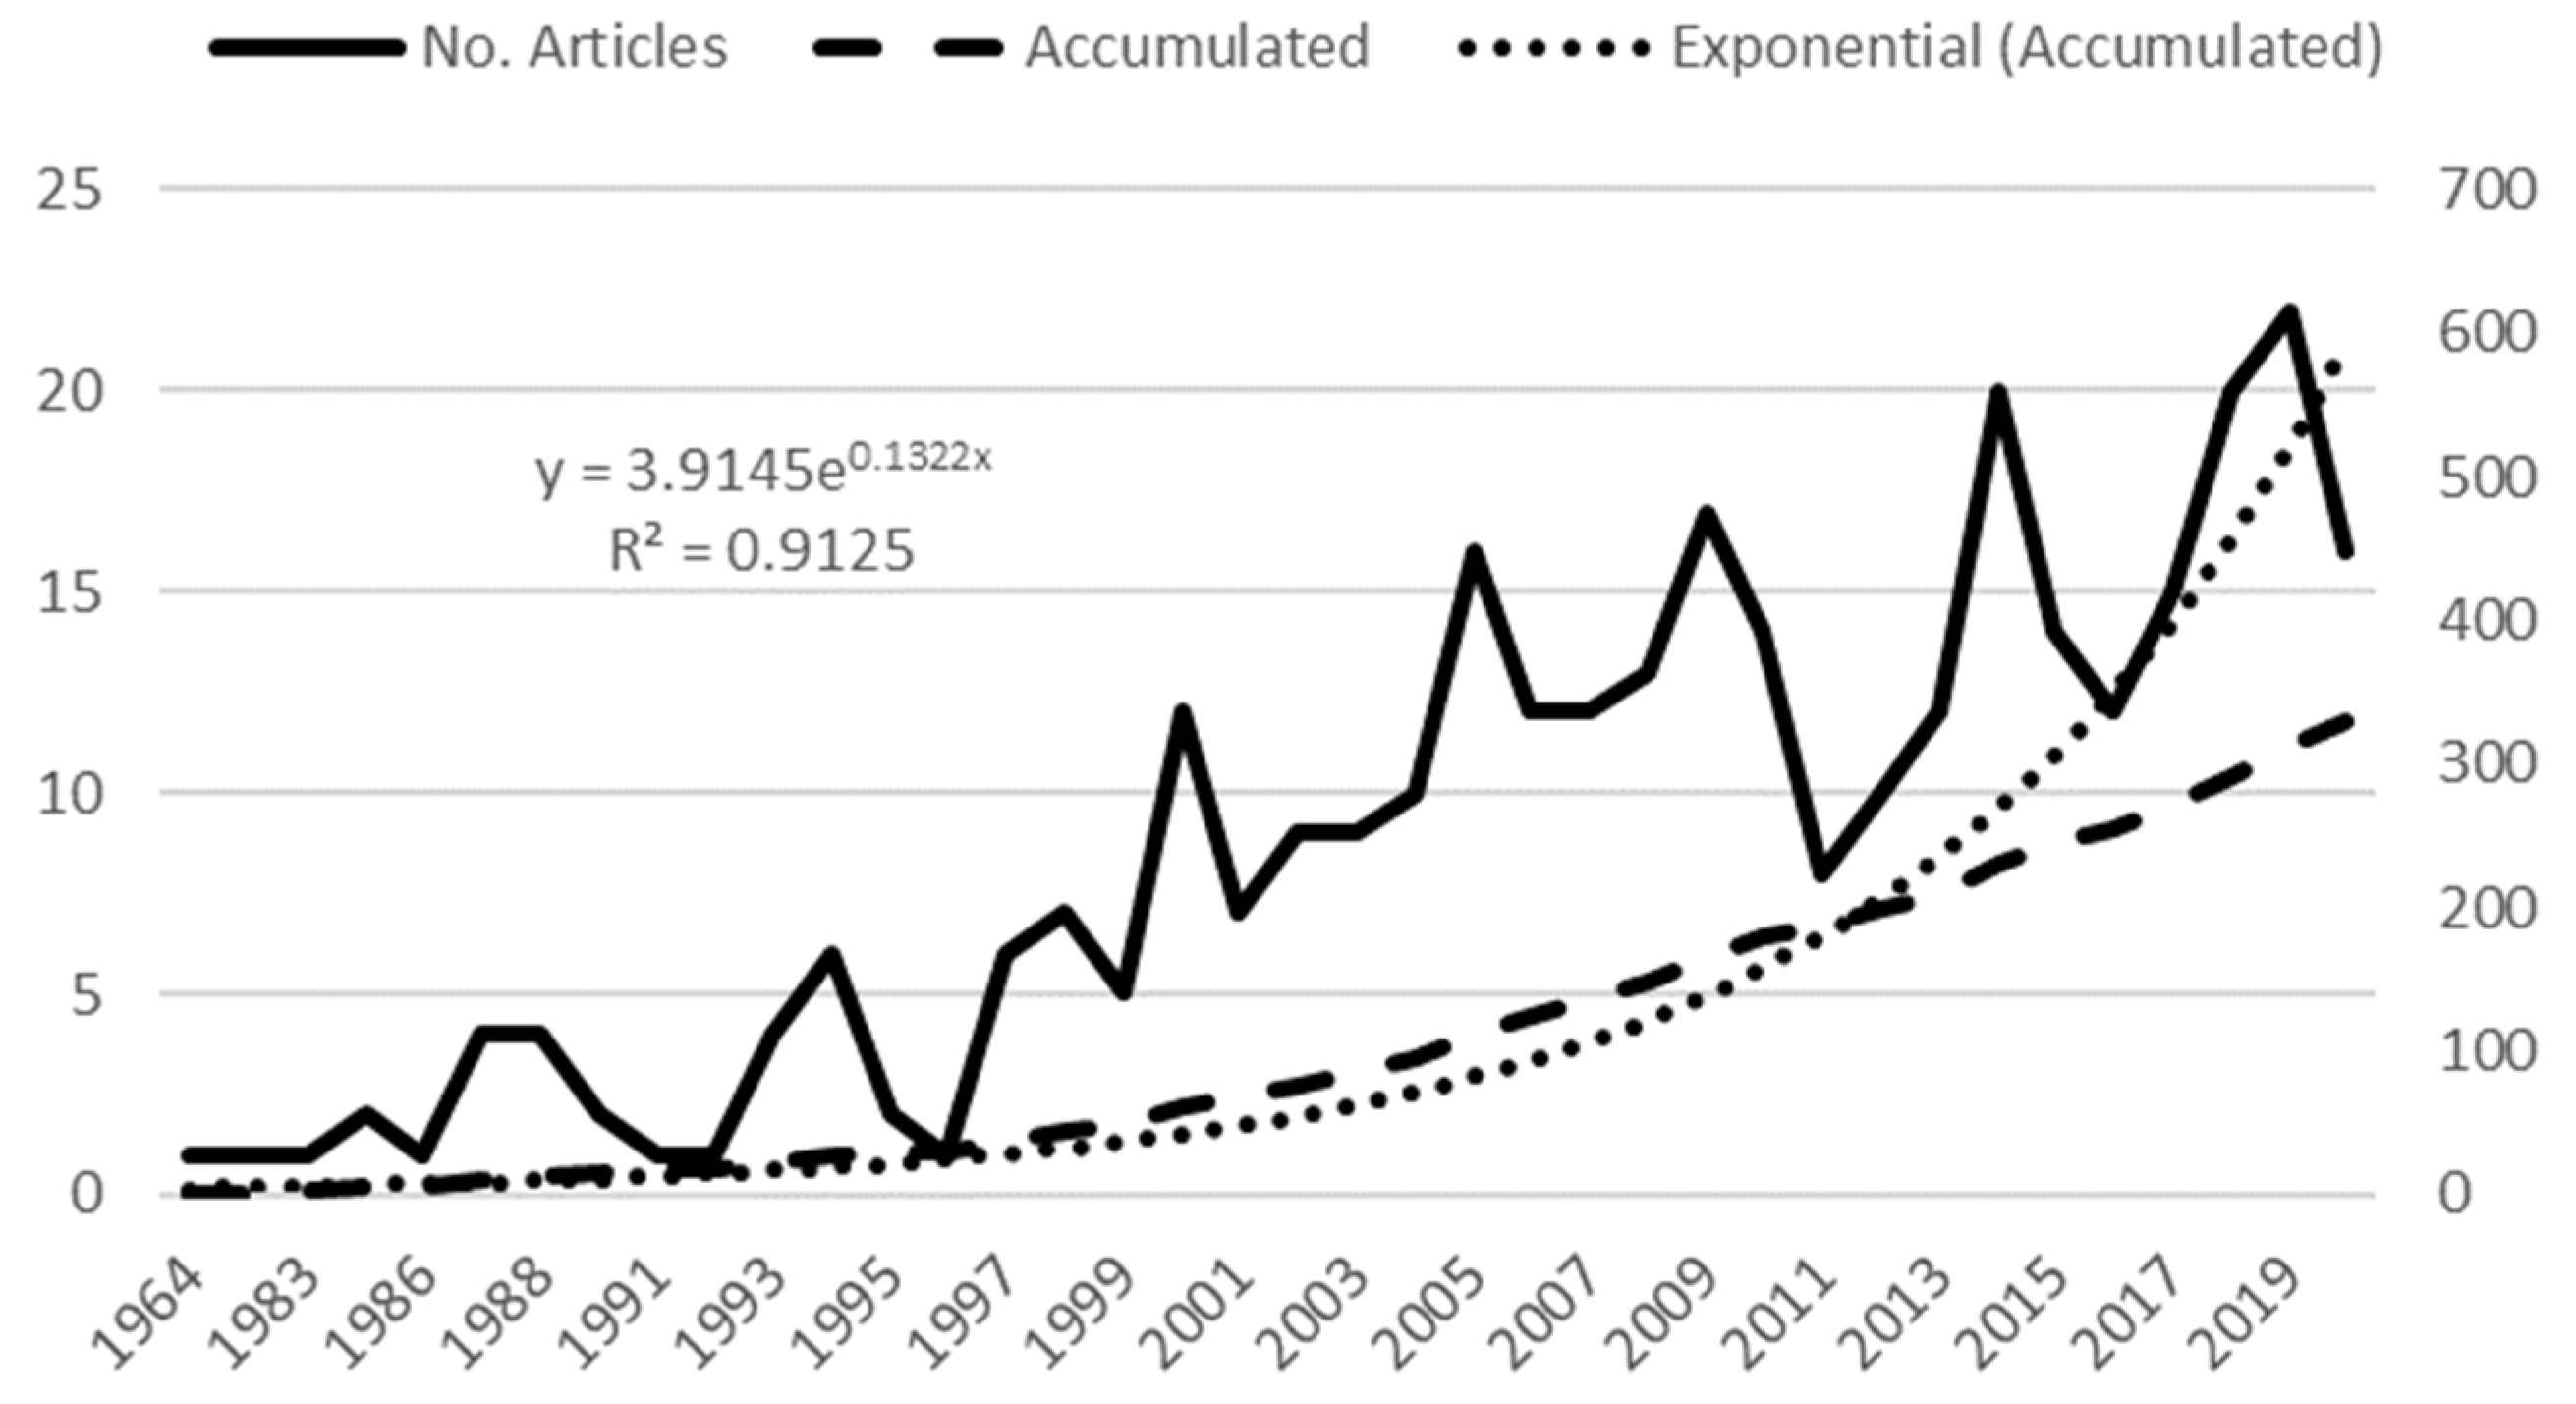
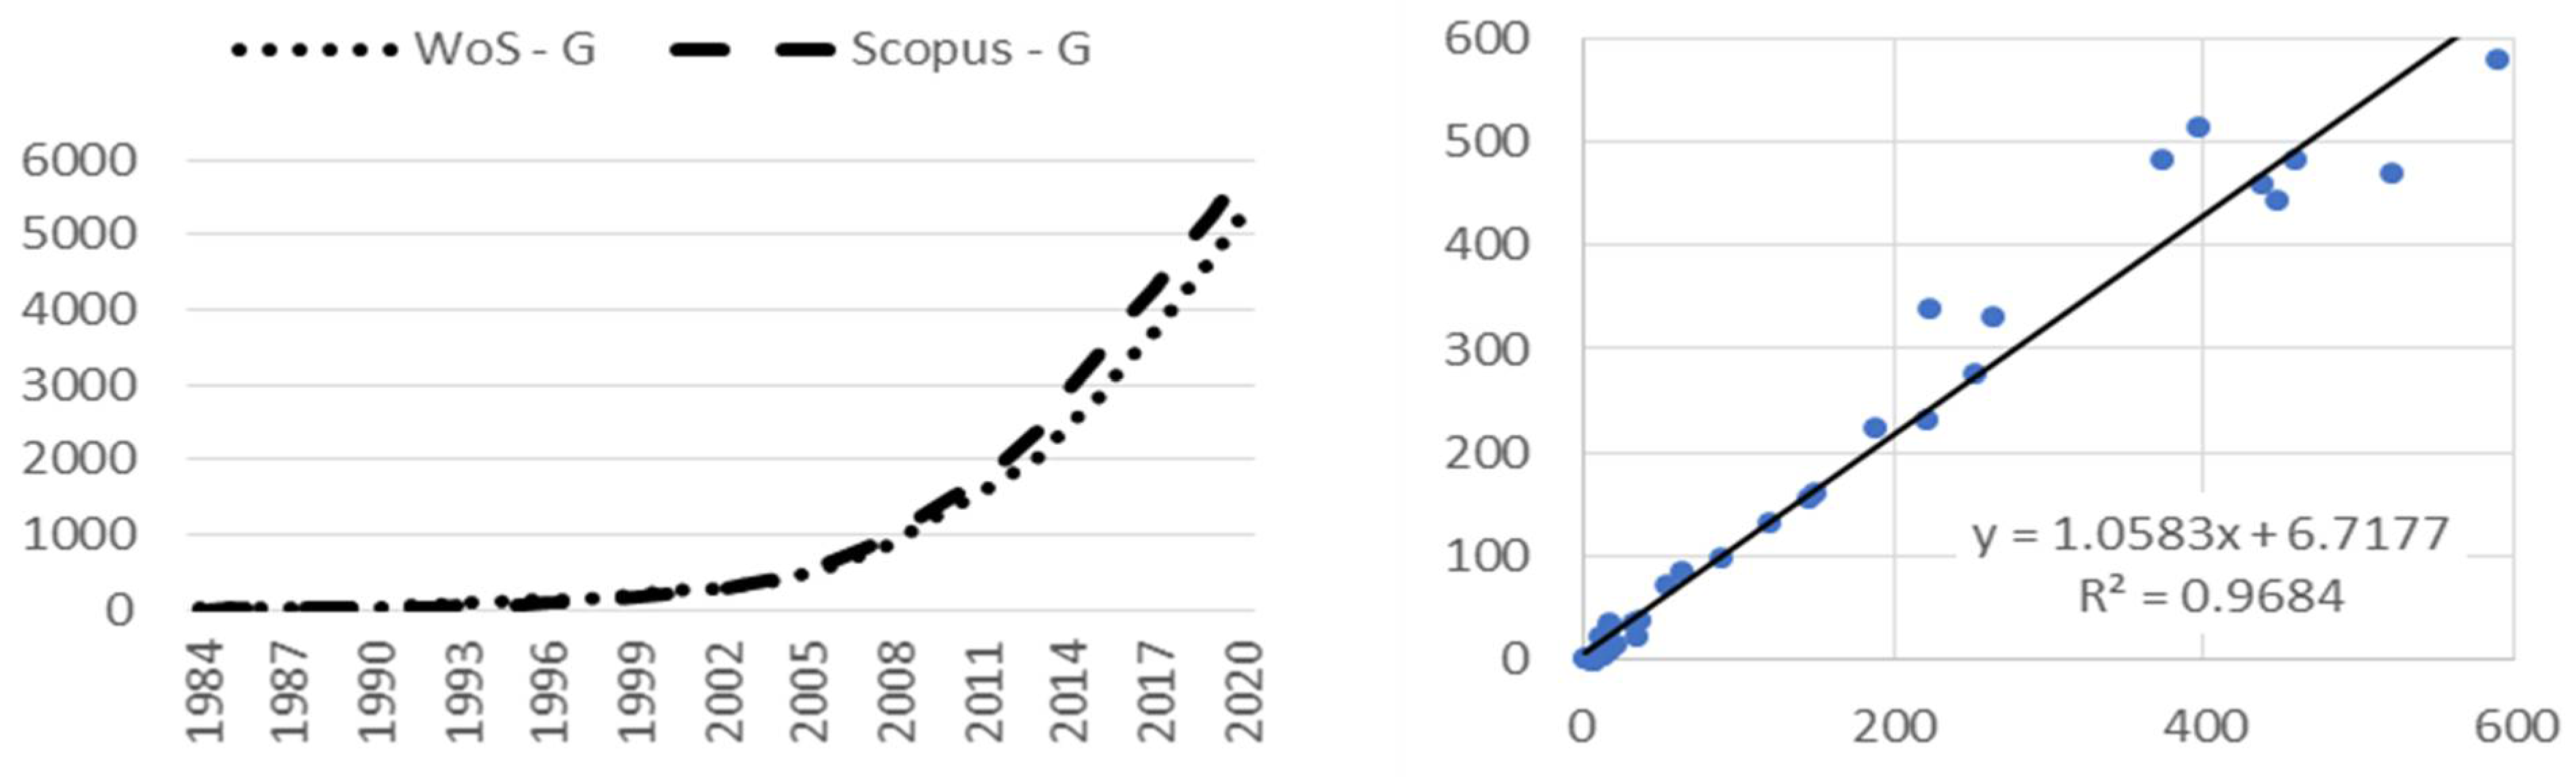
4.3. Production
- N—measured magnitude related to size,
- N0—magnitude measured at time t = 0,
- b—constant relating the growth speed to the size already acquired.
4.4. Citation Analysis
4.5. Authors
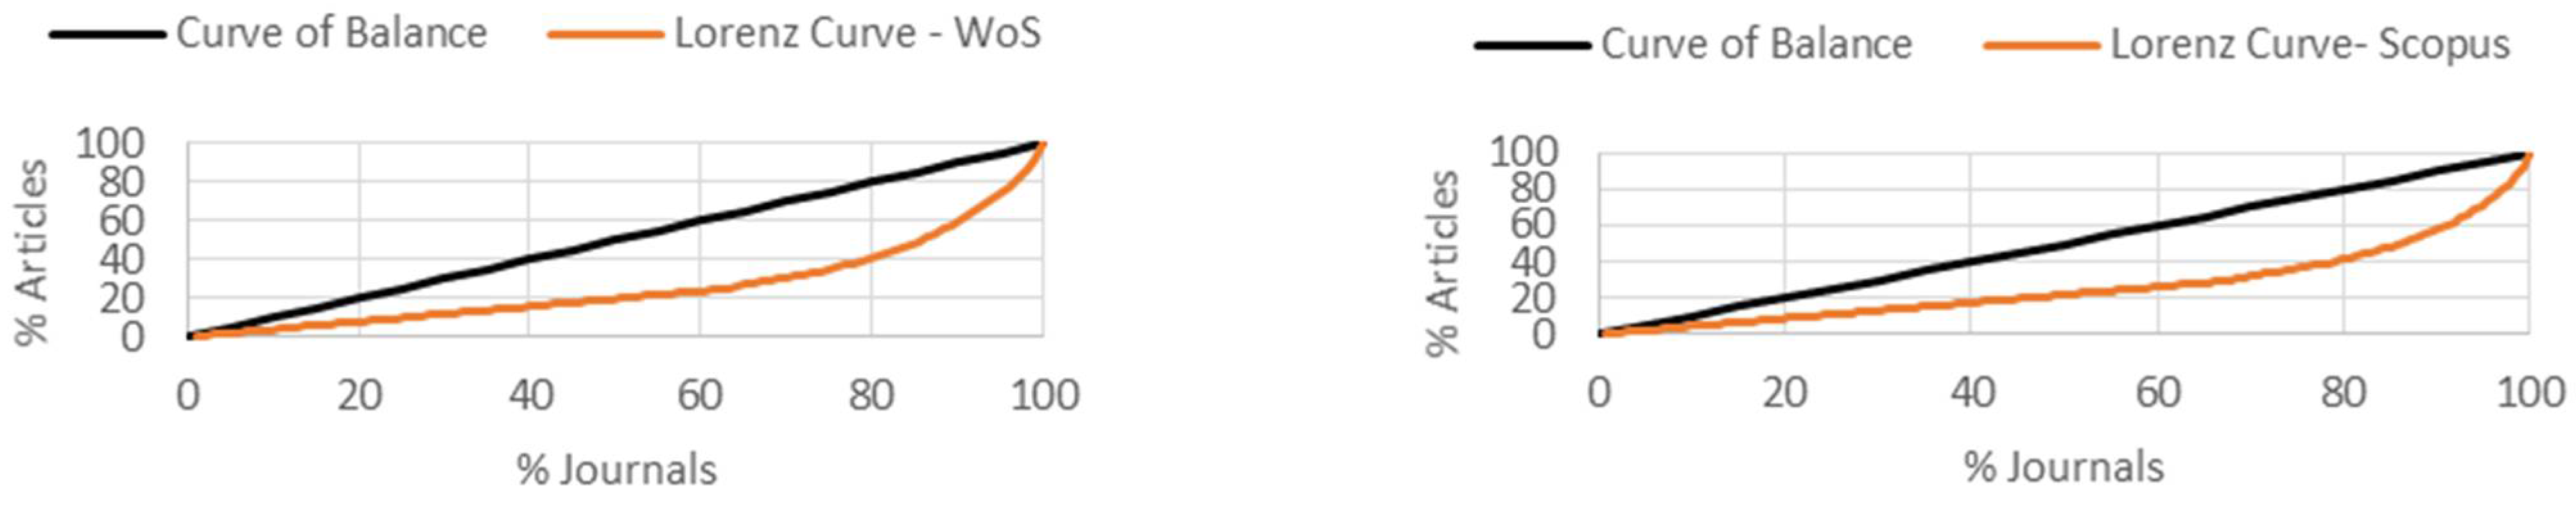
4.6. Journals
- qi = cumulative evolution of articles expressed in percentages,
- pi = cumulative evolution of journals expressed in percentages,
- = 0.4711,
- = 0.4891,
- As Ig (WoS) Ig (Scopus), and is located at the midpoint of the value.
5. Conclusions
Author Contributions
Funding
Institutional Review Board Statement
Informed Consent Statement
Data Availability Statement
Conflicts of Interest
References
- Debaere, P.; Richter, B.D.; Davis, K.F.; Duvall, M.S.; Gephart, J.A.; O’Bannon, C.E.; Pelnikd, C.; Powell, E.M.; Smith, T.W. Water markets as a response to scarcity. Water Policy 2014, 16, 625–649. [Google Scholar] [CrossRef]
- Richter, B. Chasing Water: A Guide for Moving from Scarcity to Sustainability; Island Press: Washington, DC, USA, 2014. [Google Scholar]
- International Water Management Institute (IWMI). Water for Food, Water for Life: A Comprehensive Assessment of Water Management in Agriculture; Earthscan: London, UK; International Water Management Institute: Colombo, Sri Lanka, 2007. [Google Scholar]
- United Nations Managing Water under Uncertainty and Risk. World Water Development Report, 4th ed.; UNESCO: Paris, France, 2012. [Google Scholar]
- Delorit, J.D.; Block, P.J. Promoting competitive water resource use efficiency at the water-market scale: An intercooperative demand equilibrium-based approach to water trading. Water Resour. Res. 2018, 54, 5394–5421. [Google Scholar] [CrossRef]
- Garrick, D.; Siebentritt, M.; Aylward, B.; Bauer, C.; Purkey, A. Water markets and freshwater ecosystem services: Policy reform and implementation in the Columbia and Murray–Darling Basins. Ecol. Econ. 2009, 69, 366–379. [Google Scholar] [CrossRef]
- Johansson, R.C.; Tsur, Y.; Roe, T.L.; Doukkali, R.; Dinar, A. Pricing irrigation water: A review of theory and practice. Water Policy 2002, 4, 173–199. [Google Scholar] [CrossRef]
- Scott, A.; Coustalin, G. The evolution of water rights. Nat. Resour. J. 1995, 35, 821–979. [Google Scholar]
- Leonard, B.; Costello, C.; Libecap, G.D. Expanding water markets in the western United States: Barriers and lessons from other natural resource markets. Rev. Environ. Econ. Policy 2019, 13, 43–61. [Google Scholar] [CrossRef]
- Bitran, E.; Rivera, P.; Villena, M.J. Water management problems in the Copiapó Basin. Chile: Markets, severe scarcity and the regulator. Water Policy 2014, 16, 844–863. [Google Scholar] [CrossRef]
- Seidl, C.; Wheeler, S.A.; Zuo, A. Treating water markets like stock markets: Key water market reform lessons in the Murray-Darling Basin. J. Hydrol. 2020, 581, 124399. [Google Scholar] [CrossRef]
- Gómez, C.M.G.; Pérez-Blanco, C.D.; Adamson, D.; Loch, A. Managing water scarcity at a river basin scale with economic instruments. Water Econ. Policy 2018, 4, 1750004. [Google Scholar] [CrossRef]
- Chong, H.; Sunding, D. Water markets and trading. Annu. Rev. Environ. Resour. 2006, 31, 239–264. [Google Scholar] [CrossRef]
- Vaux, H.J., Jr.; Howitt, R.E. Managing water scarcity: An evaluation of interregional transfers. Water Resour. Res. 1984, 20, 785–792. [Google Scholar] [CrossRef]
- Sunding, D. The price of water: Market-based strategies are needed to cope with scarcity. Calif. Agric. 2000, 54, 56–63. [Google Scholar] [CrossRef][Green Version]
- Grafton, R.Q.; Libecap, G.M.; Landry, C.; O’Brien, B. An integrated assessment of water markets: A cross-country comparison. Rev. Environ. Econ. Policy 2011, 5, 219–239. [Google Scholar] [CrossRef]
- Tranfield, D.; Denyer, D.; Smart, P. Towards a methodology for developing evidence-informed management knowledge by means of systematic review. Br. J. Manag. 2006, 14, 207–222. [Google Scholar] [CrossRef]
- Fahimnia, B.; Sarkis, J.; Davarzani, H. Green supply chain management: A review and bibliometric analysis. Int. J. Prod. Econ. 2015, 162, 101–114. [Google Scholar] [CrossRef]
- Bornmann, L.; Mutz, R. Growth rates of modern science: A bibliometric analysis based on the number of publications and cited references. J. Assoc. Inf. Sci. Technol. 2015, 66, 2215–2222. [Google Scholar] [CrossRef]
- Hall, C.M. Publish and perish? Bibliometric analysis, journal ranking and the assessment of research quality in tourism. Tour. Manag. 2011, 32, 16–27. [Google Scholar] [CrossRef]
- Cobo, M.J.; López-Herrera, A.G.; Herrera-Viedma, E.; Herrera, F. Science mapping software tools: Review, analysis, and cooperative study among tools. J. Am. Soc. Inf. Sci. Technol. 2011, 62, 1382–1402. [Google Scholar] [CrossRef]
- Randall, A. Property entitlements and pricing policies for a maturing water economy. Aust. J. Agric. Econ. 1981, 25, 195–220. [Google Scholar] [CrossRef]
- Backeberg, G. Water institutions, markets and decentralised resource management: Prospects for innovative policy reforms in irrigated agriculture. Agrekon 1997, 36, 350–384. [Google Scholar] [CrossRef]
- Anderson, T.L.; Leal, D.R. Free market versus political environmentalism. Harv. J. Law Public Policy 1992, 15, 297–310. [Google Scholar]
- Artero, C.N. La construcción social de los mercados de agua en Chile: Un enfoque desde la geografía legal. Rev. Geogr. Norte Gd. 2021, 79, 163–182. [Google Scholar] [CrossRef]
- Molle, F. Defining water rights: By prescription or negotiation? Water Policy 2004, 6, 207–227. [Google Scholar] [CrossRef]
- Mukherji, A. The energy-irrigation nexus and its impact on groundwater markets in eastern Indo-Gangetic basin: Evidence from West Bengal, India. Energy Policy 2007, 35, 6413–6430. [Google Scholar] [CrossRef]
- Wheeler, S.A.; Loch, A.; Crase, L.; Young, M.; Grafton, R.Q. Developing a water market readiness assessment framework. J. Hydrol. 2017, 552, 807–820. [Google Scholar] [CrossRef]
- Rosegrant, M.; Gazmuri, R. Reforming Water Allocation Policy Through Markets in Tradable Water Rights: Lessons from Chile, Mexico, and California; Environment and Production Technology Division, International Food Policy Research Institute: Washington, DC, USA, 1994. [Google Scholar]
- Petterini, F.C. The possibility of a water market in Brazil. Economia 2018, 19, 187–200. [Google Scholar] [CrossRef]
- Anderson, T.L.; Hill, P.J. The evolution of property rights: A study of the American West. J. Law Econ. 1975, 18, 163–179. [Google Scholar] [CrossRef]
- Howe, C.W.; Schurmeier, D.R.; Shaw, W.D., Jr. Innovative approaches to water allocation: The potential for water markets. Water Resour. Res. 1986, 22, 439–445. [Google Scholar] [CrossRef]
- Bjornlund, H. Efficient water market mechanisms to cope with water scarcity. Water Resour. Dev. 2003, 19, 553–567. [Google Scholar] [CrossRef]
- Howitt, R.E. Empirical analysis of water market institutions: The 1991 California water market. Resour. Energy Econ. 1994, 16, 357–371. [Google Scholar] [CrossRef]
- Grafton, R.Q.; Libecap, G.D.; Edwards, E.C.; O’Brien, R.J.; Landry, C. Comparative assessment of water markets: Insights from the Murray–Darling Basin of Australia and the Western USA. Water Policy 2012, 14, 175–193. [Google Scholar] [CrossRef]
- North, D.C. Institutions. J. Econ. 1991, 5, 97–112. [Google Scholar] [CrossRef]
- Endo, T.; Kakinuma, K.; Yoshikawa, S.; Kanae, S. Are water markets globally applicable? Environ. Res. Lett. 2018, 13, 034032. [Google Scholar] [CrossRef]
- Gray, B.E. A primer on California water transfer. Ariz. Law Rev. 1989, 31, 745–781. [Google Scholar]
- Grafton, R.Q.; Horne, J.; Wheeler, S.A. On the marketisation of water: Evidence from the Murray-Darling Basin, Australia. Water Resour. Manag. 2016, 30, 913–926. [Google Scholar] [CrossRef]
- Manjunatha, A.V.; Aravindakshan, S.; Babu, A.T.S.; Mal, P. Impact of informal groundwater markets on efficiency of irrigated farms in India: A bootstrap data envelopment analysis approach. Irrig. Sci. 2016, 34, 41–52. [Google Scholar]
- Rissman, A.R.; Kohl, P.A.; Wardropper, C.B. Public support for carrot, stick, and no-government water quality policies. Environ. Sci. Policy 2017, 76, 82–89. [Google Scholar] [CrossRef]
- Mellah, T. Effectiveness of the water resources allocation institution in Tunisia. Water Policy 2018, 20, 429–445. [Google Scholar] [CrossRef]
- Loch, A.; Wheeler, S.A.; Settre, C. Private transaction costs of water trade in the Murray–Darling Basin. Ecol. Econ. 2018, 146, 560–573. [Google Scholar] [CrossRef]
- Juana, J.S.; Strzepek, K.M.; Kirsten, J.F. Market efficiency and welfare effects of inter-sectoral water allocation in South Africa. Water Policy 2011, 13, 220–231. [Google Scholar] [CrossRef]
- Lanna, A.E.L.; Braga, B. Hidroeconomia. In Águas Doces no Brasil: Capital Ecológico, Uso e Conservação, 3rd ed.; Rebouças, A.C., Braga, B., Tundisi, J.G., Eds.; Escrituras: São Paulo, Brazil, 2006; pp. 607–637. [Google Scholar]
- Garrick, D.; Whitten, S.M.; Coggan, A. Understanding the evolution and performance of water markets and allocation policy: A transaction costs analysis framework. Ecol. Econ. 2013, 88, 195–205. [Google Scholar] [CrossRef]
- Esteban, E.; Dinar, A.; Albiac, J.; Calera, A.; García-Mollá, M.; Avellá, L. Interest group perceptions on water policy reforms: Insight from a water-stressed basin. Water Policy 2018, 20, 794–810. [Google Scholar] [CrossRef]
- Skurray, J.H.; Roberts, E.J.; Pannell, D.J. Hydrological challenges to groundwater trading: Lessons from south-west Western Australia. J. Hydrol. 2012, 412, 256–268. [Google Scholar] [CrossRef]
- Summitt, A.R. Marketing the Colorado River: Water allocations in the American Southwest. Water Hist. 2011, 3, 45–62. [Google Scholar] [CrossRef]
- Bakker, K. The business of water: Market environmentalism in the water sector. Annu. Rev. Environ. Resour. 2014, 39, 469–494. [Google Scholar] [CrossRef]
- Kahil, M.T.; Albiac, J.; Dinar, A.; Calvo, E.; Esteban, E.; Avella, L.; Garcia-Molla, M. Improving the performance of water policies: Evidence from drought in Spain. Water 2016, 8, 34. [Google Scholar] [CrossRef]
- Young, R.A.; Haveman, R.H. Economics of water resources: A survey. In Handbook of Natural Resource and Energy Economics; Elsevier: Amsterdam, The Netherlands, 1985; Volume 2, pp. 465–529. [Google Scholar]
- Colby, B.G.; Crandall, K.; Bush, D.B. Water right transactions: Market values and price dispersion. Water Resour. Res. 1993, 29, 1565–1572. [Google Scholar] [CrossRef]
- Cummings, R.G.; Nercissiantz, V. The use of water pricing as a means for enhancing water use efficiency in irrigation: Case studies in Mexico and the United States. Nat. Resour. J. 1992, 32, 731. [Google Scholar]
- Broadus, R.N. Toward a definition of “bibliometrics”. Scientometrics 1987, 12, 373–379. [Google Scholar] [CrossRef]
- Merigó, J.M.; Gil-Lafuente, A.M.; Yager, R.R. An overview of fuzzy research with bibliometric indicators. Appl. Soft Comput. 2014, 27, 420–433. [Google Scholar] [CrossRef]
- Boyack, K.W.; Klavans, R.; Börner, K. Mapping the backbone of science. Scientometrics 2005, 64, 351–374. [Google Scholar] [CrossRef]
- Zupic, I.; Čater, T. Bibliometric methods in management and organization. Organ. Res. Methods 2015, 18, 429–472. [Google Scholar] [CrossRef]
- Rowley, J.; Slack, F. Conducting a literature review. Manag. Res. News 2004, 27, 31–39. [Google Scholar] [CrossRef]
- Donthu, N.; Kumar, S.; Mukherjee, D.; Pandey, N.; Lim, W.M. How to conduct a bibliometric analysis: An overview and guidelines. J. Bus. Res. 2021, 133, 285–296. [Google Scholar] [CrossRef]
- Norris, M.; Oppenheim, C. Comparing alternatives to the Web of Science for coverage of the social sciences’ literature. J. Infometrics 2007, 1, 161–169. [Google Scholar] [CrossRef]
- Álvarez-García, J.; Durán-Sánchez, A.; del Río-Rama, M.; García-Vélez, D. Active ageing: Mapping of scientific coverage. Int. J. Environ. Res. Public Health 2018, 15, 2727. [Google Scholar] [CrossRef]
- Meho, L.I.; Rogers, Y. Citation counting, citation ranking, and h-index of human-computer interaction researchers: A comparison of Scopus and Web of Science. J. Am. Society Inf. Sci. Technol. 2008, 59, 1711–1726. [Google Scholar] [CrossRef]
- Corral, J.A.; Canoves, G. La investigación turística publicada en revistas turísticas y no turísticas: Análisis bibliométrico de la producción de las universidades catalanas. Cuad. Tur. 2013, 31, 55–81. [Google Scholar]
- Gluck, M. A review of journal coverage overlap with an extension to the definition of overlap. J. Am. Soc. Inf. Sci. 1990, 41, 43–60. [Google Scholar] [CrossRef]
- Bearman, T.C.; Kunberger, W.A. A Study of Coverage Overlap among Fourteen Major Science and Technology Abstracting and Indexing Services; National Federation of Abstracting and Indexing Services: Philadelphia, PA, USA, 1977. [Google Scholar]
- Meyer, D.E.; Mehlman, D.W.; Reeves, E.S.; Origoni, R.B.; Evans, D.; Sellers, D.W. Comparison study of overlap among 21 scientific databases in searching pesticide information. Online Rev. 1983, 7, 33–43. [Google Scholar] [CrossRef]
- Price, D.J.S. The exponential curve of science. Discovery 1956, 17, 240–243. [Google Scholar]
- Merigó, J.M.; Mas-Tur, A.; Roig-Tierno, N.; Ribeiro-Soriano, D. A bibliometric overview of the Journal of Business Research between 1973 and 2014. J. Bus. Res. 2015, 68, 2645–2653. [Google Scholar] [CrossRef]
- Bauer, C.J. Bringing water markets down to earth: The political economy of water rights in Chile, 1976–1995. World Dev. 1997, 25, 639–656. [Google Scholar] [CrossRef]
- Wheeler, S.; Loch, A.; Zuo, A.; Bjornlund, H. Reviewing the adoption and impact of water markets in the Murray–Darling Basin, Australia. J. Hydrol. 2014, 518, 28–41. [Google Scholar] [CrossRef]
- Hearne, R.R.; Easter, K.W. The economic and financial gains from water markets in Chile. Agric. Econ. 1997, 15, 187–199. [Google Scholar] [CrossRef]
- Luo, B.; Maqsood, I.; Yin, Y.Y.; Huang, G.H.; Cohen, S.J. Adaption to Climate Change through Water Trading under Uncertainty- An Inexact Two-Stage Nonlinear Programming Approach. J. Environ. Inform. 2003, 2, 58–68. [Google Scholar] [CrossRef]
- Islam, M.D.; Oki, T.; Kanae, S.; Hanasaki, N.; Agata, Y.; Yoshimura, K. A grid-based assessment of global water scarcity including virtual water trading. Water Resour. Manag. 2007, 21, 19–33. [Google Scholar] [CrossRef]
- Bjornlund, H.; McKay, J. Aspects of water markets for developing countries: Experiences from Australia, Chile, and the US. Environ. Dev. Econ. 2002, 7, 769–795. [Google Scholar] [CrossRef]
- Brewer, J.; Glennon, R.; Ker, A.; Libecap, G. 2006 Presidential address water markets in the West: Prices, trading, and contractual forms. Econ. Inq. 2008, 46, 91–112. [Google Scholar] [CrossRef]
- Weinberg, M.; Kling, C.L.; Wilen, J.E. Water markets and water quality. Am. J. Agric. Econ. 1993, 75, 278–291. [Google Scholar] [CrossRef]
- Lotka, A.J. The frequency distribution of scientific productivity. J. Wash. Acad. Sci. 1926, 16, 317–323. [Google Scholar]
- Bradford, S.C. Sources of information on specific subjects. Engineering 1934, 137, 85–86. [Google Scholar]
- Durán-Sánchez, A.; Álvarez-García, J.; González-Vázquez, E.; Del Río-Rama, M.C. Wastewater management: Bibliometric analysis of scientific literature. Water 2020, 12, 2963. [Google Scholar] [CrossRef]


| Search Word | “Water Market” OR “Water Trading” |
| Category | Title |
| Subject area | ALL |
| Document type | Journal article or review articles |
| Period time | Year of publication ≤ 2020 |
| Language | English |
| Query String | WoS: (Main Collection) TÍTULO: (“Water Market” OR “Water Markets” OR “Water Trading”) Refined by: [excluding] YEARS OF PUBLICATION: (> 2020) AND TYPES OF DOCUMENTS: (ARTICLE AND REVIEW ARTICLE) AND LANGUAGES: (ENGLISH) Scopus: TITLE (“Water Market” OR “Water Markets” OR “Water Trading”) AND PUBYEAR < 2021 AND (LIMIT-TO (DOCTYPE, “ar”) OR LIMIT-TO (DOCTYPE, “re”) OR LIMIT TO (LANGUAJE, “English”)) |
| Search Date | September 2021 |
| Open Access Type | Descriptions | |
|---|---|---|
| Gold | Gold | “Identified as having a Creative Commons (CC) license by OurResearch Unpaywall Database. All articles in these journals must have a license in accordance with the Budapest Open Access Initiative to be called Gold.” |
| Hybrid | “Items identified as having a Creative Commons (CC) license by OurResearch but that are not in journals where all content is Gold. Hybrid Gold open access status is at varying levels of completeness, especially for newly published articles.” | |
| Free to Read | “The licensing for these articles is either unclear or identified by OurResearch as non-CC license articles. These are free-to-read or public access articles located on a publisher’s site. A publisher may, as a promotion, grant free access to an article for a limited time. At the end of the promotional period, access to the article may require a fee, which can lead to temporary errors in our data. You may find content that is incomplete, especially new content.” | |
| Green | Published | “Final published versions of articles hosted on an institutional or subject-based repository.” |
| Accepted | “Accepted manuscripts hosted on a repository. Content is peer reviewed and final, but may not have been through the publisher’s copy-editing or typesetting.” | |
| Submitted | “Original manuscripts submitted for publication, but that have not been through a peer review process.” | |
| WoS | Frequency (Number of Articles Published) | Relative Frequency (of 261) |
|---|---|---|
| All Open Access | 76 | 28.74% |
| Gold | 17 | 6.51% |
| Gold-Hybrid | 9 | 3.45% |
| Free to Read | 23 | 9.20% |
| Green Published | 24 | 8.81% |
| Green Accepted | 5 | 1.92% |
| Green Submitted | 28 | 10.73% |
| Scopus Filter | Information Lebel | Definition | |
|---|---|---|---|
| Gold | Gold | OA-only journal | “Published version with Creative Commons license, available on publisher platform. Documents are in journals which only publish open access.” |
| Gold Hybrid | Hybrid journal | “Published version with Creative Commons license, available on publisher platform. Documents are in journals which provide authors the choice of publishing open access.” | |
| Bronze | Other free-to-read from publisher | “Published version of record or manuscript accepted for publication, for which the publisher has chosen to provide temporary or permanent free access. Bronze status is assigned to a document if there is another (publisher-specific) license other than a Creative Commons license (e.g., Elsevier’s publisher license for Open Archive), or no license at all.” | |
| Green | Free-to-read from repository | “Published version or manuscript accepted for publication, available at repository. Documents may also be available gold or other free-to-read on the publisher platform.” | |
| Scopus | Frequency (Number of Articles Published) | Relative Frequency (of 305) |
|---|---|---|
| All Open Access | 82 | 26.23% |
| Gold | 17 | 5.57% |
| Gold-Hybrid | 9 | 2.95% |
| Bronze | 23 | 7.87% |
| Green | 54 | 17.38% |
| Year | WoS | Scopus | ||||||||||||||||||
|---|---|---|---|---|---|---|---|---|---|---|---|---|---|---|---|---|---|---|---|---|
| fi | %hi | Fi | %Hi | C | ∑C | h-ind | OP | %OP | fi | %hi | Fi | %Hi | C | ∑C | h-ind | OA | %OA | |||
| 1969 | 1 | 0.4 | 1 | 0.4 | 0 | 0 | 0.0 | 0 | 0 | 0.0 | - | - | - | - | - | - | - | - | - | - |
| 1975 | 1 | 0.4 | 2 | 0.8 | 0 | 0 | 0.0 | 0 | 0 | 0.0 | - | - | - | - | - | - | - | - | - | - |
| 1983 | 1 | 0.4 | 3 | 1.1 | 23 | 23 | 23.0 | 1 | 0 | 0.0 | 1 | 0.33 | 1 | 0.33 | 24 | 24 | 24.0 | 1 | 0 | 0.0 |
| 1985 | 2 | 0.8 | 5 | 1.9 | 18 | 41 | 9.0 | 2 | 0 | 0.0 | 2 | 0.66 | 3 | 0.98 | 16 | 40 | 8.0 | 2 | 0 | 0.0 |
| 1986 | 1 | 0.4 | 6 | 2.3 | 207 | 248 | 207.0 | 1 | 1 | 100.0 | 1 | 0.33 | 4 | 1.31 | 89 | 129 | 89.0 | 1 | 1 | 100.0 |
| 1987 | 4 | 1.5 | 10 | 3.8 | 71 | 319 | 17.8 | 1 | 0 | 0.0 | 3 | 0.98 | 7 | 2.30 | 81 | 210 | 27.0 | 3 | 0 | 0.0 |
| 1988 | 4 | 1.5 | 14 | 5.4 | 41 | 360 | 10.3 | 3 | 0 | 0.0 | 2 | 0.66 | 9 | 2.95 | 35 | 245 | 17.5 | 2 | 0 | 0.0 |
| 1989 | 2 | 0.8 | 16 | 6.1 | 77 | 437 | 38.5 | 2 | 0 | 0.0 | 2 | 0.66 | 11 | 3.61 | 86 | 331 | 43.0 | 2 | 0 | 0.0 |
| 1991 | 1 | 0.4 | 17 | 6.5 | 23 | 460 | 23.0 | 1 | 0 | 0.0 | - | - | 11 | 3.61 | - | 331 | - | - | - | - |
| 1992 | 1 | 0.4 | 18 | 6.9 | 1 | 461 | 1.0 | 1 | 0 | 0.0 | - | - | 11 | 3.61 | - | 331 | - | - | - | - |
| 1993 | 4 | 1.5 | 22 | 8.4 | 169 | 630 | 42.3 | 4 | 1 | 25.0 | 4 | 1.31 | 15 | 4.92 | 199 | 530 | 49.8 | 4 | 1 | 25.0 |
| 1994 | 5 | 1.9 | 27 | 10.3 | 142 | 772 | 28.4 | 4 | 0 | 0.0 | 6 | 1.97 | 21 | 6.89 | 205 | 735 | 34.2 | 5 | 0 | 0.0 |
| 1995 | 2 | 0.8 | 29 | 11.1 | 29 | 801 | 14.5 | 1 | 0 | 0.0 | 2 | 0.66 | 23 | 7.54 | 43 | 778 | 21.5 | 1 | 0 | 0.0 |
| 1996 | - | - | 29 | 11.1 | - | 800 | - | - | - | - | 1 | 0.33 | 24 | 7.87 | 0 | 778 | 0.0 | 0 | 0 | 0.0 |
| 1997 | 4 | 1.5 | 33 | 12.6 | 307 | 1107 | 76.8 | 4 | 1 | 25.0 | 6 | 1.97 | 30 | 9.84 | 380 | 1158 | 63.3 | 5 | 1 | 16.7 |
| 1998 | 1 | 0.4 | 34 | 13.0 | 36 | 1143 | 36.0 | 1 | 0 | 0.0 | 7 | 2.30 | 37 | 12.13 | 59 | 1217 | 8.4 | 2 | 0 | 0.0 |
| 1999 | 3 | 1.1 | 37 | 14.2 | 144 | 1287 | 48.0 | 3 | 2 | 66.7 | 5 | 1.64 | 42 | 13.77 | 153 | 1370 | 30.6 | 5 | 2 | 40.0 |
| 2000 | 8 | 3.1 | 45 | 17.2 | 172 | 1459 | 21.5 | 5 | 3 | 37.5 | 10 | 3.28 | 52 | 17.05 | 197 | 1567 | 19.7 | 5 | 5 | 50.0 |
| 2001 | 4 | 1.5 | 49 | 18.8 | 47 | 1506 | 11.8 | 2 | 0 | 0.0 | 6 | 1.97 | 58 | 19.02 | 58 | 1625 | 9.7 | 2 | 0 | 0.0 |
| 2002 | 7 | 2.7 | 56 | 21.4 | 232 | 1738 | 33.1 | 6 | 2 | 28.6 | 9 | 2.95 | 67 | 21.97 | 325 | 1950 | 36.1 | 8 | 2 | 22.2 |
| 2003 | 6 | 2.3 | 62 | 23.7 | 271 | 2009 | 45.2 | 5 | 2 | 33.3 | 8 | 2.62 | 75 | 24.59 | 244 | 2194 | 30.5 | 5 | 1 | 12.5 |
| 2004 | 8 | 3.1 | 70 | 26.8 | 246 | 2255 | 30.8 | 8 | 4 | 50.0 | 9 | 2.95 | 84 | 27.54 | 273 | 2467 | 30.3 | 8 | 4 | 44.4 |
| 2005 | 9 | 3.4 | 79 | 30.3 | 332 | 2587 | 36.9 | 9 | 1 | 11.1 | 16 | 5.25 | 100 | 32.79 | 402 | 2869 | 25.1 | 10 | 2 | 12.5 |
| 2006 | 9 | 3.4 | 88 | 33.7 | 355 | 2942 | 39.4 | 8 | 4 | 44.4 | 11 | 3.61 | 111 | 36.39 | 348 | 3217 | 31.6 | 9 | 3 | 27.3 |
| 2007 | 9 | 3.4 | 97 | 37.2 | 207 | 3149 | 23.0 | 7 | 0 | 0.0 | 12 | 3.93 | 123 | 40.33 | 220 | 3437 | 18.3 | 6 | 1 | 8.3 |
| 2008 | 9 | 3.4 | 106 | 40.6 | 241 | 3390 | 26.8 | 7 | 2 | 22.2 | 13 | 4.26 | 136 | 44.59 | 304 | 3741 | 23.4 | 8 | 4 | 30.8 |
| 2009 | 13 | 5.0 | 119 | 45.6 | 383 | 3773 | 29.5 | 10 | 2 | 15.4 | 17 | 5.57 | 153 | 50.16 | 418 | 4159 | 24.6 | 10 | 2 | 11.8 |
| 2010 | 11 | 4.2 | 130 | 49.8 | 99 | 3872 | 9.0 | 6 | 1 | 9.1 | 15 | 4.92 | 168 | 55.08 | 119 | 4278 | 7.9 | 7 | 1 | 6.7 |
| 2011 | 8 | 3.1 | 138 | 52.9 | 163 | 4035 | 20.4 | 5 | 1 | 12.5 | 8 | 2.62 | 176 | 57.70 | 199 | 4477 | 24.9 | 6 | 2 | 25.0 |
| 2012 | 6 | 2.3 | 144 | 55.2 | 113 | 4148 | 18.8 | 5 | 4 | 66.7 | 9 | 2.95 | 185 | 60.66 | 138 | 4615 | 15.3 | 6 | 5 | 55.6 |
| 2013 | 11 | 4.2 | 155 | 59.4 | 262 | 4410 | 23.8 | 8 | 2 | 18.2 | 12 | 3.93 | 197 | 64.59 | 380 | 4995 | 31.7 | 8 | 2 | 16.7 |
| 2014 | 20 | 7.7 | 175 | 67.0 | 405 | 4815 | 20.3 | 11 | 7 | 35.0 | 20 | 6.56 | 217 | 71.15 | 353 | 5348 | 17.7 | 12 | 7 | 35.0 |
| 2015 | 12 | 4.6 | 187 | 71.6 | 156 | 4971 | 13.0 | 8 | 5 | 41.7 | 14 | 4.59 | 231 | 75.74 | 165 | 5513 | 11.8 | 7 | 5 | 35.7 |
| 2016 | 11 | 4.2 | 198 | 75.9 | 81 | 5052 | 7.4 | 7 | 1 | 9.1 | 13 | 4.26 | 244 | 80.00 | 90 | 5603 | 6.9 | 6 | 1 | 7.7 |
| 2017 | 11 | 4.2 | 209 | 80.1 | 110 | 5162 | 10.0 | 6 | 8 | 72.7 | 11 | 3.61 | 255 | 83.61 | 84 | 5687 | 7.6 | 5 | 6 | 54.5 |
| 2018 | 18 | 6.9 | 227 | 87.0 | 55 | 5217 | 3.1 | 5 | 10 | 55.6 | 15 | 4.92 | 270 | 88.52 | 50 | 5737 | 3.3 | 5 | 11 | 73.3 |
| 2019 | 20 | 7.7 | 247 | 94.6 | 59 | 5276 | 3.0 | 5 | 8 | 40.0 | 20 | 6.56 | 290 | 95.08 | 59 | 5796 | 3.0 | 5 | 8 | 40.0 |
| 2020 | 14 | 5.4 | 261 | 100.0 | 36 | 5312 | 2.6 | 4 | 3 | 21.4 | 15 | 4.92 | 305 | 100.00 | 31 | 5827 | 2.1 | 3 | 3 | 20.0 |
| 261 | 100 | 5313 | 20.36 | 44 | 75 | 28.7 | 305 | 100 | 5827 | 19.11 | 46 | 80 | 26.2 | |||||||
| Author/s | Year | Age | Title | WoS | Scopus | ||||
|---|---|---|---|---|---|---|---|---|---|
| R | C | C/Age | R | C | C/Age | ||||
| Howe, C.W. Schurmeier, D.R. Shaw, W.D. [32] | 1986 | 34 | Innovative Approaches to Water Allocation: The Potential for Water Markets | 1 | 207 | 6.09 | 1 | 243 | 7.15 |
| Bauer, C.J. [70] | 1997 | 23 | Bringing Water Markets Down to Earth: The Political Economy of Water Rights in Chile, 1976–1995 | 2 | 146 | 6.35 | 2 | 182 | 7.91 |
| Grafton, R.Q. Libecap, G. McGlennon, S. Landry, C. O’Brien, B. [16] | 2011 | 9 | An Integrated Assessment of Water Markets: A Cross-Country Comparison | 3 | 112 | 12.44 | 3 | 134 | 14.89 |
| Chong, H. Sunding, D. [13] | 2006 | 14 | Water Markets and Trading | 4 | 94 | 6.71 | - | - | - |
| Garrick, D. Siebentritt, M.A. Aylward, B. Bauer, C.J. Purkey, A. [6] | 2009 | 11 | Water Markets and Freshwater Ecosystem Services: Policy Reform and Implementation in the Columbia and Murray-Darling Basins | 5 | 85 | 7.73 | 7 | 89 | 8.09 |
| Wheeler, S. Loch, A. Zuo, A. Bjornlund, H. [71] | 2013 | 7 | Reviewing the Adoption and Impact of Water Markets in the Murray-Darling Basin, Australia | 6 | 82 | 11.71 | 6 | 92 | 13.14 |
| Hearne, R.R. Easter, K.W. [72] | 1997 | 23 | The Economic and Financial Gains from Water Markets in Chile | 7 | 80 | 3.48 | 4 | 96 | 4.17 |
| Garrick, D. Whittern, S.M. Coggan, A. [46] | 2013 | 7 | Understanding the Evolution and Performance of Water Markets and Allocation Policy: A Transaction Costs Analysis Framework | 8 | 80 | 11.43 | 8 | 87 | 12.43 |
| Luo, B. Maqsood, I. Yin, Y.Y. Huang, G.H. Cohen, S.J. [73] | 2003 | 17 | Adaption to Climate Change through Water Trading under Uncertainty—An Inexact Two-Stage Nonlinear Programming Approach | 9 | 79 | 4.65 | - | - | - |
| Islam, M.S. Oki, T. Kanae, S. Hnansaki, N. Agata, Y. Yoshimura, K. [74] | 2007 | 13 | A Grid-Based Assessment of Global Water Scarcity including Virtual Water Trading | 10 | 74 | 5.69 | 15 | 80 | 6.15 |
| Bjornlund, H. McKay, J. [75] | 2002 | 18 | Aspects of Water Markets for Developing Countries: Experiences from Australia, Chile, and the US | 13 | 69 | 3.83 | 9 | 83 | 4.61 |
| Brewer, J. Glennon, R. Ker, A. Libecap, G. [76] | 2008 | 12 | 2006 Presidential Address Water Markets in the West: Prices, Trading, and Contractual Forms | 14 | 68 | 5.67 | 5 | 94 | 7.83 |
| Weinber, M. Kling, C.L. Wilen, J.E. [77] | 1993 | 27 | Water Markets and Water Quality | 15 | 68 | 2.52 | 10 | 81 | 3.00 |
| R. | Name | Affiliation | Country | Tfi | WoS | Scopus | ||||||||||
|---|---|---|---|---|---|---|---|---|---|---|---|---|---|---|---|---|
| fi | LA | SA | C | C/fi | h | fi | LA | SA | C | C/fi | h | |||||
| 1 | Bjornlund, H. | University of South Australia | Australia | 14 | 9 | 2 | 3 | 378 | 42.0 | 7 | 14 | 4 | 5 | 525 | 37.5 | 10 |
| 2 | Wheeler, S.A. | University of South Australia | Australia | 12 | 11 | 5 | 0 | 236 | 21.5 | 6 | 12 | 4 | 0 | 256 | 21.3 | 6 |
| 3 | Zuo, A. | University of Adelaide | Australia | 9 | 8 | 3 | 0 | 137 | 17.1 | 5 | 9 | 3 | 0 | 147 | 16.3 | 4 |
| 4 | Howitt, R.E. | University of California | United States | 8 | 6 | 0 | 1 | 213 | 35.5 | 6 | 8 | 1 | 2 | 277 | 34.6 | 7 |
| 5 | Garrick, D.E. | University of Oxford | United Kingdom | 7 | 7 | 3 | 0 | 243 | 34.7 | 6 | 6 | 3 | 0 | 251 | 41.8 | 5 |
| - | Huang, G.H. | North China Electric Power University | China | 7 | 7 | 0 | 0 | 170 | 24.3 | 8 | 6 | 0 | 0 | 92 | 15.3 | 5 |
| 7 | Garrido, A. | Universidad Politécnica de Madrid | Spain | 6 | 6 | 0 | 3 | 202 | 33.7 | 5 | 6 | 0 | 3 | 218 | 36.3 | 5 |
| - | Harris, E. | Monash University | Australia | 6 | 5 | 0 | 1 | 105 | 21.0 | 4 | 6 | 0 | 1 | 119 | 19.8 | 4 |
| - | Libecap, G. | University of California | United States | 6 | 4 | 0 | 2 | 235 | 58.8 | 4 | 6 | 0 | 2 | 294 | 49 | 4 |
| R. | Country | WoS | R. | Country | Scopus | ||||||||
|---|---|---|---|---|---|---|---|---|---|---|---|---|---|
| fi | hi% | C | C/fi | h | fi | hi% | C | C/fi | h | ||||
| 1 | United States | 107 | 41.00% | 2605 | 24.35 | 30 | 1 | United States | 100 | 32.79% | 2291 | 22.91 | 26 |
| 2 | Australia | 60 | 22.99% | 1640 | 27.33 | 25 | 2 | Australia | 75 | 24.59% | 1958 | 26.11 | 27 |
| 3 | China | 23 | 8.81% | 259 | 11.26 | 8 | 3 | China | 29 | 9.51% | 260 | 8.97 | 7 |
| 4 | Spain | 22 | 8.43% | 431 | 19.59 | 11 | 4 | Spain | 22 | 7.21% | 480 | 21.82 | 12 |
| 5 | United Kingdom | 15 | 5.75% | 523 | 34.87 | 9 | 5 | United Kingdom | 19 | 6.23% | 593 | 31.21 | 9 |
| 6 | Canada | 14 | 5.36% | 370 | 26.43 | 9 | 6 | Canada | 15 | 4.92% | 342 | 22.80 | 9 |
| 7 | France | 8 | 3.07% | 61 | 7.63 | 4 | 7 | South Africa | 10 | 3.28% | 164 | 16.40 | 6 |
| 8 | Germany | 5 | 1.92% | 32 | 6.40 | 2 | 8 | France | 9 | 2.95% | 60 | 6.67 | 4 |
| 9 | South Africa | 5 | 1.92% | 132 | 26.40 | 5 | 9 | Germany | 7 | 2.30% | 42 | 6.00 | 2 |
| 10 | India | 5 | 1.92% | 44 | 8.80 | 3 | 10 | India | 6 | 1.97% | 25 | 4.17 | 2 |
| Journals | WoS | Scopus | ||||||||||||
|---|---|---|---|---|---|---|---|---|---|---|---|---|---|---|
| R | fi | OA | hi% | C | h | Q | R | fi | OA | hi% | C | h | Q | |
| Water Resources Research | 1 | 25 | 13 | 9.6 | 841 | 14 | Q1 | 1 | 25 | 13 | 8.20 | 763 | 15 | Q1 |
| Water Policy | 2 | 12 | 6 | 4.6 | 154 | 6 | Q4 | 2 | 16 | 6 | 5.25 | 221 | 9 | Q2 |
| Agricultural Water Management | 3 | 12 | 2 | 4.6 | 355 | 8 | Q1 | 3 | 13 | 3 | 4.26 | 375 | 8 | Q1 |
| Water (Switzerland) | 4 | 9 | 9 | 3.4 | 92 | 5 | Q2 | 4 | 9 | 9 | 2.95 | 91 | 5 | Q1 |
| American Journal of Agricultural Economics | 5 | 8 | 3 | 3.1 | 228 | 7 | Q1 | 6 | 8 | 3 | 2.62 | 268 | 8 | Q1 |
| Australian Journal of Agricultural and Resource Economics | 6 | 8 | 8 | 3.1 | 250 | 7 | Q2 | 7 | 8 | 8 | 2.62 | 300 | 7 | Q2 |
| Water International | 7 | 8 | - | 3.1 | 85 | 4 | Q2 | 5 | 9 | - | 2.95 | 110 | 7 | Q2 |
| International Journal of Water Resources Development | 8 | 7 | 3 | 2.7 | 112 | 5 | Q1 | 8 | 7 | 3 | 2.30 | 136 | 5 | Q1 |
| Water Resources Management | 9 | 6 | 1 | 2.3 | 122 | 6 | Q2 | 9 | 6 | 1 | 1.97 | 128 | 6 | Q1 |
| Journal of the American Water Resources Association | 10 | 6 | - | 2.3 | 102 | 4 | Q2 | 10 | 6 | - | 1.97 | 120 | 5 | Q1 |
| WoS | Scopus | ||||||||||
|---|---|---|---|---|---|---|---|---|---|---|---|
| Area | fi | hi% | C | C/fi | h | Area | fi | hi% | C | C/fi | h |
| Water Resources | 129 | 0.49 | 2331 | 18.07 | 27 | Environmental Science | 213 | 0.70 | 3986 | 18.71 | 37 |
| Environmental Sciences Ecology | 110 | 0.42 | 2584 | 23.49 | 32 | Social Science | 107 | 0.35 | 1655 | 15.47 | 23 |
| Business Economics | 74 | 0.28 | 2062 | 27.86 | 30 | Economics; Econometrics and Finance | 83 | 0.27 | 2365 | 28.49 | 31 |
| Engineering | 45 | 0.17 | 660 | 14.67 | 15 | Agricultural and Biological Sciences | 64 | 0.21 | 1540 | 24.06 | 23 |
| Agriculture | 44 | 0.17 | 1191 | 27.07 | 22 | Earth and Planetary Sciences | 28 | 0.09 | 646 | 23.07 | 15 |
| Marine Freshwater Biology | 25 | 0.10 | 841 | 33.64 | 14 | Engineering | 21 | 0.07 | 239 | 11.38 | 8 |
| Geology | 16 | 0.06 | 344 | 21.50 | 10 | Business; Management and Accounting | 18 | 0.06 | 255 | 14.17 | 8 |
| Government Law | 15 | 0.06 | 165 | 11.00 | 8 | Biochemistry; Genetics and Molecular Biology | 10 | 0.03 | 92 | 9.20 | 5 |
Publisher’s Note: MDPI stays neutral with regard to jurisdictional claims in published maps and institutional affiliations. |
© 2022 by the authors. Licensee MDPI, Basel, Switzerland. This article is an open access article distributed under the terms and conditions of the Creative Commons Attribution (CC BY) license (https://creativecommons.org/licenses/by/4.0/).
Share and Cite
Durán-Sánchez, A.; del Río-Rama, M.d.l.C.; Álvarez-García, J.; Cabezas-Hernández, M.T. Water Markets: Mapping Scientific Knowledge. Water 2022, 14, 1907. https://doi.org/10.3390/w14121907
Durán-Sánchez A, del Río-Rama MdlC, Álvarez-García J, Cabezas-Hernández MT. Water Markets: Mapping Scientific Knowledge. Water. 2022; 14(12):1907. https://doi.org/10.3390/w14121907
Chicago/Turabian StyleDurán-Sánchez, Amador, María de la Cruz del Río-Rama, José Álvarez-García, and Mᵃ Teresa Cabezas-Hernández. 2022. "Water Markets: Mapping Scientific Knowledge" Water 14, no. 12: 1907. https://doi.org/10.3390/w14121907
APA StyleDurán-Sánchez, A., del Río-Rama, M. d. l. C., Álvarez-García, J., & Cabezas-Hernández, M. T. (2022). Water Markets: Mapping Scientific Knowledge. Water, 14(12), 1907. https://doi.org/10.3390/w14121907