Article

Water Reservoirs as a Driver of Anthropogenic Changes in Landscape and Transport Networks: The Czech Republic Experience

1
Silva Tarouca Research Institute for Landscape and Ornamental Gardening, Lidická 25/27, 60200 Brno, Czech Republic
2
Transport Research Centre (CDV), Líšeňská 33a, 63600 Brno, Czech Republic
3
Department of Ecology and Environmental Science, Faculty of Natural Sciences and Informatics, Constantine the Philosopher University in Nitra, Tr. A. Hlinku 1, 94974 Nitra, Slovakia
4
Department of Geography, Faculty of Science, Palacky University Olomouc, 17. Listopadu 2, 77146 Olomouc, Czech Republic
*
Author to whom correspondence should be addressed.
Water 2022, 14(12), 1870; https://doi.org/10.3390/w14121870
Submission received: 28 February 2022 / Revised: 25 May 2022 / Accepted: 7 June 2022 / Published: 10 June 2022

Abstract

:
The construction of reservoirs has a major impact on the floodplain landscape, and their existence also affects land use in the hinterland. The aim of this article is to evaluate the influence of artificial lakes on changes in landscape use and transport networks; in this context, an assessment is provided of the significance of this anthropogenic activity as one of the drivers of landscape change. Old topographic maps and archival aerial photographs are used to analyze changes in the use of landscape and road networks, and these materials are complemented with the latest geographic data in digital form. Utilizing geographic information systems, we assessed the landscape changes and processes in the hinterland of those Czech Republic reservoirs that have an area of 100 ha or more. The results of the research show that landscape change processes are more intensive in the hinterland of the lakes than in the surrounding landscape. The predominant utility function of a reservoir emerged as a key factor in landscape use changes and ongoing processes. A different landscape use scenario can be observed in drinking water reservoirs, especially regarding the leisure and irrigation functions that dominate elsewhere. After the completion of reservoirs, the road and railway networks had an impact on, above all, the connection of the nearest villages in the hinterland of the lakes. The information that we found can be employed in projecting future changes in land use and road networks at newly planned dams.

1. Introduction

Landscapes are dynamic systems that undergo continuous changes over time. Although some of this dynamism originates from natural processes, the human society has been the most influential factor, with the intensity of the anthropogenic changes graduating since the mid-20th century [1,2,3]; by extension, the history of the site has played a major role too [4,5]. Historically, humans used landscape for agriculture and built settlements to connect them with linear transport infrastructures. Other anthropogenic activities that contributed significantly to landscape changes are the extraction of minerals and raw materials, the growth of heavy industry, and the exploitation of its energy potential [6,7].
The continuous supply of water to a company cannot be ensured without accumulation in reservoirs. Human-made rivers, dams, and reservoirs have increasingly been constructed to modify free-flowing rivers to benefit society through hydropower generation, irrigation, other water supplies, navigation, and flood prevention [8]. Dams and reservoirs play an important role in controlling and managing water resources. The water–energy–food (WEF) concept also comprises various options to build artificial lakes. Considering WEF nexus relationships would have been unavoidable as humans first sought to produce food in naturally arid and semi-arid zones, sites lacking water during the growing season, and locations subject to sporadic drought and flooding [9].
Information on the world’s largest operating reservoirs is provided by the Global Reservoir Surface Area Dataset and the Global Reservoir and Dam Database [10]. Mitigating floods, securing water supply, and providing hydropower undoubtedly benefit the society in many ways and allows improving human health, expanding food production, and ensure economic growth. The irrigation water that is made available by large dams, for instance, has been estimated to directly facilitate 12–16% of global food production [11].
Water storage in reservoirs has a major impact on land-use change and brings large-scale social effects [12,13,14]. When reservoirs are built, various types of land use vanish; in this context, the most socially significant and sensitive processes are the loss of settlements or individual residential and industrial buildings along watercourses [15,16]. At the same time, filling a lake may lead to the loss of some naturally valuable sites [17]. The construction of reservoirs also has a major impact on the immediate surroundings, and the different intensities of changes in such areas arise from the actual purpose of the lake [18]. Thus, for example, in some water bodies, anthropogenic activities in the vicinity are eliminated, and the surroundings are often intentionally reforested or grassed over [19,20]; other lakes, by contrast, may exhibit a major potential for the development of leisure zones [21]. Reservoirs can be classified into several basic categories according to their intended use, and they are commonly used as multifunctional [22,23]. In addition to impacts on surface features in the landscape, influences on linear features can also be observed in reservoir construction, especially regarding transport infrastructure.
Long-term landscape use variations are most often investigated on the basis of old topographic maps [24], with the Austrian military topographic mapping being widely used in Central Europe [25,26,27,28]. Aerial imagery finds application in assessing more recent trends in land-use change at present [29,30]. Transport networks can also be assessed in the long term by means of old topographic maps and current topographic evidence in combination with aerial imagery [31,32,33].
Areas affected by the construction of large hydropower dams and the associated dynamics of landscape change have long been of interest to landscape ecologists [33,34,35,36]. The use of modern methods based on remote sensing, GIS, in particular, is essential for collecting and reconstructing information about the state of the area before the waterworks [37,38,39,40]. The impacts of dams or lakes on land systems are divisible into direct and indirect ones. The former set refers to the land cover or land-use changes caused by reservoir flooding, which encompass area extent variations and modifications within the land use and land cover categories, such as changes in the intensity of land use. The latter group then relates dams, lakes, and land systems through more complex sequences of causes and effects [22,41]. The causal effects of dams and land cover variations on flood changes have long been a research goal [42]. Current scientific topics also comprise the effect of climate and land cover scenarios on dam management strategies [43]. Another topic is the prediction of future landscape development pathways in the vicinity of reservoirs, based on the past land-use change trajectories [44]. The construction of reservoirs is controversial because of the potential negative impacts on not only the land-use change but also the population, economy, industry, and agriculture [8,45].
The aim of this article is to evaluate the impact of reservoir construction on variations in landscape use and transport networks; this step then also involves assessing the significance of such an anthropogenic activity as one of the drivers of landscape change. To carry out the tasks, we chose the largest reservoirs in the Czech Republic. The landscape use of floodplains and the immediate surroundings of the reservoirs, where the main effects can be expected, are monitored. One of the hypotheses is that the purpose of a reservoir has fundamental importance for specific landscape changes in its hinterland. Another hypothesis takes into account the period in which the lakes were built. Presumably, the oldest large reservoirs, completed in the first half of the 20th century, were conceived to protect the land from flooding and to store water for the population and industry; by contrast, the artificial lakes that originate from the later decades also fulfill leisure- and agriculture-related functions. Relevant landscape changes then manifest themselves in accordance with all of these purposes. The influence exerted by the previously built reservoirs on the landscape is also taken into account when the impact of planned lakes in the Czech Republic has to be assessed. The article aims to answer the following questions:
  • Does the primary purpose of the reservoir affect the use of the landscape?
  • Do certain characteristics of reservoirs, (e.g., depth and period of construction) have similar landscape use patterns?
  • Can dam construction be considered a major driver for changes in land use and transport networks?

2. Materials and Methods

2.1. Study Area

The case study was conducted within the Czech Republic, a landlocked country located in Central Europe. The Czech Republic is the source of several important streams, (e.g., the Labe and Odra) whose transport significance reaches beyond the country. The territory belongs to the North Sea, the Baltic Sea, and the Black Sea (Figure 1). From the long-term historical perspective, a characteristic trait has rested in well-conceived water management in the landscape, especially in pond systems, some of which have a tradition of more than five hundred years [46]. The primary purpose of ponds is fish farming, yet their parameters often closely resemble those of reservoirs. In what is now the Czech Republic, the construction of reservoirs began as early as the end of the 19th century, the central aims being to supply drinking water, ensure flood protection, and deliver water to industries [47]. Later on, other functions, such as leisure, energy, and irrigation, came to be considered and involved in the construction of artificial lakes. In order to address the connections between building a reservoir and the impact on the landscape change and transport networks, we monitored water reservoirs and their surroundings up to a distance of 1 km, including planned lakes, too.

2.2. Map Sources

Medium-scale topographic maps of the present-day Czech Republic are available from 1763–1768, namely, from the first Austrian military mapping, at a scale of 1:28,800. However, modern cartographic methods were not used in the making of these materials, meaning that the maps do not provide sufficient accuracy for monitoring the development of the land use or the road network [48]. The maps of the 2nd Austrian military mapping of 1836–1852 (completed at a scale of 1:28,800) already achieve a higher positional accuracy [49], mainly due to the application of a trigonometric network. For the purposes of this article, we employed the 1:25,000 map sources that resulted from the 3rd Austrian military mapping, which took place between the years 1876 and 1880 (referred to as 1880 in the text below), the 1:25,000 Czechoslovak topographic maps of 1953–1957 (to be referred to as 1950) and 1988–1996 (to be referred to as 1990), and the 1:10 000 current topographic maps of 2015–2020 (to be referred to as 2020). Aerial photographs from the first half of the 1950s and current orthophotos were also utilized to refine the course of the roads. The aerial photographs are available at the Archive of Aerial Survey Images of the Czech Office for Surveying, Mapping, and Cadastre.

2.3. Set of the Existing and Planned Reservoirs

When monitoring the impact of reservoir construction on the landscape and transport networks in the Czech Republic, we focused on lakes larger than 100 ha. The source that enabled us to select data on reservoirs under construction was the Basic Geographic Database (ZABAGED) at the Czech Office for Surveying, Mapping, and Cadastre; in more concrete terms, we followed the water areas data layer. Considering the above criterion, we established that a total of 36 operational reservoirs had been registered in the Czech Republic in 2021 (see Table 1).
In the country, four large artificial lakes were constructed between 1880 and 1950, namely, Seč (1924–1934), Vranov (1929–1933), Vrané (1935), and Brno (1936–1940). Most of the Czech Republic’s major reservoirs, however, originate from the period 1950 to 1990; there are 29 such lakes in total, with the year of completion being usually around 1960. To assess the potential impact of the construction of new lakes on the land use and transport networks, we employed the reservoir map from the Surface Water Accumulation Areas Master Plan [50]. This document had been produced in cooperation between the Ministry of Agriculture and the Ministry of the Environment, and it embodies the basis for the draft spatial development policy and spatial planning documentation. The maps were provided by the T. G. Masaryk Research Institute of Water Management for research purposes. Again, we selected water reservoirs with an area of more than 100 ha to perform an analysis of the geographic information systems; this set included 47 planned water reservoirs. The combined database of constructed and planned reservoirs with a water surface area over 100 ha includes 83 sites (Figure 2). The database of selected reservoirs was supplemented with the following parameters: year of completion, depth, water surface elevation, and individualized usage of the lake. In the reservoirs under construction, the year of completion was added from the basin managers’ sources or general internet sources on reservoirs. The primary purposes of a reservoir include energy use (hydroelectric power), instream flow augmentation for industry, high water protection, drinking water supply, industry water delivery, recreational use, and irrigation. The secondary purposes then rest in, above all, fish farming and boating.

2.4. Handling the Datasets, and Workflow in the Geographic Information Systems

The relationship between reservoir construction and landscape use, in general, was addressed by using the map layers created during the research pursued at the Silva Tarouca Research Institute for Landscape and Ornamental Gardening. Based on the topographic military maps, a total of 9 land use categories were mapped: arable land, permanent grassland, orchard, vineyard and hop field, forest, water area, built-up area, recreational area, and other areas.
These land use categories are defined as follows:
  • Code 1. Arable land
Overall, arable land can be characterized as land used mainly for agricultural production (both primary and secondary). In the map, the authors included also small buildings and other structures relating to the growing of cereals; legumes; oil-, root-, and technical crops.
  • Code 2. Permanent grassland
This category comprises lands dominated by grass and herbs on the one hand and areas whose grass cover was modified through human intervention into meadows or pastures on the other. The group also contains meadows with dispersed tree and shrub vegetation.
  • Code 3. Garden and orchard
The category includes gardens, orchards, tree nurseries, and ornamental gardens. Tree growing and seed-producing nurseries and glasshouses are included too; if located within settlements, they are categorized as built-up areas.
  • Code 4. Vineyard and hop field
Vineyards embody land on which grapes are grown to produce wines, and hop fields are important landscape elements with a typical structure (hop poles, wires). The vineyard and hop field category also include related objects outside the intravilan of municipalities (such as wine cellars inside or on the edges of vineyards).
  • Code 5. Forest
Forests are ecosystems constituted primarily by trees grown for various purposes, including the production of timber and other wood-based products. Forest areas have a canopy of ≥10%, and the trees yield timber to be worked in the manufacturing of diverse wood products; moreover, they affect climate and water. In this category, the authors also included structures and buildings directly related to forest management, (e.g., hunting lodges, gamekeeper’s houses, and timber yards).
  • Code 6. Water area
Lakes, fishponds, and other water reservoirs outside the intravilan of residential areas, (e.g., fire protection reservoirs or swimming pools); water-filled extraction shafts of quarries; gravel pits and mines. The group comprises also wetlands, which hold water layers on the ground surface, close to the ground surface, or above the terrain level for a significant part of the year.
  • Code 7. Built-up area
A residential area facilitates the construction of houses and other anthropogenic structures; incorporated is the land that adjoins the buildings and relates to their actual function(s), (e.g., squares, parking lots, and gardens). The authors also included cemeteries in the urban landscape. In the land use maps, a built-up area is plotted as a continuous line of compact developments, marked as a continuum against the surrounding landscape. Assuming the conditions in the Czech Republic, settlements also comprise agricultural, industrial, and similar production sites; areas with service facilities; commercial premises; transport terminals adjoining the continuous development sites.
  • Code 8. Recreational area
Here, leisure and tourism locations are incorporated into a systematized group. In view of the various types of leisure, the category is defined especially with respect to the manner of use. The authors included in the recreational landscape sports grounds (playgrounds) and leisure facilities outside the intravilan; the category, therefore, contains both anthropogenic objects (spa resorts, sports stadiums) and areas where greenery prevails, (e.g., cottage sites and garden colonies, golf greens, and zoological gardens).
  • Code 9. Other area
This set includes unused land (denoting land permanently non-productive, formerly used and now abandoned, and open-cast quarries and/or underground mining sites where minerals, rocks, and other applicable materials are extracted). The authors have included in this category brickyards with attached buildings; loam, sand, and gravel pits; limekilns with relevant quarries; and other mining premises. The category covers also peat-mining sites, industrial wasteland areas outside the intravilan, earth embankments of large artificial lakes, and waste dumps.
The impact exerted by the construction of a lake on the land-use changes in the reservoir floodplain and in the surrounding area within a distance of 1 km was assessed by using GIS tools. Such a distance allowed us to assess the most important influences on the surrounding landscape and to evaluate the intensity of the change processes according to the different characteristics of the reservoirs. The impacts of the above-mentioned engineering activities on land-use changes had been investigated within a research project in the years 2013–2017; at the time, the value of 1 km was chosen based on testing the intensity of the processes in the vicinity of reservoirs [17].
The road and railroad networks were mapped by refining the existing spatial linear datasets of network development that had been produced previously at the Transport Research Centre to track the historical evolution of landscape fragmentation [51]. These datasets included developments within the categories of public railways, highways, and Class I and II roads over the time span from the 1950s to the present. For the purposes of this article, the datasets were expanded to include all Class III roads in the study areas, and the time period was made longer to incorporate the maps of the 3rd Austrian Army Mapping; the latter step then facilitated matching the time periods applied for land use mapping. As the division of the road network into different sets dates back to 1946 [52], the Imperial Road and Other Road categories were followed in this mapping period. The data on historical ferry locations were obtained from the database of river ferries in the Czech Republic [53].
The roads and railways planned to be built in the future were monitored on the basis of the Principles of Territorial Development of individual regions, complemented with the current information from the Ministry of Transport of the Czech Republic, the Road and Motorway Directorate, and the Railway Administration. Many of such planned infrastructures have not yet been spatially stabilized, and it is therefore not possible to clearly determine their future routes exactly. In these cases, the roads and railways were mapped along the axis of the corridor defined for the construction by the spatial planning documentation.

3. Results and Discussion

3.1. Changes in the Land Use Due to the Construction of Water Reservoirs

The results of the long-term landscape use changes in the surroundings of the existing and planned dams in the Czech Republic were presented separately. A dataset of reservoirs with an area larger than 100 ha (see Section 2.3) was examined; in the actual study, we focused on the surroundings of water reservoirs within 1 km from the water surface edge and the lake.
Based on a comparison of the land-use changes, we established that there had been a loss of arable land and permanent grassland in the existing water reservoirs and their surroundings (Table 2), as these land use categories had been most often flooded by the reservoirs constructed [17,34]. The loss of arable land is a typical trend in the development of some landscape types in the Czech Republic, hills and uplands in particular [54]. In the vicinity of some water reservoirs, this loss of arable land is related to the growth of recreational areas; the same fact then also applies to the growth of built-up areas in the hinterland of cities (suburbanization). Floodplains with a buffer of 1 km currently include up to 16.63% of water areas, and therefore the decline in arable land and permanent grassland cannot be explained by the creation of new water areas alone. The trend of growth of recreational areas is related to the attractiveness of water reservoirs for active recreation, leisure, and cottaging [3,21]. The growth of built-up areas shows fewer dynamics [54] than is usual in the long-term perspective for larger territorial units, (e.g., districts and catchment areas). This is due mainly to restrictions on development near drinking water sources [19,34]. In the hinterland of constructed water bodies as related to the sum of floodplains, in 1880 arable land areas dominated with a share of about 42%; today, forest areas dominate at a similar share. This trend is connected with the aforementioned limitations that accompany drinking water lakes, but it also expresses the general trends of afforestation in European countries [1,2,28]. The targeted planting of trees in the vicinity of drinking water reservoirs is in accordance with the protection of water resources in the Czech Republic and can also be verified via forest management maps.
In the area of the planned dams and in their vicinity within 1 km of the potential water surface, arable land was originally predominant (Table 3). At present, the dominant component is forest, and its growth corresponds to the overall growth of forest areas in the less populated areas of the Czech Republic [54]. The proportion of permanent grassland is also significant, fluctuating around 16–17% throughout the study periods. This category exhibits a relatively high share, compared to the usual surveys in other parts of the country [26,27,30]. In our research, the grassland areas cover alluvial meadows and wetlands, which are concentrated mostly in the floodplain itself. In regard to the built-up areas in the vicinity of the planned lakes, these occupy only 2.83% and fall within the less populated land. The catchment areas of the planned dams currently include the following land use categories: forest (52.5%), permanent grassland (28.8%), arable land (15.5%), water area (1.1%), built-up area (1.1%), recreational area (0.7%), vineyard and hopfield (0.3%), other areas (0.2%), and orchard (0.1%). Consistent with the methodology, a water body is defined as having a surface of at least 0.8 ha; water courses are not subsumed under this criterion. In the given context, we also consider some ponds, namely, those planned to be included in a new artificial lake.
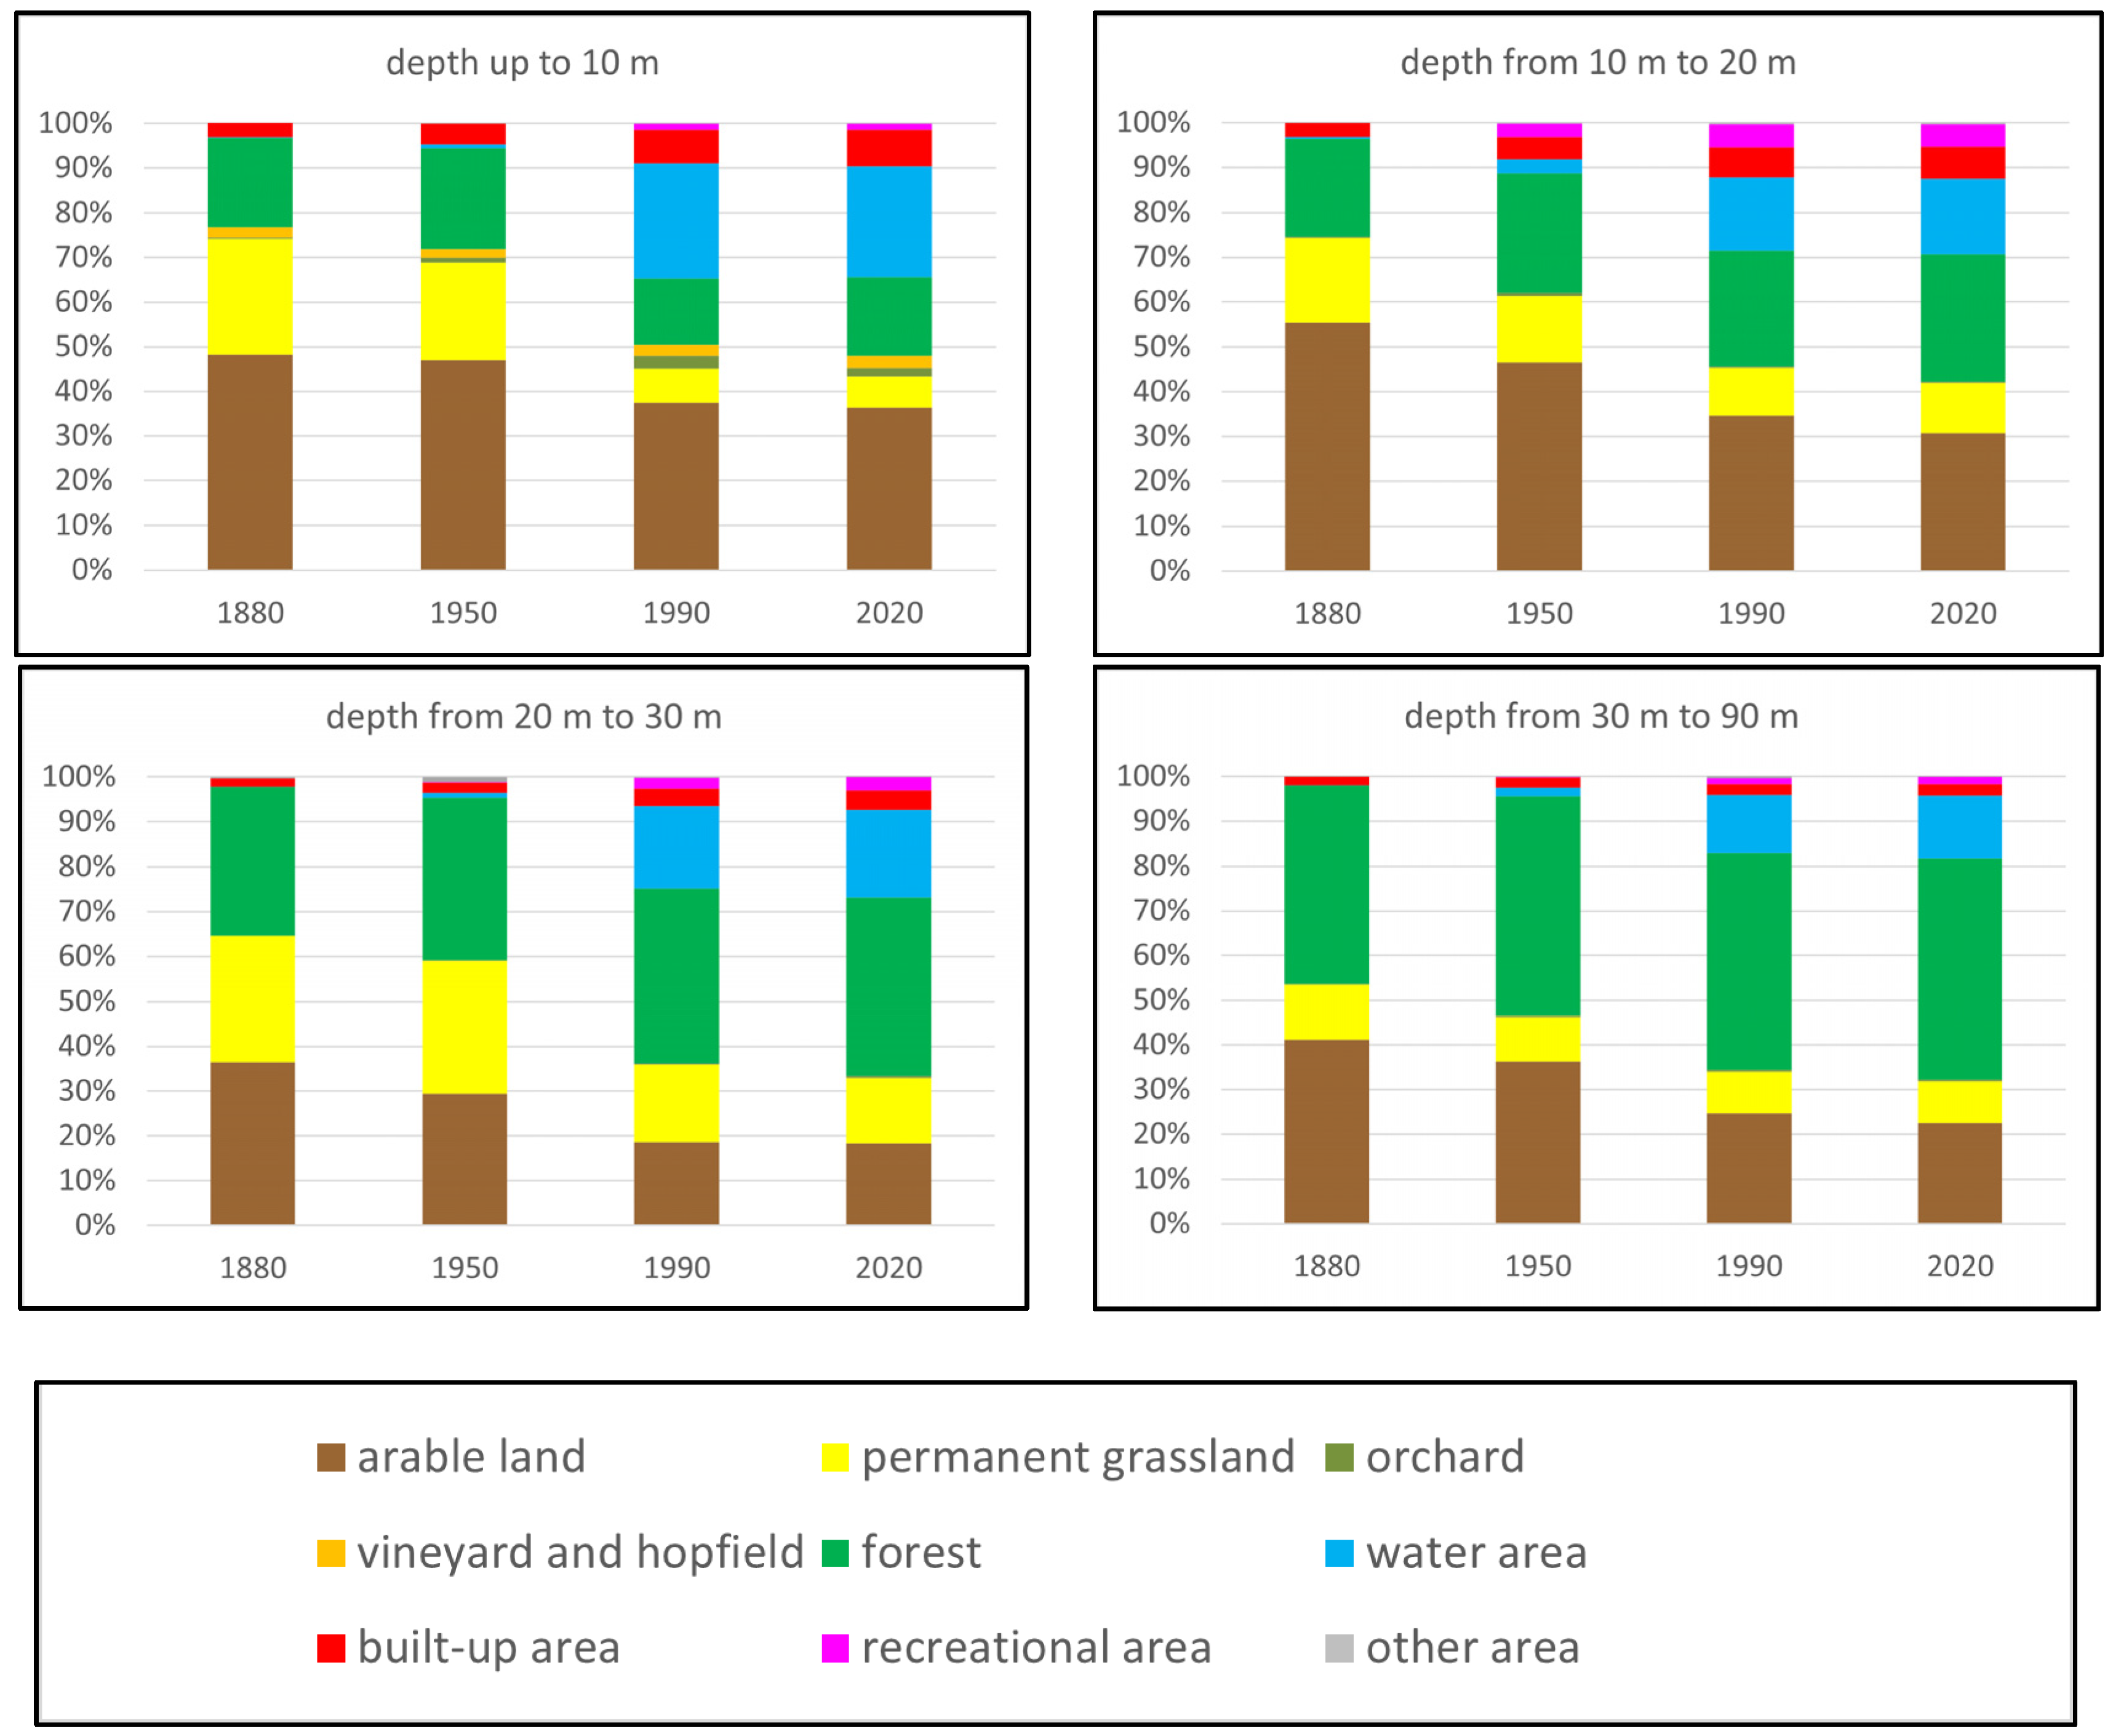
Based on the depth of the water reservoirs, the assessed operating lakes in the Czech Republic were grouped into four basic sets:
A.
Shallow, with a depth of up to 10 m: Nové Mlýny I, Nové Mlýny II, Nové Mlýny III, Kořensko, České údolí
B.
Moderately deep, with a depth from 10 to 20 m: Vrané, Újezd, Kamýk, Skalka, Rozkoš, Jesenice
C.
Medium-deep, with a depth from 20 to 30 m: Brno, Hněvkovice, Lipno I, Hracholusky, Těrlicko, Žermanice, Žlutice
D.
Very deep, with a depth from 30 to 90 m: Kružberk, Nýrsko, Horka, Seč, Římov, Josefův Důl, Vranov, Nechranice, Přísečnice, Fláje, Slapy, Švihov, Stanovice, Slezská Harta, Šance, Vír I, Orlík, Dalešice
The following Figure 3 evaluated the share of land use categories in water reservoirs and their surroundings in four periods by depth in four separate graphs.
Shallow water reservoirs, i.e., those with a depth of up to 10 m, are typical of arable land-dominated surroundings (Figure 3). The proportion has decreased, mainly due to the creation of the reservoirs, when arable fields were flooded in the lowland relief; however, the share is the highest overall. At the same time, however, as the fields were flooded, the floodplain meadows also experienced a major drop in the area (from 26% to 7%). The construction of reservoirs in the flat topography is also associated with a loss of forest areas, riparian forests in particular. The proportion of water surface areas is the highest in the vicinity of shallow reservoirs, out of all the depth categories studied; this finding then implies that the water surface areas typically exhibit wide dimensions. The proportion of built-up areas in the hinterland of shallow water reservoirs increased almost threefold during the period investigated. The landscape changes in the hinterland of these lakes correspond to typical variations in the Czech Republic in the area of flat floodplains and hills [27,54]; some aspects of the impact of reservoir construction are specific and highlight processes in the landscape. A particular change then rests in sustaining a relatively large proportion of arable land in the wider vicinity of those artificial lakes that are associated with intensive agricultural activities; such a fact arises from, among other factors, regional differences, which generally reflect or are embodied in specific natural and political processes [55].
In moderately deep reservoirs, which are characterized by a depth from 10 to 20 m, the predominant land use category was arable land, too (Figure 3). The decreases in the proportion of such land, however, appeared to be more significant than in the shallow reservoirs. The decline in the proportion of permanent grassland was also significant but not as steep as in the previous class. The area of forests in the hinterland of the moderately deep lakes has gradually increased, in line with the trends in other parts of the country. Water areas currently make up around 17% of the study area in these reservoirs and are more elongated in shape. The built-up areas in the hinterland have more than doubled in size. Recreational areas take a significant proportion, currently around 5%, meaning that the area around the moderately deep lakes features the heaviest use for recreational purposes. This type of reservoir is found mainly in hilly locations; in general, the trends of changes in the use of hilly landscapes in the Czech Republic agree with those set out in other studies [24,51]. Even in this subdomain, however, various regional differences and their partial aspects are discernible; thus, for example, the vicinity of reservoirs that are located in less populated areas exhibits a higher intensity of forestation and/or leisure grounds formation. Such differences also become evident from the diverse dynamics of landscape use in various cadastral areas [55].
Medium depth reservoirs, i.e., those with a depth of between 20 and 30 m, are typically characterized by a higher proportion of forest areas (Figure 3), and since 1950 this has been the commonest land use category in the hinterland of such lakes. Significant declines in the proportion of arable land and permanent grassland are partly due to changes in the floodplains on the one hand and increases in the forest, built-up, and recreational areas on the other. In the most recent period, water areas occupied about 19.5% of the investigated land, and their shapes were thus less elongated than in the previous category. Most of the reservoirs are located within the more rugged relief of the uplands, meaning that the trends in the landscape changes correlate with those proposed in other relevant studies [26,27]. A half of these lakes function predominantly as drinking water sources, and the land use in the hinterland is then consistent with the protection of the watershed [17,32]. Artificial lakes, whose primary purpose rested in storing potable water, were intentionally built in less densely populated regions, such as borderlands or inner peripheries. By extension, landscape use variation processes, including, above all, the forestation or abandonment of arable land, are more intensive in the vicinity of the lakes than in the surrounding cadastral areas [3,55].
Regarding the hinterland of very deep-water reservoirs, i.e., the ones with depths ranging from 30 to 90 m, forest areas were the most represented class in all periods studied, that is, from 1880 to the present; the share of forests currently amounts to almost a half of the model area (Figure 3). The significant loss of arable land was related to the construction of waterworks when agricultural valleys with flat floodplains were flooded. Lakes with very large depths are characterized by elongated water surface shapes due to the narrower watercourse valleys. The decline in the proportion of permanent grassland is not as pronounced as in the other, lower depth categories. The shares of built-up areas here are the lowest among all the classes, mainly because of the higher proportion of reservoirs in the more rugged, upland-type topography. There have occurred typical land-use changes, characteristic of Central Europe in this kind of relief [29,54]. Compared to the variation of landscape use processes that characterize uplands, the vicinity of deepwater lakes exhibits greater forestation dynamics and markedly slower grassland expansion [3,55].
Table 4 shows the proportions for each land use category; the bold data represent potable water lakes, and the numbers in italics relate to all other reservoirs. The hypothesis that the surroundings of drinking water reservoirs within 1 km of the water surface are often intentionally afforested and perennial grassland is maintained to a greater extent has been confirmed. The purpose-oriented nature of these approaches and procedures has been demonstrated through intentional tree planting and also forest land management, which utilizes relevant application maps. In the vicinity of the reservoirs, forest control is consistent with the efforts to minimize soil erosion and to prevent the water resources from being polluted by contaminants that are comprised in the adjoining or nearby arable land. By extension, the immediate vicinity of potable water reservoirs is characterized in that establishing and developing built-up and leisure areas is discouraged by state regulations (Table 4). The surroundings of such lakes then virtually overlap with protection zones, making leisure activities or urban development unfeasible, as already indicated above. These research results are in line with the legal protection of drinking water sources and resemble those in other European countries [19,34].
When studying the processes of land-use change in the hinterland of the constructed reservoirs, we evaluated changes between two consecutive periods. In the four lakes completed before 1950, processes that occurred between 1880 and 1950 were examined; the most intensive transformations were arable land to forest (3.9%), permanent grassland to water bodies (3.5%), permanent grassland to forest (3.2%), and forest to water bodies (3.2%). A relatively large proportion of the areas was registered in the change from arable land to permanent grassland (1.9%). The area stability appeared to be the highest in forest (42.5%), arable land (23.5%); permanent grassland exhibited a very low proportion generally (1.5%). The results correspond to findings from other areas of the Czech Republic, uplands in particular [54].
More representative results for lan- use change processes can be observed between 1950 and 1990; during this period, 29 lakes with an area of over 100 ha were created in what is now the Czech Republic. The intensity of the processes is significantly higher in this intermediate period; the most significant items are recorded in Table 5 below.
The intensity of land-use change processes between 1950 and 1990 in the hinterland of the reservoirs is higher than in the previous period. The most intense variations are related to the construction of the lakes and the flooding of the land formerly used as permanent grassland, forest, and arable land (Table 5). Among the most intensive processes is the grazing of arable land areas, a scenario typical of the vicinity of reservoirs that have a potential for supporting leisure or being used as a source of drinking water [19,34]. In normal agricultural landscapes or landscapes of hills and uplands, the trend between 1950 and 1990 was the opposite, with most permanent grassland areas disappearing [27,54]. The land use transformation from arable land and permanent grassland to forest was relatively strong too; this trend characterizes the vicinity of reservoirs that function as drinking water sources. The share of areas that transformed from arable to recreational land reaches 0.8%, denoting a relatively small part of the territory; in some of the reservoirs, this process was quite intensive [21]. Stable areas of the two most important land use categories showed smaller proportions than the previous land use category, meaning forest (32.2%) and arable land (22.3%). Stable permanent vegetation occupied a share of 4.5%, which is more typical of upland landscapes [54].
The processes that took place between 1990 and 2020 were monitored on a sample of three reservoirs. In these most recently created lakes, the land-use variation manifested itself, especially through changes from cropland to permanent grassland (6.9%), permanent grassland to water bodies (5.1%), forest to water bodies (3.1%), and permanent grassland to forest (2.1%). In general terms, however, the intensity of landscape change processes is lower in this intermediate period, due also to the shorter time in-between the periods. In the case of stable land use, the highest proportion is again assigned to forest (39.8%) and arable land (22.1%). Regarding the hinterland of the reservoirs, the proportion of permanent grassland in stable use between 1990 and 2020 reached relatively high (7.9%). Such information is in line with the overall findings for upland areas in the Czech Republic [54], and it also reflects the impacts of artificial lake construction on landscapes used as potable water sources.

3.2. Changes in Transport Networks during the Construction of Lakes

The transport network changes were monitored in groups of lakes correspondingly to their periods of completion.
The segregation of the first and the second periods under study was significant, as the roads had been categorized differently in 1880. Moreover, at that time, the entire road and railway network in the present-day Czech Republic was going through an expansion phase, and thus changes and drivers other than the creation of lakes are markedly more relevant to the assessment. The imperial roads were not affected by the construction of the four reservoirs, while 2.84 km (11.8%) of other roads disappeared and another 1.91 km (7.92%) were converted into local or special-purpose roads (Table 6). A significantly higher number of roads were created, but this increase can be attributed to simple network development, together with the development of railways, which originally had not been present in the hinterland of the lakes assessed.
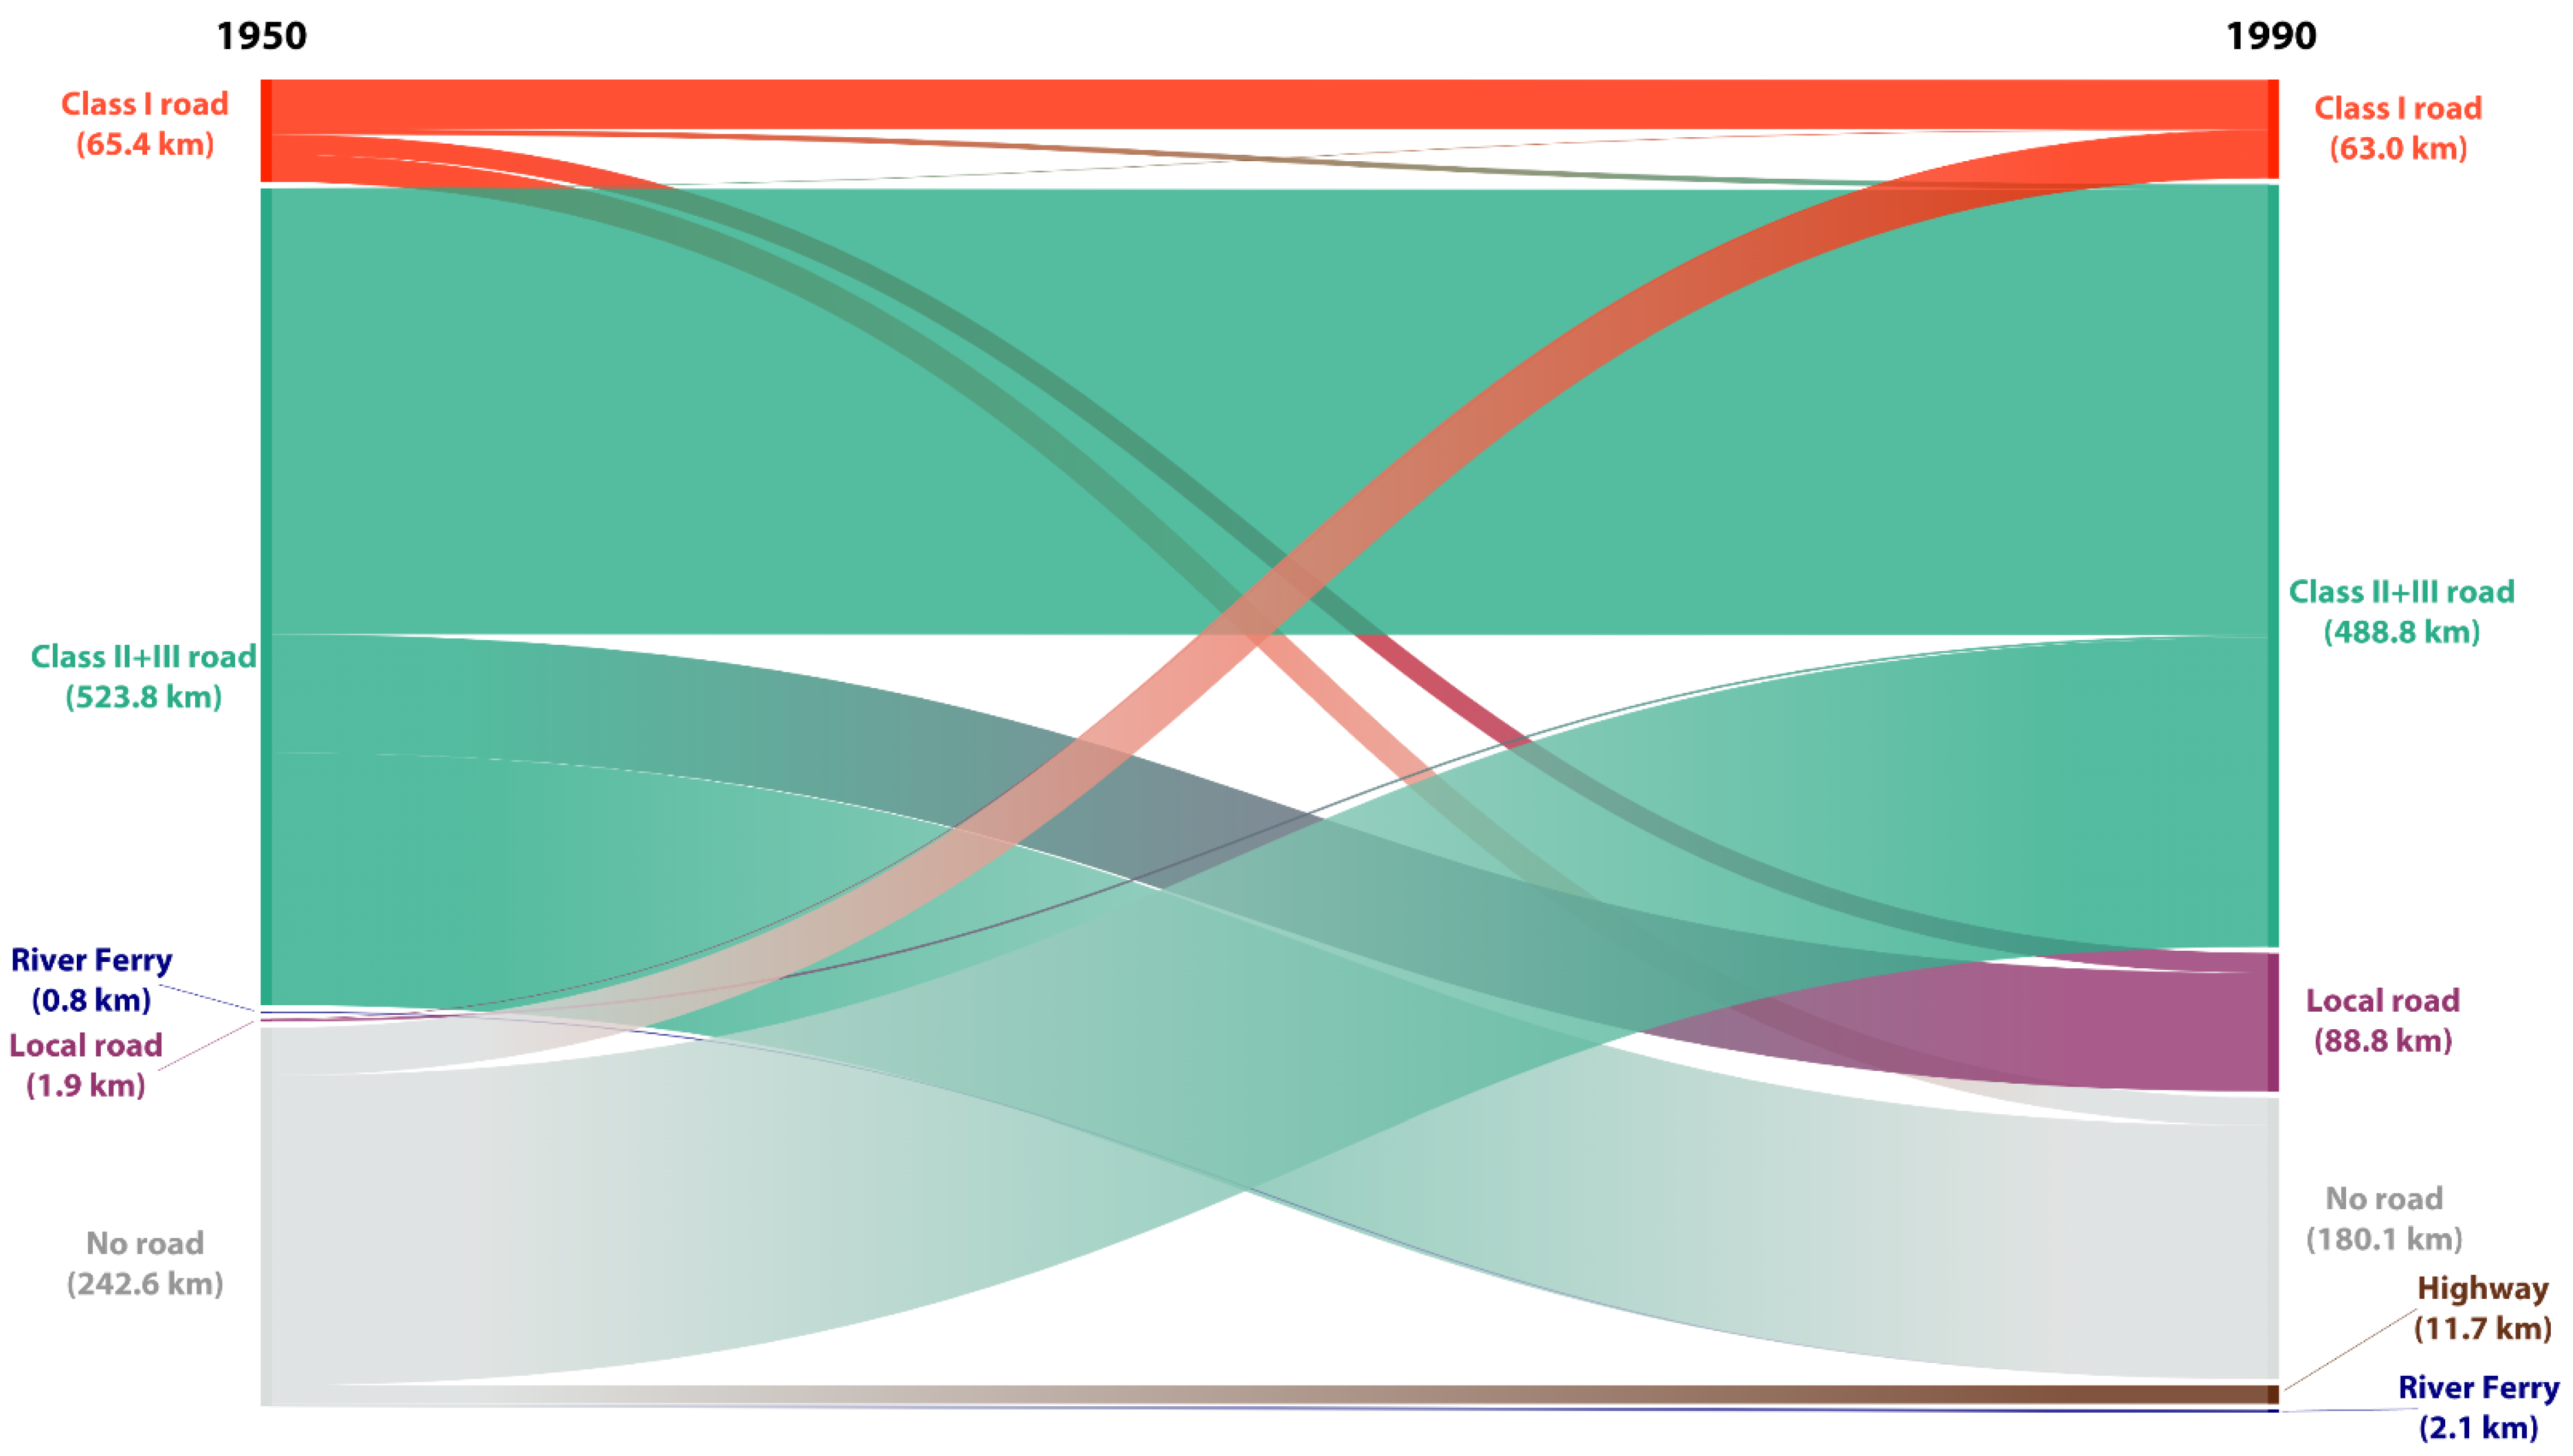
This time period covers the time of the greatest lake construction boom. Although the overall length (and thus density) of the Class I roads has remained roughly the same (slightly reduced by a few percent), a close look reveals significant changes (Table 7 and Figure 4). Only a half of the road sections have remained stable; the other half in the sample have disappeared or been converted into local or utility roads. By contrast, a significant proportion of the sections were newly built (48.6%), and highway sections became a novel phenomenon. The stability of the lower-class sections amounted to 54.5%. All of the ferries existing in 1950 disappeared completely; however, new sections with ferry operations were created again, almost tripling the total length. Unlike the other periods, this one is characterized by the fact that the creation of the lakes also affected the railway network. As a result of the completion of the reservoirs, a part of the network disappeared (18% reduction in the total length), but the degree of the spatial stability of the sample of lines studied reached higher than that of the road network. A whole 68.18 km (66.45%) of the lines remained in their original alignment.
In the third period, similarly to the first one, a small sample of lakes is assessed, which may bias the results considerably. The only Class I road that passed through the study area in 1990 was downgraded to a lower category road. Of these roads, approximately 68% have been retained. As in the previous periods, the overall length (and therefore density) of the transport networks decreased. The railways were not affected by the construction of the reservoirs during this period, and the lines remained in a stable position (Table 8).
A specific component of the road network is embodied in ferries, which allow crossing a river where no fixed link, (e.g., bridge) is available. Out of a total of 33 ferries currently in operation in the Czech Republic [50], five are situated on the water surface of existing lakes (3× Lipno I, 1× Slapy, and 1× Slezská Harta); none of the ferries, however, operated before the construction of the lake. Of the five, only those on Lipno I are operated as large ferries that also allow transporting motor vehicles. The other ferries are passenger boats, which otherwise carry only bicycles.
The projected conflicts between planned reservoirs and current transport networks are revealed in Table 9.
In the above table, we represent conflicts with highway networks, one within an existing scenario in the section Sulkov–Benešovice (D5) and one relating to the planned D6 in the section Petrohrad–Lubenec. The other two conflicts, along the route of the Class I road in the Liberec region and the Class II road in the South Moravian Region, are only territorial reserves. Especially in the last case, the spatial plan will have to be modified, as the road under consideration runs along the bottom of a valley which is also being considered for the construction of a dam. There is only one spatial conflict within the railway, the planned route of the high-speed railway, which has not yet been spatially stabilized, and it is therefore still possible to choose a route that avoids the planned reservoir.

3.3. Summary

Based on the results of research in the hinterland of reservoirs built in the Czech Republic, it has been found that some general trends in the development of landscape use are consistent with trends from other landscape types in the Czech Republic [24,25,26]. At the same time, however, it has been found that the construction of reservoirs has had a major impact on landscape use in the immediate hinterland. Similar results have been found in other studies on this topic [18,34]. The surroundings of reservoirs are significantly affected, especially for sites used as a source of drinking water [19,34]. When building new reservoirs with the primary purpose of drinking water sources, an increase in forest and permanent grassland areas can be expected in future reservoirs by analogy. This is consistent with other findings. At the same time, however, an increase in recreational areas can also be expected for newly constructed dams, but here the influence of the surrounding landscape or the proximity of a larger city will be significant [21]. For multi-purpose dams, the possible development of land use depends on the predominant land use [22,23]. In some areas, an increase in arable land can be observed after the construction of a reservoir, a typical trend for reservoirs built for irrigation purposes [15,17]. Based on the analyses conducted, dam-building can be considered a major driver for land-use change and transport networks. In the case of the depth of the dams, some consistent trends in the development of the surrounding landscape can be traced, which are also partly in line with the development of land use in the Czech Republic according to the relief [54]. The interest in the results of research into the land-use change in the vicinity of water dams was also confirmed in the area of spatial planning, especially with regard to the expected impacts in the construction of new reservoirs. At the same time, there are strong civic initiatives in the construction of water reservoirs, which fear the negative effects on the settlements and inhabitants of the region. The results of research into the impacts of building reservoirs were consulted with representatives of regions, municipalities, and local action groups.
In terms of transport networks, it should be stressed that, unlike the development of land use, the analyses should not forget the expansion periods of transport networks when they are created. Thus, for individual periods, the set of roads evaluated is not always the same, e.g., in the period between 1880 and 1950 the length of the road network increased 3.5 times. The evaluation, therefore, focused purely on individual periods corresponding to the construction of the waterworks and not on long-term changes as in the case of land use. The most significant period that had sufficient data was between 1950 and 1990, when 29 dams were built. Only half of the road sections have remained stable, while the other half in the sample have disappeared or been converted into local or utility roads. In contrast, a significant proportion of sections were newly built (48.6%). The railway network was not so affected, preserving the stability of alignment by more than 66%. The overall length of the railway has decreased due to the abandonment of several sections, sections that have been abandoned without replacement and with only road transport services provided.

4. Conclusions

The construction of reservoirs can be considered one of the important drivers of land-use change. Based on a study of changes in land use and the road network in the hinterland of the larger dams being built in the Czech Republic, it was found that more intensive landscape change processes are taking place in the hinterland of reservoirs than in the surrounding landscape. The predominant function of reservoir use emerged as the key to landscape use change and ongoing processes. The processes of afforestation and grassing are typical for the area around drinking water reservoirs, with minimal built-up areas and recreational areas. In the case of reservoirs with a recreational function, there is an expansion of recreational areas, but also an increase in areas of forest or permanent grassland. Dams intended for irrigation may affect the growth of agricultural areas in the vicinity, whether arable land, vineyards, or orchards. Depending on the depth of the dams and the surrounding relief conditions, common trends of change can be observed. The road and highway network has been disrupted by the construction of the dams, particularly in the case of the transport routes between nearby villages. The disruption of important traditional transport routes is no exception. The information found can be used to project future changes in land use and road network for newly planned dams. The potential of newly built dams for landscape measures in the context of global climate change should also be identified as very important.

Author Contributions

Conceptualization, M.H., I.D. and R.P.; methodology, M.H., I.D. and R.P.; software, M.H. and I.D.; validation, M.H. and I.D.; formal analysis, M.H. and I.D.; investigation, M.H., I.D. and R.P.; sources, M.H., I.D. and R.P.; data curation, M.H., I.D. and R.P.; writing—original draft preparation, M.H., I.D. and R.P.; writing—review and editing, M.H., I.D. and R.P.; visualization, M.H. and I.D. All authors have read and agreed to the published version of the manuscript.

Funding

This paper was drafted and completed at the Transport Research Center (CDV), utilizing the financial support provided by the Ministry of Transport within a program for the long-term conceptual development of research institutions (decision no. 1-RVO/2021), and at the Silva Tarouca Research Institute for Landscape and Ornamental Gardening, where the work was co-funded by the Ministry of Environment (VUKOZ-IP-00027073). This research was funded at Palacky University Olomouc by the IGA_Prf_2021_027 “Landscape as a palimpsest of space and places”.

Institutional Review Board Statement

Not applicable.

Informed Consent Statement

Not applicable.

Data Availability Statement

The data presented in this study are available at the corresponding author upon request.

Conflicts of Interest

The authors declare no conflict of interest.

References

  1. Antrop, M. Landscape change and the urbanization process in Europe. Landsc. Urban Plan. 2004, 67, 9–26. [Google Scholar] [CrossRef]
  2. Rudbeck-Jepsen, M.; Kuemmerle, T.; Müller, D. Transitions in European land-management regimes between 1800 and 2010. Land Use Policy 2015, 49, 53–64. [Google Scholar] [CrossRef]
  3. Skokanová, H.; Falťan, V.; Havlíček, M. Driving forces of main landscape change processes from past 200 years in Central Europe—Differences between old democratic and post-socialist countries. Ekológia 2016, 35, 50–65. [Google Scholar] [CrossRef] [Green Version]
  4. Tappeiner, U.; Leitinger, G.; Zarina, A.; Bürgi, M. How to consider history in landscape ecology: Patterns, processes, and pathways. Landsc. Ecol. 2021, 36, 2317–2328. [Google Scholar] [CrossRef]
  5. Antrop, M. Why landscapes of the past are important for future. Landsc. Urban Plan. 2005, 70, 21–34. [Google Scholar] [CrossRef]
  6. Bürgi, M.; Hersperger, A.M.; Schneeberger, N. Driving forces of landscape change—Current and new directions. Landsc. Ecol. 2004, 19, 857–868. [Google Scholar] [CrossRef]
  7. Kidawa, J.; Molenda, T. Degradation of dam reservoirs under the influence of mining subsidence in Upper Silesian Coal Basin, South Poland. Lakes Reserv. Res. Manag. 2021, 26, e12388. [Google Scholar] [CrossRef]
  8. Siegmund-Schultze, M.; do Carmo Sobral, M.; Alcoforado de Moraes, M.M.G.; Almeida-Cortez, J.S.; Azevedo, J.R.G.; Candeias, A.L.; Cierjacks, A.; Gomes, E.T.A.; Gunkel, G.; Hartje, V.; et al. The legacy of large dams and their effects on the water-land nexus. Reg. Environ. Chang. 2018, 18, 1883–1888. [Google Scholar] [CrossRef] [Green Version]
  9. Pueppke, S.G. Ancient wef: Water-energy-food nexus in the distant past. Water 2021, 13, 925. [Google Scholar] [CrossRef]
  10. Tian, W.; Liu, X.; Wang, K.; Bai, P.; Liu, C.; Liang, X. Estimation of global reservoir evaporation losses. J. Hydrol. 2022, 607, 127524. [Google Scholar] [CrossRef]
  11. Lehner, B.; Liermann, C.R.; Revenga, C.; Vörömsmarty, C.; Fekete, B.; Crouzet, P.; Döll, P.; Endejan, M.; Frenken, K.; Magome, J.; et al. High-resolution mapping of the world’s reservoirs and dams for sustainable river-flow management. Front. Ecol. Environ. 2011, 9, 494–502. [Google Scholar] [CrossRef] [Green Version]
  12. Kirchherr, J.; Pohlner, H.; Charles, K.J. Cleaning up the big muddy: A meta-synthesis of the research on the social impact of dams. Environ. Rev. 2016, 60, 115–125. [Google Scholar] [CrossRef]
  13. Loker, W.M. Dam impacts in a time of globalization: Using multiple methods to document social and environmental change in rural Honduras. Curr. Anthropol. 2003, 44, S112–S121. [Google Scholar] [CrossRef]
  14. Cho, M.S.; Qi, J. Quantifying spatiotemporal impacts of hydro-dams on land use/land cover changes in the Lower Mekong River Basin. Appl. Geogr. 2021, 136, 102588. [Google Scholar] [CrossRef]
  15. Tanksali, A.; Soraganvi, V.S. Assessment of impacts of land use/land cover changes upstream of a dam in a semi-arid watershed using QSWAT. Model. Earth Syst. Environ. 2021, 7, 2391–2406. [Google Scholar] [CrossRef]
  16. Sayektiningsih, T.; Hayati, N. Potential impacts of dam construction on environment, society and economy based on community perceptions. In Proceedings of the IOP Conference Series: Earth and Environmental Science, International Conference of Indonesia Forestry Researchers VI 2021—Stream 3: Enhancing Resilience Capacity of Disaster and Climate Change, Jakarta, Indonesia, 7–8 September 2021; Volume 874, p. 012013. [Google Scholar] [CrossRef]
  17. Mlejnková, H. Zatopené Kulturní a Přírodní Dědictví Jižní Moravy; Výzkumný ústav vodohospodářský T. G. Masaryka, v.v.i.: Praha, Czech Republic; Brno, Czech Republic, 2016; p. 264. ISBN 978-80-87402-52-8. (In Czech) [Google Scholar]
  18. Zarco-González, Z.; Monroy-Vilchis, O.; Antonio-Némiga, X.; Endara-Agramont, A.R. Land use change around hydroelectric dams using Landsat multi-temporal data: A challenge for a sustainable environment in Mexico. Geocarto. Int. 2021. [Google Scholar] [CrossRef]
  19. Wilk-Woźniak, E.; Krztoń, W.; Górnik, M. Synergistic impact of socio-economic and climatic changes on the ecosystem of a deep dam reservoir: Case study of the Dobczyce dam reservoir based on a 30-year monitoring study. Sci. Total Environ. 2021, 756, 144055. [Google Scholar] [CrossRef]
  20. Dąbrowska, J.; Kaczmarek, H.; Markowska, J.; Tyszkowski, S.; Kempa, O.; Gałęza, M.; Kucharczak-Moryl, E.; Moryl, A. Shore zone in protection of water quality in agricultural landscape—The Mściwojów Reservoir, southwestern Poland. Environ. Monit. Assess. 2016, 188, 467. [Google Scholar] [CrossRef]
  21. Hlavinková, V.; Vařechová, M.; Talpová, M.; Háva, K.; Klika, P. The importance of water bodies on recreational properties. In Proceedings of the International Multidisciplinary Scientific GeoConference Surveying Geology and Mining Ecology Management SGEM, Albena, Bulgaria, 16–25 August 2020; Volume 20, pp. 611–618. [Google Scholar] [CrossRef]
  22. Rufin, P.; Gollnow, F.; Müller, D.; Hostert, P. Synthesizing dam-induced land system change. Ambio 2019, 48, 1183–1194. [Google Scholar] [CrossRef]
  23. Steyaert, J.C.; Condon, L.E.; Turner, S.W.D.; Voisin, N. ResOpsUS, a dataset of historical reservoir operations in the contiguous United States. Sci. Data 2022, 9, 34. [Google Scholar] [CrossRef]
  24. Fuchs, E.; Verbung, P.H.; Clevers, J.G.P.H.; Herold, M. The potential of old maps and encyclopaedias for reconstructing historic European land cover/use change. Appl. Geogr. 2015, 59, 43–55. [Google Scholar] [CrossRef] [Green Version]
  25. Boltižiar, M.; Olah, B.; Petrovič, F. Historické mapy—Zdroj dát pri štúdiu krajiny a jej zmien (Historical Maps—Data Sources for the Research of Landscape Changes). Živ. Prostr. 2013, 47, 8–12. (In Slovak) [Google Scholar]
  26. Skaloš, J.; Weber, M.; Lipský, Z.; Trpáková, I.; Šantrůčková, M.; Uhlířová, L.; Kukla, P. Using old military survey maps and orthophotograph maps to analyse long-term land cover changes—Case study (Czech Republic). Appl. Geogr. 2011, 31, 426–438. [Google Scholar] [CrossRef]
  27. Šantrůčková, M.; Demková, K.; Weber, M.; Lipský, Z.; Dostálek, J. Long term changes in water areas and wetlands in an intensively farmed landscape: A case study from the Czech Republic. Eur. Countrys. 2017, 9, 132–144. [Google Scholar] [CrossRef] [Green Version]
  28. Havlíček, M.; Skokanová, H.; Dostál, I.; Vymazalová, M.; Pavelková, R.; Petrovič, F. The consequences of establishing military training areas for land use development—A case study of Libavá Czech Republic. Land Use Policy 2018, 73, 84–94. [Google Scholar] [CrossRef]
  29. Wiejaczka, L.; Olȩdzki, J.R.; Bucała-Hrabia, A.; Kijowska-Strugała, M. A spatial and temporal analysis of land use changes in two mountain valleys: With and without Dam Reservoir (Polish Carpathians). Quaest. Geogr. 2017, 36, 129–137. [Google Scholar] [CrossRef] [Green Version]
  30. Skokanová, H.; Netopil, P.; Havlíček, M.; Šarapatka, B. The role of traditional agricultural landscape structures in changes to green infrastructure connectivity. Agric. Ecosyst. Environ. 2020, 302, 107071. [Google Scholar] [CrossRef]
  31. Jedlička, J.; Havlíček, M.; Dostál, I.; Huzlík, J.; Skokanova, H. Assessing relationships between land use changes and the development of a road network in the Hodonín Region (Czech Republic). Quaest. Geogr. 2019, 38, 145–159. [Google Scholar] [CrossRef] [Green Version]
  32. Skládaná, P.; Havlíček, M.; Dostál, I.; Skládaný, P.; Tučka, P.; Perůtka, J. Land use as a motivation for railway trespassing: Experience from the Czech Republic. Land 2018, 7, 1. [Google Scholar] [CrossRef] [Green Version]
  33. Zhao, Q.; Liu, S.; Deng, L.; Dong, S.; Yang, Z.; Liu, Q. Determining the influencing distance of dam construction and reservoir impoundment on land use: A case study of Manwan Dam, Lancang River. Ecol. Eng. 2013, 53, 235–242. [Google Scholar] [CrossRef]
  34. Keken, Z.; Panagiotidis, D.; Skalos, J. The influence of damming on landscape structure change in the vicinity of flooded areas: Case studies in Greece and the Czech Republic. Ecol. Eng. 2015, 74, 448–457. [Google Scholar] [CrossRef]
  35. Abdallah, S.; Abd elmohemen, M.; Hemdan, S.; Ibrahem, K. Assessment of land use/land cover changes induced by Jizan Dam, Saudi Arabia, and their effect on soil organic carbon. Arab. J. Geosci. 2019, 12, 350. [Google Scholar] [CrossRef]
  36. Huang, C.; Huang, X.; Peng, C.; Zhou, Z.; Teng, M.; Wang, P. Land use/cover change in the Three Gorges Reservoir area, China: Reconciling the land use conflicts between development and protection. Catena 2019, 175, 388–399. [Google Scholar] [CrossRef]
  37. Jafari, R.; Hasheminasab, S. Assessing the effects of dam building on land degradation in central Iran with Landsat LST and LULC time series. Environ. Monit. 2017, 189, 74. [Google Scholar] [CrossRef]
  38. Pacina, J.; Cajthaml, J.; Kratochvílová, D.; Popelka, J.; Dvořák, V.; Janata, T. Pre-dam valley reconstruction based on archival spatial data sources: Methods, accuracy, and 3D printing possibilities. Trans. GIS 2021, 26, 385–420. [Google Scholar] [CrossRef]
  39. Blandoi, J.A.J.; Jamian, M.A.H.; Mohd-Azlan, J. An assessment of land use surrounding hydropower reservoirs using remote sensing in Sarawak, Malaysia. J. Sustain. Sci. Manag. 2020, 15, 66–78. [Google Scholar]
  40. Zhao, G.; Gao, H. Automatic correction of contaminated images for assessment of reservoir surface area dynamics. Geophys. Res. Lett. 2018, 45, 6092–6099. [Google Scholar] [CrossRef]
  41. Torre, A.; Sabir, M.; Pham, H.-V. Socioeconomic conflicts and land-use issues in context of infrastructural projects: The example of Diamer Basha Dam project in Pakistan. Asia-Pac. J. Reg. Sci. 2021, 5, 241–260. [Google Scholar] [CrossRef]
  42. Yang, W.; Yang, H.; Yang, D.; Hou, A. Causal effects of dams and land cover changes on flood changes in mainland China. Hydrol. Earth Syst. Sci. 2021, 25, 2705–2720. [Google Scholar] [CrossRef]
  43. Zabalza-Martínez, J.; Vicente-Serrano, S.M.; López-Moreno, J.I.; Calvo, G.B.; Savé, R.; Pascual, D.; Pla, E.; Morán-Tejeda, E.; Domínguez-Castro, F.; Tague, C.L. The influence of climate and land-cover scenarios on dam management strategies in a highwater pressure catchment in Northeast Spain. Water 2018, 10, 1668. [Google Scholar] [CrossRef] [Green Version]
  44. Matlhodi, B.; Kenabatho, P.K.; Parida, B.P.; Maphanyane, J.G. Analysis of the future land use land cover changes in the gaborone dam catchment using ca-markov model: Implications on water resources. Remote Sens. 2021, 13, 2427. [Google Scholar] [CrossRef]
  45. Fan, P.; Cho, M.S.; Lin, Z.; Ouyang, Z.; Qi, J.; Chen, J.; Moran, E.F. Recently constructed hydropower dams were associated with reduced economic production, population, and greenness in nearby areas. Proc. Natl. Acad. Sci. USA 2022, 119, e2108038119. [Google Scholar] [CrossRef] [PubMed]
  46. Pavelková, R.; Frajer, J.; Havlíček, M.; Netopil, P.; Rozkošný, M.; David, V.; Dzuráková, M.; Šarapatka, B. Historical ponds of the czech republic: An example of the interpretation of historic maps. J. Maps 2016, 12, 551–559. [Google Scholar] [CrossRef] [Green Version]
  47. Špano, M.; Osičková, K.; Dzuráková, M.; Honek, D.; Klepárníková, R. The Application of Cluster Analysis and Scaling Analysis Methods for the Assessment of Dams in Terms of Heritage Preservation. Int. J. Archit. Herit. 2021, 19. [Google Scholar] [CrossRef]
  48. Janata, T.; Cajthaml, J. Georeferencing of multi-sheet maps based on least squares with constraints—First military mapping survey maps in the area of Czechia. Appl. Sci. 2021, 11, 299. [Google Scholar] [CrossRef]
  49. Timár, G.; Molnár, G.; Székely, B.; Biszak, S.; Varga, J.; Jankó, A. Digitized maps of the Habsburg Empire—The map sheets of the second military survey and their georeferenced version. Acta. Geod. Geophys. 2009, 44, 115–120. [Google Scholar]
  50. Surface Water Accumulation Areas Master Plan; Ministry of the Agriculture of the Czech Republic, Ministry of the Environment of the Czech Republic: Praha, Czech Republic, 2020; p. 190.
  51. Romportl, D.; Zýka, V.; Skokanová, H.; Hlaváč, V.; Krása, A.; Kučera, Z.; Sladová, M.; Strnad, M.; Větrovcová, J.; Dostál, I.; et al. (Eds.) Atlas Fragmentace a Konektivity Terestrických Ekosystémů v České Republice; AOPK ČR: Praha, Czech Republic, 2017; ISBN 978-80-88076-50-6. (In Czech) [Google Scholar]
  52. Lídl, V.; Pospíšil, P.; Svoboda, L.; Šejna, P.; Švarc, J.; Vorel, V. Silnice a Dálnice v České Republice; Agentura Lucie: Rudná, Czech Republic, 2009; p. 376. (In Czech) [Google Scholar]
  53. Dostál, I.; Havlíček, M.; Svoboda, J. There used to be a river ferry: Identifying and analyzing localities by means of old topographic maps. Water 2021, 13, 2689. [Google Scholar] [CrossRef]
  54. Havlíček, M.; Chrudina, Z. Long-term land use changes in relation to selected relief characteristics in Western Carpathians and Western Pannonian basin—Case study from Hodonín District (Czech Republic). Carpathian J. Earth Environ. Sci. 2013, 8, 231–244. [Google Scholar]
  55. Kupková, L.; Bičík, I.; Jeleček, L. At the crossroads of european landscape changes: Major processes of landscape change in Czechia since the middle of the 19th century and their driving forces. Land 2021, 10, 34. [Google Scholar] [CrossRef]
Figure 1. The study area within Europe (The Czech Republic).
Water 14 01870 g001
Figure 2. The completed and planned water reservoirs in the Czech Republic.
Water 14 01870 g002
Figure 3. Share (%) of land use categories in water reservoirs and their surroundings in four periods. Water reservoirs were differentiated by their depth.
Water 14 01870 g003
Figure 4. Visualizing the road network changes between 1950 and 1990 [km].
Water 14 01870 g004
Table 1. Dams by periods of construction.
Period1880/19501950/19901990/2020
Number of objects4293
Total area incl. buffer zone [km2]132.441075.98122.99
Mean area incl. buffer zone [km2]33.1137.1041.00
Std. dev. incl. buffer zone [km2]15.7840.906.49
Table 2. The proportion of the land use categories in the existing water reservoirs and their surroundings over four periods (%).
Land UseProportion (%) in:
1880195019902020
Arable land42.437.225.723.9
Permanent grassland18.116.111.210.6
Orchard0.20.40.60.6
Vineyard and hopfield0.30.30.30.3
Forest36.840.740.441.7
Water area0.11.715.816.6
Built-up area2.22.93.74.3
Recreational area0.00.52.12.0
Other areas0.10.30.20.1
Table 3. The proportion of the land use categories in the planned water reservoirs and their surroundings over four periods (%).
Land UseProportion in (%):
1880195019902020
Arable land44.238.434.231.7
Permanent grassland16.617.315.916.7
Orchard0.30.20.30.2
Vineyard and hopfield0.20.20.30.3
Forest36.641.746.047.7
Water area0.20.20.30.3
Built-up area1.92.12.72.8
Recreational area0.00.00.20.2
Other areas0.00.10.10.1
Table 4. The proportion of the land use categories in the drinking water reservoirs and other reservoirs with their surroundings in four periods (%).
Land Use18801880195019501990199020202020
Arable land36.846.329.742.420.529.417.428.4
Permanent grassland23.914.123.311.015.28.315.07.4
Orchard0.00.30.00.60.10.90.11.0
Vineyard and hopfield0.00.50.00.40.00.40.00.5
Forest37.336.441.840.044.837.445.739.0
Water area0.00.21.91.615.815.817.615.9
Built-up area1.92.42.53.22.54.62.65.3
Recreational area0.00.00.20.81.12.81.42.5
Other areas0.10.00.60.00.20.30.10.1
Note: bold—drinking water reservoirs; italics—other lakes.
Table 5. The proportion of the land-use change processes that occurred between 1950 and 1990 in the existing water reservoirs and their surroundings.
Land Use 1950Land Use 1990Area in %
Permanent grasslandWater area6.8
Arable landPermanent grassland5.9
ForestWater area5.8
Arable landWater area4.2
Arable landForest3.5
Permanent grasslandForest2.8
Permanent grasslandArable land2.5
Arable landBuilt-up area1.1
Arable landRecreational area0.8
Table 6. The transport network changes: the lakes (n = 4) constructed in 1880/1950 [km].
ROAD1950Total
Class I RoadClass II + III RoadLocal RoadNo Road
1880Imperial road2.320002.32
Other road019.371.912.8424.12
No road1.3366.69xxx
Total3.6586.06xxx
RAILWAYRailwayNo railwayTotal
1880Railway000
No railway13.80x13.80
Total13.800.00x
Table 7. The transport network changes: the lakes (n = 29) constructed in 1950/1990 [km].
ROAD1990Total
HighwayClass I RoadClass II + III RoadFerryLocal RoadNo Road
1950Class I road031.513.50012.8917.5065.39
Class II + III road00.54285.49075.93161.82523.79
Ferry000000.830.83
Local Road00.331.540xxx
No road11.6730.63198.242.07xxx
Total11.6763.00488.772.07xxx
RAILWAYRailwayNo railwayTotal
1950Railway68.1834.42102.60
No railway16.35x16.35
Total84.5434.42118.95
Table 8. The transport network changes: the lakes constructed (n = 3) in 1990/2020 [km].
ROAD2020Total
HighwayClass I RoadClass II + III RoadFerryLocal RoadNo Road
1990Highway0000000
Class I road005.5500.53 6.08
Class II + III road0062.9709.2420.3192.51
Ferry0000000.00
Local Road003.430xxx
No road000.730xxx
Total0072.680xxx
RAILWAYRailwayNo railwayTotal
1990Railway4.3604.36
No railway0x0
Total4.360x
Table 9. The proposed transport network changes and the current infrastructure to be flooded with planned lakes [km].
HighwayClass I RoadClass II + III RoadTotal RoadsRailway
Existing infrastructure0.518.3083.4892.2919.77
Planned infrastructure0.400.203.514.110.42
Publisher’s Note: MDPI stays neutral with regard to jurisdictional claims in published maps and institutional affiliations.

