
Determination of Glufosinate-P-Ammonium in Soil Using Precolumn Derivation and Reversed-Phase High-Performance Liquid Chromatography

Abstract
:1. Introduction
2. Experimental Section
2.1. Chemicals and Reagents
2.2. Instruments and Equipment
2.3. Solution Preparation
2.4. Test Soil
2.5. Sample Extraction
2.6. Purification
2.7. Derivatization
2.8. HPLC Analysis
2.9. Method Validation Set
3. Results and Discussion
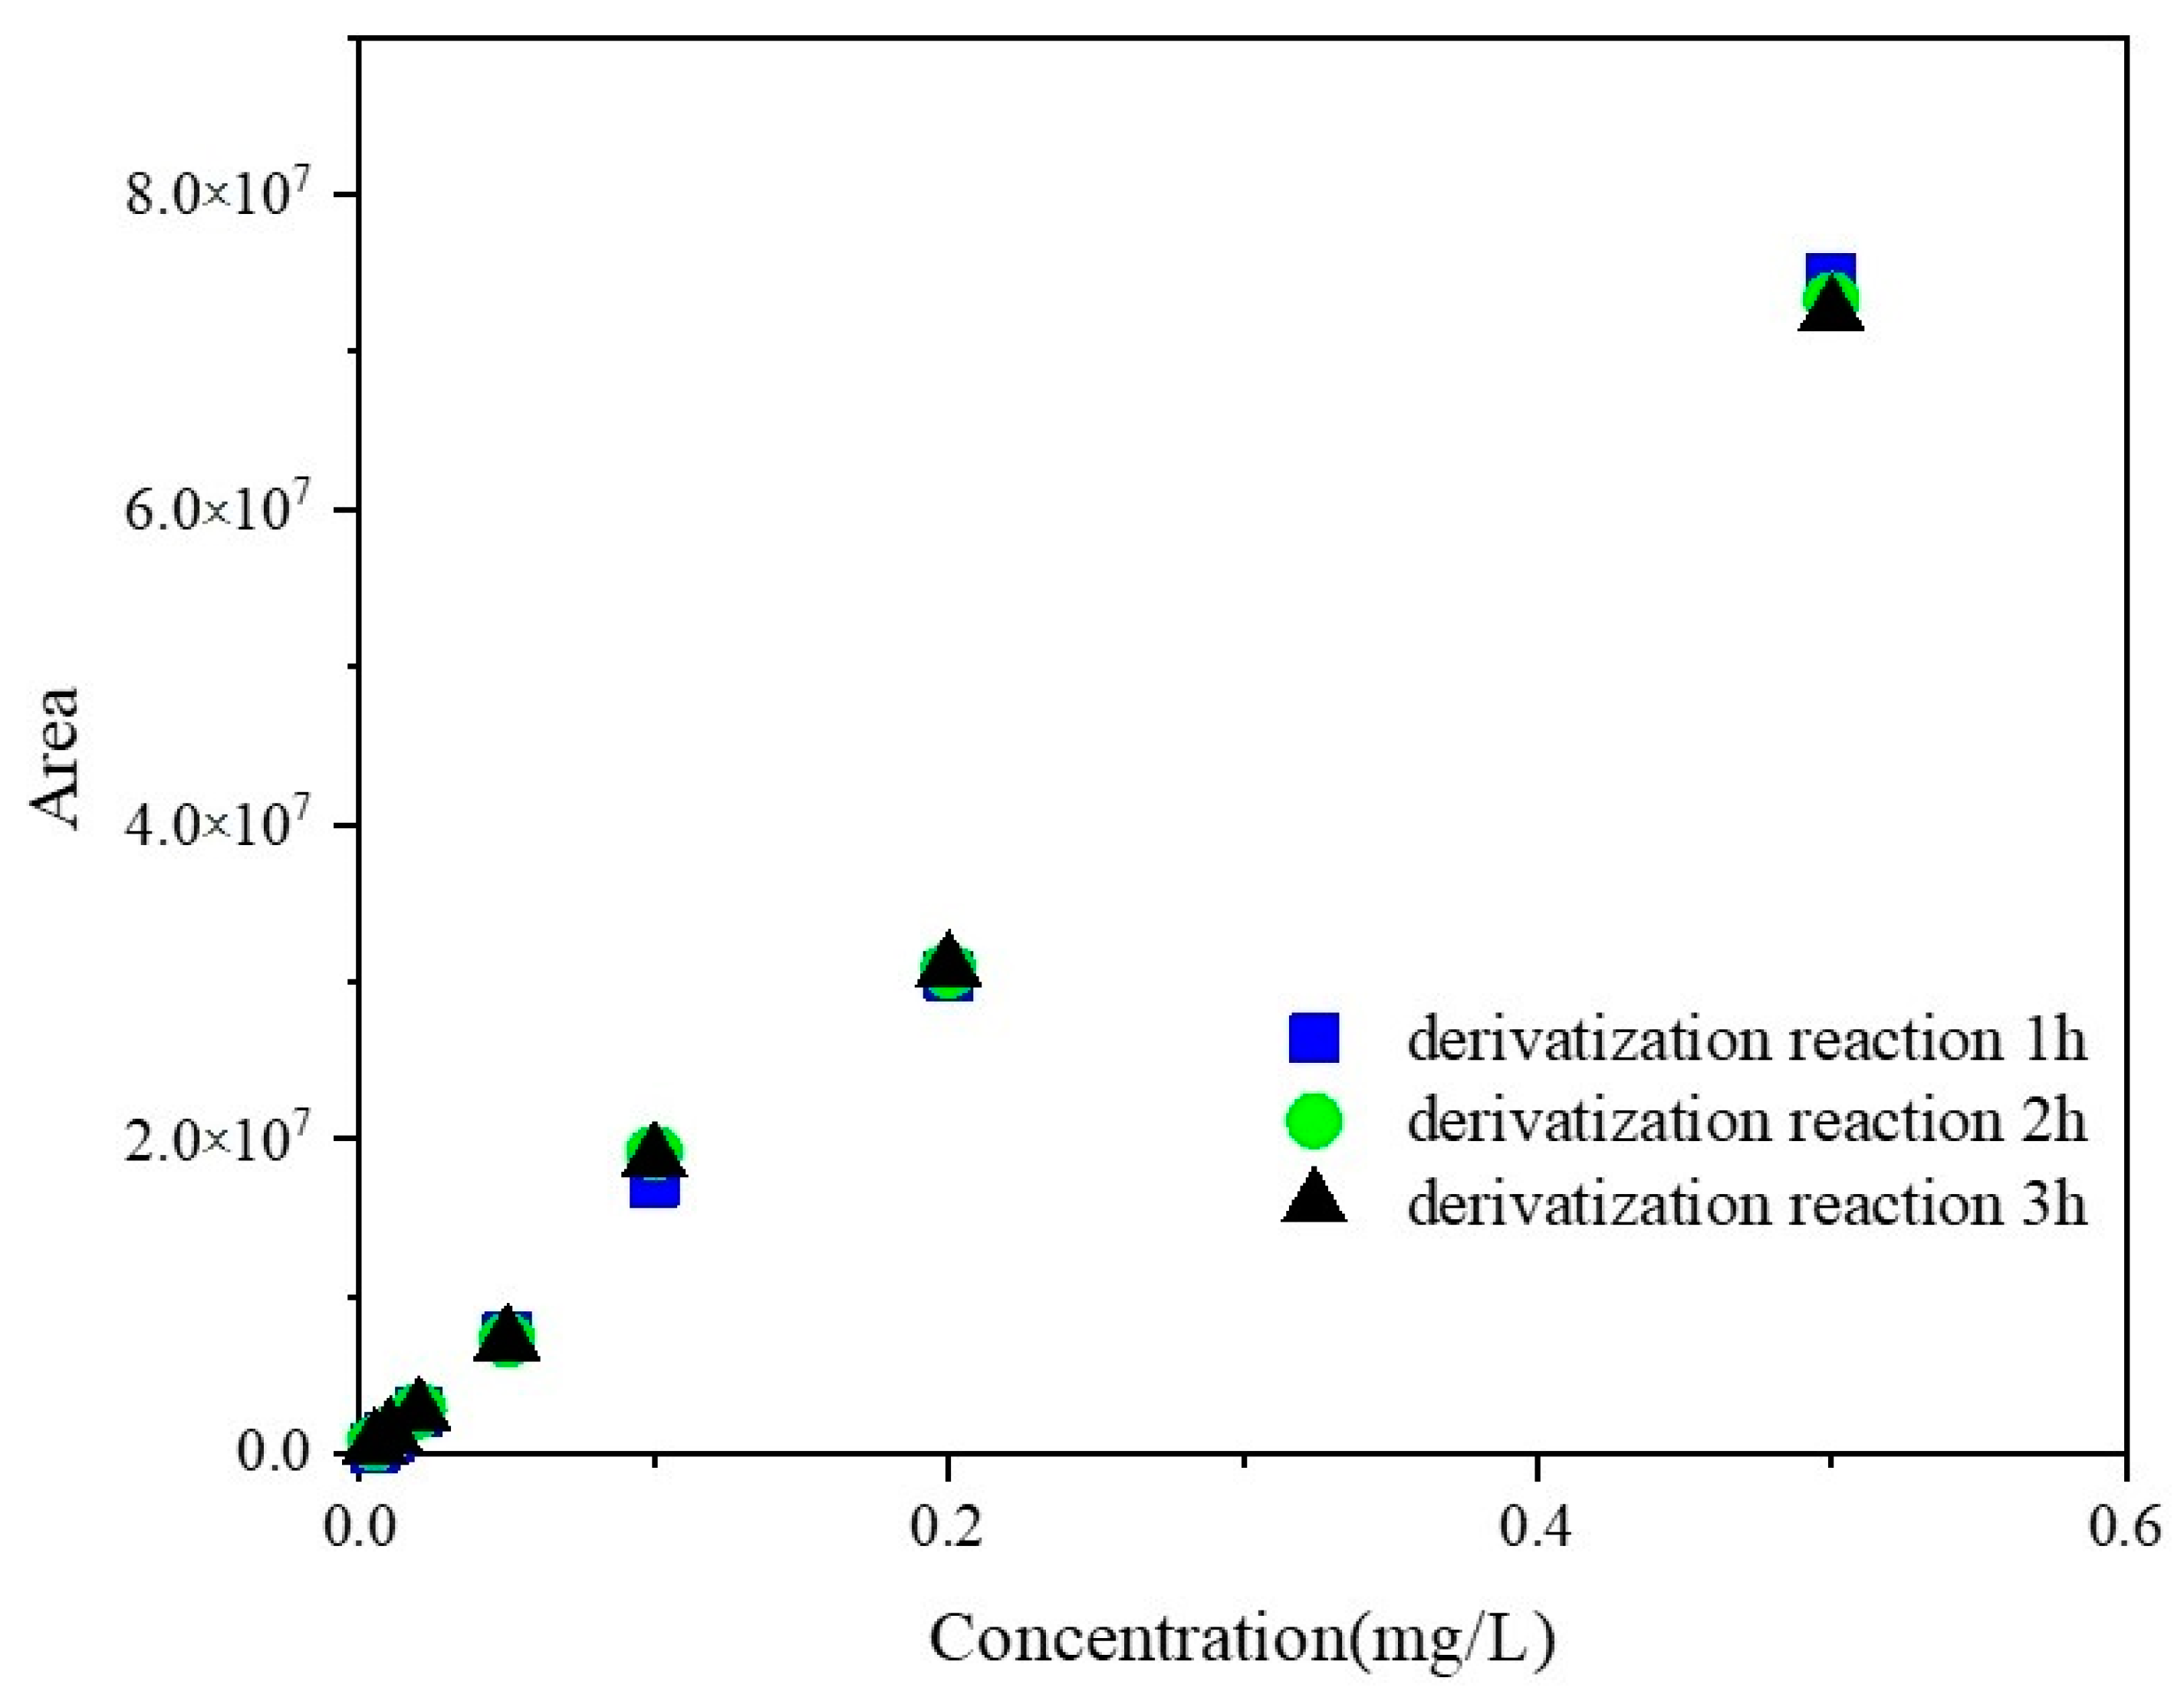
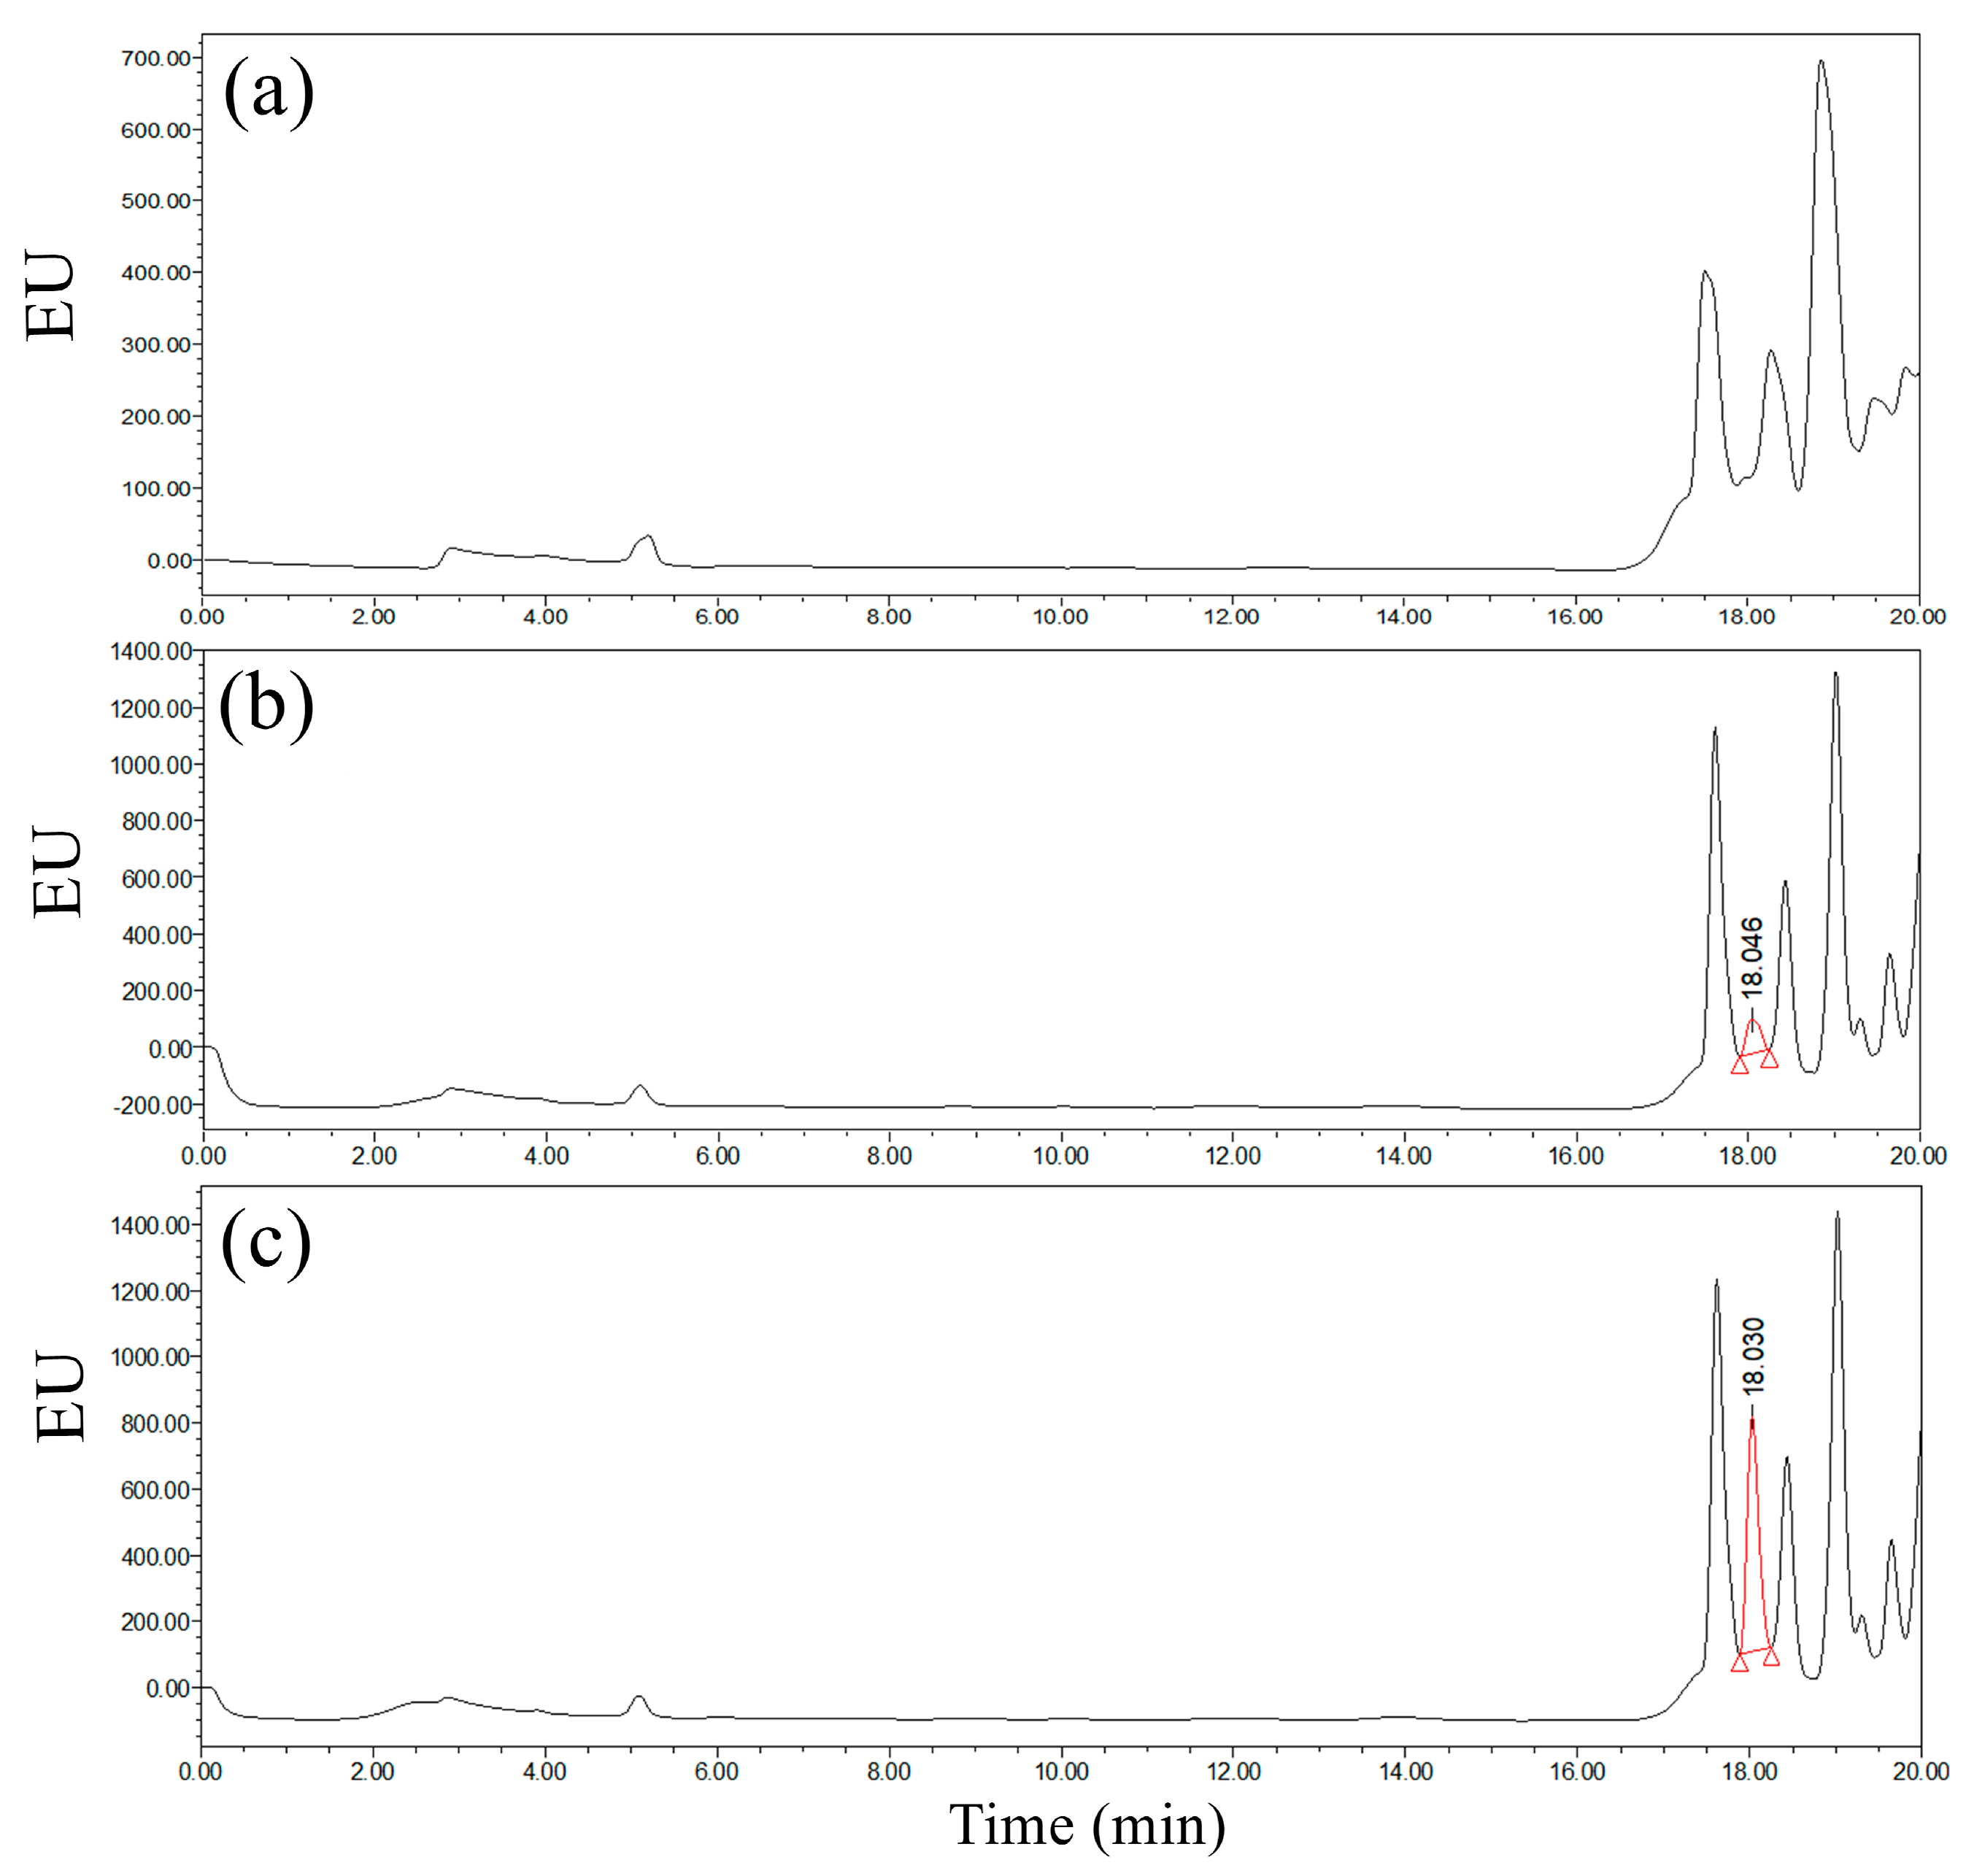
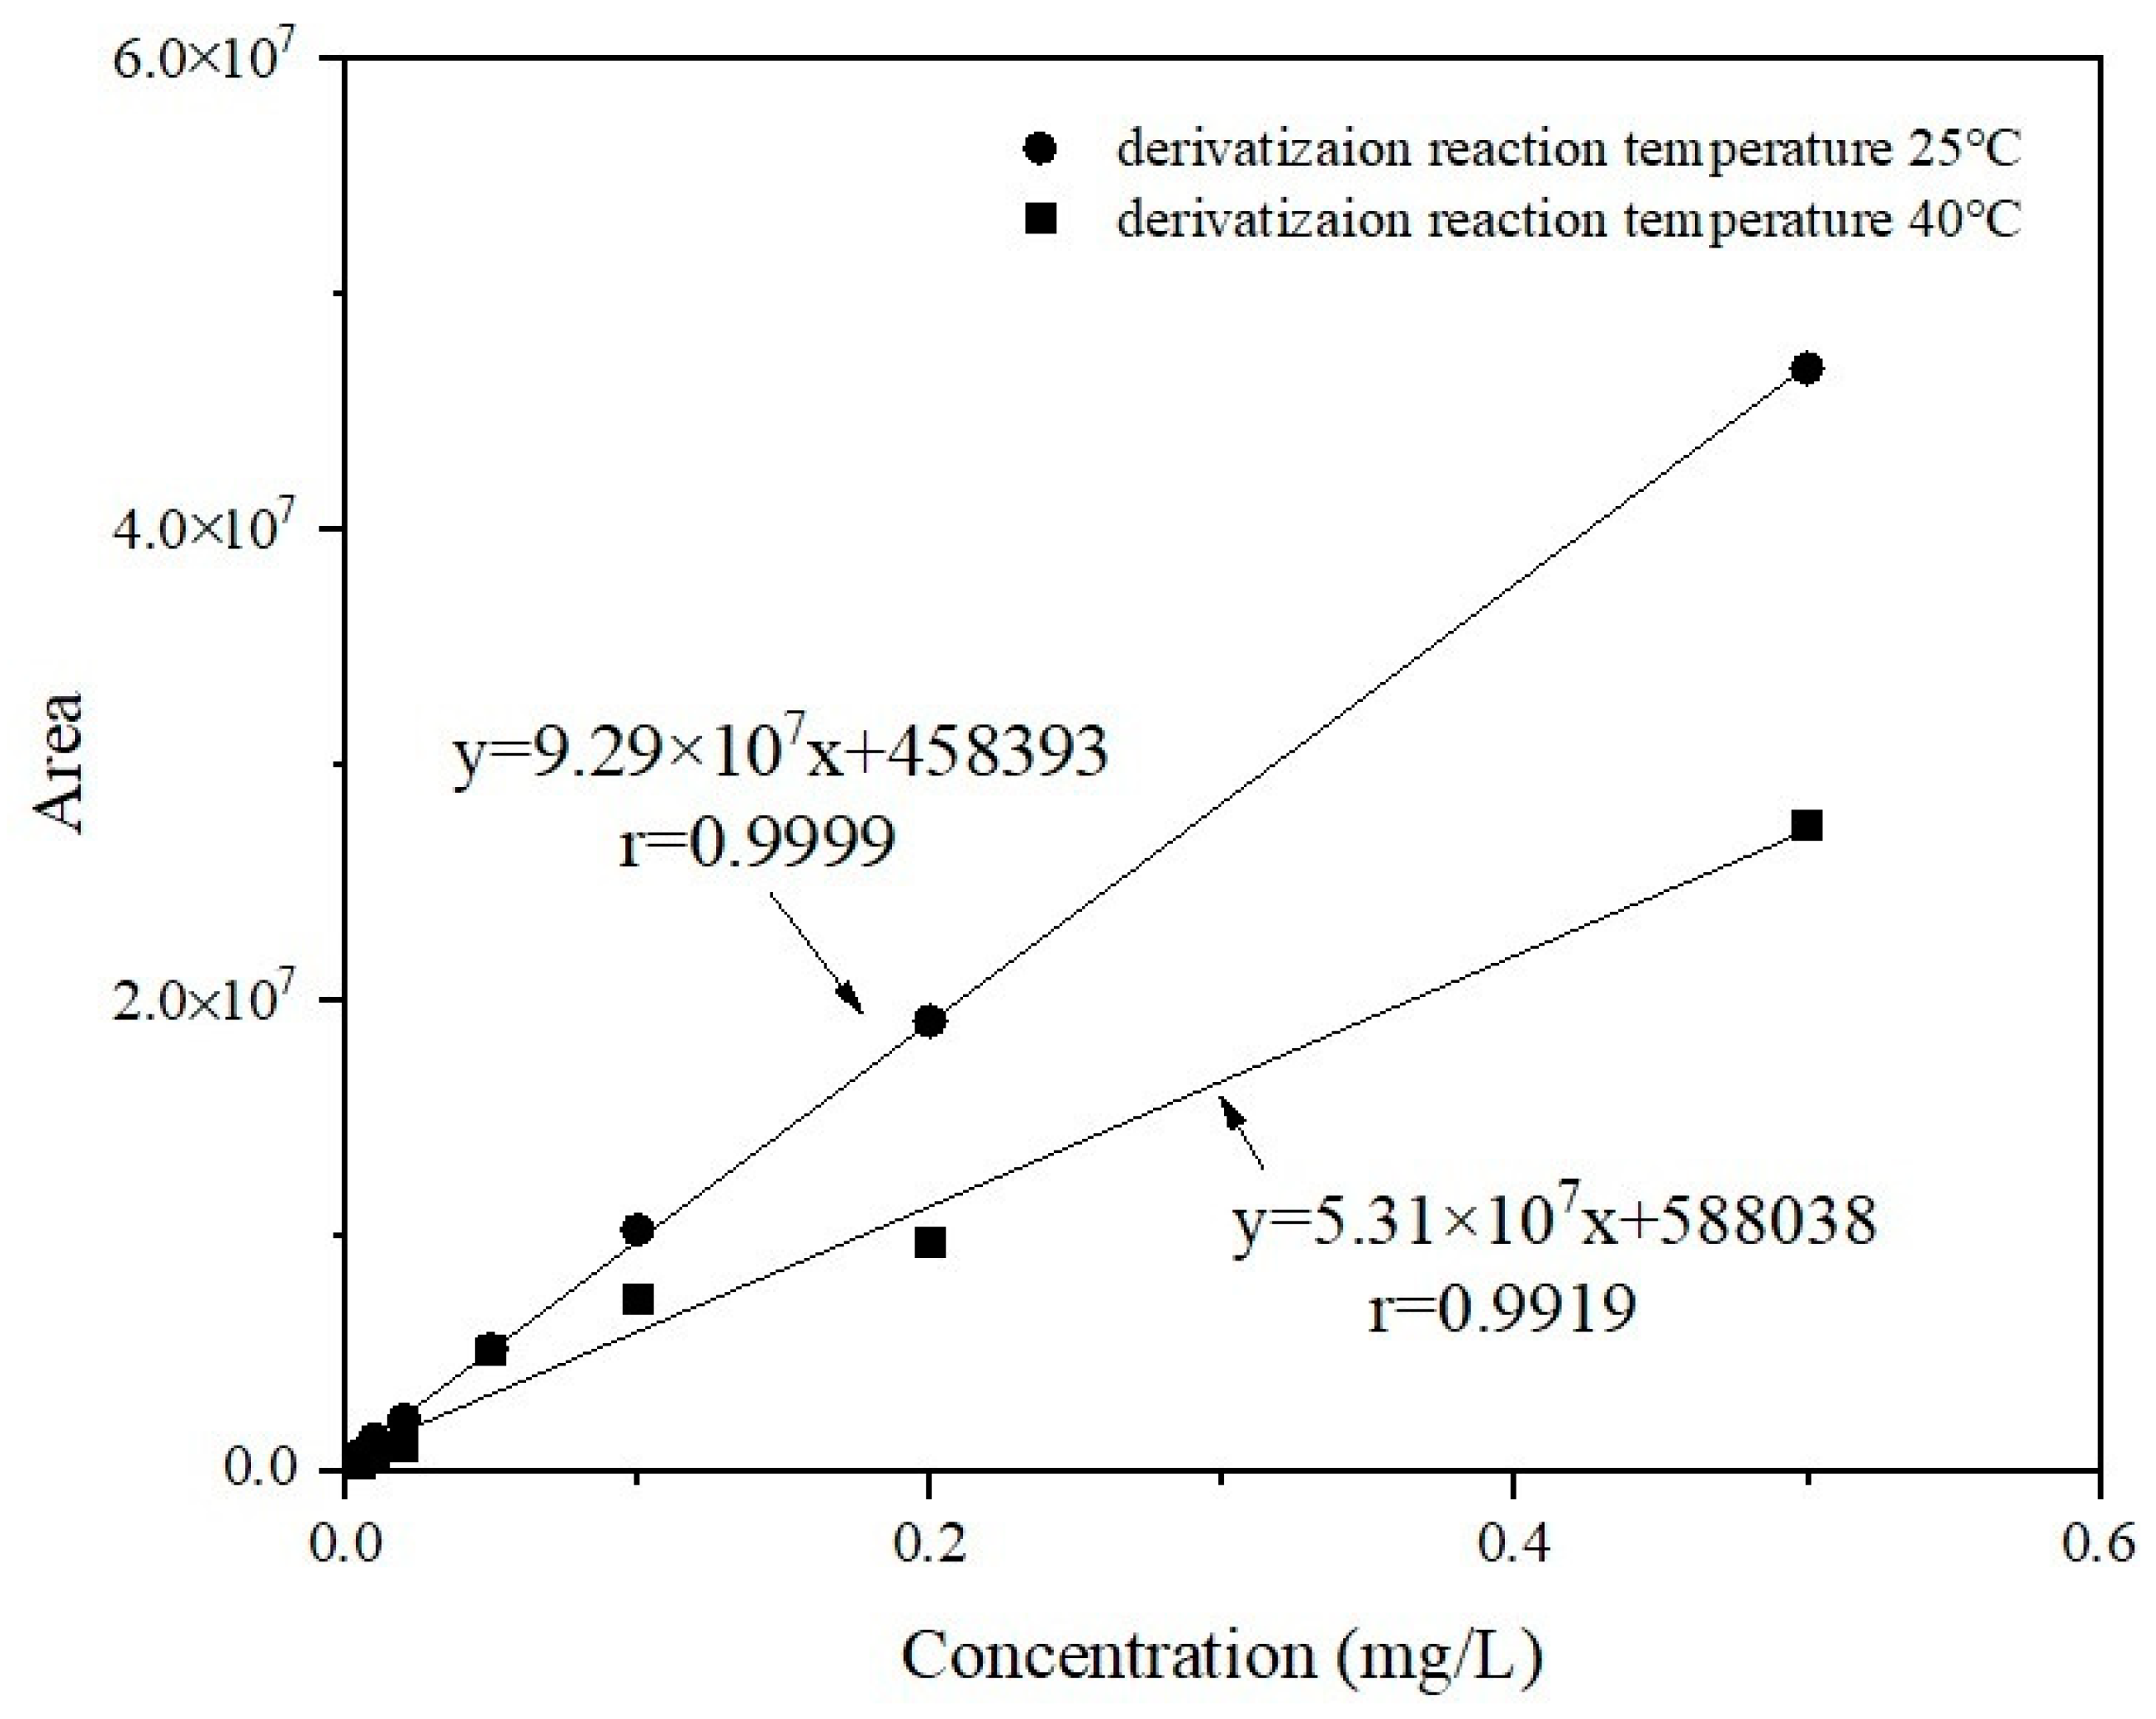
3.1. Optimization of Derivatization Conditions
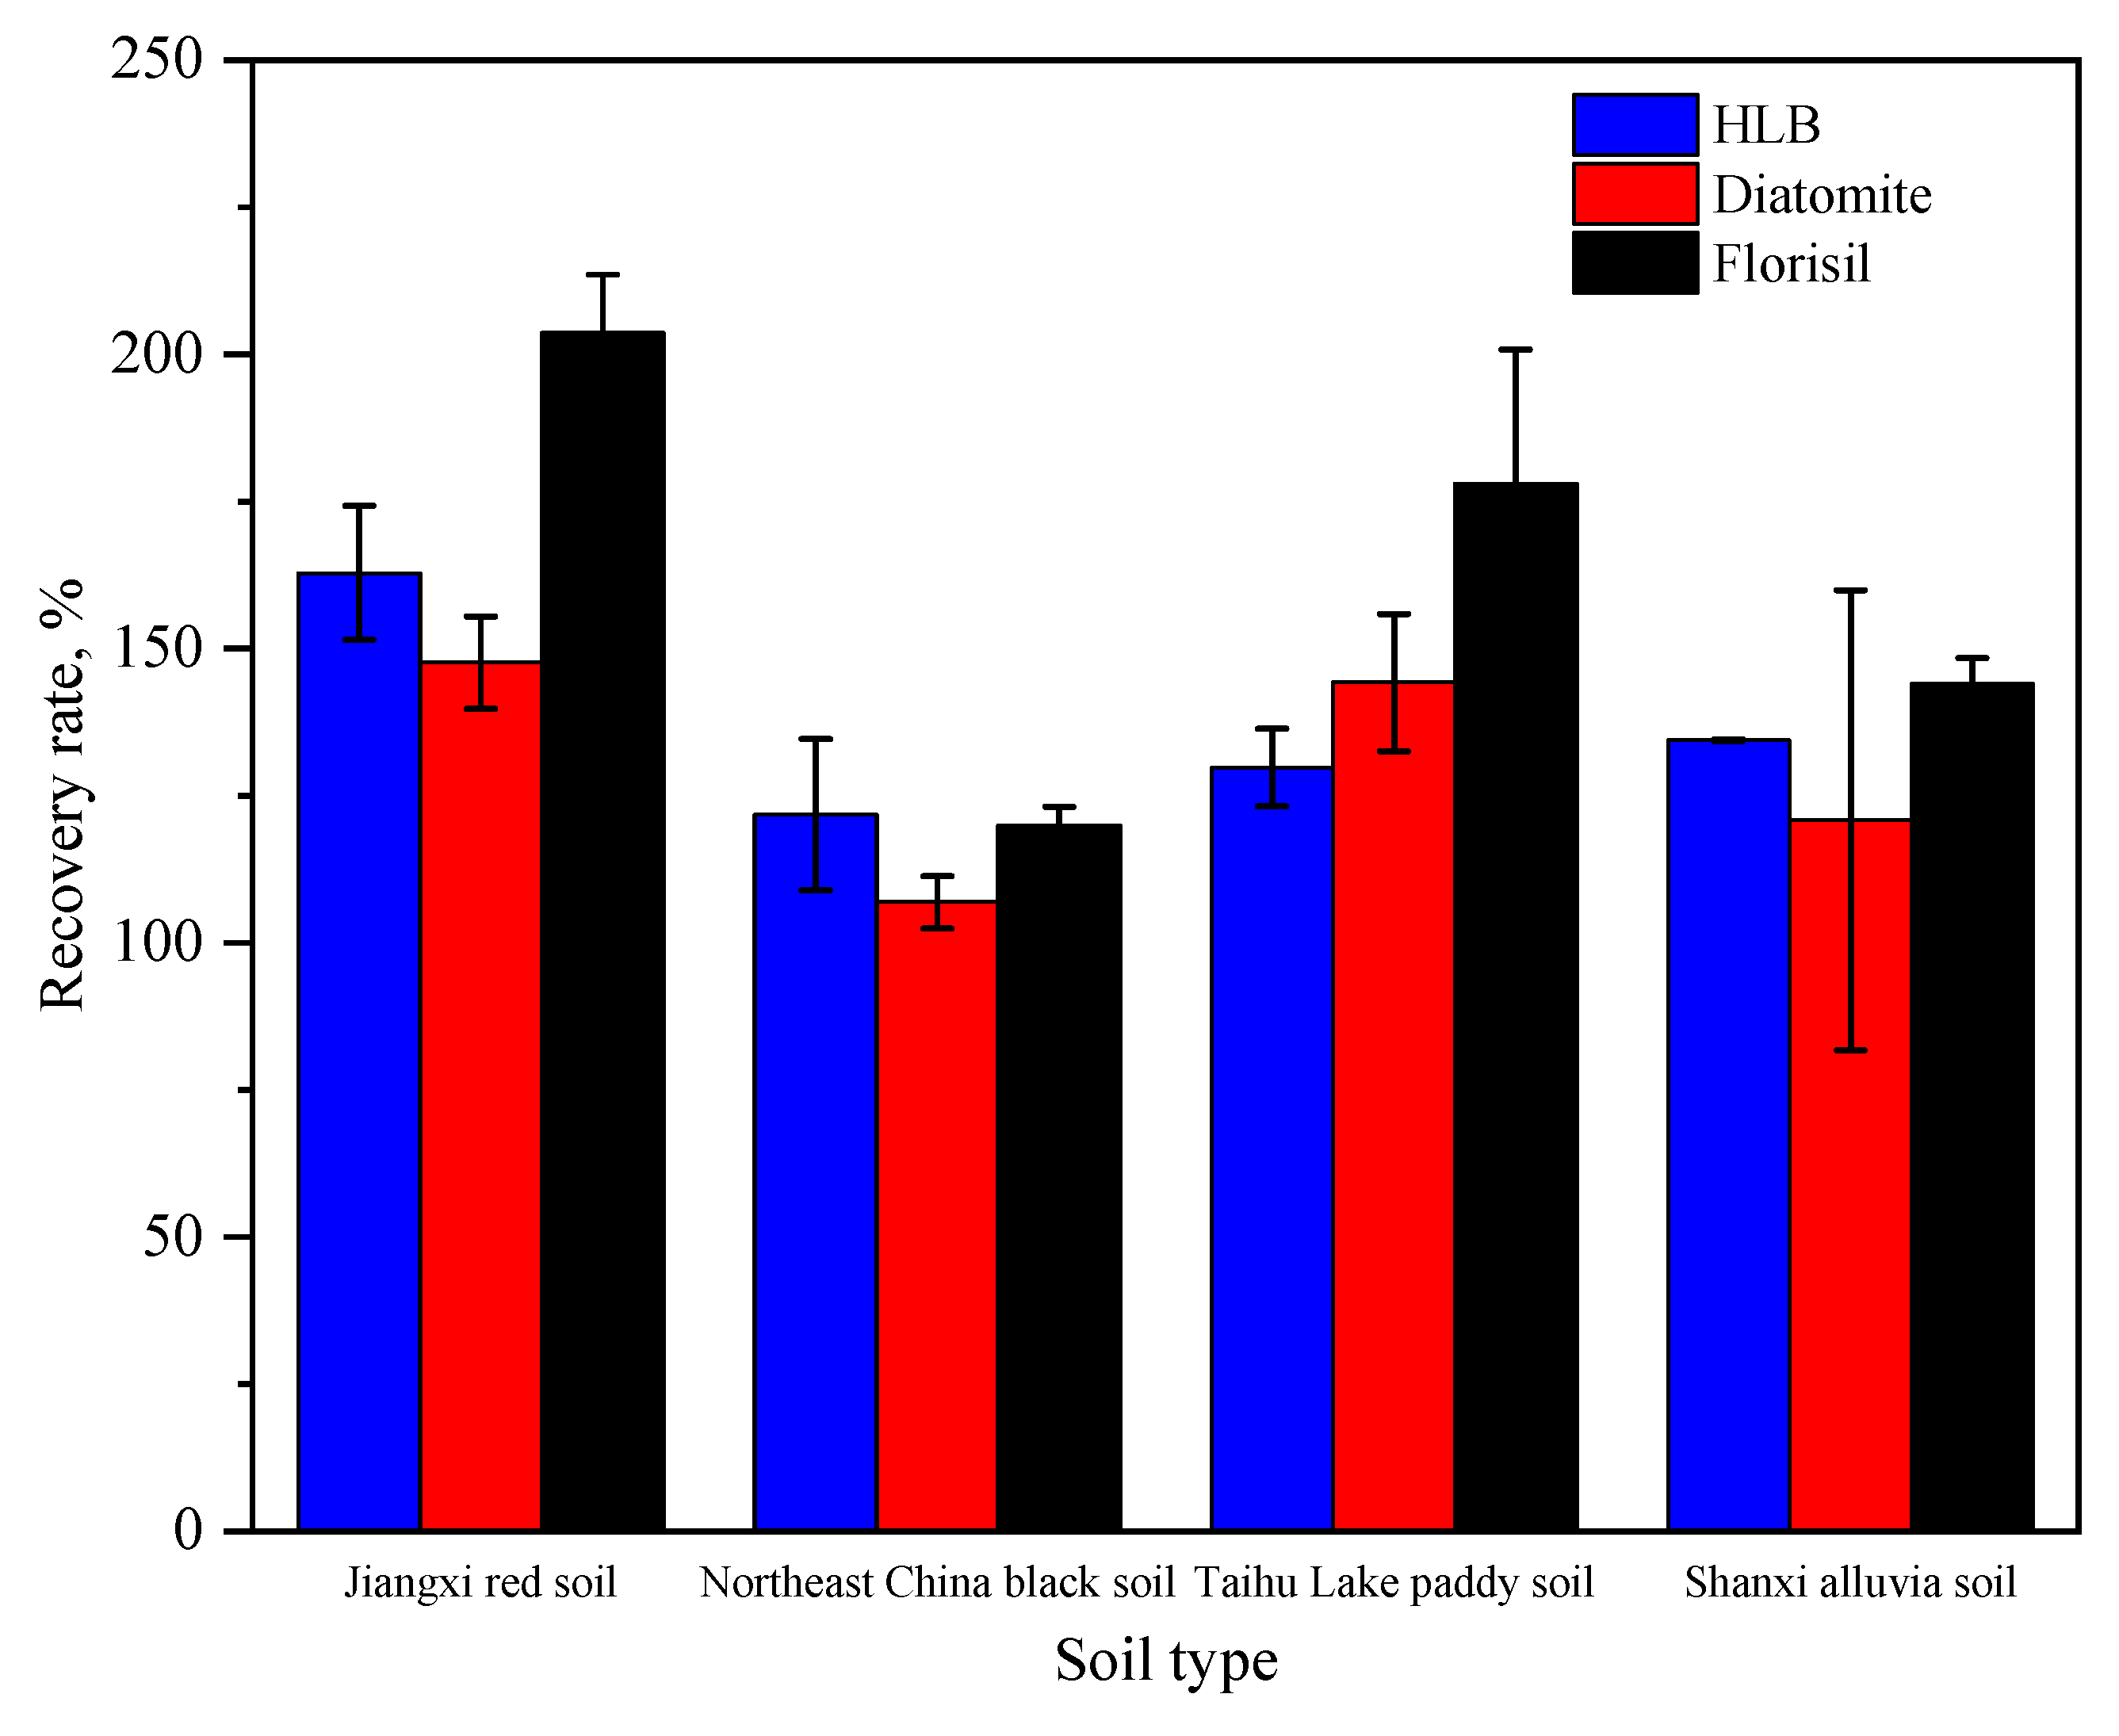
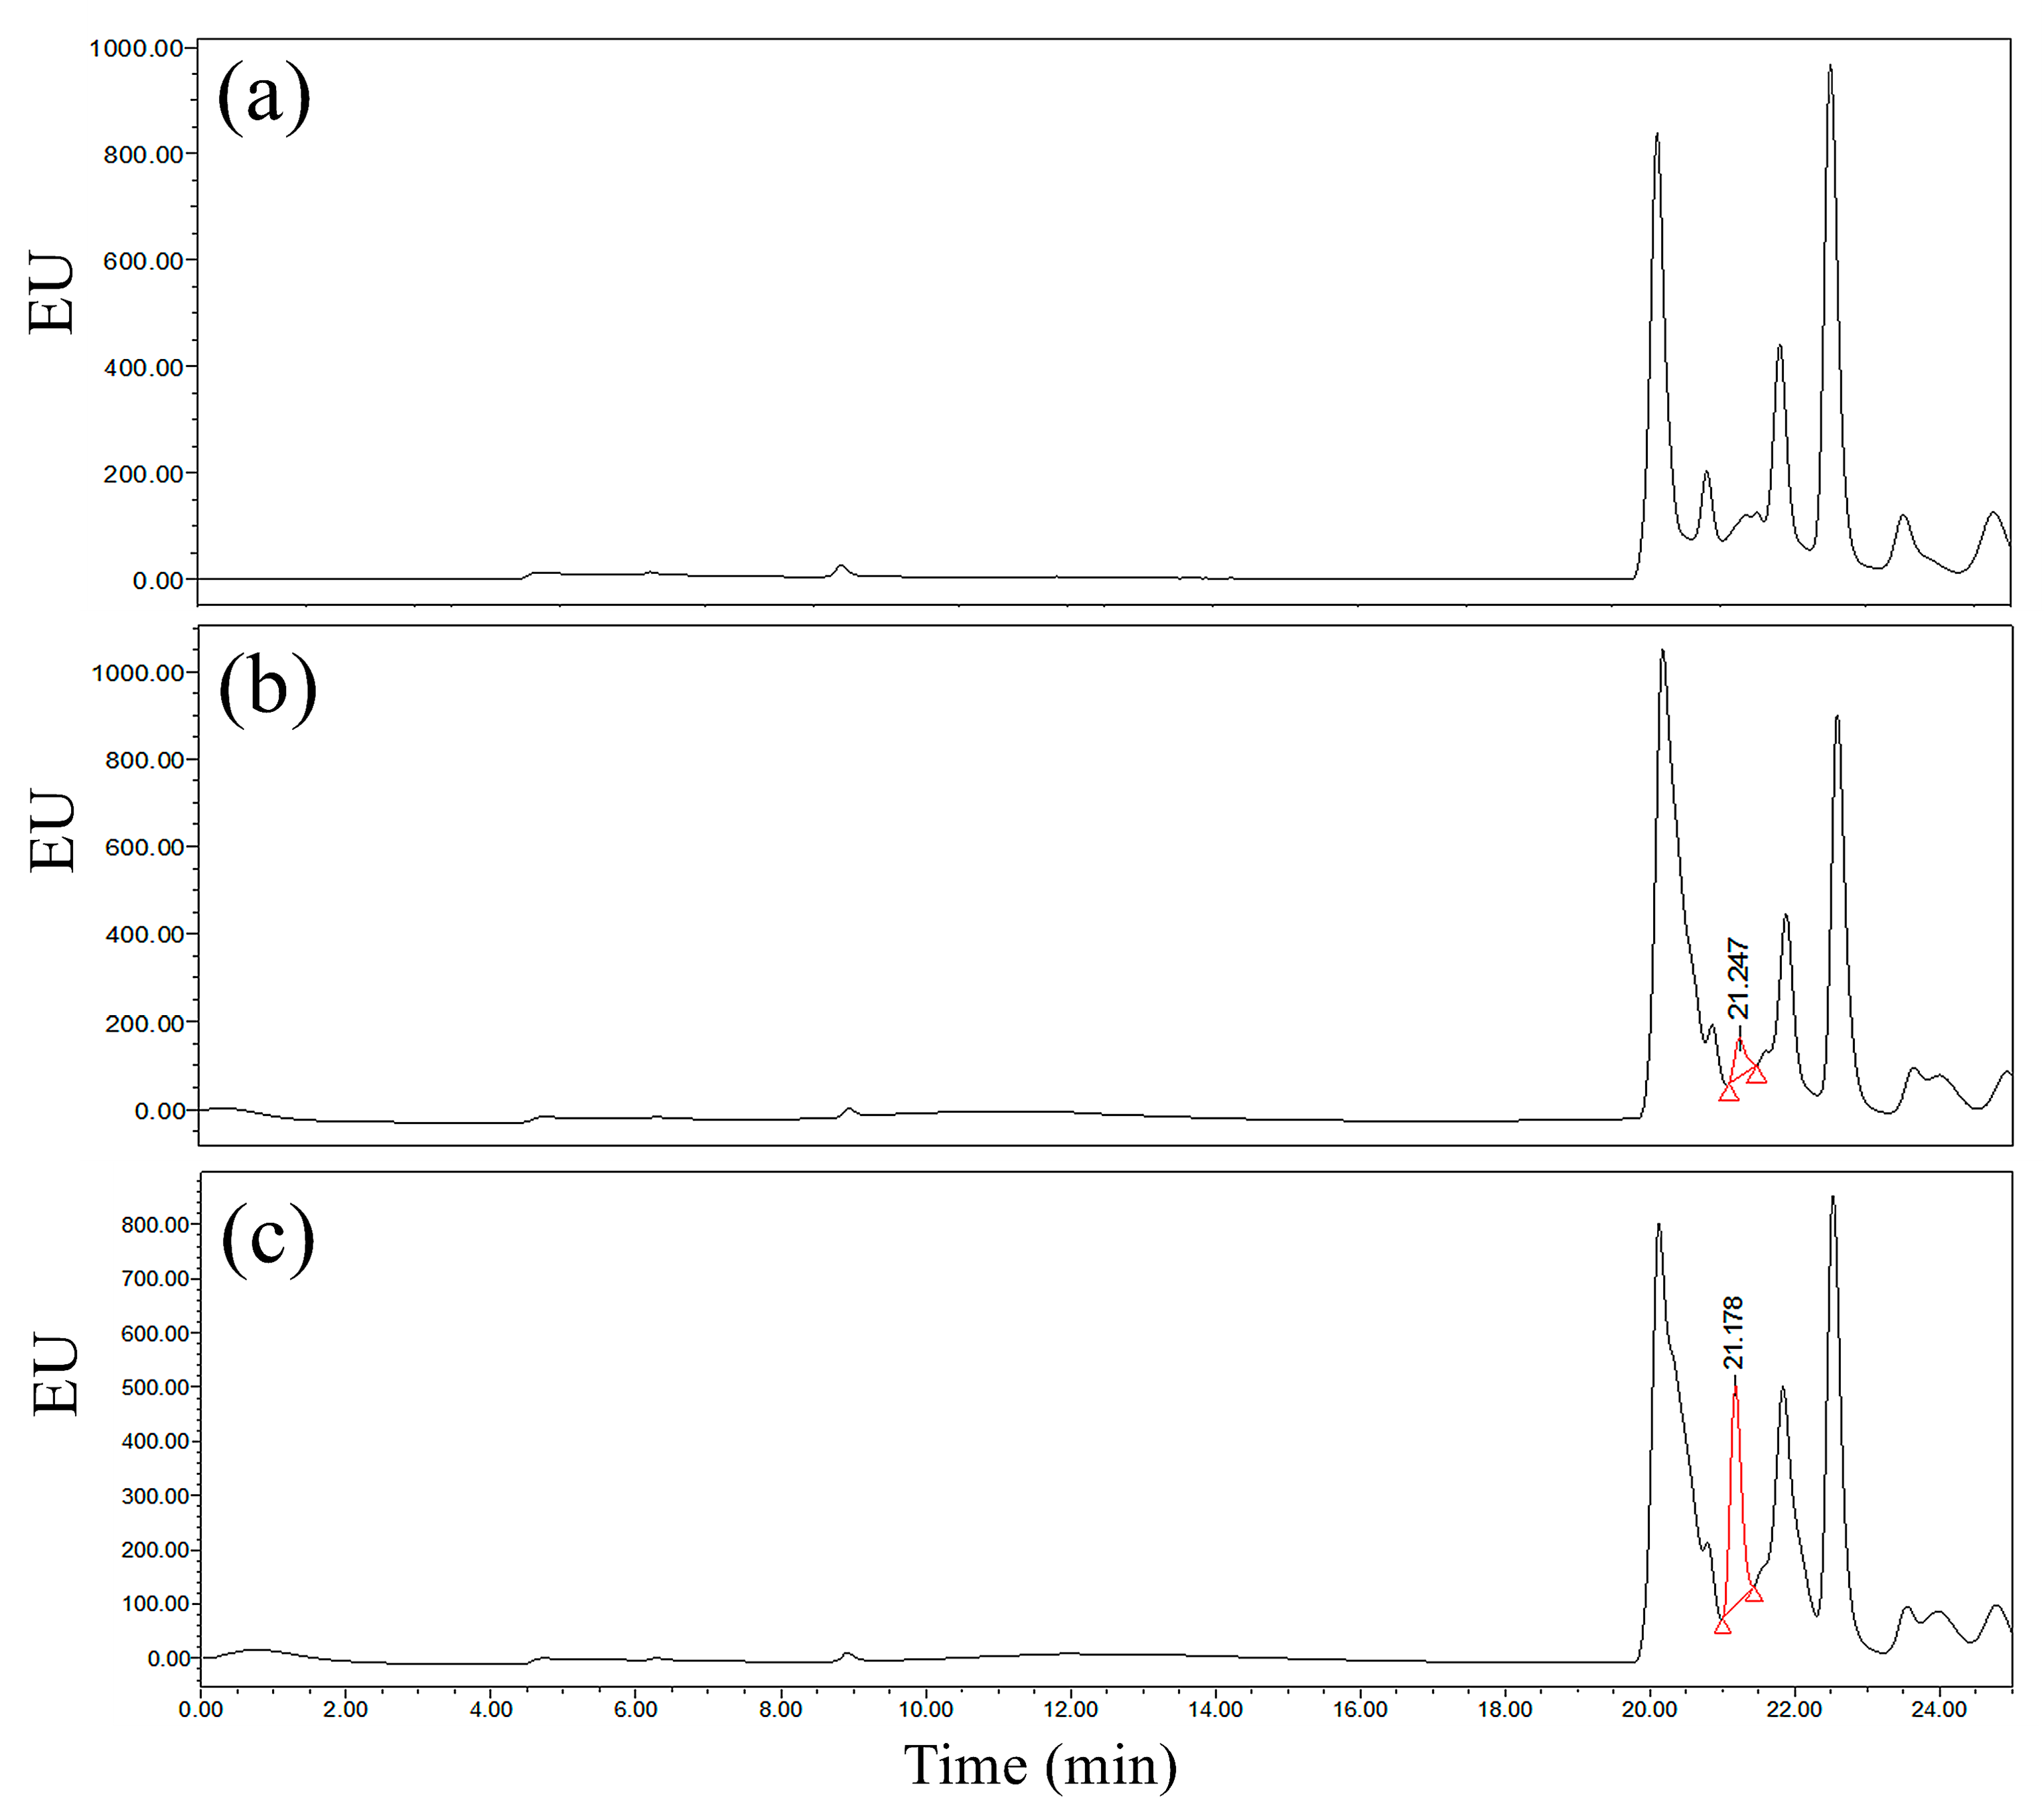
3.2. Comparison of Purification Effects
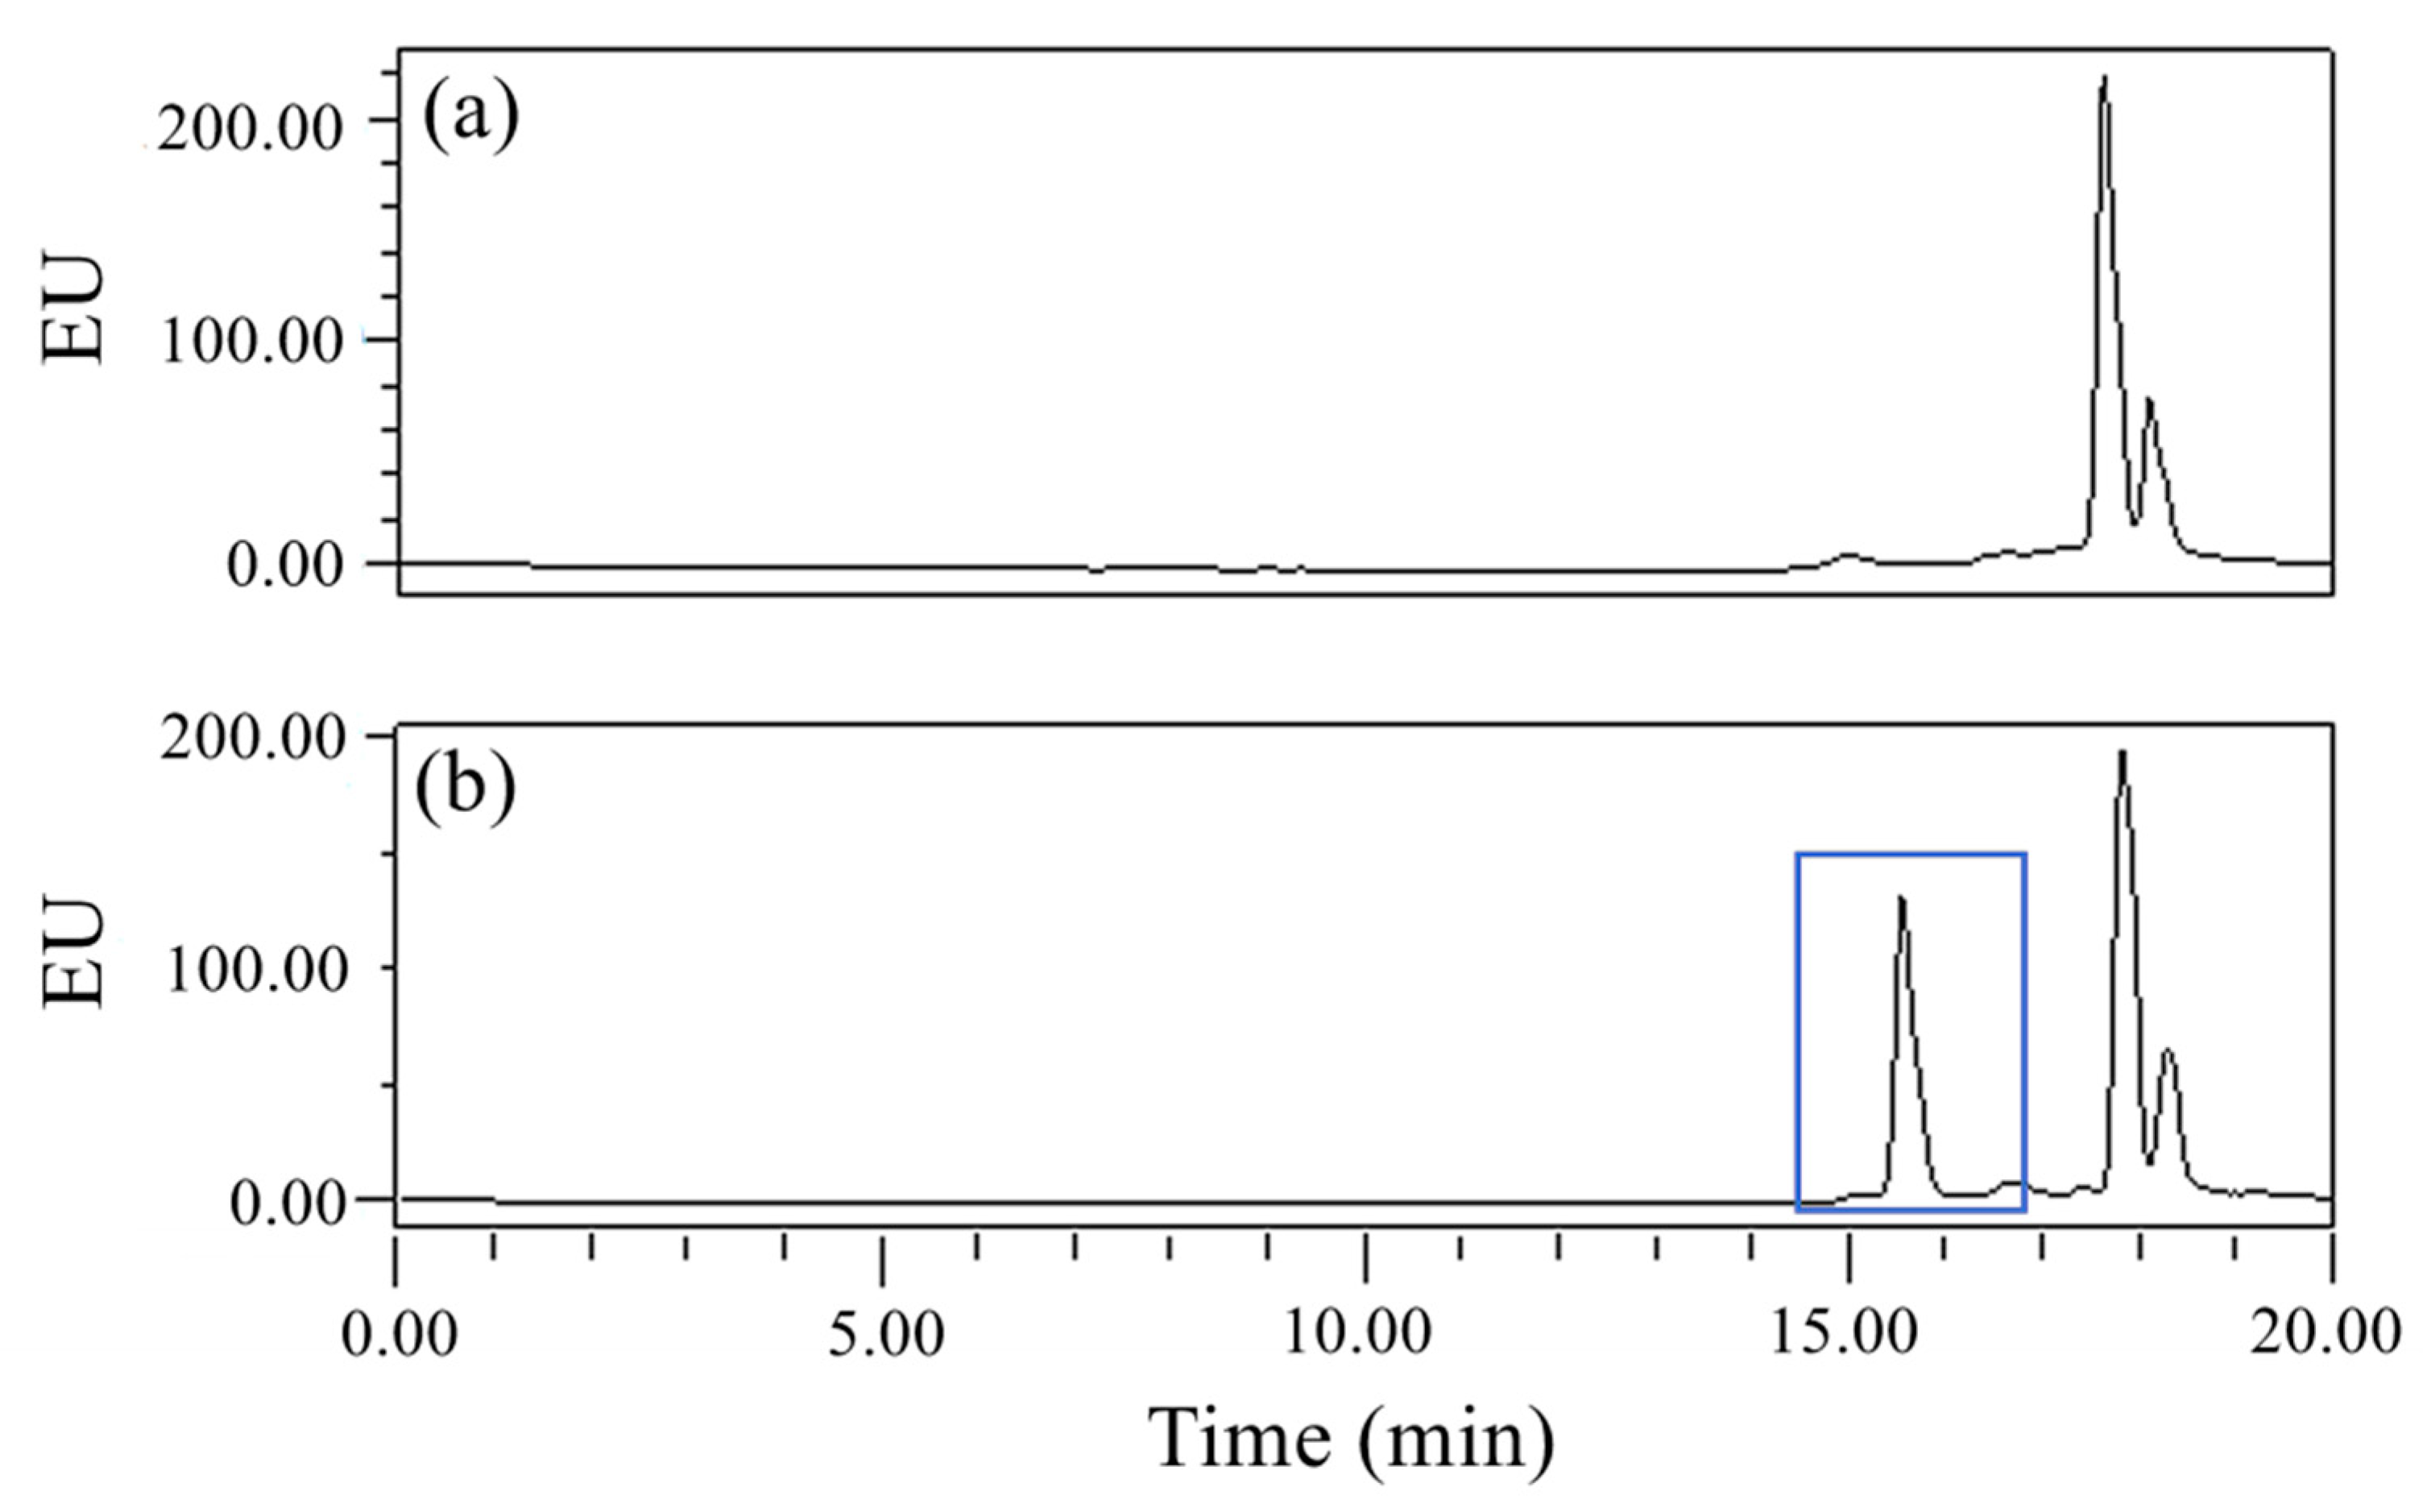
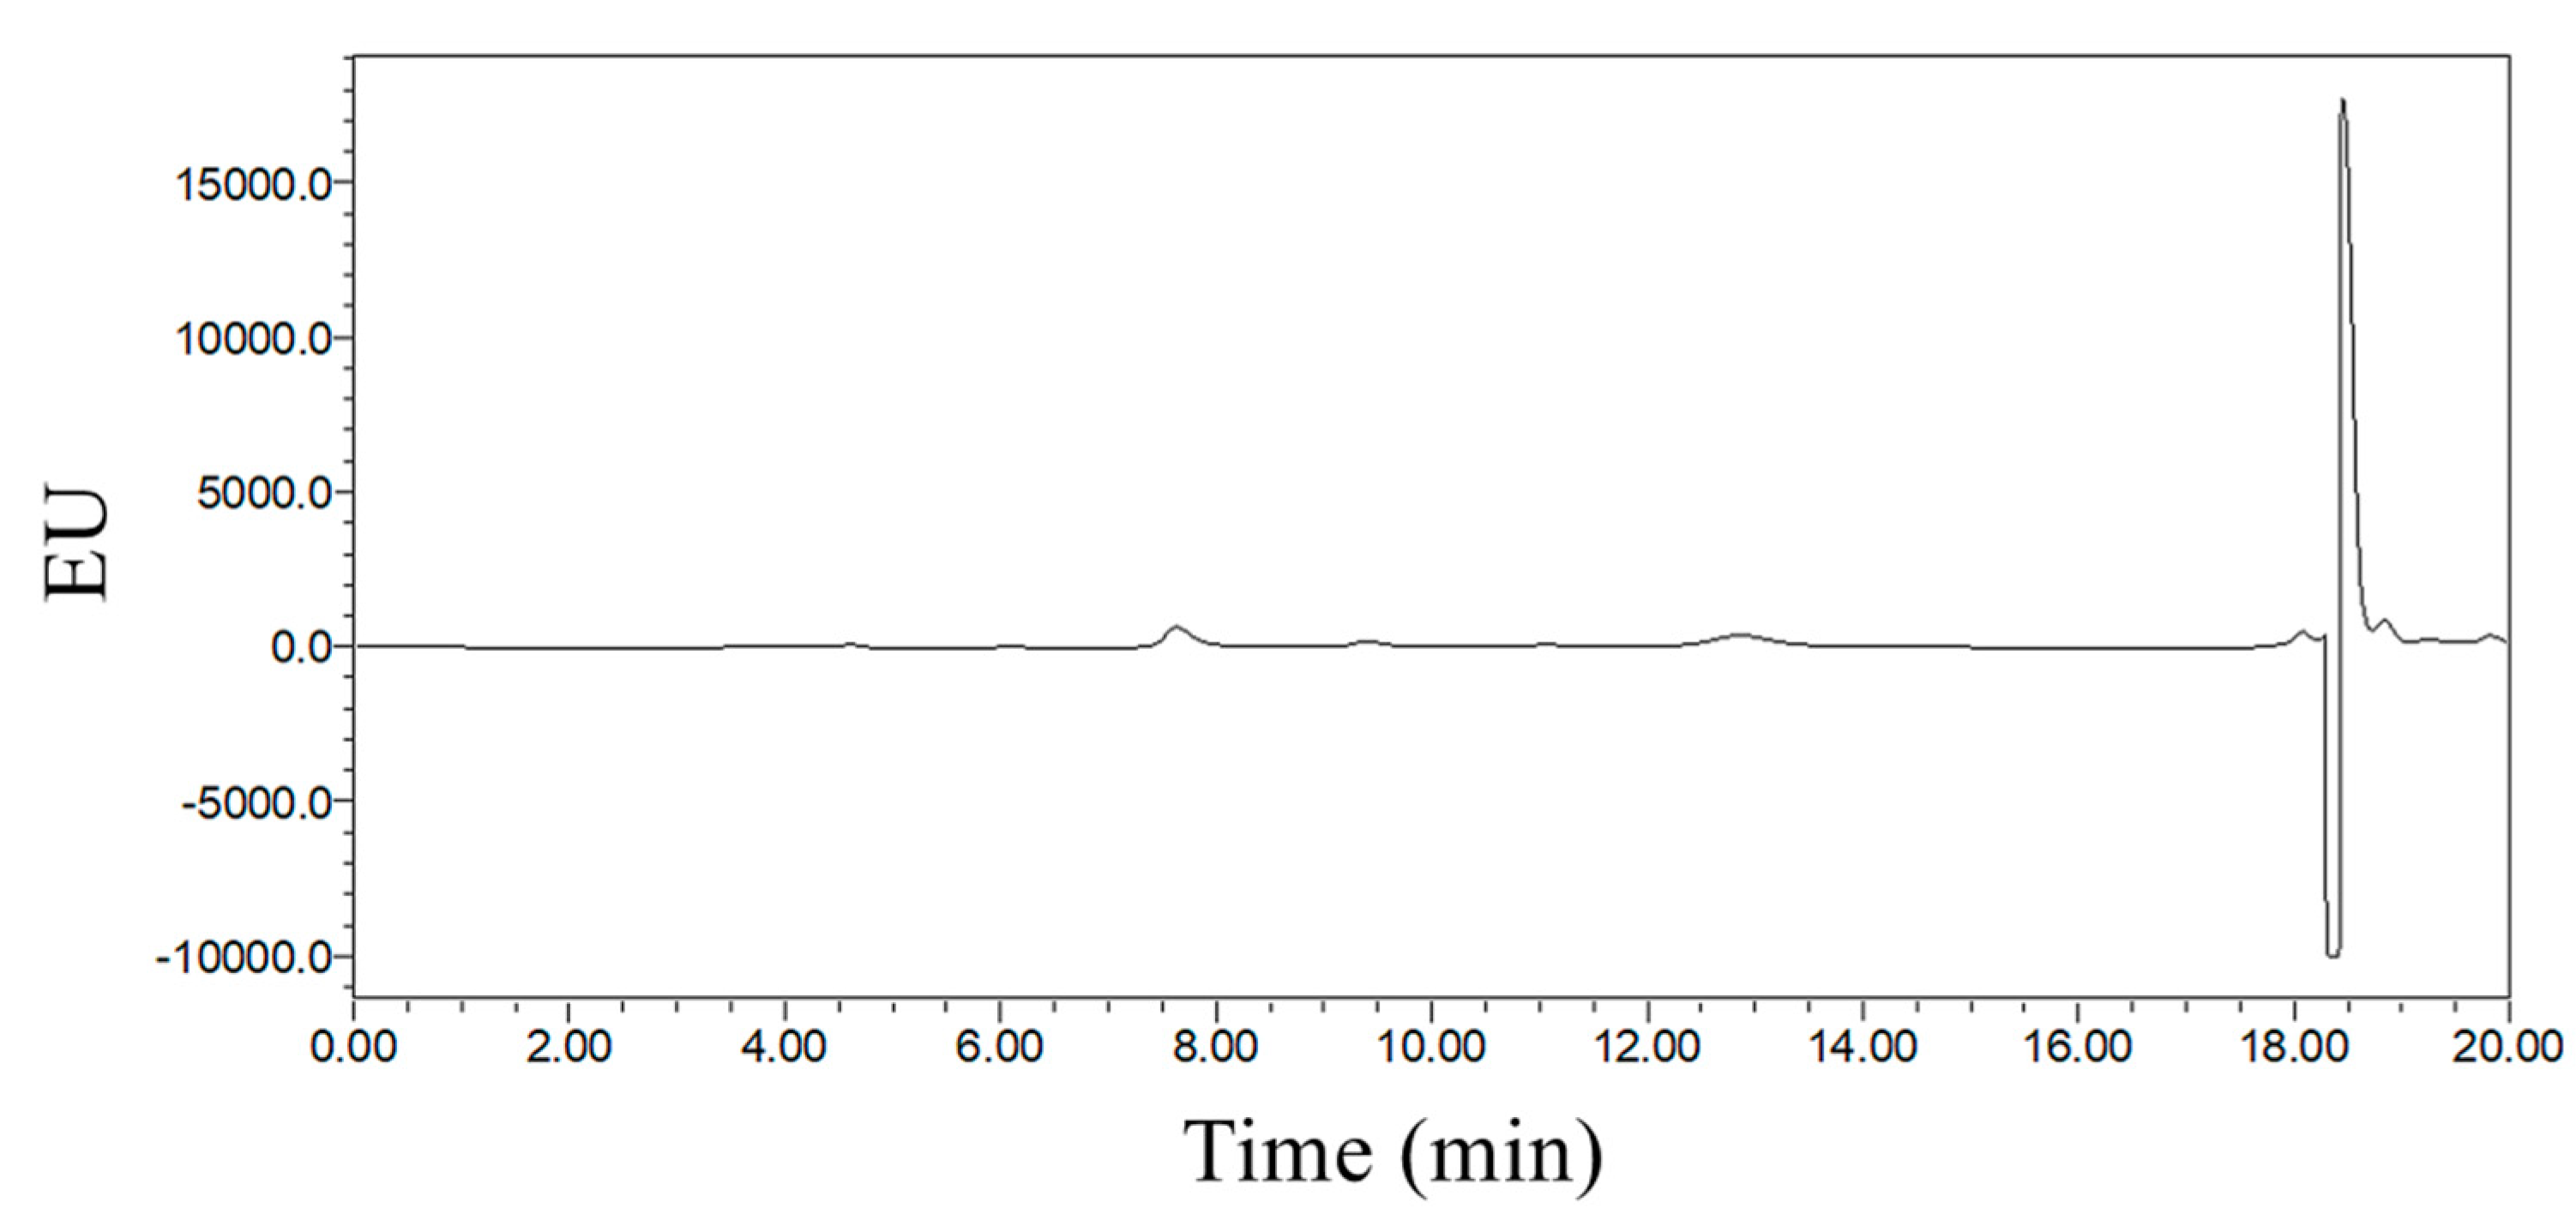
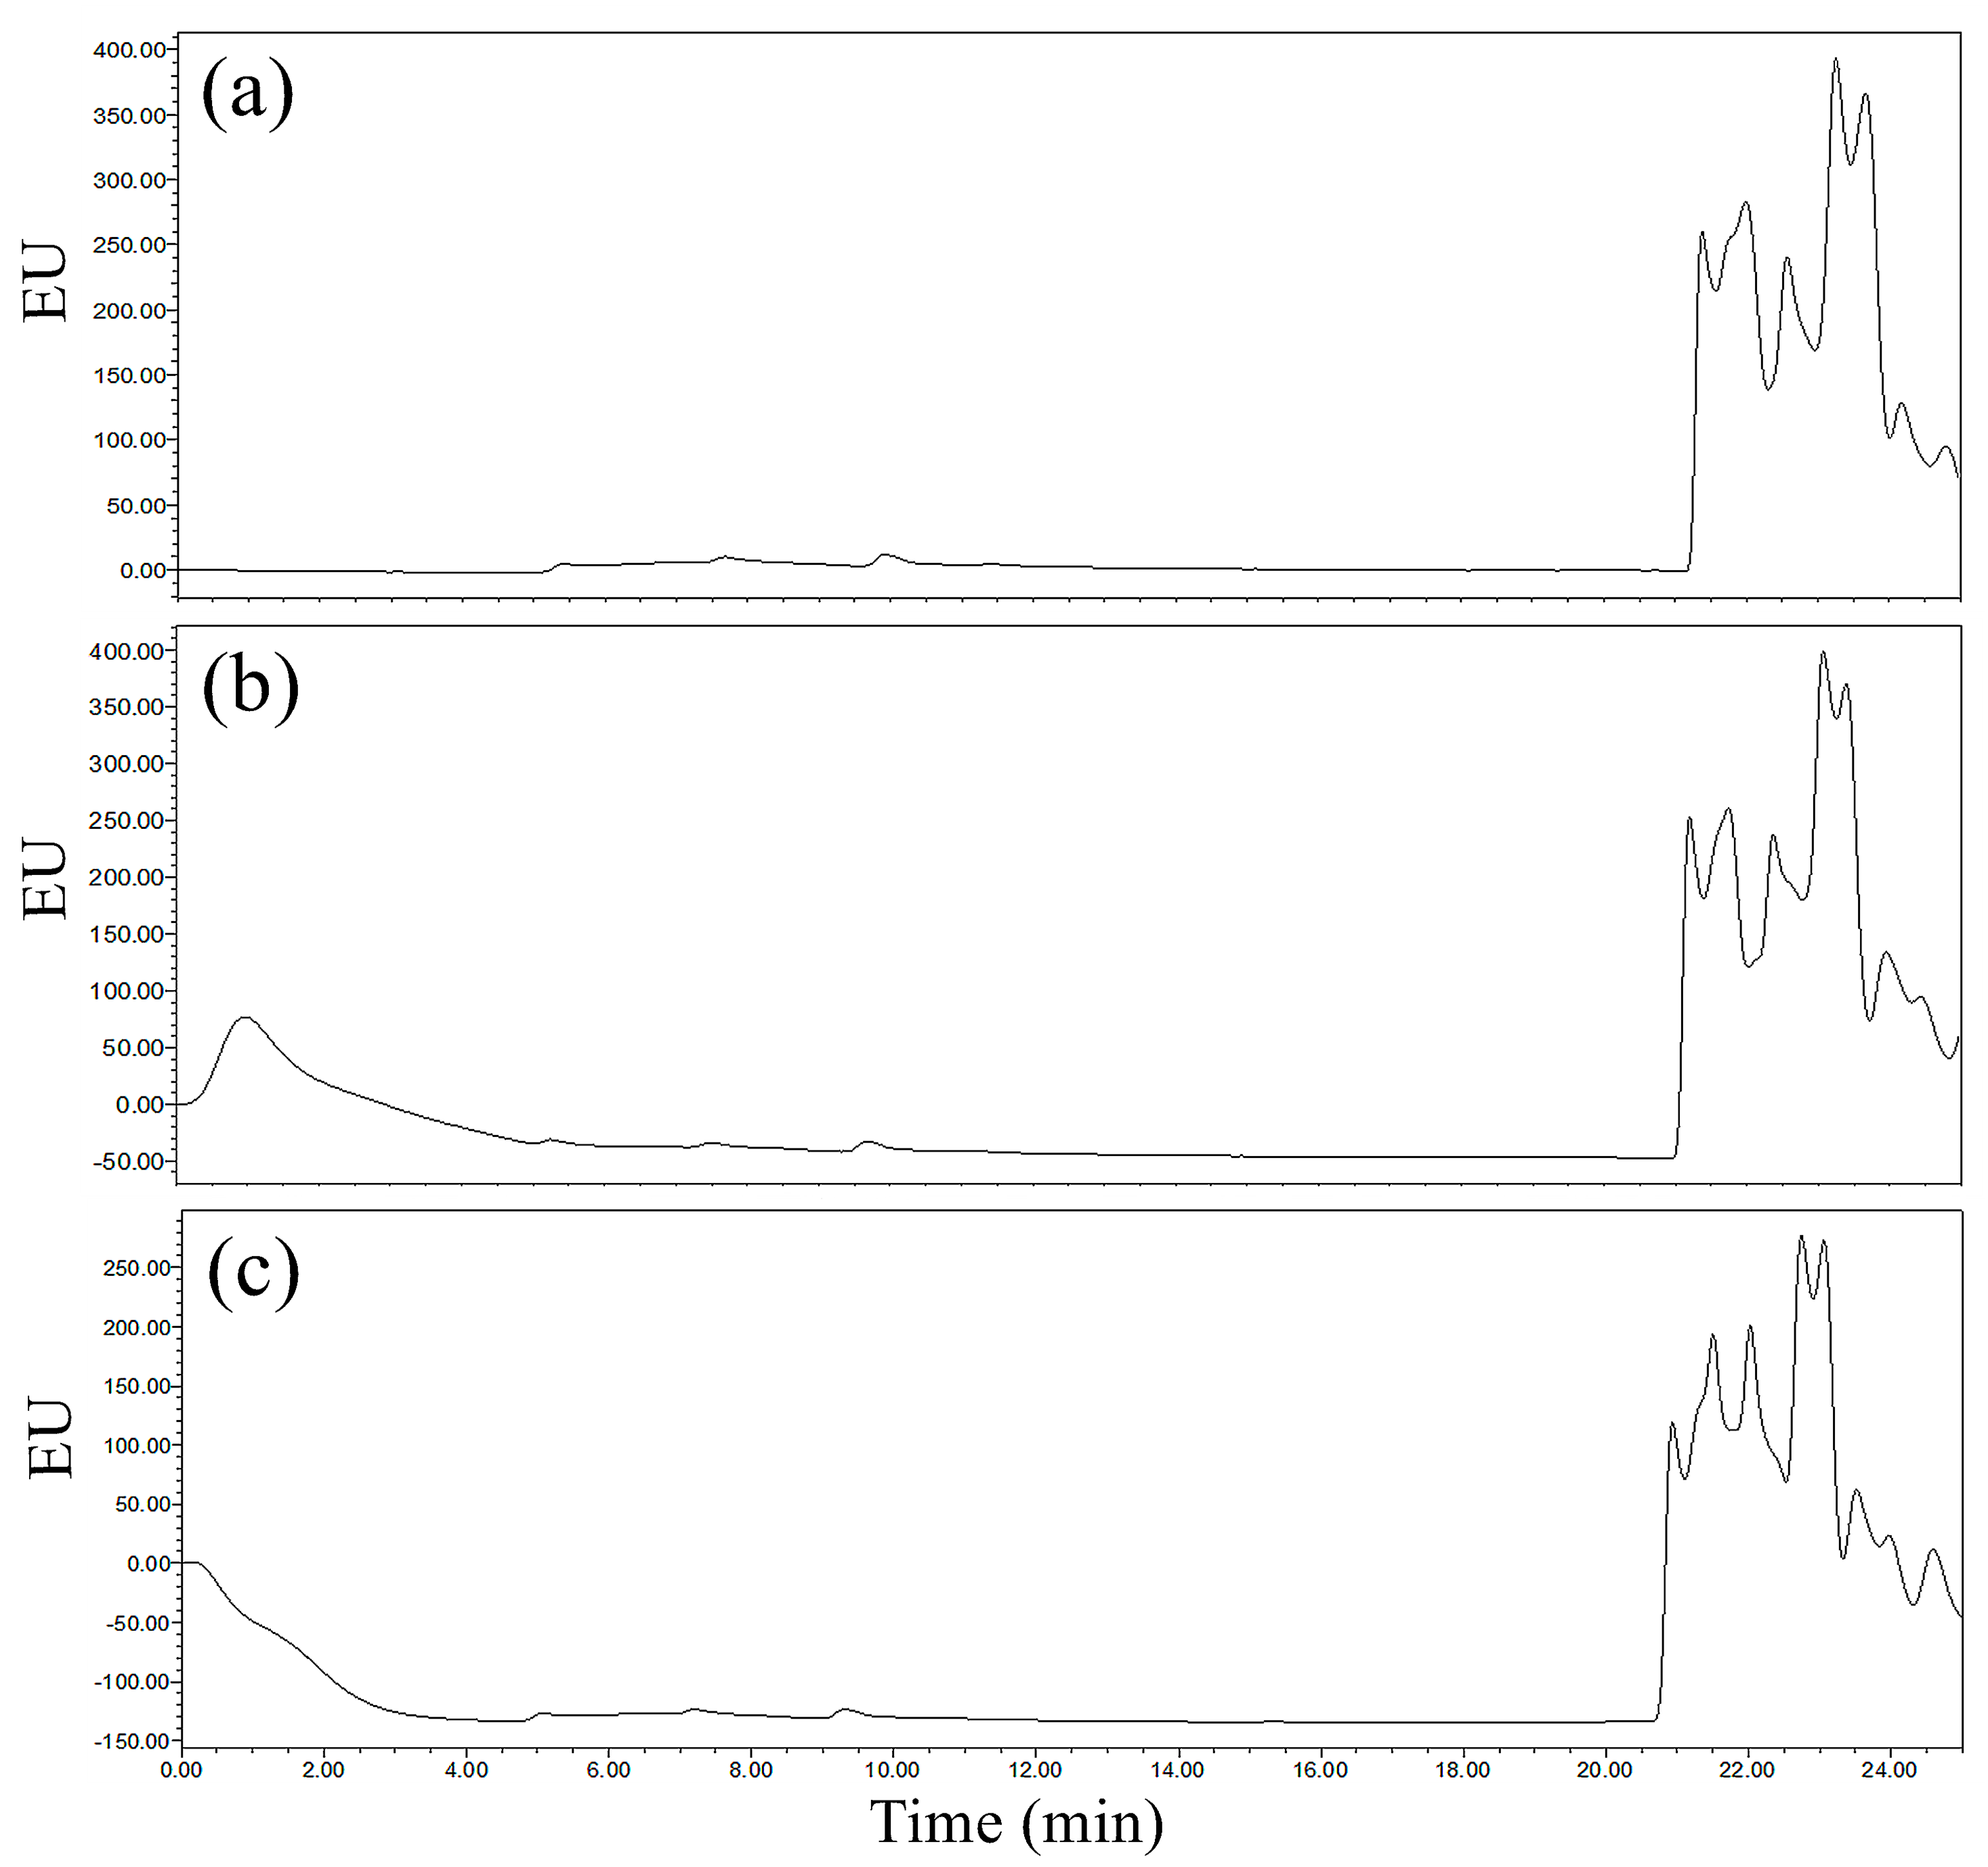
3.3. Choice of the Chromatographic Column
3.4. Method Validation Results
4. Conclusions
Author Contributions
Funding
Institutional Review Board Statement
Informed Consent Statement
Acknowledgments
Conflicts of Interest
References
- Guinto-Ruiz, E.; Sánchez-Carlos, J.J.; Moreno-Godínez, M.E.; González-Calixto, C.; Calixto-Gálvez, M.; Quintanilla-Vega, B.; Hernández-Ochoa, I.; Urióstegui-Acosta, M. Glufosinate ammonium alters quality and DNA in mouse spermatozoa. Toxicol. Lett. 2016, 259, S216. [Google Scholar] [CrossRef]
- Ebert, E.; Leist, K.H.; Mayer, D. Summary of safety evaluation toxicity studies of glufosinate ammonium. Food Chem. Toxicol. 1990, 28, 339–349. [Google Scholar] [CrossRef]
- Bayer, E.; Gugel, K.H.; Hägele, K.; Hagenmaier, H.; Jessipow, S.; König, W.A.; Zähner, H. Stoffwechselprodukte von Mikroorganismen. 98. Mitteilung. Phosphinothricin und Phosphinothricyl-Alanyl-Alanin. Helv. Chim. Acta 1972, 55, 224–239. [Google Scholar] [CrossRef]
- Zhang, L.; Chen, L.; Meng, Z.; Jia, M.; Li, R.; Yan, S.; Tian, S.; Zhou, Z.; Diao, J. Effects of L-Glufosinate-ammonium and temperature on reproduction controlled by neuroendocrine system in lizard (Eremias argus). Environ. Pollut. 2020, 257, 113564. [Google Scholar] [CrossRef]
- Van Bruggen, A.H.C.; He, M.M.; Shin, K.; Mai, V.; Jeong, K.C.; Finckh, M.R.; Morris, J.G. Environmental and health effects of the herbicide glyphosate. Sci. Total Environ. 2018, 616–617, 255–268. [Google Scholar] [CrossRef] [PubMed]
- Qian, K.; He, S.; Tang, T.; Shi, T.; Li, J.; Cao, Y. A rapid liquid chromatography method for determination of glufosinate residue in maize after derivatisation. Food Chem. 2011, 127, 722–726. [Google Scholar] [CrossRef]
- Skeff, W.; Recknagel, C.; Düwel, Y.; Schulz-Bull, D.E. Adsorption behaviors of glyphosate, glufosinate, aminomethylphosphonic acid, and 2-aminoethylphosphonic acid on three typical Baltic Sea sediments. Mar. Chem. 2018, 198, 1–9. [Google Scholar] [CrossRef]
- Usui, K.; Minami, E.; Fujita, Y.; Kubota, E.; Kobayashi, H.; Hanazawa, T.; Yoshizawa, T.; Kamijo, Y.; Funayama, M. Application of probe electrospray ionization-tandem mass spectrometry to ultra-rapid determination of glufosinate and glyphosate in human serum. J. Pharm. Biomed. Anal. 2019, 174, 175–181. [Google Scholar] [CrossRef]
- Laugeray, A.; Herzine, A.; Perche, O.; Richard, O.; Menuet, A.; Mazaud-Guittot, S.; Lesne, L.; Briault, S.; Jegou, B.; Pichon, J.; et al. Perinatal exposure to low dose glufosinate ammonium induces autism-like phenotypes in mice. Toxicol. Lett. 2014, 229, S43. [Google Scholar] [CrossRef]
- Geerdink, R.B.; Hassing, M.; Ayarza, N.; Bruggink, C.; Wielheesen, M.; Claassen, J.; Epema, O.J. Analysis of glyphosate, AMPA, Glufosinate and MPPA with ION chromatography tandem mass spectrometry using A membrane suppressor in the ammonium form application to surface water of low to moderate salinity. Anal. Chim. Acta 2020, 1133, 66–76. [Google Scholar] [CrossRef]
- Motojyuku, M.; Saito, T.; Akieda, K.; Otsuka, H.; Yamamoto, I.; Inokuchi, S. Determination of glyphosate, glyphosate metabolites, and glufosinate in human serum by gas chromatography–mass spectrometry. J. Chromatogr. B 2008, 875, 509–514. [Google Scholar] [CrossRef] [PubMed]
- Chang, S.Y.; Liao, C.-H. Analysis of glyphosate, glufosinate and aminomethylphosphonic acid by capillary electrophoresis with indirect fluorescence detection. J. Chromatogr. A 2002, 959, 309–315. [Google Scholar] [CrossRef]
- Royer, A.; Beguin, S.; Sochor, H.; Communal, P.Y. Determination of glufosinate ammonium and its metabolite (AE F064619 and AE F061517) residues in water by gas chromatography with tandem mass spectrometry after ion exchange cleanup and derivatization. J. Agric. Food. Chem. 2000, 48, 5184–5189. [Google Scholar] [CrossRef] [PubMed]
- Sato, K.; Jin, J.-Y.; Takeuchi, T.; Miwa, T.; Suenami, K.; Takekoshi, Y.; Kanno, S. Integrated pulsed amperometric detection of glufosinate, bialaphos and glyphosate at gold electrodes in anion-exchange chromatography. J. Chromatogr. A 2001, 919, 313–320. [Google Scholar] [CrossRef]
- Demonte, L.D.; Michlig, N.; Gaggiotti, M.; Adam, C.G.; Beldoménico, H.R.; Repetti, M.R. Determination of glyphosate, AMPA and glufosinate in dairy farm water from Argentina using a simplified UHPLC-MS/MS method. Sci. Total Environ. 2018, 645, 34–43. [Google Scholar] [CrossRef]
- Zhang, Y.; Dang, Y.; Lin, X.; An, K.; Li, J.; Zhang, M. Determination of glyphosate and glufosinate in corn using multi-walled carbon nanotubes followed by ultra high performance liquid chromatography coupled with tandem mass spectrometry. J. Chromatogr. A 2020, 1619, 460939. [Google Scholar] [CrossRef]
- Botero-Coy, A.M.; Ibáñez, M.; Sancho, J.V.; Hernández, F. Direct liquid chromatography–tandem mass spectrometry determination of underivatized glyphosate in rice, maize and soybean. J. Chromatogr. A 2013, 1313, 157–165. [Google Scholar] [CrossRef]
- Chamkasem, N.; Harmon, T. Direct determination of glyphosate, glufosinate, and AMPA in soybean and corn by liquid chromatography/tandem mass spectrometry. Anal. Bioanal. Chem. 2016, 408, 4995–5004. [Google Scholar] [CrossRef]
- Liao, Y.; Berthion, J.-M.; Colet, I.; Merlo, M.; Nougadère, A.; Hu, R. Validation and application of analytical method for glyphosate and glufosinate in foods by liquid chromatography-tandem mass spectrometry. J. Chromatogr. A 2018, 1549, 31–38. [Google Scholar] [CrossRef]
- Zhang, Y.; Wang, K.; Wu, J.; Zhang, H. Field dissipation and storage stability of glufosinate ammonium and its metabolites in soil. Int. J. Anal. Chem. 2014, 2014, 256091. [Google Scholar] [CrossRef] [Green Version]
- Hori, Y.; Fujisawa, M.; Shimada, K.; Sato, M.; Honda, M.; Hirose, Y. Enantioselective analysis of glufosinate using precolumn derivatization with (+)-1-(9-fluorenyl)ethyl chloroformate and reversed-phase liquid chromatography. J. Chromatogr. B 2002, 776, 191–198. [Google Scholar] [CrossRef]
- Hanke, I.; Singer, H.; Hollender, J. Ultratrace-level determination of glyphosate, aminomethylphosphonic acid and glufosinate in natural waters by solid-phase extraction followed by liquid chromatography-tandem mass spectrometry: Performance tuning of derivatization, enrichment and detection. Anal. Bioanal. Chem. 2008, 391, 2265–2276. [Google Scholar] [CrossRef] [PubMed] [Green Version]
- Sun, W.S.; Zhu, J.J.; Zhong, H.H.; Dong, Y.J.; Yu, J.; Liu, J. Determination of glufosinate, glyphosate and its metabolite aminomethylphosphonic acid residues in soil by UHPLC-Triple quadrupole mass spectrometry after purification with solid phase extraction. PTCA (Part B Chem. Anal.) 2021, 57, 322–326. (In Chinese) [Google Scholar]


| Parameters | Soil | |||
|---|---|---|---|---|
| Jiangxi Red Soil | Northeast China Black Soil | Taihu Lake Paddy Soil | Shanxi Alluvial Soil | |
| Mechanical components | ||||
| Sand (g/kg) | 126 | 21 | 29 | 24 |
| Silt (g/kg) | 343 | 512 | 662 | 546 |
| Clay (g/kg) | 531 | 467 | 309 | 430 |
| pH | 4.39 | 6.58 | 5.04 | 8.38 |
| Organic matter (g/kg) | 8.3 | 28.4 | 20.1 | 11.8 |
| CEC (cmol (+)/kg) | 9.6 | 25.1 | 8.6 | 9.5 |
| Texture | Reddish brown loam | Black loam | Grey silty soil | Yellow-grey silty soil |
| Time (Min) | Mobile Phase A (%) | Mobile Phase B (%) |
|---|---|---|
| 0 | 35 | 65 |
| 10 | 25 | 75 |
| 15 | 80 | 20 |
| 20 | 35 | 65 |
| Index | Jiangxi Red Soil | Northeast China Black Soil | Taihu Lake Paddy Soil | Shanxi Alluvial Soil |
|---|---|---|---|---|
| Linear range (mg/L) | 0.02~1.0 | 0.01~0.5 | 0.005~0.5 | 0.01~0.5 |
| Equation | y = 1.0 × 10⁸x − 2.0 × 10⁶ | y = 8.0 × 10⁷x + 489,600 | y = 3 × 10⁷x + 1,000,000 | y = 9 × 10⁷x – 50,952 |
| r | 0.998 | 0.999 | 0.992 | 0.999 |
| LOD (mg/kg) | 0.015 | 0.008 | 0.004 | 0.008 |
| LOQ(mg/kg) | 0.050 | 0.025 | 0.0125 | 0.025 |
| Item | Jiangxi Red Soil | Northeast China Black Soil | Taihu Lake Paddy Soil | Shanxi Alluvial Soil |
|---|---|---|---|---|
| Spiked level (mg/kg) | 0.1 | |||
| Recoveries (%) | 116.4~120.3 | 106.8~115.4 | 91.4~96.8 | 106.5~114.2 |
| Average Recoveries | 119.8 | 111.7 | 94.0 | 110.2 |
| RSD(%) | 3.0 | 6.3 | 8.5 | 2.8 |
| Spiked level (mg/kg) | 1.0 | |||
| Recoveries (%) | 112.2~118.3 | 115.5~118.4 | 109.6~116.2 | 112.4~114.6 |
| Average Recoveries (%) | 116.6 | 116.7 | 112.1 | 113.2 |
| RSD (%) | 3.3 | 8.4 | 9.0 | 3.8 |
| Method | Matrix | LOD | Recoveries, % | References |
|---|---|---|---|---|
| Derivation and HPLC | Maize | 0.02 mg/kg | 98.0–100.5 | [6] |
| Derivation and HPLC | human serum | 0.005 mg/L | 95.1–98.7 | [21] |
| Derivation and GC-MS | human serum | 0.1 mg/L | 38.8–41.6 | [11] |
| Derivation and GC-MS | water | 0.01 mg/L | 71.0–125.0 | [13] |
| SPE -LC-MS | soybean and corn | 0.014mg/kg | 92.0–104.0 | [18] |
| SPE- UPLC-MS | Soil | 0.02 mg/kg | 80.0–91.6 | [23] |
| Derivation and HPLC | Soil | 0.004–0.015 mg/kg | 94.0–119.8 | This study |
Publisher’s Note: MDPI stays neutral with regard to jurisdictional claims in published maps and institutional affiliations. |
© 2022 by the authors. Licensee MDPI, Basel, Switzerland. This article is an open access article distributed under the terms and conditions of the Creative Commons Attribution (CC BY) license (https://creativecommons.org/licenses/by/4.0/).
Share and Cite
Chen, L.; Kong, S.; Wang, G.; Yan, X.; Zhang, X.; Kong, X.; Bu, Y. Determination of Glufosinate-P-Ammonium in Soil Using Precolumn Derivation and Reversed-Phase High-Performance Liquid Chromatography. Water 2022, 14, 1816. https://doi.org/10.3390/w14111816
Chen L, Kong S, Wang G, Yan X, Zhang X, Kong X, Bu Y. Determination of Glufosinate-P-Ammonium in Soil Using Precolumn Derivation and Reversed-Phase High-Performance Liquid Chromatography. Water. 2022; 14(11):1816. https://doi.org/10.3390/w14111816
Chicago/Turabian StyleChen, Lin, Shun Kong, Guodong Wang, Xiaoju Yan, Xuemei Zhang, Xiangji Kong, and Yuanqing Bu. 2022. "Determination of Glufosinate-P-Ammonium in Soil Using Precolumn Derivation and Reversed-Phase High-Performance Liquid Chromatography" Water 14, no. 11: 1816. https://doi.org/10.3390/w14111816
APA StyleChen, L., Kong, S., Wang, G., Yan, X., Zhang, X., Kong, X., & Bu, Y. (2022). Determination of Glufosinate-P-Ammonium in Soil Using Precolumn Derivation and Reversed-Phase High-Performance Liquid Chromatography. Water, 14(11), 1816. https://doi.org/10.3390/w14111816