
Channel Bed Deformation and Ice Jam Evolution around Bridge Piers


Abstract
:1. Introduction
2. Materials and Methods
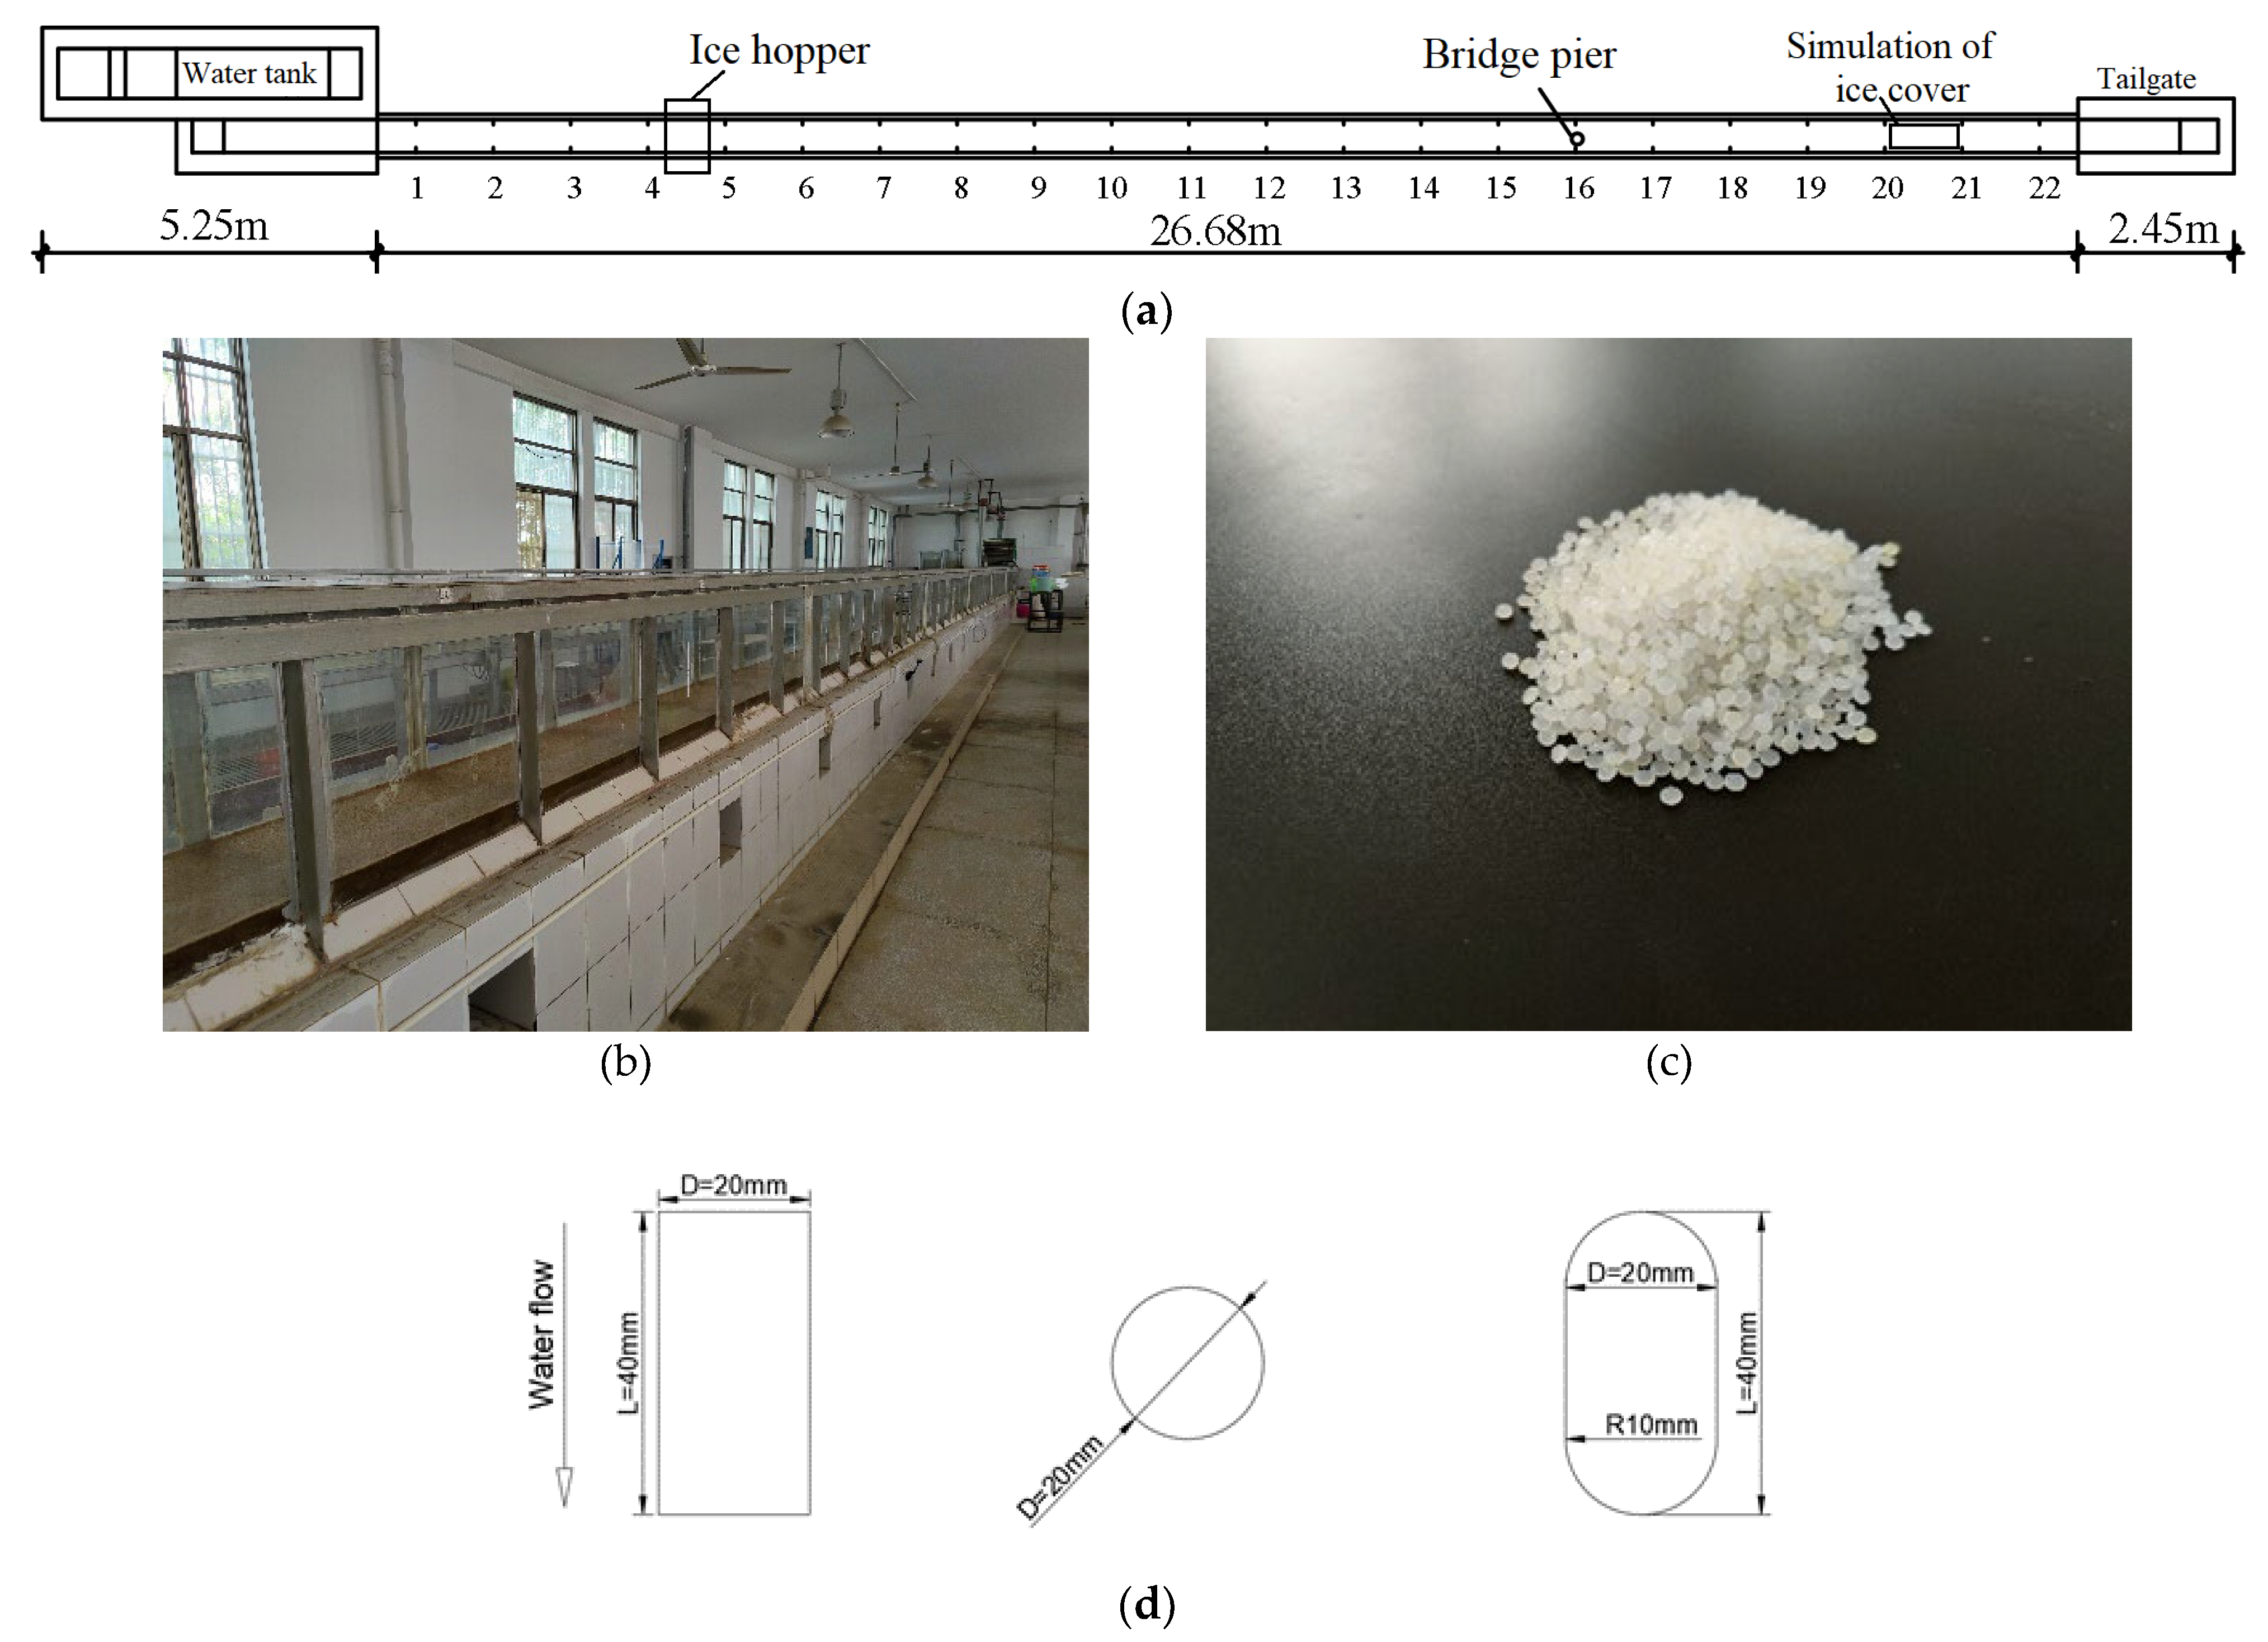
2.1. Experimental Setup
2.2. Experimental Process
- (1)
- Firstly, the sand scraper was used to level the sediment bed along the study channel so that the flow pattern at each cross section was approximately the same.
- (2)
- The flume was filled with water slowly to prevent sediment particles in the channel bed from the initiation of motion until the water level in the flume reached the target value. The flow discharge of each experiment running through the triangular thin-walled weir with an accuracy of 0.1 mm was kept as constant. The water level in the flume was controlled by adjusting the tailgate of the flume.
- (3)
- Styrofoam panels were placed on the water surface between CS-20 and CS-21 to simulate the initiating point for an ice jam. A four-channel ultrasonic current meter with an accuracy of 0.01 m/s was arranged at the cross section where the pier was located to measure flow velocities around the model pier, which was placed in the center at CS-16.
- (4)
- Ice particles were filled in a barrel with a volume of 7.40 L. The mass of each barrel of ice particles was 6.786 kg. The time required for each barrel of ice particles to enter the flume from the ice hopper was calculated. At this point, the test preparation work was completed. Note: the ice discharge rate was controlled as the target value during each experiment run.
- (5)
- At CS-16, where the piers were located, the depth and length of scour holes were measured every 10 min for the first 1 h and then every 30 min. The thickness of the ice jam around this cross section was measured using a ruler with an accuracy of 1 mm, every 10 min in the previous hour, and then every 30 min (Note: when the ice wave phenomenon did not occur at this cross section, the thickness of the ice jam was the average of the largest and smallest values along this cross section; when an ice wave phenomenon appeared at this cross section, the thickness of the ice jam at this cross section was the average of the thickness of the wave crest and wave trough). The water level was measured at the same frequency as that for the ice jam thickness, and both were performed simultaneously until the ice jam and local scour achieved an equilibrium state. Experiments showed that the time for the scour hole to achieve an equilibrium state under an ice-jammed flow condition was related to the hydraulics and ice flow conditions and ranged from 8 h to 11 h. However, all experiments lasted 24 h to ensure that the local scour under an ice jam condition achieved an equilibrium state.
- (6)
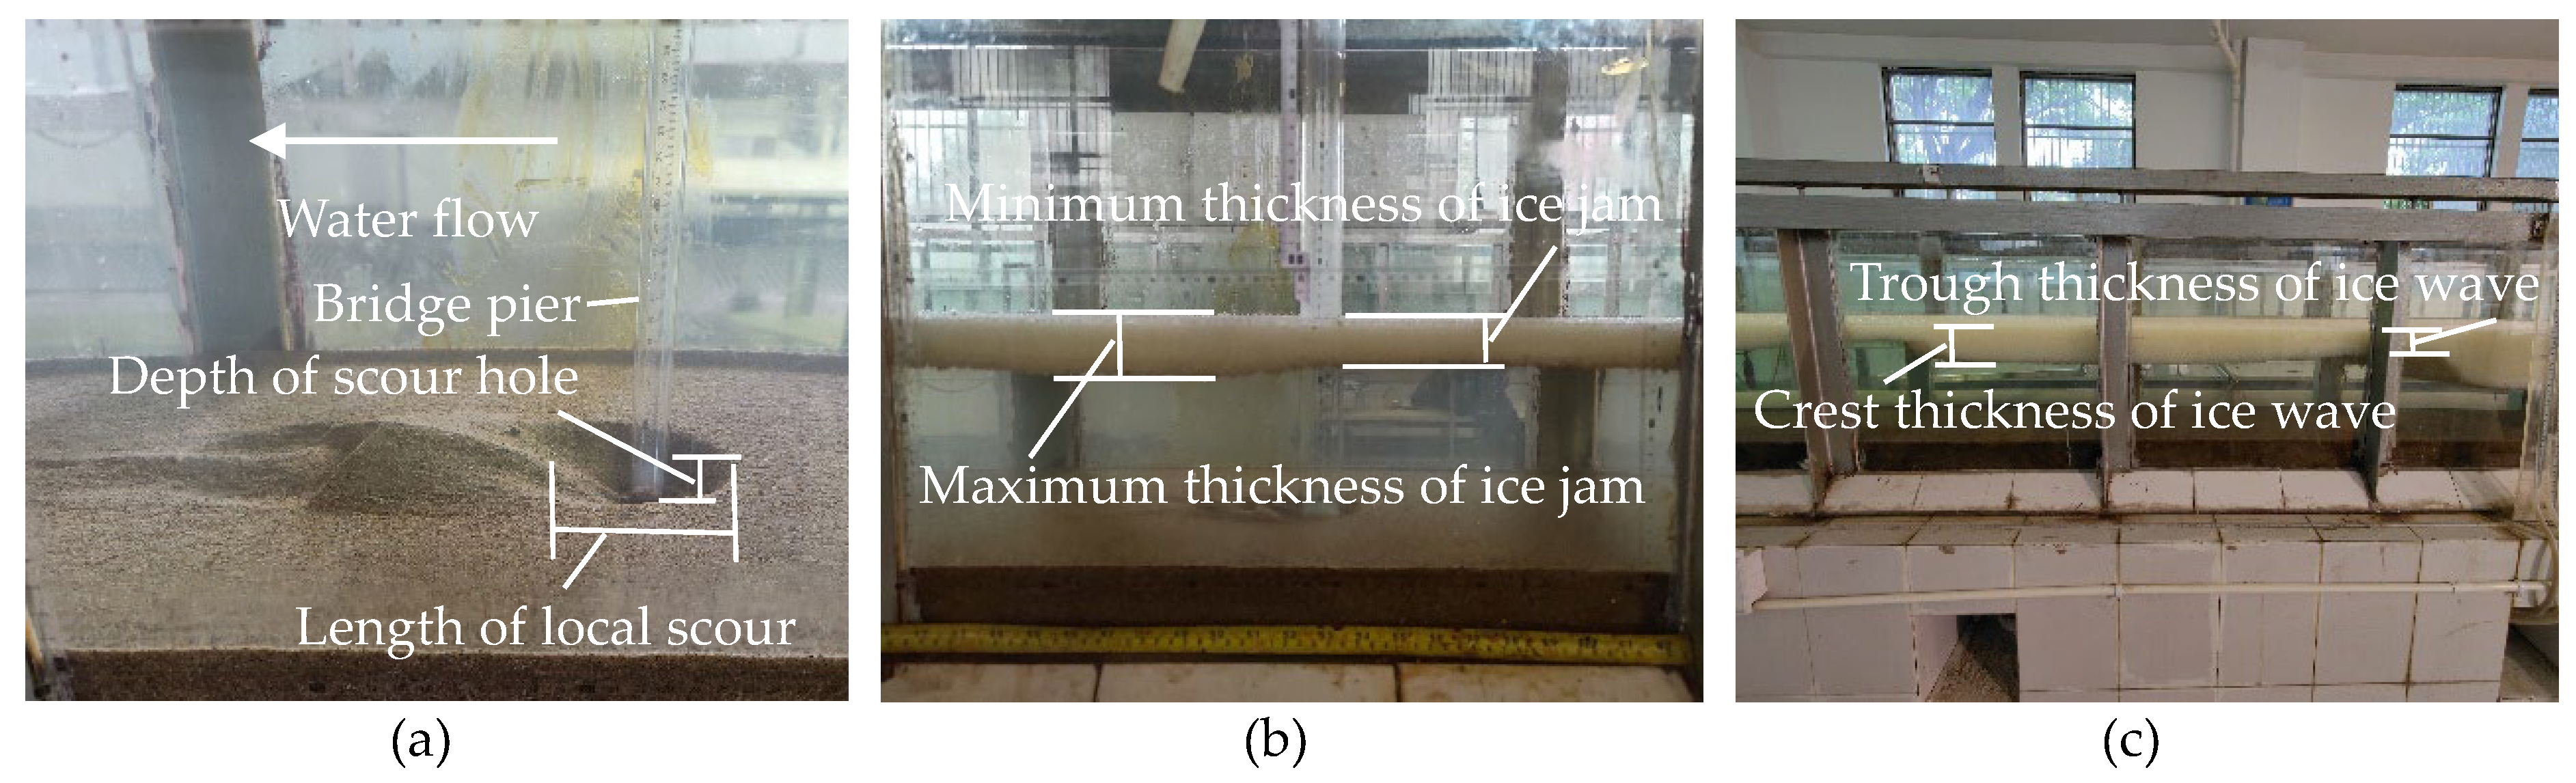
- Subsequently, we stopped adding ice particles in the flume, raised the tailgate, and gradually reduced the flow discharge to increase the water level so that ice particles under an ice jam in the flume stopped moving. To obtain a precious bathymetry of the scour hole, laboratory measurements were carefully carried out in order to not disturb the scour hole and ice jam due to the addition of probes. A point gage and a spot measuring instrument with an accuracy of 0.1 mm were used for measuring the bathymetry of the deformation of the sand bed around the pier. For each experimental run, data were collected at 26 measurement points around the bridge pier. Some variables used in this study were defined and are shown in Figure 2.
3. Interaction of Local Scour and Ice Jam Evolution
3.1. Impact of Local Scour on Ice Jam Evolution
3.2. Effect of Ice Jam Evolution on Local Scour
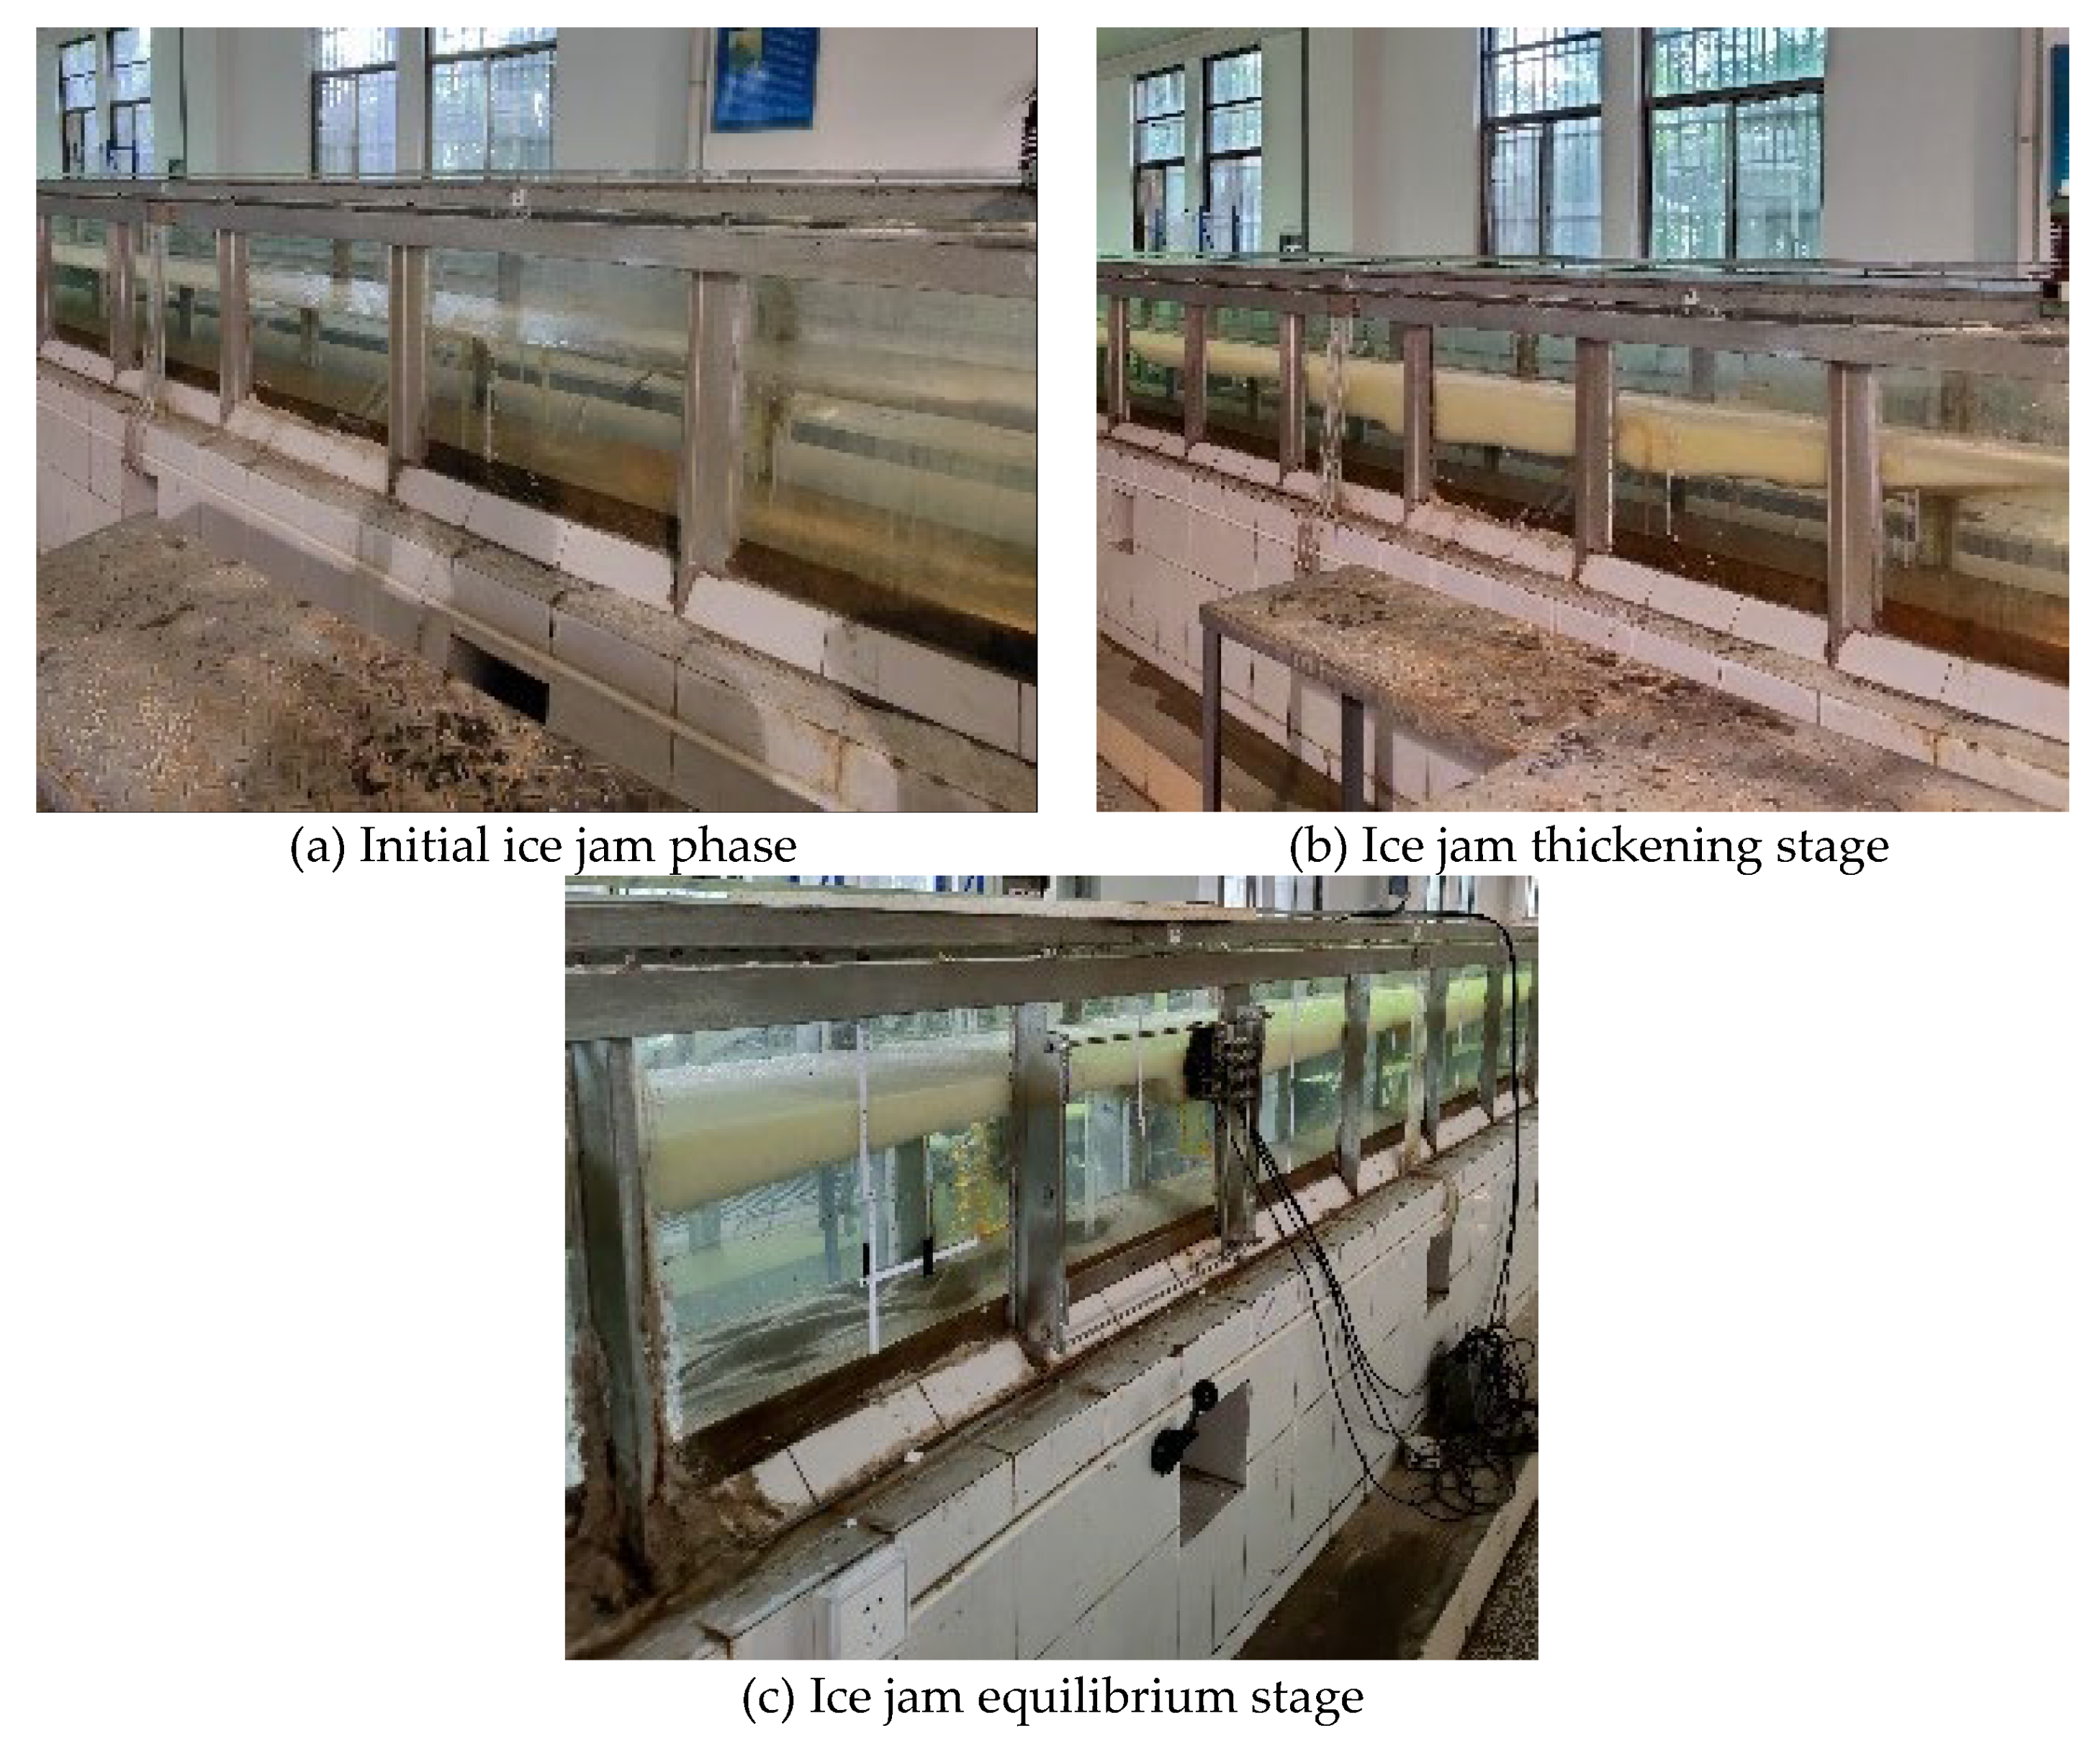
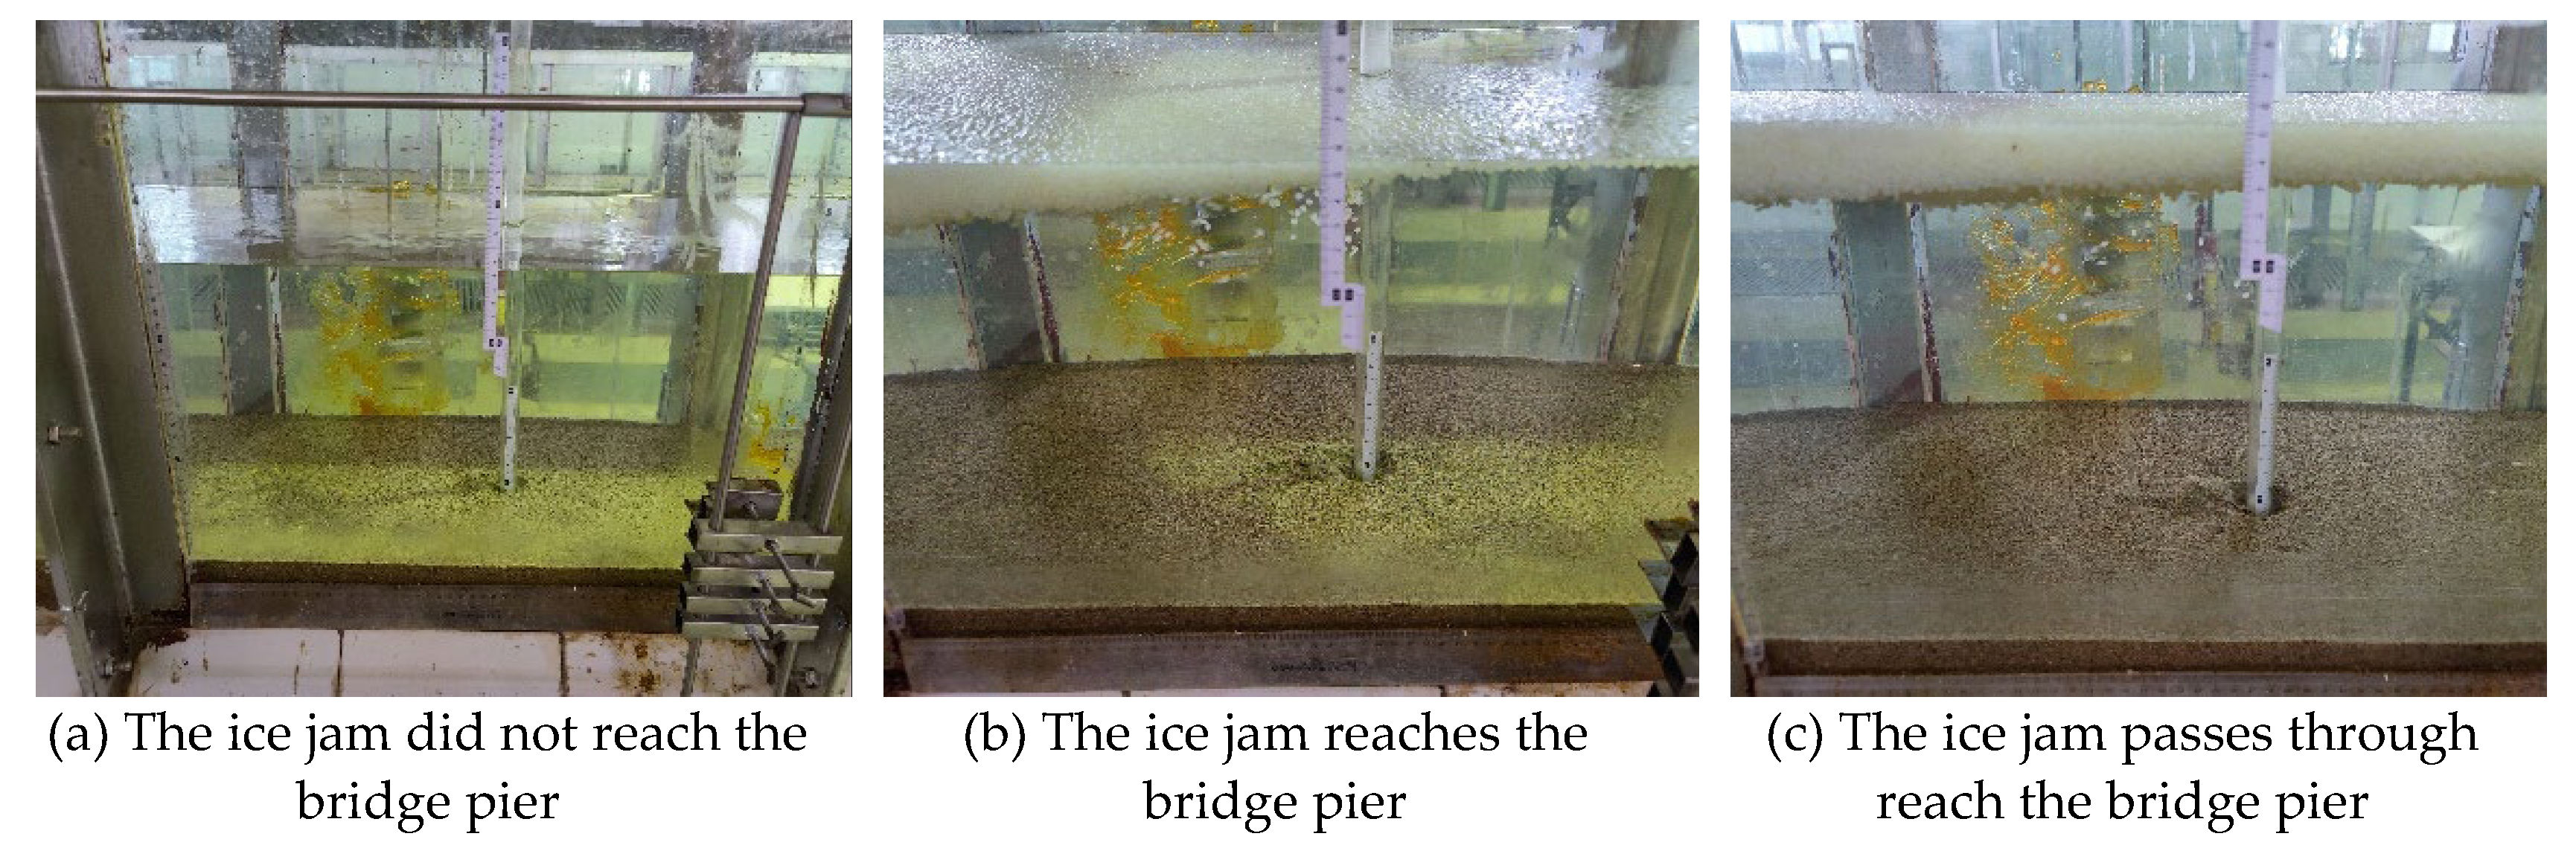
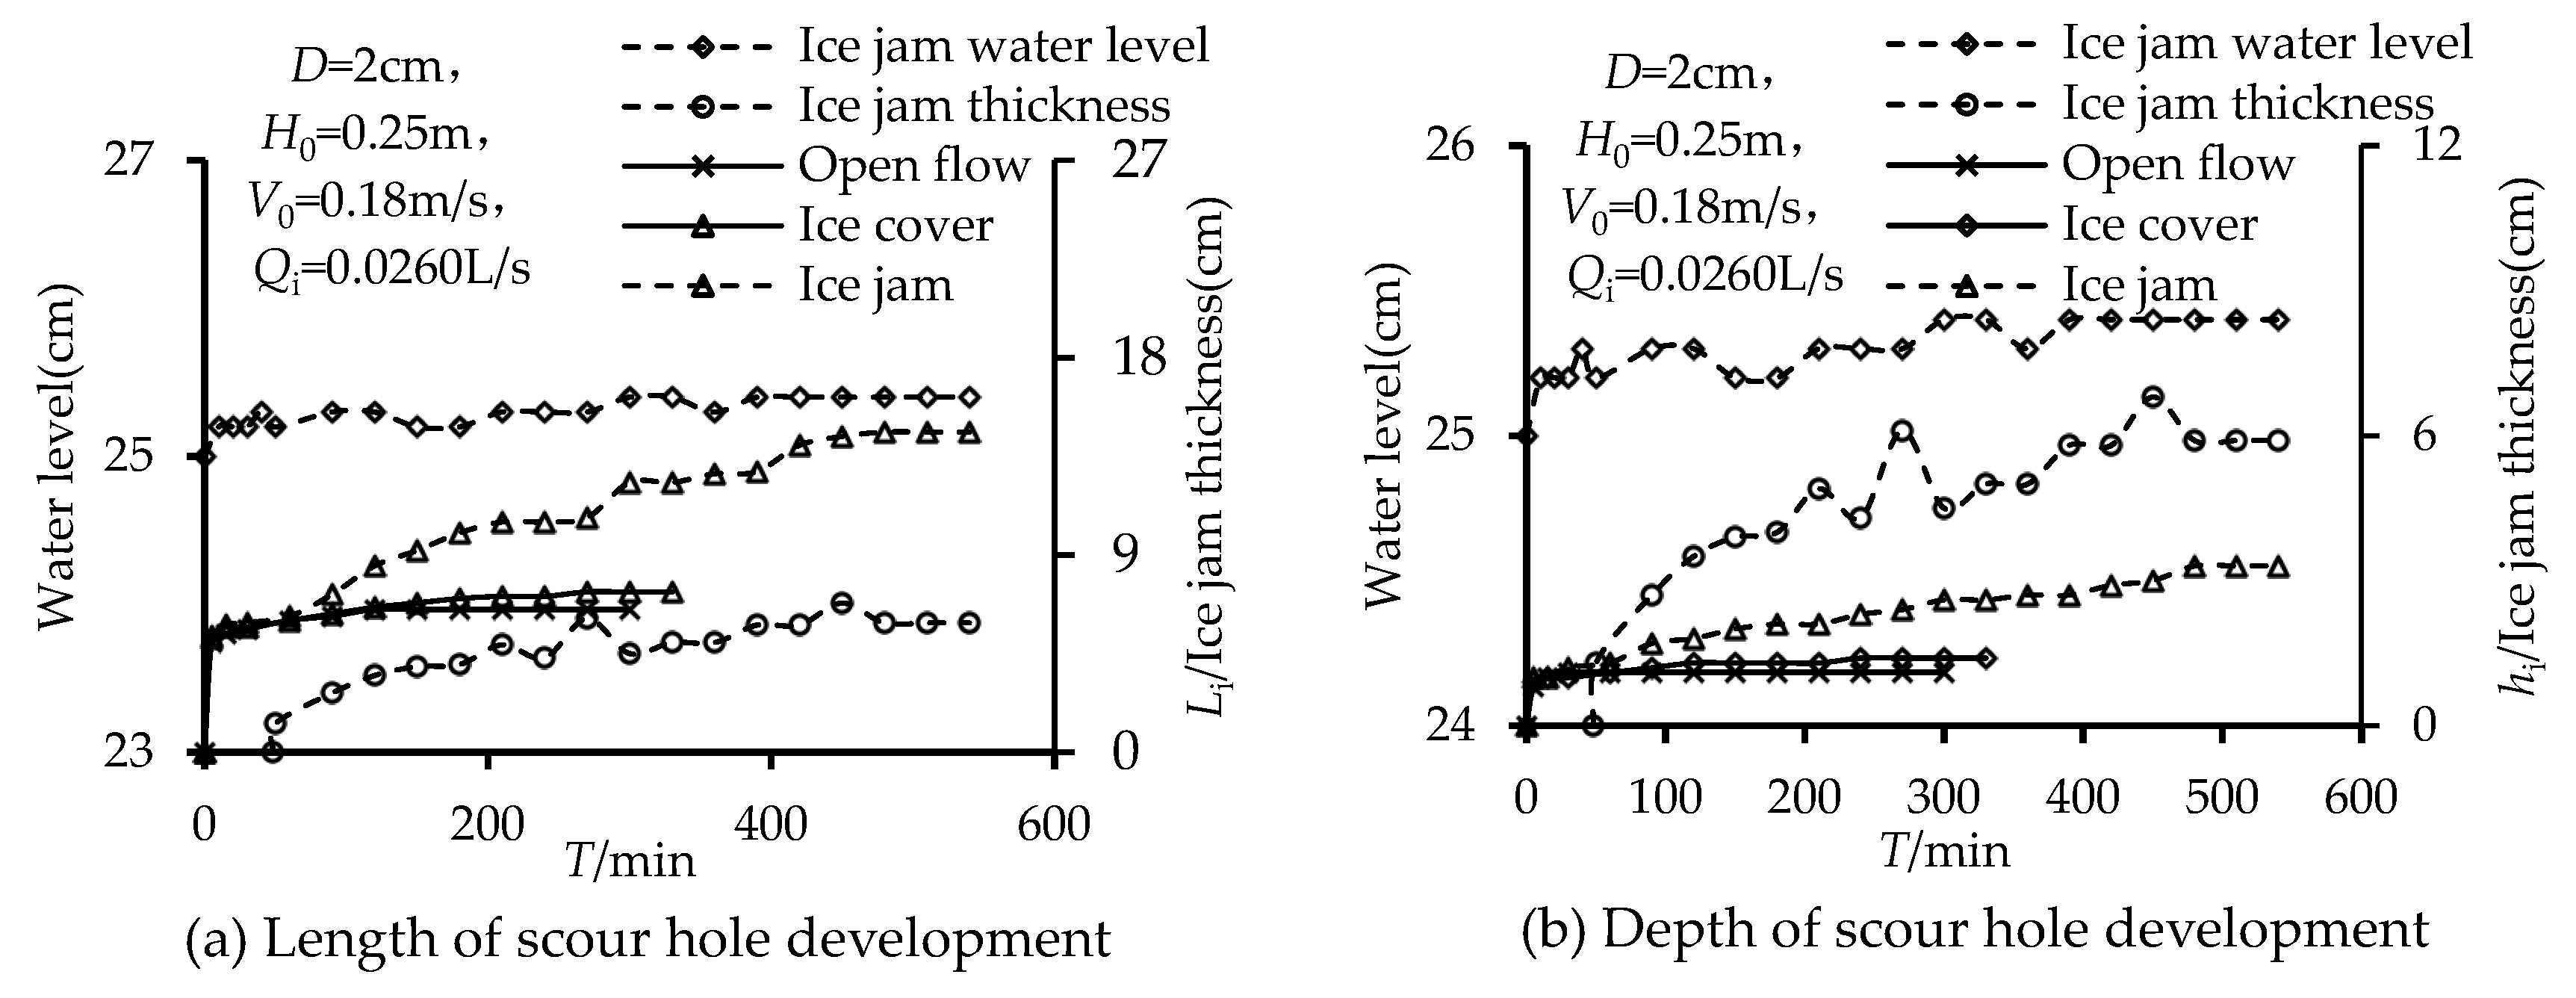
- The bed shear stress changes dramatically after an ice cover forms on the water surface compared to that of open flow conditions. Thus, in the presence of an ice cover, the turbulence intensities in a scour hole increase, and the sediment transport will be affected significantly. As pointed out by Wu et al. [29,30,31], the rougher the ice cover, the closer the maximum velocity to the sand bed and thus, the greater the Reynolds shear stress inside the scour hole. As a consequence, the scour hole at a pier becomes deeper. When the development of an ice jam is dominated by a mechanical thickening process (an ice cover is unable to withstand the external forces acting on it and is broken up and extruded to form an ice jam) [40], the development process of a scour hole is similar to that under an open flow condition. In such a case, as the ice jam develops upstream, the thickness of the ice jam increases. When the initial ice jam reaches the pier, the thickness of the initial ice jam grows rapidly, and the flow depth decreases. Thus, the velocity under the initial ice jam at this section increases and results in an intensified scouring process around the pier with a rapid increase in the scour depth. The scouring process at the pier gradually decreases since the increase in the jam thickness gradually slows down and gradually approaches the equilibrium ice jam phase, as shown in Figure 15 (In the figure, Li is the length of a scour hole, and hi is the depth of a scour hole at the pier, respectively).
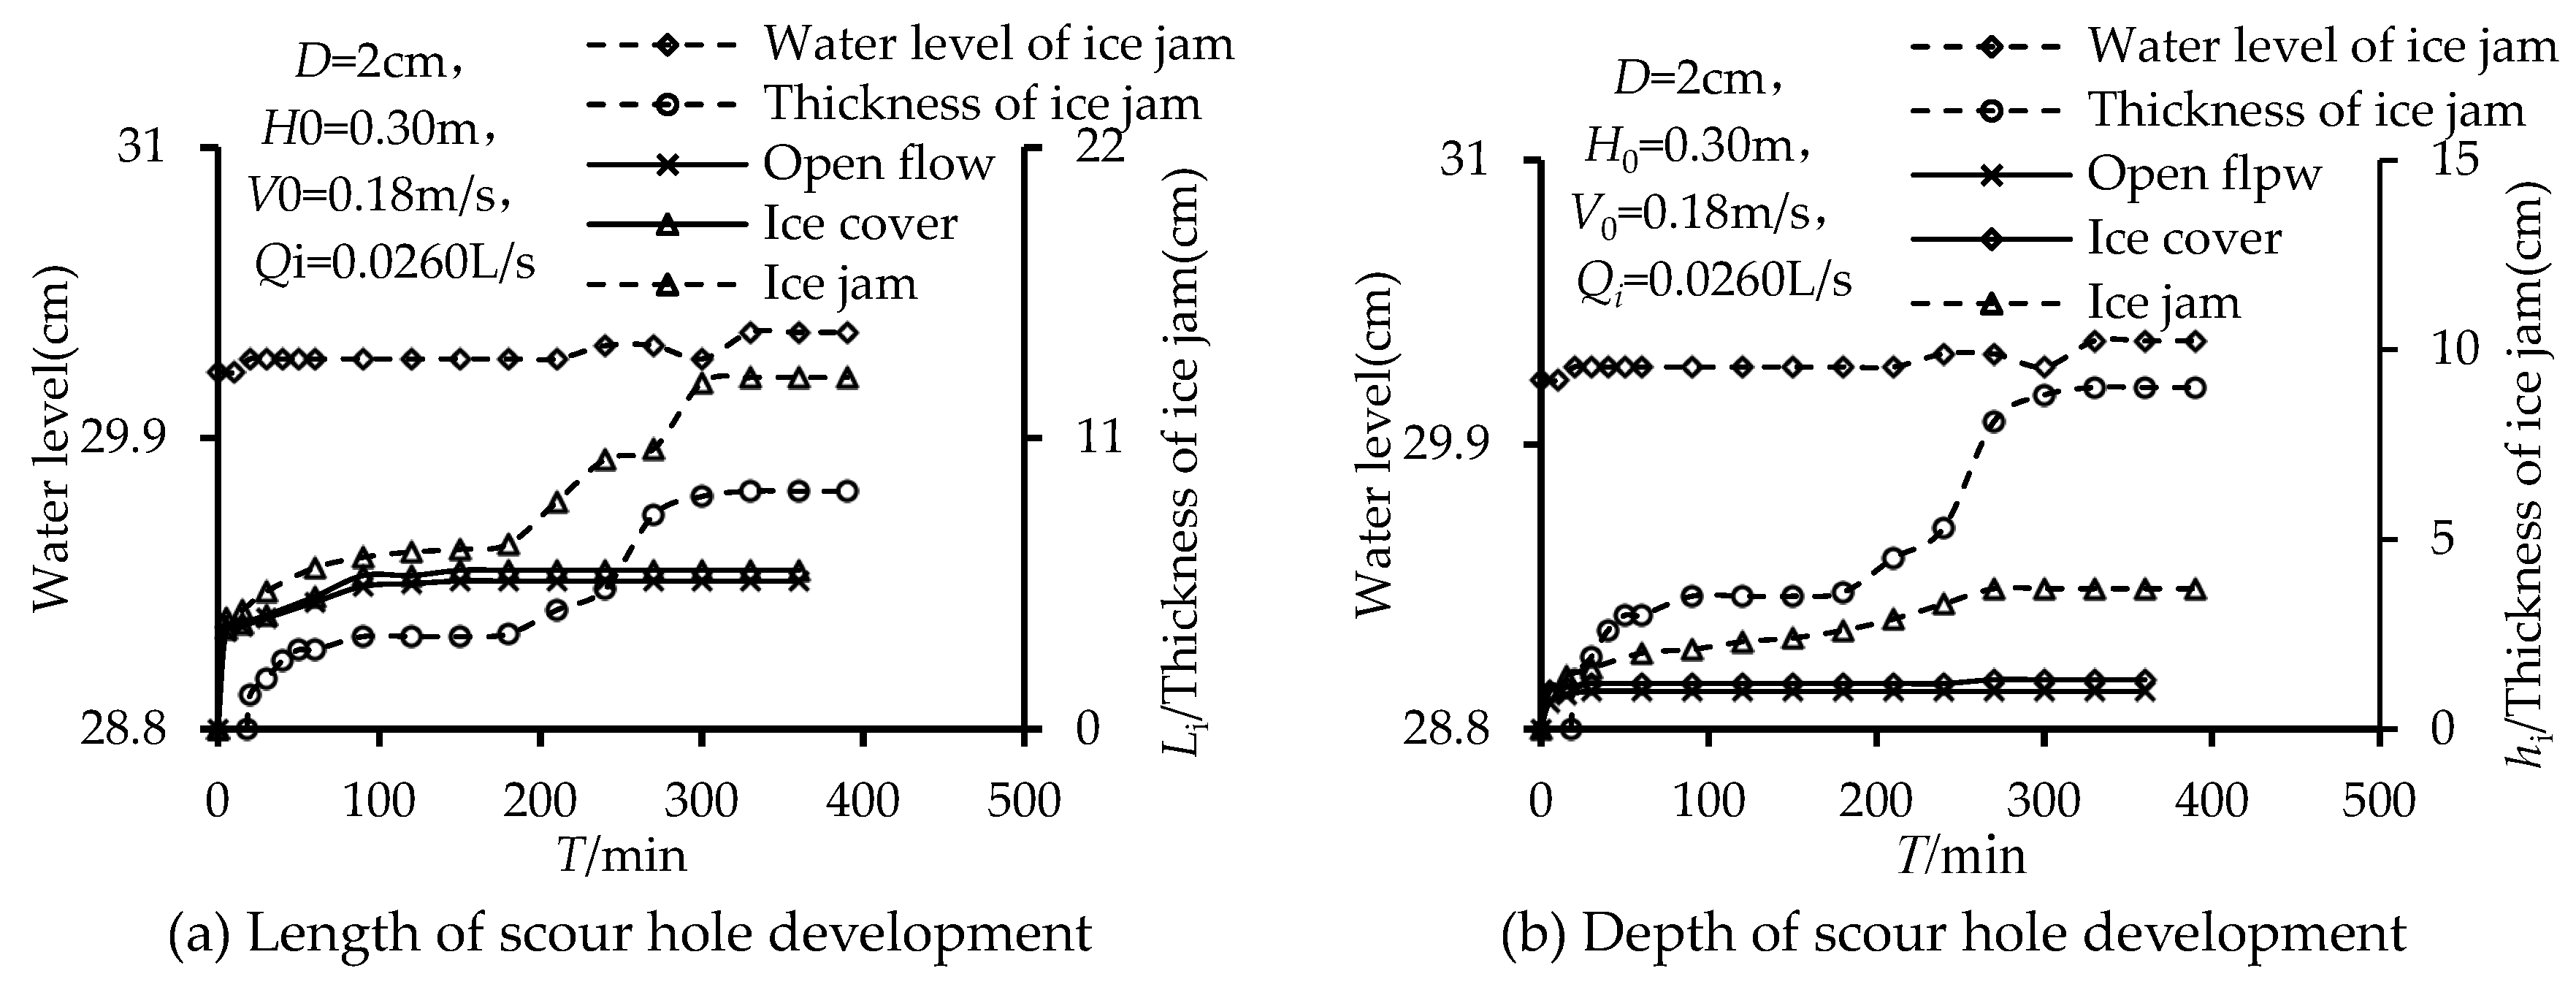
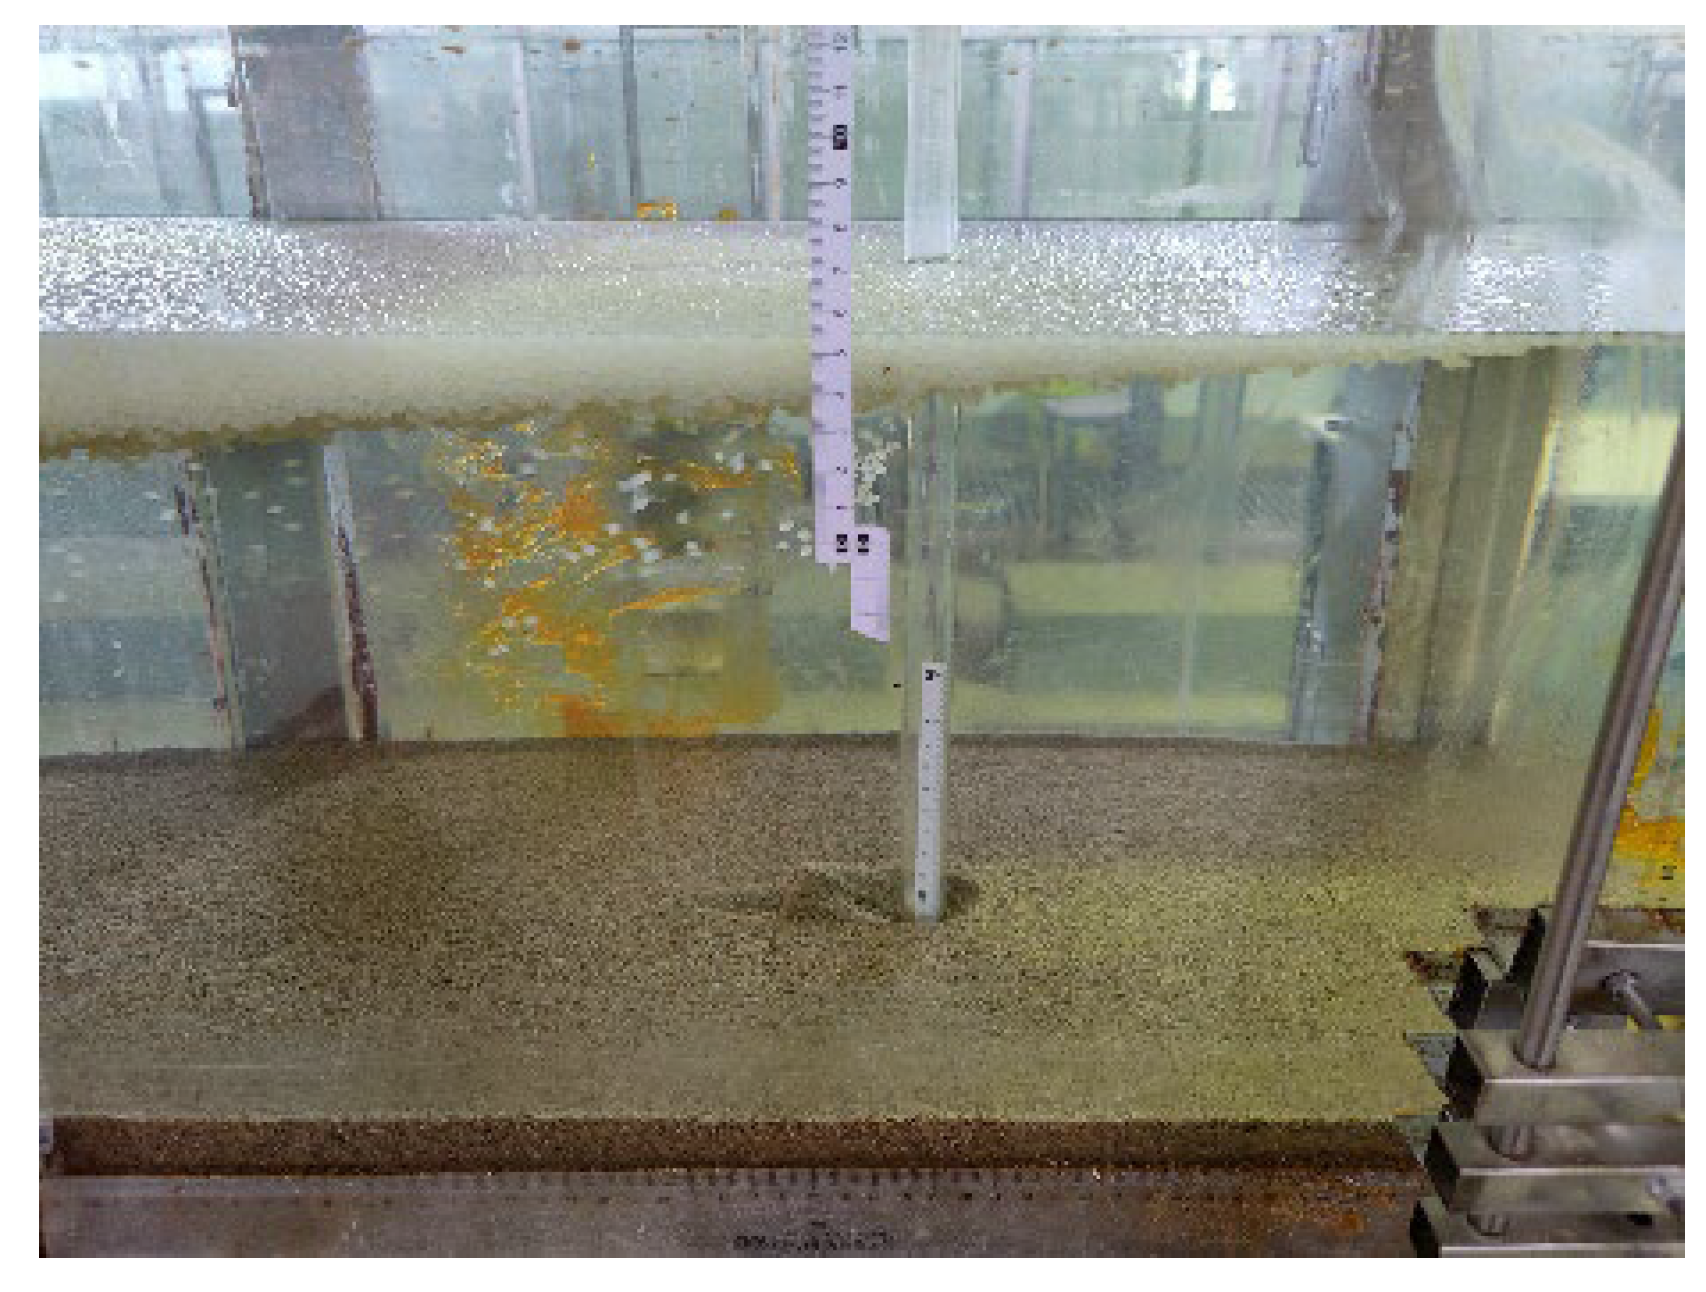
- When the formation of an initial ice jam is dominated by a hydraulic thickening process (ice floes and frazil ice particles are entrained by flowing water and submerged at the front of the ice cover and accumulate under the ice cover) [40], with fewer ice particles entrained and accumulating under an ice cover/initial ice jam, the thickness of the initial ice jam is much smaller and grows more slowly compared to that dominated by a mechanical thickening process. Thus, the water depth under the ice jam changes less. The depth of the scour hole around a pier develops similarly to that under an ice-covered flow condition, and the depth of the scour hole around a pier increases slowly. During the thickening process of the ice jam (dominated by a hydraulic thickening process) along the channel, the bottom of the ice jam appears as a wave-shaped accumulation. It is noticed that when the crest of such a wave migrates from upstream to the cross section of the pier, the flow depth under the ice jam decreases, and the flow velocity increases. Under such a circumstance (migration of a wave of ice accumulation), the scouring process at the pier becomes intense. Gradually, the development of the ice jam approaches an equilibrium condition, and the scouring process around the pier slows down, as shown in Figure 16.
4. Empirical Relationship between Scour Depth and Ice Jam Thickness
5. Conclusions
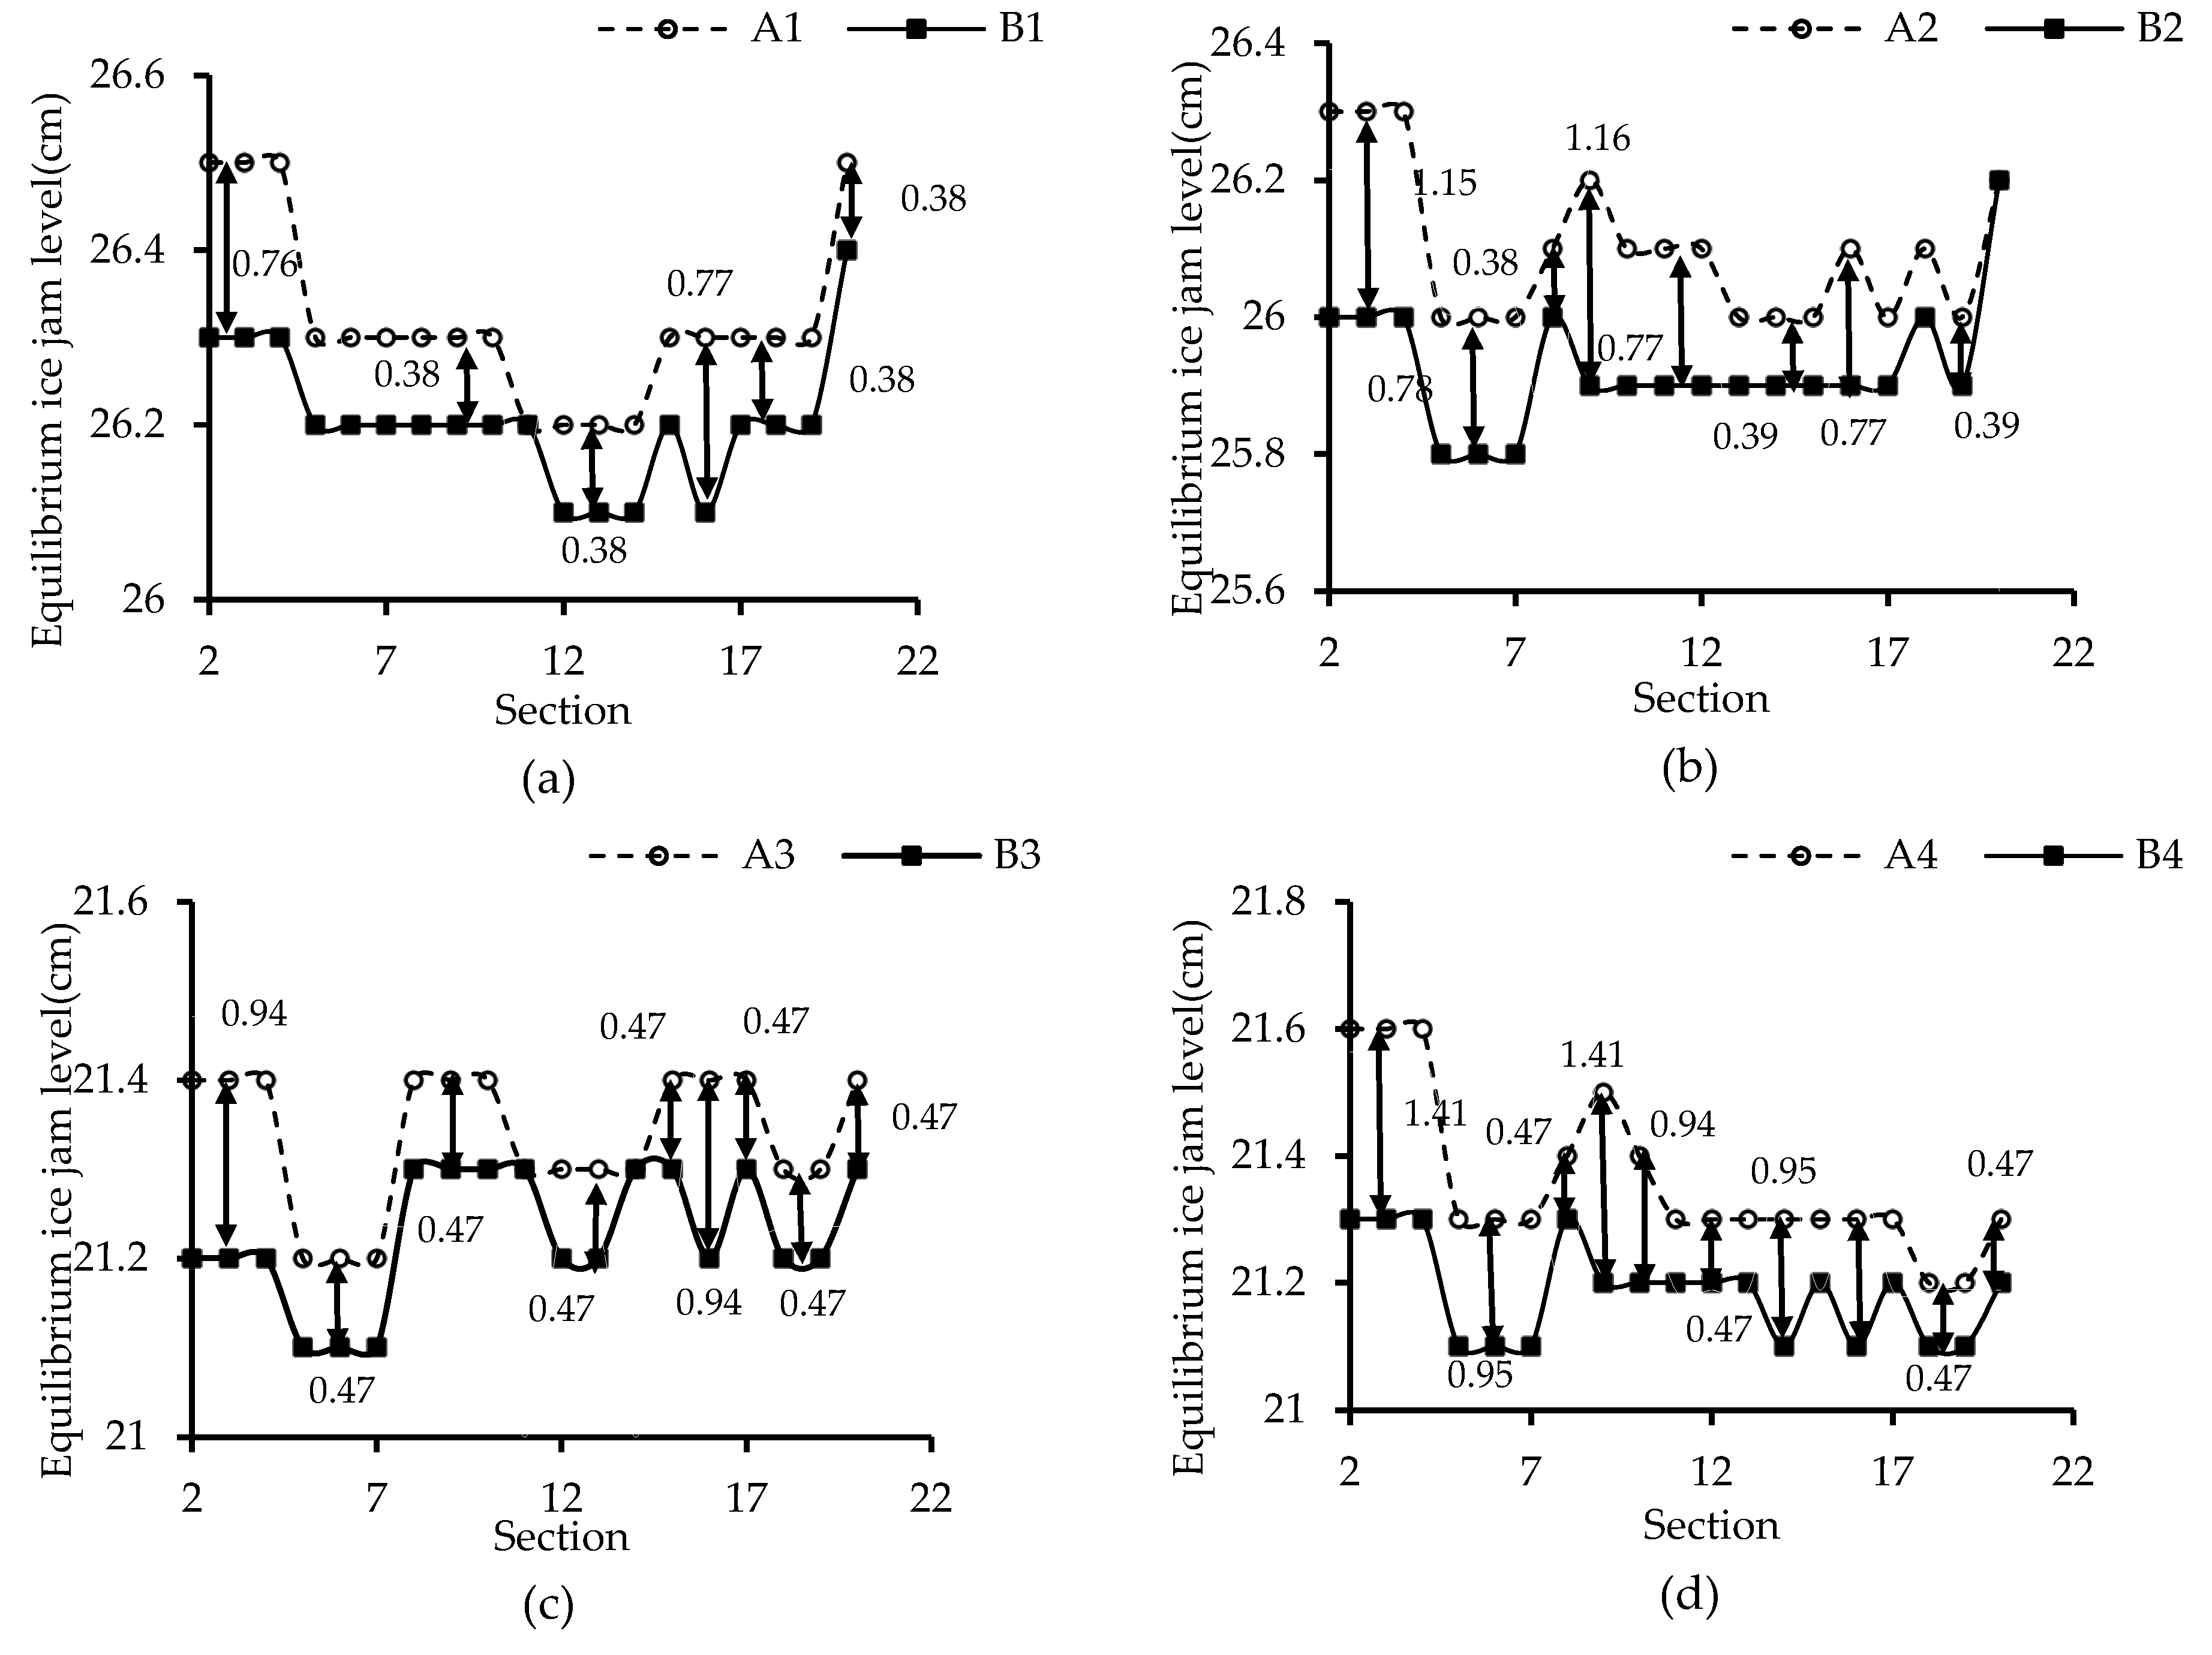
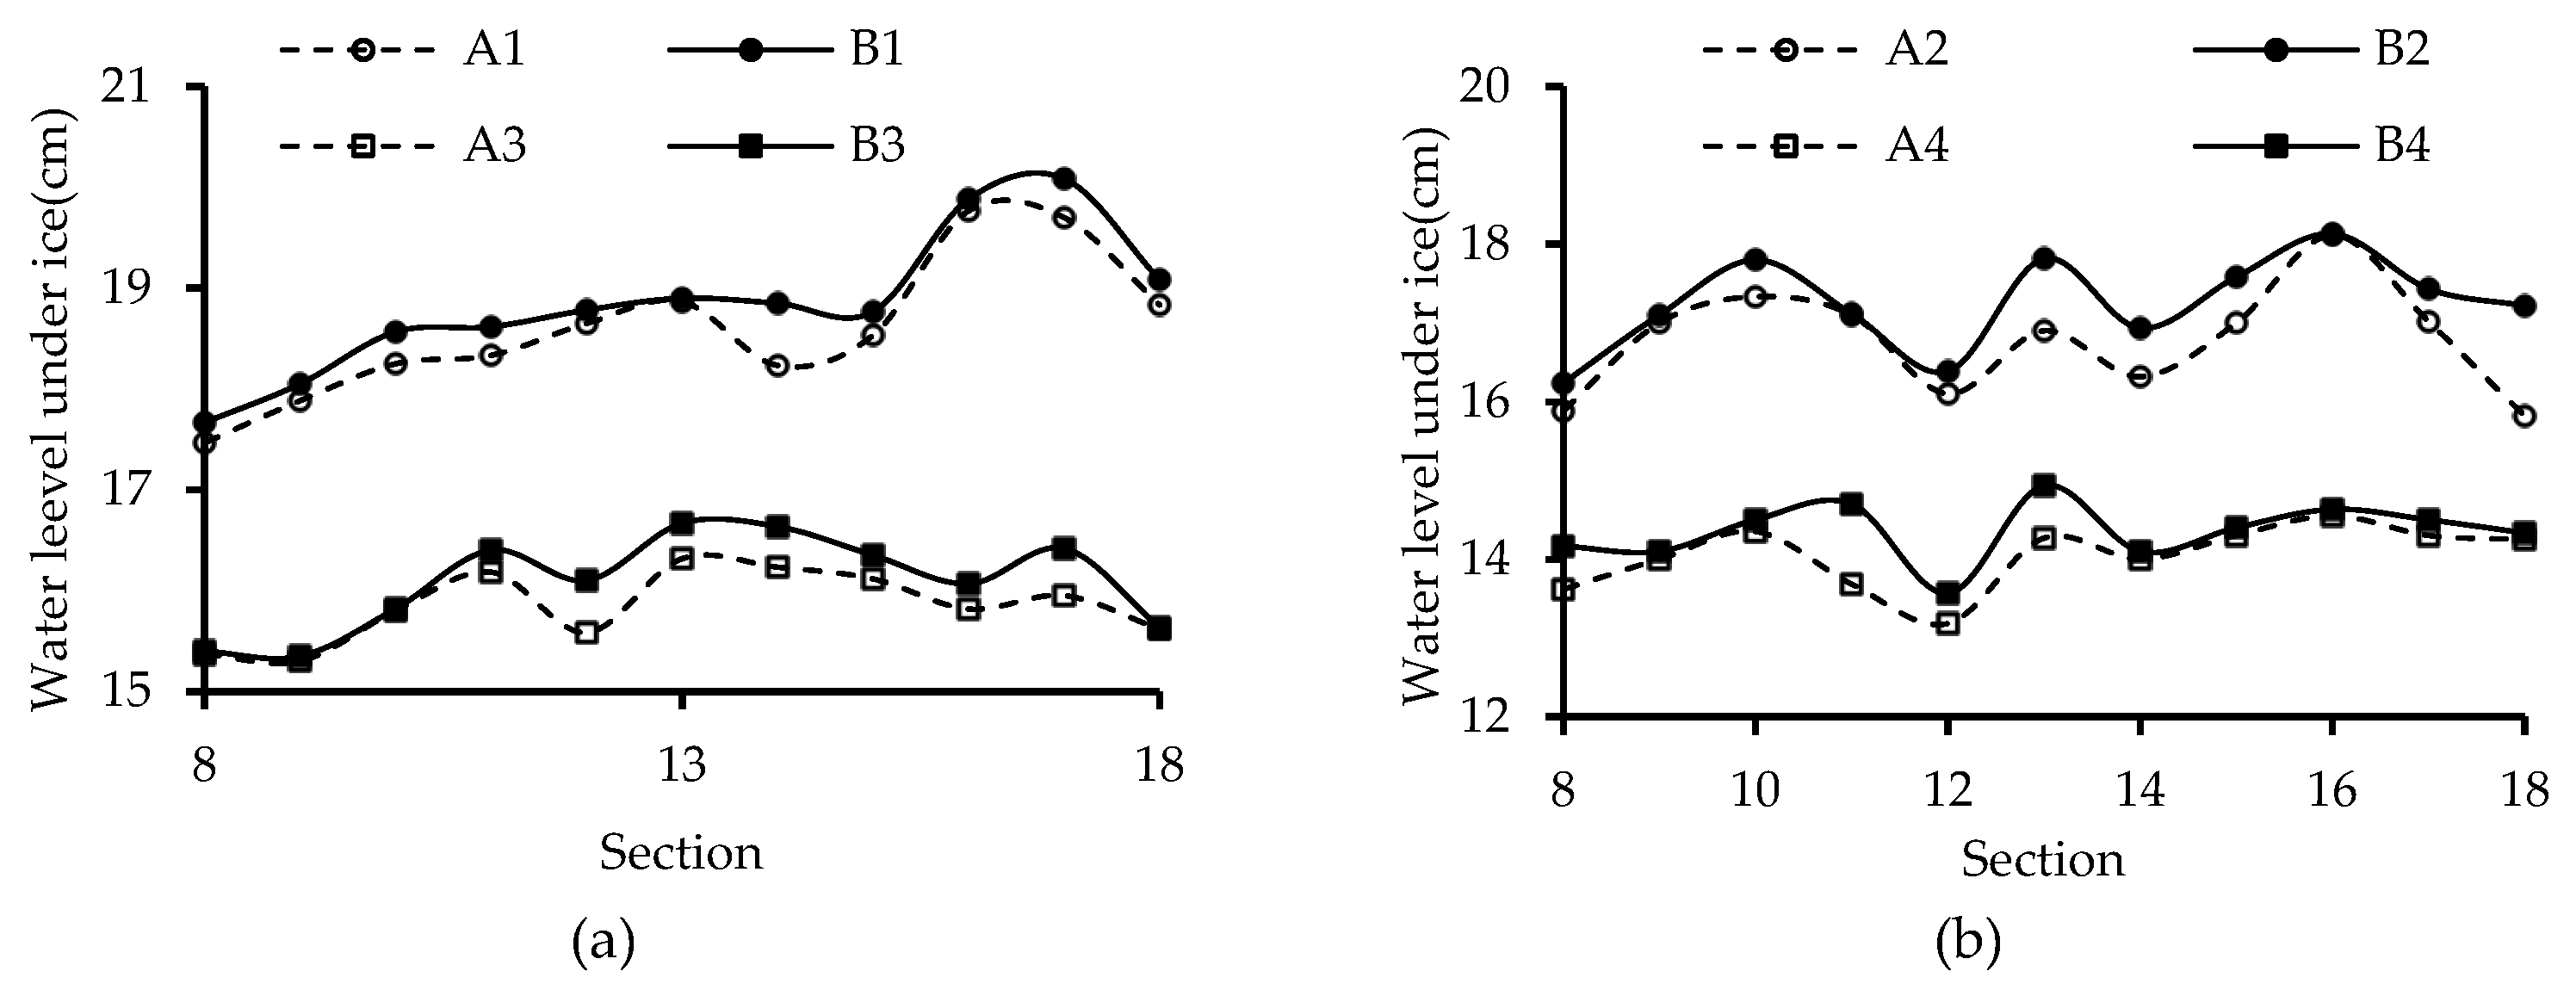
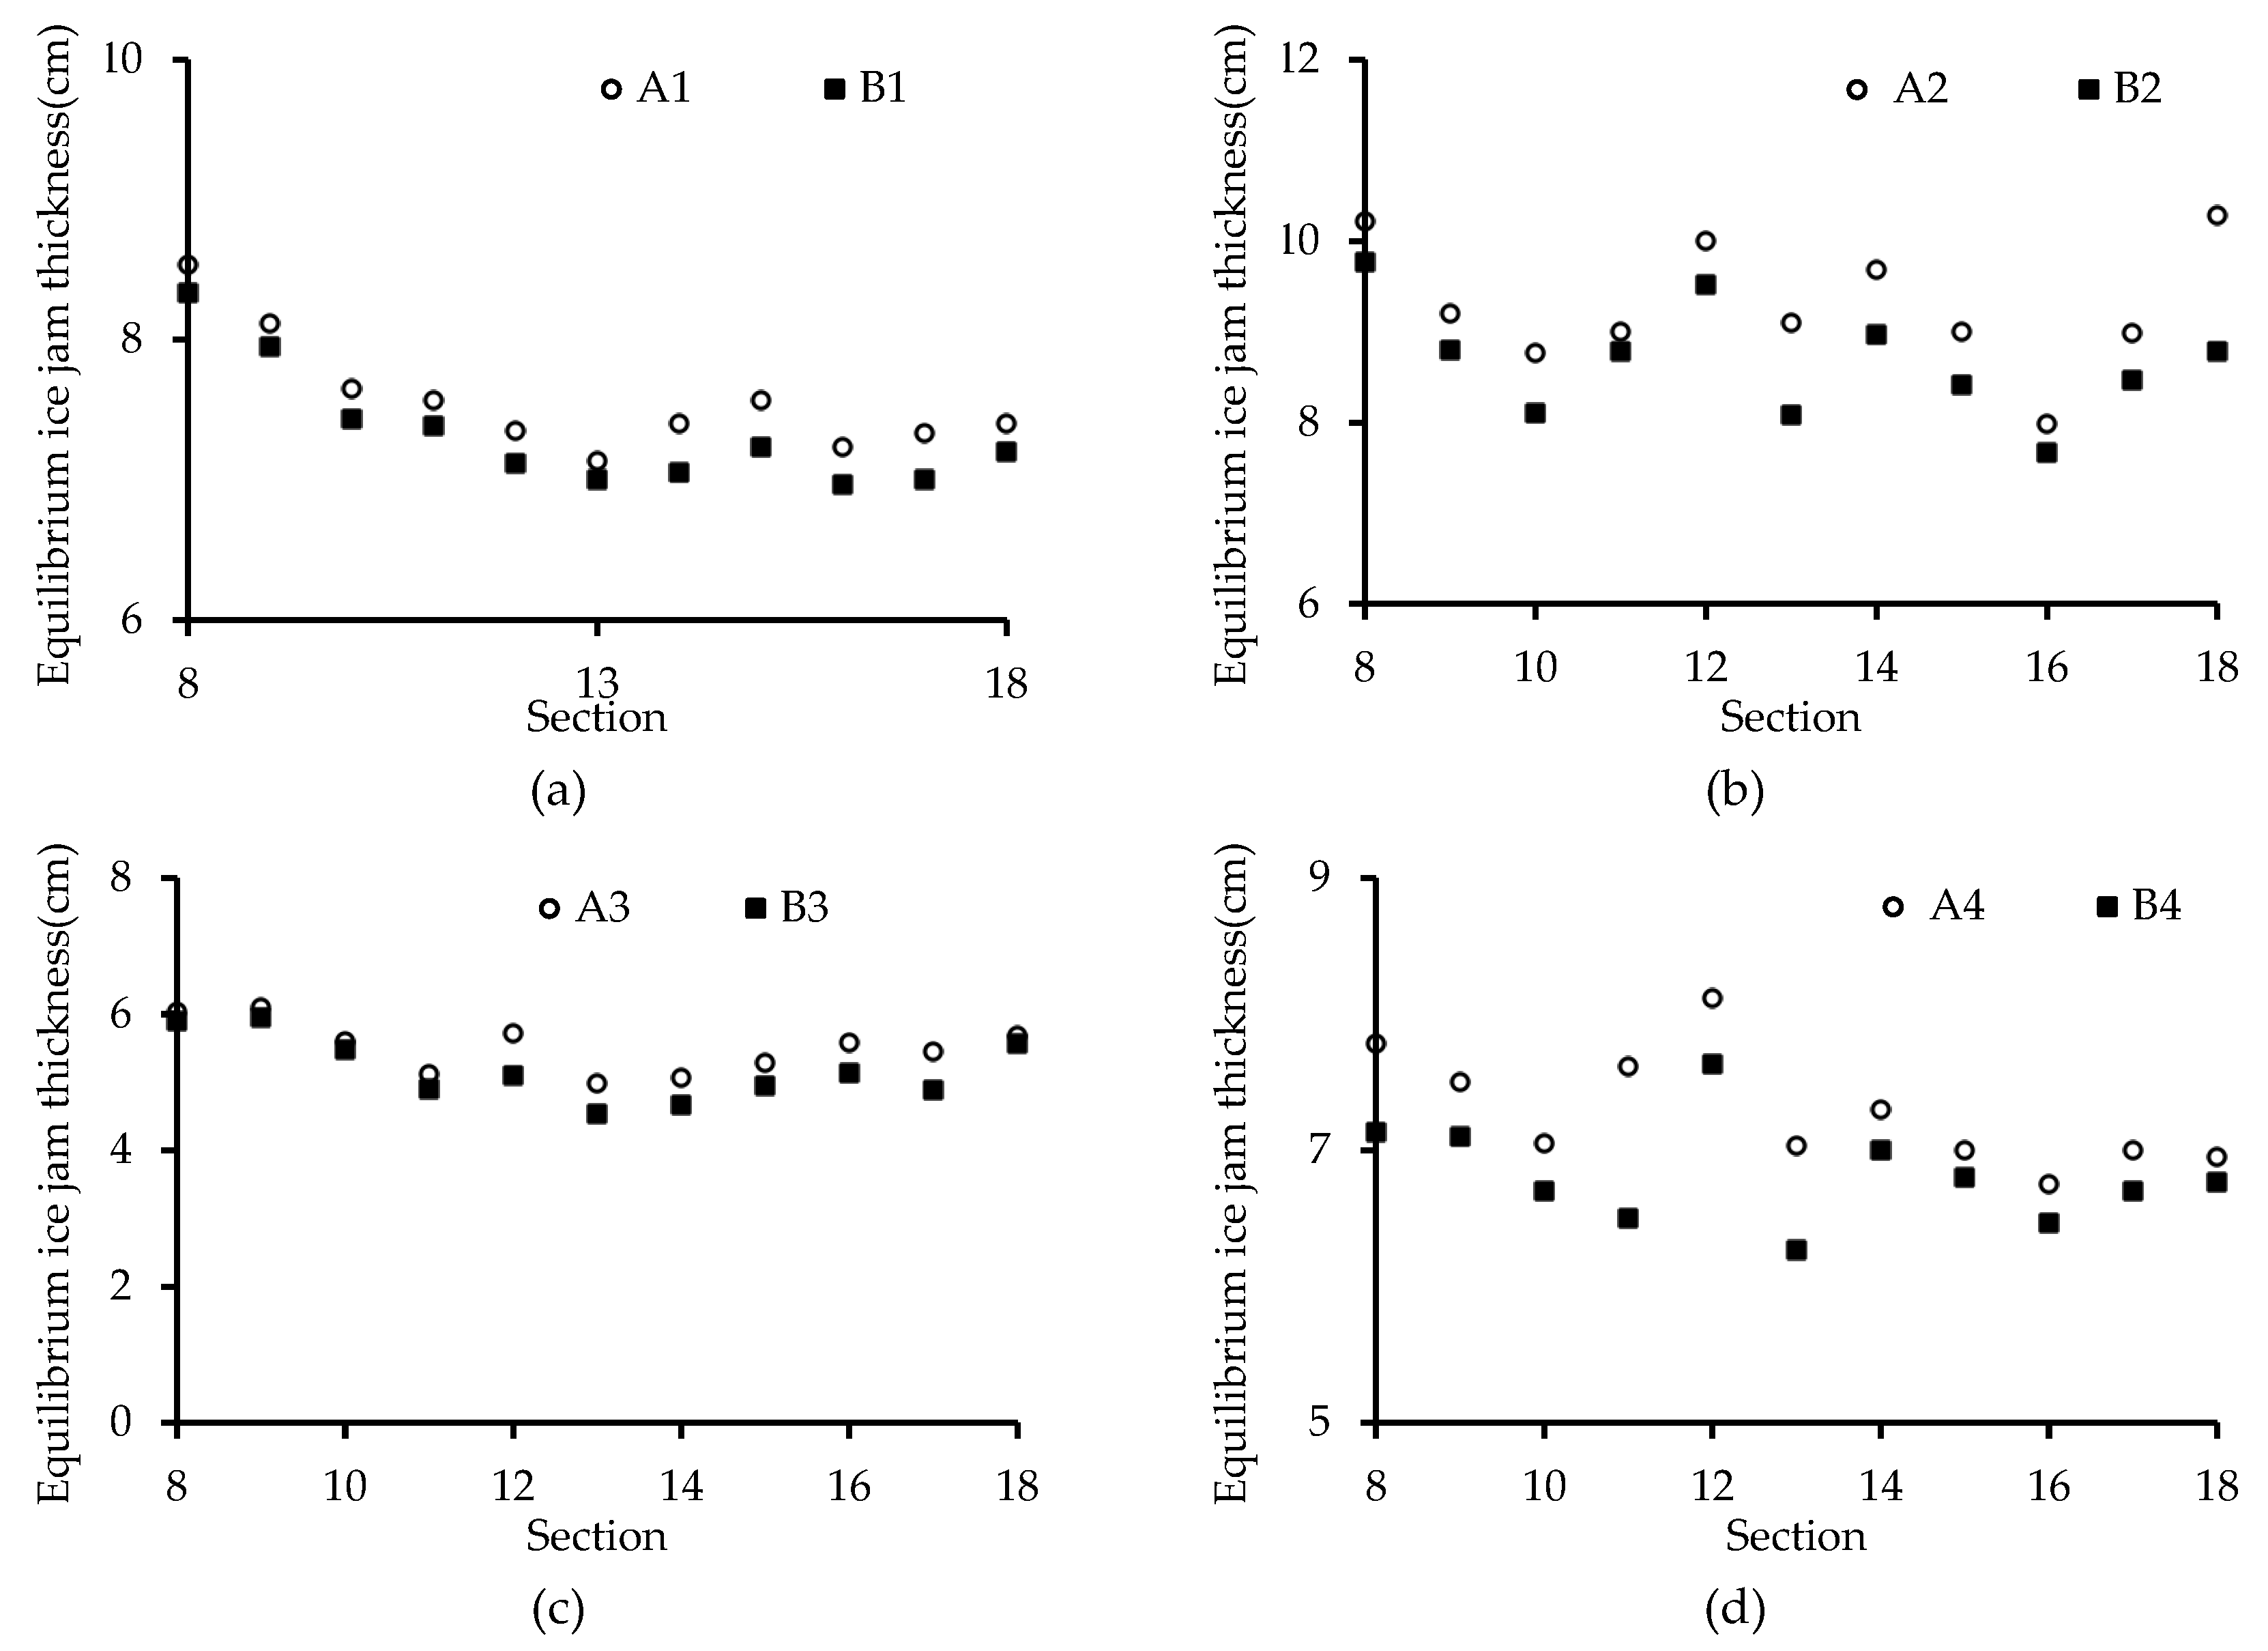
- During the formation of the initial ice jam around the piers with the local scour process, compared to the absence of the local scour around the pier, the depth of the water under the initial ice jam is greater with the local scour, implying that the flow under the initial ice jam has less capacity for transporting ice particles. Thus, during the thickening stage of an ice jam, more ice particles accumulate under the initial ice jam, and the thickness of the equilibrium ice jam is greater.
- Compared to the results without a local scour, with the presence of a local scour around the pier, it needs more time for an ice jam to achieve an equilibrium condition; the upstream water level and jam thickness are clearly higher, and the rate of increase in the water level of equilibrium ice jams in upstream and pier sections is larger. In addition, the flow depth under an equilibrium ice jam with the scour case is smaller than that without a pier scour, implying that the presence of a local scour consumes part of the flow energy and is not conducive to transport ice particles.
- Compared to the development of scour holes without the presence of an ice cover, the formation of scour holes under an ice jam can be classified into the following two different categories based on the thickening process of the ice jam: (a) When the development of an ice jam is dominated by a mechanical thickening process, as the ice jam develops upstream, the thickness of an ice jam increases. When the initial ice jam reaches the pier, the flow depth under the ice jam decreases. The development of a scour hole is accelerated. Experiments showed that the development of a scour hole under an ice-jammed flow condition is faster before an ice jam reaches an equilibrium state. (b) When the development of an initial ice jam is dominated by a hydraulic thickening process, during the thickening stage of an ice jam, when the ice wave crest reaches the pier, the thickness of an ice jam increases rapidly, and thus, the flow depth under the ice jam decreases and leads to a rapid development of the scour hole at the pier.
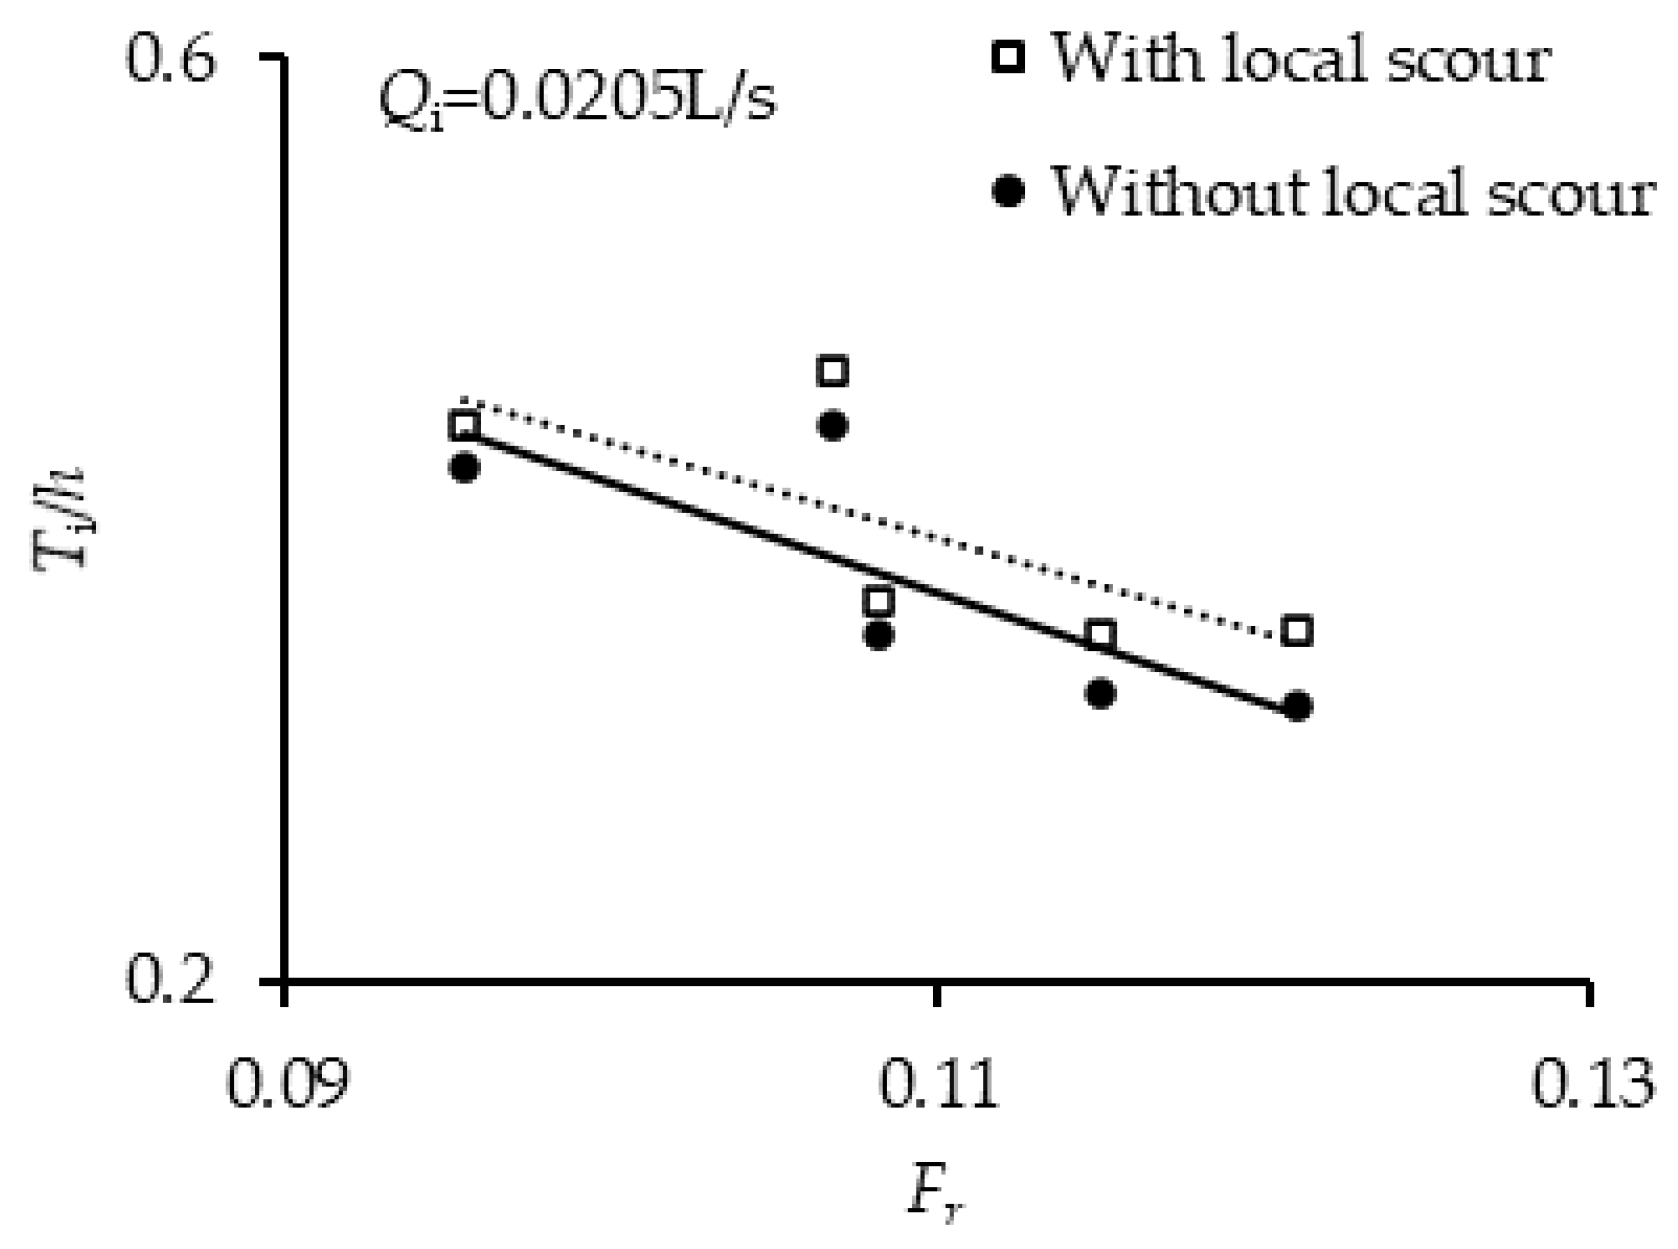
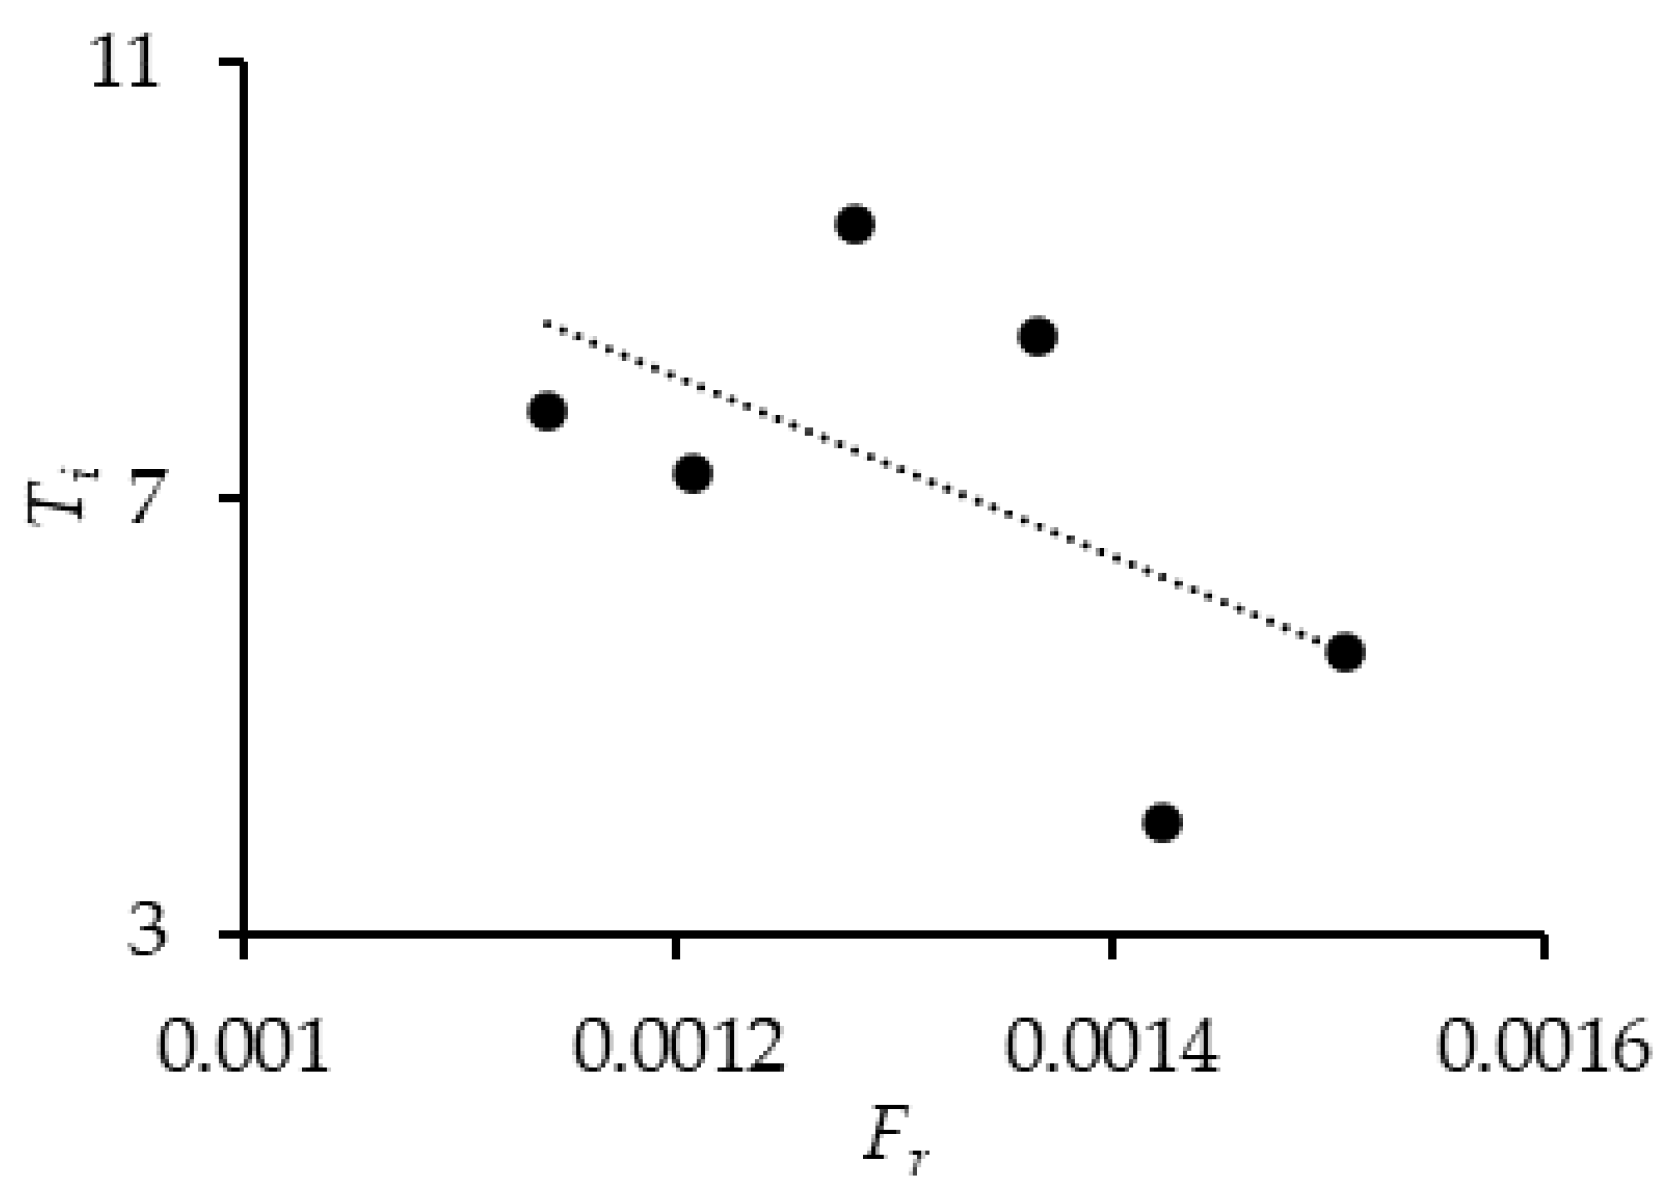
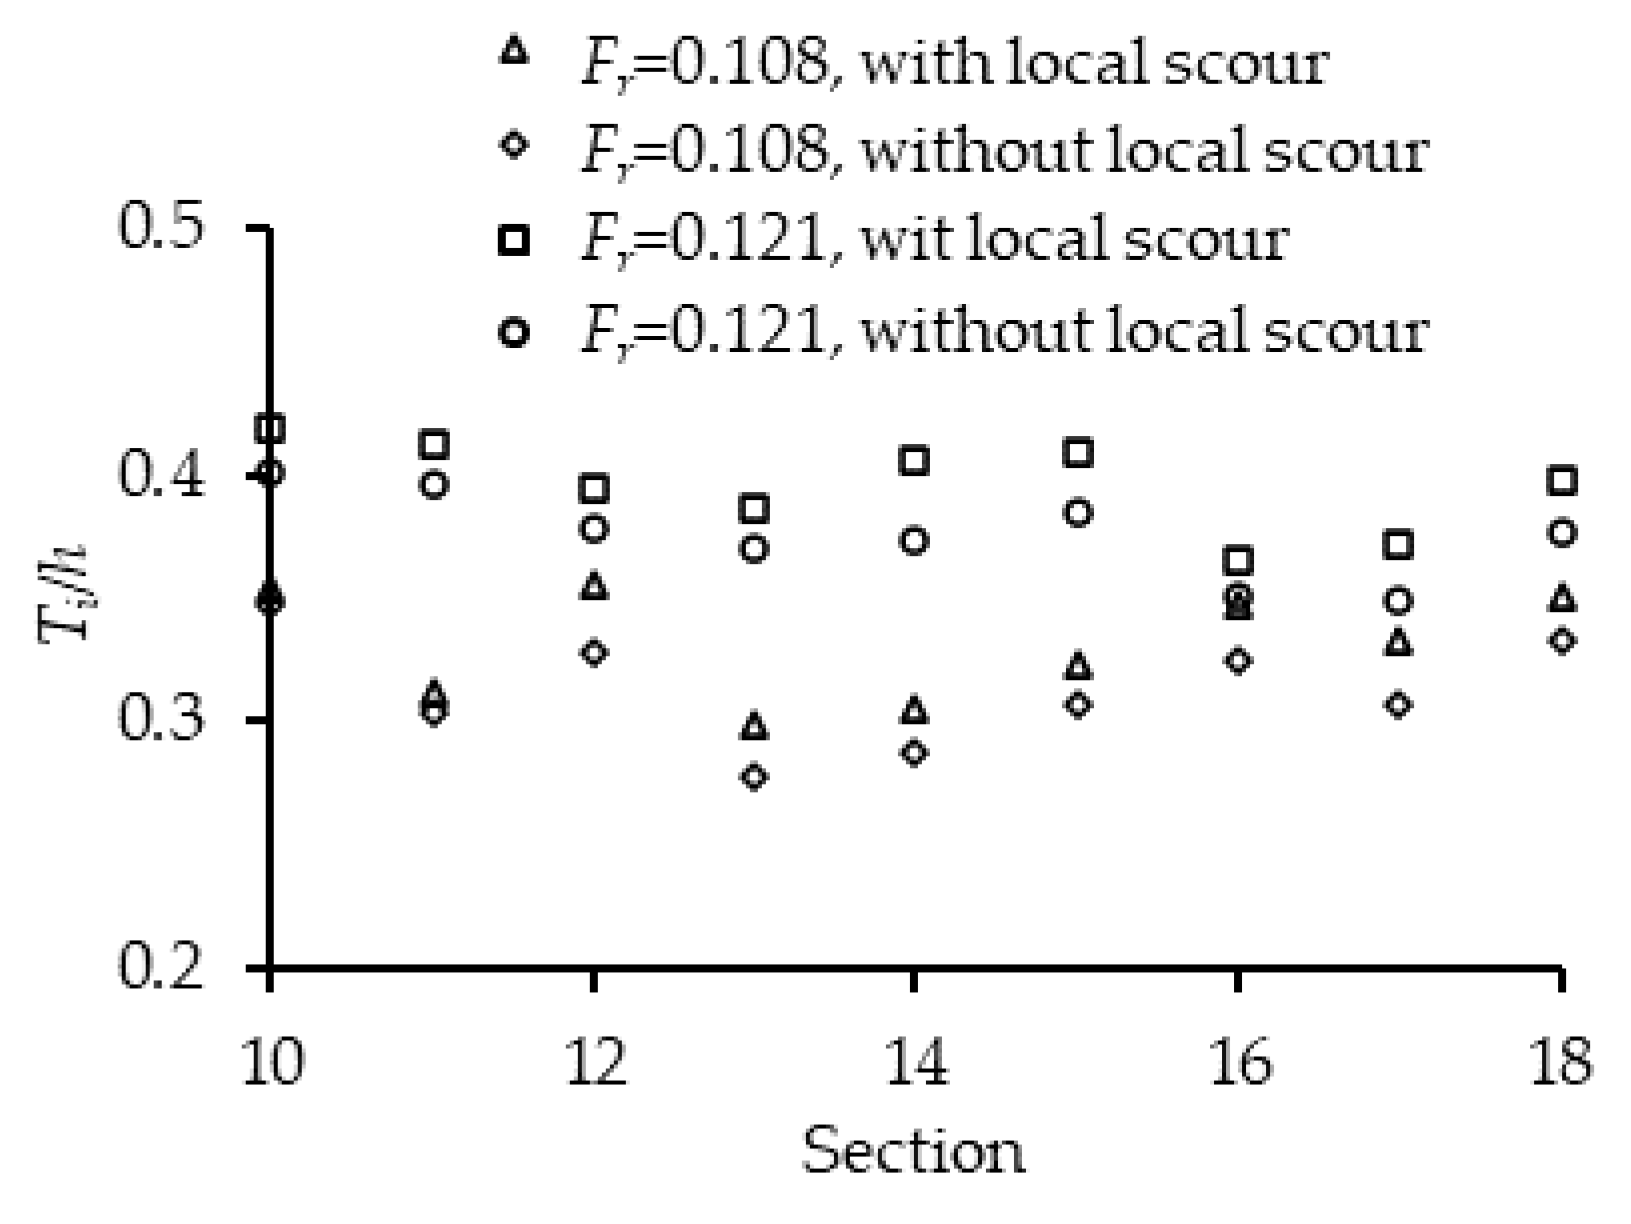
- Regardless of whether a local scour appears or not, the Ti/h is negatively correlated with Fr. An increase in Fr results in an increase in the ice transport capacity. Therefore, more ice particles are transported downstream, and the ice jam thickness is relatively small. However, with the same flow Froude number Fr, the Ti/h value is larger in the presence of a local scour. The ice jam thickness near the piers increases, which leads to an upstream water level increase, and the ice transport capacity is weakened. Thus, the ice jam thickness in the upstream section of the pier increases
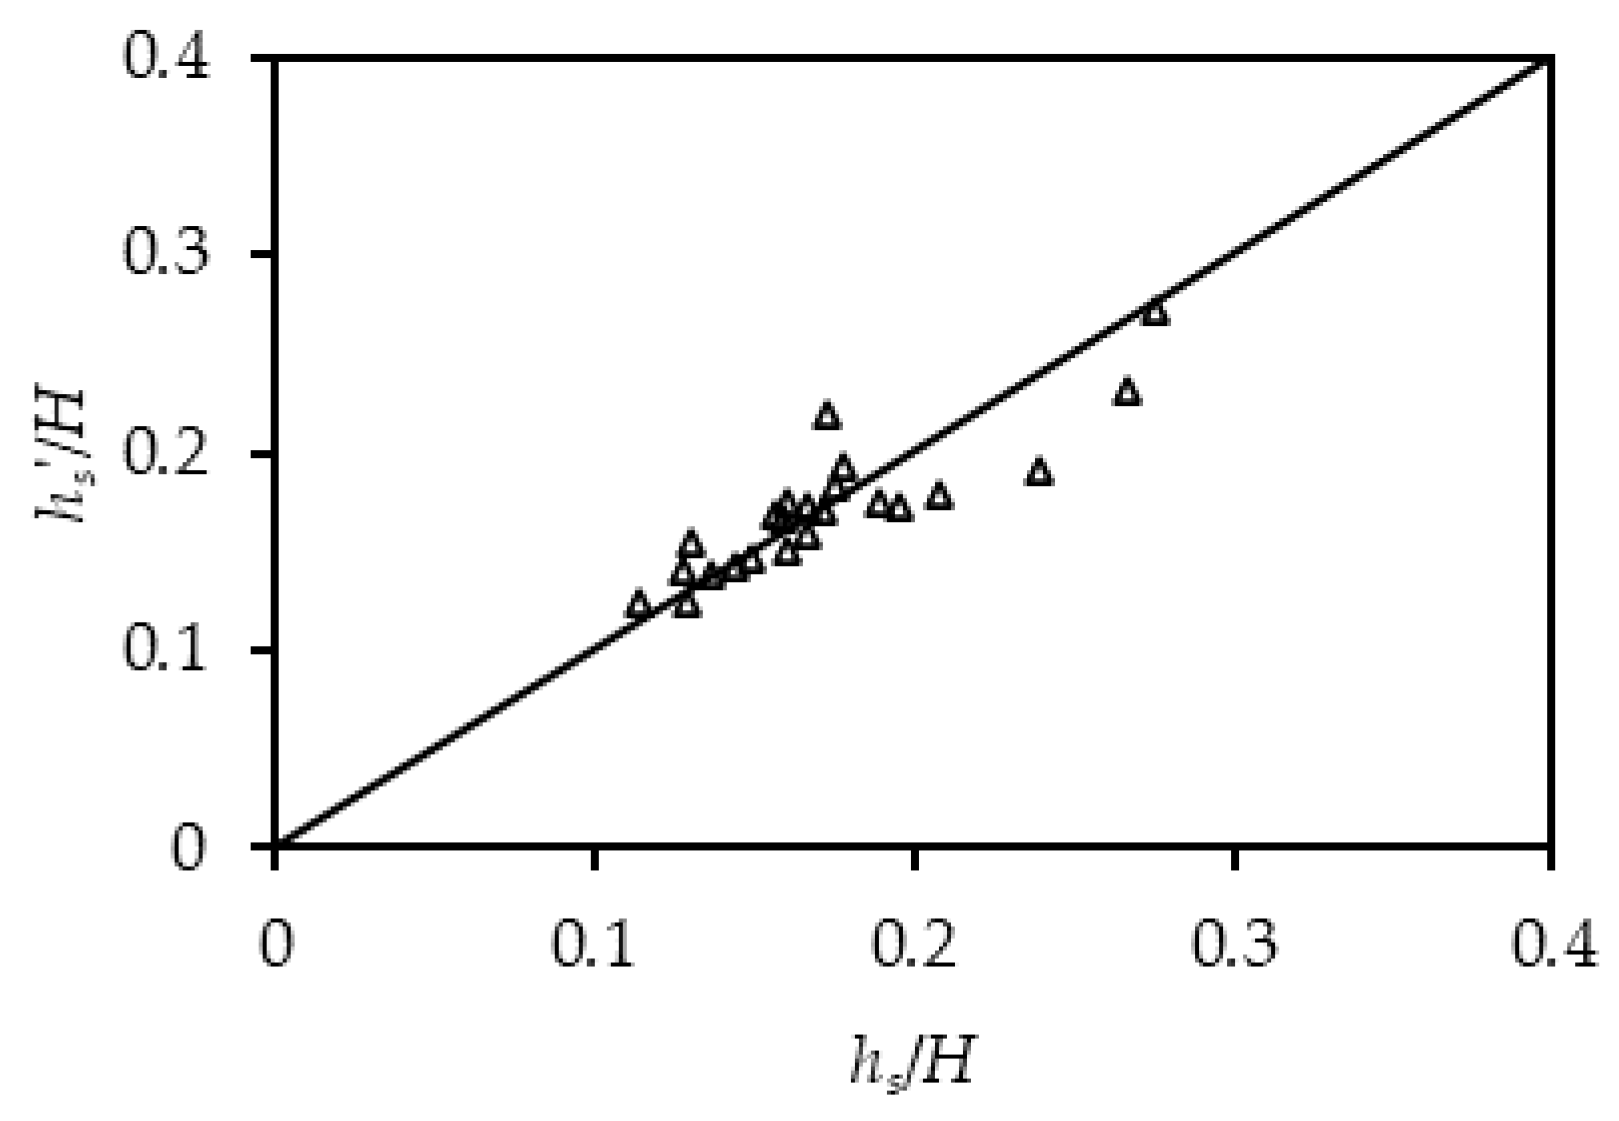
- An equation for calculating the maximum depth of a scour hole around the pier under an ice-jammed flow condition is obtained. The results show that with the increase in the flow Froude number (Fr), ice flow (Qi), and pier shape coefficient (Kζ), the maximum depth of scour holes around the pier increases. The maximum depth of a scour hole under an ice-jammed flow condition increases with the decrease in the particle size of the sand bed. The calculation results using the proposed equation agree well with those of the measurements in the laboratory.
- This paper mainly focuses on the interaction between local scour at a single pier and ice jam evolution under the flow condition whereby the leading edge of an initial ice jam can reach the upstream of the piers. The mechanical impact of ice particles on the pier and the interaction between piers (pier superstructure) and ice jams under extreme conditions were not investigated. The influence of different angles between the direction of the flow and the bridge pier on local scour at the pier was not assessed. In the event that the leading edge of an ice jam cannot reach the pier section, the local scour around the pier should be further studied.
Author Contributions
Funding
Institutional Review Board Statement
Informed Consent Statement
Data Availability Statement
Conflicts of Interest
References
- Sui, J.; Wang, J.; He, Y.; Krol, F. Velocity profiles and incipient motion of frazil particles under ice cover. Int. J. Sediment Res. 2010, 25, 39–51. [Google Scholar] [CrossRef]
- Wang, J.; Wang, T.; Li, S.; Chen, P. Impacts of bridge pier on ice jam initiation and ice thickness in a curved channel—An experimental study. J. Hydraul. Eng. 2017, 48, 588–593. [Google Scholar]
- Wang, J.; Hou, Z.; Sun, H.; Fang, B.; Sui, J.; Karney, B. Local scour around a bridge pier under ice-jammed flow condition—An experimental study. J. Hydrol. Hydromech. 2021, 69, 275–287. [Google Scholar] [CrossRef]
- Wang, J.; Hua, J.; Chen, P.; Sui, J.; Wu, P.; Whitcombe, T. Initiation of ice jam in front of bridge piers—An experimental study. J. Hydrodyn. 2019, 31, 117–123. [Google Scholar] [CrossRef]
- Wang, J.; Chen, P.; Qang, Q. lmpact of bridge piers on ice jam stage variation: An experimental study. Adv. Water Sci. 2015, 26, 867–873. [Google Scholar]
- Urroz, G.E.; Schaefer, J.; Ettema, R. Bridge-pier location and ice conveyance in curved channels. J. Cold Reg. Eng. 1994, 8, 66–72. [Google Scholar] [CrossRef]
- Wang, J.; Huang, N.; Wu, Y.; Cheng, T. Impacts of bridge-pier types on balancing ice jams: An experimental study. Adv. Water Sci. 2018, 29, 568–573. [Google Scholar]
- Wang, J.; Hua, J.; Sui, J.; Wu, P.; Liu, T.; Chen, P. The impact of bridge pier on ice jam evolution an experimental study. J. Hydrol. Hydromech. 2016, 64, 75–82. [Google Scholar] [CrossRef] [Green Version]
- Cheng, T.; Wang, J.; Chen, P.; Sui, J. Simulation of ice accumulation around bridge piers during river breakup periods using a discrete element model. J. Hydrodyn. 2022, 34, 94–105. [Google Scholar] [CrossRef]
- Yang, W.C.; Shekhar, K.; Arduino, P.; Mackenzie-Helnweinb, P.; Millerb, G. Modeling tsunami induced debris impacts on bridge structures using the material point method. Procedia Eng. 2017, 175, 175–181. [Google Scholar] [CrossRef]
- Istrati, D.; Hasanpour, A.; Buckle, I. Numerical Investigation of Tsunami-Borne Debris Damming Loads on a Coastal Bridge. In Proceedings of the 17 World Conference on Earthquake Engineering, Sendai, Japan, 27 September–2 October 2020; p. 27. [Google Scholar]
- Salciarini, D.; Tamagnini, C.; Conversini, P. Discrete element modeling of debris-avalanche impact on earthfill barriers. Phys. Chem. Earth Parts A/B/C 2010, 35, 172–181. [Google Scholar] [CrossRef]
- Hasanpour, A.; Istrati, D.; Buckle, I. Coupled SPH–FEM Modeling of Tsunami-Borne Large Debris Flow and Impact on Coastal Structures. J. Mar. Sci. Eng. 2021, 9, 1068. [Google Scholar] [CrossRef]
- Parola, A.C.; Apelt, C.J.; Jempson, M.A. Debris Forces on Highway Bridges; No. 445; Transportation Research Board: Washington, DC, USA, 2000. [Google Scholar]
- Malavasi, S.; Riva, M.; Vanali, M.; Larcan, E. Hydrodynamic forces on a submerged bridge. WIT Trans. Built Environ. 2001, 56. [Google Scholar] [CrossRef]
- Pandey, M.; Oliveto, G.; Pu, J.H.; Sharma, P.K.; Ojha, C.S.P. Pier scour prediction in non-uniform gravel beds. Water 2020, 12, 1696. [Google Scholar] [CrossRef]
- Memar, S.; Zounemat-Kermani, M.; Beheshti, A.; Rahimpour, M.; Cesare, G.D.; Schleiss, A.J. Influence of collars on reduction in scour depth at two piers in a tandem configuration. Acta Geophys. 2020, 68, 229–242. [Google Scholar] [CrossRef]
- Zhao, J.; Zhang, Y.; Li, M. Experimental study of piers scour in complex boundary condition. J. Sediment Res. 2013, 1, 14–19. [Google Scholar]
- Nyantekyi-Kwakye, B.; Essel, E.E.; Dow, K.; Clark, S.P.; Tachie, M.F. Hydraulic and turbulent flow characteristics beneath a simulated partial ice-cover. J. Hydraul. Res. 2021, 59, 392–403. [Google Scholar] [CrossRef]
- Beltaos, S.; Burrell, B.C. Effects of River-Ice Breakup on Sediment Transport and Implications to Stream Environments: A Review. Water 2021, 13, 2541. [Google Scholar] [CrossRef]
- Biron, P.M.; Buffin-Bélanger, T.; Martel, N. Three-dimensional turbulent structures at a medium-sized confluence with and without an ice cover. Earth Surf. Process. Landf. 2019, 44, 3042–3056. [Google Scholar] [CrossRef]
- Fu, H.; Guo, X.; Kashani, A.H. Experimental study of real ice accumulation on channel hydraulics upstream of inverted siphons. Cold Reg. Sci. Technol. 2020, 176, 103087. [Google Scholar] [CrossRef]
- Batuca, D.; Dargahi, B. Some experimental results on local scour around cylindrical piers for open and covered flow. In Third International Symposium on River Sedimentation; University of Mississippi: University, MS, USA, 1986; pp. 1095–1104. [Google Scholar]
- Ackermann, N.L.; Shen, H.; Olsson, P. Local Scour Around Circular Piers Under Ice Covers. In Proceedings of the Ice in the Environment: 16th IAHR International Symposium on Ice, Dunedin, New Zealand, 2–6 December 2002; pp. 149–155. [Google Scholar]
- Hains, D.; Zabilansky, L. Laboratory Test of Scour under Ice: Data and Preliminary Results; U.S. Army Engineer Research and Development Center, Cold Regions Research and Engineering Laboratory: Hanover, NH, USA, 2004; p. 182. [Google Scholar]
- Hains, D.; Zabilansky, L. The Effects of river ice on scour and sediment transport. In Proceedings of the CRIPE 13th Workshop on the Hydraulics of Ice Covered Rivers, Hanover, NH, USA, 15–16 September 2005; pp. 102–107. [Google Scholar]
- Munteanu, A. Scouring around a Cylindrical Bridge Pier under Partially Ice-Covered Flow Condition; University of Ottawa: Ottawa, ON, Canada, 2004. [Google Scholar]
- Valela, C.; Sirianni, D.A.; Nistor, I.; Rennie, C.D.; Almansour, H. Bridge pier scour under ice cover. Water 2021, 13, 536. [Google Scholar] [CrossRef]
- Wu, P.; Balachandar, R.; Sui, J. Local Scour around Bridge Piers under Ice-Covered Conditions. J. Hydraul. Eng. 2016, 142, 04015038. [Google Scholar] [CrossRef]
- Wu, P.; Hirshfield, F.; Sui, J. Further studies of incipient motion and shear stress on local scour around bridge abutment under ice cover. Can. J. Civ. Eng. 2014, 41, 892–899. [Google Scholar] [CrossRef]
- Wu, P.; Hirshfield, F.; Sui, J. Armour Layer Analysis of Local Scour around Bridge Abutments Under Ice Cover. River Res. Appl. 2015, 31, 736–746. [Google Scholar] [CrossRef]
- Wang, J.; Li, Z.; Cheng, T.; Sui, J. Time-dependent local scour around bridge piers under ice cover-an experimental study. Chin. J. Hydraul. Eng. 2021, 52, 1174–1182. [Google Scholar]
- Namaee, M.R.; Sui, J. Impact of armour layer on the depth of scour hole around side-by-side bridge piers under ice-covered flow condition. J. Hydrol. Hydromech. 2019, 67, 240–251. [Google Scholar] [CrossRef] [Green Version]
- Namaee, M.R.; Sui, J. Effects of ice cover on the incipient motion of bed material and shear stress around side-by-side bridge piers. Cold Reg. Sci. Technol. 2019, 165, 102811. [Google Scholar] [CrossRef]
- Namaee, M.R.; Sui, J. Local scour around two side-by-side cylindrical bridge piers under ice-covered conditions. Int. J. Sediment Res. 2019, 34, 355–367. [Google Scholar] [CrossRef]
- Namaee, M.R.; Sui, J. Velocity profiles and turbulence intensities around side-by-side bridge piers under ice-covered flow condition. J. Hydrol. Hydromech. 2020, 68, 70–82. [Google Scholar] [CrossRef] [Green Version]
- Namaee, M.R.; Sui, J.; Wu, Y.; Linklater, N. Three-dimensional numerical simulation of local scour around circular side-by-side bridge piers with ice cover. Can. J. Civ. Eng. 2021, 48, 1335–1353. [Google Scholar] [CrossRef]
- CCCC High-Way Consultants Co, Ltd. General Code for Design of Highway Bridges and Culverts: JTG D60—2015[S]; China Communications Press: Beijing, China, 2015. [Google Scholar]
- Sui, J.; Karney, B.; Fang, D. Variation in water level under ice-jammed condition–Field investigation and experimental study. Hydrol. Res. 2005, 36, 65–84. [Google Scholar] [CrossRef]
- Ashton, G.D. River and Lake Ice Engineering; Water Resources Publication: Alexandria, VA, USA, 1986. [Google Scholar]


| Number | Average Approaching Velocity V0 (m/s) | Approaching Flow Depth H0 (m) | Ice Flow Rate Qi (L/s) | Grain Size of Sand Bed d50 (mm) | With or Without Local Scour | Bridge Pier Shape |
|---|---|---|---|---|---|---|
| A1 | 0.17 | 0.25 | 0.0205 | 0.713 | With | cylindrical |
| A2 | 0.15 | 0.25 | 0.0205 | 0.713 | With | cylindrical |
| A3 | 0.17 | 0.20 | 0.0205 | 0.713 | With | cylindrical |
| A4 | 0.15 | 0.20 | 0.0205 | 0.713 | With | cylindrical |
| A5 | 0.16 | 0.20 | 0.0205 | 0.713 | With | round end-shaped |
| A6 | 0.18 | 0.25 | 0.0205 | 0.713 | With | round end-shaped |
| A7 | 0.17 | 0.20 | 0.0205 | 0.713 | With | round end-shaped |
| A8 | 0.15 | 0.15 | 0.0205 | 0.713 | With | round end-shaped |
| A9 | 0.17 | 0.25 | 0.0205 | 0.713 | With | rectangle |
| A10 | 0.15 | 0.25 | 0.0205 | 0.713 | With | rectangle |
| A11 | 0.15 | 0.20 | 0.0205 | 0.713 | With | rectangle |
| A12 | 0.15 | 0.15 | 0.0205 | 0.713 | With | rectangle |
| A13 | 0.17 | 0.25 | 0.0205 | 0.490 | With | cylindrical |
| A14 | 0.15 | 0.20 | 0.0205 | 0.490 | With | cylindrical |
| A15 | 0.17 | 0.25 | 0.0205 | 1.040 | With | cylindrical |
| A16 | 0.15 | 0.20 | 0.0205 | 1.040 | With | cylindrical |
| B1 | 0.17 | 0.25 | 0.0205 | - | Without | cylindrical |
| B2 | 0.15 | 0.25 | 0.0205 | - | Without | cylindrical |
| B3 | 0.17 | 0.20 | 0.0205 | - | Without | cylindrical |
| B4 | 0.15 | 0.20 | 0.0205 | - | Without | cylindrical |
| Pier Shape | Pier Shape Factor Kζ (The Oblique Angle with Water Flow is 0°) |
|---|---|
| cylindrical | 1 |
| rectangle | 1.2 |
| round end-shaped | 0.98 |
| Bridge Pier Shape | V0 (m/s) | H0 (m) | Qi (L/s) | Time Required to Complete the Initial Ice Jam Phase (min) | ||
|---|---|---|---|---|---|---|
| With Local Scour | Without Local Scour | With Local Scour | Without Local Scour | |||
| cylindrical | 0.17 | 0.25 | 0.0205 | 0.0205 | 138 | 195 |
| cylindrical | 0.15 | 0.25 | 0.0205 | 0.0205 | 80 | 107 |
| cylindrical | 0.17 | 0.20 | 0.0205 | 0.0205 | 269 | 300 |
| cylindrical | 0.15 | 0.20 | 0.0205 | 0.0205 | 100 | 118 |
| round end-shaped | 0.17 | 0.20 | 0.0205 | 0.0224 | 93 | 129 |
| round end-shaped | 0.16 | 0.20 | 0.0205 | 0.0212 | 87 | 175 |
| Bridge Pier Shape | V0 (m/s) | H0 (m) | Qi (L/s) | Time Required to Complete the Initial Ice Jam Phase (min) | ||
|---|---|---|---|---|---|---|
| With Local Scour | Without Local Scour | With Local Scour | Without Local Scour | |||
| cylindrical | 0.17 | 0.25 | 0.0205 | 0.0205 | 8.5 | 7.0 |
| cylindrical | 0.15 | 0.25 | 0.0205 | 0.0205 | 9.0 | 8.0 |
| cylindrical | 0.17 | 0.20 | 0.0205 | 0.0205 | 8.0 | 7.0 |
| cylindrical | 0.15 | 0.20 | 0.0205 | 0.0205 | 8.5 | 7.5 |
| round end-shaped | 0.17 | 0.20 | 0.0205 | 0.0224 | 7.5 | 5.5 |
| round end-shaped | 0.16 | 0.20 | 0.0205 | 0.0212 | 8.5 | 6.5 |
Publisher’s Note: MDPI stays neutral with regard to jurisdictional claims in published maps and institutional affiliations. |
© 2022 by the authors. Licensee MDPI, Basel, Switzerland. This article is an open access article distributed under the terms and conditions of the Creative Commons Attribution (CC BY) license (https://creativecommons.org/licenses/by/4.0/).
Share and Cite
Hu, H.; Wang, J.; Cheng, T.; Hou, Z.; Sui, J. Channel Bed Deformation and Ice Jam Evolution around Bridge Piers. Water 2022, 14, 1766. https://doi.org/10.3390/w14111766
Hu H, Wang J, Cheng T, Hou Z, Sui J. Channel Bed Deformation and Ice Jam Evolution around Bridge Piers. Water. 2022; 14(11):1766. https://doi.org/10.3390/w14111766
Chicago/Turabian StyleHu, Haotian, Jun Wang, Tiejie Cheng, Zhixing Hou, and Jueyi Sui. 2022. "Channel Bed Deformation and Ice Jam Evolution around Bridge Piers" Water 14, no. 11: 1766. https://doi.org/10.3390/w14111766
APA StyleHu, H., Wang, J., Cheng, T., Hou, Z., & Sui, J. (2022). Channel Bed Deformation and Ice Jam Evolution around Bridge Piers. Water, 14(11), 1766. https://doi.org/10.3390/w14111766