1. Introduction
The concept of total maximum daily loads (TMDLs) has been in effect in Korea since 1994. It refers to a regulatory system that manages the total quantity of pollutants discharged in each watershed within an allowable pollution load limit to achieve and maintain water quality targets set for each water system section [
1]. However, the allowable pollution load in Korea differs from that for the TMDLs used in the United States (US), which are planned and managed based on the delivered pollution load. In Korea, the discharged pollution load is calculated to satisfy the water quality target under standard flow rate conditions [
2]. Since the implementation of TMDLs in Korea, more than 60% of watersheds have achieved the water quality target based on the five-day biochemical oxygen demand (BOD
5), with a discharged pollution load compliance rate of approximately 85%; thus, the system is functioning effectively [
3].
The Korean TMDLs specify that the representative indicator for the management of organic matter in rivers is BOD
5, which is the amount of oxygen consumed when biodegradable organic matter in water is decomposed by microorganisms over five days. It is generally recognized as carbonaceous oxygen demand (CBOD). However, if the concentration of ammonia nitrogen (NH
3-N) in a body of water is higher, the nitrogenous oxygen demand (NOD) can affect the BOD
5. In general, the nitrifying bacteria responsible for NOD have only a small effect on BOD
5 over their five days of incubation due to their slow growth. However, if treated water that relies on biological treatment is introduced or a sufficient population of nitrifying bacteria are distributed in the body of water, the nitrifying bacteria can consume oxygen within five days, thereby significantly affecting the BOD
5. For this reason, the standard methods in the US [
4] and Japan exclude NOD from BOD measurements by injecting a nitrification inhibitor when measuring the efficiency of a sewage treatment plant (STP) or measuring the BOD of river water for compliance with effluent water quality criteria. However, while the Standard Methods for the Examination of Water Pollution in Korea [
5] suggests adding a nitrification inhibitor, such as CBOD, when BOD
5 is measured, BOD
5 is not separately regulated by CBOD. BOD
5 is managed as a representative water quality indicator to evaluate the efficiency of an STP or the pollution level of a river [
6].
Thus, although TMDLs have proven to be an effective part of watershed management policy for water quality control in Korea, there may be limitations in their ability to facilitate evaluation and diagnosis of river water quality based only on the amounts of pollutants discharged from the watershed. This is because watersheds are subject to change due to various factors, such as flow rate, temporary runoff from unidentified pollutants, and NOD. Moreover, the water quality management policies of Korea, as well as TMDLs, focus on BOD
5 and total phosphorus (TP). While the effluent water quality criteria for STPs and wastewater treatment plants (WWTPs) for BOD
5 and TP are stringent and continuously enforced, the management criteria for total nitrogen (TN) are relatively lax [
7]. However, nitrogen can induce an increase in BOD
5 in STP and WWTP effluent, as well as promote eutrophication of water bodies; thus, in other countries, to consider the effects of BOD
5 by NOD, the standard for effluent water quality from treatment facilities and management items for river water quality are set and managed in terms of NH
3-N. In contrast, in Korea, STPs face difficulty with nitrogen treatment during periods of low water temperature, which affects the NOD of rivers. Nevertheless, NH
3-N is not a regulatory item for rivers and effluent from treatment facilities, and the Korean government does not acquire basic data about nitrogen by type of treatment plant from annual national pollutant surveys [
8].
According to previous research, in rivers that receive high volumes of STP effluent, NOD is likely to increase when the NH
3-N content is high. In addition, changes in BOD
5 may be larger than changes in CBOD and total organic carbon (TOC) because of nitrification in STP effluents [
9]. In addition, the contribution of NOD to BOD
5 in a river unaffected by STP effluent is approximately 3%; however, it is 19–26% in rivers receiving effluent incompletely denitrified through treatment. This affects the increase in the concentration of organic matter and NH
3-N in the water [
10,
11].
Consequently, if large volumes of effluent with high levels of NH3-N flow into a watershed, BOD5 measurements in the waterways of that watershed may be distorted; thus, even if a plan to reduce organic matter emitted from pollutants in the watershed is implemented to improve BOD5, it may have little effect.
In fact, in some watersheds, the annual BOD discharge pollution load is decreasing, but the water quality continues to deteriorate; thus, it is necessary to identify the cause of the discrepancy between the discharge pollution load and the water quality and to take appropriate water quality management measures.
In this study, after selecting watersheds where such a phenomenon was suspected, the effects of NH3-N discharged from the STP on the organic matter target indicators, presented as TMDLs, were identified through field survey and water quality modeling. Based on it, an improvement plan for Korean TMDLs was developed considering the linkage between water quality indicators.
2. Materials and Methods
2.1. Study Area
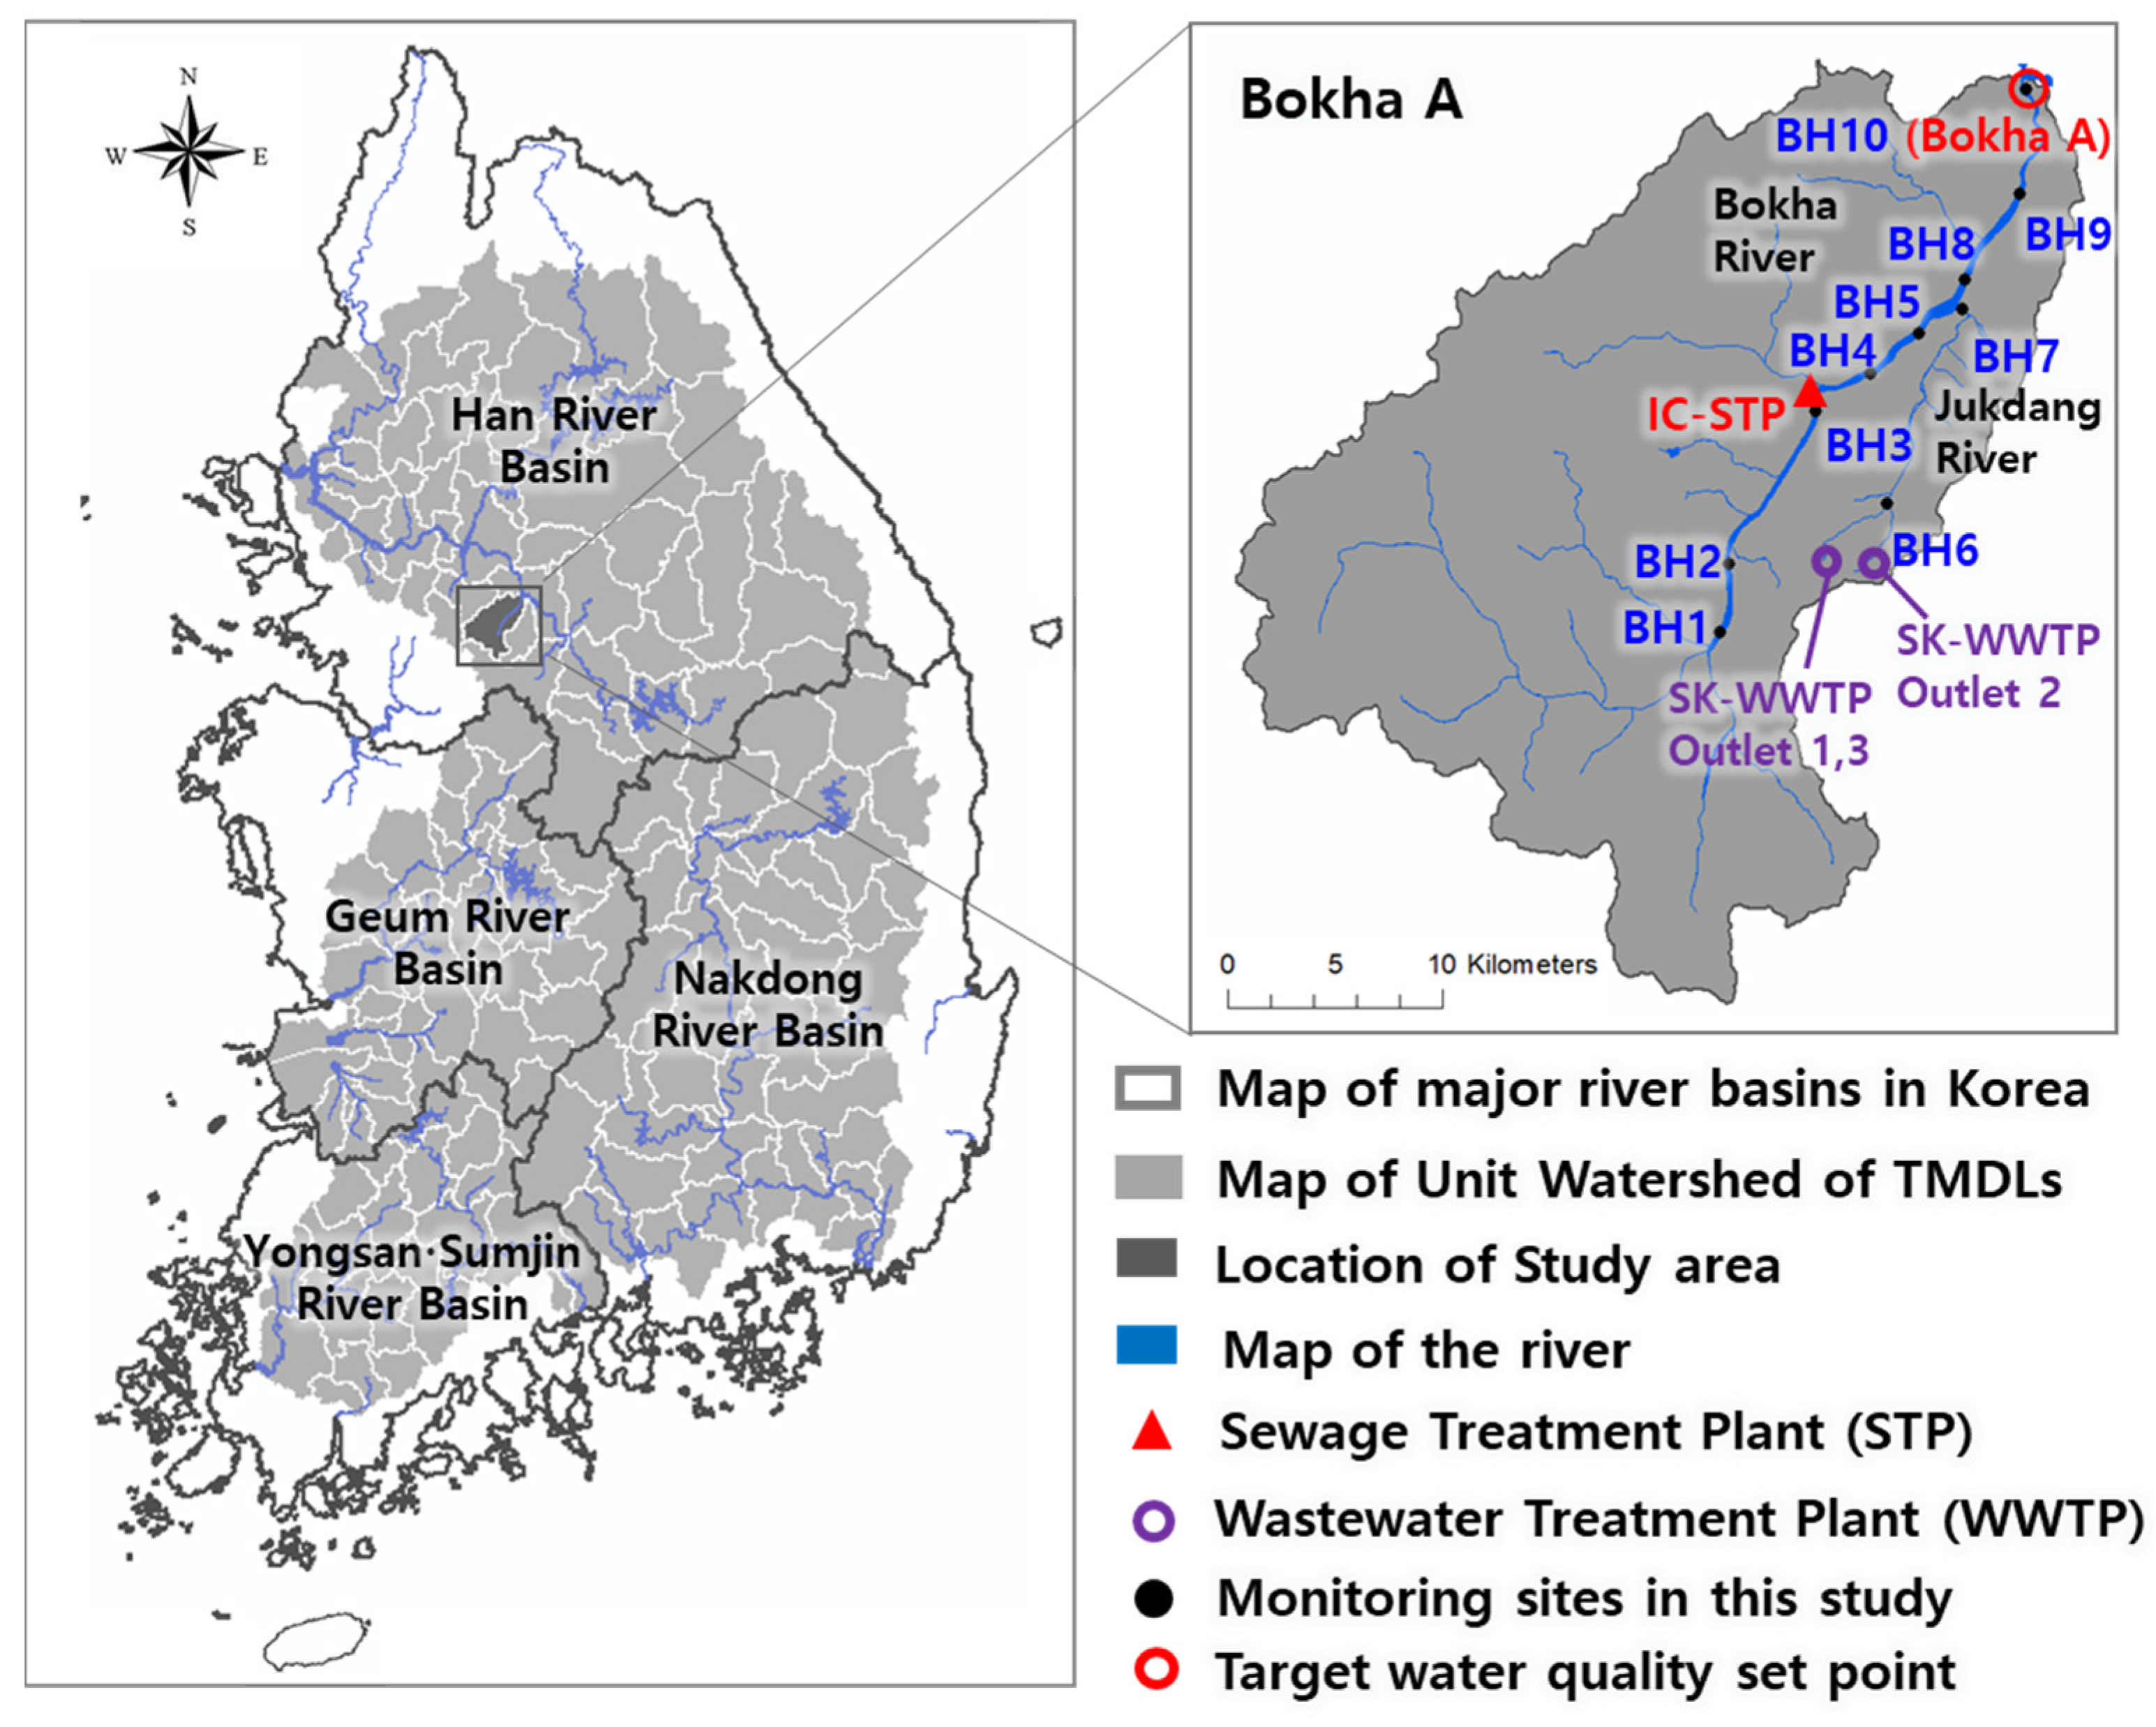
Korean rivers can be divided into four basins, as shown in
Figure 1. To implement TMDLs, these river basins were divided into 227 unit watersheds, and the target water quality was set and managed at the end of the river in each unit watershed. To select watersheds suspected of having a large nitrogen effect from the discharge facility in the river, a total of 77 unit watersheds were assigned a score based on water pollution levels and flow contribution rates of the discharge facility (treatment facility discharge/river flow), concentration of BOD
5 and TN, BOD
5/chemical oxygen demand (COD) ratio, and TN discharged pollution load contribution ratio (treatment facility load/river load). This included 21 unit watersheds in the Han River, 27 in the Nakdong River, 18 in the Geum River, and 11 in the Yeongsan and Seomjin Rivers. The unit watersheds excluded the mainstream and lake sections. The analysis period was from January 2017 to December 2018.
Based on the results, the highest-scoring unit watersheds were Bokha A for the Han River, Geumho C for the Nakdong River, Tapcheon A for the Geum River, and Jiseok A for the Yeongsan–Seomjin River (
Table 1). Among them, Bokha A was selected as the target watershed for this study, as the concentration of water pollutants was high, making it relatively simple to analyze the effects of the discharge facilities (
Table 1).
The BOD discharged pollution load of Bokha A, calculated from the pollution source survey data, decreased annually, suggesting that the discharged pollution load was decreasing. However, the water quality continually worsened. Thus, it was necessary to identify the cause of this discrepancy between the discharge load and the water quality and to prepare appropriate water quality management measures.
Bokha A is spread across 309.39 km2, and its human population as of 2018 was 185,347, with 26,473 cattle and 188,573 pigs. Mountains and agricultural land comprise 75% of the entire land area.
For the field monitoring survey, one STP and one WWTP were chosen as sites for discharge monitoring. These included the IC-STP (with a discharge of 10,000 m3/day or higher) and the SK-WWTP (with a discharge of 3000 m3/day or higher and a TN discharge concentration of 10.000 mg/L or higher). The SK-WWTP has three outlets, with outlets 1 and 3 discharging to the same place. Ten river survey sites were selected, located within 1 km of the STP effluent or tributary inflow and unit watershed endpoints.
The monitoring survey sites for the unit watersheds surveyed in this study and the plant capacity and effluent water quality of the STP are shown in
Figure 1 and
Table 2 [
8].
2.2. Water Quality Survey and Analysis Method
For the field monitoring survey, rivers and treatment plants were surveyed eight times at monthly intervals between October 2019 and June 2020, except for January 2020 since the cost and conditions associated with the monitoring were not ideal. Water temperature was measured in the field, and the CODMn, BOD
5, TP, phosphate (PO
4-P), NOD, TN, NH
3-N, nitrite nitrogen (NO
2-N), and nitrate nitrogen (NO
3-N) concentrations were analyzed according to the Standard Methods for the Examination of Water Pollution in Korea [
5]. NOD was calculated as the difference between the BOD
5 concentration measured without the addition of a nitrification inhibitor and the CBOD concentration measured by adding the seed solution and nitrification inhibitor [
12].
The concentration of dissolved inorganic nitrogen (DIN) was calculated as the sum of the concentrations of NH3-N, NO2-N, and NO3-N. The organic nitrogen concentration was calculated as the difference between TN and DIN concentrations because particulate inorganic nitrogen is generally absent.
BH 8 to 10 at the end of the river were analyzed for nine days to analyze the changes in BOD5 and NH3-N over time. Based on the results of this analysis, the water quality model factors, carbonaceous deoxygenation rate constant (K1), and rate constant for the biological oxidation of NH3 (β1) were calculated and applied to the QUAL-MEV model.
The K
1 value was calculated using the nonlinear curve equation for the BOD and CBOD concentrations over time, and the β
1 value was calculated from the nonlinear curve equation for the NH
3-N concentration over time using the same method as for the K
1 value. The K
1 calculated in this study differed by river, location, and time, but was within 0.05–0.39 day
−1, which is in the range of 25–75% of the default value of the water quality model applied in Korea. This is similar to the BOD mean K
1, 0.18 day
−1, which was measured in eight water bodies, including the Han River, by Jang et al. [
13].
β
1 was calculated using the same method as for K
1 because there are few accurate calculation methods and previous studies on this. It was found to be in the range of 0.143–0.351 day
−1 (
Table 3).
2.3. Overview of Korean TMDLs
According to the Korean TMDL planning process, first, the master and implementation plans for five to ten years are established, followed by an annual implementation evaluation to assess whether the plans are being properly implemented. The discharged pollution load is calculated based on the annual implementation evaluation to determine whether the load allocation is exceeded.
In the case of a unit watershed that exceeds the load allocation or water quality in the final target year, no approval or permission for urban development projects and industrial and tourism complexes are given as sanctions for non-compliance with the TMDL [
14]. The load allocation managed in the TMDL plan starts with the setting of the target water quality, which utilizes the water quality model. Based on the discharged pollution load calculated from the pollution source survey data, the discharged pollution load for the target year is predicted by considering the population growth rate, urban development plan, and load reduction plan. After establishing a water quality model that reflects the watershed environment, including the discharged pollution load in the planned year, calibration and verification are performed on the water quality in the planned year.
When constructing the water quality model, the discharged pollution load for the input planned year was changed to the predicted pollution load for the target year. Moreover, the water quality model was re-run, and the predicted water quality was made the target water quality. The load allocation was obtained by multiplying the target water quality by the standard flow rate and excluding a 10% margin of safety (MOS).
There are various water quality models available in the literature based on the characteristics of the target body of water, the water quality factors targeted for prediction and analysis, and the required basic data and their availability. The water quality model applied in Korean TMDLs is a static model of the QUAL family, and the most utilized model is QUAL-MEV [
15], which was especially optimized for TMDLs based on the QUAL2E model [
16]. QUAL-MEV has the same basic functionality as QUAL2E but modifies the simulation for the existing CBOD so that it can reflect the effects of nitrogen and algae on BOD (
Figure 2). This study also selected the QUAL-MEV model because it is universally applied for the establishment of target values and the evaluation of achievement in water environment policies in Korea, including TMDLs.
In Korean TMDLs, the flow rate condition, which is the standard for setting the BOD target value, is the 10-year average dry condition flow (10Q275). For values applied to the model, including the observed values and ratios, measurements during a period similar to the standard flow rate of the dry season were used.
3. Results
3.1. Verification of the Model’s Reproduction of Recent Water Quality
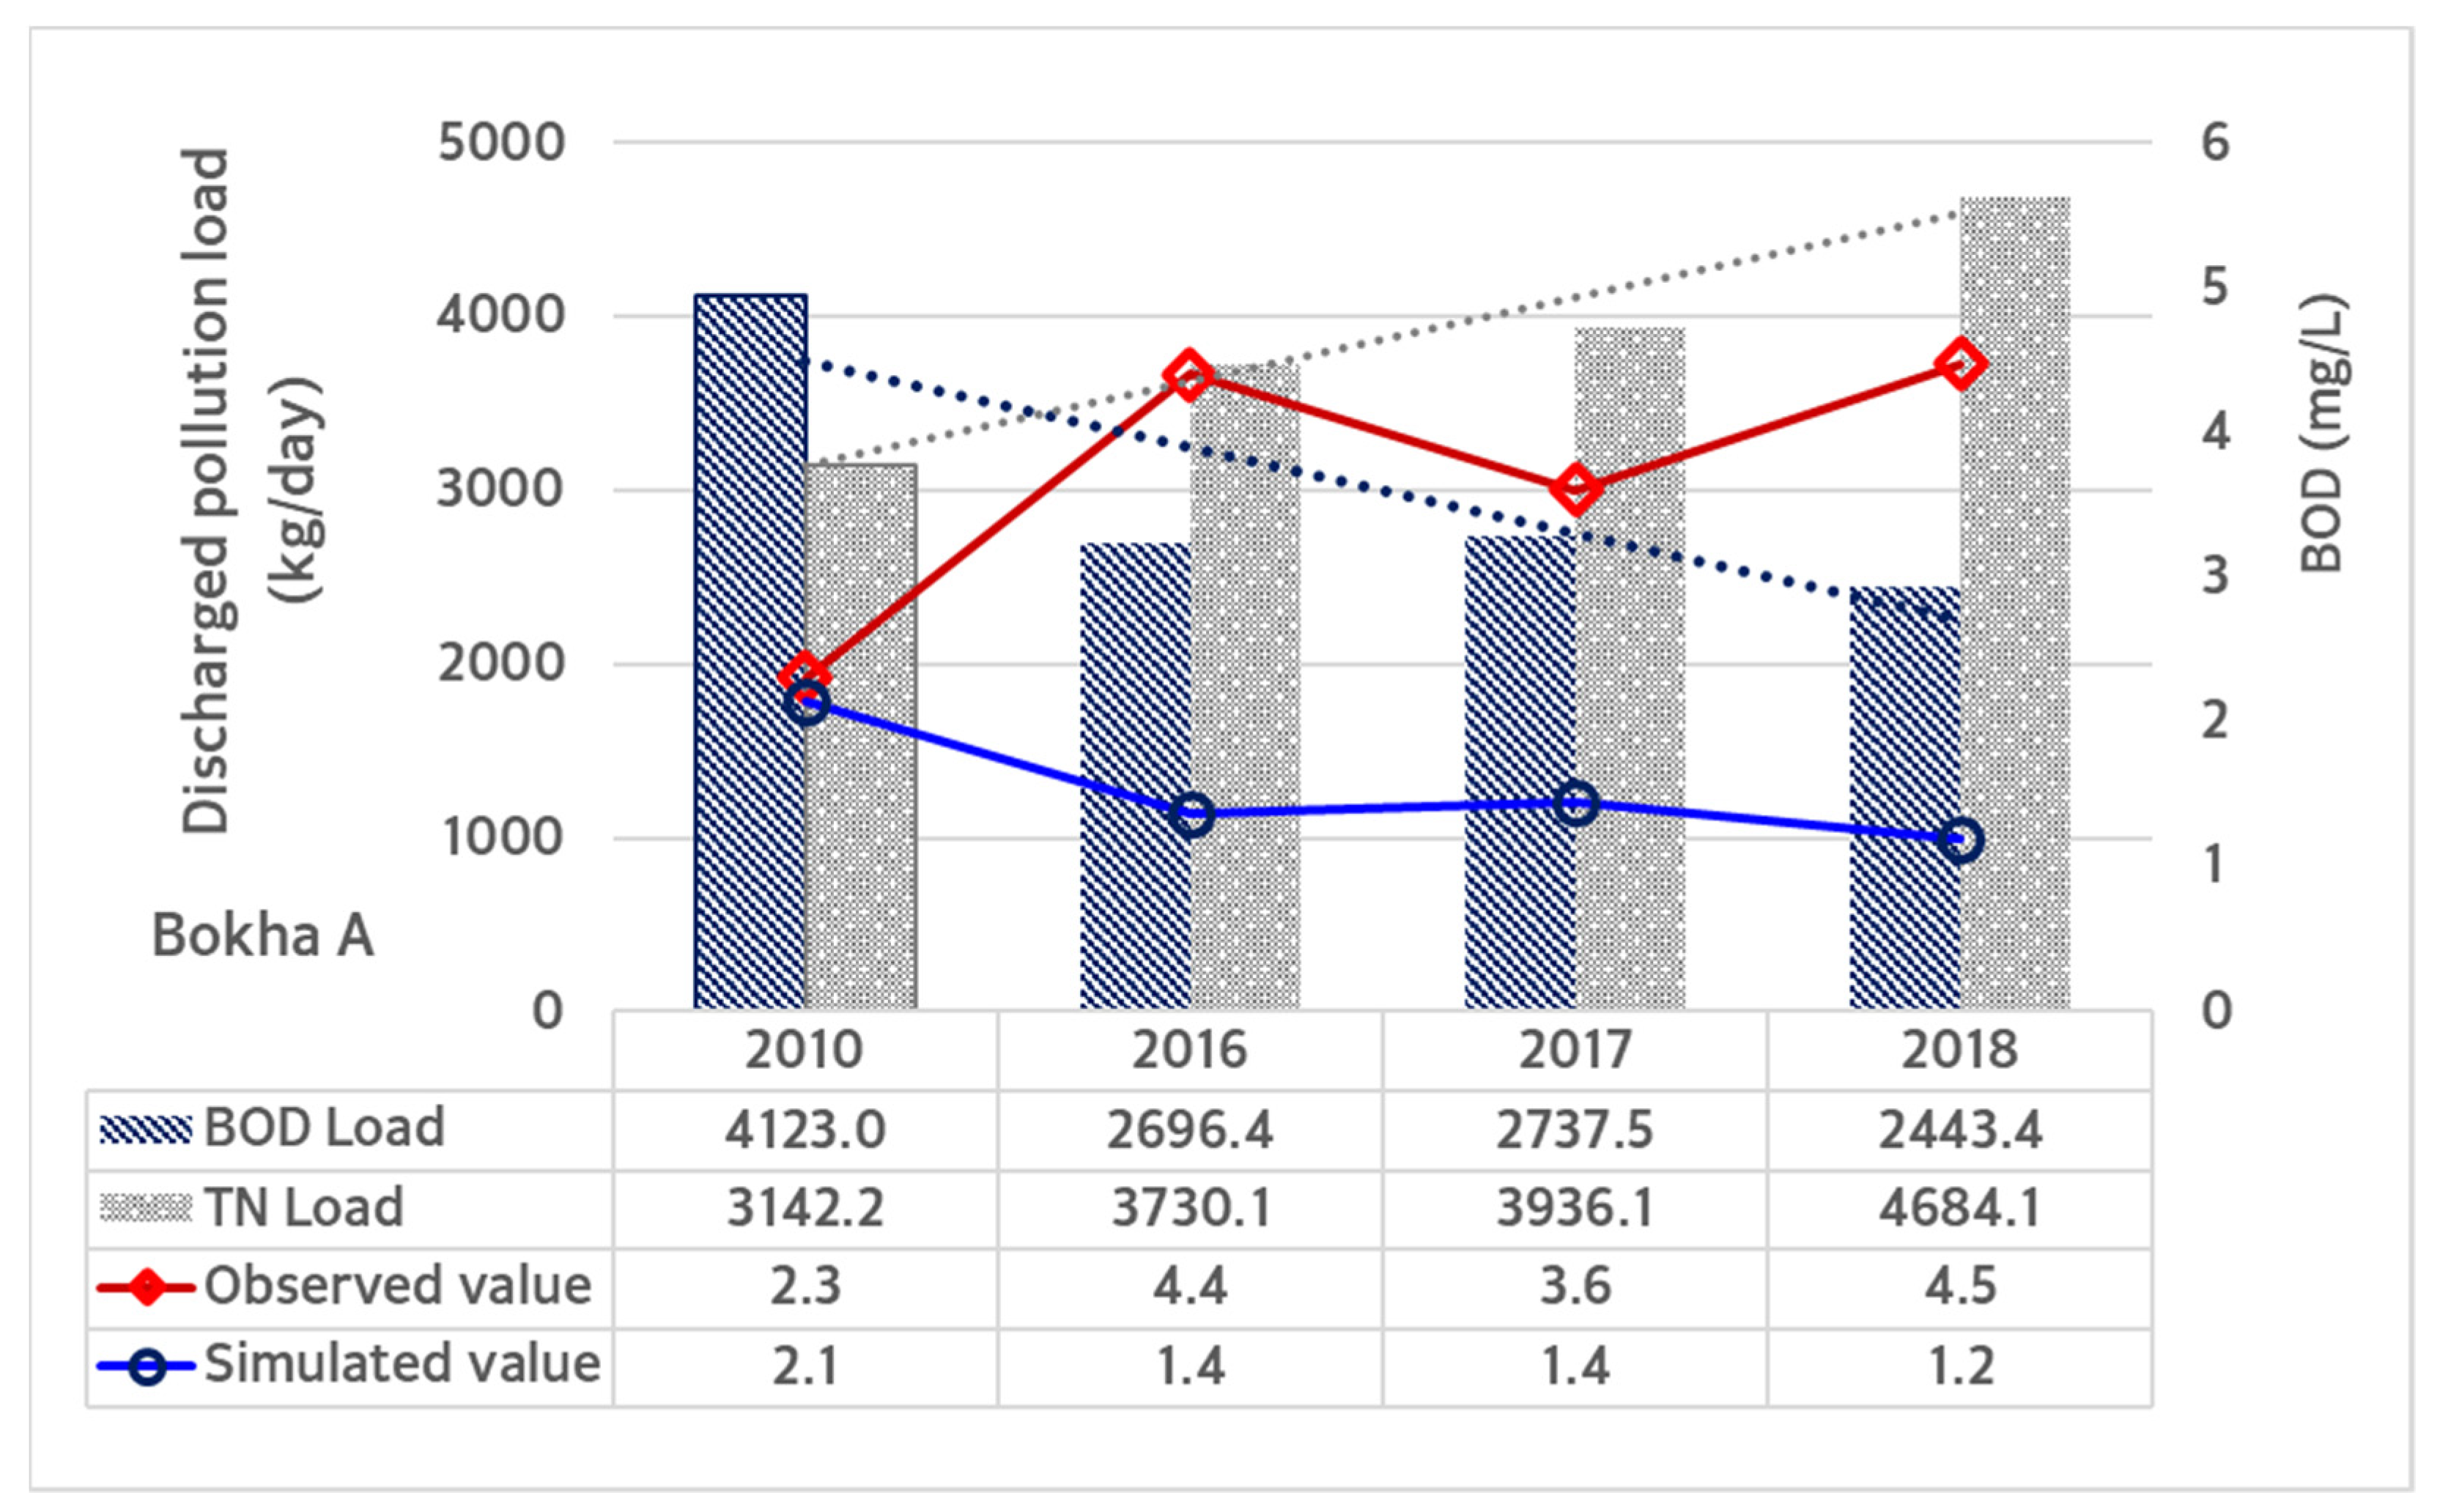
The water quality of the existing model was assessed to determine whether it was reproduced according to the change in the discharged pollution load by year. The discharge pollution load for each year calculated during the implementation evaluation were input into the QUAL-MEV model built during the establishment of the existing TMDL. The model was then assessed to ensure that it reflected the observed water quality for each year. Bokha A is located in Gyeonggi-do, Korea. The base year of the Gyeonggi-do TMDLs master plan [
17] was 2010. The water quality model was developed and operated to reflect the watershed environment at this time. The predicted value of 2.1 mg/L, which was simulated by predicting the discharged pollution load in the target year (2020) and inputting it into the model, was suggested as the target. Recent pollutant source data from Yeoju, Icheon, and Yongin cities from 2016–2018 and discharge flow rate and water quality data of STPs by year were investigated and input into the model. The simulation result showed that the simulated BOD
5 values decreased by the same amount that the BOD discharged pollution load was reduced. However, the average observed water quality during the dry season increased each year from 2010. Thus, the model could not reproduce the real-world water quality from 2016–2018 (
Figure 3). Moreover, the target value that should have been achieved in 2020 was 2.1 mg/L; however, the measured values were 3.5–4.5 mg/L. This suggested that the TN discharged pollution load was increasing, unlike the BOD discharged pollution load, and the model built to establish the conventional TMDL did not reflect the effect of nitrogen according to the actual watershed environment.
Consequently, the schematic diagram was changed so that the model reflects the actual watershed environment. The existing schematic diagram of the plan was built under the assumption that the industrial discharge facilities directly flowed into the mainstream of the Bokha River (element 52); however, it was modified to flow into the upstream of Jukdangcheon and the upstream of Jeontteulcheon, matching the actual watershed environment. The model was constructed based on 2010 conditions, which used 0.399 m
3/s for the daily mean discharge flow of the SK-WWTP. However, the mean discharge flow for 2016–2018 was 0.869 m
3/s and was, therefore, modified to reflect this change (
Table 4). That is, two reaches were added to the schematic diagram such that outlets 1 and 3 of the industrial discharge facilities would flow into Jukdangcheon, while outlet 2 would flow into Jeontteulcheon, a tributary of the Jukdangcheon. Consequently, as shown in
Table 4 and
Figure 4, the schematic diagram was the same as the master plan schematic diagram until reach 4 and element 10, at which point reaches 5 and 6 were added so that Jukdangcheon would flow into reach 7. In
Table 5 and
Figure 4, the catchment numbers that subdivided and partitioned the Bokha A unit watershed for TMDL implementation are provided.
The base year was first set as 2010 to be consistent with the master plan. However, because the flow rate and water quality data of the Jukdangcheon head water were not available, the base year was changed to 2016 to use the monthly monitoring data for the three years from 2016 to 2018, which were investigated in a previous study [
18]. When the model was reconstructed based on 2016, a calibration factor was applied (as it was when establishing the basic plan). The nitrogen ratio values by type for each discharge facility were also entered in the same manner as in the basic plan and then changed to the nitrogen ratio by type as investigated in 2016, to verify whether the dry-season water quality of 2016 could be reproduced. In other words, after entering a calibration factor similar to that of the master plan into the reconstructed model, the NH
3-N of the industrial discharge facility was increased to approximately 60% based on the data found in a previous study [
17], but the BOD
5 change was insignificant (
Table 6).
The reason for this may be attributed to the calibration factor applied to the model when establishing the TMDLs, which was input based on the K1 and organic sedimentation rate (K3); thus, the change in BOD5 for the increased NH3-N rate and the TN discharged pollution load increase were not reflected.
Consequently, it was necessary to consider the application of a calibration factor when simulating the model for watersheds and sections that were expected to be affected by NOD. Recalibration was performed by inputting K
1 and β
1 based on
Table 3, which was calculated from the water quality changes over time at the end of Bokhacheon (BH8, BH9, BH10), as determined in this study.
In this study, K1 was input with the mean BOD of 0.127 day−1 for April to June, which is the dry season. For β1, the mean value used in the model for the dry season (from April to June) was 0.189 day−1.
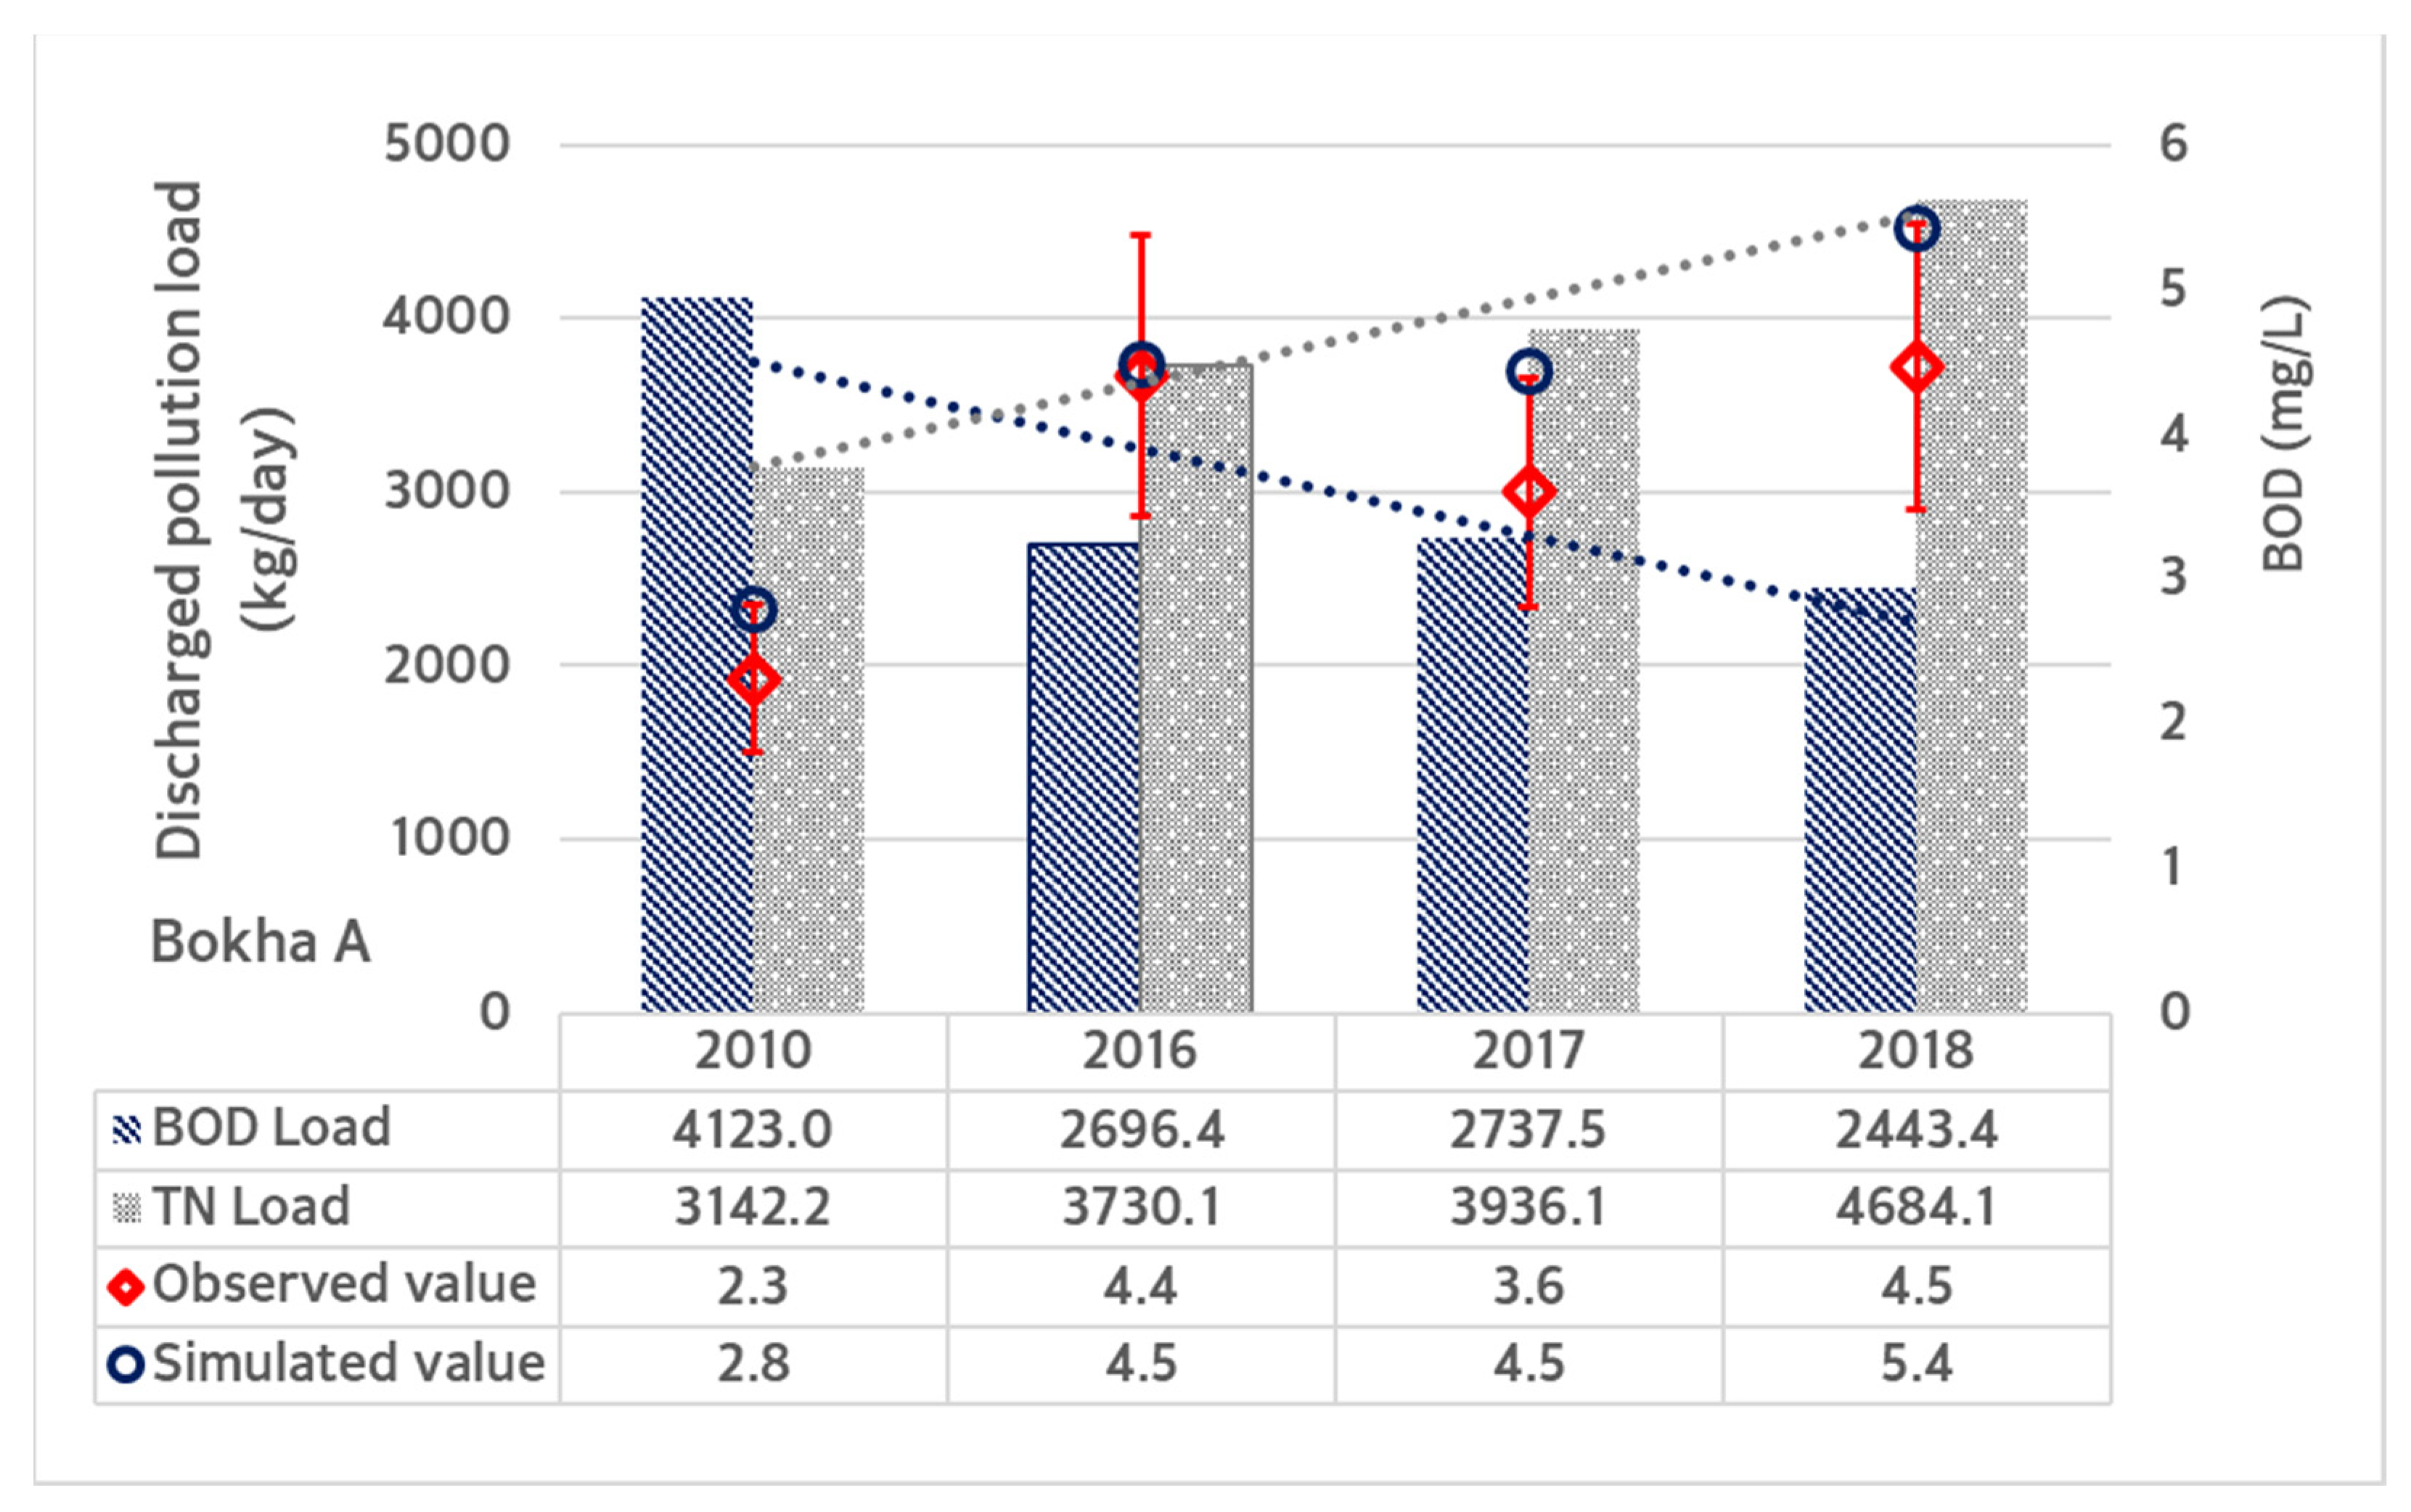
Simulation was performed by inputting the discharged pollution loads for 2010, 2017, and 2018 in the model, recalibrated by applying the calibration factor calculated in this study based on 2016. As a result, the water quality for the dry season by year was simulated within ±20% of the observed value, as shown in
Figure 5, thus confirming the reproducibility of the BOD
5 values in the dry season for Bokha A. In the Korean TMDL technical guidelines, when the water quality model is verified, the error range of the simulated water quality is presented within ±20% [
19].
Consequently, the need for water quality prediction and water quality target setting for the management of BOD5 considering the TN discharged pollution load and nitrogen contribution rate by type of discharge facility (STP or WWTP) could be verified.
3.2. Effect on River Water Quality According to Change in Nitrogen Ratio by Type of STP
To examine the extent of the effect of BOD
5 in the rivers according to changes in the nitrogen ratio by type of STP, a reconstruction model that reproduces water quality for three years was simulated by changing the nitrogen ratio by type of discharge facility investigated. The ratios of NH
3-N and NO
3-N were larger than those applied in 2010, and the ratio of Org-N was smaller based on eight investigations at the Bokha A watershed (
Table 7).
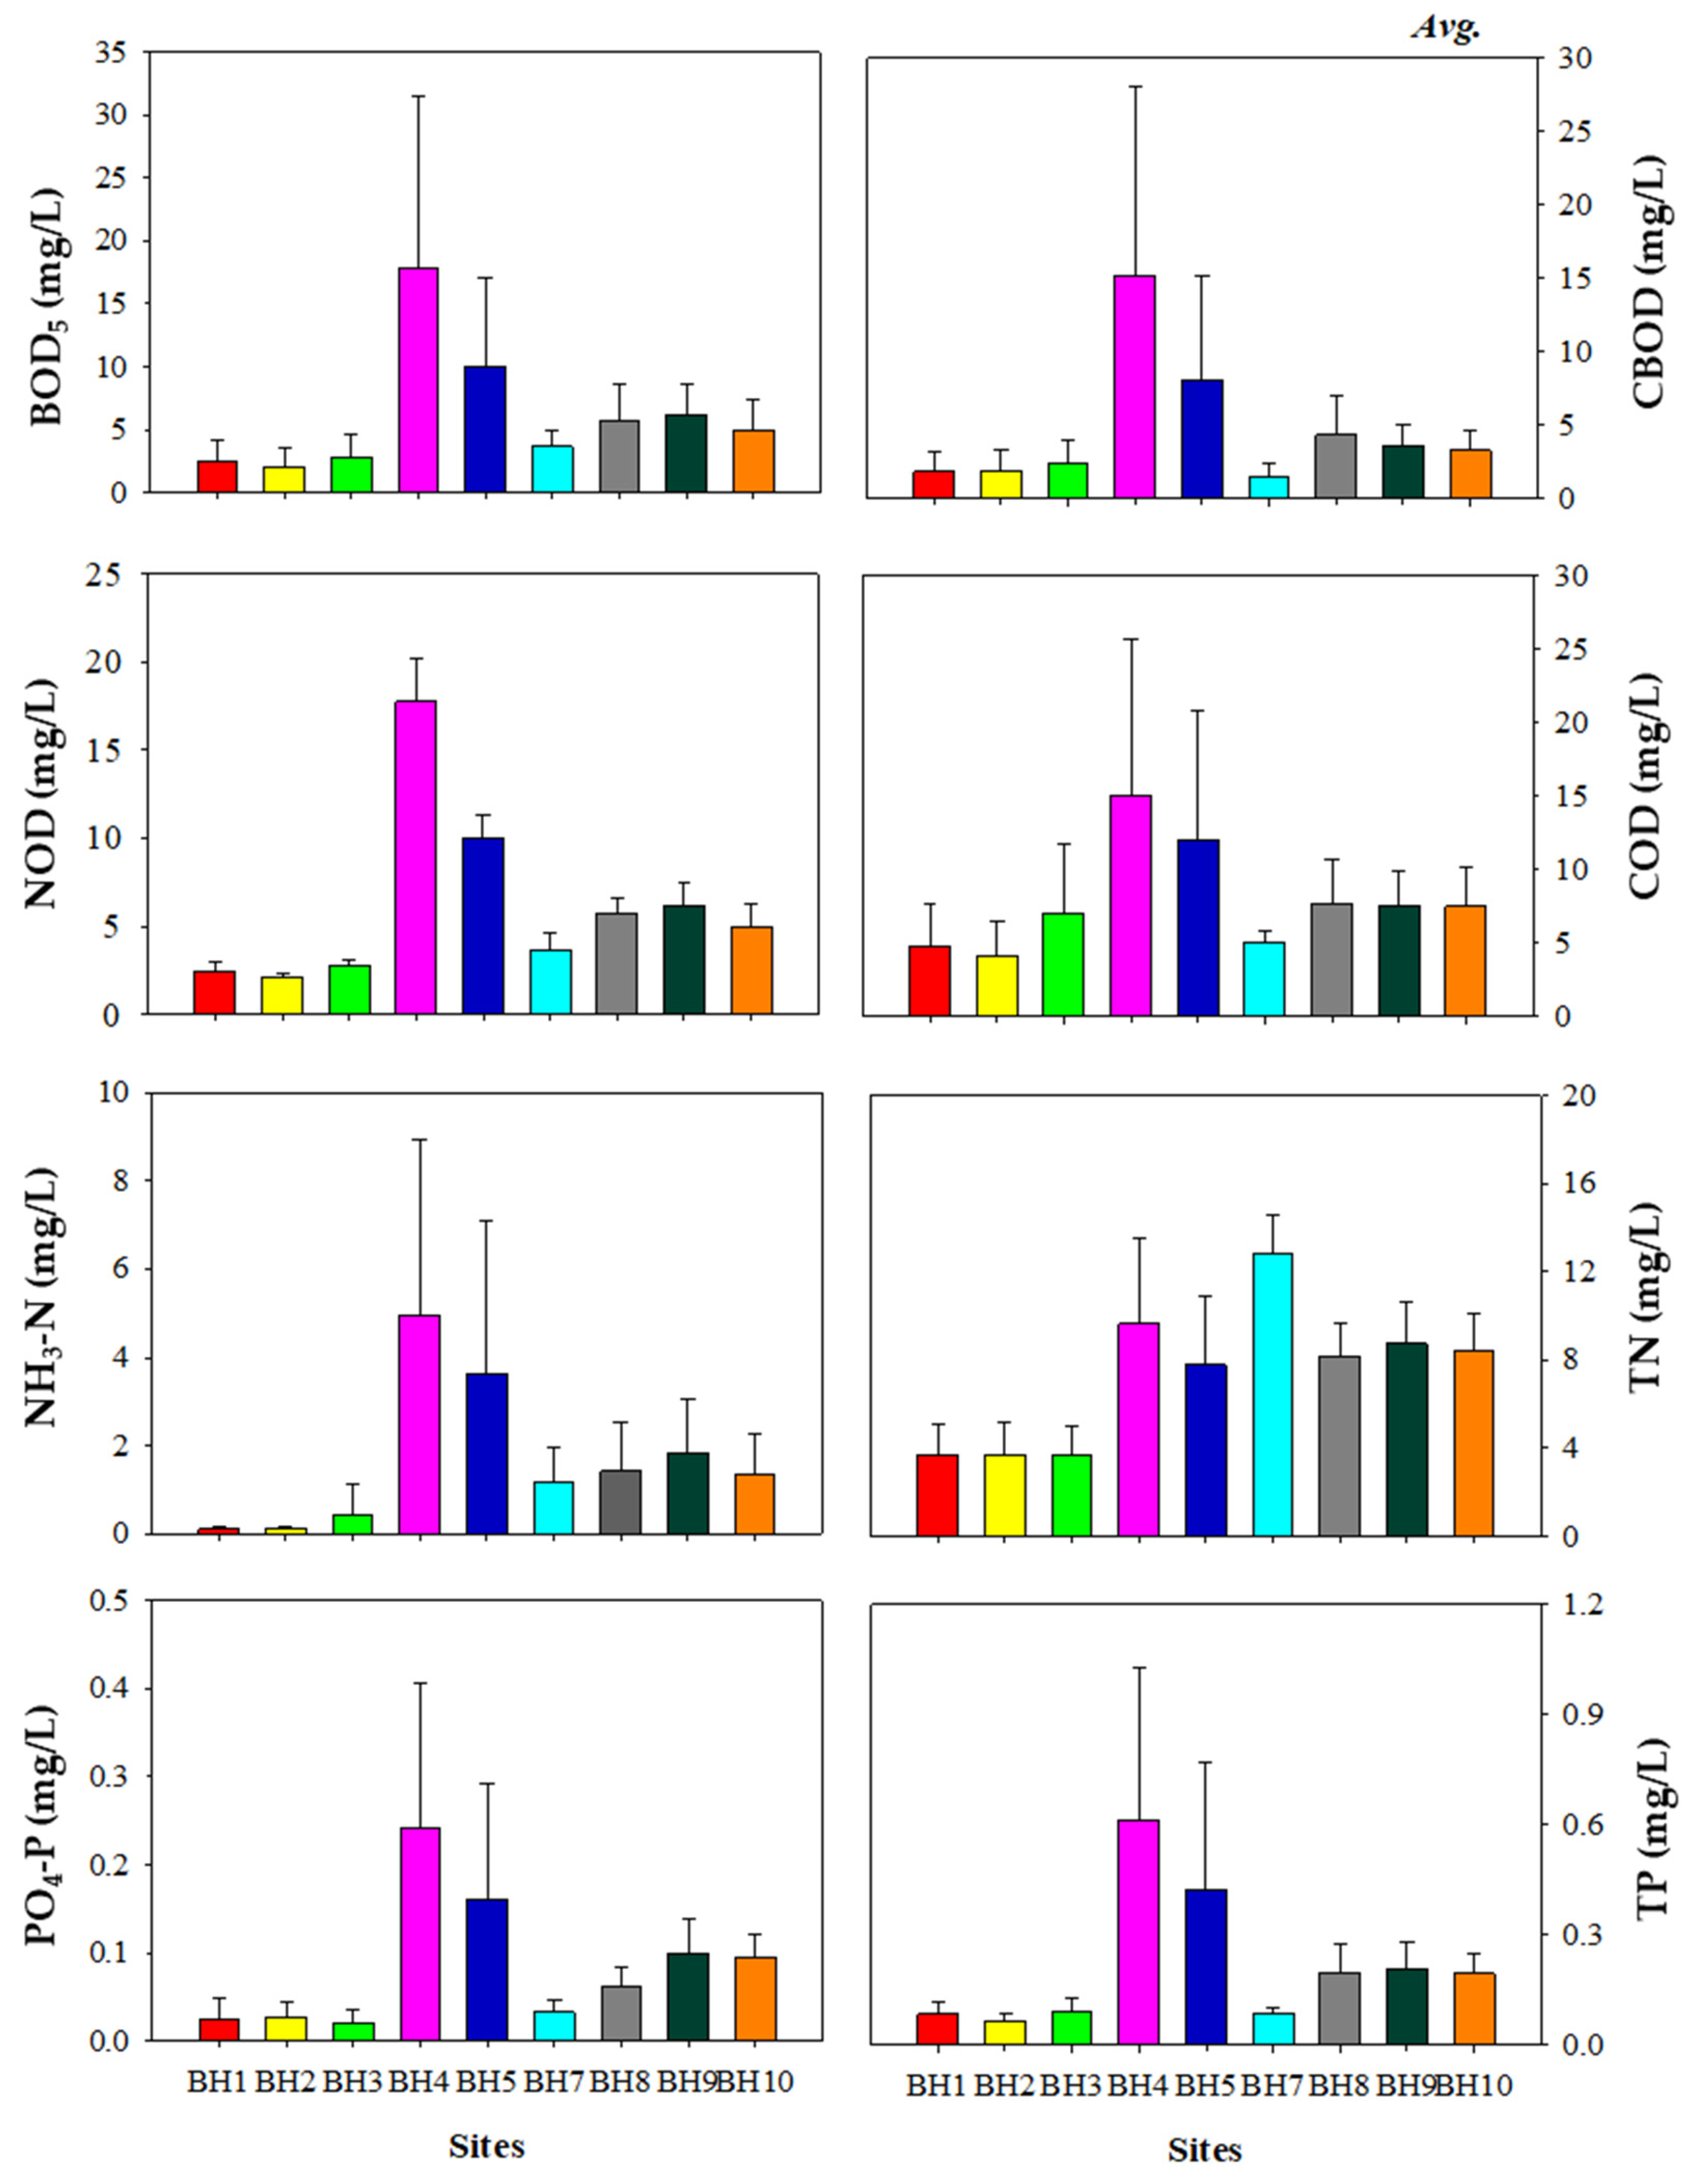
Reviewing the results of the river monitoring survey in the Bokha River (
Figure 6) revealed large differences in the observed values for all eight items at BH3 and BH4 before and after the inflow of the IC-STP. The values of BOD
5, NOD, and NH
3-N were approximately five times higher at BH4 than at BH3.
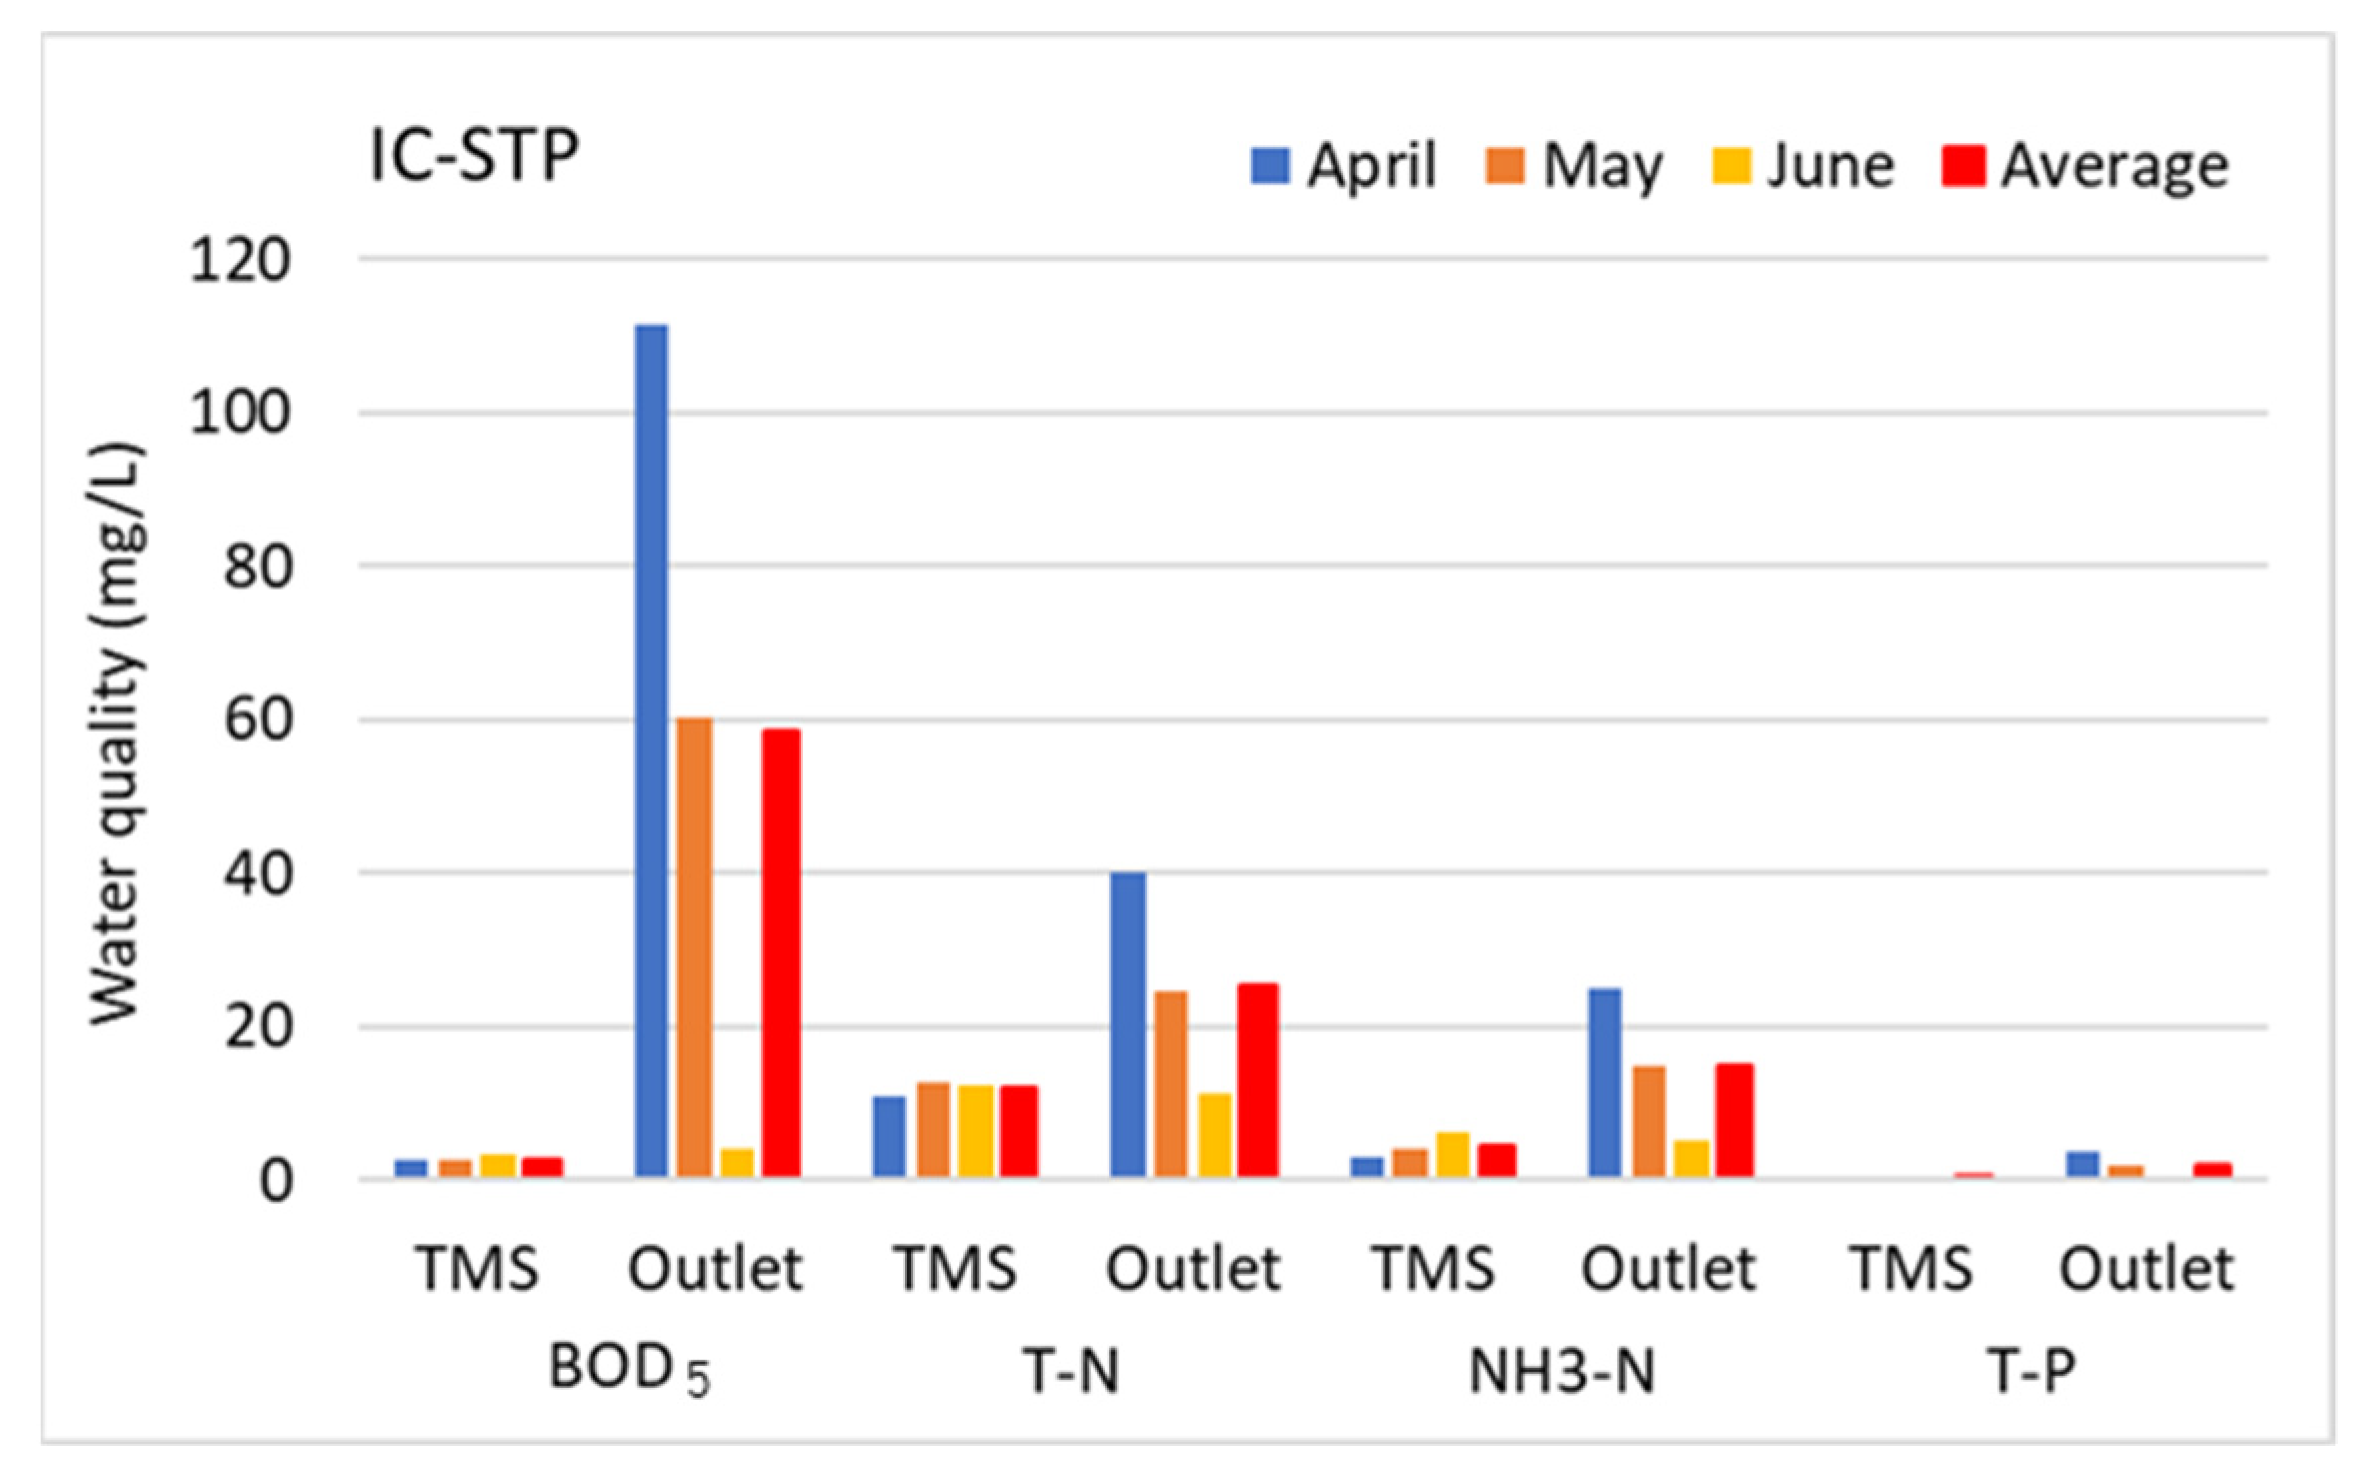
To identify the cause of this, the water quality observed at the IC-STP telemonitoring system (TMS) survey site was analyzed (
Figure 7). The water quality complied with the following STP effluent water quality standards: BOD
5 ≤ 5 mg/L, COD ≤ 20 mg/L, TN ≤ 20 mg/L, and TP ≤ 0.2 mg/L. The water quality at BH4 was found to be too high to be attributed to the effect of the IC-STP. At the TMS survey site of STPs, the Ministry of Environment in Korea has installed automatic measuring devices at the outlets of STPs and WWTPs with discharge levels of at least 700 m
3/day, and the water quality data are collected over the internet. That is, the system monitors the discharge status of water pollutants for 24 h, and the collection point of the TMS is inside the facility before it is discharged into the river. Therefore, to investigate other possible causes, an additional field survey was performed at the location where effluent was discharged from the IC-STP to the river, and the concentration was found to be higher than the TMS water quality data (
Figure 7). Furthermore, the average water quality at the end of the Bokha River (BH10) was 5.9 mg/L, nearly three times the target value.
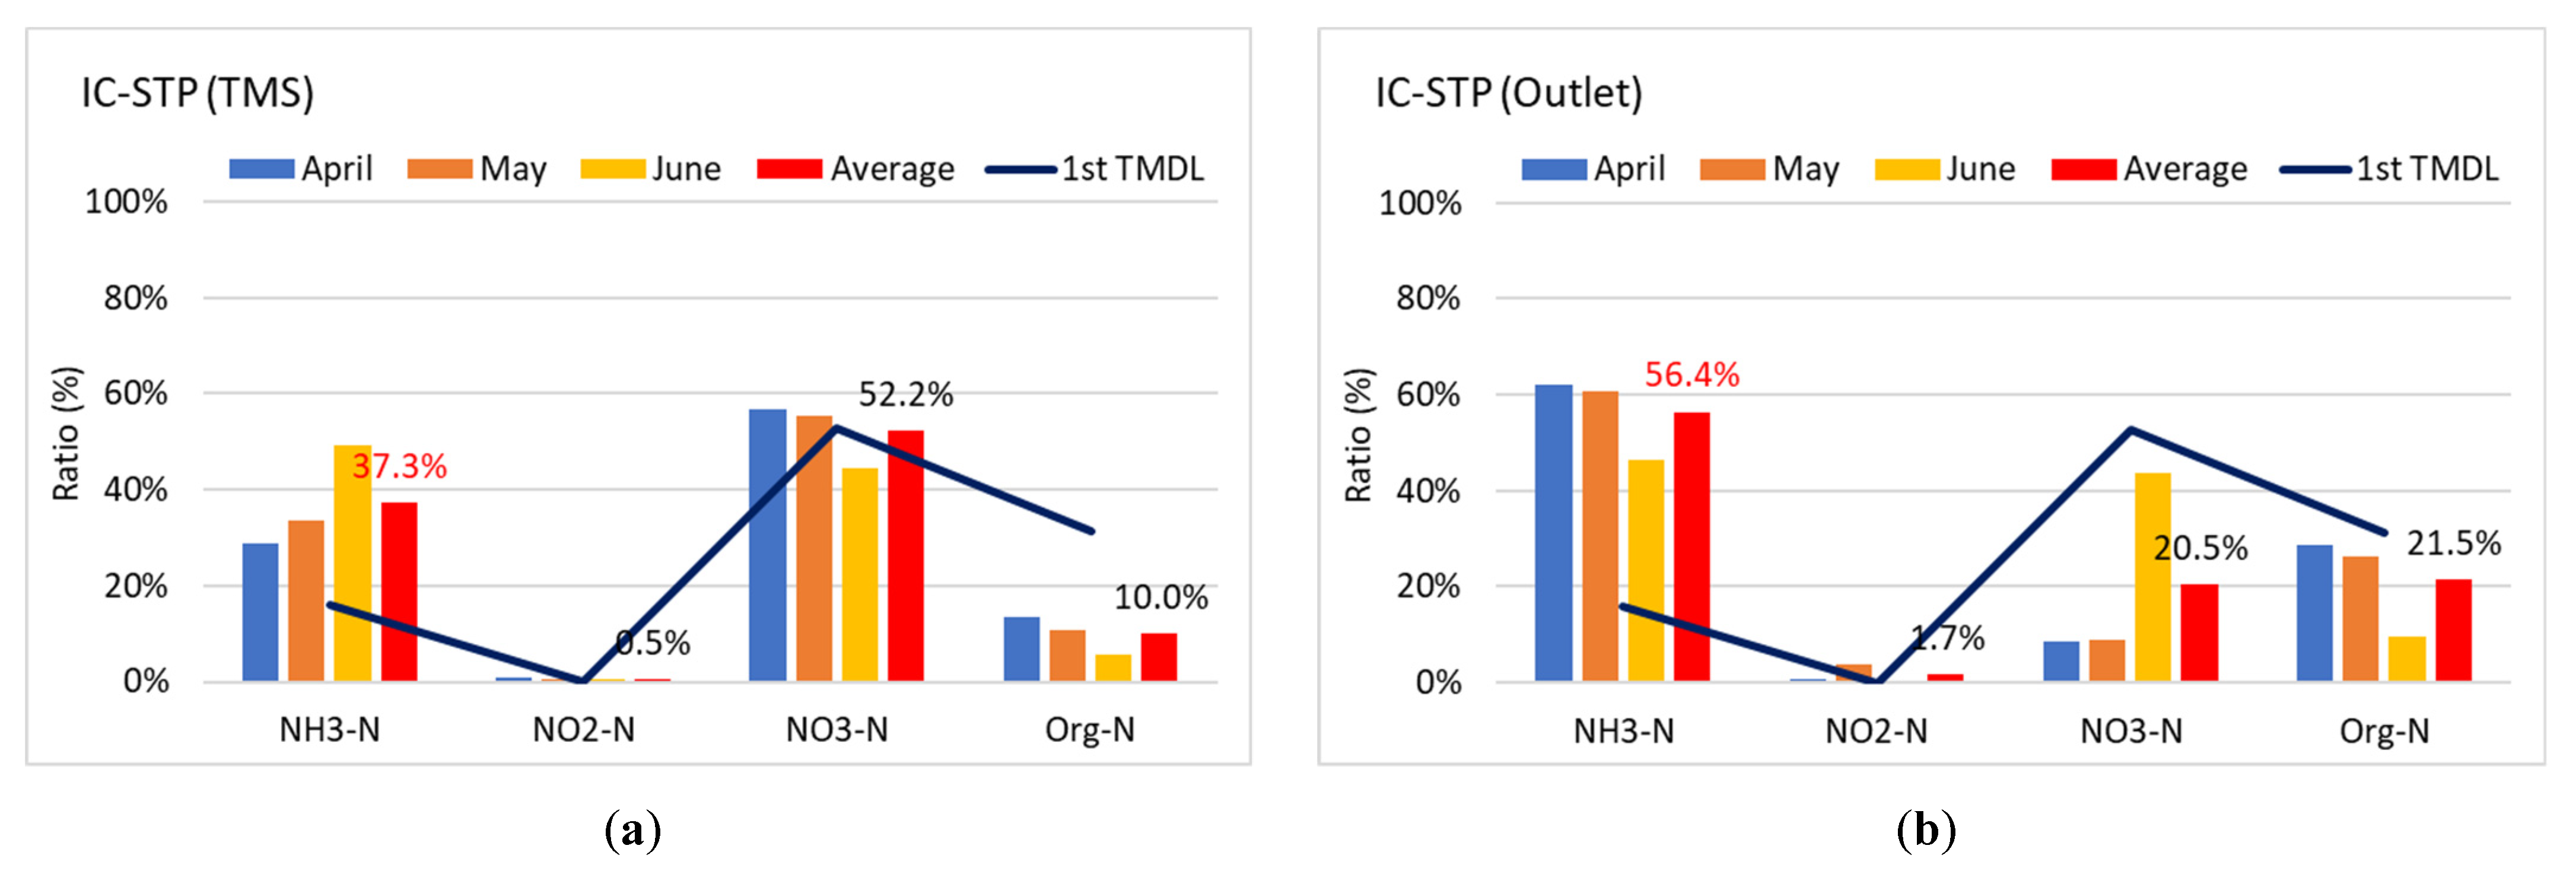
The results of water quality and flow rate surveys at additional sites from April to June showed that the water quality was high but that the ratio of NH
3-N was approximately 56.4% of TN (
Figure 8). The discharge flow rate was approximately 0.727 m
3/s, 0.265 m
3/s higher than the annual average flow rate of 0.462 m
3/s of the IC-STP. Thus, a simulation was performed to model the effect of BOD
5 at the end of the river by applying the nitrogen ratio by type at the location where the effluent was discharged to the river: (1) at the TMS site of the STP investigated in this study, and (2) at an additional survey location where the effluent was discharged to the river. The model reported in
Section 3.1 was designed to reflect the Bokha A watershed conditions as closely as possible and was used to simulate scenarios (1) and (2).
This comparison revealed that the flow rates measured at the end of the Bokha River from April to June were close to the standard flow in the dry season. Thus, the simulation applied the average values by type of STP observed at this time.
When the nitrogen ratio by type investigated at the TMS site was applied at the end of the Bokha River, the location where the water quality target was set, the BOD
5 increased from 4.3 to 4.6 mg/L. When the ratio was investigated at the point of discharge into the river, an increase in the ratio of NH
3-N from 15.9% to 56.4% was observed, and the BOD
5 at the end of the Bokha River increased from 4.3 to 4.9 mg/L. This value was similar to the water quality of Bokha A (BH10) that was investigated during the same period. Among the nitrogen types discharged from the STP, the ratio of NH
3-N can affect the BOD
5 measured at the end of the river. Hence, this should be reflected in the management plan when the water quality target is set (
Table 8,
Figure 9).
The year 2020, partly included in the monitoring period surveyed in this study, was the final target year for step 1 of the TMDL for Bokha A; the average annual BOD5 value in 2020 was more than double the target value of 2.1 mg/L.
As mentioned above, this system can impose penalties for unit watersheds that exceed the target water quality and load allocation for the TMDL in the target year. Local governments included in the unit watershed subject to a penalty must submit the results from analyses of the target water quality and the causes of the load allocation being exceeded during a certain period to the Ministry of Environment, and regulatory action will only be reverted if the analysis results are reasonable.
In the future, based on the results of this study regarding the reflection of actual environmental conditions when establishing the first TMDL plan, the calibration factor of the model, the nitrogen ratio by type of STP, and the management of the TN discharged pollution load, it will be possible to explain the cause of the exceedingly high target water quality of Bokha A.
4. Discussion
In the US, TMDLs, the water quality indicators used to assess river pollution and the target parameters measured in the field, are not always the same. For example, to achieve DO and Chl-a water quality targets, the load allocation of related water quality indicators, such as BOD, TN, and TP, are managed. In this case, the linkage between the indicator and the target parameters that need to be numerically achieved should be explained in the TMDL report [
20]. In other words, a description of the cause-and-effect relationship between the pollutant and related water quality indicators is included [
21]. Specifically, BOD (CBOD, NOD) and NH
3-N are measured to manage DO. This indicates that the oxygen consumption rate based on the oxidation reaction of carbon and nitrogen microorganisms is managed because the DO of the river is influenced by CBOD, NOD, Algal BOD (ABOD), and sediment oxygen demand (SOD), as well as by water temperature. In the case of a river for which NH
3-N is managed, the standard water quality or load by period is allocated to the discharge facilities and managed as well [
22].
Korea is adopting BOD
5 and TP as uniform water quality management indicators without considering the relationship between watershed pollution sources and other water quality indicators. Moreover, the survey cycle for the TMDL monitoring network that is suggested in the operation plan for the water quality survey sites in Korea [
23] occurs more than 36 times annually, with an average interval of eight days, and the monitoring items include water temperature, pH, DO, BOD
5, COD, TOC, suspended solids (SS), TN, TP, electrical conductivity, and flow rate. The daily monitoring items of discharge facilities (STP, WWTP) include flow rate, pH, DO, BOD
5, COD, SS, TN, and TP. Thus, Korea does not investigate nitrogen and phosphorus by type at the measurement points in rivers including discharge facilities.
Furthermore, the system should be improved to make it mandatory to measure nitrogen by type among effluent quality survey items for large-discharge facilities, such as STPs and WWTPs. In addition, as in the STPs investigated in this study, there is a large difference in water quality between the TMS measurement point and the point at which effluent is discharged into the river, which makes it difficult to assess the water quality of a watershed. Therefore, it is necessary to verify the reliability of the TMS data of these discharge facilities and to consider appropriate sites to take measurements.
QUAL-MEV is an important water quality model used for setting target water quality in the Korean TMDL, but it only presents the default range for calibration coefficients.
As mentioned in
Section 3.1, if only the K
1 and K
3 values are calibrated, the model cannot reproduce the actual water quality because the BOD change for the increase in the NH
3-N ratio and the increase in the T-N discharge pollution load by year is not reflected. Therefore, it is necessary to investigate model calibration factors based on field survey data by watershed and period; moreover, a review of the applicability of the calculated calibration factors should follow.
In Korea, models are being developed and pilot studies planned to change the target indicator for organic matter management in TMDLs to TOC. From this perspective, the findings of this study can be used as basic data to show the limitations of BOD5 and the current management of the TMDLs, and for rapid conversion to TOC.


