Article

Metal Removal Kinetics, Bio-Accumulation and Plant Response to Nutrient Availability in Floating Treatment Wetland for Stormwater Treatment

by
Md Nuruzzaman
*,
A. H. M. Faisal Anwar
and
Ranjan Sarukkalige
School of Civil and Mechanical Engineering, Curtin University, GPO Box U1987, Perth, WA 6845, Australia
*
Author to whom correspondence should be addressed.
Water 2022, 14(11), 1683; https://doi.org/10.3390/w14111683
Submission received: 2 May 2022 / Revised: 19 May 2022 / Accepted: 20 May 2022 / Published: 24 May 2022

Abstract

:
Floating treatment wetland (FTW) is a recent innovation to remove nutrients from stormwater, but little is known about its effectiveness for metal removal. This study aims to test the hypothesis that the metal removal performance of FTWs will be affected by nutrient (NH3-N, NO3-N, and PO4-P) availability in stormwater. Two experiments were carried out in nutrient-deficient tap water, and two experiments were carried out in nutrient-rich lake water using four native Australian plants, namely Carex fascicularis, Juncus kraussii, Eleocharis acuta, and Baumea preissii. Up to 81% Cu and 44.9% Zn removal were achieved by the plants in 16 days in tap water. A reduction in Cu and Zn removal of 28.4–57.3% and 1.0–19.7%, respectively, was observed in lake water compared with tap water for the same duration. The kinetic analysis also confirmed that plant metal uptake rates slowed down in lake water (0.018–0.088 L/mg/day for Cu and 0.005–0.018 L/mg/day for Zn) compared to tap water (0.586–0.825 L/mg/day for Cu and 0.025–0.052 L/mg/day for Zn). A plant tissue analysis revealed that E. acuta and B. preissii bioaccumulated more than 1000 mg/kg of both metals in their tissue, indicating high metal accumulation capacities. To overcome the slower metal uptake rate problem due to nutrient availability, future studies can investigate multi-species plantations with nutrient stripping plants and metal hyper-accumulator plants.

1. Introduction

Stormwater is a major source of pollution to receiving waterbodies such as rivers, lakes, and estuaries [1]. Heavy metals in stormwater threaten the receiving waterbodies’ ecosystem due to their potential toxicity level at low concentrations [2]. Heavy metals in stormwater are of significant concern since, unlike the organic pollutants, metals are non-biodegradable and can bio-accumulate in waterbodies and aquatic animals [3]. The most prevalent metals in urban highway runoff include copper (Cu), zinc (Zn), lead (Pb), cadmium (Cd), and nickel (Ni) [4,5]. Among these metals, Cu and Zn are found typically at a high concentration in stormwater from urban areas [6,7]. A literature survey for this study revealed that Cu and Zn concentrations in stormwater in Australia ranged from 0.025–0.38 mg/L and 0.08–3.4 mg/L, respectively [8,9,10]. The prevalence and concentration of Cu and Zn in urban stormwater are much higher than stated in the ANZECC (2000) water quality guidelines (2.5 μg/L Cu and 31 μg/L Zn) to protect aquatic ecosystems [11]. Cu and Zn in dissolved form (ionic) were also found to be the leading cause of toxicity in highway stormwater runoff tested for five different freshwater and marine animals [12].
A recent innovation—floating treatment wetland (FTW), also known as constructed floating wetland (CFW) or floating treatment island (FTI), is increasingly being used for nutrient removal from stormwater [13]. FTWs consist of a floating bed (scaffold), which is planted with water-tolerant species and can be retrofitted on existing stormwater retention ponds [14]. The roots of plants extend into the water column from where they absorb nutrients and contaminants, thus purifying the water [15]. This water treatment process is known as phytoremediation and provides excellent treatment for dissolved pollutants [16,17]. FTWs also facilitate particle settlement and detain particle-bound pollutants by settling and trapping them within the root matrix [18]. Furthermore, root exudates, e.g., organic acids, promote the complexation and immobilization of metals [19].
FTWs can also be used for heavy metal removal [20]. The use of FTWs for metal removal is a new study area compared to their use for nutrient removal. There is a paucity of literature worldwide on the phytoremediation of metals in FTWs. The phytoremediation of metals in an FTW system was studied in some parts of the world, including New Zealand, India, Portugal, China, France, Thailand, Indonesia, Nigeria, and Pakistan [6,21,22,23,24,25,26,27,28]. One of the problems in using FTWs for metal removal is that plants need metals in their tissue at a very low concentration. As such, plants are likely to absorb nutrients such as ammonia nitrogen (NH4-N), nitrate nitrogen (NO3-N), and phosphate phosphorus (PO4-P) at a faster rate than metals such as Cu and Zn.
Bio-accumulated metals in plant tissue can be released back into the water column due to the shedding of older roots. In one of the field-scale FTW studies in Australia, a few FTWs were relocated from a nutrient-deficient recently constructed lake to a nutrient-rich established lake. Following the relocation, it was reported that some of the bio-accumulated metals, including K, Ca, Al, Na, Al, Mn, Fe, and Cu, in the plant roots were initially released back into the water column [13]. It is not clear whether it only happened due to the shedding of roots or if increasing nutrient availability may have played a role in this case. The initial release of metals may also have been caused by the shock received by the plants during the relocation of the FTWs. However, the exact reason cannot be confirmed without investigation. Over a 13-month period, part of the released metals were uptaken again into the plant tissue and thus reducing the net export from the plant tissue. However, this re-uptake did not happen for Al and Mn; rather, there was further release of Al and Mn into the water column after the initial release. We hypothesize that increasing nutrient availability played a role in the initial release of metals into the water column. Plant physiology may have also contributed to the continuous release of Al and Mn into the water column. Thus, it is necessary to test whether nutrient availability has any adverse effect or not on the metal uptake by plants in an FTW system. A hyper-accumulator plant of metals is likely to be able to overcome the adverse effect on metal removal due to nutrient availability because of its bio-accumulation capacity. Carex appressa was used in those FTWs, which also showed rapid plant growth following the relocation. Maximum Cu and Zn bio-accumulation within C. appressa tissue were measured to be 24.7 and 224 mg/kg, respectively [13]. It implies that C. appressa falls well below the threshold criteria (1000 mg/kg Cu and 10,000 mg/kg Zn) of a metal hyper-accumulator plant. As such, it is also essential to investigate the response of a hyper-accumulator plant on metal uptake due to nutrient availability.
With an aim to investigate the plant response of metal uptake to nutrient availability in FTWs, the specific objectives of this study are as follows: (1) to investigate how metal removal (Cu and Zn) by FTWs can be impacted due to nutrient availability by using four native Australia plant species; (2) to investigate the metal removal kinetics and metal bio-accumulation within aboveground (shoots) and belowground plant tissues (roots) of four native Australian species. Cu and Zn were selected for this study due to their toxicity at low concentrations and prevalence in urban stormwater, as discussed earlier.

2. Materials and Methods

2.1. Plant Selection and Acclimatization

Four native Australian plants were selected for the phytoremediation experiments. The selected plants are Carex fascicularis, Juncus kraussii, Eleocharis acuta, and Baumea preissii, commonly known as tassel sedge, sea rush, small spikerush, and soft twig rush, respectively. The plants were sourced from a local nursery (Natural Areas Nursery, Perth) in forestry tubes. Local companies in Western Australia often used plant species from the Baumea and Juncus genus for nutrient removal, but no specific study evaluated their performances. All the plants were selected based on suggestions given by the local companies and the nursery based on their use and capability to grow in water media. Following root-soil removal, eight plants from each species were placed in nutrient-rich water (containing NH3-N, NO3-N, and PO4-P) for two weeks for acclimatization. A literature survey revealed that the plant acclimatization period varied between one week and nine weeks for experimental purposes across the world [29,30,31,32]. Visible growth (new roots and shoots) in all of the plants was observed after two weeks of acclimatization. The plants were exposed to actual experimental water containing metals after this period.

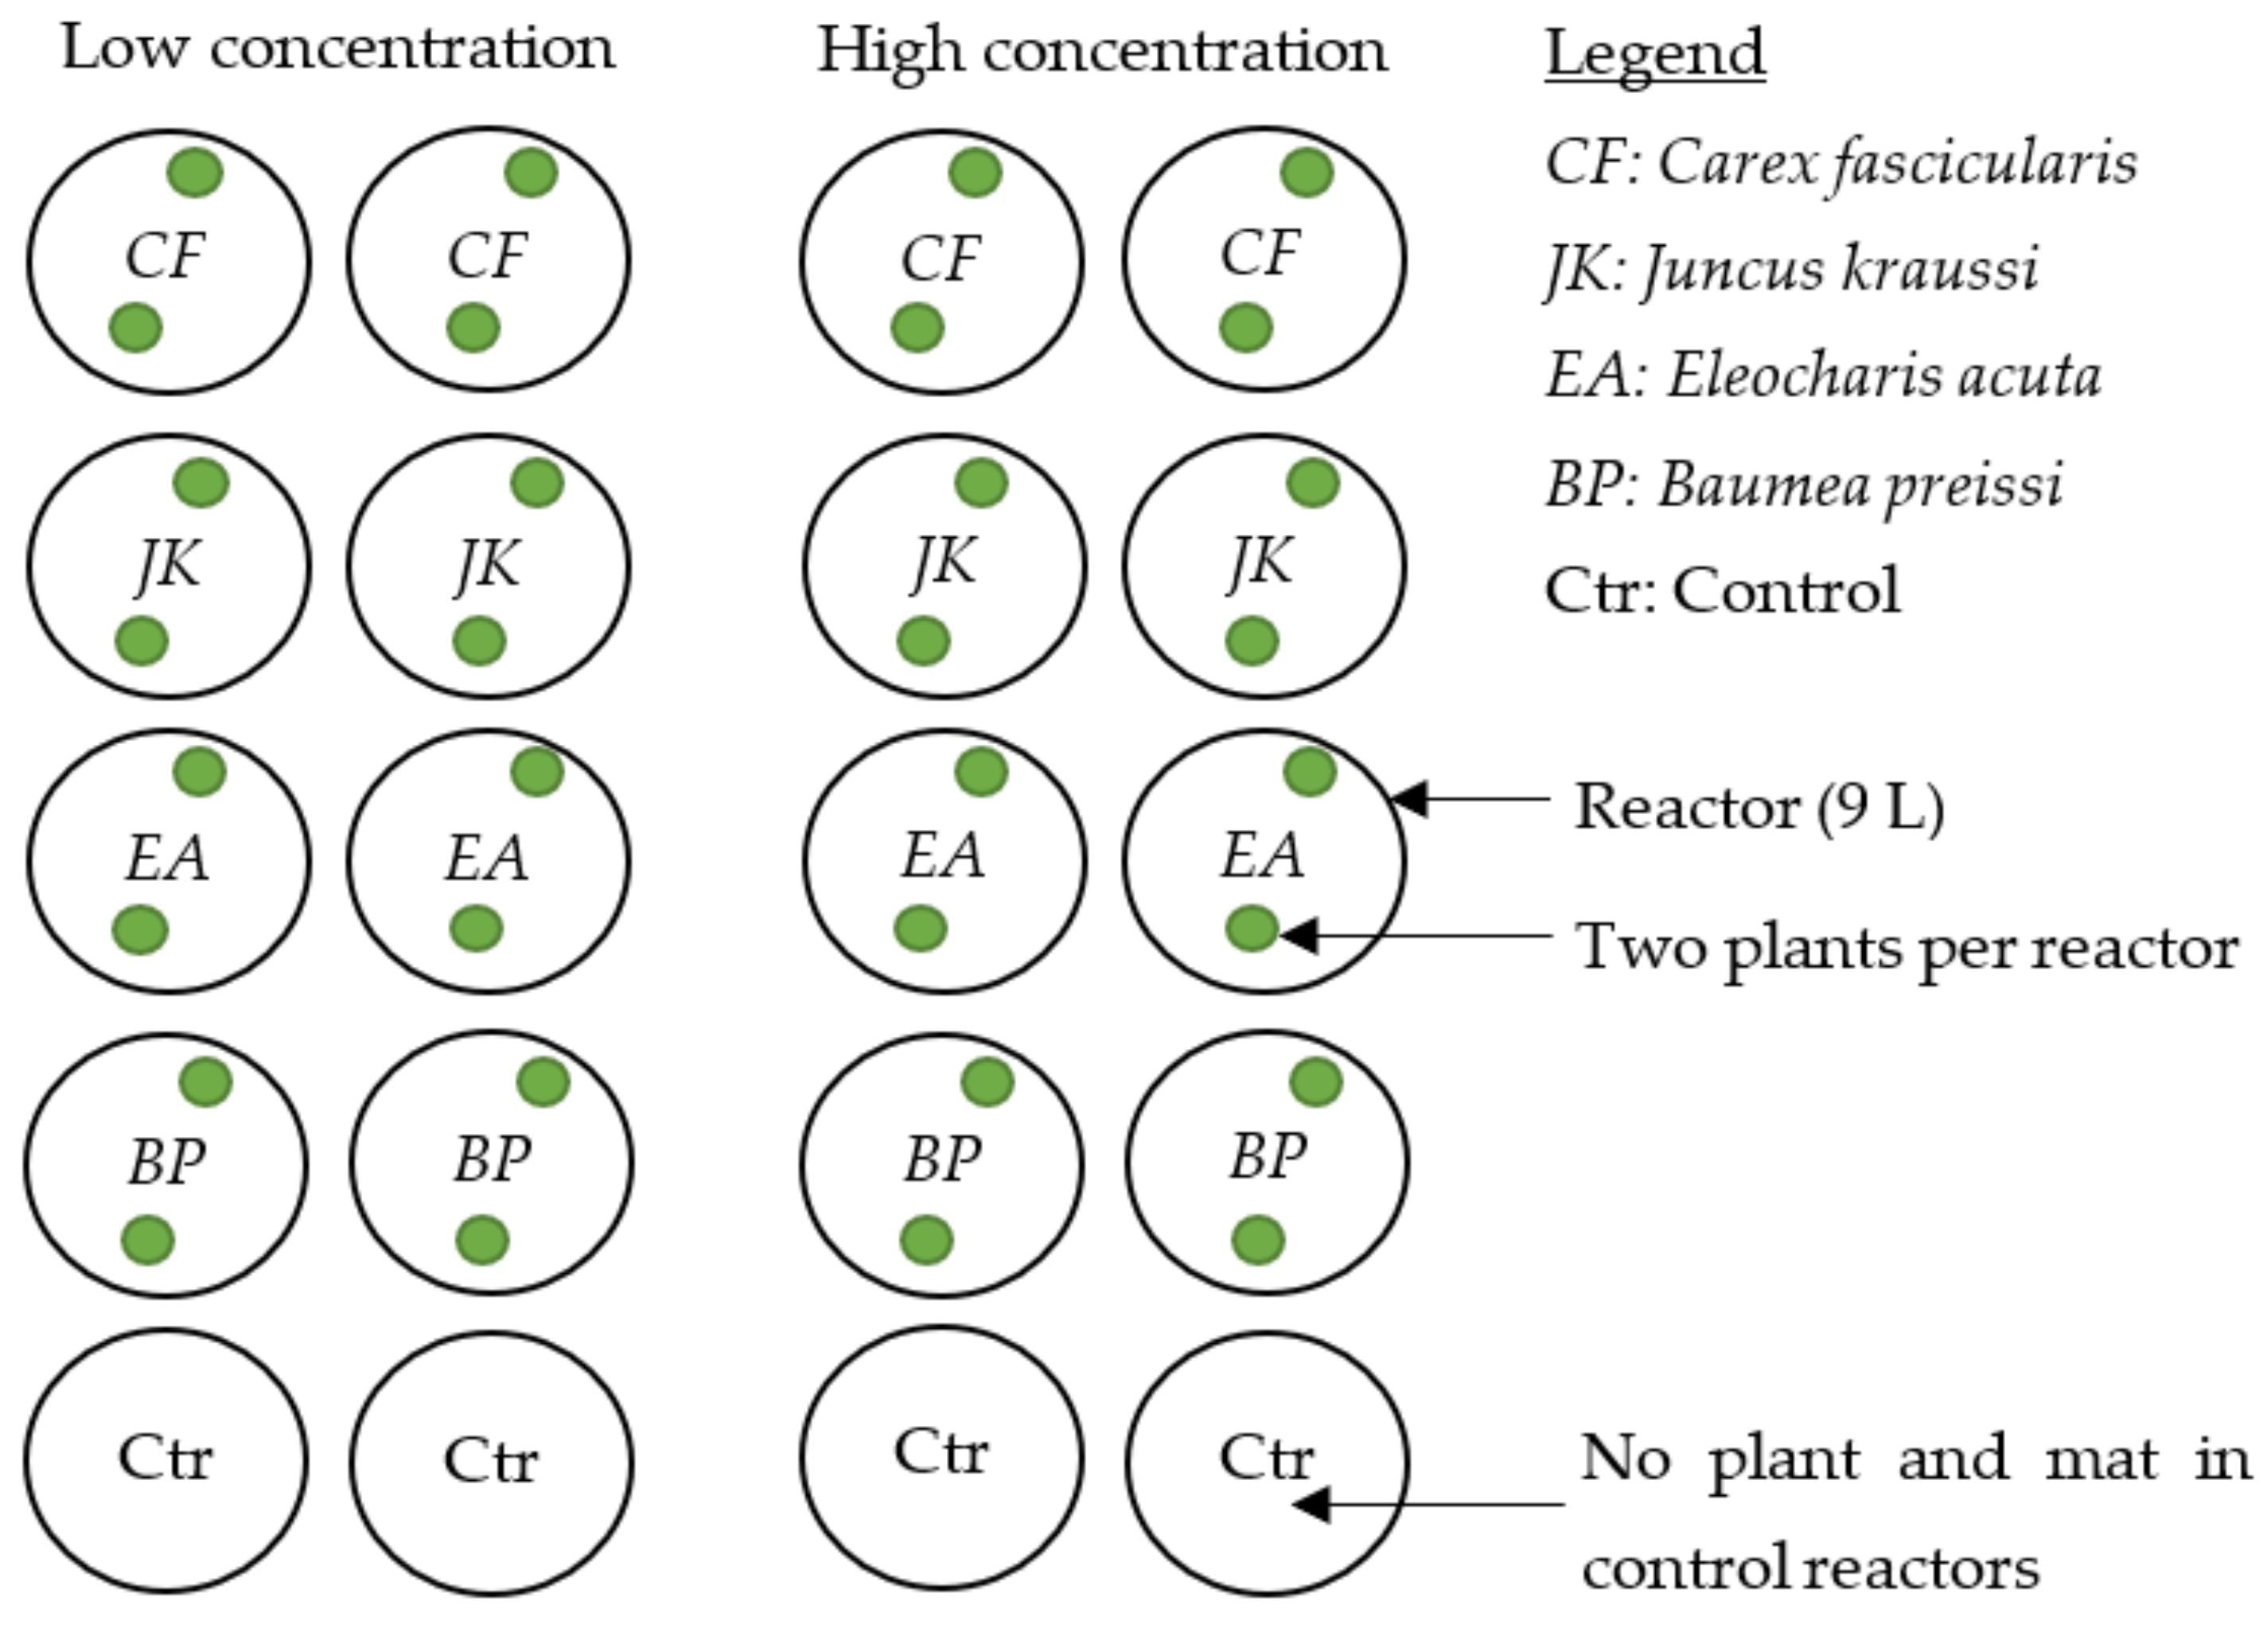
2.2. Experimental Set-Up

A conceptual diagram of the experimental set-up is depicted in Figure 1, and the operational parameters are given in Table 1. The microcosm experiments were conducted in 9 L reactors filled up to 7 L. A polystyrene foam floating bed was used to float the plants. Two holes were made in each of the polystyrene beds for inserting plants. The plants were supported by plastic cups hanging from the top of the bed down through the holes. The sidewalls of the plastic cups were cut open to allow direct contact between water and plant roots. There were two plants of the same species per reactor. The plants were exposed to high and low concentrations of metals, and there were duplicate reactors for each species and each concentration. So, for a single species, four reactors (two with high concentration and two with low concentration) were used in the experiments. There were four plant species treatments and a control treatment without plants for both high and low concentrations using 20 reactors for the whole experiment, including the duplicate reactors. The control reactor did not contain a floating mat since polystyrene foam mats have been reported not to affect nutrient and metal removal [33].
The experimental reactors were placed outdoors in the natural environment to reflect the natural conditions at Building 611 backyard, Technology Park, Curtin University, Western Australia. Four consecutive experiments were carried out, spanning a total of 86 days using the same plants. Two of the experiments using nutrient-deficient tap water continued for 16 days each. The other two experiments continued for 27 days, each using nutrient-rich lake water. The 16 days of experiment duration was selected based on the information that the maximum stormwater detention period can be up to 16 days in a typical stormwater pond during the wet season [19,34]. In the lake water experiments, a possible initial release of metals by plants in the first 16 days was suspected. As such, these experiments were continued until metal removal in the planted reactors and control reactors were equal, which in this case was 27 days. For statistical analysis, only 16 days of data were used to compare the metal removal performance in different water types to facilitate fair comparison. The tap water and lake water experiments were carried out alternately, meaning that the first and third experiments were in tap water, and the second and fourth experiments were in lake water. The experiments were carried out between late June and mid-September in 2020 to reflect the weather conditions of typical storm events. Most rain events occur between May and October in Australia [35,36].

2.3. Preparation of Experimental Water

There were two types of water used in this experiment. For two of the experiments, the water was collected from a lake nearby Curtin University named Bodkin Park Lake in Waterford, Perth, Western Australia. The lake receives stormwater from the surrounding residential and commercial areas. The lake water contained nutrients such as NH3-N, NO3-N, and PO4-P at a concentration of 0.6 ± 0.04 mg/L, 0.2 ± 0.02 mg/L, and 0.25 ± 0.02 mg/L, respectively. Heavy metal concentrations such as Cu, Zn, Pb, Cr, Ni, and Co were < 0.001 mg/L, and Cd concentrations were <0.0001 mg/L. For two of the experiments, tap water was used, containing nutrients at a concentration of < 0.01 mg/L. In both types of water, analytical grade copper sulfate (CuSO4) and zinc chloride (ZnCl2) were used to spike the water with desired concentrations of Cu and Zn. The first and third experiments were conducted using tap water; the second and fourth experiments were conducted using lake water. All the experiments were conducted using the same plants, and only the water was changed after the end of each experiment. In both cases, water lost over time due to evapotranspiration was refilled with deionized water to bring the water to its initial level. The high concentration for Cu was 0.40 ± 0.02 mg/L, and for Zn, it was 3.35 ± 0.16 mg/L. The high concentrations were selected based on the highest concentrations found in stormwater across Australia from a literature review conducted for this study [8,10]. The low concentration for Cu was 0.17 ± 0.02 mg/L, and for Zn, it was 0.82 ± 0.06 mg/L. The concentrations considered to be low for this study were the average Cu and Zn concentrations found in stormwater worldwide [37].

2.4. Water Sampling and Measurements

There were seven sampling events for each of the experiments during 16 days. Two more samplings were performed between 16 and 27 days for lake water experiments. Cu and Zn concentrations were measured using an Atomic Absorption Spectrophotometer–AAS (AA-6300, Shimadzu Corp., Kyoto, Japan). The AAS was calibrated every day before measurement by using standard concentrations of Cu and Zn. The direct air-acetylene flame continuous method was used to measure the concentrations of both Cu and Zn [38]. After analysis, the remaining samples were returned to their respective reactors. pH, Electrical Conductivity (EC), Redox Potential (RP), Dissolved Oxygen (DO), and water temperature were measured in-situ using an HQ40d portable meter (HACH, Colorado, USA) coupled with respective probes (HACH Intellical PHC101, HACH Intellical CDC40101, HACH LDO101). Nutrients (NH3-N, NO3-N, and PO4-P) were measured initially and after 16 days by the Aquakem Analyzer 200 (Thermofisher Scientific, Massachusetts, USA).

2.5. Plant Tissue Sample Analysis

At the end of the fourth experiment, (i.e., the last experiment), all of the plants were harvested and washed thoroughly before further analysis. The plants were cut into two portions—belowground tissue (roots) and aboveground tissue (shoots). Then they were oven-dried at 60 °C for 24 h, during which a constant weight was achieved. Oven-dried weight was measured and subsequently calcined at 550 °C for 8 h in a furnace. The calcined tissue was weighed again before being pulverized using mortar and pestle to produce a fine powder. Pulverization continued until the sample could be passed through a 180 μm sieve. The sieved sample was split into two, each weighing 500 mg. It was not possible to get two 500 mg calcined samples for some of the plants due to their low dry biomass. In those cases, at least one 500 mg sample was weighed, and for the second sample, at least 250 mg of the sample was weighed and factored during digestion and element calculation. The weighed calcined tissue was digested in 10 mL of aqua regia (HCl-HNO3, ratio 3:1) for 500 mg samples or a proportionate amount of aqua regia for samples below 500 mg according to the standard trace elements determination technique [39]. Trace metal grade hydrochloric acid (HCl) and nitric acid (HNO3) were used to prepare aqua regia. The digestion was carried out at 120 °C for 1 h. After that the digested samples were cooled at room temperature and diluted to 500 mL with Milli-Q water. From the 500 mL diluted sample, two samples, each amounting to 12 mL, were filtered through a 45 μm syringe filter and then analyzed in AAS for Cu and Zn concentrations. A blank sample consisting of 10 mL of aqua regia only was also heated and diluted with an equal amount of water for AAS analysis to account for the trace metals in the digesting acid.
After determining the Cu and Zn concentrations within the plant tissues, the Translocation Factor (TF) and Bioconcentration Factor (BCF) were calculated according to Equation (1) [40] and Equation (2) [41].
T F = M s h o o t M r o o t
B C F = M t i s s u e C i
where Mshoot and Mroot are total metal accumulation (mg) in dry plant shoots and roots, respectively. Mtissue is the metal concentration in dry plant (whole) tissue (mg/kg), and Ci is the initial metal concentration in water (mg/L).

2.6. Statistical Analysis

All the data were tested for the Shapiro-Wilk normality test and Levene’s homogeneity test before comparing treatments and concentrations. Since normality and homogeneity of variances were not observed, the Scheirer–Ray–Hare test was performed to compare overall means (combining all the removed concentration data of the four experiments), which is a nonparametric version of a two-way ANOVA [42,43,44]. For an overall pairwise comparison, a Kruskal–Wallis nonparametric test was performed as a post-hoc analysis [42,45,46]. To compare plant metal uptake performance between nutrient-deficient tap water and nutrient-rich lake water, a Mann-Whitney U nonparametric test was applied, which is a nonparametric version of a t-test [47,48]. This test was applied since the measured variable (in this instance, concentration) could not be measured at interval or ratio level. This happened since a similar sampling interval could not be strictly maintained for all four experiments due to access restrictions to the lab during weekends and public holidays. All the statistical tests were reported for a p-value less than 0.05. The values in the statistical tests were labeled with letters representing statistically significant/non-significant differences between treatment and within treatment at different concentrations and different water types. The values which share a common letter label have no statistically significant difference between them.

2.7. Kinetic Analysis

Kinetic analyses were performed to determine the removal rate constants, which can facilitate designers to estimate total mass removal after any specific time. First-order and second-order kinetic models were applied in this study. The linear forms of the models are given in Equations (3) and (4) [49].
l n   C t = l n   C i k 1 t
1 C t = 1 C i + k 2 t
where Ct is the metal concentration (mg/L) after time ‘t’ (days), Ci is the initial metal concentration (mg/L), t is time (days), k1 and k2 are the first-order (per day) and second-order (L/mg/day) kinetic rate constants, respectively.
Data fitting analysis between measured and predicted mass removal was estimated in terms of Root Mean Square Error (RMSE) and R2. The kinetic model with the best data fitting was suggested for this study.

3. Results and Discussion

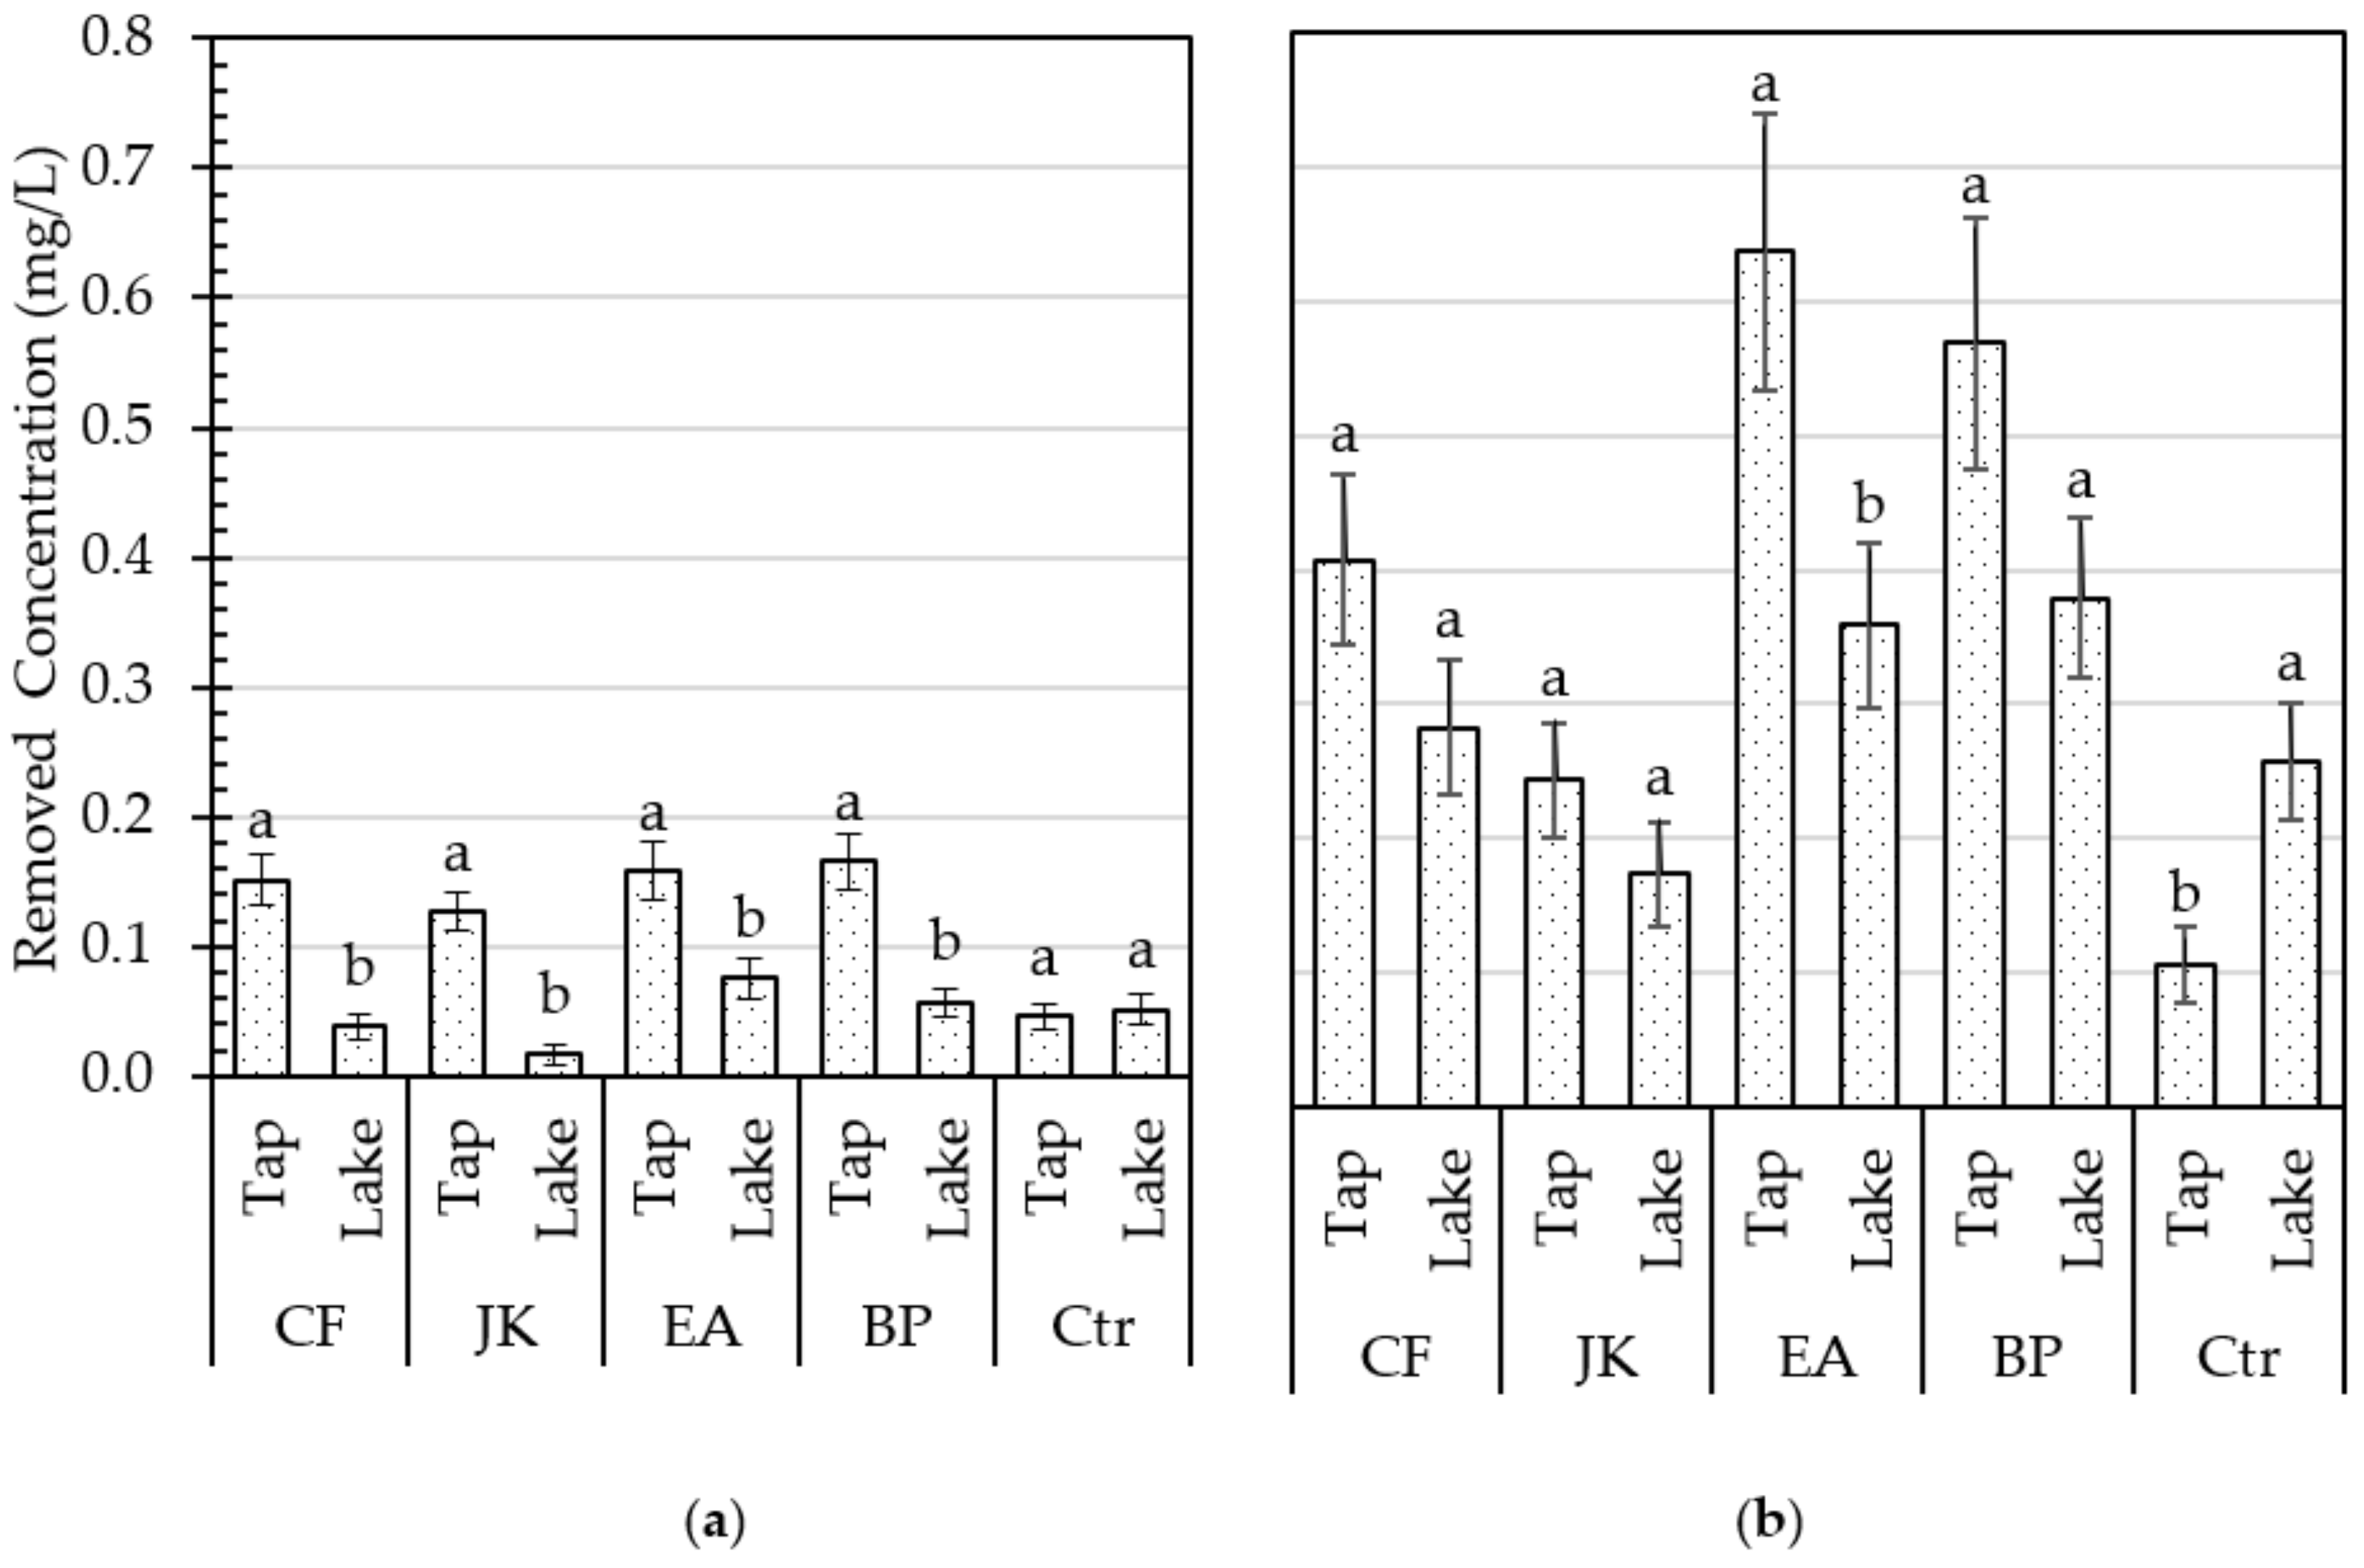
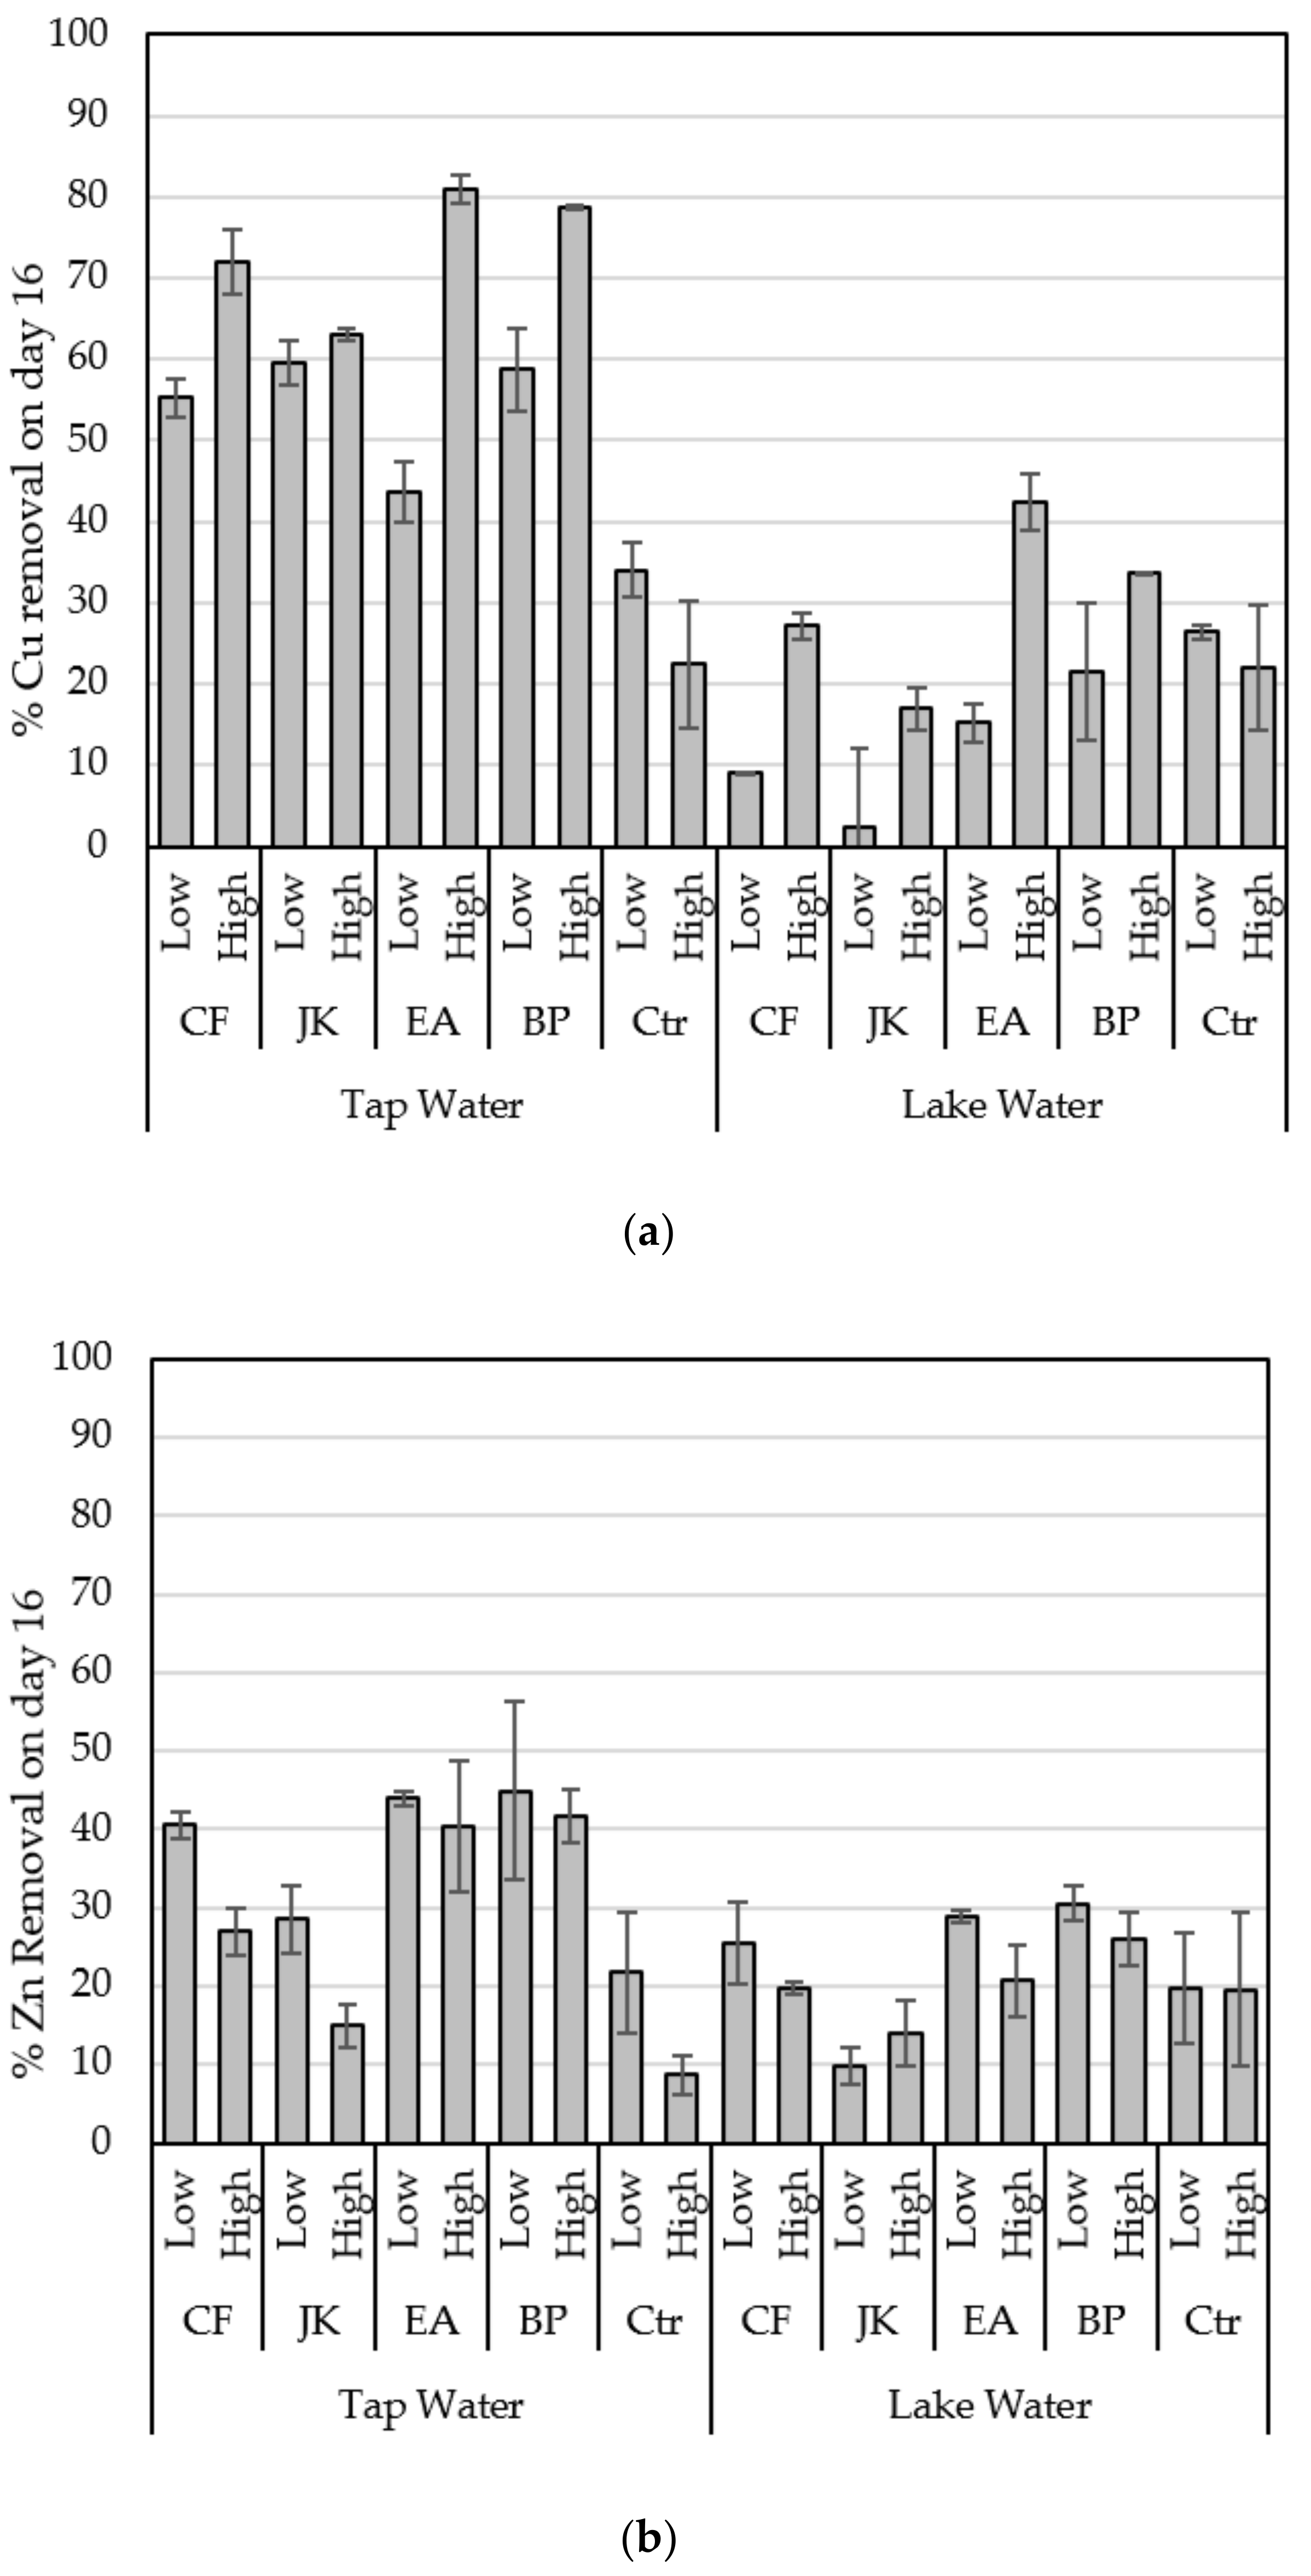
3.1. Role of Plants in Metal Removal

The Scheirer–Ray–Hare test revealed that overall, there was a significant difference between treatments for both of the parameters (Table 2). As such, the Kruskal-Wallis test was conducted as a post-hoc analysis to determine where the differences were by doing a pairwise comparison. It is evident that E. acuta and B. preissii removed a significant amount of Cu and Zn than the control reactors, whereas C. fascicularis had a significant impact on Zinc removal only (p < 0.05). Though removal by J. kraussii was higher than the control, no statistically significant difference was found between them for both Cu and Zn (p > 0.05). It is evident that the highest amount of removals were achieved by E. acuta followed by B. preissii with no significant difference between them. No statistical significance was found between plant species for Cu. Significant differences between plant species were found for Zn involving J. kraussii, E. acuta, and B. preissii. A significant difference between treatments at high and low concentrations was detected, with higher mass removal of Cu and Zn achieved at high concentrations.

3.2. Impact of Nutrients on Metal Removal

The species-wise removed concentrations data were clustered together (both high and low concentrations) and separated by water type to facilitate statistical comparison between nutrient-deficient tap water and nutrient-rich lake water. The statistical comparisons by Mann Whitney U nonparametric test are depicted in Figure 2. A significantly lower amount of Cu removal was observed in lake water (0.016–0.076 mg/L) than in tap water (0.0127–0.165 mg/L) in the planted reactors. On the other hand, though Zn removal in all plant species was lower in lake water than in tap water, the difference was statistically insignificant except for E. acuta. Nutrient analysis on day 0 and day 16 for the lake water experiments revealed that more than 98% of all the nutrients (NH3-N, NO3-N, and PO4-P) were uptaken by the plants during this period, but not in the unplanted control reactors, which explains the lower amount of metal removal in nutrient-rich lake water by the plants compared to nutrient-deficient tap water. It was also observed that the mean metal removal by J. kraussii in lake water (0.016 mg/L Cu and 0.174 mg/L Zn) was less than in the control reactors (0.051 mg/L Cu and 0.257 mg/L Zn). Metal removal in the control reactors account for the natural precipitation of metals in solution, whereas metal removal in planted reactors is the combination of metal precipitation and plant metal uptake. Assuming that metal precipitation in the control reactors and planted reactors were equal, the planted buckets should have higher metal removal than the control reactors since plant uptake contributes further removal in the planted reactors. For J. kraussii, this was not the case for both Cu and Zn; rather, metal removal was lower than in the control reactors. This reduced metal removal in the J. kraussii reactors possibly happened due to the release of metals by the plant to the water column. However, the initial concentration in the J. kraussii reactors was not higher than the final concentration. As such, it cannot be conclusively stated that there was a metal release by J. kraussii. Nevertheless, the results definitively suggest that due to the presence of nutrients in lake water, Cu removal was significantly reduced in all of the planted reactors. The Zn removal in the control reactors indicates that the precipitation of Zn was higher in lake water (0.257 mg/L) than in tap water (0.106 mg/L). This enhanced precipitation may have played a role in having no statistical significance between tap and lake water for Zn in most of the planted reactors.
Next, the percentage removal of Cu and Zn after 16 days of treatment is shown in Figure 3. The percentage removal of Zn was lower than Cu in the planted reactors in general, indicating a lower uptake rate of Zn. A kinetic rate analysis has been shown in Section 3.3, which confirms this observation. Percentage removal was less in nutrient-rich lake water than in nutrient-deficient tap water for both of the metals. A reduction in Cu removal between 28.4–57.3% was observed in lake water compared to tap water in the planted reactors, with the highest amount of decline observed in J. kraussii. On the other hand, a 1–19.7% reduction in Zn removal was observed in lake water compared to tap water in the planted reactors. E. acuta and B. preissii achieved around 80% of Cu removal in nutrient-deficient tap water compared to less than 50% removal in nutrient-rich lake water at high concentrations. On the other hand, more than 40% of Zn was removed by E. acuta and B. preissii in tap water compared to around 30% removal in lake water. C. fascicularis and J. kraussii also removed metals, following a similar trend. C. fascicularis and E. acuta performed poorer than the control reactors for Cu removal at low concentration only during the first 16 day period in lake water. The variations of metal concentrations over time are shown in Figures S1–S4. As lake water experiments were continued up to 27 days, it revealed that both C. fascicularis and E. acuta were able to remove slightly better or almost equal amounts (28.1% by C. fascicularis and 26% by E. acuta) after 27 days compared to the control reactors (26.5%) at low concentration for Cu, as shown in Figure S5. However, removal by J. kraussii still fell behind the control at 22.4% after 27 days for Cu at a low concentration. J. kraussii was able to remove an almost equal amount of Zinc to the control reactor after 27 days (around 28 and 24% at low and high concentrations, respectively), whereas all other plants achieved 10–20% higher removal than the control during the same duration. All of these plants initially performed poorer than the control reactor for Cu at low concentrations due to nutrient availability.

3.3. Kinetic Analysis

The concentrations of metals over time were fitted into the first-order, and second-order kinetic Equations (3) and (4), and data fitting indicators (RMSE and R2) were calculated as shown in Table 3. Lower RMSE values (0.001–0.048 mg/L) and higher R2 (0.648–0.914) values can be observed for the second-order kinetic equation compared to the first-order kinetics for both Cu and Zn. It signifies that the second-order kinetics is better at describing both the metals (Cu and Zn) removal processes, which is consistent with other phytoremediation studies [3,49,50]. Cu removal rates in the planted reactors were higher than Zn removal rates suggesting more bioavailability of Cu than Zn. The control reactors had the lowest kinetic rate for both metals, which account for the metal precipitation rate only. The kinetic analysis also revealed that planted reactors performed poorly in nutrient-rich lake water compared with nutrient-deficient tap water. The mean kinetic rates for Cu in planted reactors were 0.586–0.825 L/mg/day in tap water, whereas it ranged from 0.018–0.088 L/mg/day in lake water. The mean kinetic rate for Zn was also much lower in lake water (0.005–0.018 L/mg/day) than in tap water (0.025–0.052 L/mg/day) for the planted reactors. Lower kinetic rates for both Cu and Zn in lake water compared to tap water re-affirms the findings of the statistical analysis that the presence of nutrients adversely impacts metal uptake by plants.

3.4. Plant Tissue Analysis

Metal bio-accumulation within plant roots and shoots was measured after harvesting the plants at the end of the fourth experiment. Metal bio-accumulation within the plant tissue of this study is shown in Table 4, and the maximum metal bio-accumulation in other FTW studies is shown in Table 5. Metal concentrations in the plant tissue were much higher than the potentially toxic level for vegetation, 10–30 mg/kg Cu and 100–500 mg/kg Zn [6]. This suggests that all the tested plants developed good metal tolerance, which is typical for water-tolerant species [51]. The average Cu concentration for different plants used in this study varied between 262 and 1279 mg/kg (Table 4). In contrast, several studies reported Cu concentration under 100 mg/kg of dry mass (Table 5) for different plants, including Carex virgata and Typha latifolia (6,33,40), which suggests that all of the plants used in this study can tolerate a high level of Cu in their tissue. A maximum of 24.7 mg/kg of Cu bio-accumulation was reported by a native Australian species—C. appressa [13], which is even lower than other studies. A value of around 900 mg/kg of Cu concentration was also reported in Pistia stratiotes (water lettuce), suggesting that a high level of Cu bio-accumulation in plant tissue is not typical but possible. Maximum Zn bio-accumulation in C. appressa was found to be 250 mg/kg [13]. In a mesocosm study, Zn bio-accumulation in Cyperus ustulatus was found to be up to 1732 mg/kg for stormwater treatment [33], whereas Zn bio-accumulation in this study has been found to be up to 3466 mg/kg by E. acuta, which proves its higher efficiency in uptaking Zn. On the other hand, a Zn accumulation of up to 22,686 mg/kg was reported in Pistia stratiotes roots by Sricoth, et al. (2018) [28]. The plants were exposed to 40 mg/L of Zn in this particular study, which possibly led to this exceptional Zn accumulation. Hyper-accumulator plants of Cu and Zn have been defined as plants that can accumulate and tolerate up to 1000 mg/kg Cu and 10,000 mg/kg Zn in their tissue [52]. According to this definition, only E. acuta and B. preissii are hyper-accumulators of Cu, and none of the plants are hyper-accumulators of Zn.
The translocation factor (TF) for Zn for all of the plants (0.2–1.1) in this study was observed to be mostly higher than the TF for Cu (0.05–0.38). A similar finding was also reported in Typha australis used in a constructed wetland for metal remediation [53]. A similar trend was also found in C. appressa, where TF for Cu was estimated to be 0.20–0.31 and TF for Zn varied from 0.37–1.61. Even though C. fascicularis was not able to remove as many metals as E. acuta and B. preissii, its TF is mostly higher than all of the plants for both of the metals. Between 12–61% of the total accumulated metals were stored in shoots of C. fascicularis compared to 2–38% in other plants. This can be attributed to the higher shoot biomass production (10.27 ± 0.71 gm for a single plant by dry weight) of C. fascicularis compared to other plants (2.12 to 3.12 gm on average). Due to higher aboveground biomass, the transpiration rate was higher for C. fascicularis, which was also evident from the daily water lost in the reactors. C. fascicularis planted reactors required twice as much water compared to other reactors to bring the initial water level to 7 L. Transpiration is one of the key mechanisms through which metals are translocated from plant roots to leaves [54]. TF for all the plants was found to be less than 1 except for C. fascicularis for Zn translocation, where the maximum average TF of C. fascicularis was 1.1 for Zn.
Table 5. Maximum metal bio-accumulation within plant tissue in previous studies.
LocationType of StudyType of WaterPlantMaximum Metal Bio-Accumulation (mg/kg)Reference
ThailandLabWastewaterHeliconia psittacorumCd: 1010, Zn: 4500[55]
Echinodorus cordifoliusCd: 3386, Zn: 5326
Pontederia cordataCd: 3306, Zn: 3826
ThailandLabWastewaterTypha angustifoliaCd: 1261, Zn: 2743[56]
Pandanus amaryllifoliusCd: 260, Zn: 1109
Acorus calamusCd: 2954, Zn: 2578
PakistanLabRiver waterBrachia muticaFe: 97, Mn: 33, Ni:24, Ni: 6, Cr: 21[27]
Typha domingensisFe: 127, Mn: 50, Ni:43, Pb:12, Cr: 33
Phragmites australisFe: 142, Mn: 60, Ni:53, Pb:14, Cr: 39
Leptochala fuscaFe: 87, Mn:31, Ni: 21, Pb: 6, Cr: 6
AustraliaFieldStormwaterCarex appressaCu: 25, Fe: 10,047, Mn: 6667, Zn: 250[13]
ChinaLabWastewaterOenanthe javanicaCa: 21, K: 71, Mg: 6[23]
Rumex japonicasCa: 31, K: 80, Mg: 7
Phalaris arundinaceaCa: 19, K: 60, Mg: 8
Reineckia carneaCa: 31, K: 53, Mg: 7
ThailandLabWastewaterPistia straitiotes
Eichhornia crassipes
Cyperus alternifolius
Vetiveiria zizanioides
Canna indica
Thalia geniculate
Cd: 10,133, Zn: 22,686 (roots only)
Cd: 9001, Zn: 19,111 (roots only)
Cd: 3195, Zn: 9138 (roots only)
Cd: 1723, Zn: 3311 (roots only)
Cd: 2376, Zn: 8605 (roots only)
Cd; 3663, Zn: 7207 (roots only)
[28]
IndiaLabWastewaterPhragmites australisCu: 8.2, Cd: 2.6, Cr: 5.4, Ni: 3.0, Fe: 71,
Pb: 3.8, Zn: 50
[24]
Typha latifoliaCu: 8.2, Cd: 2.3, Cr: 4.8, Ni: 2.9,
Fe: 68.4, Pb: 6.3, Zn: 50
FranceFieldStormwaterJuncus effususCd: 0.4, Ni: 154, Zn: 290[57]
Carex ripariaCd: 0.21, Ni: 144, Zn: 213
IndonesiaLabWastewaterPistia stratiotesCu: 900, Pb: 38,000[26]
PortugalFieldRiver waterFontinalis antipyreticaU: 4950[22]
Callitriche stagnalisU: 2060
Typha latiofoliaU: 400
Oenanthe crocataU: 30
IndiaLabWastewaterLemna minorCd: 4734[3]
Spirodela polyrhizaCd: 7711
New ZealandFieldStormwaterCarex virgataCu: 78, Zn: 285[6]
FranceLabStormwaterJuncus effususCd: 7, Ni: 65, Zn: 137[25]
Carex ripariaCd: 7.1, Ni: 15, Zn: 105
New ZealandFieldStormwaterCarex virgata-[20]
New ZealandLabStormwaterSchoenoplectus tabernaemontaniFe: 266, Mn: 280, Zn: 1070, Cu: 53[33]
Juncus edgariaeFe: 654, Mn: 212, Zn: 1100, Cu: 41
Carex virgateFe: 311, Mn: 263, Zn: 574, Cu: 29
Cyperus ustilatusFe: 803, Mn: 214, Zn: 1732, Cu: 54
BelgiumLabWastewaterCarex spp.-[58]
Lythrum salicaria
Phragmites australis
Juncus effusus
NigeriaFieldEstuarine waterEichornia crassipesAs: 0.54, Cd: 0.69, Cu: 78, Cr: 16, Fe: 927, Mn: 1050, Ni: 2.13, Pb: 0.94, V: 5, Zn: 354[21]
The TF of C. fascicularis (0.16–0.38 for Cu and 0.39–1.10 for Zn) is comparable to the other native species—C. appressa (0.20–0.31 for Cu and 0.37–1.61 for Zn). Both of the species are from the same genus (Carex). A TF value greater than 1 is desirable to remove more metals permanently from the waterbody where FTW is installed, as harvesting the leaves of the plants is easier than harvesting roots. Harvesting roots may also impact its ability to remove metals further. However, previous studies demonstrated that in most of the water-tolerant species, TF is typically less than 1 for metals [25,40,41] which is mostly consistent with this study.
The bio-concentration factor (BCF) was found to be a lot higher than 1, which implies the capability of the plants to uptake metals [59]. Average BCF was higher for Cu (1273–4643) than Zn (275–1499) for all of the plants, which indicates that Cu was more bioavailable than Zn [57]. This is consistent with the kinetic analysis, where removal rates for Cu were higher than Zn for all of the plants in this study. BCF values up to 3453 for Cu and up to 1337 for Zn have been reported in the literature [41,57], which is comparable to this study.

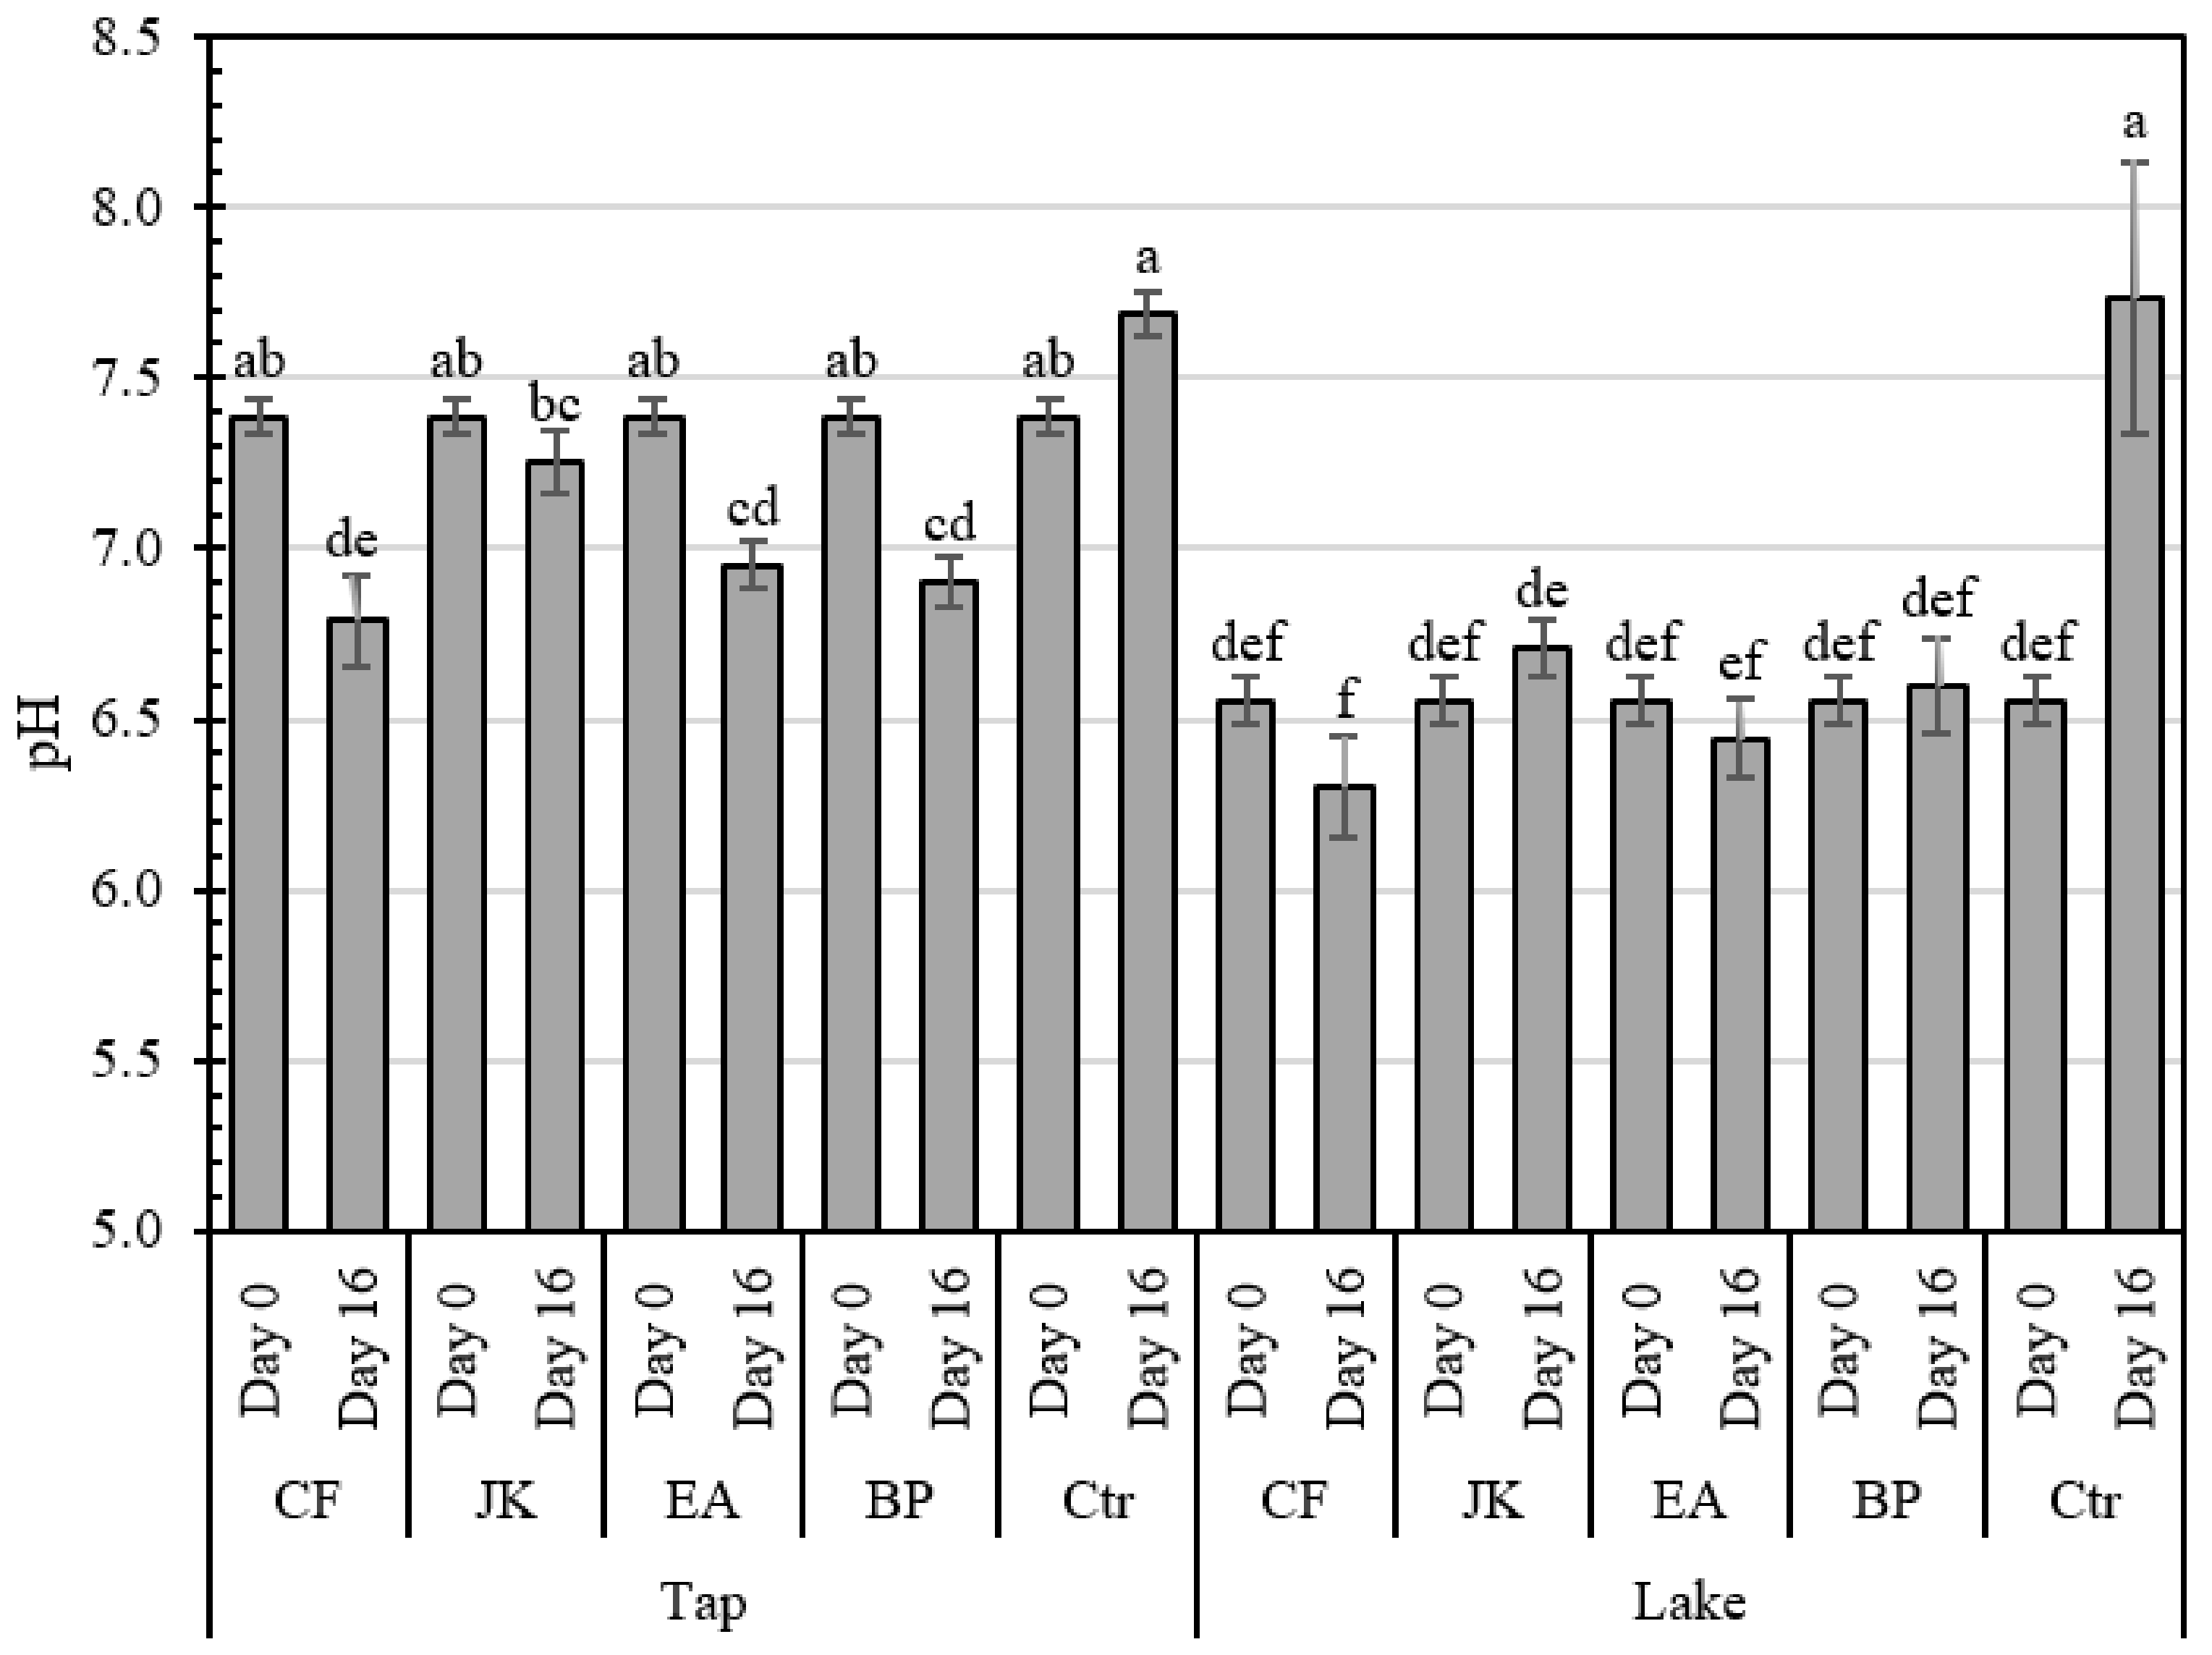
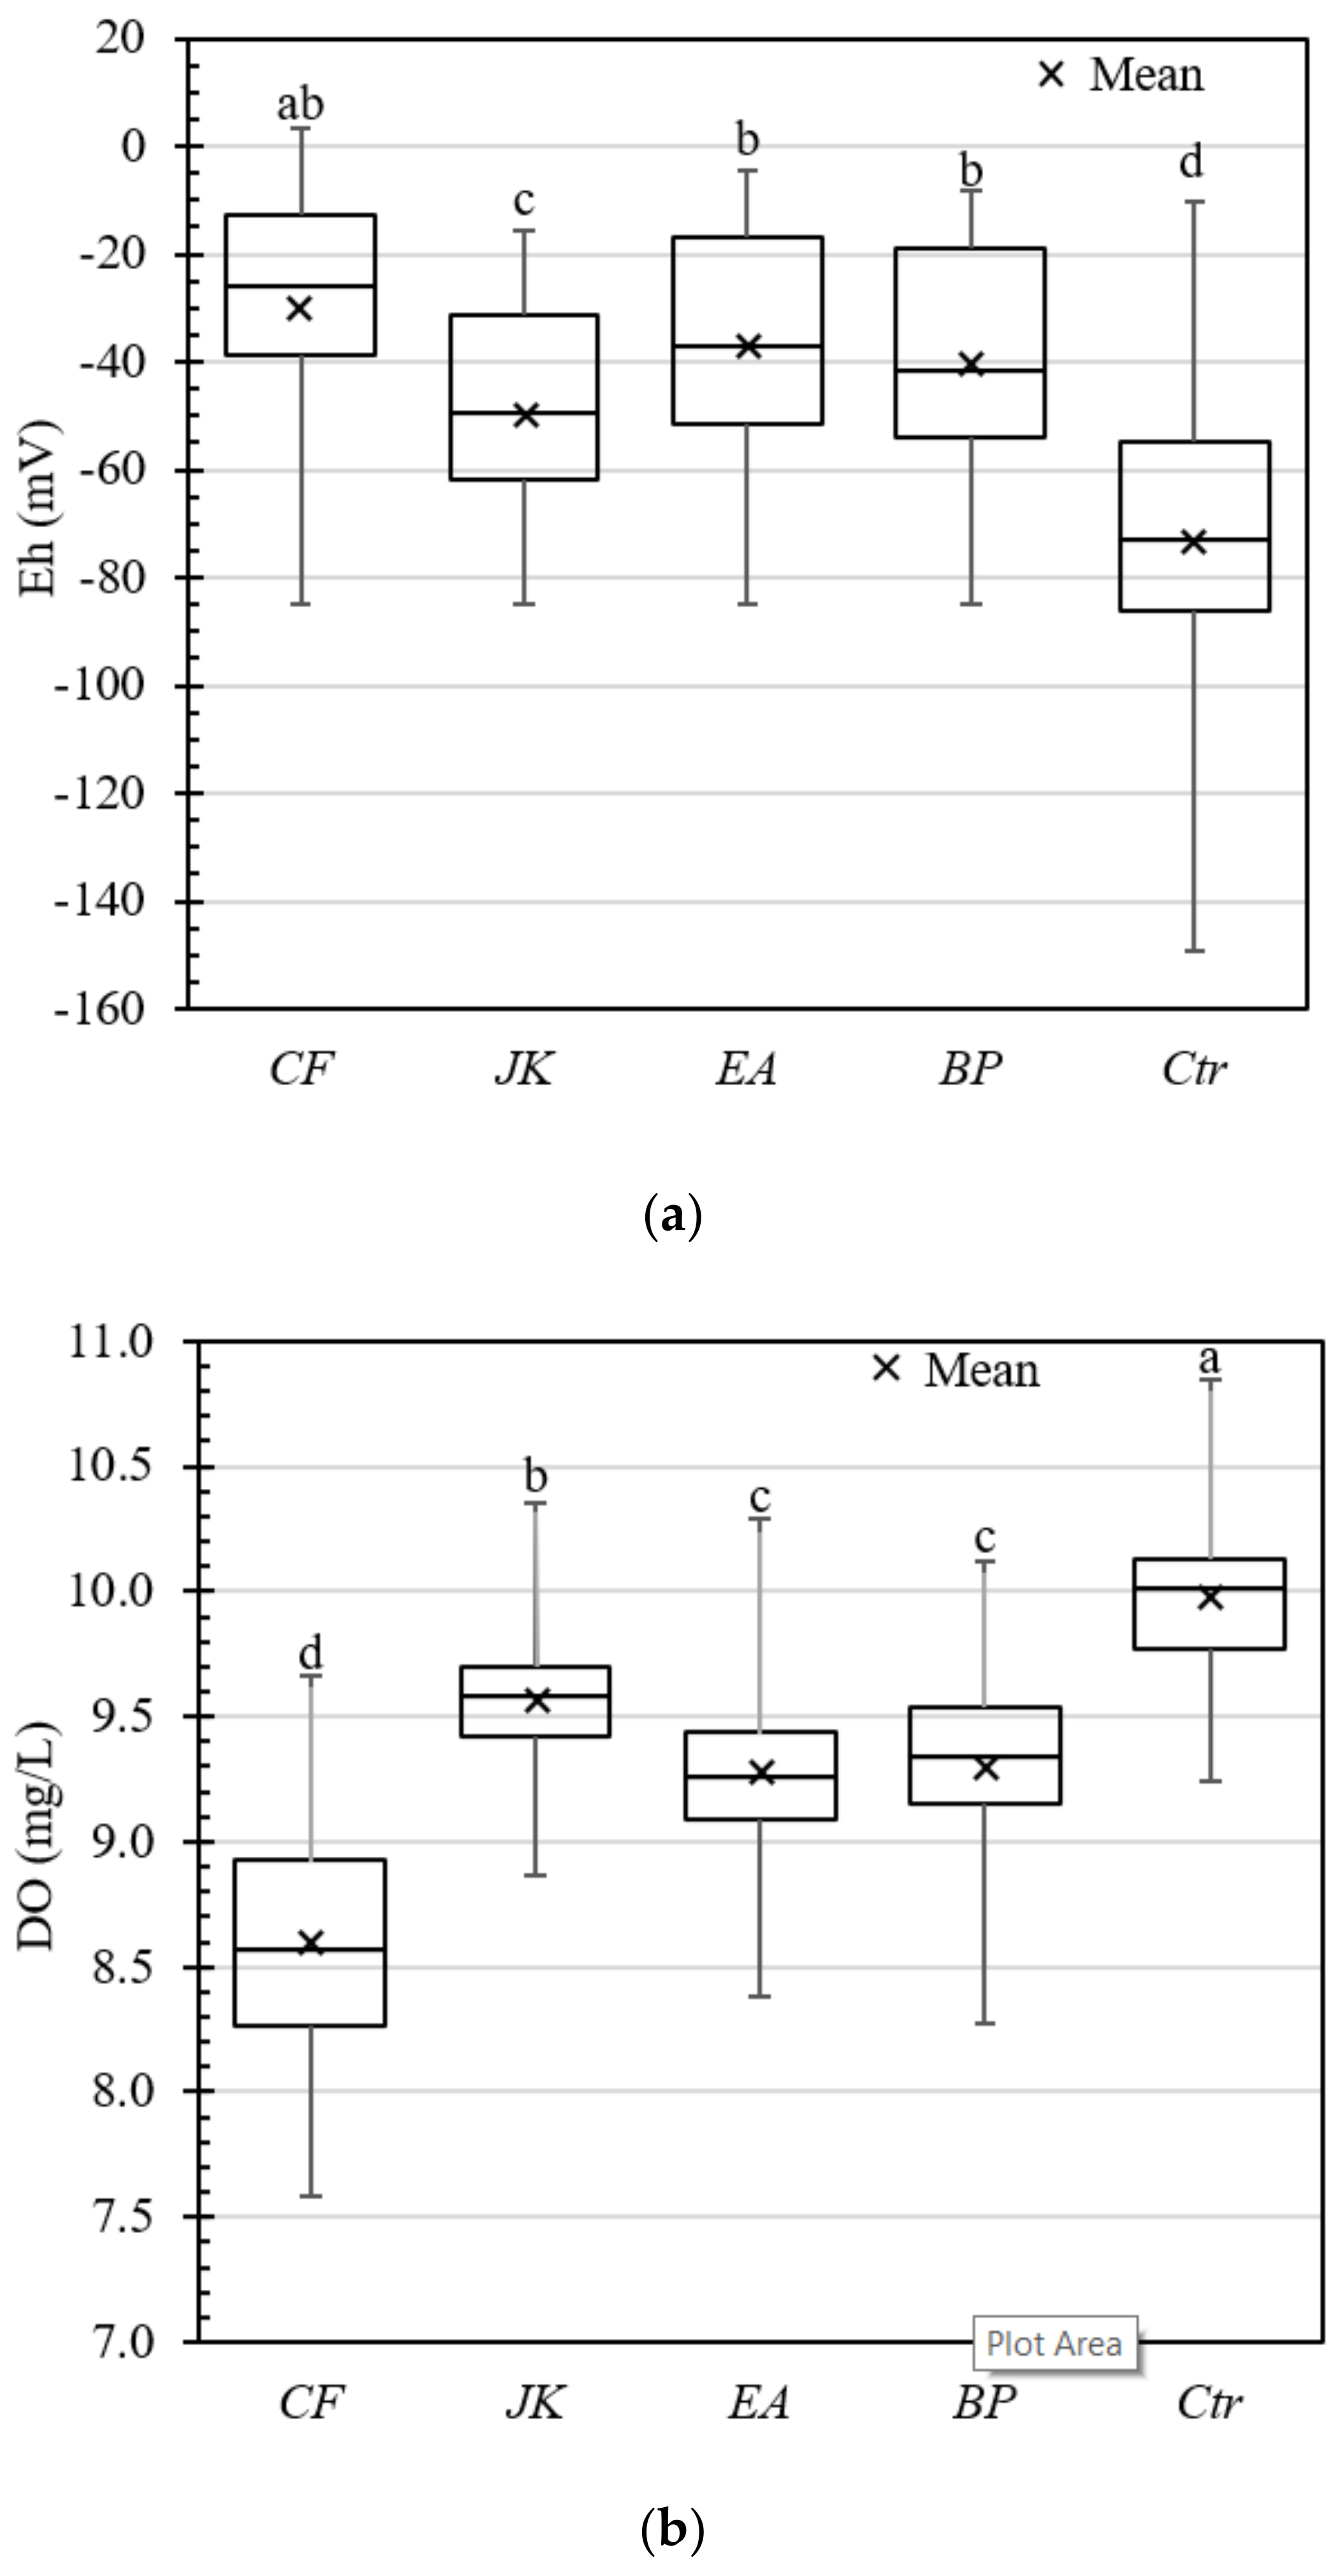
3.5. Physico-Chemical Parameters of Water

Measurements of pH demonstrated that the initial pH was slightly alkaline (around 7.4) in tap water and slightly acidic (around 6.6) in lake water (Figure 4). All the plants except J. kraussii significantly reduced pH levels in tap water, which is consistent with most other studies [6,15,27,58,60]. The reduction of pH in FTWs happens because of the release of organic acids by the plants through their roots [15,61,62]. There was no significant increase or decrease in pH in lake water in the planted reactors. Conversely, a significant increase in pH from 6.56 to 7.73 was observed in the control reactors in lake water. The availability of nutrients in lake water possibly triggered algal growth, which released toxins, increasing the pH of the water [63]. On the other hand, since plants were uptaking nutrients, algal growth and subsequent pH increase were inhibited in the planted reactors. A higher pH is reported to enhance the precipitation of metals [64]. Comparing the precipitation of metals in the control reactors, there was no significant difference in copper precipitation in tap and lake water (Figure 2). In contrast, zinc precipitation was significantly higher in lake water despite the pH of lake water being lower than that of tap water. On the other hand, plant metal uptake increases with decreasing pH up to a slightly acidic range (5–7), as reported by Shahid, et al. (2020) [27]. Metal removal in the planted reactors in tap water was significantly higher, although the pH in tap water was higher than in lake water. These two observations imply that the difference in pH in lake and tap water did not play any role in creating any substantial difference in metal removal in tap water and lake water by the studied plants. Nutrients were responsible for the slower metal uptake in nutrient-rich lake water compared to nutrient-deficient tap water.
Redox potential measurements show that the water environment was mostly in reduced condition (negative Eh). Eh varied between −85 mV and 3.4 mV for planted reactors with different plants (Figure 5a). Eh was significantly lower in the control reactor than in the planted reactors ranging between −149 mv and −10.3 mV. It is consistent with pH measurements since a reduction in pH increases Eh and vice-versa [65]. Similar findings were reported in other FTW studies [6,58], where Eh values were measured to be higher under the planted floating mat compared to that of the unplanted control reactor/pond. Higher Eh values in planted reactors indicate oxygen-consuming reactions taking place, which is also evident from Figure 5b, where significantly lower DO concentrations were observed for plants with higher Eh values. A correlation analysis between mean Eh and mean DO values of the reactors yielded an R2 value of 0.906. DO was significantly higher in the control reactor than in any other planted reactors, ranging between 9.2 and 10.9 mg/L. A low DO concentration in planted reactors compared to that of control reactors indicates that plant release of oxygen was outweighed by the consumption of oxygen due to respiration and oxidation in the metallic water environment. Other studies also reported a similar phenomenon under planted floating mats [6,33]. The DO for C. fascicularis was found to be the lowest (between 7.6 and 9.7 mg/L). In other planted reactors, DO ranged between 8.3 and 10.4 mg/L. A high respiration rate compared to other plants combined with oxygen-consuming reactions brought the DO level down to the lowest for C. fascicularis planted reactors. The high respiration rate of C. fascicularis may have been fueled by plant release of exudates and secretions, e.g., organic acids [33], which is evident from the lowest pH level achieved by C. fascicularis.
Water temperature, in general, was slightly lower in planted reactors than in the control reactor due to the shading effect (Figure S6). Similar findings and reasons were reported in other studies [6,58]. The mean water temperature for different experiments was found to be between 16.0 and 18.2 °C, whereas it ranged between 16.3 and 19.0 °C for the control reactor. However, this difference was not statistically significant. A whisker-box plot of air temperature is shown in Figure S7. The electrical conductivity of water ranged between 303 and 552 μS/cm (Figure S8), which is comparable to other studies for metal remediation from stormwater by FTW [6,33]. The variation of EC between treatments was not noteworthy. A general minor decline in EC over time was observed during the experiments.

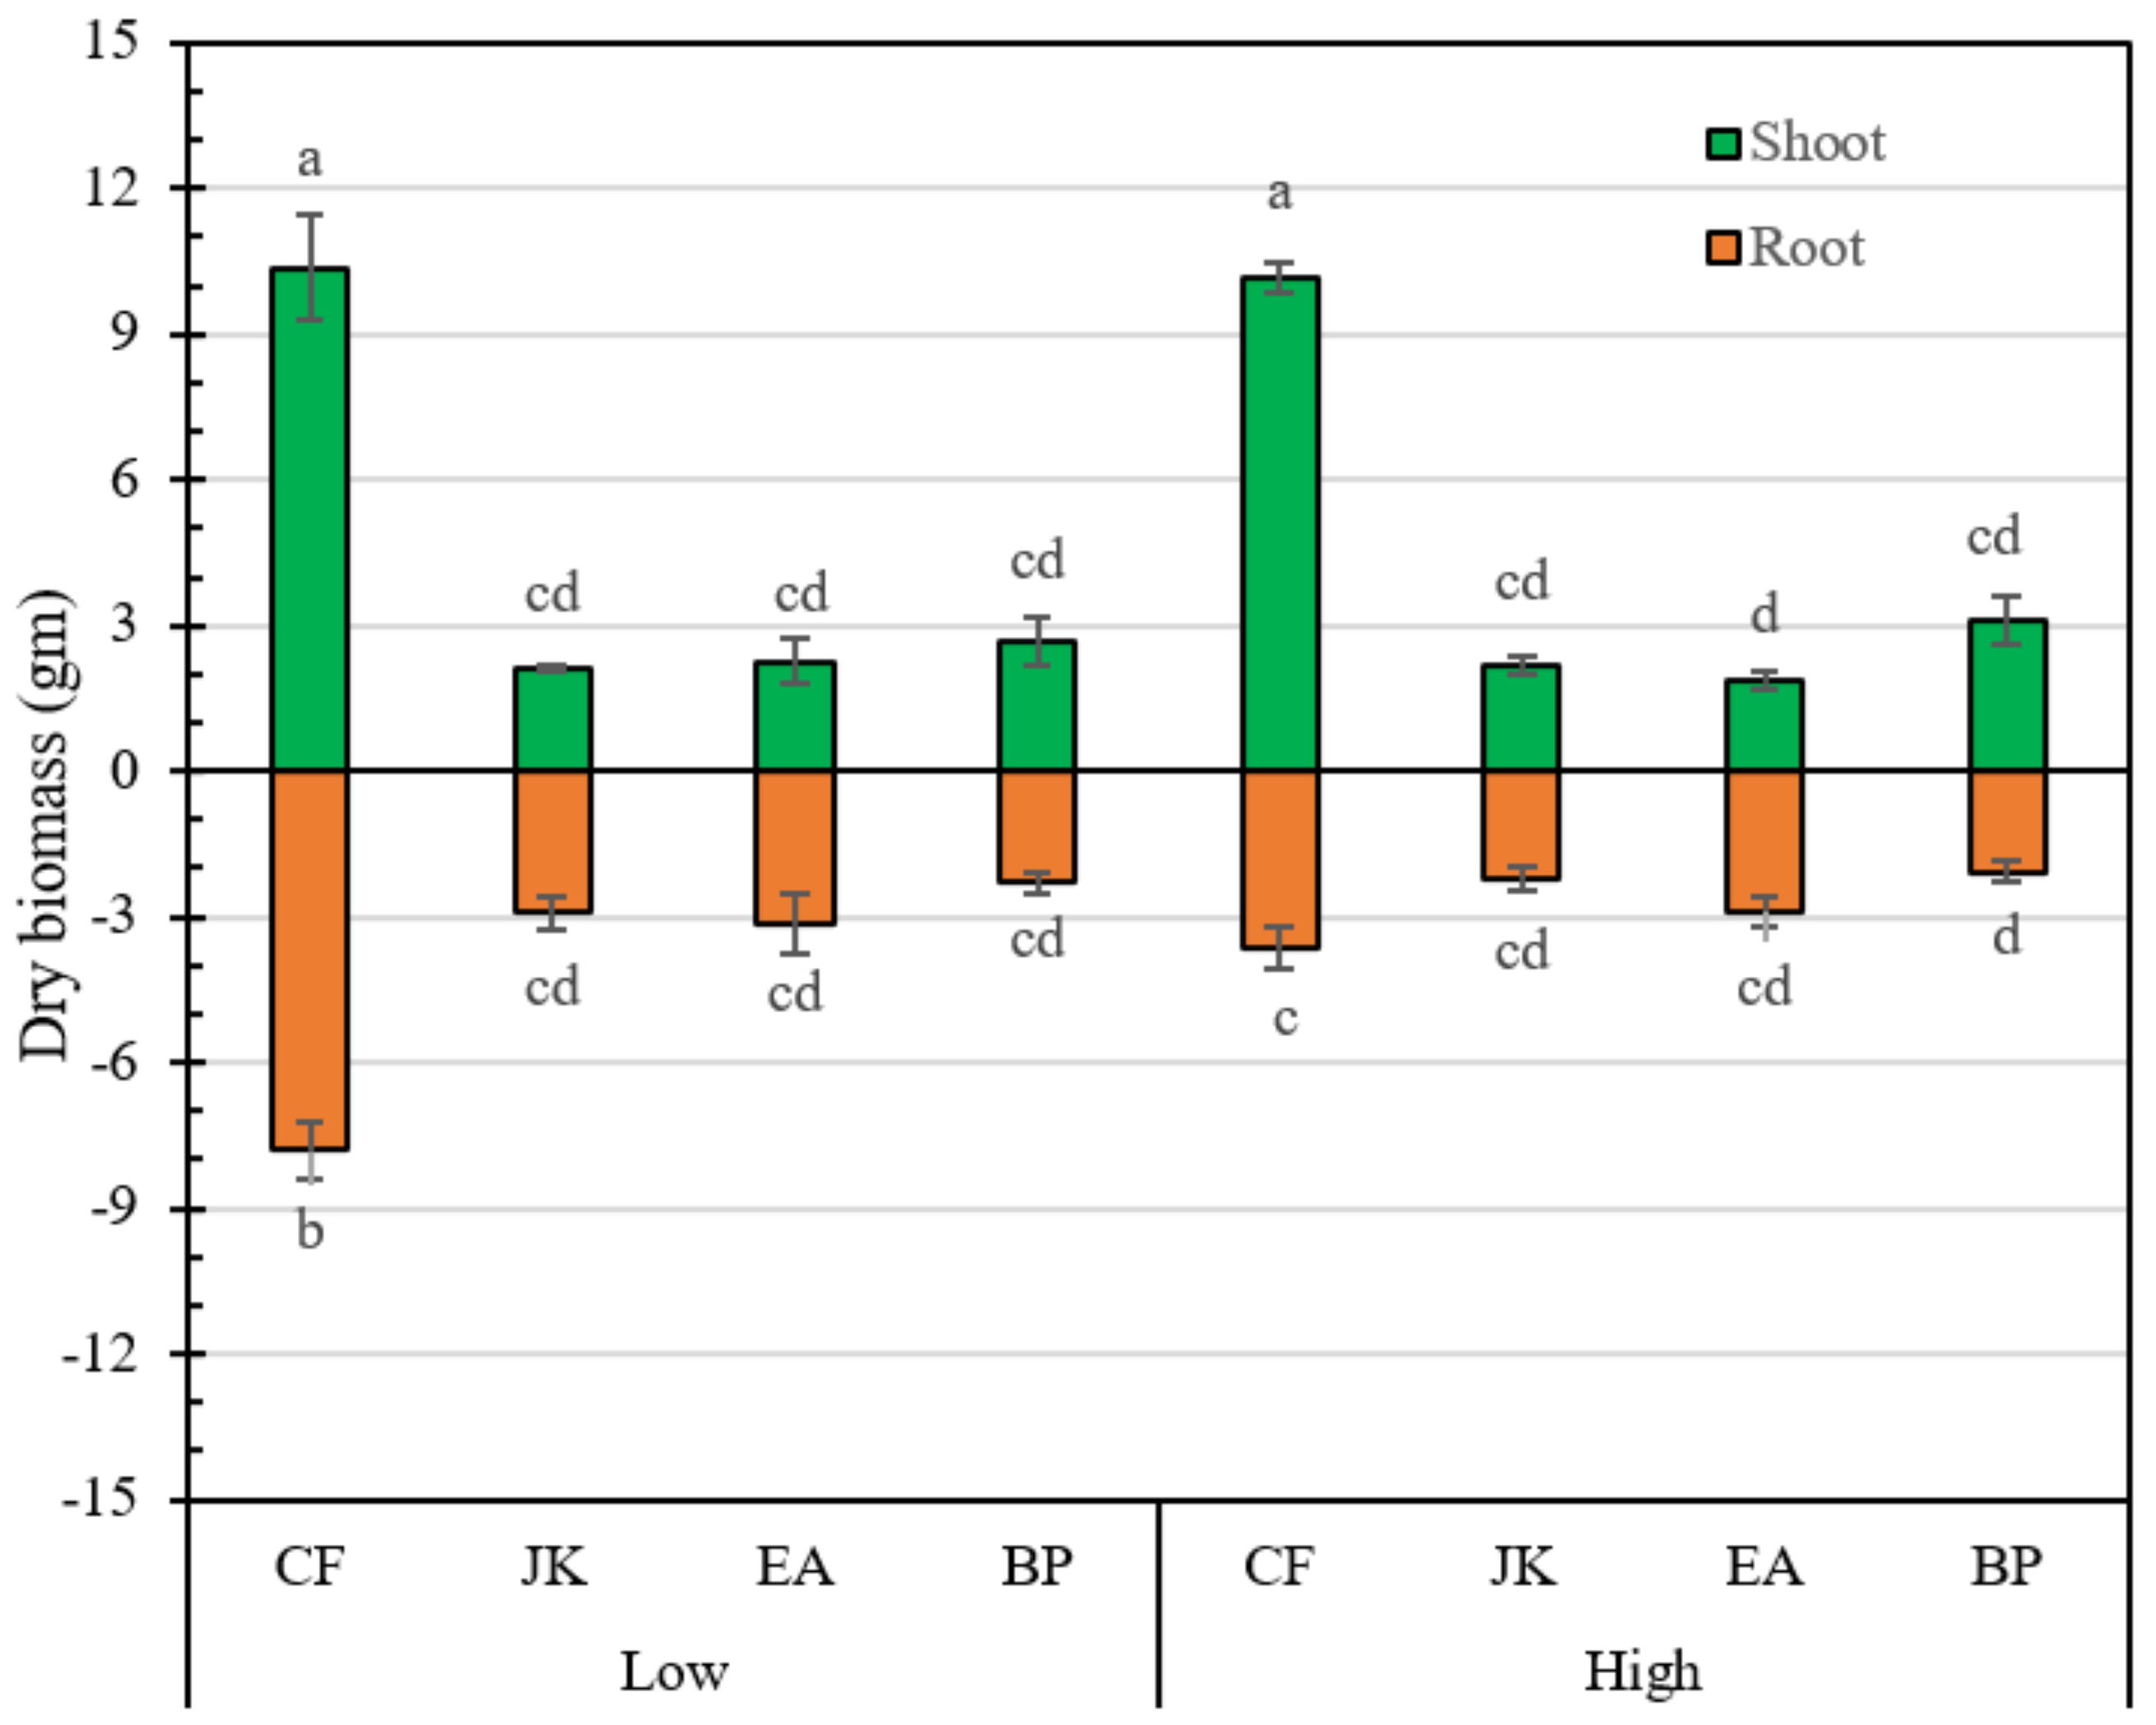
3.6. Plant Biomass Production

C. fascicularis had a total dry biomass of 16.01 ± 0.71 gm per plant at the end of the experiments, whereas all other plants had a total dry biomass of around 5 gm per plant (Figure 6). C. fascicularis also produced 1.5 to 3 times higher shoots than its roots by dry weight, which as mentioned earlier, is one of the reasons for the translocation factor of C. fascicularis being higher than other plants. Wetland species typically produce higher aboveground biomass compared to belowground biomass [66]. In contrast, no significant difference between plant roots and shoots was detected for the other three plants in this study. It can also be observed that plants exposed to high metal concentration had slightly lower biomass production compared to the plants exposed to low concentration. However, this was not statistically significant except for roots of C. fascicularis. Ladislas, et al. (2013) also did not find any significant difference in biomass production between plants exposed to high and low concentrations of metals using Juncus effusus and Carex riparia [25]. In contrast, plant growth inhibition effect was observed by a study using duckweeds, e.g., Lemna gibba and Spirodela polyrhiza [3]. It is possible that plant physiology played a role in determining the growth inhibition effect on C. fascicularis in this study. From visual observation (Figure S9), it can be understood that all of the plants underwent metal stress due to metal bio-accumulation in their body tissue. However, since all of the plants survived for the whole duration (86 days) of metal exposure, it is evidence that the plants were able to develop a tolerance to metal stress.
The impact of nutrient availability on plant metal removal performance in FTWs has been investigated in this research. A reduction in DO concentration was also observed in the planted reactors of this study, especially by C. fascicularis. Both of these two phenomena might negatively impact metal removal efficiency and the health of the waterbody. As such, a long-term study is warranted to further confirm the findings of this study. A possible solution for slow metal uptake in the presence of nutrients might be a multi-species plantation. It has been reported that multi-species plantations may enhance pollutant removal efficiency [67,68] due to a synergistic effect. A possible combination can be oxygenator plants and nutrient stripping plants along with metal hyper-accumulator plants in a multi-species plantation. As such, different combinations of multi-species plantations using native Australian plants can be a subject of future investigation. In this study, better results were obtained for E. acuta, B. preissii, and C. fascicularis, which may be suitable for field-scale FTWs. However, first, field trials are needed to evaluate the performance of these plants in longer-term weather conditions. Future studies can also investigate developing harvesting strategies to permanently remove metals from stormwater ponds.

4. Conclusions

We hypothesized in our study that heavy metal phytoremediation from stormwater in floating treatment wetlands (FTW) could be affected due to the presence of nutrients, e.g., NH3-N, NO3-N, and PO4-P. This hypothesis was not tested before in an FTW system to the best of our knowledge. It is important because if the metal uptake rate is retarded due to the presence of nutrients, more metals will go into the stormwater receiving waterbodies, causing harm to the ecosystem. This study investigated the phenomenon in FTWs using four native Australian plant species. The results revealed that native Australian species such as E. acuta and B. preissii can be effective for Cu (up to 81%) and Zn removal (up to 44.9%) during a 16 days period, while C. fascicularis can be effective for the removal of Zn only up to 41% in 16 days in nutrient-deficient water. The other plant, J. kraussii, did not have any significant impact on removing any metals, but possibly, it was releasing metals into the water column in the presence of nutrients. The release of metals could not be conclusively confirmed, but a reduction in plant metal uptake in the presence of nutrients by all of the studied plants was definitively proven with statistical significance. Plant metal uptake performance was reduced in the presence of nutrients by 28.4–57.3% for Cu and 1.0–19.7% for Zn. This indicates the preference of nutrients for metals by the plants. Plants also behaved differently when exposed to high and low metal concentrations. All the plants removed a higher percentage of Cu at high concentrations compared to low concentrations, but it was the opposite for Zn removal, which suggests the dependency of metal removal on its initial concentration. Cu uptake by plants in the presence of nutrients was highly affected when exposed to low Cu concentration. Though total mass removal of Zn (0.21–0.504 mg/L mean) was higher than Cu (0.074–0.119 mg/L mean) by all of the plants, percentage removal, and kinetic rates were higher for Cu than Zn. Average kinetic rates for Cu and Zn for different plants were 0.306–0.454 and 0.015–0.035 L/mg/day (second-order kinetics), respectively. Kinetic rates in the presence of nutrients (0.018–0.088 L/mg/day for Cu and 0.005–0.018 L/mg/day for Zn) for different plant species were slower than in the absence of nutrients (0.586–0.825 L/mg/day for Cu and 0.025–0.052 L/mg/day for Zn), which further corroborates the hypothesis. E. acuta and B. preissii were able to accumulate more than 1000 mg/kg Cu in their tissue, suggesting these two as Cu hyper-accumulator species. None of the plants met the Zn hyper-accumulation threshold of 10,000 mg/kg. C. fascicularis was able to translocate a substantial amount of Zn into its shoots compared to its roots due to its higher shoot biomass production. Metal bio-accumulation in other plants in this study was mostly in their roots. To overcome the slower metal uptake issue, multi-species plantation can be adopted consisting of nutrient stripping plants and metal hyper-accumulator plants.

Supplementary Materials

The following supporting information can be downloaded at: https://www.mdpi.com/article/10.3390/w14111683/s1, Figure S1. Cu concentration over time (Low). Error bars are Standard Errors. Figure S2. Cu concentration over time (High). Error bars are Standard Errors. Figure S3. Zn concentration over time (Low). Error bars are Standard Errors. Figure S4. Zn concentration over time (High). Error bars are Standard Errors. Figure S5. Average percentage removal of Cu and Zn after 27 days in lake water experiments. Error bars are Standard Errors. Figure S6. Average water temperature during experiments. Error bars are Standard Errors. Figure S7. Whisker-Box plot of air temperature during four experiments. Figure S8. Average Electrical conductivity (μS/cm) of experimental water. Error bars are Standard Errors. Figure S9. Visual observation of plants before and after the experiments.

Author Contributions

Conceptualization, M.N.; Laboratory and fieldwork, M.N.; Data curation, M.N.; Writing—original draft preparation, M.N.; Writing—review and editing, A.H.M.F.A. and R.S.; Supervision, A.H.M.F.A. and R.S. All authors have read and agreed to the published version of the manuscript.

Funding

This research is part of the PhD research project of the first author at Curtin University, Western Australia. The project is supported by the Australian Government Research Training Program (RTP) Scholarship for the first author at Curtin University, Australia.

Institutional Review Board Statement

Not applicable.

Informed Consent Statement

Not applicable.

Data Availability Statement

The data presented in this study are available in Supplementary Materials here.

Acknowledgments

The authors appreciate the help provided by Dipok Sarker, Karen Haynes, Mark Whittaker, and Rowan Kleindienst for facilitating the experiments and Bree Howard, Bernie Masters, and Michael Mac Shane for helping to select plants.

Conflicts of Interest

The authors declare no conflict of interest.

Abbreviations

List of Symbols
Mshoottotal metal accumulation in dry plant shoots
Mroottotal metal accumulation in dry plant rhoots
Mtissuemetal concentration in whole dry plant tissue (mg/kg)
Ciinitial metal concentration (mg/L)
Ctmetal concentration (mg/L) after time t (days)
tTime (days)
k1first-order kinetic rate constant (per day)
k2second-order kinetic rate constant (L/mg/day)
R2coefficient of determination.
List of Abbreviations
AASAtomic Absorption Spectrophotometer
ANOVAAnalysis of variance
ANZECCAustralian and New Zealand Environment Conservation Council
APHAAmerican Public Health Association
BCFBio-Concentration factor
BPBaumea preissii
CFCarex fascicularis
CFWConstructed floating wetland
CtrControl
DODissolved oxygen
EAEleocharis acuta
ECElectrical conductivity
EhRedox potential
FTIFloating treatment island
FTWFloating treatment wetland
HRTHydraulic retention time
JKJuncus kraussii
RMSERoot mean square error
SEStandard error
TFTranslocation factor

References

  1. Barbosa, A.; Fernandes, J.; David, L.M. Key issues for sustainable urban stormwater management. Water Res. 2012, 46, 6787–6798. [Google Scholar] [CrossRef] [PubMed]
  2. Alam, Z.; Anwar, A.F.; Heitz, A.; Sarker, D.C. Improving stormwater quality at source using catch basin inserts. J. Environ. Manag. 2018, 228, 393–404. [Google Scholar] [CrossRef] [PubMed]
  3. Chaudhuri, D.; Majumder, A.; Misra, A.K.; Bandyopadhyay, K. Cadmium removal by Lemna minor and Spirodela poly-rhiza. Int. J. Phytoremediat. 2014, 1119–1132. [Google Scholar] [CrossRef] [PubMed]
  4. Ashoori, N.; Teixido, M.; Spahr, S.; LeFevre, G.H.; Sedlak, D.L.; Luthy, R.G. Evaluation of pilot-scale biochar-amended woodchip bioreactors to remove nitrate, metals, and trace organic contaminants from urban stormwater runoff. Water Res. 2019, 154, 1–11. [Google Scholar] [CrossRef] [PubMed]
  5. Reddy, K.; Xie, T.; Dastgheibi, S. Removal of heavy metals from urban stormwater runoff using different filter materials. J. Environ. Chem. Eng. 2014, 2, 282–292. [Google Scholar] [CrossRef]
  6. Borne, K.E.; Fassman-Beck, E.A.; Tanner, C.C. Floating Treatment Wetland influences on the fate of metals in road runoff retention ponds. Water Res. 2014, 48, 430–442. [Google Scholar] [CrossRef]
  7. Zgheib, S.; Moilleron, R.; Chebbo, G. Influence of the land use pattern on the concentrations and fluxes of priority pollutants in urban stormwater. Water Sci. Technol. 2011, 64, 1450–1458. [Google Scholar] [CrossRef]
  8. Beck, H.J.; Birch, G.F. Spatial and temporal variance of metal and suspended solids relationships in urban storm-water—Implications for monitoring. Water. Air. Soil Pollut. 2012, 223, 1005–1015. [Google Scholar] [CrossRef]
  9. Department of Environment of Western Australia. Stormwater Management Manual for Western Australia; Government of Western Australia: Perth, Australia, 2004.
  10. Goonetilleke, A.; Egodawatta, P.; Kitchen, B. Evaluation of pollutant build-up and wash-off from selected land uses at the Port of Brisbane, Australia. Mar. Pollut. Bull. 2009, 58, 213–221. [Google Scholar] [CrossRef] [Green Version]
  11. ANZECC. Australian and New Zealand Guidelines for Fresh and Marine Water Quality; Australian and New Zealand Environment and Conservation Council and Agriculture and Resource Management Council of Australia and New Zealand: Canberra, Australia, 2000; Volume 1, pp. 1–314. [Google Scholar]
  12. Kayhanian, M.; Stransky, C.; Bay, S.; Lau, S.-L.; Stenstrom, M. Toxicity of urban highway runoff with respect to storm duration. Sci. Total Environ. 2008, 389, 386–406. [Google Scholar] [CrossRef]
  13. Schwammberger, P.F.; Yule, C.M.; Tindale, N.W. Rapid plant responses following relocation of a constructed floating wetland from a construction site into an urban stormwater retention pond. Sci. Total Environ. 2019, 699, 134372. [Google Scholar] [CrossRef] [PubMed]
  14. Nuruzzaman, M.; Anwar, A.H.M.F.; Sarukkalige, R.; Sarker, D.C. Review of hydraulics of Floating Treatment Is-lands retrofitted in waterbodies receiving stormwater. Sci. Total Environ. 2021, 149526. [Google Scholar] [CrossRef] [PubMed]
  15. Shahid, M.J.; Arslan, M.; Ali, S.; Siddique, M.; Afzal, M. Floating Wetlands: A Sustainable Tool for Wastewater Treatment. CLEAN Soil Air Water 2018, 46. [Google Scholar] [CrossRef]
  16. Afzal, M.; Arslan, M.; Müller, J.A.; Shabir, G.; Islam, E.; Tahseen, R.; Anwar-Ul-Haq, M.; Hashmat, A.J.; Iqbal, S.; Khan, Q.M. Floating treatment wetlands as a suitable option for large-scale wastewater treatment. Nat. Sustain. 2019, 2, 863–871. [Google Scholar] [CrossRef]
  17. Samal, K.; Kar, S.; Trivedi, S. Ecological floating bed (EFB) for decontamination of polluted water bodies: Design, mechanism and performance. J. Environ. Manag. 2019, 251, 109550. [Google Scholar] [CrossRef]
  18. Sharma, R.; Vymazal, J.; Malaviya, P. Application of floating treatment wetlands for stormwater runoff: A critical review of the recent developments with emphasis on heavy metals and nutrient removal. Sci. Total Environ. 2021, 777, 146044. [Google Scholar] [CrossRef]
  19. Headley, T.R.; Tanner, C.C. Constructed Wetlands with Floating Emergent Macrophytes: An Innovative Stormwater Treatment Technology. Crit. Rev. Environ. Sci. Technol. 2012, 42, 2261–2310. [Google Scholar] [CrossRef]
  20. Borne, K.E.; Fassman, E.A.; Tanner, C.C. Floating treatment wetland retrofit to improve stormwater pond performance for suspended solids, copper and zinc. Ecol. Eng. 2013, 54, 173–182. [Google Scholar] [CrossRef]
  21. Agunbiade, F.O.; Olu-Owolabi, B.I.; Adebowale, K.O. Phytoremediation potential of Eichornia crassipes in met-al-contaminated coastal water. Bioresour. Technol. 2009, 100, 4521–4526. [Google Scholar] [CrossRef]
  22. Favas, P.J.; Pratas, J.; Varun, M.; D’Souza, R.; Paul, M.S. Accumulation of uranium by aquatic plants in field conditions: Prospects for phytoremediation. Sci. Total Environ. 2014, 470–471, 993–1002. [Google Scholar] [CrossRef]
  23. Han, W.; Ge, Y.; Ren, Y.; Luo, B.; Du, Y.; Chang, J.; Wu, J. Removal of metals and their pools in plant in response to plant diversity in microcosms of floating constructed wetlands. Ecol. Eng. 2018, 113, 65–73. [Google Scholar] [CrossRef]
  24. Kumari, M.; Tripathi, B. Efficiency of Phragmites australis and Typha latifolia for heavy metal removal from wastewater. Ecotoxicol. Environ. Saf. 2015, 112, 80–86. [Google Scholar] [CrossRef] [PubMed]
  25. Ladislas, S.; Gérente, C.; Chazarenc, F.; Brisson, J.; Andrès, Y. Performances of Two Macrophytes Species in Floating Treatment Wetlands for Cadmium, Nickel, and Zinc Removal from Urban Stormwater Runoff. Water. Air. Soil Pollut. 2013, 224, 1–10. [Google Scholar] [CrossRef]
  26. Putra, R.S.; Cahyana, F.; Novarita, D. Removal of Lead and Copper from Contaminated Water Using EAPR System and Uptake by Water Lettuce (Pistia Stratiotes L.). Procedia Chem. 2015, 14, 381–386. [Google Scholar] [CrossRef] [Green Version]
  27. Shahid, M.J.; Ali, S.; Shabir, G.; Siddique, M.; Rizwan, M.; Seleiman, M.F.; Afzal, M. Comparing the performance of four macrophytes in bacterial assisted floating treatment wetlands for the removal of trace metals (Fe, Mn, Ni, Pb, and Cr) from polluted river water. Chemosphere 2019, 243, 125353. [Google Scholar] [CrossRef] [PubMed]
  28. Sricoth, T.; Meeinkuirt, W.; Saengwilai, P.; Pichtel, J.; Taeprayoon, P. Aquatic plants for phytostabilization of cadmium and zinc in hydroponic experiments. Environ. Sci. Pollut. Res. 2018, 25, 14964–14976. [Google Scholar] [CrossRef]
  29. Darajeh, N.; Idris, A.; Masoumi, H.R.F.; Nourani, A.; Truong, P.; Sairi, N.A. Modeling BOD and COD removal from Palm Oil Mill Secondary Effluent in floating wetland by Chrysopogon zizanioides (L.) using response surface methodology. J. Environ. Manag. 2016, 181, 343–352. [Google Scholar] [CrossRef] [PubMed]
  30. Saeed, T.; Paul, B.; Afrin, R.; Al-Muyeed, A.; Sun, G. Floating constructed wetland for the treatment of polluted river water: A pilot scale study on seasonal variation and shock load. Chem. Eng. J. 2016, 287, 62–73. [Google Scholar] [CrossRef]
  31. Urakawa, H.; Dettmar, D.L.; Thomas, S. The uniqueness and biogeochemical cycling of plant root microbial com-munities in a floating treatment wetland. Ecol. Eng. 2017, 108, 573–580. [Google Scholar] [CrossRef]
  32. Wu, Q.; Hu, Y.; Li, S.; Peng, S.; Zhao, H. Microbial mechanisms of using enhanced ecological floating beds for eutrophic water improvement. Bioresour. Technol. 2016, 211, 451–456. [Google Scholar] [CrossRef]
  33. Tanner, C.C.; Headley, T.R. Components of floating emergent macrophyte treatment wetlands influencing removal of stormwater pollutants. Ecol. Eng. 2011, 37, 474–486. [Google Scholar] [CrossRef]
  34. Xavier, M.L.M.; Janzen, J.G.; Nepf, H. Numerical modeling study to compare the nutrient removal potential of different floating treatment island configurations in a stormwater pond. Ecol. Eng. 2018, 111, 78–84. [Google Scholar] [CrossRef] [Green Version]
  35. Feng, J.; Li, J.; Li, Y. A Monsoon-Like Southwest Australian Circulation and Its Relation with Rainfall in Southwest Western Australia. J. Clim. 2010, 23, 1334–1353. [Google Scholar] [CrossRef] [Green Version]
  36. Silberstein, R.; Aryal, S.; Durrant, J.; Pearcey, M.; Braccia, M.; Charles, S.; Boniecka, L.; Hodgson, G.; Bari, M.; Viney, N.; et al. Climate change and runoff in south-western Australia. J. Hydrol. 2012, 475, 441–455. [Google Scholar] [CrossRef]
  37. Duncan, H.P. Urban Stormwater Quality: A Statistical Overview; Cooperative Research Centre for Catchment Hydrology: Canabera, Australia, 1999. [Google Scholar]
  38. APHA. Standard Methods for the Examination of Water and Wastewater; Water Environment Federation (WEF): Washington, DC, USA, 2005. [Google Scholar]
  39. ISO; NFEN. Water Quality—Determination of Trace Elements Using Atomic Absorption Spectrometry with Graphite Furnace; AFNOR: Saint-Denis, France, 2004; p. 15586. [Google Scholar]
  40. Zhang, Z.; Rengel, Z.; Meney, K. Cadmium Accumulation and Translocation in Four Emergent Wetland Species. Water. Air. Soil Pollut. 2010, 212, 239–249. [Google Scholar] [CrossRef]
  41. Ben Salem, Z.; Laffray, X.; Al-Ashoor, A.; Ayadi, H.; Aleya, L. Metals and metalloid bioconcentrations in the tissues of Typha latifolia grown in the four interconnected ponds of a domestic landfill site. J. Environ. Sci. 2017, 54, 56–68. [Google Scholar] [CrossRef]
  42. Liu, H.; Chen, F.; Hartmann, V.; Khalid, S.G.; Hughes, S.; Zheng, D. Comparison of different modulations of pho-toplethysmography in extracting respiratory rate: From a physiological perspective. Physiol. Meas. 2020, 41, 94001. [Google Scholar] [CrossRef]
  43. Luepsen, H. Comparison of nonparametric analysis of variance methods: A vote for van der Waerden. Commun. Stat. Simul. Comput. 2017, 47, 2547–2576. [Google Scholar] [CrossRef]
  44. Valová, Z.; Jurajda, P.; Janáč, M.; Bernardová, I.; Hudcová, H. Spatiotemporal trends of heavy metal concentrations in fish of the River Morava (Danube basin). J. Environ. Sci. Health Part A 2010, 45, 1892–1899. [Google Scholar] [CrossRef]
  45. McKight, P.E.; Najab, J. Kruskal-wallis test. Corsini Encycl. Psychol. 2010, 1. [Google Scholar]
  46. Ostertagová, E.; Ostertag, O.; Kováč, J. Methodology and Application of the Kruskal-Wallis Test. Appl. Mech. Mater. 2014, 611, 115–120. [Google Scholar] [CrossRef]
  47. MacFarland, T.W.; Yates, J.M. Introduction to Nonparametric Statistics for the Biological Sciences Using R; Springer: New York, NY, USA, 2016. [Google Scholar] [CrossRef]
  48. McKnight, P.E.; Najab, J. Mann-Whitney U Test. Corsini Encycl. Psychol. 2010, 1. [Google Scholar]
  49. Emiliani, J.; Llatance Oyarce, W.G.; Bergara, C.D.; Salvatierra, L.M.; Novo, L.A.B.; Pérez, L.M. Variations in the Phy-toremediation Efficiency of Metal-polluted Water with Salvinia biloba: Prospects and Toxicological Impacts. Water 2020, 12, 1737. [Google Scholar] [CrossRef]
  50. Mosoarca, G.; Vancea, C.; Popa, S.; Boran, S. Adsorption, bioaccumulation and kinetics parameters of the phy-toremediation of cobalt from wastewater using Elodea canadensis. Bull. Environ. Contam. Toxicol. 2018, 100, 733–739. [Google Scholar] [CrossRef] [PubMed]
  51. Cronk, J.K.; Fennessy, M.S. Wetland Plants: Biology and Ecology; CRC Press: Boca Raton, FL, USA, 2016. [Google Scholar]
  52. Baker, A.J.M.; Brooks, R. Terrestrial higher plants which hyperaccumulate metallic elements. A review of their distribution, ecology and phytochemistry. Biorecovery 1989, 1, 81–126. [Google Scholar]
  53. Vymazal, J.; Březinová, T. Accumulation of heavy metals in aboveground biomass of Phragmites australis in horizontal flow constructed wetlands for wastewater treatment: A review. Chem. Eng. J. 2016, 290, 232–242. [Google Scholar] [CrossRef]
  54. Tangahu, B.V.; Sheikh Abdullah, S.R.; Basri, H.; Idris, M.; Anuar, N.; Mukhlisin, M. A Review on Heavy Metals (As, Pb, and Hg) Uptake by Plants through Phytoremediation. Int. J. Chem. Eng. 2011, 2011, 939161. [Google Scholar] [CrossRef]
  55. Woraharn, S.; Meeinkuirt, W.; Phusantisampan, T.; Avakul, P. Potential of ornamental monocot plants for rhizofiltration of cadmium and zinc in hydroponic systems. Environ. Sci. Pollut. Res. 2021, 28, 35157–35170. [Google Scholar] [CrossRef]
  56. Woraharn, S.; Meeinkuirt, W.; Phusantisampan, T.; Chayapan, P. Rhizofiltration of cadmium and zinc in hydroponic systems. Water Air Soil Poll. 2021, 232, 1–17. [Google Scholar] [CrossRef]
  57. Ladislas, S.; Gérente, C.; Chazarenc, F.; Brisson, J.; Andrès, Y. Floating treatment wetlands for heavy metal removal in highway stormwater ponds. Ecol. Eng. 2015, 80, 85–91. [Google Scholar] [CrossRef]
  58. Van de Moortel, A.M.K.; Meers, E.; De Pauw, N.; Tack, F.M. Effects of vegetation, season and temperature on the removal of pollutants in experimental floating treatment wetlands. Water Air Soil Poll. 2010, 212, 281–297. [Google Scholar] [CrossRef] [Green Version]
  59. Coakley, S.; Cahill, G.; Enright, A.-M.; O’Rourke, B.; Petti, C. Cadmium hyperaccumulation and translocation in Impatiens glandulifera: From foe to friend? Sustainability 2019, 11, 5018. [Google Scholar] [CrossRef] [Green Version]
  60. Spangler, J.T.; Sample, D.J.; Fox, L.J.; Owen, J.S., Jr.; White, S.A. Floating treatment wetland aided nutrient removal from agricultural runoff using two wetland species. Ecol. Eng. 2019, 127, 468–479. [Google Scholar] [CrossRef]
  61. Bi, R.; Zhou, C.; Jia, Y.; Wang, S.; Li, P.; Reichwaldt, E.S.; Liu, W. Giving waterbodies the treatment they need: A critical review of the application of constructed floating wetlands. J. Environ. Manag. 2019, 238, 484–498. [Google Scholar] [CrossRef]
  62. Yi, N.; Gao, Y.; Long, X.-H.; Zhang, Z.-Y.; Guo, J.-Y.; Shao, H.-B.; Zhang, Z.-H.; Yan, S.-H. Eichhornia crassipes Cleans Wetlands by Enhancing the Nitrogen Removal and Modulating Denitrifying Bacteria Community. CLEAN Soil Air Water 2013, 42, 664–673. [Google Scholar] [CrossRef]
  63. Wang, C.-Y.; Sample, D.J.; Day, S.D.; Grizzard, T.J. Floating treatment wetland nutrient removal through vegetation harvest and observations from a field study. Ecol. Eng. 2015, 78, 15–26. [Google Scholar] [CrossRef]
  64. Barakat, M. New trends in removing heavy metals from industrial wastewater. Arab. J. Chem. 2011, 4, 361–377. [Google Scholar] [CrossRef] [Green Version]
  65. Hillel, D.; Hatfield, J.L. Encyclopedia of Soils in the Environment; Elsevier: Amsterdam, The Netherlands, 2005. [Google Scholar]
  66. Vymazal, J. Concentration is not enough to evaluate accumulation of heavy metals and nutrients in plants. Sci. Total Environ. 2016, 544, 495–498. [Google Scholar] [CrossRef]
  67. Geng, Y.; Han, W.; Yu, C.; Jiang, Q.; Wu, J.; Chang, J.; Ge, Y. Effect of plant diversity on phosphorus removal in hydroponic microcosms simulating floating constructed wetlands. Ecol. Eng. 2017, 107, 110–119. [Google Scholar] [CrossRef]
  68. Sricoth, T.; Meeinkuirt, W.; Pichtel, J.; Taeprayoon, P.; Saengwilai, P. Synergistic phytoremediation of wastewater by two aquatic plants (Typha angustifolia and Eichhornia crassipes) and potential as biomass fuel. Environ. Sci. Pollut. Res. 2017, 25, 5344–5358. [Google Scholar] [CrossRef]
Figure 1. Conceptual diagram of the experimental set-up.
Water 14 01683 g001
Figure 2. (a) Copper, (b) Zinc. Mean removal of metals in nutrient-deficient (tap) and nutrient-rich (lake) water. Comparison was performed between tap water and lake water only for the same treatment by Mann-Whitney U nonparametric test. Values sharing a common letter label for the same treatment are not statistically significant.
Water 14 01683 g002
Figure 3. (a) Copper, (b) Zinc. Percentage removal of Cu and Zn after 16 days.
Water 14 01683 g003
Figure 4. Variation of pH during experiments (with standard errors). pH values on day 0 and day 16 are the mean values of treatment-wise reactors (including high and low concentrations) on respective days. pH data followed normal distribution, and variance was homogeneous. One-way ANOVA with Duncan post-hoc analysis was performed. Values sharing a common letter label are not statistically significant.
Water 14 01683 g004
Figure 5. (a) Redox Potential, (b) Dissolved oxygen. Whisker-Box plots of Redox Potential (Eh) and Dissolved Oxygen (DO) for different treatments. One–way ANOVA with Duncan post-hoc analysis was performed for both Eh and DO. Values sharing a common letter label are not statistically significant.
Water 14 01683 g005
Figure 6. Final dry biomass of plants at the end of experiments. Error bars are standard errors. One–way ANOVA with Duncan post-hoc analysis was performed. Values sharing a common letter label are not statistically significant.
Water 14 01683 g006
Table 1. Operational conditions in the experiments.
Water TypeNutrient-Deficient WaterNutrient-Rich Water
SourceTapLake
Used inExp. 1 (day 0–16)
Exp. 3 (day 43–59)
Exp. 2 (day 16–43)
Exp. 4 (day 59–86)
ConcentrationsLow and HighLow and High
HRT (days)1627
Sampling events79
HRT = Hydraulic retention time.
Table 2. Statistical comparison of mean removal of Cu and Zn by Scheirer–Ray–Hare test and Kruskal-Wallis post-hoc analysis.
ParameterMean Removed Concentration (mg/L)p-Value
Treatment WiseConcentration WiseTreatmentConcentrationInteraction
CFJKEABPCtrLowHigh
Cu0.097 bc0.074 bc0.119 ab0.113 ab0.048 c0.039 b0.142 a0.00382 × 10−180.058
Zn0.348 bc0.210 cd0.504 ab0.478 ab0.178 d0.168 b0.518 a2 × 10−73 × 10−160.525
Values sharing a common letter label (in superscript) are not statistically significant.
Table 3. Kinetic analysis of metal removal.
EquationParameterTreatmentKinetic Rate
(Mean ± SE)
Data Fitting Indicators
(Mean ± SE)
Tap WaterLake WaterRMSE (mg/L)R2
1st Order Kinetics (per day)CopperCF0.100 ± 0.0170.013 ± 0.0040.003 ± 0.0010.756 ± 0.066
JK0.080 ± 0.0070.006 ± 0.0030.002 ± 0.0010.706 ± 0.103
EA0.124 ± 0.0330.025 ± 0.0050.003 ± 0.0010.874 ± 0.036
BP0.115 ± 0.0330.020 ± 0.0110.002 ± 0.0010.881± 0.040
Ctr0.024 ± 0.0060.019 ± 0.0060.003 ± 0.0020.630 ± 0.097
ZincCF0.031 ± 0.0060.017 ± 0.0030.034 ± 0.0160.874 ± 0.023
JK0.019 ± 0.0060.008 ± 0.0010.036 ± 0.0110.653 ± 0.054
EA0.044 ± 0.0050.019 ± 0.0040.069 ± 0.0310.816 ± 0.038
BP0.040 ± 0.0050.021 ± 0.0020.036 ± 0.0160.881 ± 0.033
Ctr0.011 ± 0.0050.015 ± 0.0030.032 ± 0.0130.608 ± 0.080
2nd order kinetics (L/mg/day)CopperCF0.699 ± 0.0560.041 ± 0.0080.002 ± 0.00030.789 ± 0.060
JK0.586 ± 0.1560.018 ± 0.0070.002 ± 0.0040.758 ± 0.078
EA0.825 ± 0.0890.088 ± 0.0290.001 ± 0.00050.906 ± 0.025
BP0.791 ± 0.1070.081 ± 0.0140.001 ± 0.00020.914 ± 0.025
Ctr0.143 ± 0.0530.074 ± 0.0250.002 ± 0.0010.648 ± 0.096
ZincCF0.035 ± 0.0180.015 ± 0.0060.030 ± 0.0130.880 ± 0.025
JK0.025 ± 0.0150.005 ± 0.0010.034 ± 0.0100.657 ± 0.055
EA0.052 ± 0.0230.018 ± 0.0070.048 ± 0.0200.842 ± 0.041
BP0.048 ± 0.0240.017 ± 0.0070.026 ± 0.0120.895 ± 0.029
Ctr0.015 ± 0.0100.014 ± 0.0070.031 ± 0.0120.616 ± 0.082
SE = Standard Error, RMSE = Root Mean Square Error.
Table 4. Metal bio-accumulation within plant tissue of this study.
ParameterPlantConcentrationMetal Bio-Accumulation (mg/kg)Translocation Factor (TF)Bio-Concentration Factor (BCF)
CopperCFLow262 ± 270.16 ± 0.011379 ± 143
High492 ± 470.38 ± 0.091273 ± 121
JKLow398 ± 610.05 ± 0.012089 ± 320
High687 ± 1410.05 ± 0.011777 ± 366
EALow884 ± 2810.23 ± 0.074643 ± 1478
High1279 ± 860.26 ± 0.073311 ± 233
BPLow798 ± 2350.13 ± 0.074196 ± 1233
High1240 ± 630.14 ± 0.042174 ± 163
ZincCFLow513 ± 450.39 ± 0.04647 ± 57
High1310 ± 851.10 ± 0.26437 ± 28
JKLow536 ± 760.34 ± 0.06676 ± 96
High824 ± 2950.21 ± 0.06275 ± 98
EALow1096 ± 1190.45 ± 0.071381 ± 150
High2818 ± 2620.35 ± 0.06939 ± 87
BPLow1190 ± 4390.36 ± 0.031499 ± 553
High2062 ± 2480.41 ± 0.09687 ± 83
Publisher’s Note: MDPI stays neutral with regard to jurisdictional claims in published maps and institutional affiliations.

