Article

Salt Accumulation during Cropping Season in an Arid Irrigation Area with Shallow Water Table Depth: A 10-Year Regional Monitoring

Center for Agricultural Water Research in China, China Agricultural University, Beijing 100083, China
*
Author to whom correspondence should be addressed.
Water 2022, 14(10), 1664; https://doi.org/10.3390/w14101664
Submission received: 15 March 2022 / Revised: 12 May 2022 / Accepted: 19 May 2022 / Published: 23 May 2022

Abstract

:
Nowadays, irrigation takes up about 35% of agricultural water consumption worldwide, and irrigation induced secondary soil salinizationsalinization affects the crop production and sustainable development of arid irrigation areas globally. However, the regular pattern of salt accumulation in the root zone during the cropping season and the contributions of its attribute factors are still unclear. Therefore, a 10-year monitoring was conducted in the Hetao Irrigation District to reveal the soil salt accumulation during the cropping season and to relate it to influential factors, including potential crop evapotranspiration, water input (field irrigation + precipitation) and water table depth. It was found that under the climate conditions and water-saving irrigation measures of the investigated 10-year period, (1) the salt accumulated during the cropping season could be effectively leached by autumn irrigation and the root zone soil could remain suitable for crop germination, (2) the cropping season water deficit (potential crop evapotranspiration − field irrigation − precipitation) showed strong correlation with the cropping season salt accumulation, and (3) maintaining the cropping season average water table depth larger than a critical depth (roughly 3 m) might be the most economical way to alleviate salt accumulation. Therefore, it is recommended to balance the salt leaching and the water table depth controlling in the future water-saving irrigation management practices.

1. Introduction

Nearly half of the total available land on the earth (14 billion hectares) is in the arid and semiarid regions (6.5 billion hectares), where evapotranspiration far exceeds precipitation and soil salinization is prevalent [1]. In these areas, soil salinization, together with water scarcity, hinders agricultural production and sustainable development. Currently, one-fifth of the global croplands, one-third of the global irrigated croplands, and nearly one-seventh of the arid and semiarid areas are salt-affected [2,3,4]. The area of the human-induced secondarily salinized soil is increasing by one-tenth per year. At this rate, half of the global croplands could be salinized by 2050, if no better agricultural water management practices were taken [5].
The Ebro Basin in Spain, the Murray-Darling Basin in Australia, the Indus Basin in Pakistan, and the Hetao Irrigation District in the Yellow River Basin in China are typical salt-affected arid and semi-arid irrigation areas. By the origin of salt, those irrigation areas can be categorized into three types: salt originating from the parent geological material, from the shallow and saline groundwater, and from the irrigation water [6]. Each irrigation area has its own water and salt migration pattern and has developed its own strategies to deal with salinization. The salt accumulated in the Ebro Basin in Spain originally came from the irrigation water from the Ebro River and its tributaries. The traditional irrigation districts (about 0.3 million hectares) were located on well-drained river terraces and were absent from salinization. However, the new irrigation districts (about 0.5 million hectares) constructed from the 1940s to 1980s in the broad areas outside river terraces have been suffering from salinization due to insuffficient drainage [7,8]. The salt accumulated in the Murray-Darling Basin in Australia originally came from the parental material. After the deep-rooted native vegetation in the Murray-Darling Basin was cleared and replaced by agriculture and urban land use, the hydrological balance maintained by salt lakes and natural salt-tolerant vegetation was broken. What is worse is that after the development of irrigated agriculture, the saline groundwater rose to near two-meter depth and the salt showed up in the root zone. Salinity management strategies had been implemented since 1988, and the salinity target of maintaining the water salinity (EC) at Morgan below 800 μS/cm for 95% of the time was finally met in 2010 [9]. The salt that accumulates in the irrigated lands of the Indus Basin of Pakistan comes from the Indus River and its tributaries (122 km3/year) and groundwater (62 km3/year) [10]. The shortage of fresh surface water and the seepage and percolation of fresh surface irrigation water led to the overexploit of fresh groundwater for irrigation. The exploitation of the fresh groundwater resulted in the dropping of the fresh groundwater, the rising of the saline groundwater, and the water-logging of farmlands. Annually, 49 million tons of salt accumulates in the irrigated lands of the basin, equivalent to 3.5 tons of salt per hectare of irrigated land [11]. In 1980, up to 35% of the basin was suffering from salinization. After the implementation of salinity management measures for three decades, one-fifth of the salt-affected area has been reclaimed by 2007 [10].
Located in the upper Yellow River Basin, Hetao Irrigation District (HID) is the third-largest irrigation district in China and the most important grain production area in Inner Mongolia. As a typical arid irrigation area, HID has an annual precipitation of 155 mm, and annual evapotranspiration of 2000 mm [12,13]. Therefore, the agriculture in HID relies on the irrigation water diverted from the Yellow River, which has a salinity of 0.60 g/L, good enough for drinking [6,14,15]. It was the long-term flood irrigation plus drainage systems in disrepair that led to shallow water table depth (1–2 m) and salt accumulation in the HID (2.5 million tons per year, specifically, 250 g/m2/year), mainly since the 1960s, after a great irrigation area expansion [13,16,17]. The secondary soil salinization undermined the food production in HID by impeding the germination and emergence of crops in the spring [18]. Ever since the implementation of water-saving irrigation in 1998, the irrigation water diverted from the Yellow River into the HID has been reduced gradually from 5.2 billion m3/year to the targeted 4.0 billion m3/year [13,19].
Since then, research has been conducted for decades to investigate the impact of the reduced irrigation water and the water-saving measures on the soil water and salt content dynamics, groundwater dynamics and irrigation water efficiency and productivity in HID [12,13,14,19,20,21,22,23]. Wang et al. [12] predicted that in 2010 the water table depth would be deepened by 0.61 m, and, consequently, the groundwater discharge to soil would be reduced by 39.5% for both farmlands and uncultivated lands, and the evapotranspiration from uncultivated lands would be reduced by 46.5%, compared to 1997 Xu et al. [13] estimated that before the implementation of the water-saving irrigation measures, the Jiefangzha Subdistrict (JFZSD), HID, had a water table depth (WTD) of 1–1.45 m during the cropping season, and the phreatic evaporation (the contribution of groundwater to evapotranspiration) accounted for 82% of the annual groundwater discharge. They further predicted the water-saving potential of different water-saving measures and the corresponding WTDs. Gao et al. [21] reported that after the implementation of the water-saving measures in HID, the water table depths at up-, mid-, and down-stream had all deepened gradually from 2007 to 2010. Based on field measurement in 2012, Sun [19] reported that after the implementation of the water-saving irrigation for over one decade, the HID had a field water use efficiency (of 100 cm planned wetting layer) of 0.76 and an irrigation water use efficiency of 0.39. Of all the 5 subdistricts of HID, JFZSD had the largest field water use efficiency (of 100 cm planned wetting layer, 0.85) and the largest irrigation water use efficiency (0.44). They estimated that the HID and the JFZSD had a further water-saving potential of 256 and 56 million m3, respectively. Based on field measurements from 2006 to 2013, Liu et al. [21] estimated the phreatic evaporation during the cropping season in the JFZSD, and worried that further decreasing the amount of irrigation water might exacerbate soil salinization. Xue et al. [23,24] estimated that the regional irrigation water productivity in the JFZSD had been improved by the water-saving measures from 0.86 kg/m3 from 1990 to 2000 to 0.96 kg/m3 between 2000 and 2009. They stated that, thanks to the phreatic evaporation, saving irrigation water in a certain range could improve the regional irrigation water productivity and sustain crop yield above a certain level. Chang [14] reported that in the two decades after the implementation of the water-saving irrigation measures, the annual irrigation water diverted from the Yellow River has been approaching 40 billion m3, while the salinity of the irrigation water has been approaching 0.63 g/L. The reduced irrigation water has led to an increase of WTD from 1.70 m to 1.95 m in the HID on average. Particularly, in the second decade, the JFZSD on average accumulated salt of 57.12 t/year, of which 40% in the 0–1 m soil layer and the rest in the soil layer >1 m and in the groundwater. Specifically, the 0–1 m soil layer of the farmlands desalted 11.21%, whereas the 0–1 m soil layer of the uncultivated lands accumulated salt by 235.62%, highlighting the important role of the uncultivated lands in storing the salt laterally migrating from the farmlands (i.e., dry drainage). Zhou [25] tested the feasibility of the deficit irrigation in the JFZSD, and, based on one-year field measurements of spring wheat, they recommended that compared to the full irrigation of 100% crop water demand, the deficit irrigation at 80% crop water demand could save 20% irrigation water while only compromising 5–13% crop field. However, no consensus has been reached on whether the saved irrigation water in the HID helps drop the elevated water table depth and alleviating soil salinization and sodification, or the saved irrigation water in the HID was the leaching fraction of the irrigation water and soil salt cannot be effectively leached any more.
Climatic factors, integrated into the potential crop evapotranspiration (ETc), drive the upward water movement and the associated salt migration [26]. Especially in the era of climate change, agricultural water and soil management need to be adapted to the changing climate conditions. The irrigation amount and schedule and drainage system conditions are the dominant and manageable factors influencing soil salt leaching and accumulating in the arid and semi-arid irrigation areas [27,28]. Increased salinity in the croplands can be attributed to the irrigation shortage in summer, and well-scheduled sufficient irrigation in autumn/winter/spring and summer can solve the problem [29]. Increasing the amount of irrigation water could help salt leaching, and given the same amount of irrigation water, intermittent irrigation is more effective than one-time irrigation [28]. With a well-maintained drainage system, irrigation can help salt leaching; whereas, with a poorly-maintained drainage system, some irrigation practices could lead to salt accumulation [30].
In irrigation areas with shallow WTD, spatial and temporal dynamics of soil salt are closely related to the WTD [21,29]. WTD is the result of managing irrigation and drainage systems. Leached saline water can readily recharge groundwater. The saline groundwater could contribute up to 40% of the total evapotranspiration when the WTD was about 0.5 m [31]. With the same WTD, groundwater could contribute to 100% of wheat root uptake and 80% of sunflower root uptake [32]. When the water table depth is more than 3 m, groundwater can hardly affect salt accumulation [33].
In recent years, car-borne electromagnetic conductivity meters have conveniently obtained high spatial and temporal resolution soil salinity data, geostatistical methods have interpolated the soil salinity at unknown points based on measured points, and remote sensing methods have been used to obtain time-series images demonstrating the soil salt dynamics [34]. However, in irrigation areas with a scattered distribution of different types of croplands, i.e., the eight croplands adjacent to one cropland may grow different types of crops, these novel methods may have their limitations. The spatial resolution of the remote sensing images may not meet the requirement. The soil water content and soil texture may interfere with the apparent electrical conductivity (ECa) measured by the electromagnetic conductivity meters. The geospatial methods need measured points to interpolate unknown points. Thus, directly measured electrical conductivity (EC) of different soil layers is still needed as known points to apply the geostatistical methods, calibrate the ECa values and validate the soil salinity maps obtained from remote sensing images.
Therefore, a 10-year regional monitoring was conducted in the Jiefangzha Subdistrict (JFZSD) of the Hetao Irrigation District (HID), (1) to uncover the regular pattern of soil salt accumulation during the cropping season, (2) to find the relationships between the salt accumulation and the potential crop evapotranspirtion (ETc), the water input (I + P) and the water table depth (WTD), and to reveal the contribution of each of the three influencing factors to the soil salt accumulation in the root zone during the cropping season, and (3) to recommend corresponding agricultural water management practices in adaption to the changing climate and the more and more strict water-saving irrigation regulations.

2. Materials and Methods
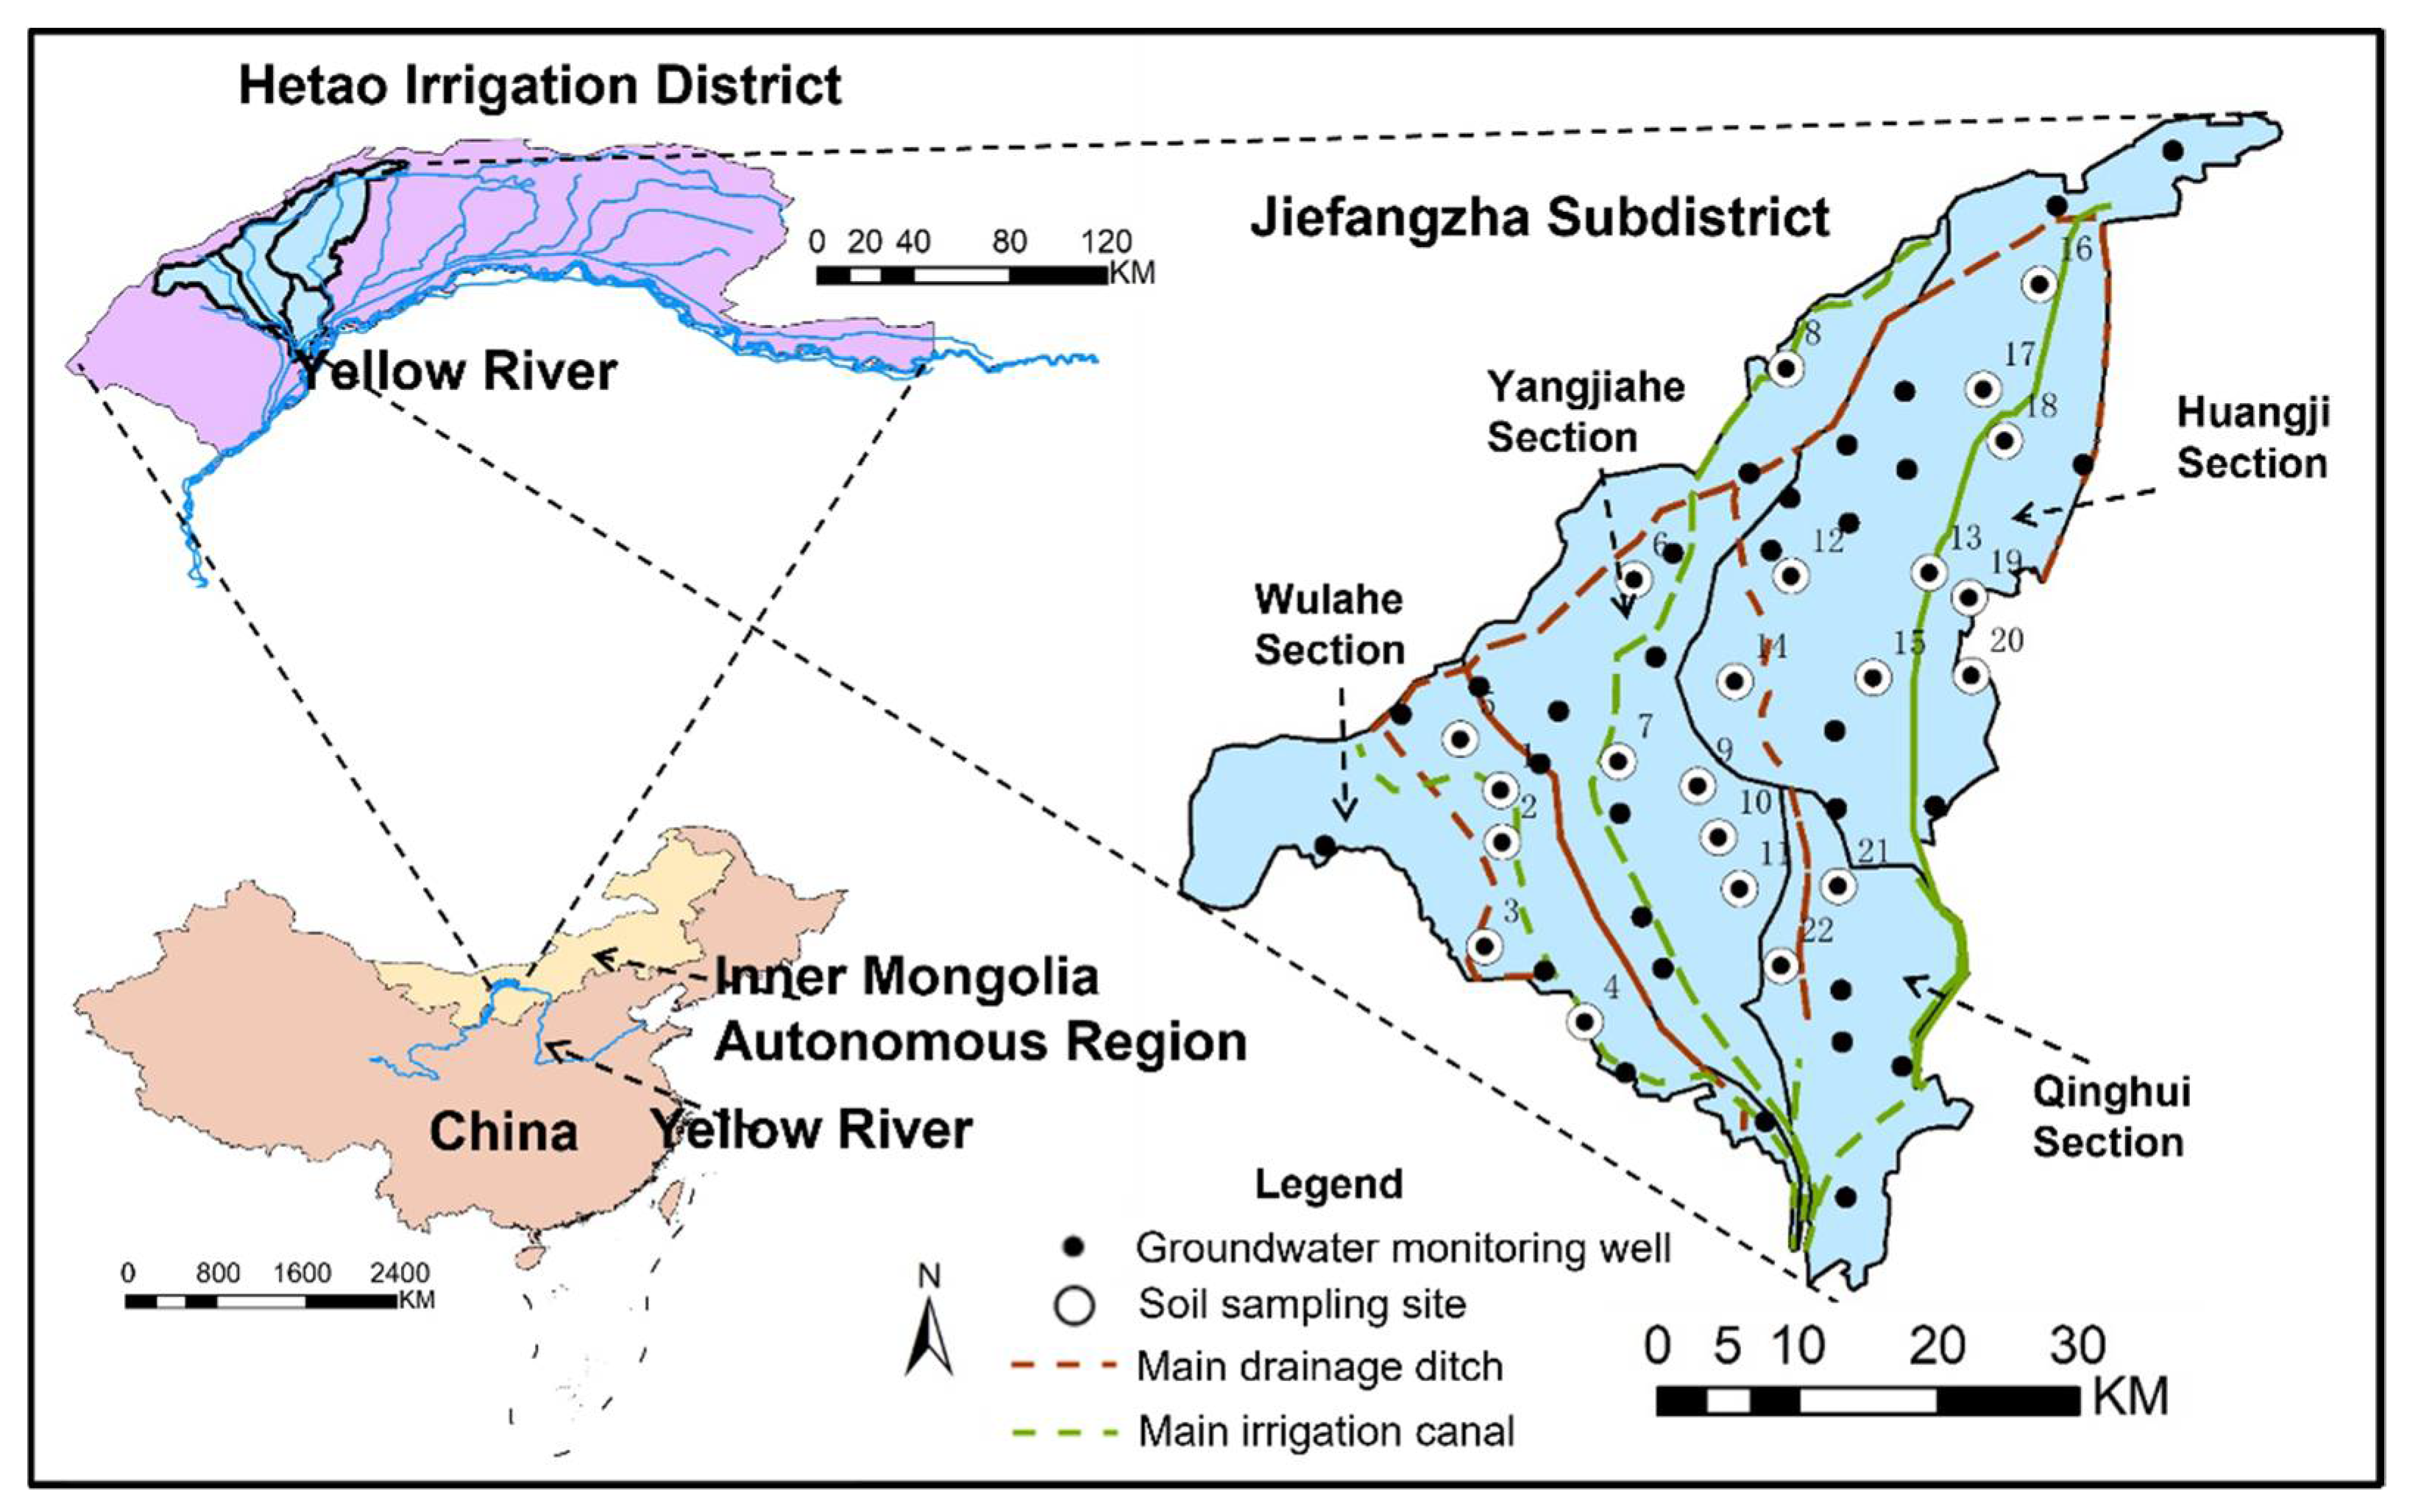
2.1. Study Area

The JFZSD (40°34′–41°14′ N, 106°43′–107°27′ E), the second-largest subdistrict in the HID, was selected as the study area (Figure 1). The JFZSD is a plane of 2157 km2 of which 66% is cropland. It has a typical arid to semi-arid continental climate [20], with an annual average temperature between 6–10 °C [35], annual average precipitation of about 155 mm of which 70% occurs from June to September, annual average sunshine of 3100–3300 h, and annual average evapotranspiration of about 2000 mm [23]. The upper JFZSD is covered with silty loam, loam, and clay loam, and the middle and lower JFZSD is covered mainly with clay loam [13]. In JFZSD, soil begins to freeze in mid-November and does not thaw completely until late April or early May the next year.
Wheat, maize, sunflower and vegetables are typical crops in the study area, whose roots mainly distributed at 0–40 cm depth [23]. The growing season of wheat, maize, sunflower and vegetables are the late March to the early August, the late April to the late September, the late May to the late September, and the early April to the late September, respectively. Most of their growing seasons ranged between mid-April to mid-September; therefore, the cropping season used in this study is defined as the period between mid-April (before the first irrigation) to mid-September (before the autumn irrigation), the exact date may vary from year to year.
The JFZSD is divided into four sections by the controlling area of the main irrigation canals: the Wulahe Canal, the Yangjiahe Canal, the Huangji Canal, and the Qinghui Canal (Figure 1). The Qinghui section is a groundwater irrigated section, where deep fresh groundwater with salinity of about 2 g/L is extracted for flood irrigation. Whereas, the other three sections are flood irrigated with water diverted from the Yellow River (1.3 billion m3/year, 0.6 g/L salinity) [21]. A total of 52 groundwater wells were drilled, randomly distributed in the four sections (Figure 1). Near 22 of the groundwater wells, 22 soil sampling sites were selected, covering the four main farmland types (wheat fields, maize fields, sunflower fields and vegetable fields) in JFZSD and randomly distributed in the four sections (Figure 1). In areas with very shallow water table depth, like our study area, the drainage is from the shallow groundwater, thus the average salinity of the drainage water is 2 g/L [36], almost the same as groundwater.

2.2. Data Availability

2.2.1. Water Table Depth and Soil Properties

From 2007 to 2016, WTD were manually measured every 5 days at the 52 groundwater observation wells (Figure 1). Soil cores were collected at croplands around 22 of the wells (soil sampling sites, Figure 1) by 3 layers: 0–10 cm, 10–20 m, and 20–40 m. Then the electrical conductivity of the 1:5 soil water extract (EC1:5, mS/cm) were measured and converted to total soluble salt (TSS, g/kg) by a local standard curve [37]: TSS = 3.42EC1:5 − 0.21 (R2 = 0.996; n =118). The percentages of sand, silt and clay of each soil sample were measured by a Mastersizer 2000 (Malvern Instruments Ltd., Malvern, UK) and the soil texture was determined using the soil texture triangle. The dry bulk density was measured by oven-drying the intact soil core at 105 °C.

2.2.2. Field Irrigation, Precipitation and Potential Crop Evapotranspiration

Due to the lack of a specific amount of field irrigation water for the very fields where the soil samples were taken, the cropping season field irrigation of the soil sampling sites was estimated by uniformly allocating the field irrigation water amount over the irrigated area of each section. The field irrigation water amount was estimated by multiplying the amount of water diverted into the section by the irrigation efficiency coefficient of the canal system, 0.49 as suggested by Liu et al. [21].
The meteorological data was collected from the nearest meteorological station, the Bayannur Linhe Meteorological Station. The daily precipitation during the cropping season was summed up to obtain the cropping season precipitation for each year which was the same for all the sites. The daily ETo was estimated from the daily average, maximum and minimum temperatures, daily average, maximum and minimum atmospherically pressures, daily average relative humidity, daily average wind speed, and latitude and longitude of each soil sampling site by the FAO-56 Penman Monteith equation [38]. The meteorological data were from the same station, and the latitudes and longitudes of all the sites were very similar, thus the same cropping season ETo was used for all the sites in each year.
The monthly variations of the most relevant meteorological factors—precipitation, average, maximum and minimum temperature, wind speed, relative humidity, and the reference evapotranspiration (ETo) from 2007 to 2016 are shown in Figure 2. Note that in order to plot the meteorological factors in the same graph, the precipitation is expressed in millimeters (mm), while the reference evapotranspiration (ETo) is expressed in centimeters (cm). Overall, during the cropping season, i.e., from April to September, the average temperature, precipitation, and ETo were 19.29 ± 3.16 °C, 20.53 ± 5.19 mm, 164.44 ± 29.18 mm, respectively; while from October to March, they were −1.69 ± 6.54 °C, 2.94 ± 2.28 mm, 53.01 ± 25.34 mm, respectively. In general, the wind speed was stable with an average of 2.15 m/s and relative humidity was 46%. The relative humidity decreased as the temperature rose (from January to May), but during the cropping season, the relative humidity remained high due to precipitation and irrigation.
The potential crop evapotranspiration (ETc) was obtained by multiplying the ETo by the crop coefficient Kc suggested by FAO-56 [38]. Note that since there were four types of main crops—wheat, maize, sunflower and vegetables, the Kc on each day during the cropping season was the area-weighted average of the Kc of the four main crops:
K c , d = K c , d , r A r A r
where Kc,d is the crop coefficient on day d, Kc,r is the crop coefficient of crop r (r = wheat, maize, sunflower or vegetables) on day d, and Ar is the cropping area of crop r in the JFZSD. Note that for the days before the initial stage or after the end of the late season stage of a crop, the Kc,d,r was assumed to be the Kc,d,r during the initial stage of that crop. In different years, the cropping area of crop r in the JFZSD (Ar) was different, thus, the Kc,d was different.

2.3. Data Analysis

2.3.1. Salt Accumulation and Water Table Depth

The total soluble salt in the 0–40 cm soil layer at a site, Salti,j,k (g/kg), was estimated by taking the thickness weighted average of the total soluble salt in the 0–10 cm, 10–20 cm and 20–40 cm soil layers at that site:
S a l t i , j , k = S a l t i , j , k 0 40 = 10 S a l t i , j , k 0 10 + 10 S a l t i , j , k 10 20 + 20 S a l t i , j , k 20 40 10 + 10 + 20
where i is the index for n = 22 soil sampling sites, j is the index for the year; and k is the index for soil sampling time, 1–6 denotes the soil sampling before the first to the sixth irrigation and 7 denotes the soil sampling before the autumn irrigation.
The salt accumulated in the cropping season in each year at each soil sampling site, Salti,j, was the difference between the total soluble salt in the 0–40 cm soil layer at that site before the autumn irrigation at that year, Salti,j,7, and the total soluble salt in the 0–40 cm soil layer at that site before the first irrigation at that year, Salti,j,1:
S a l t i , j = S a l t i , j , 7 S a l t i , j , 1
Note that each of the problematic or missing Salti,js was substituted by (Salti,j-1 + Salti,j-1)/2. The 10-year total accumulated salt in the cropping season at each soil sampling site, Salti, was the summation of that in each year:
S a l t i = j = 2007 2016 S a l t i ,   j
The salt accumulated in the cropping season in each year in section c, Saltc,j, was the average of that at all the sites within the section, S a l t ¯ c , i , j .
Likely, the 10-year average cropping season WTD at each well was the average of that in each year, W T D l = W T D ¯ l , j , where l is the index for m = 52 groundwater wells, j is the index for the year. Note that the cropping season WTD in year j at well l was the average WTD at well l from the date of soil sampling before the first irrigation in year j to the date of soil sampling before the autumn irrigation in year j. The average cropping season WTD in each year in section c was the average of cropping season WTD in that year at all the groundwater wells within that section, W T D c , j = W T D ¯ c , l , j .

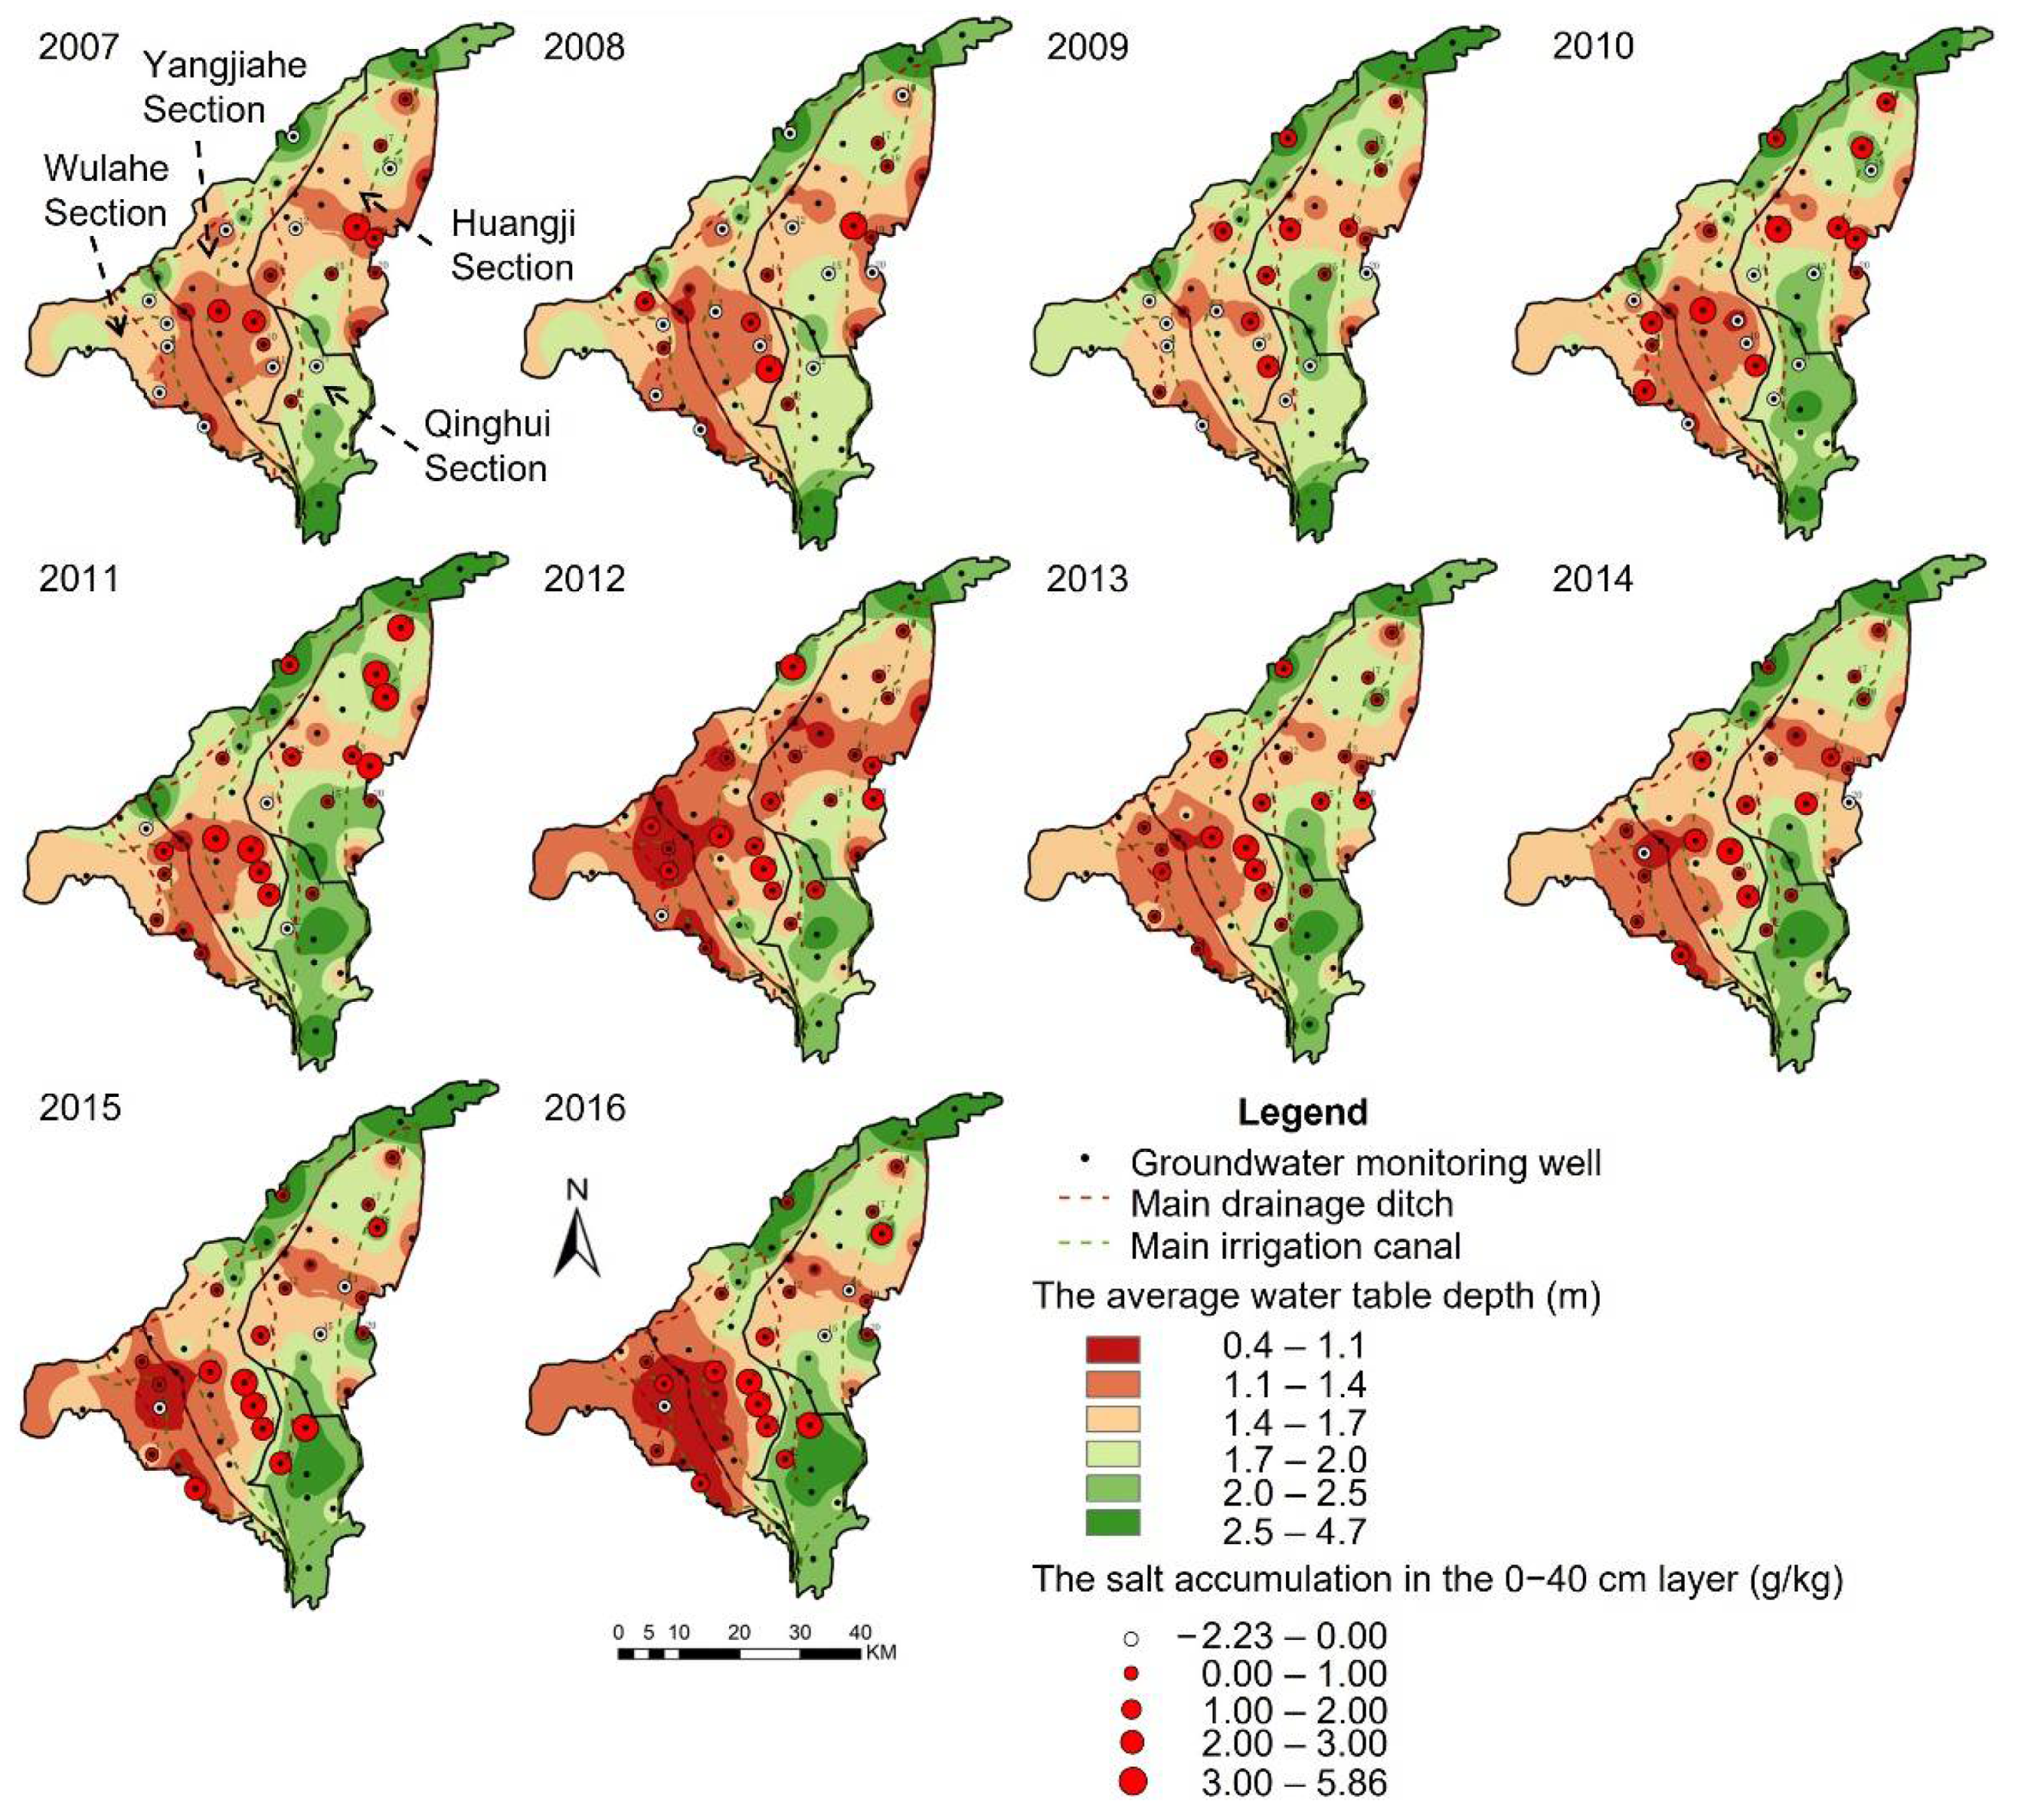
2.3.2. Spatial Distribution of the Water Table Depth

The spatial distribution of the average cropping season WTD in each year was obtained by the inverse distance weighted (IDW) interpolation [39,40] using ArcGIS 10.4.1. The IDW interpolation assumes that the attribute value (e.g., average WTD and average change rate of WTD) of an unknown point o ( y ^ (So)) is the weighted average of that of h (h = 12 in this study) neighboring sampled points p (y(Sp)). The weights (λp) are inversely related to the distances between the unknown point and the sampled points (dop). A distance-decay parameter α (α = 2 in this study) adjusts the decreasing strength of the inverse-distance weight with increasing distance [41,42].
y ^ ( S o ) = p = 1 h λ p y ( S p ) , λ p = d o p α p h d o p α ,   p h λ p = 1

2.3.3. Factors Influencing Salt Accumulation

The relationships between the salt accumulated in the cropping season and the three influencing factors—cropping season I + P, cropping season ETc, cropping season WTD—at each soil sampling site in each year were analyzed, after eliminating the outliers, for example, the groundwater irrigated sites.
Due to the complicated interrelationships between the salt accumulated in the cropping season and the three influencing factors, grey relational analysis [43] was performed to rank their contributions. Firstly, the four variables were normalized, so-called grey relational generating [44]. The accumulated salt and ETc were the smaller the better; therefore, each of them was normalized by subtracting from its maximum value and then divided by the difference between its maximum and minimum values. Whereas, the I + P and WTD (in the WTD range of the study area) were the larger the better, therefore, each of them was normalized by subtracting its minimum value and then divided by the difference between its maximum and minimum values. The normalized salt accumulation is now the reference sequence Xo = (xo1, xo2, …, xoq, …, xoN) for q = 1, 2, …, N, and the normalized ETc, I + P and WTD are the three comparability sequences XK = (xK1, xK2, …, xKq, …, xKN) for K = 1, 2, 3. Note that q = 1, 2, …, N denotes all the 22 soil sampling sites in the 10 years, excluding outliers. Then, the grey relational coefficients between each comparability sequence and the reference sequence [44] is calculated as:
γ ( x o q ,   x K q ) = Δ m i n + ζ Δ m a x Δ K q + ζ Δ m a x   for   K = 1 ,   2 ,   3 ;   q = 1 ,   2 ,   ,   N
where Δ K q = | x o q x K q | , Δ m i n = M i n { Δ K q } , Δ m a x = M a x { Δ K q } , and ζ [ 0 ,   1 ] is the distinguishing coefficient which is set to 0.5 here.
Assigning all the grey relational coefficients the same weight, the grey relational grade between a comparability sequence and the reference sequence is the average of its grey relational coefficients. The rank of the grey relational grade is the rank of similarities between the comparability sequences and the reference sequence.

3. Results

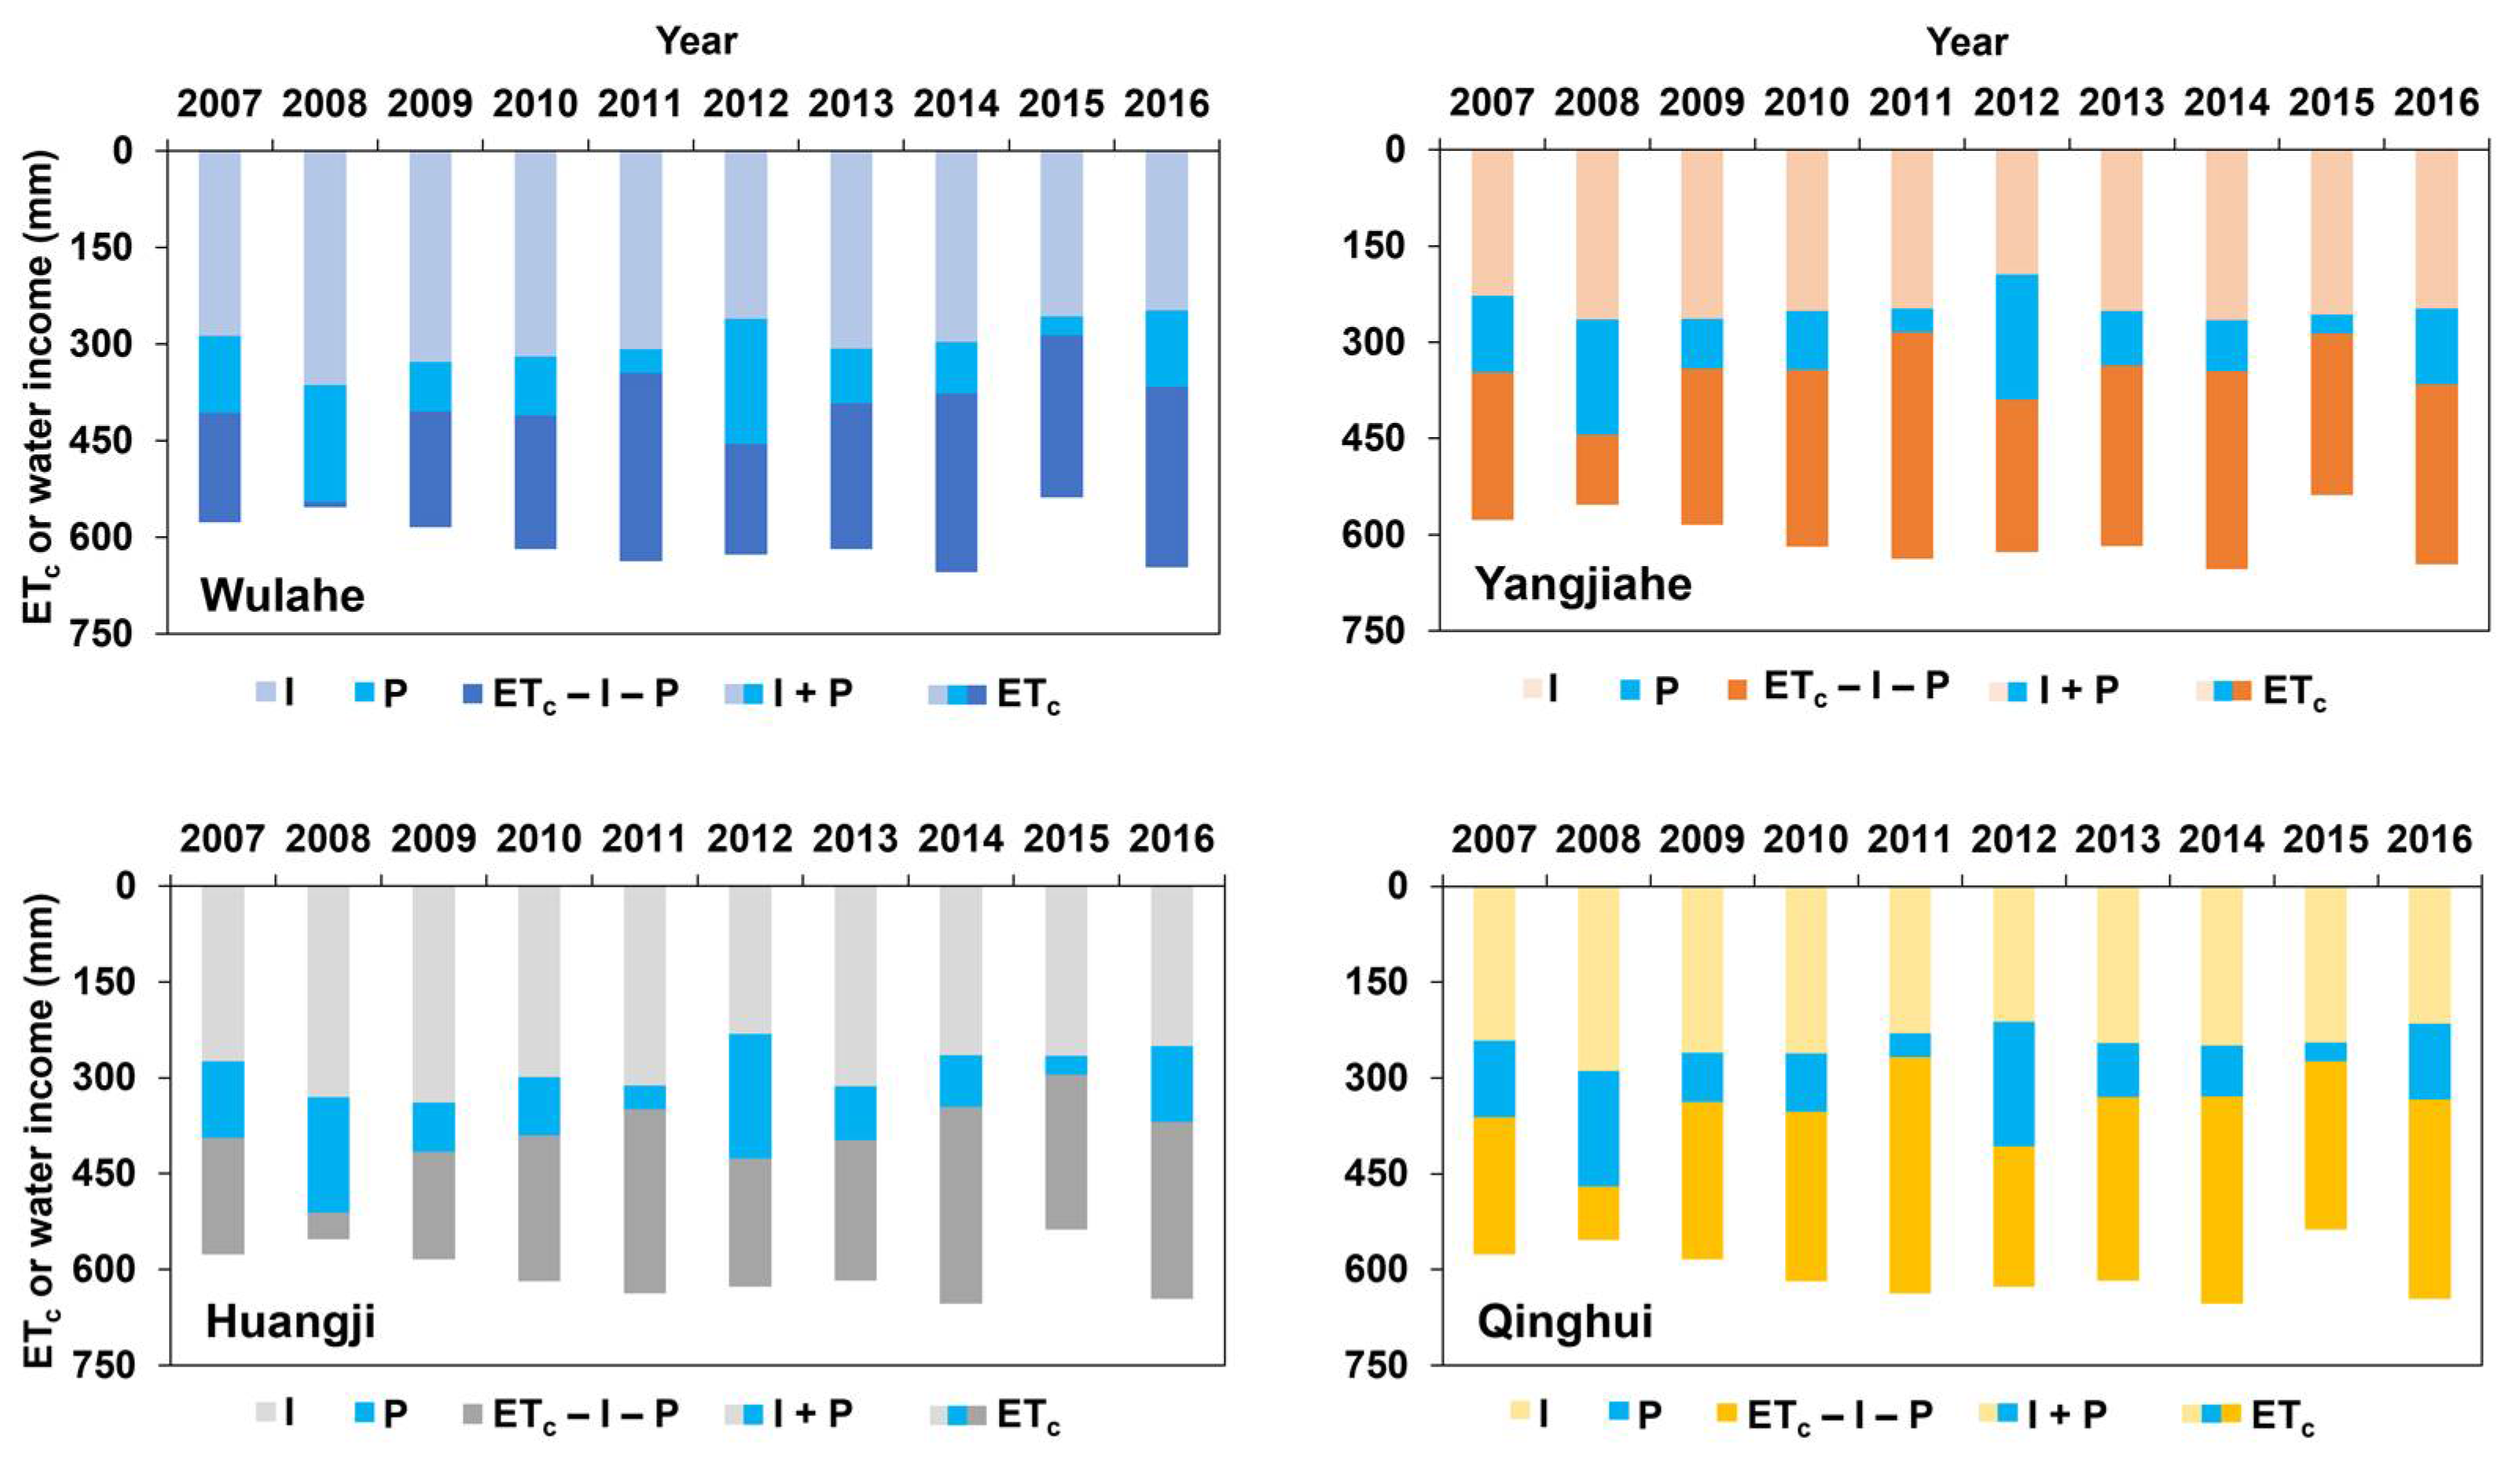
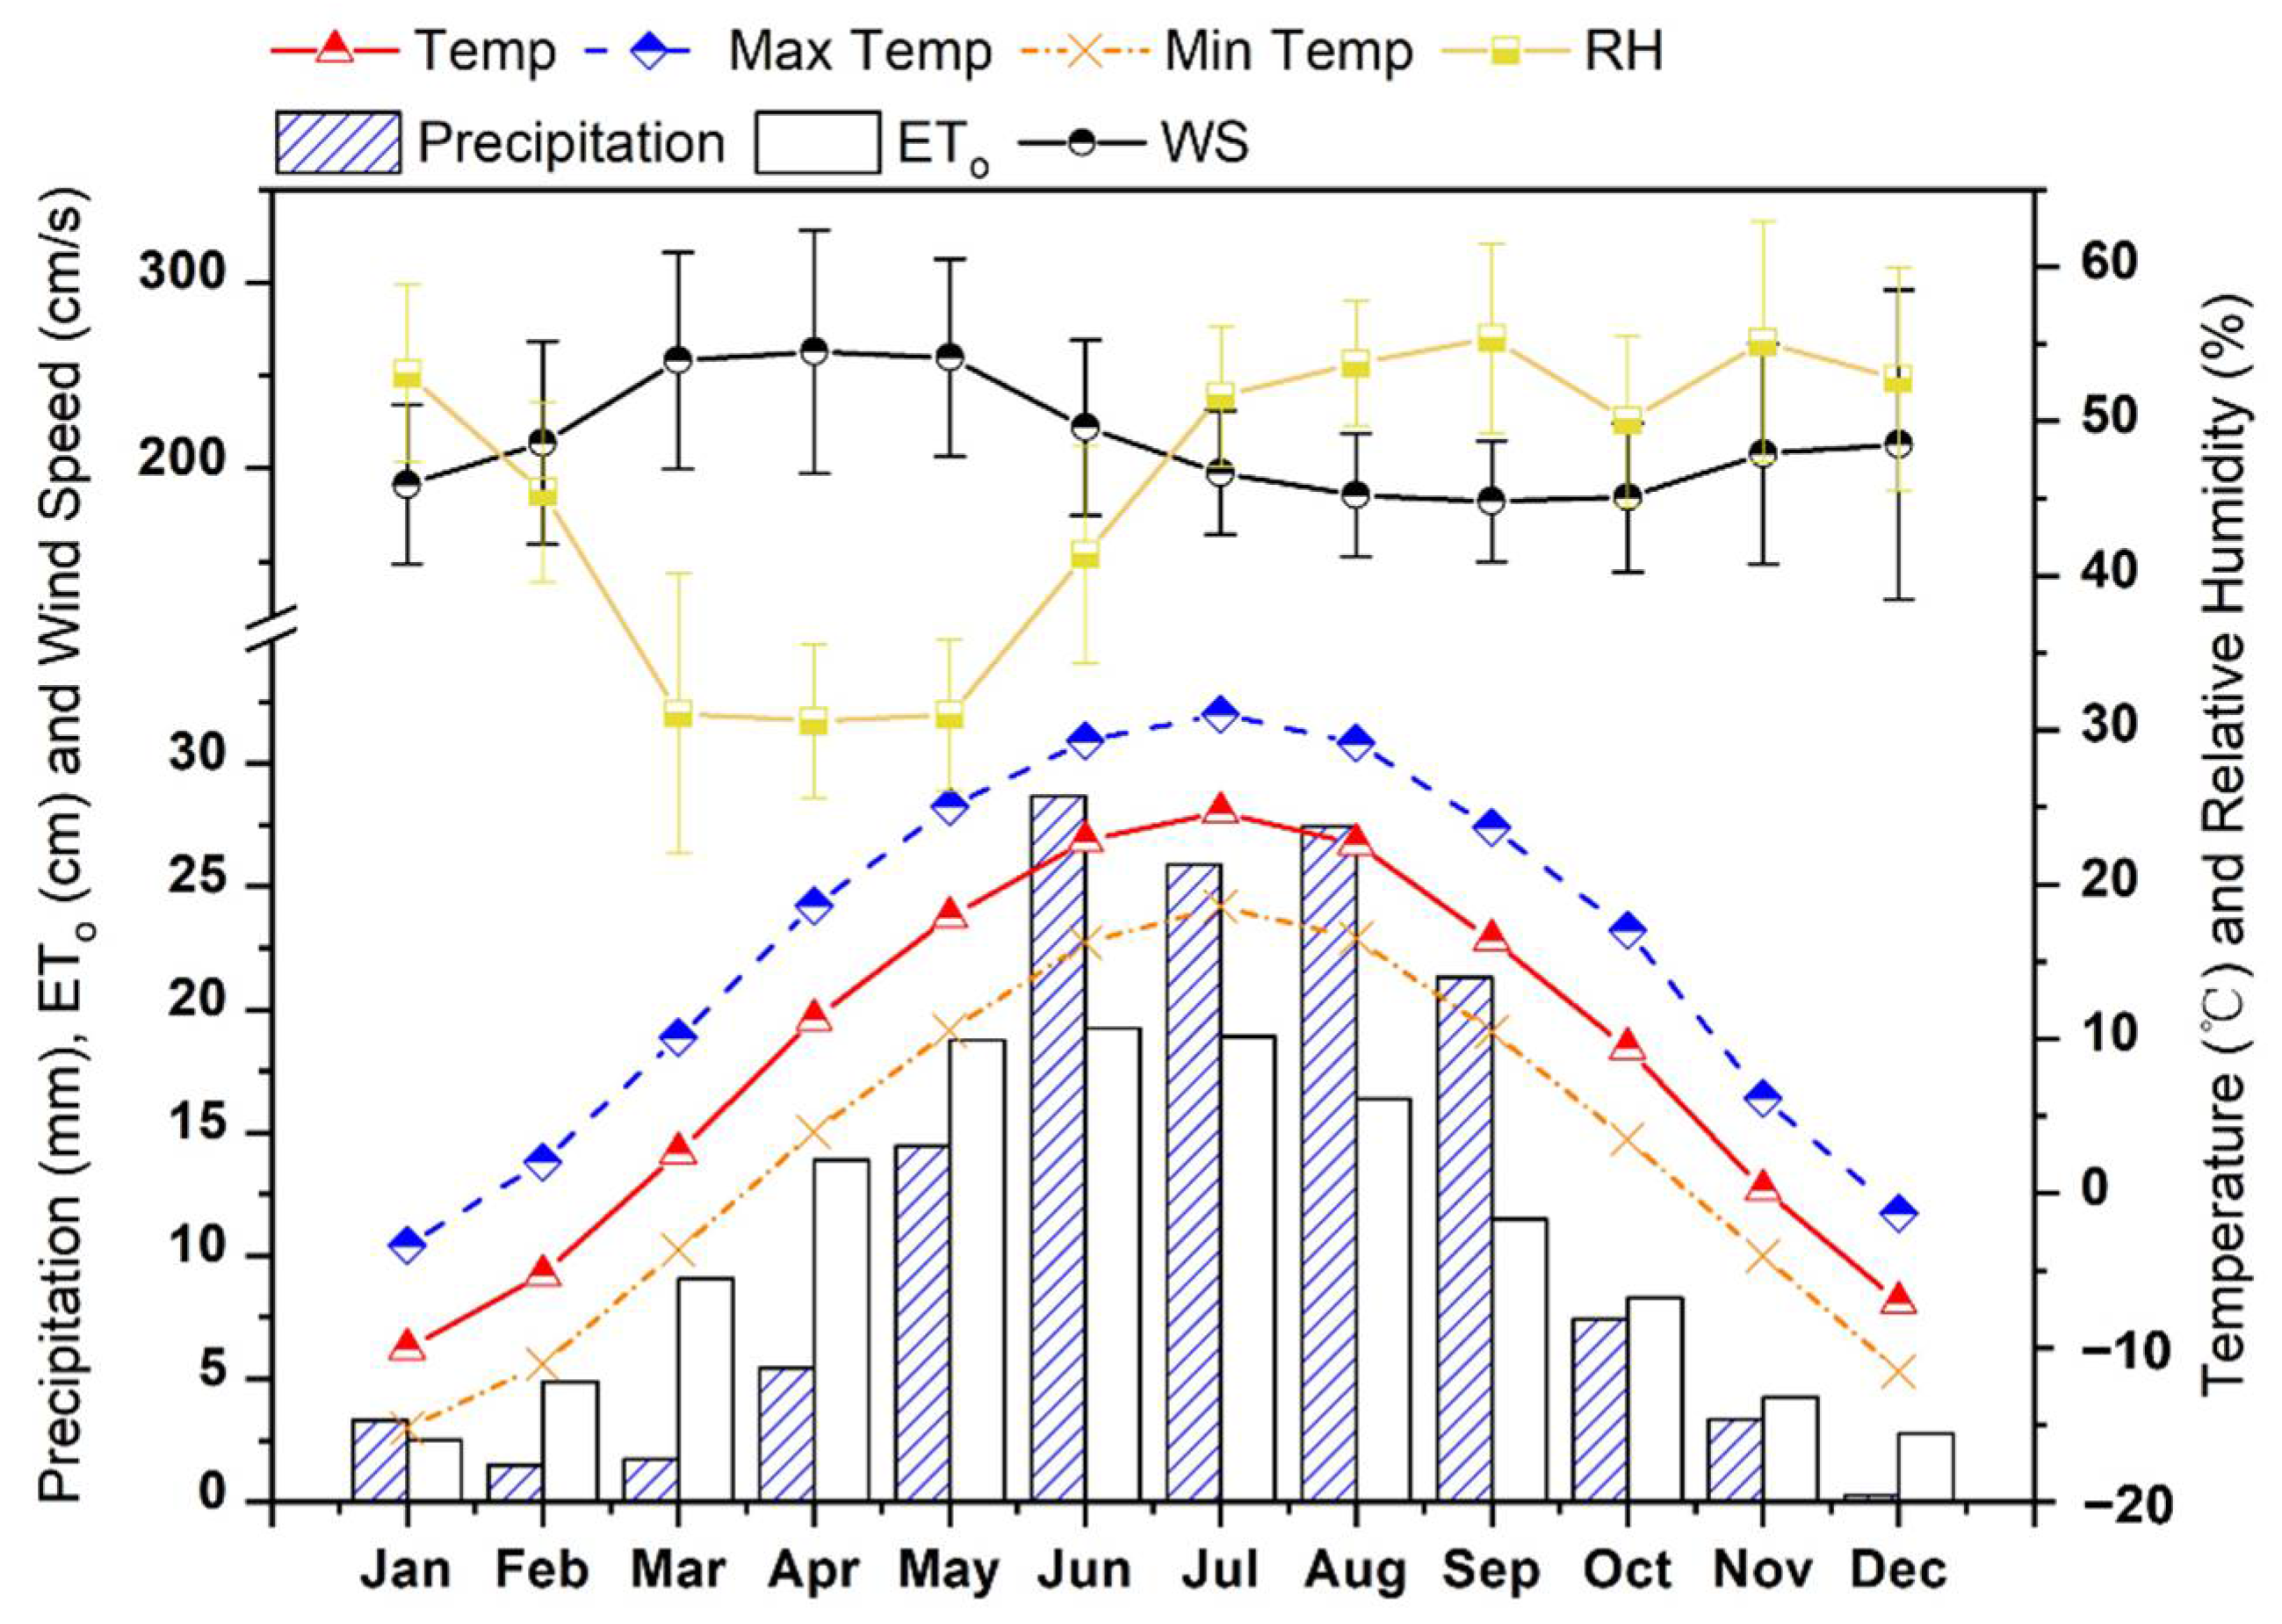
3.1. Cropping Season Climatic Factors and Field Irrigation

The cropping season precipitation (P) and potential crop evapotranspiration (ETc) were from the meteorological data, and, therefore, they are the same for all the four sections in the same year; whereas, the field irrigation (I) and, consequently, the I + P and ETc − I − P was different at different sections (Figure 3). During the 10-year investigation period, neither the precipitation nor the ETc showed clear increasing or decreasing trend, which means that this area did not become dryer or wetter. The field irrigation during the 10 years was decreasing in Wulahe, Huangji and Qinghui, but it did not change significantly in Yangjiahe. Wulahe received the largest amount of irrigation water, followed by Huangji; Yangjiahe and Qinghui received similar amount of irrigation water, but one from the Yellow River and the other from deep groundwater. Superimposed with precipitation, the resulting total water input (I + P) was decreasing in all four sections, with a primary peak in 2008, a secondary peak in 2012 and a tertiary peak in 2016. Given that the ETc peaked in 2011, 2014 and 2016, the water deficit (ETc − I − P), representing the potential driving force pulling water and dissolved salt upward, was the lowest in 2008, the highest in 2011, 2014 and 2016 in all the sections.

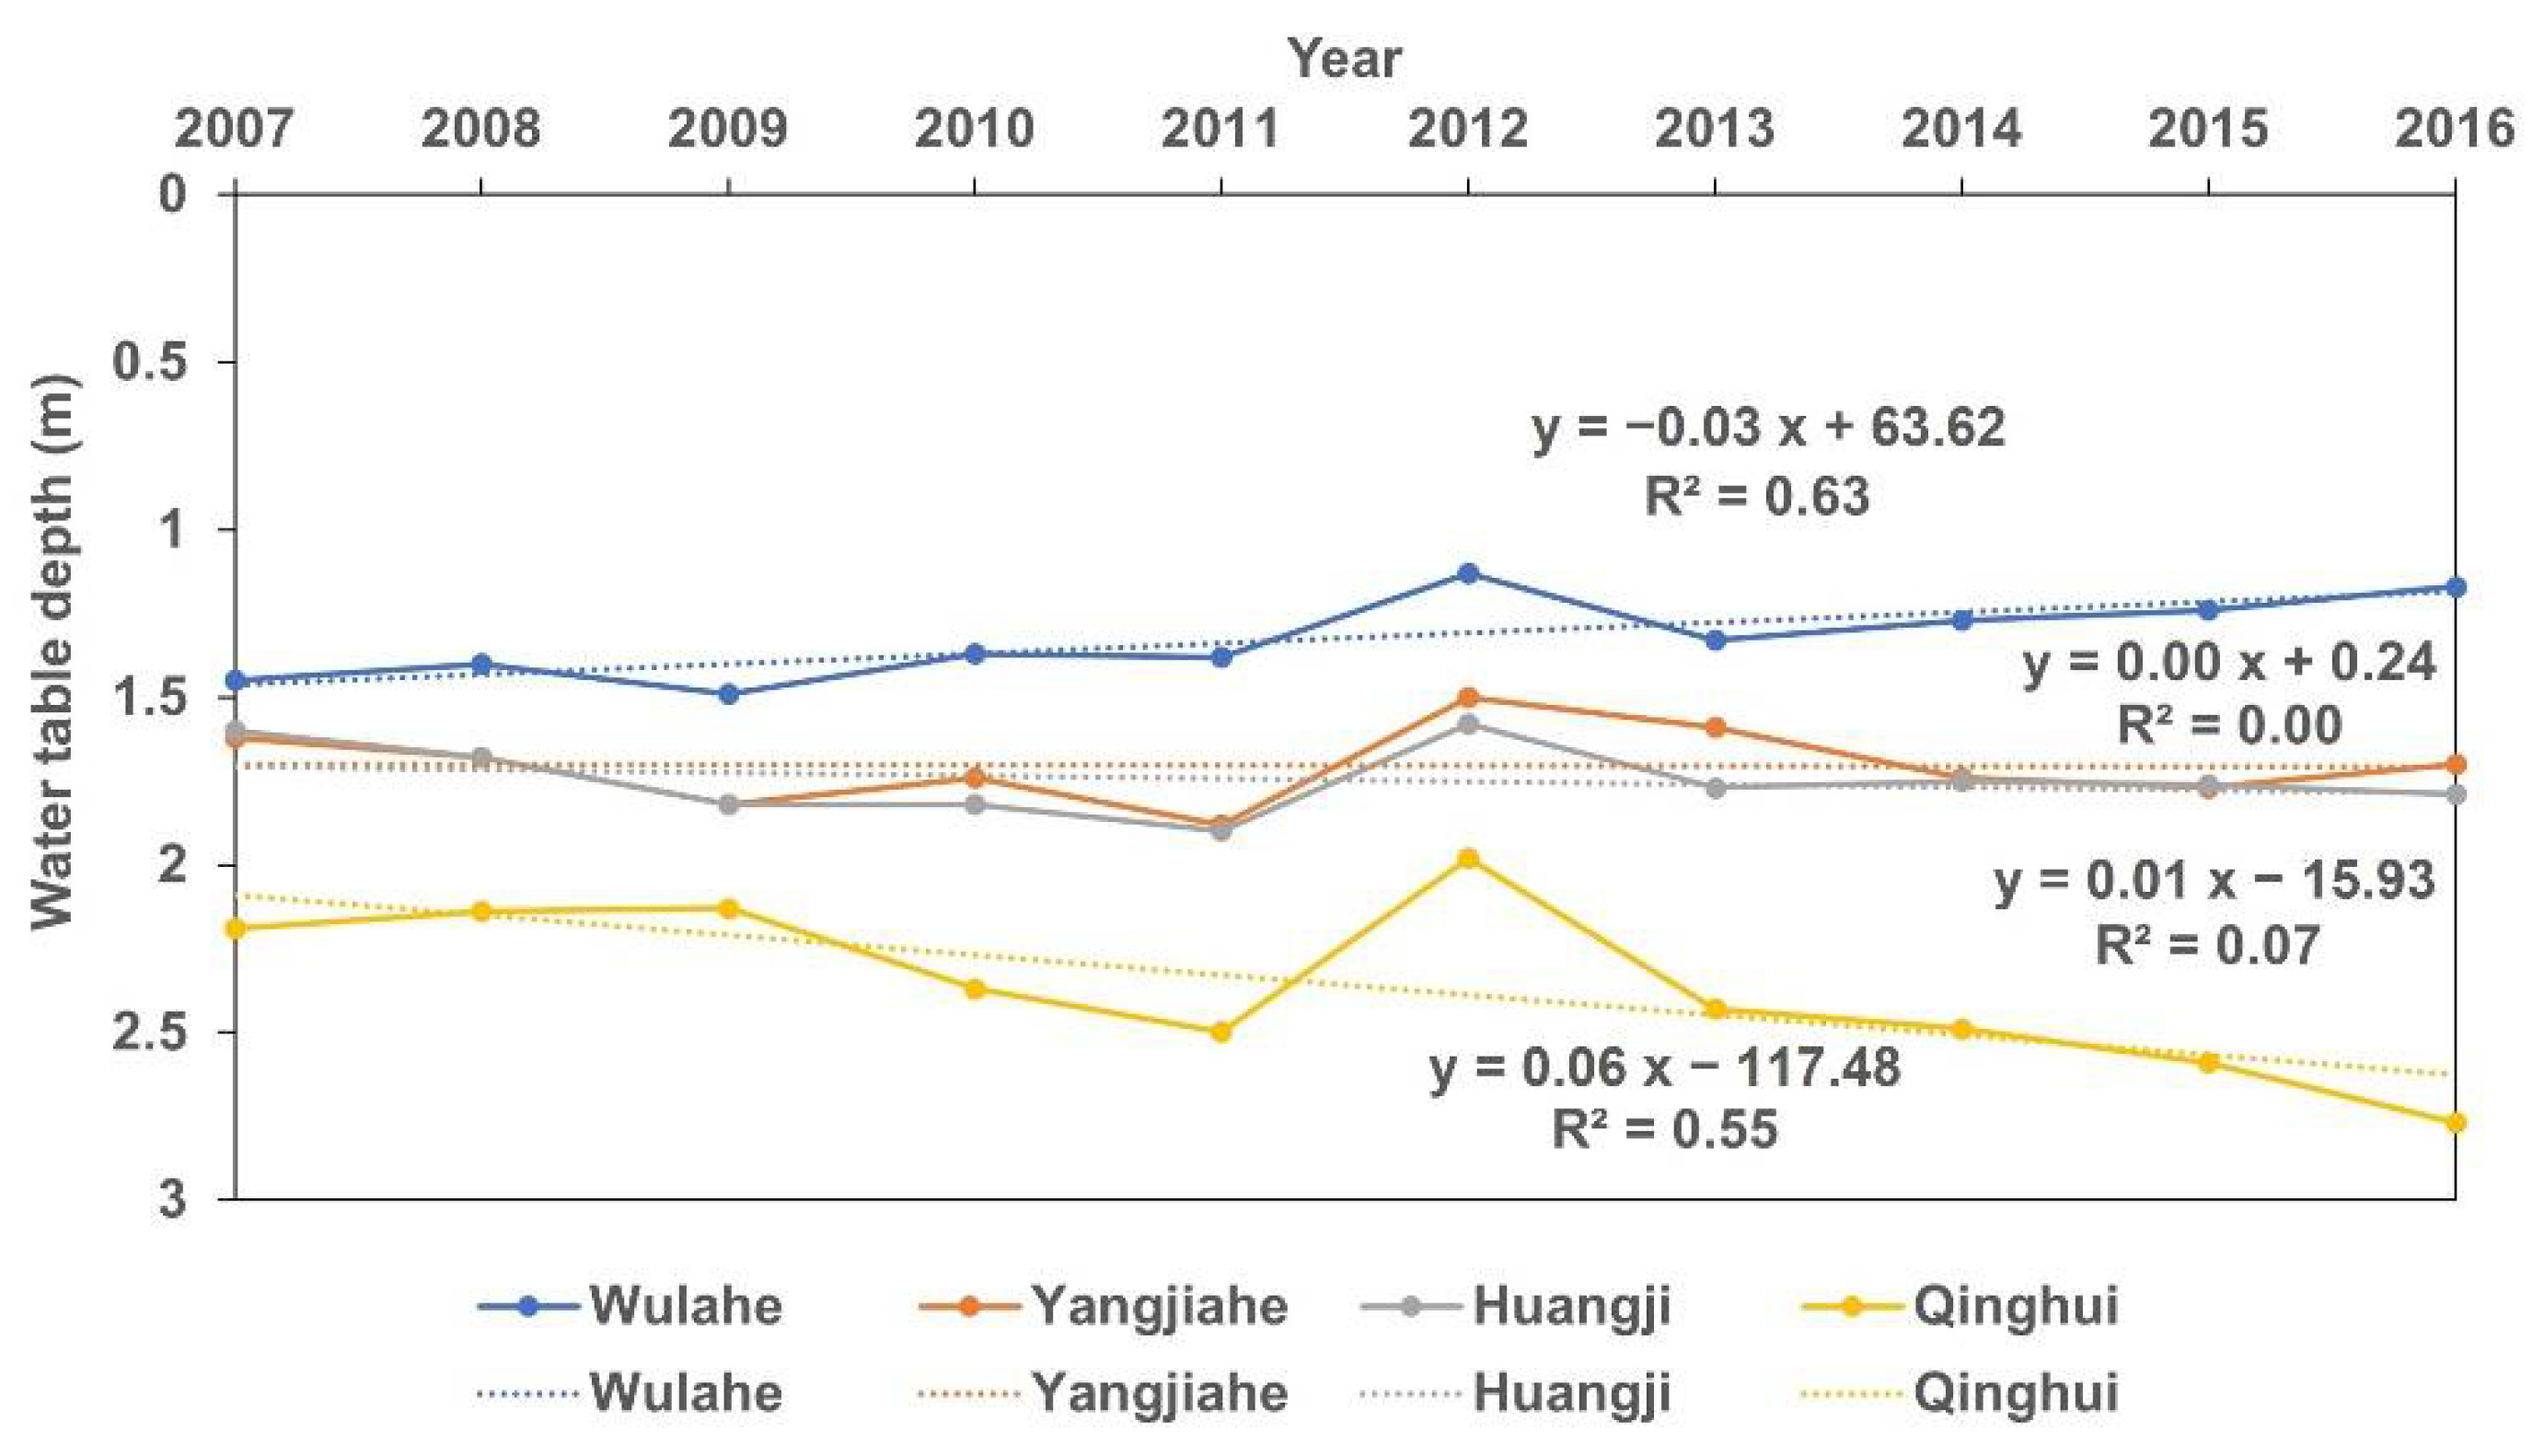
3.2. Cropping Season Water Table Depth

The cropping season water table depth decreased in Wulahe due to the large amount of irrigation, increased in Qinghui due to the extraction of groundwater for irrigation, and did not change much in Yangjiahe and Huangji during the 10 years (Figure 4 and Figure 5). Note that the water table was the shallowest for all four sections in 2012 (Figure 4 and Figure 5), which was due to a 50-year storm event. The water table was the deepest in Qinghui (2.0–4.7 m), the groundwater irrigated section. It was the shallowest in Wulahe (0.4–1.7 m in most areas) (Figure 5). In most parts of Yangjiahe and Huangji, the water table was shallower than 2.0 m; only along the northern boundary of these two sections and the southern boundary of Huangji adjacent to Qinghui, the water table was deeper than 2.0 m.

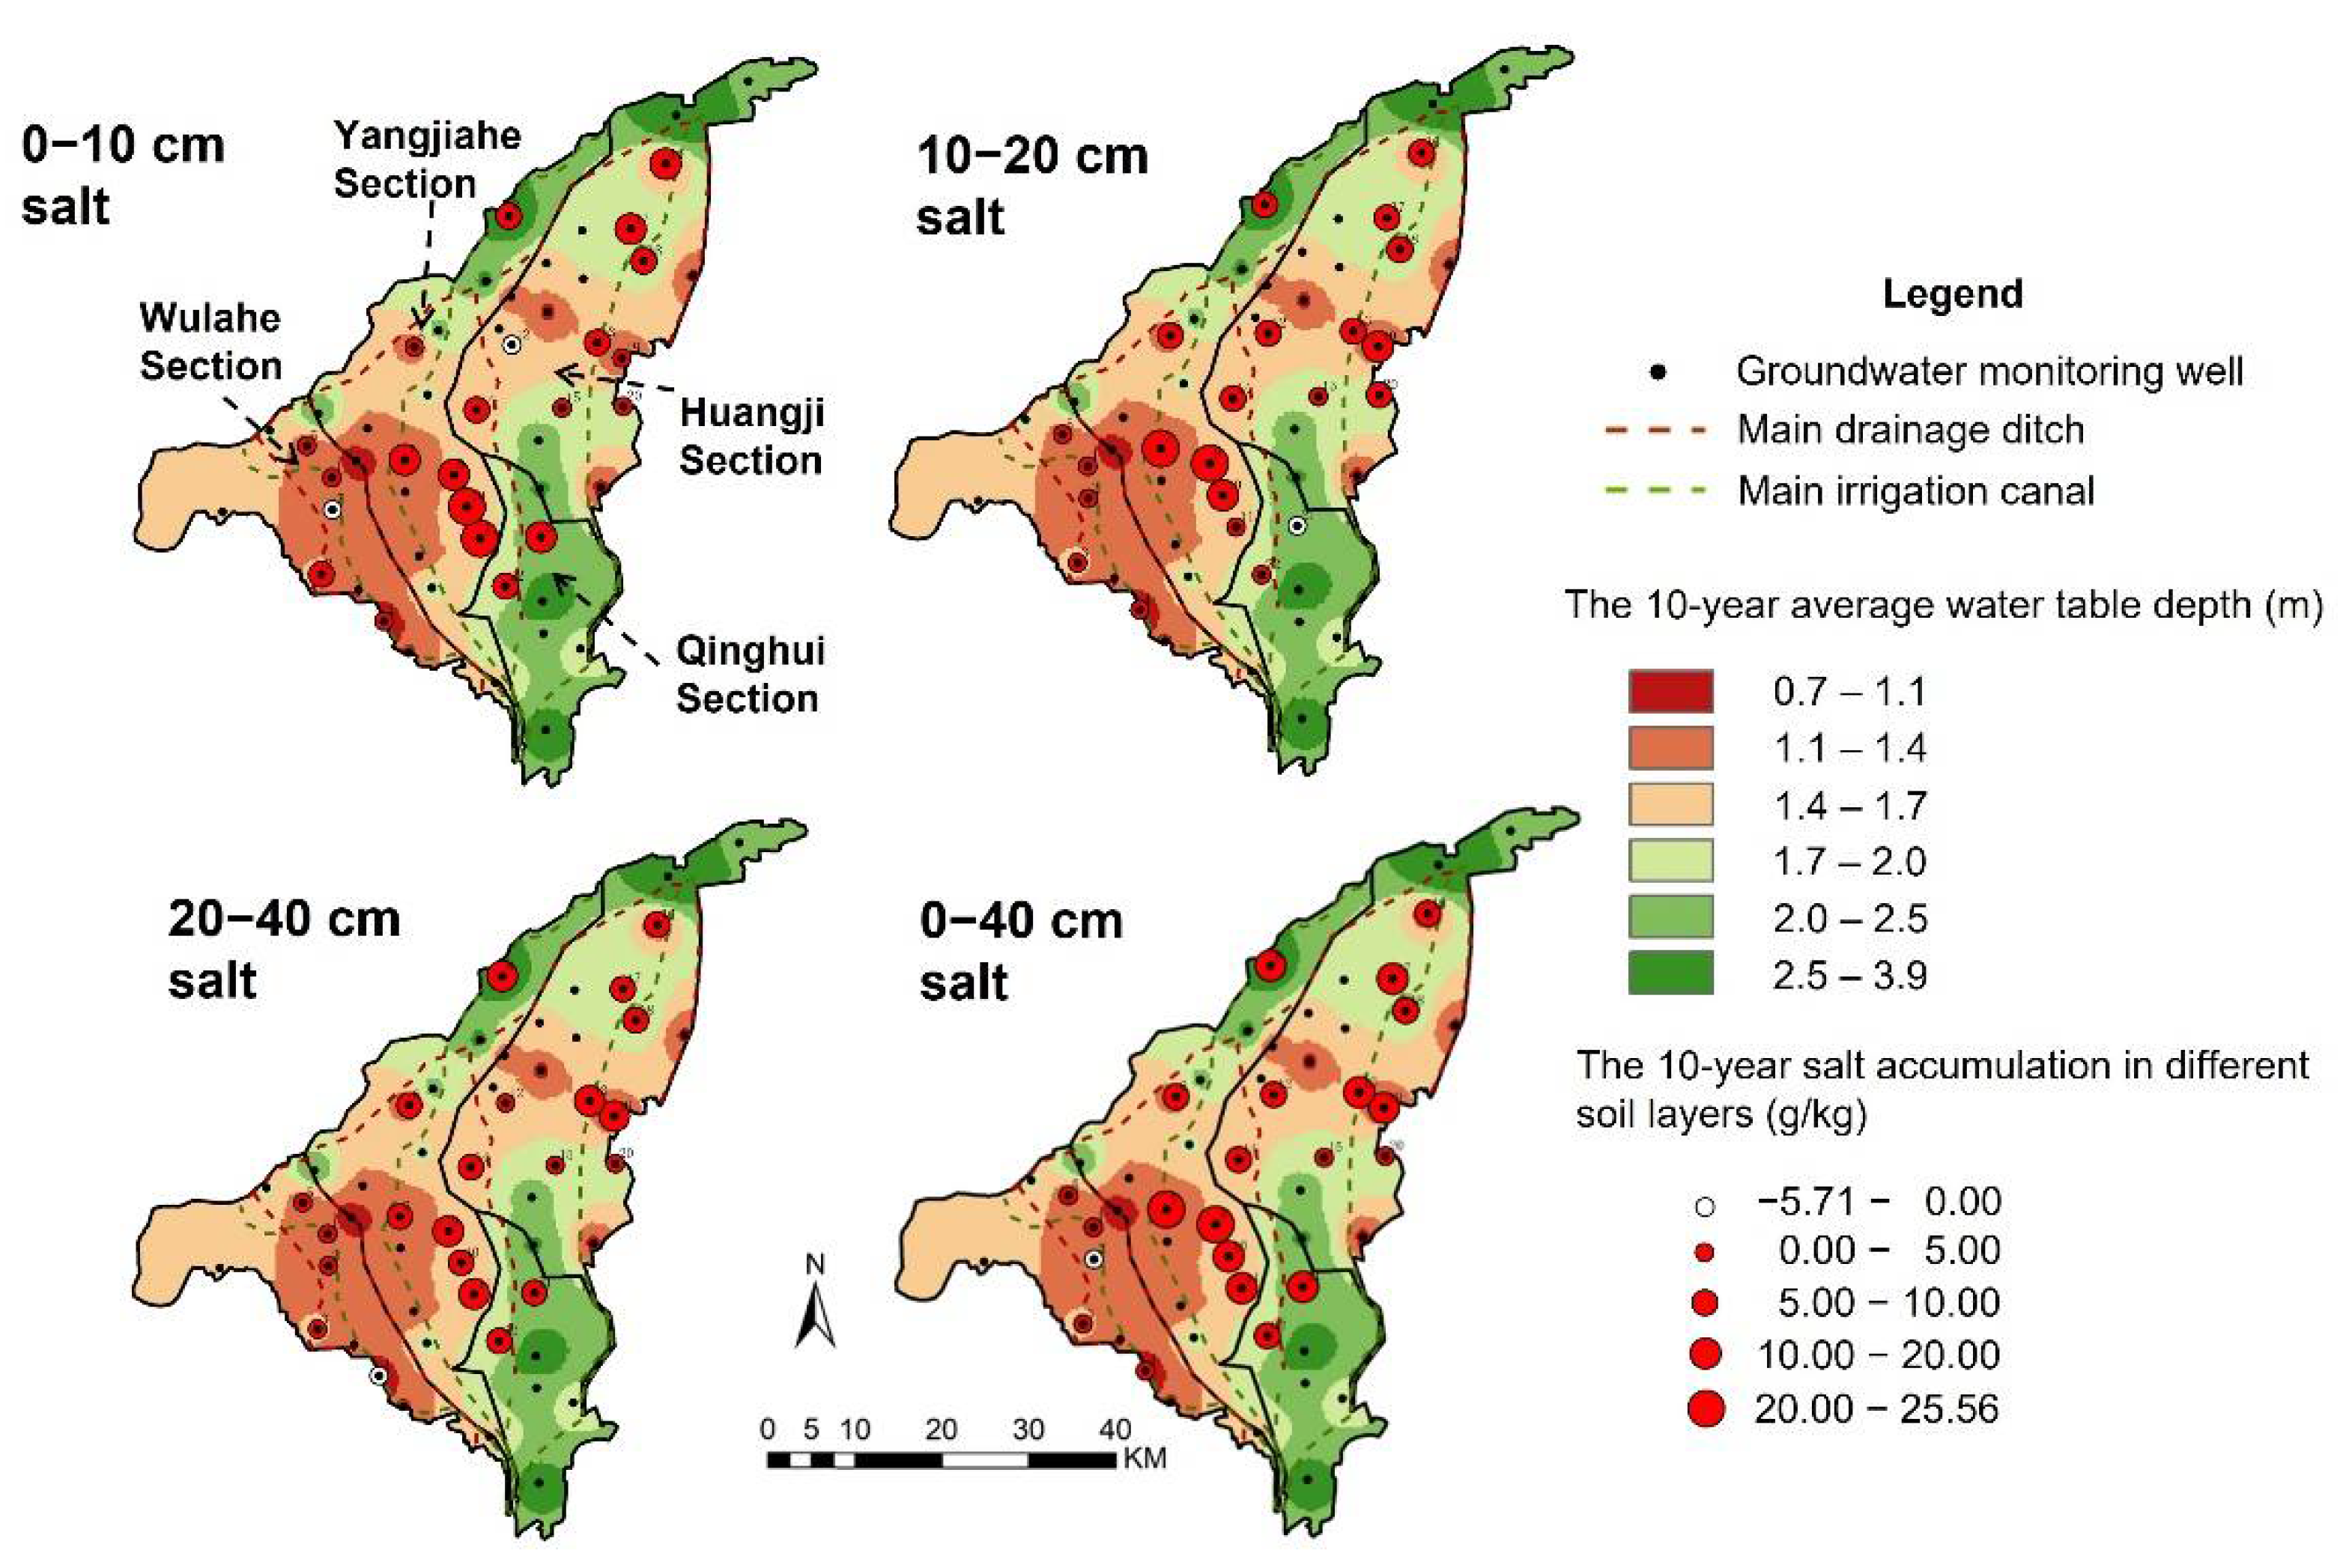
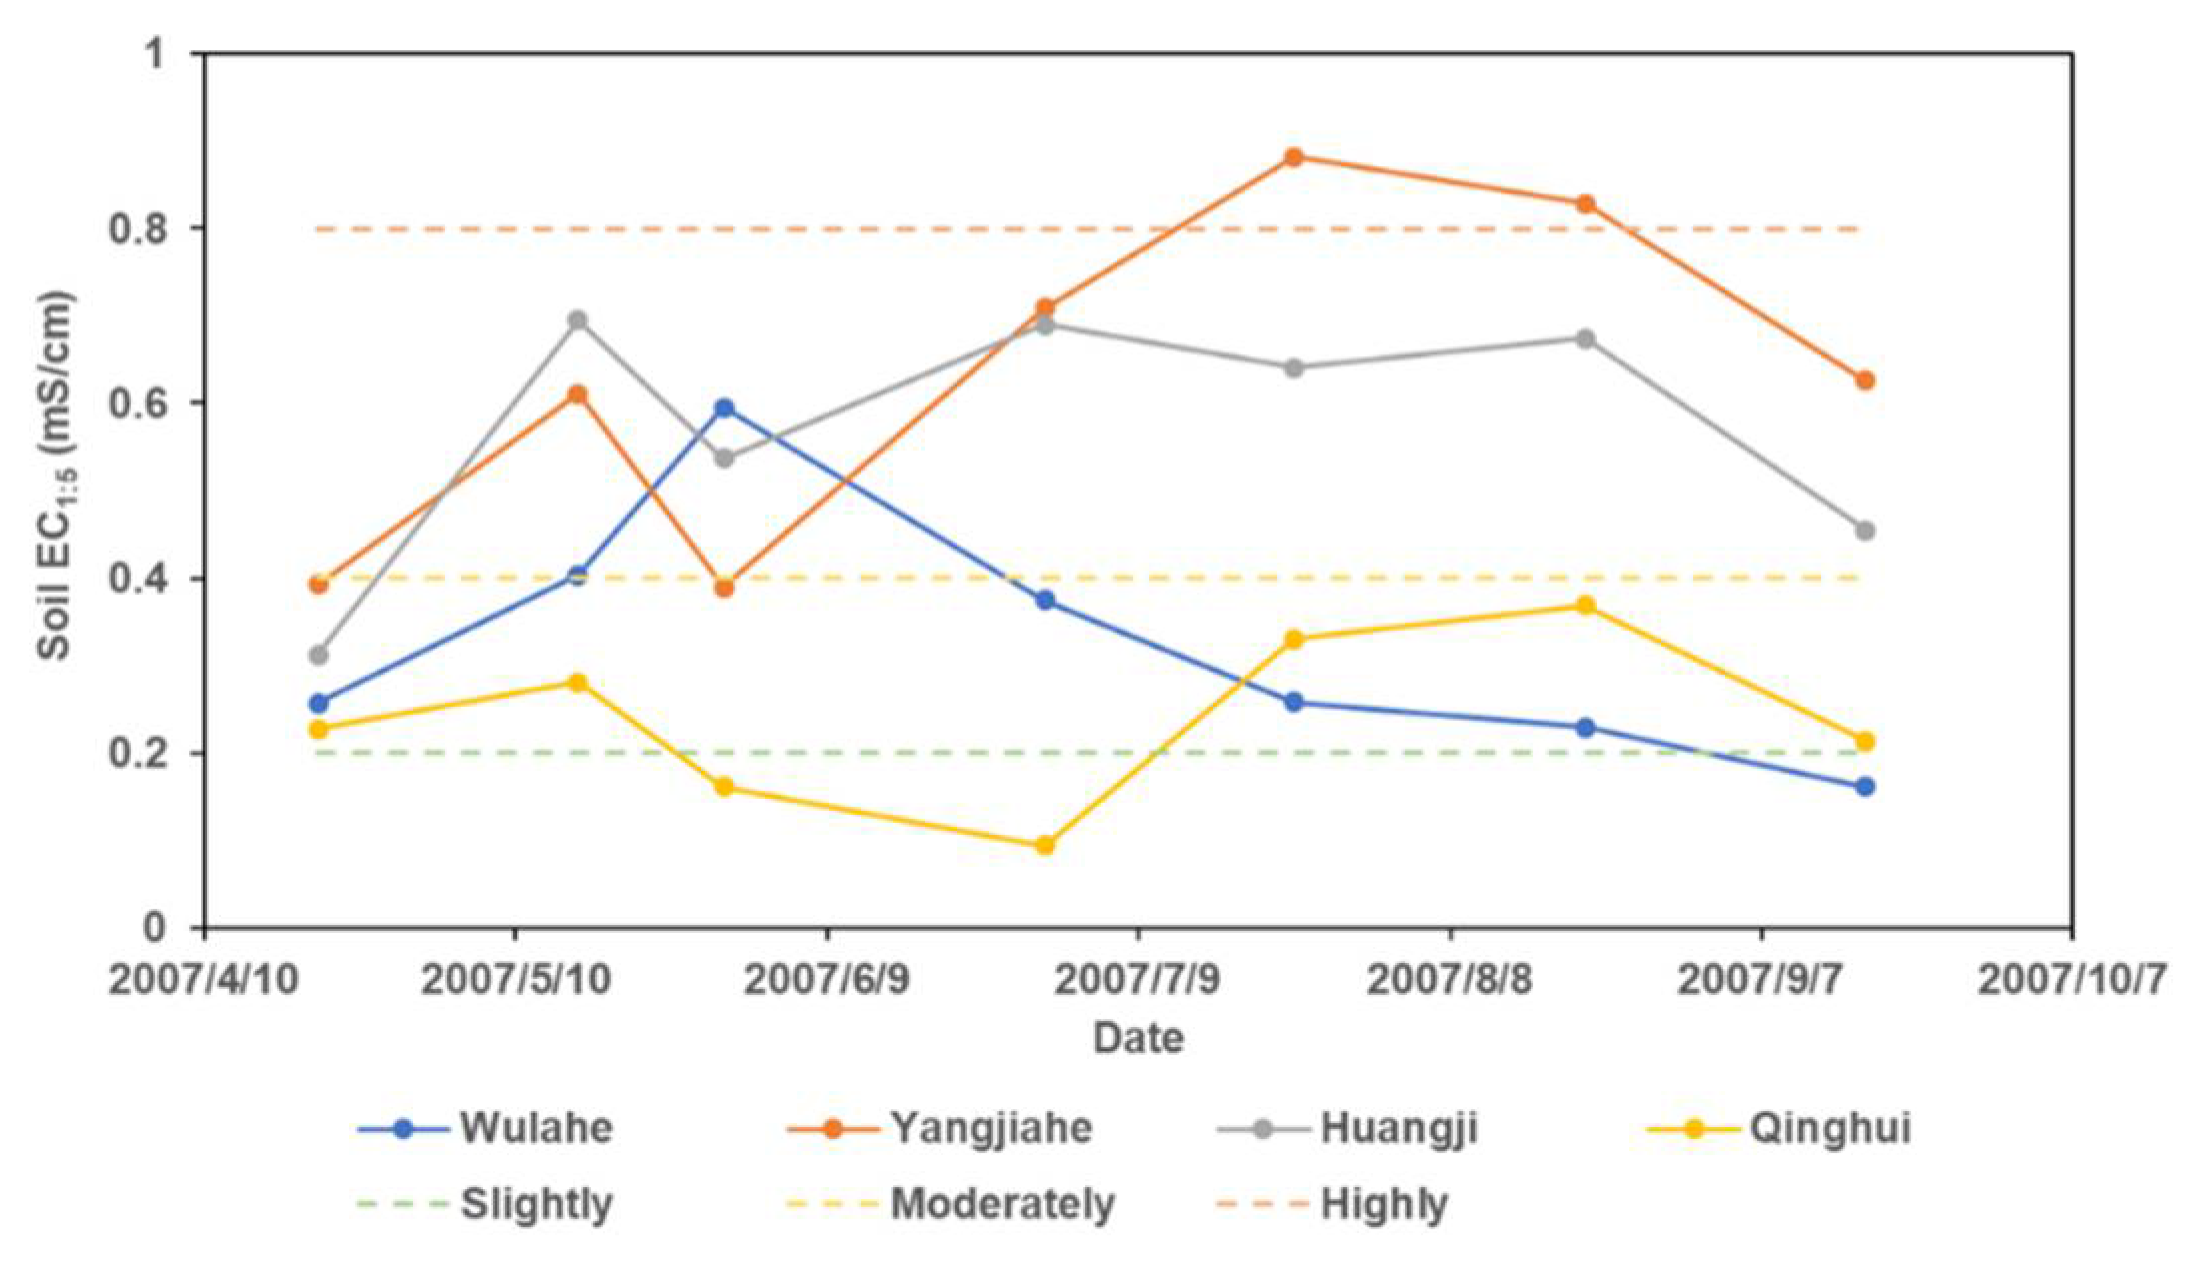
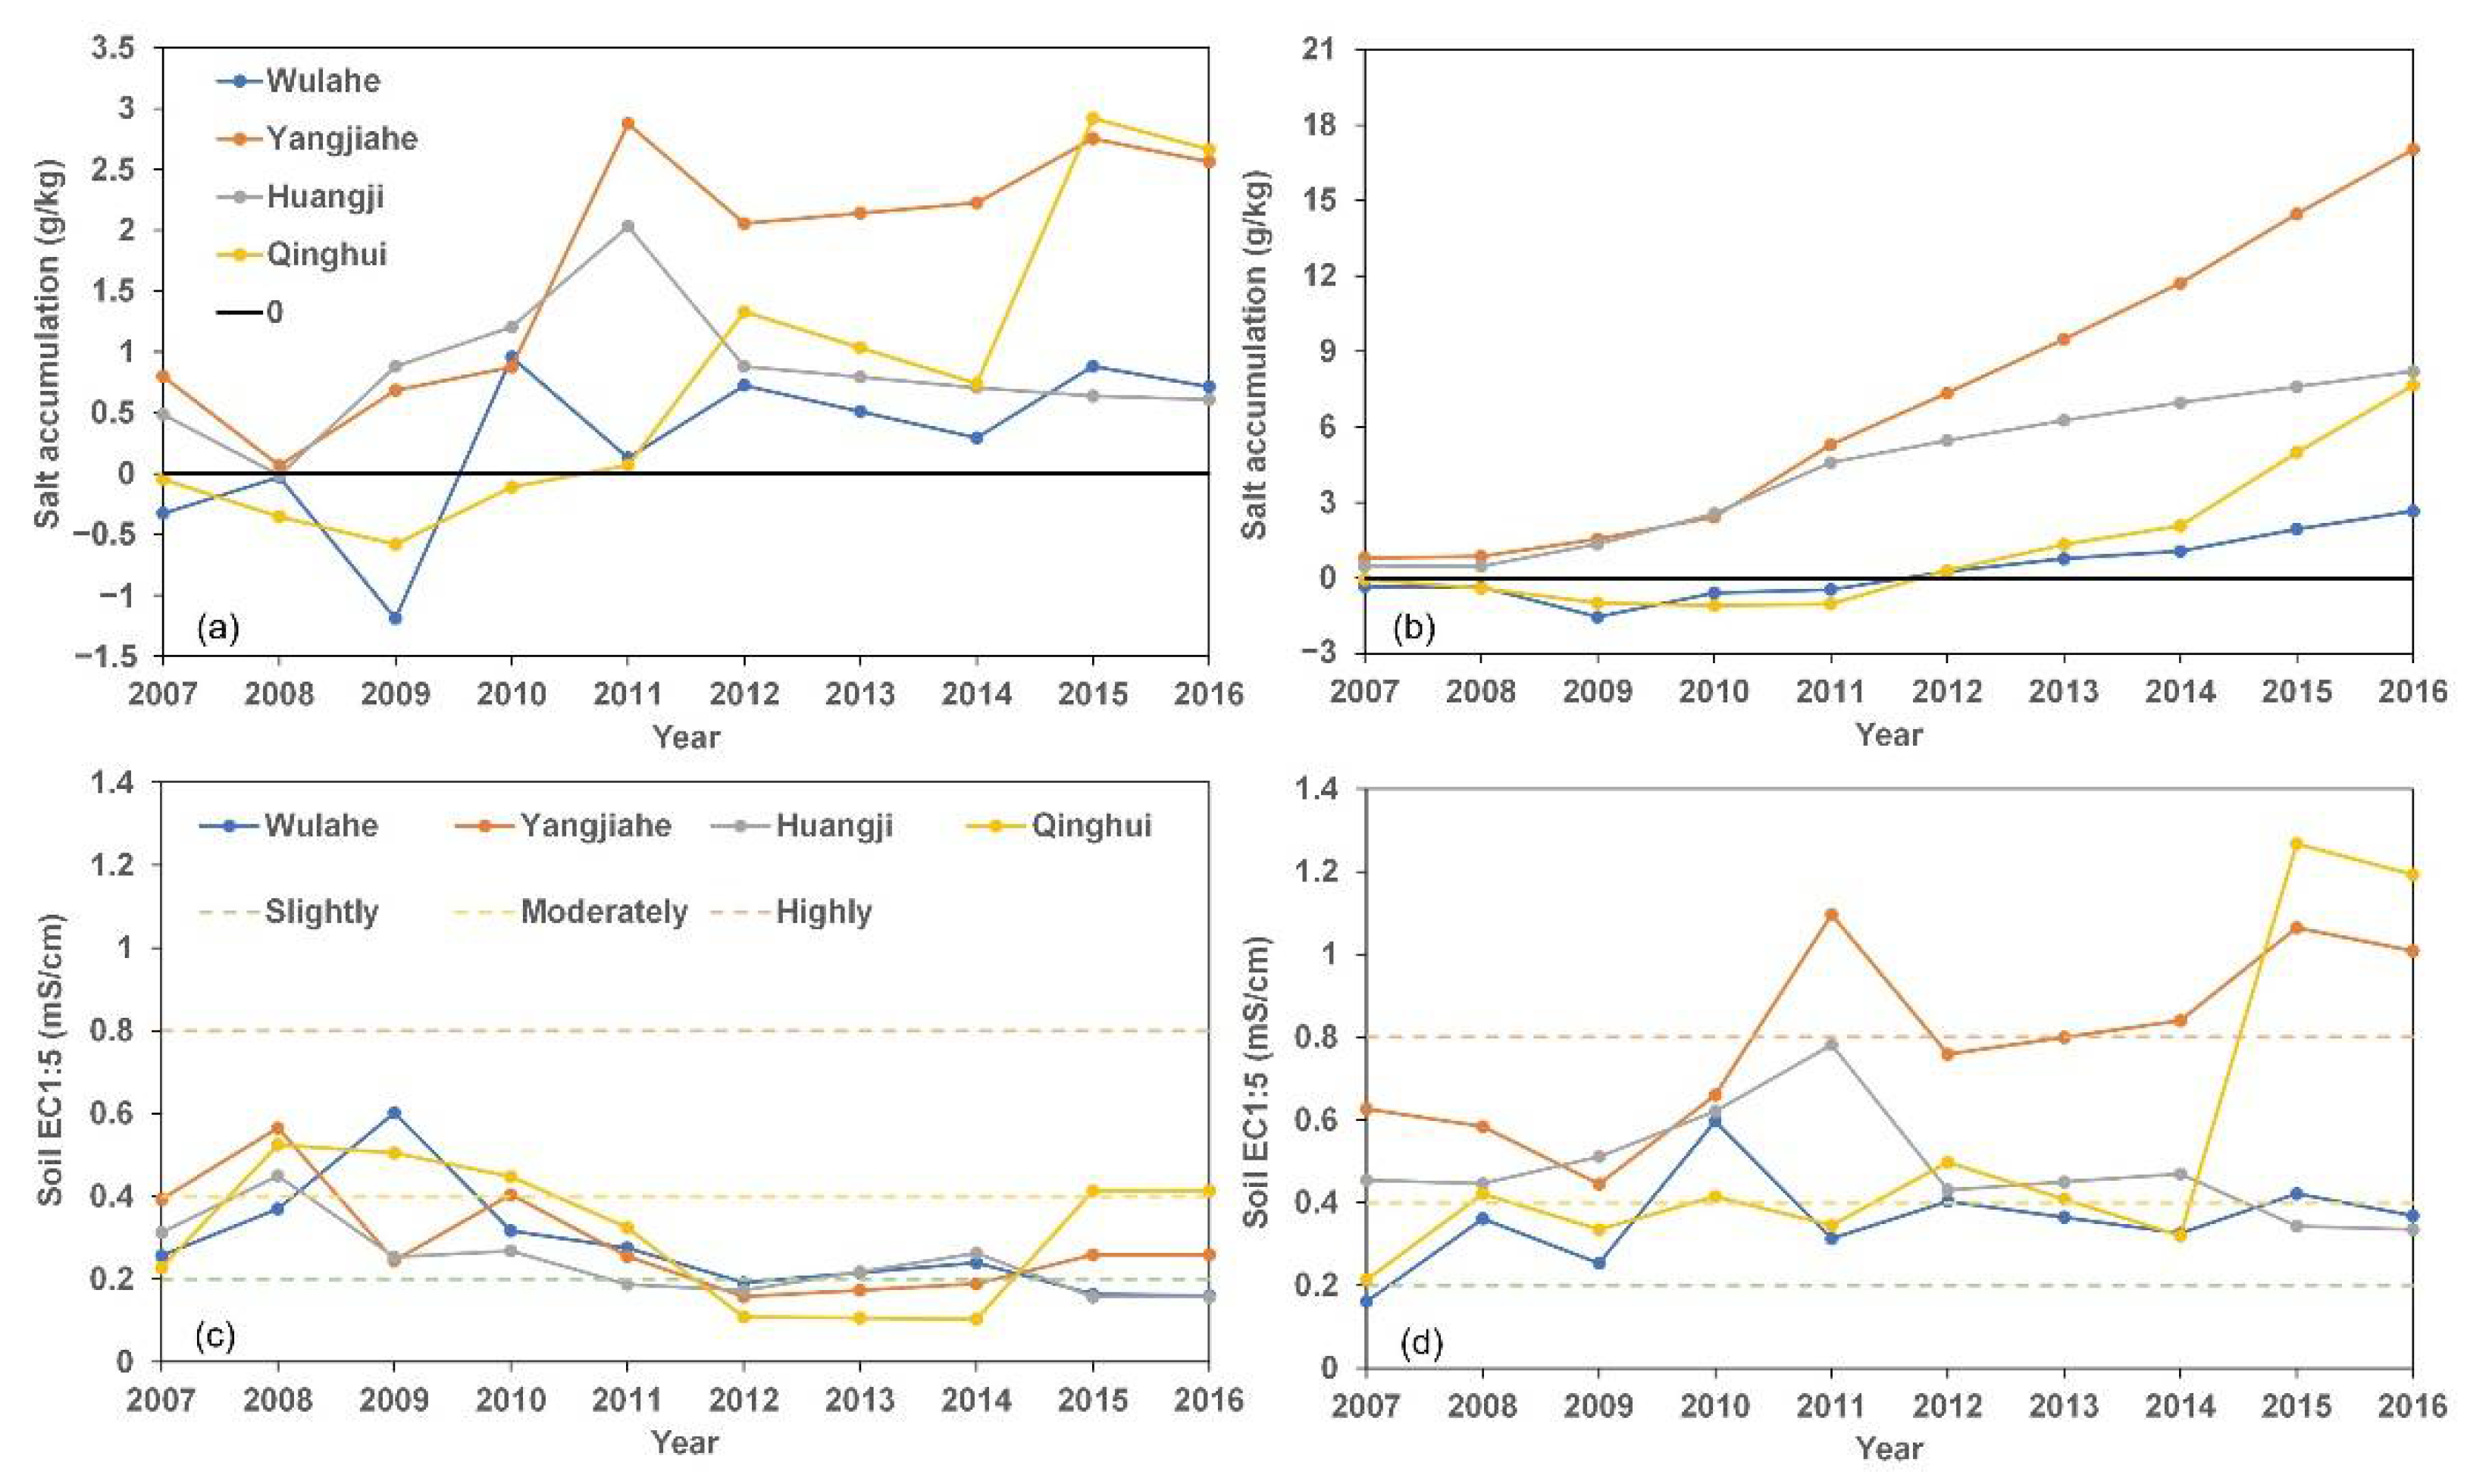
3.3. Cropping Season Salt Accumulation Pattern

At the two soil sampling sites in the southern Yangjiahe, the salt in the 0–10 cm layer accumulated a total of 20.00–20.56 g/kg during the cropping season in the 10 years (Figure 6). At the two soil sampling sites in the central Yangjiahe, the two sites in the northern Huangji and the one site along the northern boundary of Qinghui the salt in the 0–10 cm layer accumulated 10.00–20.00 g/kg during the cropping season in the 10 years. Generally, the salt did not accumulate as much in 10–20 and 20–40 cm as that in 0–10 cm, except for the three sites in the central Huangji. At the three exceptional sites, the salt accumulated in the 10–20 cm or 20–40 cm layer accumulated more salt than in the 0–10 cm layer. This might be due to the relatively course and fine soil textures of the soil layers, which will be discussed later. During the 10 years, only the site in the central Wulahe desalted during the cropping season, mainly thanks to its desalinization in the 0–10 cm layer. However, it was hard to find a correlation between salt accumulation with water table depth (Figure 6).
In the root zone (0–40 cm), in cropping seasons from 2007 to 2011, Wulahe and Qinghui did not accumulate salt, especially, in 2009, there was significant desalinization (Figure 5 and Figure 7a,b); however, in cropping seasons from 2012 to 2016, they both showed significant salt accumulation, especially Qinghui. Wulahe accumulated the least amount of salt in the cropping season during the 10-year period (2.66 g/kg), but the accumulated amount slightly increased by the year. The reason for the slight increase might be that the largest amount of irrigation water in Wulahe (Figure 3) led to its shallowest WTD (Figure 4 and Figure 5), as Wulahe was the only section that had decreasing WTD year after year (Figure 4 and Figure 5). Qinghui accumulated the second least amount of salt in the cropping season during the 10-year period (7.66 g/kg), but there was a significant increase in 2015 and 2016. The reason for the second least amount of salt accumulation might be that Qinghui was a groundwater irrigated section, i.e., the deep groundwater was pumped and flood irrigated. This led to its deepest WTD and its increase of WTD by year (Figure 4 and Figure 5), and resulted in its hindered phreatic evaporation and suppressed upward salt migration; however, the salinity of the pumped groundwater was larger than that of the Yellow River. Thus, in 2015–2016, more groundwater was pumped and irrigated, leading to a dropped water table and accumulated salt.
From 2007 to 2010, Yangjiahe and Huangji accumulated salt in the cropping season gradually, until an accelerated accumulation in both sections in 2011 (Figure 5 and Figure 7a,b). After 2011, Yangjiahe kept the accelerated salt accumulation; whereas, Huangji returned back to the gradual salt accumulation. Yangjiahe accumulated the most amount of salt in the cropping season during the 10-year period (17.03 g/kg), and the accumulated amount was increasing by the year. The reason for the most accumulated amount of salt might be that the cropping season water deficit (ETc − I − P) was the largest in Yangjiahe (Figure 3); moreover, Yangjiahe had the second shallowest WTD (Figure 4), which led to more phreatic evaporation and upward salt migration. Huangji accumulated the second most amount of salt in the cropping season during the 10-year period (8.21 g/kg), and most of the salt was accumulated in 2011 (Figure 5 and Figure 7a,b). The reason for the abrupt salt accumulation increase in 2011 might be that 2011 was the driest year during the 10-year period, with the largest ETc and the least water input (I + P) (Figure 3).
The soil EC1:5 at the beginning and at the end of each cropping season are shown in Figure 7c,d. Nearly all of the root zone soils were loams (Table 1). According to DPIRD [45], a loam with EC1:5 < 0.20 mS/cm is non-saline soil, a loam with 0.20 mS/cm < EC1:5 < 0.40 mS/cm is slightly saline soil, a loam with 0.40 mS/cm < EC1:5 < 0.80 mS/cm is moderately saline soil, and a loam with 0.80 mS/cm < EC1:5 < 1.60 mS/cm is highly saline soil (Figure 7c,d). At the beginning of the cropping seasons, most soils were slightly saline, some were non-saline and some were moderately saline (Figure 7c). Notably, from 2012 to 2014 the soils were mostly non-saline. Whereas, at the end of the cropping seasons, most soils were slightly and moderately saline, few were non-saline, and some were even highly saline (Figure 7d), especially in 2011, 2015 and 2016. In the HID, besides the first to the sixth irrigations during the cropping season, there is an autumn irrigation after the cropping season to leach salt. On average, the field autumn irrigation during the 10-year period in the JFZSD was 179 ± 39 mm, about 66.6 % of the field irrigation during the cropping season (269 ± 37 mm). Then, the reason why the slightly and moderately saline soil at the end of one cropping season could restore to slightly saline at the beginning of the next cropping season must be that the autumn irrigation leached the salt during the non-cropping season.
The soil EC1:5 variation within a cropping season, taking the 2007 cropping season as an example, is shown in Figure 8. The date of the measured data points corresponded to the soil sampling date before the first to the sixth irrigation and the autumn irrigation, respectively. For all the sections, salt accumulated after the first irrigation and was leached by the sixth irrigation. The soil EC1:5 in Wulahe, Huangji, Yangjiahe and Qinghui section peaked before the third, fourth, fifth and sixth irrigation, respectively. During the cropping season, Yangjiahe and Huangji accumulated salt, Qinghui roughly remained at the same level, and Wulahe leached salt. It seems that the sixth irrigation could effectively leach salt in all the sections; and the second irrigation could effectively leach salt in all the sections, except for Wulahe. In Wulahe, the third and fourth irrigations seemed to be the most effective ones.

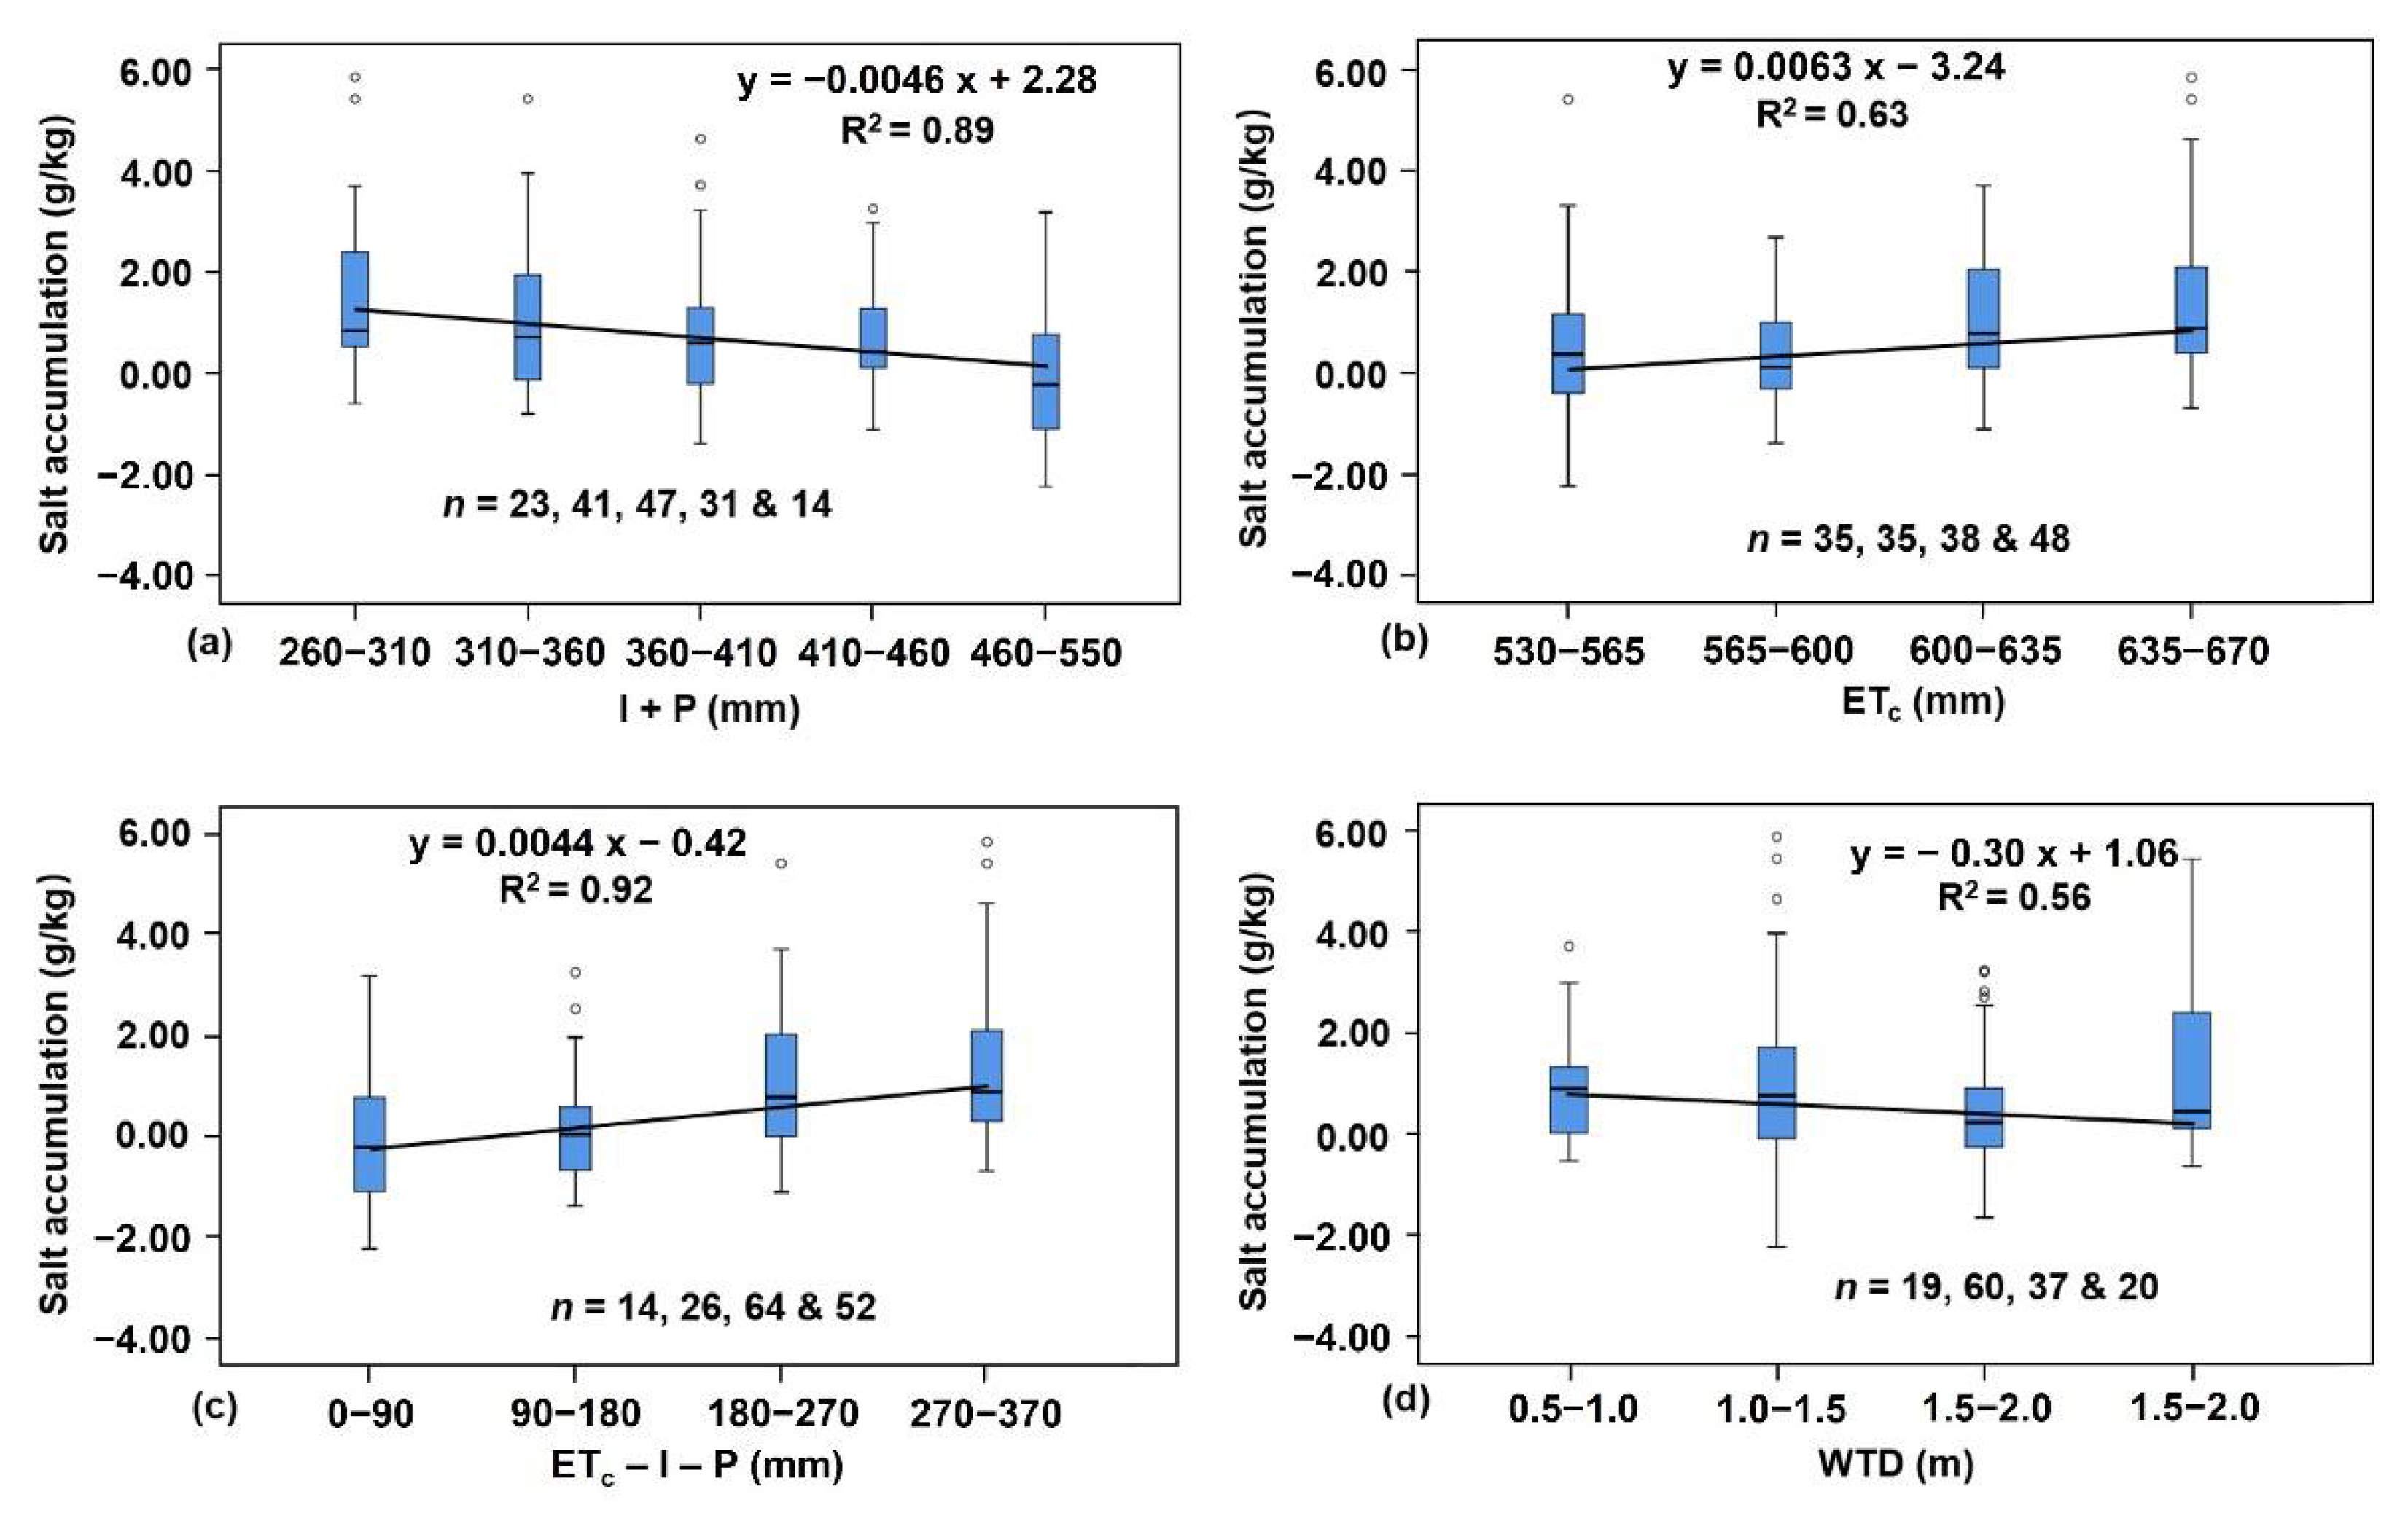
3.4. Cropping Season Salt Accumulation Attribute Factors and Their Contributions

The relationships between the cropping season salt accumulation in the root zone (0–40 cm) and the cropping season water input (I + P), ETc, water deficit (ETc − I − P) and average WTD were found (Figure 9). Note that the data points obtained in the groundwater irrigated Qinghui were excluded when plotting the boxplot involving WTD (Figure 9d). The x-axes were categorized, considering both roughly similar spacing and a roughly similar number of points (n) in each category. The trend line shows the relationship between the mean of each x-axis interval and the median of the cropping season salt accumulation in this group. It was expected that the cropping season salt accumulation can be hindered by higher cropping season water input (I + P) and deeper WTD, and be accelerated by higher ETc (Figure 9a,b,d); therefore, the relationship between water deficit (ETc − I − P), the force driving phreatic evaporation, and salt accumulation was exceptionally strong (Figure 9c). This means that given a steady climate, the water-saving irrigation management practices from 2012 to 2016 could potentially increase salt accumulation during the cropping season. The relationship between WTD and salt accumulation was weaker than the other three relationships, but the relationship shows that if the WTD were larger than 3 m, the soil salt might not accumulate, agreeing with Jin et al. [33].
The grey relational grade between the cropping season salt accumulation and the cropping season ETc, I + P, and average WTD in each year at each soil sampling site was 0.644, 0.675 and 0.604, respectively. Thus, the contribution of the cropping season I + P was the largest, followed by ETc and average WTD. This means that a deeper average WTD could largely remediate the salt accumulation in the arid and semiarid region; whereas, more field irrigation water could remediate even more.
The soil texture and dry bulk density (ρ) were tabulated for the three soil layers of each site (Table 1). The numbers (No.) correspond to the soil sampling site numbers labelled in Figure 1. Note that for all the soil layers, the clay (<0.002 mm) contents were less than 40%, the silt (0.002–0.02 mm) contents were less than 60%, and the sand (0.02–2 mm) contents varied from 10–90 %; therefore, the texture of all the soils fell in the sand, sandy loam, loam, silty loam, silty clay loam and clay loam categories, and loam took up more than half. For half of the sites, the soil texture of the three layers was the same, the air-entry values were similar and capillary rise could be continuous. For a quarter of the sites, for example, the 20–40 cm of soil No. 5 and 10–20 cm of soil No. 14, there existed the case that one soil layer was finer than its overlying soil layer. This means that the capillary rise and, therefore, the evaporation and associated salt upward transport could be disrupted at the interface of the two soil layers [46]. In this case, the fine layer might accumulate more salt than its overlying layer, and the total salt accumulation in the root zone might be hindered.

4. Discussion

It was found that (1) at the beginning of the cropping seasons, most soils were slightly saline and (2) at the end of the cropping seasons, most soils were slightly to moderately saline and some were even highly saline. This indicated that thanks to the autumn irrigation, which was applied after each cropping season to leach salt, the salt accumulation during the cropping season did not lead to continuous deterioration of the soil in this area, but restored to a relative healthy condition in next spring for crop germination. However, if the salt accumulated during the cropping season keeps the level of 2012 to 2016, and the water-saving irrigation measures keeps the level during 2012 to 2016 or becomes even more strict, whether the soil could sustainably remain suitable for germination and crop growth is questionable.
Overall, the water-saving management practices during the 10-year period could effectively leach the salt accumulated in the cropping season by autumn irrigation and keep the soil sustainable for crop growth. Larger potential crop evapotranspiration would lead to more salt accumulation; however, deeper water table depth could reverse the trend, and more precipitation and field irrigation could reverse the trend even more effectively. Therefore, given a steady climatic condition and the irrigation measures during 2012 to 2016, saving more water might mean accelerated soil salinization.
If the climate becomes drier for arid and semiarid areas as predicted by the climate patterns, more water might need to be diverted from the Yellow River to keep the soil healthy. Alternatively, better drainage systems to keep water table depth larger than a critical depth might be the most economical way for the Hetao Irrigation District. The critical water table depth is roughly 3 m in the Hetao Irrigation District, but may vary with climate change, irrigation amount, the spatial distribution of different types of crops and soil texture, and resulted salt leaching requirement of the specific cropland. Constructing drainage systems to maintain water table under their own critical water table depths could be helpful in other arid and semiarid irrigation areas suffering from shallow water table depth and soil salinization.

Author Contributions

Conceptualization, C.W. and Z.H.; Data curation, Y.L. (Yuanyuan Luo); Formal analysis, Y.L. (Yuanyuan Luo); Funding acquisition, C.W. and Z.H.; Investigation, C.W. and Y.L. (Yuanyuan Luo); Methodology, C.W. and Y.L. (Yuanyuan Luo); Project administration, C.W. and Z.H.; Resources, Z.L., S.W., Y.L. (Yifan Lin) and P.W.; Software, Y.L. (Yuanyuan Luo); Supervision, C.W. and Z.H.; Validation, Y.L. (Yuanyuan Luo) and G.L.; Visualization, C.W., Y.L. (Yuanyuan Luo) and G.L.; Writing–original draft, C.W. and Y.L. (Yuanyuan Luo); Writing–review and editing, C.W., Z.H. and G.L. All authors have read and agreed to the published version of the manuscript.

Funding

This work was supported by the National Natural Science Foundation of China [grant numbers: 51909264, 52130902] and the Beijing College Student Innovation and Entrepreneurship Training Program [grant number: bj202010019204].

Data Availability Statement

The data presented in this study are available on request from the corresponding author. The data are not publicly available due to the request of the initial data provider.

Acknowledgments

The authors would like to thank Shahaoqu Experimental Station, Inner Mongolia Hetao Irrigation District Jiefangzha Department, China for the assistance with field work.

Conflicts of Interest

The authors declare no conflict of interest.

References

  1. Syed, A.; Sarwar, G.; Shah, S.H.; Muhammad, S. Soil salinity research in 21(st) Century in Pakistan: Its impact on availability of plant nutrients, growth and yield of crops. Commun. Soil Sci. Plant Anal. 2021, 52, 183–200. [Google Scholar] [CrossRef]
  2. Shrivastava, P.; Kumar, R. Soil salinity: A serious environmental issue and plant growth promoting bacteria as one of the tools for its alleviation. Saudi J. Biol. Sci. 2015, 22, 123–131. [Google Scholar] [CrossRef] [Green Version]
  3. Singh, A. Soil salinization and waterlogging: A threat to environment and agricultural sustainability. Ecol. Indic. 2015, 57, 128–130. [Google Scholar] [CrossRef]
  4. Thenkabail, P.S. Global Croplands and their Importance for Water and Food Security in the Twenty-first Century: Towards an Ever Green Revolution that Combines a Second Green Revolution with a Blue Revolution. Remote Sens. 2010, 2, 2305–2312. [Google Scholar] [CrossRef] [Green Version]
  5. Jamil, A.; Riaz, S.; Ashraf, M.; Foolad, M. Gene expression profiling of plants under salt stress. Crit. Rev. Plant Sci. 2011, 30, 435–458. [Google Scholar] [CrossRef]
  6. Nachshon, U. Cropland soil salinization and associated hydrology: Trends, processes and examples. Water 2018, 10, 1030. [Google Scholar]
  7. Castaneda, C.; Herrero, J.; Latorre, B. The vanishing legacy of soil salinity data from irrigated districts: A case study from Spain and a call for action. Adv. Agron. 2020, 161, 325–355. [Google Scholar]
  8. Isidoro, D.; Aragues, R. River water quality and irrigated agriculture in the Ebro basin: An overview. Int. J. Water Resour. Dev. 2007, 23, 91–106. [Google Scholar] [CrossRef]
  9. Hart, B.; Walker, G.; Katupitiya, A.; Doolan, J. Salinity Management in the Murray–Darling Basin, Australia. Water 2020, 12, 1829. [Google Scholar] [CrossRef]
  10. Qureshi, A.S.; Perry, C. Managing water and salt for sustainable agriculture in the Indus Basin of Pakistan. Sustainability 2021, 13, 5303. [Google Scholar] [CrossRef]
  11. Qureshi, A.S.; McCornick, P.G.; Qadir, M.; Aslam, Z. Managing salinity and waterlogging in the Indus Basin of Pakistan. Agric. Water Manag. 2008, 95, 1–10. [Google Scholar] [CrossRef]
  12. Wang, X.; Wei, Y.; Yang, J. Analysis on water cycling in GSPAC system of Hetao Irrigation District, in InnerMongolia, China. J. Irrig. Drain. Eng. 2004, 23, 30–33. [Google Scholar]
  13. Xu, X.; Huang, G.; Qu, Z.; Pereira, L.S. Assessing the groundwater dynamics and impacts of water saving in the Hetao Irrigation District, Yellow River basin. Agric. Water Manag. 2010, 98, 301–313. [Google Scholar] [CrossRef]
  14. Chang, X. Study on Dynamic Simulation of Water and Salt and Sustainablity Strategy in Hetao Irrigation District; China Institute of Water Resources and Hydropower Research: Beijing, China, 2019. [Google Scholar]
  15. Chen, J.S.; Wang, F.Y.; Meybeck, M.; He, D.W.; Xia, X.H.; Zhang, L.T. Spatial and temporal analysis of water chemistry records (1958-2000) in the Huanghe (Yellow River) basin. Glob. Biogeochem. Cycles 2005, 19, GB3016. [Google Scholar] [CrossRef]
  16. Ren, D.Y.; Xu, X.; Hao, Y.Y.; Huang, G.H. Modeling and assessing field irrigation water use in a canal system of Hetao, upper Yellow River basin: Application to maize, sunflower and watermelon. J. Hydrol. 2016, 532, 122–139. [Google Scholar] [CrossRef]
  17. Wu, J.W.; Vincent, B.; Yang, J.Z.; Bouarfa, S.; Vidal, A. Remote sensing monitoring of changes in soil salinity: A case study in Inner Mongolia, China. Sensors 2008, 8, 7035–7049. [Google Scholar] [CrossRef] [Green Version]
  18. Morway, E.D.; Gates, T.K.; Niswonger, R.G. Appraising options to reduce shallow groundwater tables and enhance flow conditions over regional scales in an irrigated alluvial aquifer system. J. Hydrol. 2013, 495, 216–237. [Google Scholar] [CrossRef]
  19. Sun, W. The Analysis of Diflferent Scales Diversity Law of Irrigation Water Efficiency and Water Saving Potential in Hetao Irrigation District of Inner Mongolia; Inner Mongolia Agricultural University: Huhhot, China, 2014. [Google Scholar]
  20. Gao, X.; Huo, Z.; Bai, Y.; Feng, S.; Huang, G.; Shi, H.; Qu, Z. Soil salt and groundwater change in flood irrigation field and uncultivated land: A case study based on 4-year field observations. Environ. Earth Sci. 2014, 73, 2127–2139. [Google Scholar] [CrossRef]
  21. Liu, Z.; Chen, H.; Huo, Z.; Wang, F.; Shock, C.C. Analysis of the contribution of groundwater to evapotranspiration in an arid irrigation district with shallow water table. Agric. Water Manag. 2016, 171, 131–141. [Google Scholar] [CrossRef]
  22. Miao, Q.; Rosa, R.D.; Shi, H.; Paredes, P.; Zhu, L.; Dai, J.; Gonçalves, J.M.; Pereira, L.S. Modeling water use, transpiration and soil evaporation of spring wheat–maize and spring wheat–sunflower relay intercropping using the dual crop coefficient approach. Agric. Water Manag. 2016, 165, 211–229. [Google Scholar] [CrossRef]
  23. Xue, J. Modeling Agriculture Water Productivity at Muti-Scales Based on Water and Salt Processes in Arid Area with Shallow Groundwater; China Agricultural University: Beijing, China, 2018. [Google Scholar]
  24. Xue, J.; Huo, Z.; Wang, S.; Wang, C.; White, I.; Kisekka, I.; Sheng, Z.; Huang, G.; Xu, X. A novel regional irrigation water productivity model coupling irrigation- and drainage-driven soil hydrology and salinity dynamics and shallow groundwater movement in arid regions in China. Hydrol. Earth Syst. Sci. 2020, 24, 2399–2418. [Google Scholar] [CrossRef]
  25. Zhou, L. Influences of deficit irrigation on soil water content distribution and spring wheat growth in Hetao Irrigation District, Inner Mongolia of China. Water Supply 2020, 20, 3722–3729. [Google Scholar] [CrossRef]
  26. Metternicht, G.I.; Zinck, J.A. Remote sensing of soil salinity: Potentials and constraints. Remote Sens. Environ. 2003, 85, 1–20. [Google Scholar] [CrossRef]
  27. Wichelns, D.; Qadir, M. Achieving sustainable irrigation requires effective management of salts, soil salinity, and shallow groundwater. Agric. Water Manag. 2015, 157, 31–38. [Google Scholar] [CrossRef]
  28. Zeng, W.; Xu, C.; Wu, J.; Huang, J. Soil salt leaching under different irrigation regimes: HYDRUS-1D modelling and analysis. J. Arid Land 2013, 6, 44–58. [Google Scholar] [CrossRef] [Green Version]
  29. Fowler, D.N.; King, S.L.; Weindorf, D.C. Evaluating abiotic influences on soil salinity of inland managed wetlands and agricultural croplands in a semi-arid environment. Wetlands 2014, 34, 1229–1239. [Google Scholar] [CrossRef]
  30. van Rensburg, L.D.; Strydom, M.G.; du Preez, C.C.; Bennie, A.T.P.; le Roux, P.A.L.; Pretorius, J.P. Prediction of salt balances in irrigated soils along the lower Vaal River, South Africa. Water 2008, 34, 11–17. [Google Scholar] [CrossRef] [Green Version]
  31. Ragab, R.A.; Amer, F. Estimating water table contribution to the water supply of maize. Agric. Water Manag. 1986, 11, 221–230. [Google Scholar] [CrossRef]
  32. Kahlown, M.A.; Ashraf, M.; Zia ul, H. Effect of shallow groundwater table on crop water requirements and crop yields. Agric. Water Manag. 2005, 76, 24–35. [Google Scholar] [CrossRef]
  33. Jin, X.M.; Vekerdy, Z.; Zhang, Y.K.; Liu, J.T. Soil salt content and its relationship with crops and groundwater depth in the Yinchuan Plain (China) using remote sensing. Arid Land Res. Manag. 2012, 26, 227–235. [Google Scholar] [CrossRef]
  34. Zarai, B.; Walter, C.; Michot, D.; Montoroi, J.P.; Hachicha, M. Soil salinization monitoring method evolution at various spatial and temporal scales in arid context: A review. Arab. J. Geosci. 2021, 14, 283. [Google Scholar]
  35. Zhang, X.; Guo, P.; Zhang, F.; Liu, X.; Yue, Q.; Wang, Y. Optimal irrigation water allocation in Hetao Irrigation District considering decision makers’ preference under uncertainties. Agric. Water Manag. 2021, 246, 106670. [Google Scholar] [CrossRef]
  36. Wu, J.; Zhao, L.; Huang, J.; Yang, J.; Vincent, B.; Bouarfa, S.; Vidal, A. On the effectiveness of dry drainage in soil salinity control. Sci. China Ser. E Technol. Sci. 2009, 52, 3328–3334. [Google Scholar] [CrossRef]
  37. Wang, X.H.; Wang, C.Z.; Wang, X.W.; Huo, Z.L. Response of soil compaction to the seasonal freezing-thawing process and the key controlling factors. Catena 2020, 184, 104247. [Google Scholar] [CrossRef]
  38. Allen, R.G.; Pereira, L.S.; Raes, D.; Smith, M. FAO Irrigation and Drainage Paper No. 56; Food and Agriculture Organization of the United Nations: Rome, Italy, 1998; Volume 56, p. e156. [Google Scholar]
  39. Philip, G.M.; Watson, D.F. A precise method for determining contoured surfaces. APPEA J. 1982, 22, 205–212. [Google Scholar] [CrossRef]
  40. Watson, D.F.; Philip, G.M. A refinement of inverse distance weighted interpolation. Geo-Processing 1985, 2, 315–327. [Google Scholar]
  41. Bartier, P.M.; Keller, C.P. Multivariate interpolation to incorporate thematic surface data using inverse distance weighting (IDW). Comput. Geosci. 1996, 22, 795–799. [Google Scholar] [CrossRef]
  42. Lu, G.Y.; Wong, D.W. An adaptive inverse-distance weighting spatial interpolation technique. Comput. Geosci. 2008, 34, 1044–1055. [Google Scholar] [CrossRef]
  43. Deng, J.-L. Control problems of grey systems. Syst. Control Lett. 1982, 1, 288–294. [Google Scholar]
  44. Kuo, Y.; Yang, T.; Huang, G.W. The use of grey relational analysis in solving multiple attribute decision-making problems. Comput. Ind. Eng. 2008, 55, 80–93. [Google Scholar] [CrossRef]
  45. DPIRD. Measuring Soil Salinity. 4 May 2021. Available online: https://www.agric.wa.gov.au/soil-salinity/measuring-soil-salinity (accessed on 17 August 2021).
  46. Shokri, N.; Lehmann, P.; Or, D. Evaporation from layered porous media. J. Geophys. Res. Solid Earth 2010, 115, B06204. [Google Scholar] [CrossRef] [Green Version]
Figure 1. The location of the Jiefangzha Subdistrict (JFZSD) and the locations of the groundwater monitoring wells and soil sampling sites.
Water 14 01664 g001
Figure 2. Seasonal pattern of precipitation, average, maximum and minimum temperature (Temp), wind speed (WS), relative humidity (RH), and reference evapotranspiration (ETo) in the Jiefangzha Subdistrict.
Water 14 01664 g002
Figure 3. The cropping season precipitation (P), field irrigation (I) and potential crop evapotranspiration (ETc) in the four sections in each year.
Water 14 01664 g003
Figure 4. The cropping season average water table depth of the four sections in each year.
Water 14 01664 g004
Figure 5. The variation of the cropping season salt accumulation in the 0–40 cm layer of the 22 soil sampling sites and the cropping season water table depth in the Jiefangzha Subdistrict (JFZSD) from 2007 to 2016.
Water 14 01664 g005
Figure 6. The 10-year cropping season salt accumulation in different layers of the 22 soil sampling sites and the 10-year cropping season average water table depth in the Jiefangzha Subdistrict (JFZSD).
Water 14 01664 g006
Figure 7. The salt accumulated in the 0–40 cm soil layer during each cropping season (a) and its cumulative amount (b), and the soil EC1:5 (mS/cm) at the beginning (c) and at the end (d) of each cropping season of Wulahe, Yangjiahe, Huangji and Qinghui sections in the Jiefangzha Subdistrict (JFZSD) from 2007 to 2016. The dashed lines indicate the classification of the saline soils.
Water 14 01664 g007
Figure 8. The soil EC1:5 (mS/cm) during the 2007 cropping season for the four sections.
Water 14 01664 g008
Figure 9. The relationship between the cropping season salt accumulation (g/kg) and the cropping season water input (I + P, a), potential crop evapotranspiration (ETc, b), water deficit (ETc − I − P, c), and average water table depth (WTD, d).
Water 14 01664 g009
Table 1. The soil texture and dry bulk density (ρ) of the three soil layers at the 22 soil sampling sites.
No.Depth (cm)Soil Textureρ (g/cm3)No.Depth (cm)Soil Textureρ (g/cm3)
10–10loam1.53120–10loam1.48
10–20sandy loam1.6010–20loam1.52
20–40sandy loam1.4620–40loam1.39
20–10loam1.50130–10clay loam1.53
10–20loam1.4810–20loam1.66
20–40loam1.5020–40silty loam1.56
30–10silty loam1.32140–10loam1.47
10–20loam1.4510–20clay loam1.39
20–40loam1.3420–40loam1.49
40–10loam1.52150–10loam1.47
10–20loam1.5110–20silty clay loam1.74
20–40loam1.4320–40loam1.63
50–10loam1.40160–10clay loam1.33
10–20loam1.5110–20clay loam1.37
20–40clay loam1.5220–40clay loam1.41
60–10sandy loam1.49170–10sandy loam1.25
10–20sandy loam1.5710–20clay loam1.32
20–40sandy loam1.4620–40sandy loam1.40
70–10loam1.29180–10silty loam1.59
10–20loam1.5110–20silty clay loam1.63
20–40sandy loam1.3920–40loam1.34
80–10loam1.29190–10loam1.45
10–20loam1.3410–20sand1.44
20–40loam1.3020–40sand1.38
90–10loam1.44200–10loam1.57
10–20loam1.6610–20loam1.70
20–40loam1.6520–40loam1.50
100–10loam1.40210–10clay loam1.69
10–20loam1.4110–20clay loam1.45
20–40loam1.3820–40clay loam1.40
110–10sandy loam1.36220–10clay loam1.20
10–20sandy loam1.3810–20clay loam1.25
20–40sandy loam1.4320–40clay loam1.40
Publisher’s Note: MDPI stays neutral with regard to jurisdictional claims in published maps and institutional affiliations.

