Abstract
Improving irrigation performance is crucial for increased agricultural productivity. As an indicator of performance, among other factors, improving the water Fees Collection Rate (FCR) is required, but FCR has remained low in most African and Asian countries. In this research, taking the Doho rice scheme in Uganda as a case study, we analyzed the relationship between water sufficiency and FCR. We hypothesized that FCR is influenced by the hydraulic position of the paddy field along the canal. We then used quantitative data for analysis through multiple regression. Later we used qualitative data obtained through interviews for additional explanations of water management activities. As a result, the FCR decreases from upstream to downstream at block, strip, and plot levels; the FCR decreases linearly with an increase in the delivery canal length; the FCR is higher in strips with fewer plots, and FCR is higher within the rotational irrigation blocks. We concluded that inadequate water supply due to high hydraulic positions resulted in low FCR downstream at all the canal levels. To improve FCR, we recommend blending water management activities that secure farmers’ agreement with onsite technical measures to counter the effect of hydraulic positions such as shorter strips and rotational irrigation.
1. Introduction
In Asian and African developing countries, there is a need to increase the production of cereals that require large areas of land and large amounts of water to cope with the rapid population growth [1]. However, there is limited land and water suitable for these crops, and efficient irrigation is becoming increasingly important to increase production in the future [2]. Irrigated rice, a crop generally grown in conditions of water abundance, receives an estimated 34−43% of the world’s irrigation water [3]. Yet, unlike other grains, in paddy rice, yield damage due to excessive water is minimal, prompting upstream farmers to draw a lot of water depriving downstream users [4].
For efficient and sustainable irrigation, it is crucial not only to construct irrigation facilities but also to manage the facility for effective water allocation [5]; the World Bank has recommended Participatory Irrigation Management (PIM) and the Joint Water Management (JWM) method since the 1980s [6]. Under this arrangement, beneficiary farmers supported by governments establish and manage irrigation organizations while bearing their operation and maintenance (OM) costs by paying water fees [7]. However, there are few cases where PIM and JWM have been entirely successful [8]. In addition, reports indicate that water fee collection rates (FCRs) are often low [9], especially in Sub-Saharan Africa, where large-scale irrigation development is proceeding rapidly [10]. The FCR is low, partly due to their lack of experience in irrigation management, and improving this collection rate is a significant challenge [9,11].
Like many Sub-Saharan African countries, irrigation development is a priority in the national development plan in Uganda. The government intends to raise rice yield from 1.8 to 4.5 tons with an additional 1.5 million hectares brought under irrigation by 2040 [12,13]. As part of the national development plan, the government borrowing from donors has improved several rice schemes to increase water sufficiency, productivity, and cost recovery [13]. In all the rice schemes constructed by the government, as part of the implementation agreement, the government must implement PIM systems by forming water users’ associations (WUAs) to shoulder OM costs and ensure sustainability [13,14]. As an indicator of effective and sustainable irrigation, among other factors, improving the FCR and irrigation cost recovery is required [15]. Still, FCR has remained low in all the irrigation schemes in Uganda [13,16].
Several studies have discussed the importance of farmers’ payment of OM fees. For example, the users’ bearing of OM costs increases ownership of the scheme and positively affects the overall irrigation efficiency [17,18]. From the perspective of managing public goods, there is great importance for farmers bearing OM costs [19]. The OECD has also raised the importance of full cost recovery by farmers for efficient resource allocation through market principles and equitable international trade. A better incentive to farmers for increased water access is the sure way for high OM FCR and sustainability of irrigation schemes [1,2,5,6,20,21,22].
Regarding the reasons why the FCR remains low and measures to improve it, many papers point out that the economic benefits of irrigation are lower than the OM costs and, therefore, efforts are needed to raise benefits [23,24,25,26]. For example, the international water management institute (IWMI), in the analysis of the performance of WUAs based on total cost recovery and user participation, found that farmers have no incentive to pay user fees in Sub-Sahara Africa [9]. When farmers primarily make a living from agriculture, they would be more willing to pay OM costs if the reliability of irrigation water supply for agricultural products is ensured [27]. Further, in Uganda, farmers’ willingness to pay (WTP) is related to whether farmers pay OM fees [22,28]. Further, WTP differs between upstream and downstream farmers, and government subsidies for OM costs can improve FCR under uniform OM cost-sharing by farmers [29].
In addition, many other case studies of irrigation management in developing countries have pointed out the problem of low FCR [11,14,17,27,30,31,32,33]. However, most of them are limited to the issue of low FCR in large irrigation schemes as a whole. There are few research analyses of FCR among and within small irrigation blocks within irrigation schemes. If farmers’ OM payments are related to farmers’ WTP, it should have a lot to do with the availability of adequate water for individual farmers. The FCR of a canal may be lower downstream in the canal at all levels, but few studies have sought actual FCR from such a perspective. In the case of large irrigation schemes, canals are divided like a tree branch, and sub farmers’ organizations are often aligned to the tree branches; it is thus necessary to analyze the FCR distribution of canal levels for effective future improvements.
In this study, we selected the Doho rice irrigation scheme in Uganda; quantitatively, using multiple regression analysis, we determined the relationship between FCR and the hydraulic position of the paddy plot along the water supply canals. As an additional explanation of the results, we analyzed the relationship between FCR and water management activities qualitatively through interviews. We then drew policy recommendations for realizing higher FCR through increasing water sufficiency downstream.
2. Materials and Methods
2.1. Study Area
Doho, shown in Figure 1, was selected as the study area. It was developed in 1976 in phases as a large-scale paddy irrigation scheme for technology adoption with the support of the Chinese government. It is 1000 ha with around 3840 beneficiary farmers and 11 irrigation blocks drawing water from R. Manafwa. Each block has 8–30 strips, and each strip has between 4 and 80 plots. The government operates the main headworks up to tertiary gates, while farmers operate gates inside the blocks. Doho initially was fully managed by the government with support from Chinese experts; farmers had minimal roles in the daily management [34]. Doho has two planting seasons in a year; the OM fee is about 74 USD/hectare/year, about 1.5 % of the farmers’ gross rice income.
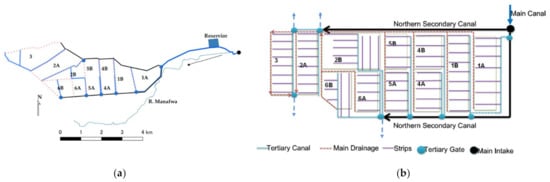
Figure 1.
The actual layout of the Doho rice scheme (a) and the schematic layout of the Doho rice scheme (b). The strip is the last terminal canal.
2.2. Method
Coupled with other water management activities, sufficient water supply to farmers influences the water fee collection rate [35,36,37,38,39,40,41,42,43], a fact many researchers have confirmed. However, in this context, we inferred that sufficient water supply to the farmer is mainly influenced by the hydraulic position along the water supply canal. Further, other farmers’ water management activities play a role.
The hydraulic position of a paddy plot along the canal directly influences the water sufficiency, and water sufficiency influences the farmers’ willingness to pay irrigation fees. At the field level, it is expected that the water sufficiency to farmers generally varies upstream and downstream of the irrigation canal due to upstream farmers’ water withdrawal and head losses in the conveyance canals [29]. The hydraulic position along the canal in this context is the location of the intake point from the 1st to the nth intake along the water supply canal; nth is the last block, last strip, or last plot. Regarding water availability, the lower hydraulic position has the most advantage, the midstream moderate, and the higher hydraulic position has the least advantage.
Main proposition:
Water sufficiency is the basis of FCR, and it is related to the hydraulic position of irrigated areas along canals. At all canal levels, the hydraulic position of the irrigated area along the canal directly influences the water fee collection rate.
For this field-based study, with a blend of complex and diverse issues at play, we adopted a mix of quantitative and qualitative analysis methods. The mixed-method was adopted because using a single approach would have provided a distorted image of the reality [44,45] and made our findings seem very biased. Moreover, the mixed-method is a recent innovation and helps lessen bias since all research processes have underlying biases [46,47,48]. Therefore, we adopted the exploratory sequential design, where we first analyzed quantitatively. The results from the quantitative analysis triggered the qualitative research, and the final interpretation was in both contexts.
As shown in the research process logical flow in Figure 2, we investigated the relationship of hydraulic position along canals to FCR and, later, as an additional consideration, investigated water management activities through interviews. Quantitatively, by plotting the distribution of FCR for each farmer group at three canal levels and using multiple regressions analysis, we established the relationship between FCR and hydraulic position along the canal. Qualitatively, through interviews with WUAs leaders, we examined the associations between FCR and other water management activities.
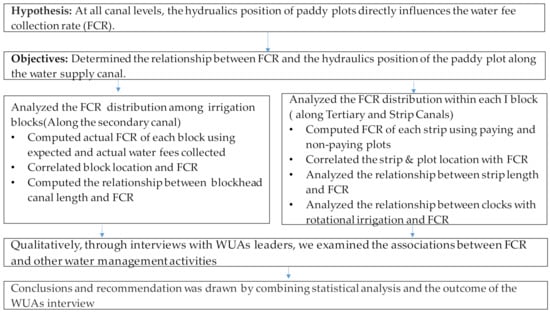
Figure 2.
The logical flow of the entire research process.
2.2.1. Effect of Hydraulic Position among Irrigation Blocks
The data obtained for this analysis includes a water payment list and a farmers’ register for all 11 irrigation blocks. The payments list was used to compute the actual water fees collected and based on the total cultivated area in the farmers’ register, the total expected water fees were calculated. With the expected and collected amount from each block, the fee collection rate for each block was computed, tabulated, and graphically presented. We also analyzed the variation of FCR with hydraulic position along the secondary canal.
2.2.2. Effect of Hydraulic Positions on FCR within the Blocks
Using the water payment list and farmers’ register for eight blocks verified on the ground, we executed the impact of hydraulic position along the canal on FCR at the strip and plot level within the block. We also examined the effects of strip length and rotational irrigation on FCR.
Tertiary canals serve water to the last terminal canals (“Strips”); each tertiary canal within a particular block has a different number of strips. The strips were ranked from upstream to downstream in terms of water advantage.
Using paying and non-paying plots from each strip, the FCR of each portion along the strip was obtained, plotted, and compared. A further analysis of hydraulic position along the canal on FCR was performed using multiple regression analysis in MS Excel
The dependent variable Y is FCR, and the independent variables (x1–xn) include block position, strip number, and plot group numbers.
For the effect of the hydraulic position of paddy fields on FCR along the strips/among plots, the paddy fields were lumped into groups of 10 plots along the strip, divided into upstream, midstream, and downstream, each containing at least ten plots. The first 10 plots are group1, and the second 10 plots are group 2.
For the influence of strip length on FCR, theoretically, the longer the last terminal canal, the more water intake points it will have. The more users to be served water, mean more inconveniences and social issues to handle. Implying longer canals can result in water insufficiency. We then analyzed the relationship between FCR and strip length (corresponding to the number of plots along a given strip). Lengths of strips were first grouped into three categories; <20 plots, between 21 and 50 plots, and >51 plots. The FCR of each category was computed for analysis.
2.2.3. Water Management Factors Affecting Water Sufficiency
Many non-technical factors can influence water sufficiency. In Doho, previous research shows a well-functioning water distribution schedule is established among the irrigation blocks, and water distribution follows the set rules [22,34]. At the same time, no sufficient data and analysis within the blocks have been performed. Therefore, we conducted field interviews with irrigation managers and farmers inside each irrigation block to compare the differences between blocks and examine their impact on FCR.
The performance of the blocks in water management issues, including the commitment and enthusiasm of block leaders, inter-strip block rotations, and frequency of meetings to resolve water issues, were investigated. The ranked results were then summarized in a table form.
We held focus group discussions with the production coordinator, the farmer’s chairman, the block chairmen, block extension workers, and the strip leaders. The production coordinator and water guard are technical resident government staff in Doho, while the extension staff are technical staff employed by WUA. The farmer’s chairman is the democratically elected overall leader of all the farmers, while the block and strip leaders are elected leaders of the blocks.
Except for block leaders, each of the interviewed leaders was asked to rank the performance of the blocks in water management issues, including the commitment and enthusiasm of block leaders, inter-strip block rotations, and frequency of meetings to resolve water issues. The ranked results were then summarized in a table form.
2.3. Data
We obtained both quantitative and qualitative data between April and May 2020 at the Doho irrigation schemes, as summarized in Table 1. Quantitative data were used to analyze the effect of hydraulic positions along the canal on FCR among and within irrigation blocks. The qualitative data for eight blocks were used to explain the relationship between FCR and water management in some paddy field areas. Data for all the 11 blocks were used for analysis among the irrigation blocks. Eight blocks located upstream and downstream were utilized for analysis inside irrigation blocks.

Table 1.
Summary of quantitative and qualitative data collected.
2.3.1. Effect of Hydraulic Position on FCR among Irrigation Blocks
The quantitative data obtained for analysis includes each block’s water fees payment records. Fee payment records are made yearly by the WUA technical staff in Doho. The fee payment record is for about 3840 farmers; it has a date of payment, the fee paid, and the area cultivated but no address.
2.3.2. Effect of Hydraulic Position on FCR within Each Block
The payment list and farmers’ register data for eight blocks located upstream and downstream were used for analysis inside irrigation blocks. The farmers’ register is a cadastral register for farmers that includes names, farm size, addresses, and plot location along a particular strip. The eight blocks used, representing more than 79% of total data for this analysis, were mainly because of the ease of getting the cooperation of block leaders for field verification. They must be distributed in the upstream and downstream areas. For locating the plots that were complying with water fees, the payment list was superimposed on the farmers’ register, as shown in Table 2, yielding two categories of paying farmers.
Table 2.
Payment list distribution and the ratio of farmers traced on the farmers’ register.
Factoring the number of farmers who paid but did not appear on the farmer’s register, the percentage of farmers who paid and were traced on the register was calculated. Only blocks with a ratio above 75% were considered for further analysis within the blocks; in that regard, we dropped block 1A.
To set an analysis database for each irrigation block, we established the hydraulic position of plots by confirming the canal maps on the ground. Hydraulic position in this context is the classification of a particular paddy field in terms of upstream, midstream, and downstream concerning water access advantage. Using google earth, we prepared canal maps, as shown in Figure 3. For the entire scheme, using the farmer’s register, GPS, and block leaders’ guidance, the actual canal maps and farmers’ plots were verified and checked on the ground. Combining the canal maps, farmers’ register, and payment list, we produced the FCR database with each paddy plot having a unique code, as shown in Figure 4 for further analysis. The code includes the numerical hydraulic position of blocks, strips, and plots (B, S, P).
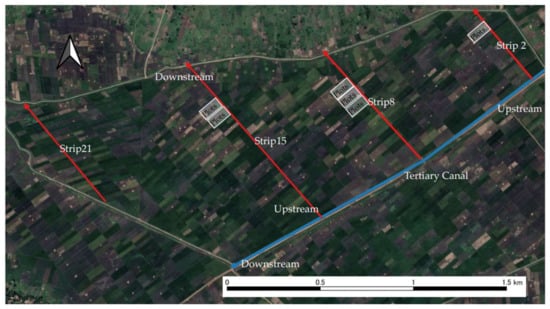
Figure 3.
Canal maps of block 3 in Doho.
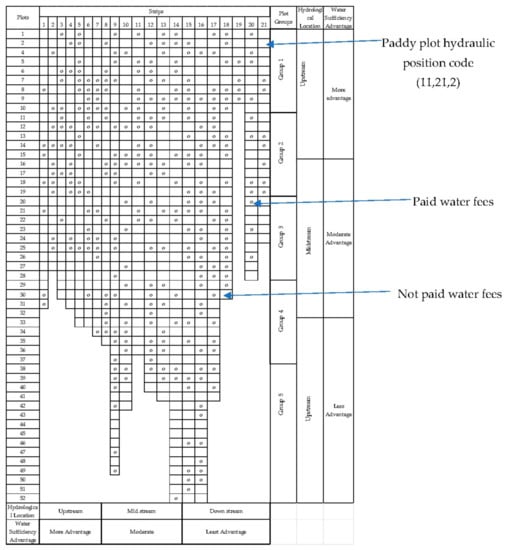
Figure 4.
Database of farmers’ fee compliance and hydraulic position of plots in the block.
3. Results
3.1. FCR among the Irrigation Blocks
As shown in Figure 5, there is a general decrease in FCR from upstream to downstream. Implying block location positively impacts the farmer’s response to paying water fees. The FCR is not decreasing linearly straight from upstream to downstream with a slight deflection in the midstream, but the trend is observed.
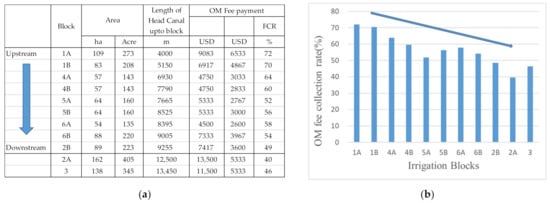
Figure 5.
FCR among irrigation blocks (a) and FCR variation among irrigation blocks (b).
The graphical relationship and simple regression analysis of block FCR with the distance of the head canal from the main headworks were also performed, as shown in Figure 6. At a 95% significance level, there is a positive relationship between FCR and the distance of the head canal. A longer head canal implies more head losses in the head canal as water moves, meaning the length of the head canal reduces the water sufficiency downstream, and hence there is lower FCR downstream.
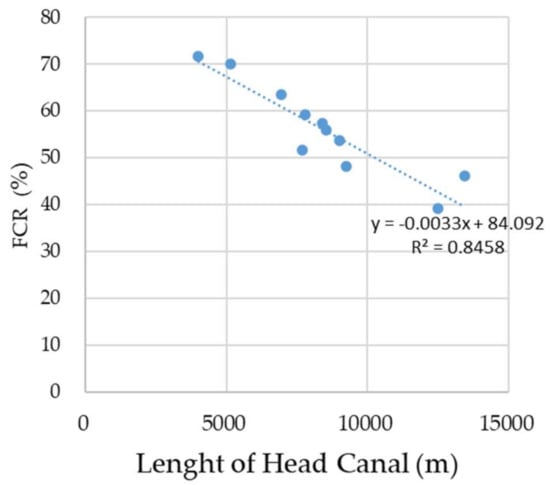
Figure 6.
Relationship of FCR with head canal length.
A previous study to evaluate the hydraulic performance in Doho found inequity in the water distribution between downstream and upstream Doho [39]. Our analysis finds that the hydraulic position of the block along the secondary canal influences FCR upstream and downstream. Since location is a common denominator in both studies, we infer that farmers’ sufficient water supply affects FCR.
3.2. FCR within the Irrigation Block
3.2.1. Effects of Hydraulic Position on FCR along Tertiary and Strip Canals
As shown in Figure 7, the results of variations of FCR within the surveyed blocks are presented. There is a general decrease in FCR downstream of the tertiary and strip canals. This is evident by the increase in the intensity of the block group of FCR < 40 and 40 < FCR < 60 in the downstream areas at all canal levels.
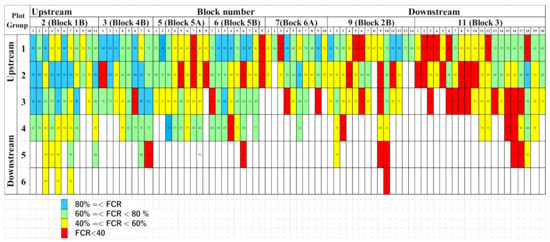
Figure 7.
Water FCR distribution within the irrigation blocks.
Figure 8a shows the sample data for regression, and the multiple regression output is shown in Figure 8b.
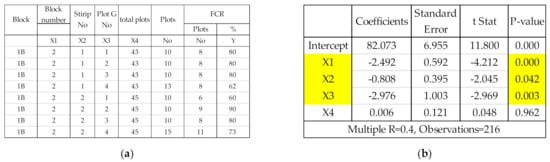
Figure 8.
Sample of regression parameter (a) and inter strip multi regression results at 95% significance (b).
3.2.2. Influence of Strip Length on FCR
The analysis of the impacts of strip length on FCR is summarized in Figure 9a and graphically plotted in Figure 9b. The average fee collection rate increases with a decrease in the total number of plots along a particular strip in all the blocks.
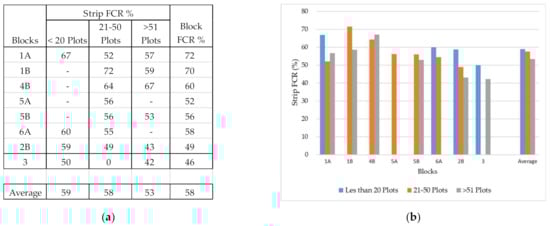
Figure 9.
FCR length of various strip lengths (a) and graph of FCR at different strip lengths (b).
The FCR of each strip category decreases towards downstream blocks. The average FCR of strips with less than 20 plots is consistently higher than the average block FCR; the average FCR of strips with 21–50 plots is almost the same as block FCR, and the average FCR of strips with plots >51 is lower than block FCR. Lowering the number of plots along a particular strip to an optimum number of fewer than 50 plots will increase the ease of water distribution [49,50] and improve water sufficiency and thus the FCR of each respective block.
The proposed number aligns with Dunbar’s layers of numbers in real life of face-to-face interaction. According to Dunbar, successive layers include 15 (good friends), 50 (friends), and 150 (meaningful) [49]. It is thus crucial for designers to factor in the optimum length of each canal at the design stage to enable better water distribution, better water sufficiency, and higher FCR.
3.2.3. Influence of Inter Strip Rotation on FCR
Interstrip block rotational irrigation exists in blocks 1B and 2B. It is thus expected that in these two blocks, the impacts of strip and plot location are relatively small. We executed a multi regression analysis to see the effects of block rotations. In both blocks, the influence of strip location diminishes from influencing water sufficiency and FCR, while the plot factor persists in both but is weaker in block 1B. The plot could be a factor because block 2B is the most downstream block, implying that even with perfect rotation, the water sufficiency of the block is still hampered due to its location downstream.
3.3. Water Management Factors Influencing FCR
The results of the field investigation and interviews on the water management of each block are shown in Table 3. The table shows that whereas the hydraulic position factor is the most dominant influencing FCR, other water management factors also play a role in FCR [7,17,51,52,53,54,55]. The commitment of block leaders, the flexibility of schedules, and the frequency of meetings can also strengthen water sufficiency in blocks, as evidenced in 1B.
Table 3.
Water management parameters within the block.
Block 5B, though midstream, could be doing fair because of the consistency of monthly meetings between leaders and farmers. In 2B, though inter-strip rotation exists, this factor is outweighed by hydraulic position dominance. Table 2 also shows that water sufficiency can not only be enhanced with physical infrastructures alone but also with institutional mechanisms that enforce water management.
4. Discussion
4.1. Distribution of FCR and Its Factors
Although the average FCR in the Doho rice scheme is low at 55%, we found that the FCR of each area in the irrigation district is not uniform and varies according to the hydraulic position of the paddy field along the canal. The FCR downstream is low, and the FCR is high upstream at all canal levels. Previous research in Doho found that the tail reaches of canals suffer in performance with adequacy, dependability, and equity [39]. This result thus suggests that water sufficiency in the downstream area is low at all canal levels.
In Doho, water allocation management organizations differ within and between blocks, complicating swift agreement between the tail and head since the head of the system resists changes. The following sections discuss the factors contributing to low water sufficiency in each area.
4.1.1. Among Blocks
For equal water distribution, the WUA has a well-organized system with a weekly rotation irrigation schedule and rules [34]. There are just 11 division gates and five check gates, making water distribution control easier. These 11 gates are never broken and are easily operated and watched by two government field staff. WUA also has a frequently revised monitoring-feedback system for water distribution
The results from our study show a decrease in FCR with an increase in head canal length along the secondary canal. Other studies also confirm the actual amount of water distributed to the downstream blocks is low in Doho [21,22,39]. Hydraulics performance evaluation shows a 32% water delivery loss through secondary channels [42]. As confirmed by our results and supported by other studies, water insufficiency would still exist downstream without consideration for head losses in scheduling, even with a good water management schedule and plan.
Additionally, as observed in the trend of FCR among blocks in our study, amidst a water distribution plan prepared by WUA but without flow measurement and flow data to guide water distribution, water reaching downstream will still be insufficient, and insufficient water would lead to low FCR.
4.1.2. Within Each Block
Within blocks, block and strip leaders manage water allocation [34]. Both the block and strip leaders are farmers, sometimes cultivating outside their specific blocks and not full-time water distribution staff. Except for 1A and 2B, water distribution to strips is performed simultaneously, and with most water control gates not being functional, water regulation to each strip is challenging. Further, water abstraction from strip to paddy fields is left to farmers with no block having systematic water uptake order. The labor required to operate the system is significant and complicates easy water access downstream.
Thus, although there is a concept of equal water distribution, unlike among irrigation blocks, there is no concrete water distribution plan within blocks. Farmers take water as they wish without no particular order. This is consistent with a previous study on the Doho Irrigation Scheme [34], which indicated that water distribution in the block is a problem and that farmers are dissatisfied with water supply, especially in the downstream areas along the strip.
4.2. Measures to Improve Water FCR
4.2.1. Measures to Improve Water FCR among Irrigation Blocks
At the block levels, as the differences in FCR between blocks in this study suggest, farmers’ agreements for equal water allocation and irrigation organizational structures alone cannot improve the water sufficiency in downstream areas. It is necessary to take technical measures to ensure water is distributed equally to many blocks with less management, less monitoring effort, and cheaper facilities. There are a few diversion points between irrigation blocks for water volume adjustment, and flow measurement devices can be installed. Inter-block rotation exists in Doho and is fixed throughout the year, but water insufficiency still exists downstream [39]. It implies that block rotation irrigation can be improved even in the present condition by factoring in water losses at the head canals.
4.2.2. Measures to Improve Water FCR within Irrigation Blocks
There are more than 5000 paddy plots in Doho; rigorous flow observation is difficult due to the required equipment and labor based on the number of intakes. Some proposed technical measures would include:
Rotational irrigation; with rotation, the hydraulic position factor can be substituted with time factors that WUAs can control. Within blocks, rotational irrigation is possible among strips and plots. As our result reveals, the hydraulic position of the blocks, strip, and plots affects water sufficiency and water FCR, so management options that replace the hydraulic position factor with a time factor at the three levels would increase water FCR. Inter-strip rotation exists in blocks 1B and 2B and can be adopted to demystify the impacts of strip and plot location on water sufficiency. Inter-plot rotation along a particular strip is not currently practiced in Doho. It is thus vital to introduce rotation such that all farmers can access water in a timely fashion, contrary to the current dictate of the hydraulic position.
Shorter strips; The average fee collection ratio increases with a decrease in the total number of plots along a particular strip. The average FCR of strips with less than 20 plots is consistently higher than the average block FCR. Lowering the number of plots along a particular strip to an optimum number of not more than 50 plots will increase the ease of water distribution, increase water sufficiency, and thus the FCR of each respective block.
5. Conclusions and Recommendations
Based on the hypothesis that water sufficiency is the basis of FCR and water sufficiency is related to the hydraulic position of irrigated areas along canals, we conducted a case study on Doho’s large paddy irrigation scheme in Uganda. We analyzed the relationship between the hydraulic position of irrigated areas and FCR at all canal levels. The results revealed the following:
- A trend showing lower downstream FCR was observed at all canal levels: The FCR is lower in the downstream blocks, the downstream tertiary, and the downstream strips, which may reflect insufficient water supply as one moves downstream at all canal levels—implying that adequate water supply and farmers’ satisfaction with irrigation water strongly influence FCR.
- Among irrigation blocks, even with rotational irrigation, FCR decreases downstream, implying water management is essential but not absolute; on-farm technical measures, such as factoring conveyance losses and installing flow measuring devices, are crucial.
- Inside irrigation blocks, FCR decreases downstream along tertiary and strips canals, but FCR was relatively high in blocks with intra-block rotational irrigation and shorter strips. As the results suggest, coupled with building consensus among farmers considering measures such as shorter strips, inter-strip rotation, and inter plot rotation is essential for increasing FCR.
It is important to emphasize that introducing on-farm technical methods for equal water allocation without an agreement on the management system within the water users’ organization is difficult. Still, at the same time, it is also challenging to realize equal water allocation by agreement alone. Thus establishing a management system based on the consensus of the farmers and field-based technical diagnosis is more effective.
Unlike in paddy rice, applying this research methodology to other crops more susceptible to yield damage by excess water may produce similar results in limited moisture conditions. This is yet to be confirmed with further research.
Factors affecting FCR may include farmers’ economic status and education level, the intensity of penalties for not paying water use fees, the transparency of the accounting of water use organizations collecting water use fees and the provision of labor for water management. The authors recognized those factors but believe that water sufficiency is the primary basis for FCR; we focused on water sufficiency for this study and have not analyzed the above other factors. However, to improve FCR in a complete sense in actual irrigated areas, it will be necessary to evaluate these effects and propose comprehensive measures.
Further, if global warming increases, mainly manifesting in the form of reduced catchment run-off, the frequency and severity of droughts in irrigated areas would increase, and the water FCR problem could become more serious. Countermeasure efforts for equitable water distribution will become increasingly important.
Author Contributions
Conceptualization, P.A., A.I. and M.S.; methodology; P.A. and A.I.; Validation; P.A., A.I. and M.S.; formal analysis P.A. and A.I.; Field Investigation and data collection; P.A. and A.I.; writing—original draft preparation; P.A. and A.I.; writing—review, and editing; P.A., A.I. and M.S.; Final proofreading, M.S.; supervision, A.I. and M.S.; project administration; P.A. and A.I. funding acquisition, A.I. All authors have read and agreed to the published version of the manuscript.
Funding
This research was funded by JSPSKAKENHI under grant numbers 19K06288, 20KK0145, and 22K05881.
Informed Consent Statement
Not applicable.
Data Availability Statement
The dataset used for the analysis was obtained from the Doho Irrigation scheme office in Uganda.
Acknowledgments
The author acknowledges the support and contribution of the Doho irrigation scheme office for timely submission of data and participation in focus group discussions.
Conflicts of Interest
The authors declare no conflict of interest, and the funders had no role in the study’s design; in the collection, analyses, or interpretation of data, in the writing of the manuscript, or in the decision to publish the results.
References
- Diao, X.; Fan, S.; Kanyarukiga, S.; Yu, B. Investment in Agricultural Water for Poverty Reduction and Economic Growth in Sub-Saharan Africa; World Bank: Washington, DC, USA, 2007; Volume 90. [Google Scholar]
- World Bank. Shaping the Future of Water for Agriculture; Agricultural and Rural Development Department, World Bank: Washington, DC, USA, 2005. [Google Scholar]
- IRRI Planthopper–IRRI Rice Knowledge Bank. Available online: http://www.knowledgebank.irri.org/step-by-step-production/growth/water-management (accessed on 5 May 2022).
- Oad, R.N.; Fowler, D.A. Fowler Rice Irrigation Water Management; Colorado State University: Fort Collins, CO, USA, 1983. Available online: http://pdf.usaid.gov/pdf_docs/PNAAS245.pdf (accessed on 3 April 2022).
- FAO. 2011 The State of the World’s Land and Water Resources for Food and Agriculture: Managing Systems at Risk; FAO: Rome, Italy, 2013; ISBN 978-0-20-314283-7. [Google Scholar]
- Tardieu, H.; Préfol, B.; Vidal, A.; Plantey, J.; Fernandez, S.; Dinar, A.; Marin, P.; Asad, M.; De Jong, I.; Baietti, A.; et al. Emerging Public-Private Partnerships in Irrigation Development and Management; World Bank: Washington, DC, USA, 2007. [Google Scholar]
- Satoh, M.; Ishii, A. Japanese Irrigation Management at the Crossroads. Water Altern. 2021, 14, 413–434. [Google Scholar]
- Ounvichit, T. Equal Water Sharing in Scarcity Conditions: The Case of the Chaisombat Muang Fai Irrigation System in Thailand. Paddy Water Environ. 2011, 9, 325–332. [Google Scholar] [CrossRef]
- Aarnoudse, E.; Closas, A.; Lefore, N. Water User Associations: A Review of Approaches and Alternative Management Options for Sub-Saharan Africa; International Water Management Institute: Colombo, Sri Lanka, 2018; Volume 180. [Google Scholar]
- Donnelly, E. Japan–African Engagement and TICAD IV: Can Japan Lead the Way on African Development? Chatham House: London, UK, 2008. [Google Scholar]
- Bardhan, P. Irrigation and Cooperation: An Empirical Analysis of 48 Irrigation Communities in South India. Econ. Dev. Cult. Chang. 2000, 48, 847–865. [Google Scholar] [CrossRef]
- UNRDS. Uganda National Rice Development Strategy (UNRDS); UNRDS: Entebbe, Uganda, 2009. [Google Scholar]
- Ministry of Agriculture, Animal Industry and Fisheries (MAAIF); Ministry of Water and Environment (MWE). National Irrigation Policy: Agricultural Transformation Through Irrigation Development; Republic of Uganda: Kampala, Uganda, 2017. [Google Scholar]
- Wanyama, J.; Ssegane, H.; Kisekka, I.; Komakech, A.J.; Banadda, N.; Zziwa, A.; Ebong, T.O.; Mutumba, C.; Kiggundu, N.; Kayizi, R.K.; et al. Irrigation Development in Uganda: Constraints, Lessons Learned, and Future Perspectives. J. Irrig. Drain. Eng. 2017, 143, 04017003. [Google Scholar] [CrossRef]
- Bjornlund, V.; Bjornlund, H.; van Rooyen, A.F. Exploring the Factors Causing the Poor Performance of Most Irrigation Schemes in Post-Independence Sub-Saharan Africa. Int. J. Water Resour. Dev. 2020, 36, S54–S101. [Google Scholar] [CrossRef]
- Easter, K.W.; Zekri, S. Reform of Irrigation Management and Investment Policy in African Development. S. Afr. J. Econ. Manag. Sci. 2004, 7, 652–663. [Google Scholar] [CrossRef][Green Version]
- Tang, S.Y. Institutions and Collective Action: Self-Governance in Irrigation, 1st ed.; Center for Self-Governance, Institute of Contemporary Studies: San Francisco, CA, USA, 1992; ISBN 1558151796. [Google Scholar]
- Ostrom, E.; Gardner, R. Coping with Asymmetries in the Commons: Self-Governing Irrigation Systems Can Work. J. Econ. Perspect. 1993, 7, 93–112. [Google Scholar] [CrossRef]
- Freeman, D.M. Local Organizations for Social Development: Concepts and Cases of Irrigation Organization; Routledge: London, UK, 2021; ISBN 978-0-42-969400-4. [Google Scholar]
- Nakawuka, P.; Langan, S.; Schmitter, P.; Barron, J. A Review of Trends, Constraints and Opportunities of Smallholder Irrigation in East Africa. Glob. Food Sec. 2018, 17, 196–212. [Google Scholar] [CrossRef]
- Bwambale, E.; Gathogo Home, P.; Messo Raude, J.; Wanyama, J. Development of a Water Allocation Model for Equitable Water Distribution at Doho Rice Irrigation Scheme, Uganda. Hydrology 2019, 7, 62. [Google Scholar] [CrossRef]
- Nakano, Y.; Otsuka, K. Determinants of Household Contributions to Collective Irrigation Management: The Case of the Doho Rice Scheme in Uganda. Environ. Dev. Econ. 2011, 16, 527–551. [Google Scholar] [CrossRef]
- Bembridge, T. Small-Scale Farmer Irrigation Schemes in South Africa. 2000. Available online: https://www.dws.gov.za/WAR/documents/WARSmallFarmers.pdf (accessed on 3 April 2022).
- Groenfeldt, D.; Svendsen, M. Case Studies in Participatory Irrigation Management; World Bank Institute: Washington, DC, USA, 2000; ISBN 0821345400. [Google Scholar]
- Padmajani, M.T.; Bandara, M.A.C.S. Farmer Participation in Irrigation System Management: Achievements and Drawbacks; Hector Kobbekaduwa Agrarian Research and Training Institute: Colombo, Sri Lanka, 2012; ISBN 978-9-55-612144-5. [Google Scholar]
- Koç, C. Sustainability of Irrigation Schemes Transferred in Turkey. Irrig. Drain. 2018, 67, 242–250. [Google Scholar] [CrossRef]
- Sserunkuuma, D.; Ochom, N.; Ainembabazi, J.H. Collective Action in the Management of Canal Irrigation Systems: The Doho Rice Scheme in Uganda. Inst. Econ. Perspect. Afr. Agric. Dev. 2009, 17, 375–387. [Google Scholar]
- Namyenya, A.; Sserunkuuma, D.; Bagamba, F. Willingness to Pay for Irrigation Water and Its Determinants among Rice Farmers at Doho Rice Irrigation Scheme (DRIS) in Uganda. J. Dev. Agric. Econ. 2014, 6, 345–355. [Google Scholar] [CrossRef]
- Satoh, M. Japanese Model of Participatory Irrigation Management and Its Implications. In Proceedings of the 8th Asian Regional Conference, Kathmandu, Nepal, 2–4 May 2018; pp. 3–6. [Google Scholar]
- Kakuta, I. Irrigation Management Problems Derived from Organizational Evaluation of a Water Users Association at the Kpong Irrigation Scheme in Ghana. J. Inst. Asian Stud. 2019, 17, 169–217. [Google Scholar]
- Ounvichit, T.; Wattayu, S.; Satoh, M. Participatory Management Structure of Large-Scale People’s Irrigation System: The Case of the Soprong Muang Fai System, Northern Thailand. Southeast Asian Stud. 2008, 46, 145–162. [Google Scholar]
- Kakuta, I. Irrigation Management Problems Derived by a WUA Evaluation at the Kpong Irrigation Scheme (KIS) in Ghana. Paddy Water Environ. 2019, 17, 141–150. [Google Scholar] [CrossRef]
- Yakubov, M. Assessing Irrigation Performance from the Farmers’ Perspective: A Qualitative Study. Irrig. Drain. 2012, 61, 316–329. [Google Scholar] [CrossRef]
- Ayella, P.; Ishii, A.; Satoh, M. A Comparative Analysis of Two Paddy Irrigation Schemes under Contrasting Water Management of Participatory and Top-down Systems in Uganda. Paddy Water Environ. 2019, 17, 497–505. [Google Scholar] [CrossRef]
- El Ghany, S.H.A.; Nassar, A.; Swelam, A.; ElFetyany, M. Assessment of Irrigation Water and Water Delivery Performance at Branch Canal Level in the Nile Delta. Int. J. Civ. Eng. Technol. 2020, 11, 17–34. [Google Scholar] [CrossRef]
- Vandersypen, K.; Bengaly, K.; Keita, A.C.T.; Sidibe, S.; Raes, D.; Jamin, J.Y. Irrigation Performance at Tertiary Level in the Rice Schemes of the Office Du Niger (Mali): Adequate Water Delivery through over-Supply. Agric. Water Manag. 2006, 83, 144–152. [Google Scholar] [CrossRef]
- Takayama, T.; Matsuda, H.; Nakatani, T. The Determinants of Collective Action in Irrigation Management Systems: Evidence from Rural Communities in Japan. Agric. Water Manag. 2018, 206, 113–123. [Google Scholar] [CrossRef]
- Molden, D.J.; Gates, T.K. Performance Measures for Evaluation of Irrigation-Water-Delivery Systems. J. Irrig. Drain. Eng. 1990, 116, 804–823. [Google Scholar] [CrossRef]
- Bwambale, E.; Home, P.; Raude, J.; Wanyama, J. Hydraulic Performance Evaluation of the Water Conveyance System of Doho Rice Irrigation Scheme in Uganda. J. Sustain. Res. Eng. 2019, 5, 101–112. [Google Scholar]
- Zardari, N.H.; Cordery, I. Water Productivity in a Rigid Irrigation Delivery System. Water Resour. Manag. 2009, 23, 1025–1040. [Google Scholar] [CrossRef]
- Unal, H.B.; Asik, S.; Avci, M.; Yasar, S.; Akkuzu, E. Performance of Water Delivery System at Tertiary Canal Level: A Case Study of the Menemen Left Bank Irrigation System, Gediz Basin, Turkey. Agric. Water Manag. 2004, 65, 155–171. [Google Scholar] [CrossRef]
- Fan, Y.; Gao, Z.; Wang, S.; Chen, H.; Liu, J. Evaluation of the Water Allocation and Delivery Performance of Jiamakou Irrigation Scheme, Shanxi, China. Water 2018, 10, 654. [Google Scholar] [CrossRef]
- Molden, D.; Burton, M.; Bos, M.G. Performance Assessment, Irrigation Service Delivery and Poverty Reduction: Benefits of Improved System Management. Irrig. Drain. 2007, 56, 307–320. [Google Scholar] [CrossRef]
- Hurmerinta-Peltomäki, L.; Nummela, N. Mixed Methods in International Business Research. Manag. Int. Rev. 2006, 46, 439–459. [Google Scholar] [CrossRef]
- Morse, J.M.; Niehaus, L. Principles and Procedures of Mixed Methods Design; Left Coast Inc.: New York, NY, USA, 2009; Volume 4, ISBN 978-1-59-874297-8. [Google Scholar]
- Babbitt, C.H.; Burbach, M.; Pennisi, L. A Mixed-Methods Approach to Assessing Success in Transitioning Water Management Institutions: A Case Study of the Platte River Basin, Nebraska. Ecol. Soc. 2015, 20, 54. [Google Scholar] [CrossRef]
- Wisler, A.K. Research Design, Qualitative, Quantitative and Mixed Method Aproaches. Intercult. Educ. 2009, 20, 127–133. [Google Scholar] [CrossRef]
- Creswell, J.; Clark, V.P. Designing and Conducting Mixed Methods Research, 2nd ed.; SAGE Publications: Los Angeles, CA, USA, 2011; ISBN 978-1-41-297517-9. [Google Scholar]
- Hill, R.A.; Dunbar, R.I.M. Social Network Size in Humans. Hum. Nat. 2003, 14, 53–72. [Google Scholar] [CrossRef] [PubMed]
- Reed, Z. Book Review: The Tipping Point: How Little Things Can Make a Big Difference. Ment. Health Rev. J. 2000, 5, 29. [Google Scholar] [CrossRef]
- Sarker, A.; Itoh, T. Design Principles in Long-Enduring Institutions of Japanese Irrigation Common-Pool Resources. Agric. Water Manag. 2001, 48, 89–102. [Google Scholar] [CrossRef]
- Satoh, M. Japanese Model of Participatory Irrigation Management and Its Implications; University of Tsukuba: Tsukuba, Japan, 2018. [Google Scholar]
- Trawick, P.B.; Trawick1, P.B. Successfully Governing the Commons: Principles of Social Organization in an Andean Irrigation System. Source Hum. Ecol. 2001, 29, 1–25. [Google Scholar] [CrossRef]
- Ostrom, E.; Lam, W.F.; Pradhan, P.; Shivakoti, G.P. Improving Irrigation in Asia: Sustainable Performance of an Innovative Intervention in Nepal; Edward Elgar Publishing Ltd.: Northampton, MA, USA, 2011; ISBN 978-0-85-793802-2. [Google Scholar]
- Mwaura, F.M.; Muwanika, F.R. Providing Irrigation Water as a Public Utility to Enhance Agricultural Productivity in Uganda. Util. Policy 2018, 55, 99–109. [Google Scholar] [CrossRef]


Publisher’s Note: MDPI stays neutral with regard to jurisdictional claims in published maps and institutional affiliations. |
© 2022 by the authors. Licensee MDPI, Basel, Switzerland. This article is an open access article distributed under the terms and conditions of the Creative Commons Attribution (CC BY) license (https://creativecommons.org/licenses/by/4.0/).