Article

Identification, Abundance, and Chemical Characterization of Macro-, Meso-, and Microplastics in the Intertidal Zone Sediments of Two Selected Beaches in Sabah, Malaysia

by
Nur Zaida Zahari
1,*,
Piakong Mohd Tuah
2,
Muhammad Ramdi Junaidi
1 and
Siti Aishah Mohd Ali
1
1
Faculty of Science & Natural Resources, University Malaysia Sabah, UMS Road, Kota Kinabalu 88400, Sabah, Malaysia
2
Bioreg Technology Solutions Sdn. Bhd. (1291799-P) H-2-2-03 Block H Lot 3 2nd floor Jalan Kian Yap, Inanam Capital, Kota Kinabalu 88450, Sabah, Malaysia
*
Author to whom correspondence should be addressed.
Water 2022, 14(10), 1600; https://doi.org/10.3390/w14101600
Submission received: 23 March 2022 / Revised: 1 May 2022 / Accepted: 11 May 2022 / Published: 17 May 2022
(This article belongs to the Special Issue Microplastics and Their Impacts on Organisms and Trophic Chains)

Abstract

:
This study aims to present the identification, abundance, and chemical characterization of plastics in the intertidal zone sediment of two selected beaches in Kota Kinabalu city, Sabah, Malaysia. Plastic debris was classified according to weight and size and was identified for its heavy metal concentrations and polymer types. Results showed that a higher abundance, by more than 2-fold, of plastic debris was found in Kebagu beach (28.7 g) compared to ODEC, UMS (13.4 g). FTIR analysis showed that polypropylene (PP) and polyethylene (PE) were the dominant plastic polymers on both beaches, followed by polystyrene (PS) and polyethylene terephthalate (PET). Five heavy metals (arsenic, chromium, copper, zinc, and nickel) were detected from four types of plastics. The results showed that the concentration of Zn was higher in all four types of plastics on both beaches, with a range of 41 mg/kg–135.3 mg/kg, followed by Cr and As, while Ni was the lowest concentration detected in PE on both beaches: 5.6 mg/kg (ODEC) and 5.1 mg/kg (Kebagu stations). This study confirmed the presence of macro-, meso- and microplastics in both stations. Further studies remain necessary for a better understanding of the sources and fates of the pollutant in the marine environment. Findings from the studies of the Kota Kinabalu beaches have provided baseline data and a clearer understanding of the distribution of plastic debris. This demonstrates that commitments and actions are required to mitigate the potential risk to the ecological system and human health.

1. Introduction

Plastic pollution has received worldwide attention due to its pervasive presence in the environment, particularly on our beaches and in our oceans. Due to the low cost, durability, high flexibility, and light weight of plastics, they are widely used in all facets of our everyday lives, leading to the accumulation of plastic wastes in the environment that are inevitably released into the ocean via numerous pathways. According to Nizzetto et al. [1], microplastics are transported via river flow regimes and flooding events; however, sedimentation is influenced by microplastic’s shape, size, and density. The fate and transport of microplastics in rivers are governed by constructed structures such as dams and reservoirs, and a large number of microplastics are retained due to sedimentation. For example, in Sweden’s Gota River, microplastics with a higher density and larger size settle to the river bottom, whereas microplastics with densities of less than 1.0 g cm3 float on the water surface and are thus transported further into marine ecosystems [2].
Other than that, human activities such as illegal dumping, accidental inputs, or insufficient treatment capacity may contribute to the large amounts of plastic as marine debris [3]. It was reported that plastic dominates marine litter globally, accounting for between 80% and 85% of total marine waste [4]. When plastic debris is discarded or released into the environment, it might persist for decades due to its chemical properties [4]. Plastics decompose naturally at an extremely slow rate. After physical, chemical, and/or biological action, the plastic waste will be broken down into small pieces [5]. Plastics with particle sizes of less than 5 mm are classified as “microplastics” (MPs) [5], a term proposed by Thompson [6].
The majority of plastics found in the ocean and coastal areas are known as microplastics [7]. Microplastics are found on global beach locations [8] and accumulate toxins on their surfaces that are harmful; adsorption and adherence of heavy metal and organic pollutants such as polycyclic aromatic hydrocarbons (PAHs) resemble food intake and at the same time are attractive to marine organisms. Reports of ingestion of microplastic debris are widespread and increasing as investigators study a broader range of marine organisms. Some reports documented microplastic ingestion in seabirds, sea turtles, manatees, and cetaceans [9]. Bivalve corals found microplastics remained in the organism and transported within the tissue [10]. Numerous studies reported the harmful consequences of microplastics ingestion to marine organisms [11]. It was found to cause inflammation and liver toxicity and cause the accumulation of lipids in fish liver [12]. The exposure of microplastics to marine organisms and directly to human health have prompted researchers to further investigate the identification and characterization of these plastics.
As a result, several approaches with great sensitivity and selectivity for the detection, distribution, and identification of microplastics have been developed in this paper. We also highlighted different sizes of plastic polymers, which consist of macroplastics (>20 mm), mesoplastics (5–10 mm) and microplastics (<5 mm). To achieve its objectives, this paper describes the abundance of these plastics in two selected beaches in Sabah, Malaysia and the potential damage to marine ecosystems. The sampling, processing, identification, and characterization of these plastics are also reported. However, we used a standard procedure for collecting and analyzing the samples. In summary, the objective of this paper was to (1) quantify the macro-, meso- and microplastics present at two selected beaches, (2) present the standard methods for plastic detection, (3) evaluate the heavy metal concentrations by different types of plastic polymers, and (4) provide knowledge and future directions for plastics detection as well as recommendations for future research.

2. Materials and Methods

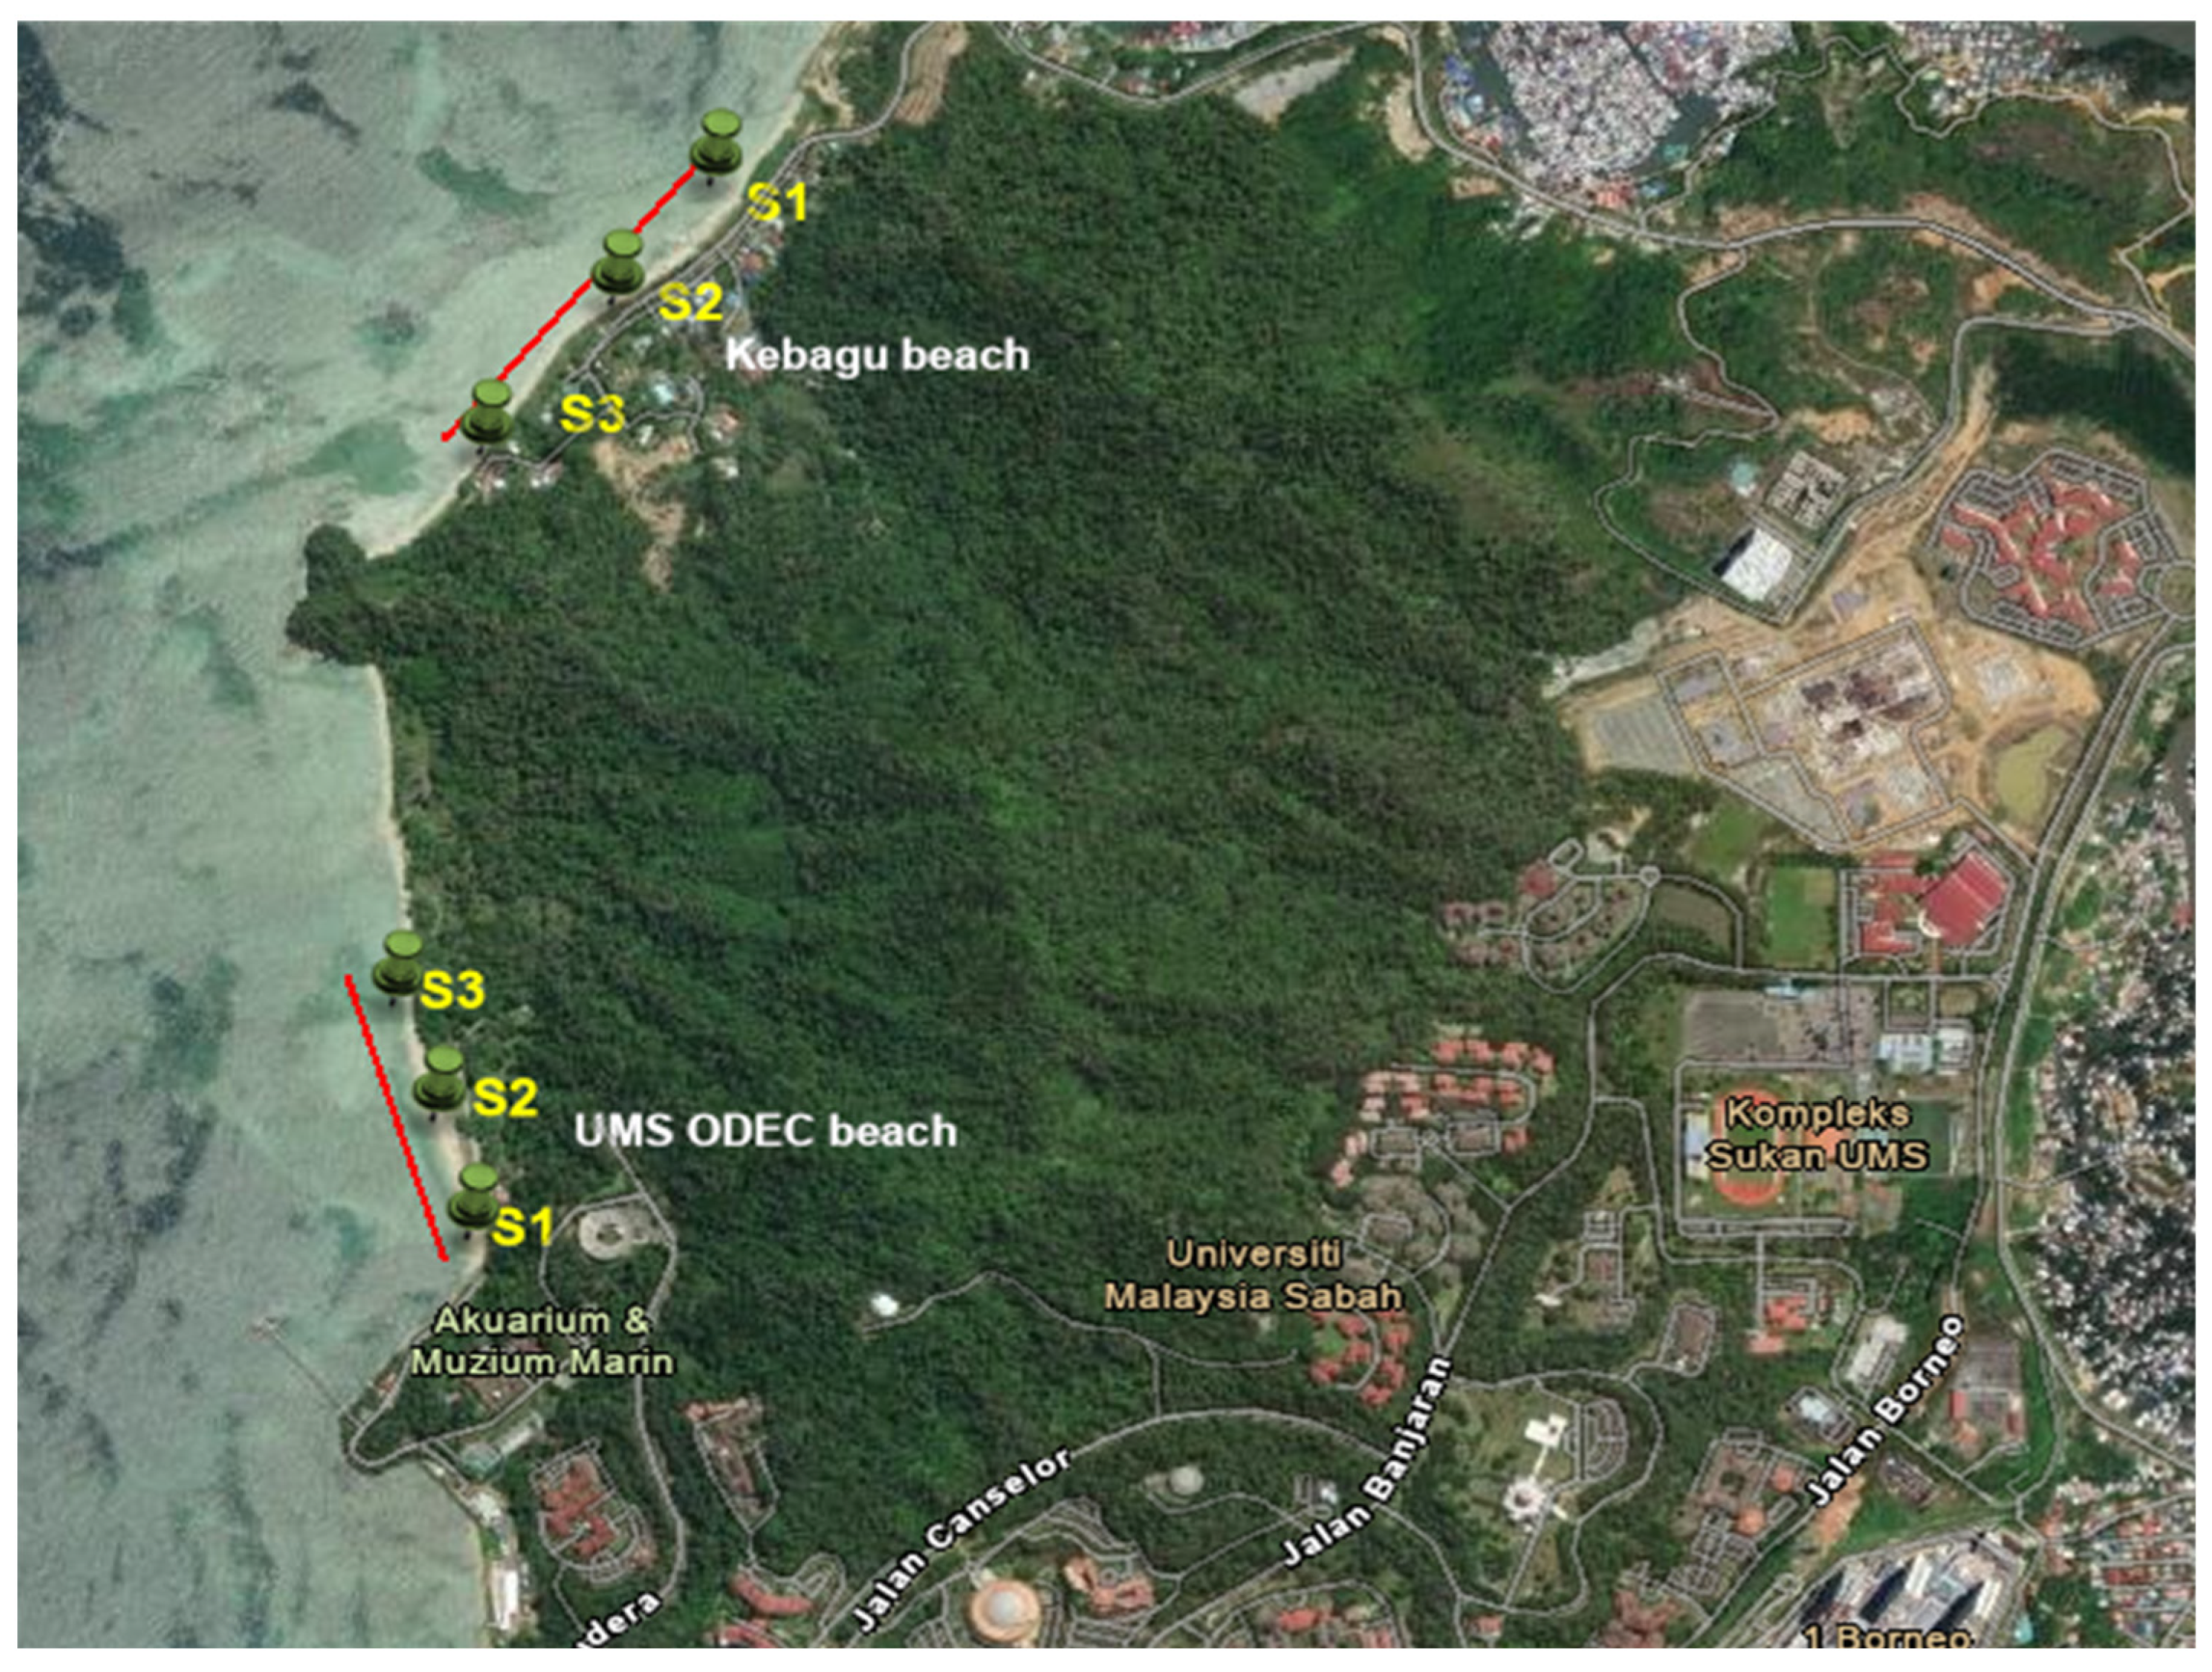
2.1. Study Area and Sampling Sites

The study was conducted in the intertidal zone of ODEC, UMS public beach, Kota Kinabalu, Sabah, Malaysia (6.04304° N, 116. 11177° E). Outdoor Development Centre (ODEC) is among the landmarks of Universiti Malaysia Sabah (UMS), Malaysia. It is a place for outdoor activities such as picnics, beach sports or retreat programs. Another sampling area was selected in the intertidal zone of Kebagu public beach, Kota Kinabalu, Sabah, Malaysia (6.0539° N, 116.1154° E). Figure 1 shows the maps for ODEC, UMS beach, Kota Kinabalu and Kebagu public beach, Kota Kinabalu, Sabah, Malaysia.

2.2. Sample Collection and Sample Preparation

Sampling was conducted at UMS ODEC and Kebagu stations in March 2018. There were three randomly selected sampling sites (S1, S2 and S3) at each station before a recreational and non-recreational beach. The sampling sites were 100 m apart from each other, with a 50 m transect along the intertidal zone in each site. In each line, every 5 m, a sediment sample was taken at 0–5 cm depth within a square frame of 20 cm × 20 cm. A stainless steel scoop was used to collect sediments at 2 cm depth from the surface from each sampling quadrant, while macroplastics that could be seen were collected with forceps. Sediment was then placed into labeled plastic bags and transferred to the laboratory. Sediment collection was performed during low tide. All sediment samples were dried at room temperature. Dried sediments were sieved through a 1 mm mesh stainless steel sieve. Plastic that had been collected was separated into macroplastics (>20 mm), mesoplastics (5–10 mm) and microplastics (<5 mm) and placed into separate labeled plastic bags for classification purposes. Different sizes of plastics that were retained on the sieve were picked up using stainless steel tweezers, visually sorted, and quantitatively measured for size and weight. However, plastic fragments that escaped the 1 mm sieve and the sediment were separated using the flotation separation method with isolation using NaCl with a density of 1.2 g/cm3. The NaCl solution (ρ = 1.2 g/cm3) was prepared in distilled water. Plastic particles with a specific gravity of 1.2 g/cm3 were filtered through Whatman filter paper using a vacuum pump. The NaCI residues were removed from plastic particles with distilled water. The plastic debris flushed along with the Whatman filter was then dried in a drying oven until constant weight.

2.3. Identification of Polymer Types from Fourier-Transform Infrared (FTIR) and Surface Morphology Observation

The identification of plastic polymer types was made using a total of 66 samples (n = 66) from ODEC and 131 samples (n = 131) from Kebagu station. Samples were cut to a size of >5 mm; then, pieces were placed on the Perkin-Elmer (Model: Spectrum 100) FTIR spectrometer. The samples were then scanned in the 4000–450 cm−1 wave number range. The data were presented in the form of spectrum peaks output from the scans expressed as %T. The results were identified with online polymer spectra database libraries. For morphological features, the plastic fragments were observed under stereo microscope and Carl Zeiss Scanning Electron Microscope (SEM). Images were captured and then enhanced for suitable brightness and contrast.

2.4. Heavy Metal Analysis

Macro-, meso- and microplastics were digested before heavy metals (As, Cr, Cu, Zn and Ni) were analyzed. The digestion process was conducted using 95–97% sulfuric and 65% nitric acid. Samples were wet-digested as described by Sakurai [13] and Ernst [5]. Eight plastic polymer types were separated into different porcelain crucibles. The samples were weighed to 50 mg. To each sample in the porcelain crucible with lid was added 2 mL of 95–97% sulfuric acid. The sample was then heated at maximum temperature setting on a hotplate in a fume hood until an oil-like black colored liquid was formed. Then, two to three drops of concentrated (65%) nitric acid were added to the hot liquid to digest the black carbon. The digestion was continued with drop-wise addition of nitric acid until the solution became a clear liquid and dense white fumes formed, indicating that the digestion was complete. After the digestion process completed, the sample was cooled to room temperature. For post-digestion treatment, the polypropylene centrifuge tube was filled with 5 mL of ultrapure water. The cooled extracts were filled into the tube. The crucible content was rinsed with ultrapure water and poured into the tube; this was repeated 3 times. The tube was tightly covered with screwcaps. The extract was transferred into a syringe with 0.45 um nylon membrane and filtered into a fresh set of sanitized 15 mL polypropylene centrifuge tubes topped up to final volume (12 mL) with ultrapure water and ready for instrument analysis. The heavy metal concentration was determined by each average concentration of metal using inductively coupled plasma–optical emission spectrometry (ICP-OES; Optima 5300 DV, Perkin Elmer) reading, the volume of dilution factor and the weight of each sample. The heavy metal concentrations were calculated with the following formula:
Concentration of heavy metal ( mg / kg ) = ICP - OES   reading ( Each average concentration metal ) × Dilution factor ( Weight of sample )

3. Results and Discussion

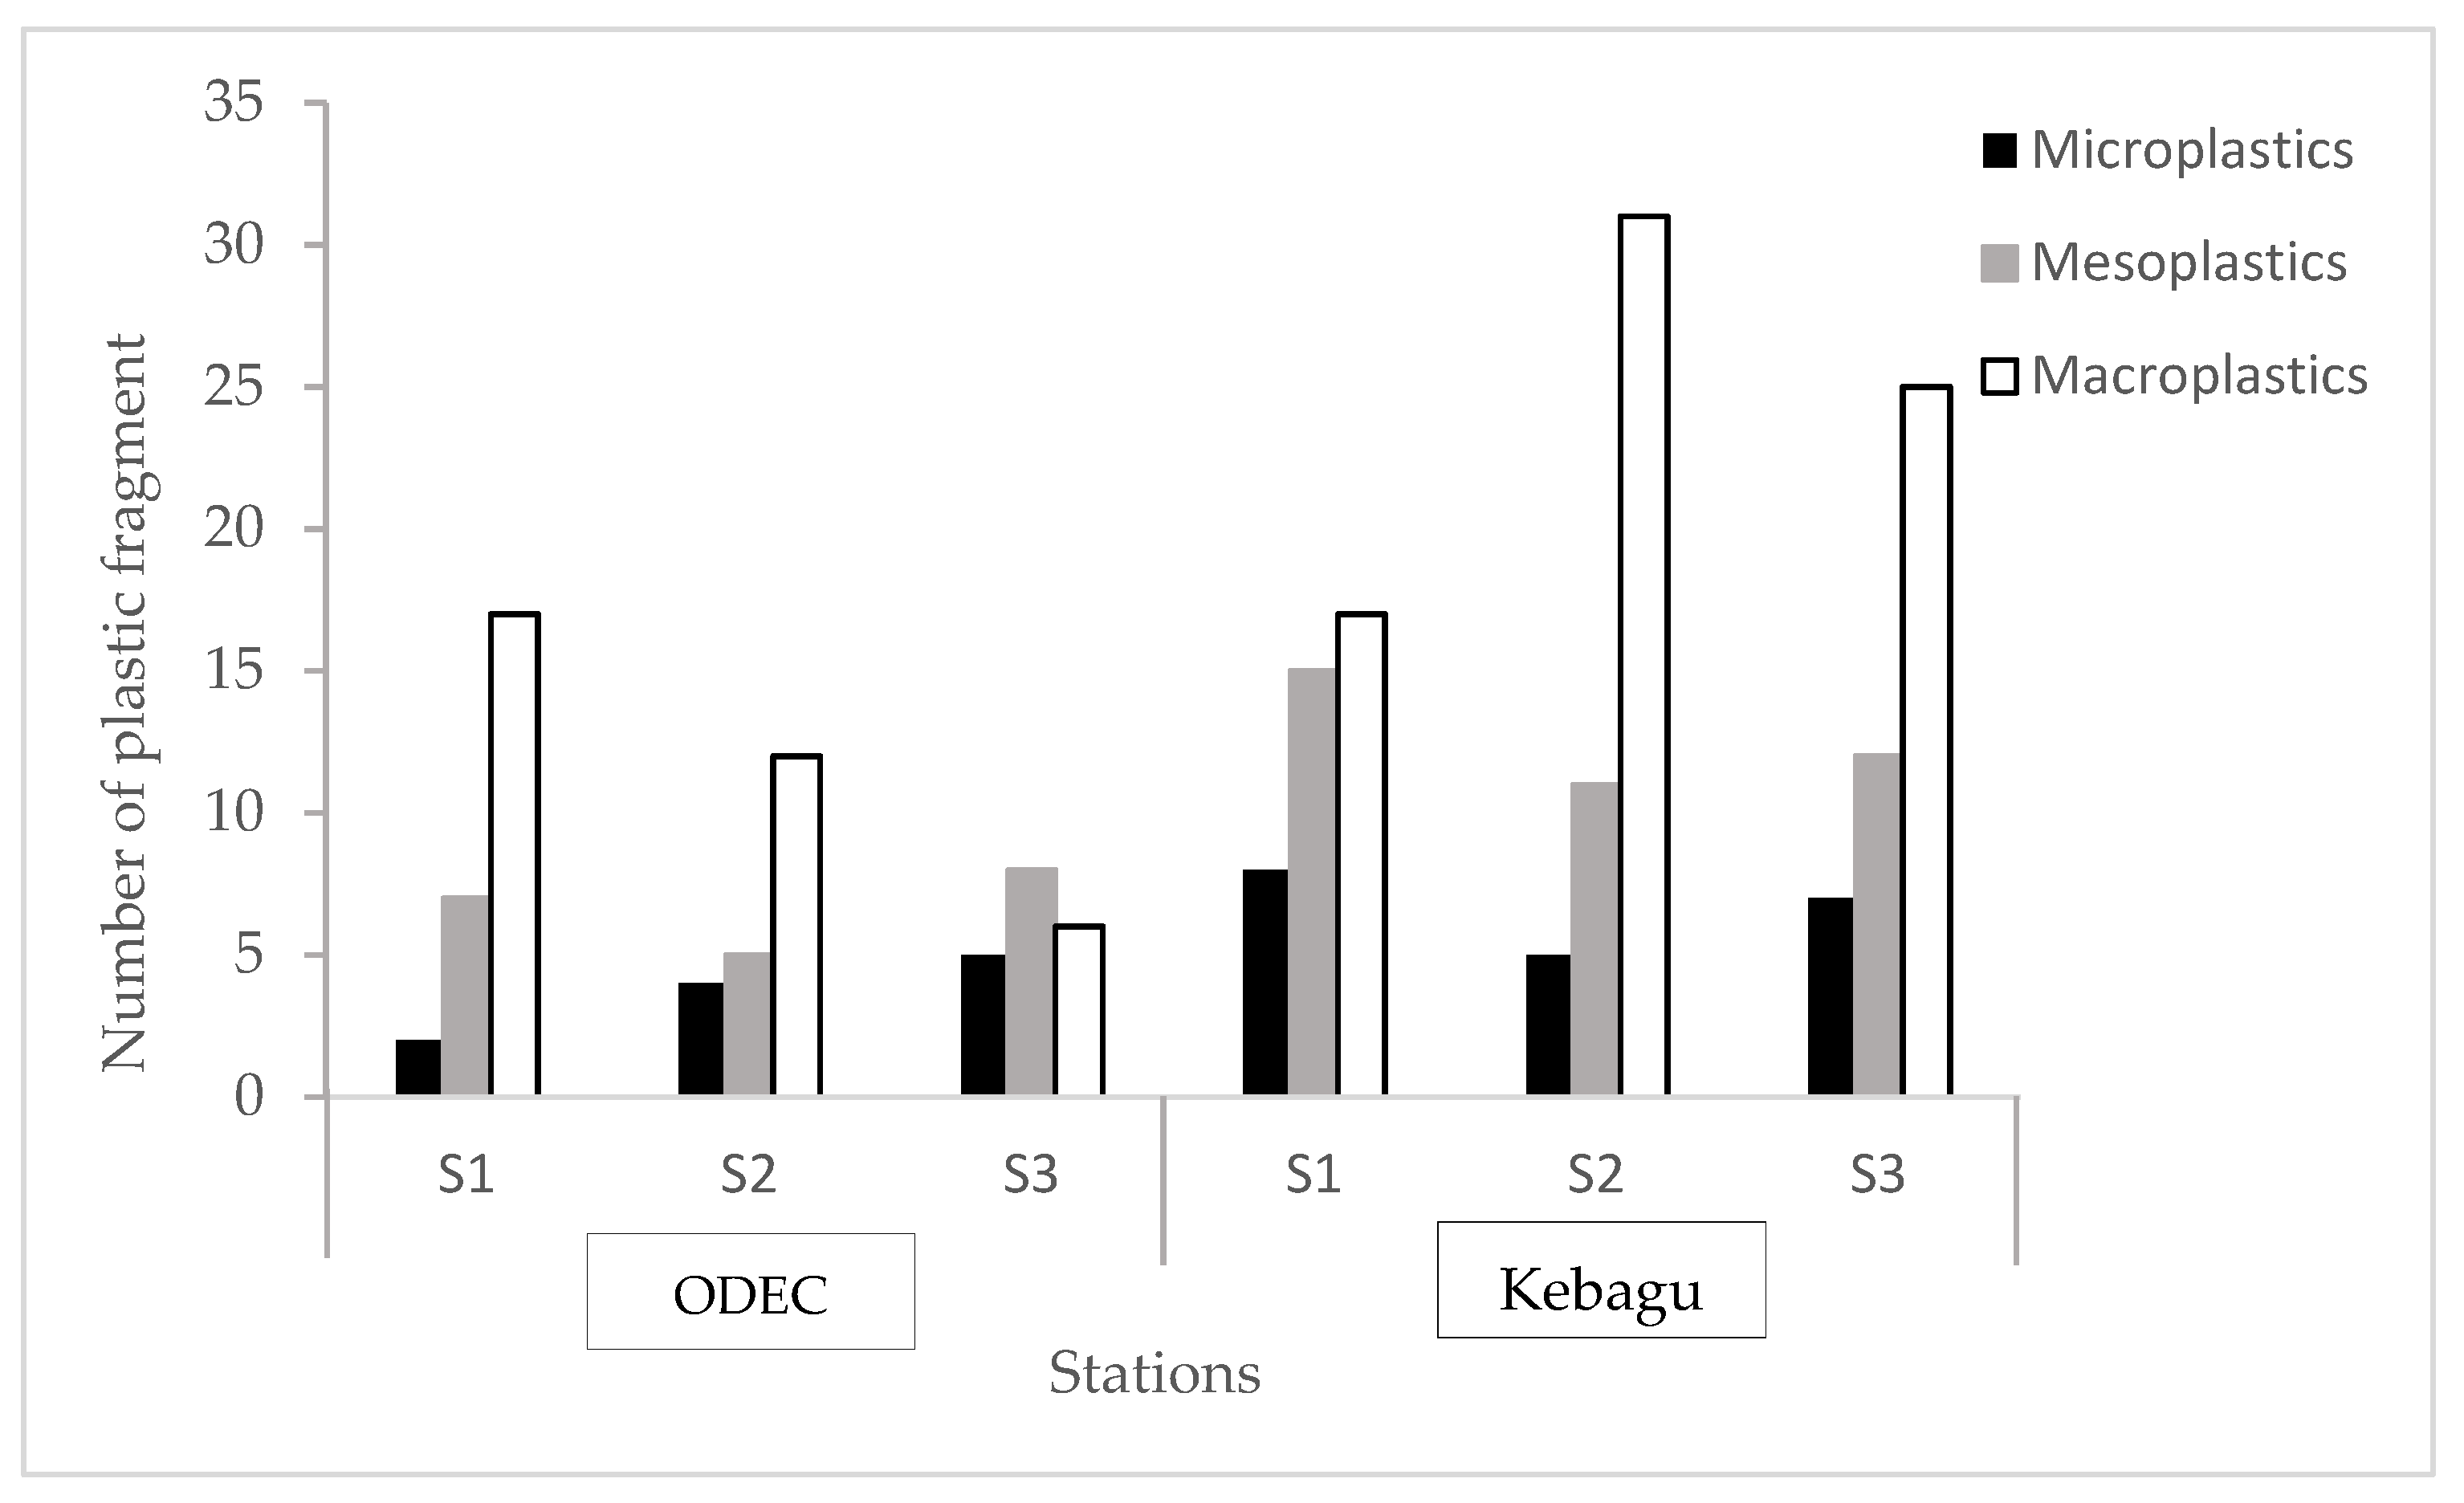
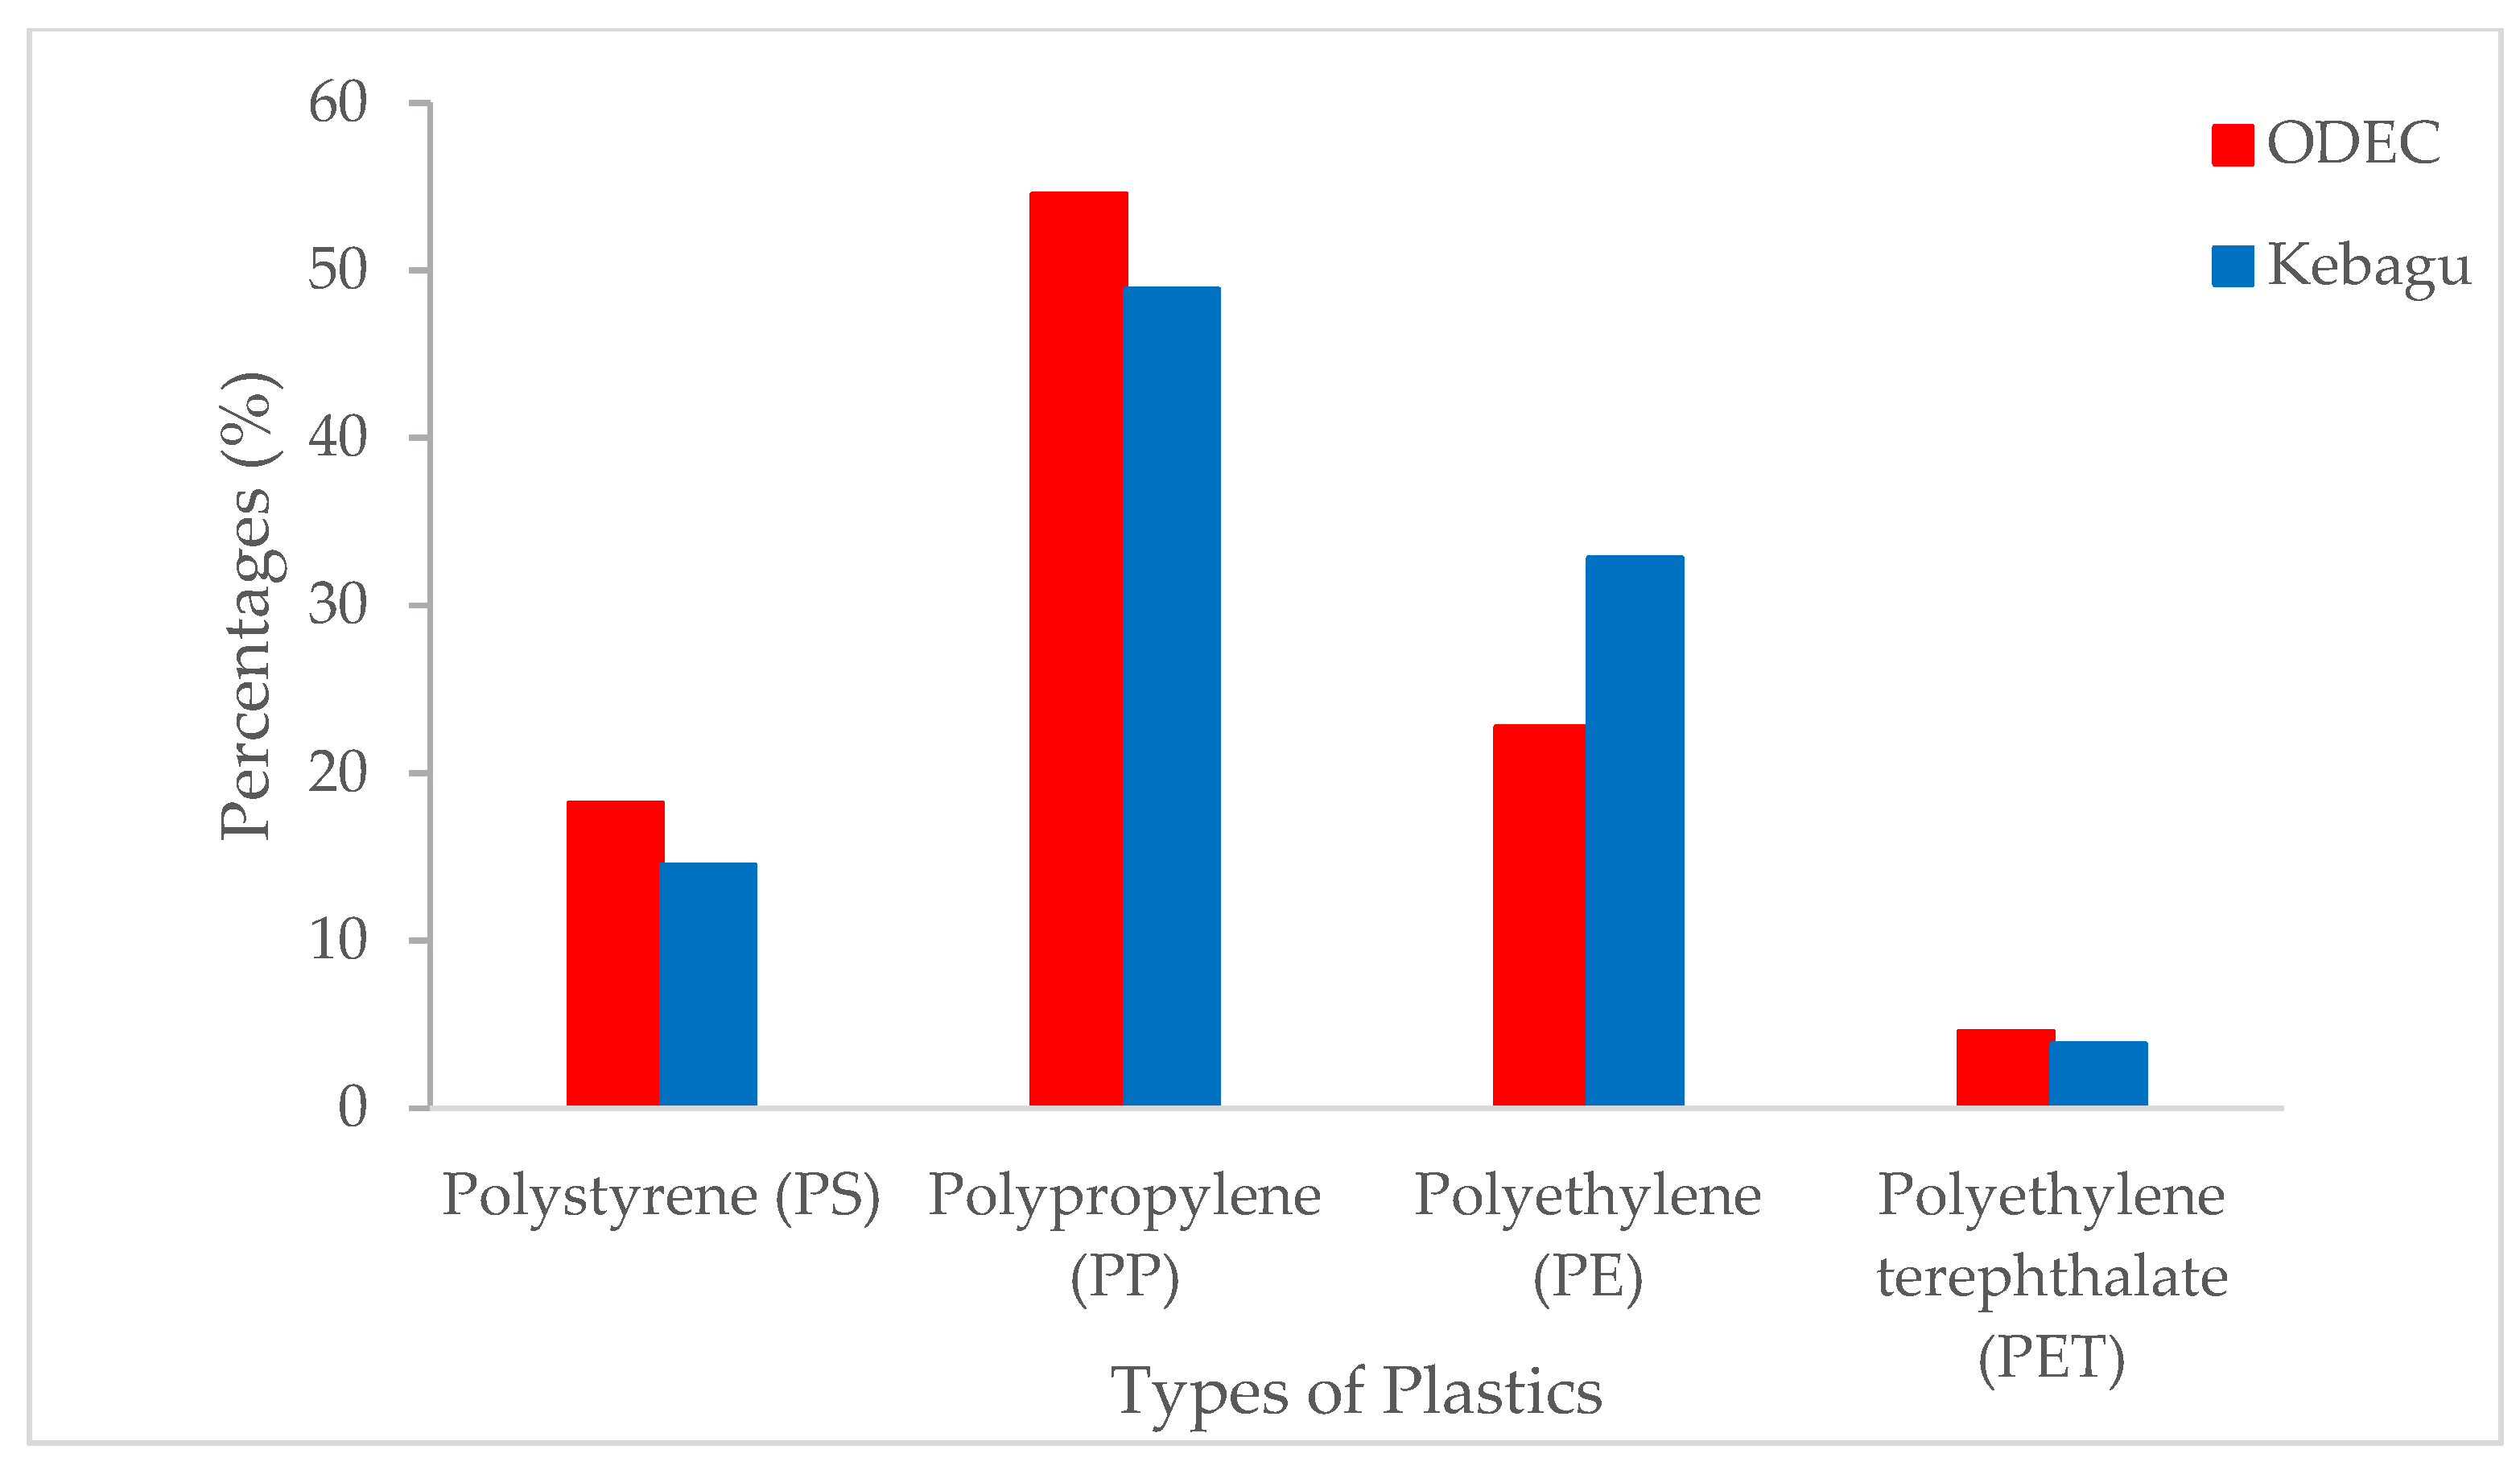
3.1. Weight and Quantity of Plastic Debris

The weight of plastic fragments collected from all sampling sites varied from 3.83 g to 10.3 g (Figure 2). Most of them were detected in diverse of sizes and shapes; thus, weight was used as a subjective indicator for plastics fragments. The differences in the plastic weight across the studied area were related to chemical and physical aging, especially on land due to the higher temperature, frictional forces and UV exposures. Overall, a total of 197 items of plastic debris were recorded from 30 samples of sediment, with 66 items of plastic debris from ODEC beach and 131 items of debris from Kebagu beach. ODEC station samples were recorded with a total weight of 13.4 g represented from S1 (4.9038 g), S2 (4.6568 g) and S3 (3.8347 g), while the samples from Kebagu station were recorded with a total weight of 28.7 g, which was the sum of S1 (8.7327 g), S2 (10.335 g) and S3 (9.6717 g). Generally, the Kebagu station samples were found to have a greater quantity of plastic fragments and debris compared to those from ODEC station. It was observed that a greater number of plastics were present in the Kebagu intertidal zone as compared to the ODEC intertidal zone. The intertidal zone is the tide level on a beach nearest to land. Most of the plastic debris and particles are washed into the intertidal zone during the highest tide incident, remaining behind when the tide recedes.
As Kebagu beach is near a residential area, the primary sources of the plastic come from household activities. In addition, human activities such as fishing (employing plastic equipment), plastic litter derived from land and the direct dumping of exfoliants, and toothpaste contribute to the sources of microplastics. The indiscriminate plastic disposal on beaches and in coastal areas with stormwater runoff might contribute to the abundance of microplastics. This is due to the natural transport across large distances by ocean currents, winds, and drift. Hence, this showed that despite beach clean-ups organized by the local authorities, amounts of small plastics were still widely retained at the study beaches. On the other hand, less plastic debris was found in the ODEC beach intertidal zone compared to Kebagu. This could also be related to good administrative management at the beach, such as effective solid waste management facilities and beach clean-up activities. This result has contributed to less plastic pollution retained at the ODEC beach, which is an attractive destination in Kota Kinabalu, and likely visited by tourists. During sampling at both beaches, it was found that most of the plastic debris in solid waste were not from industrial products. Instead, most of the plastic fragments came from packaging and household goods. The items included food packaging, children’s toys, plastic bottles, plastic bags, drinking straws, packaging foam, toiletries, bottle caps, ropes, strappings, and plastic sticks (cotton buds and lollipop sticks).
Table 1 shows the comparison of average quantity of plastic debris from other sampling sites.
The data presented revealed that fishing and recreational beaches (Kebagu beach) with a high density of beach users had increased exposure to human activities. This finding supports the results reported by Fauziah et al. [14], indicating that the amount of plastic debris is significantly related to the types of activities conducted on the beaches. Consequently, the presence of a higher quantity of plastic debris in the Tanjung Aru and Teluk Likas beach areas was due to the fact that these beaches are exposed to more intense wave currents and tides from the South China Sea. Because the South China Sea is also one of the busiest shipping routes in the world, it is possible that plastic debris from the shipping industry has contributed to the problem. As a result, it is expected that more plastic debris will be stranded there as compared to Kebagu beach. UMS ODEC beach is a private beach managed by Universiti Malaysia Sabah and only accommodates 300 capacity per entry. It is a place for outdoor activities such as picnics, beach sports and retreat programs. Such programs and daily recreational activities there are not open to the public.

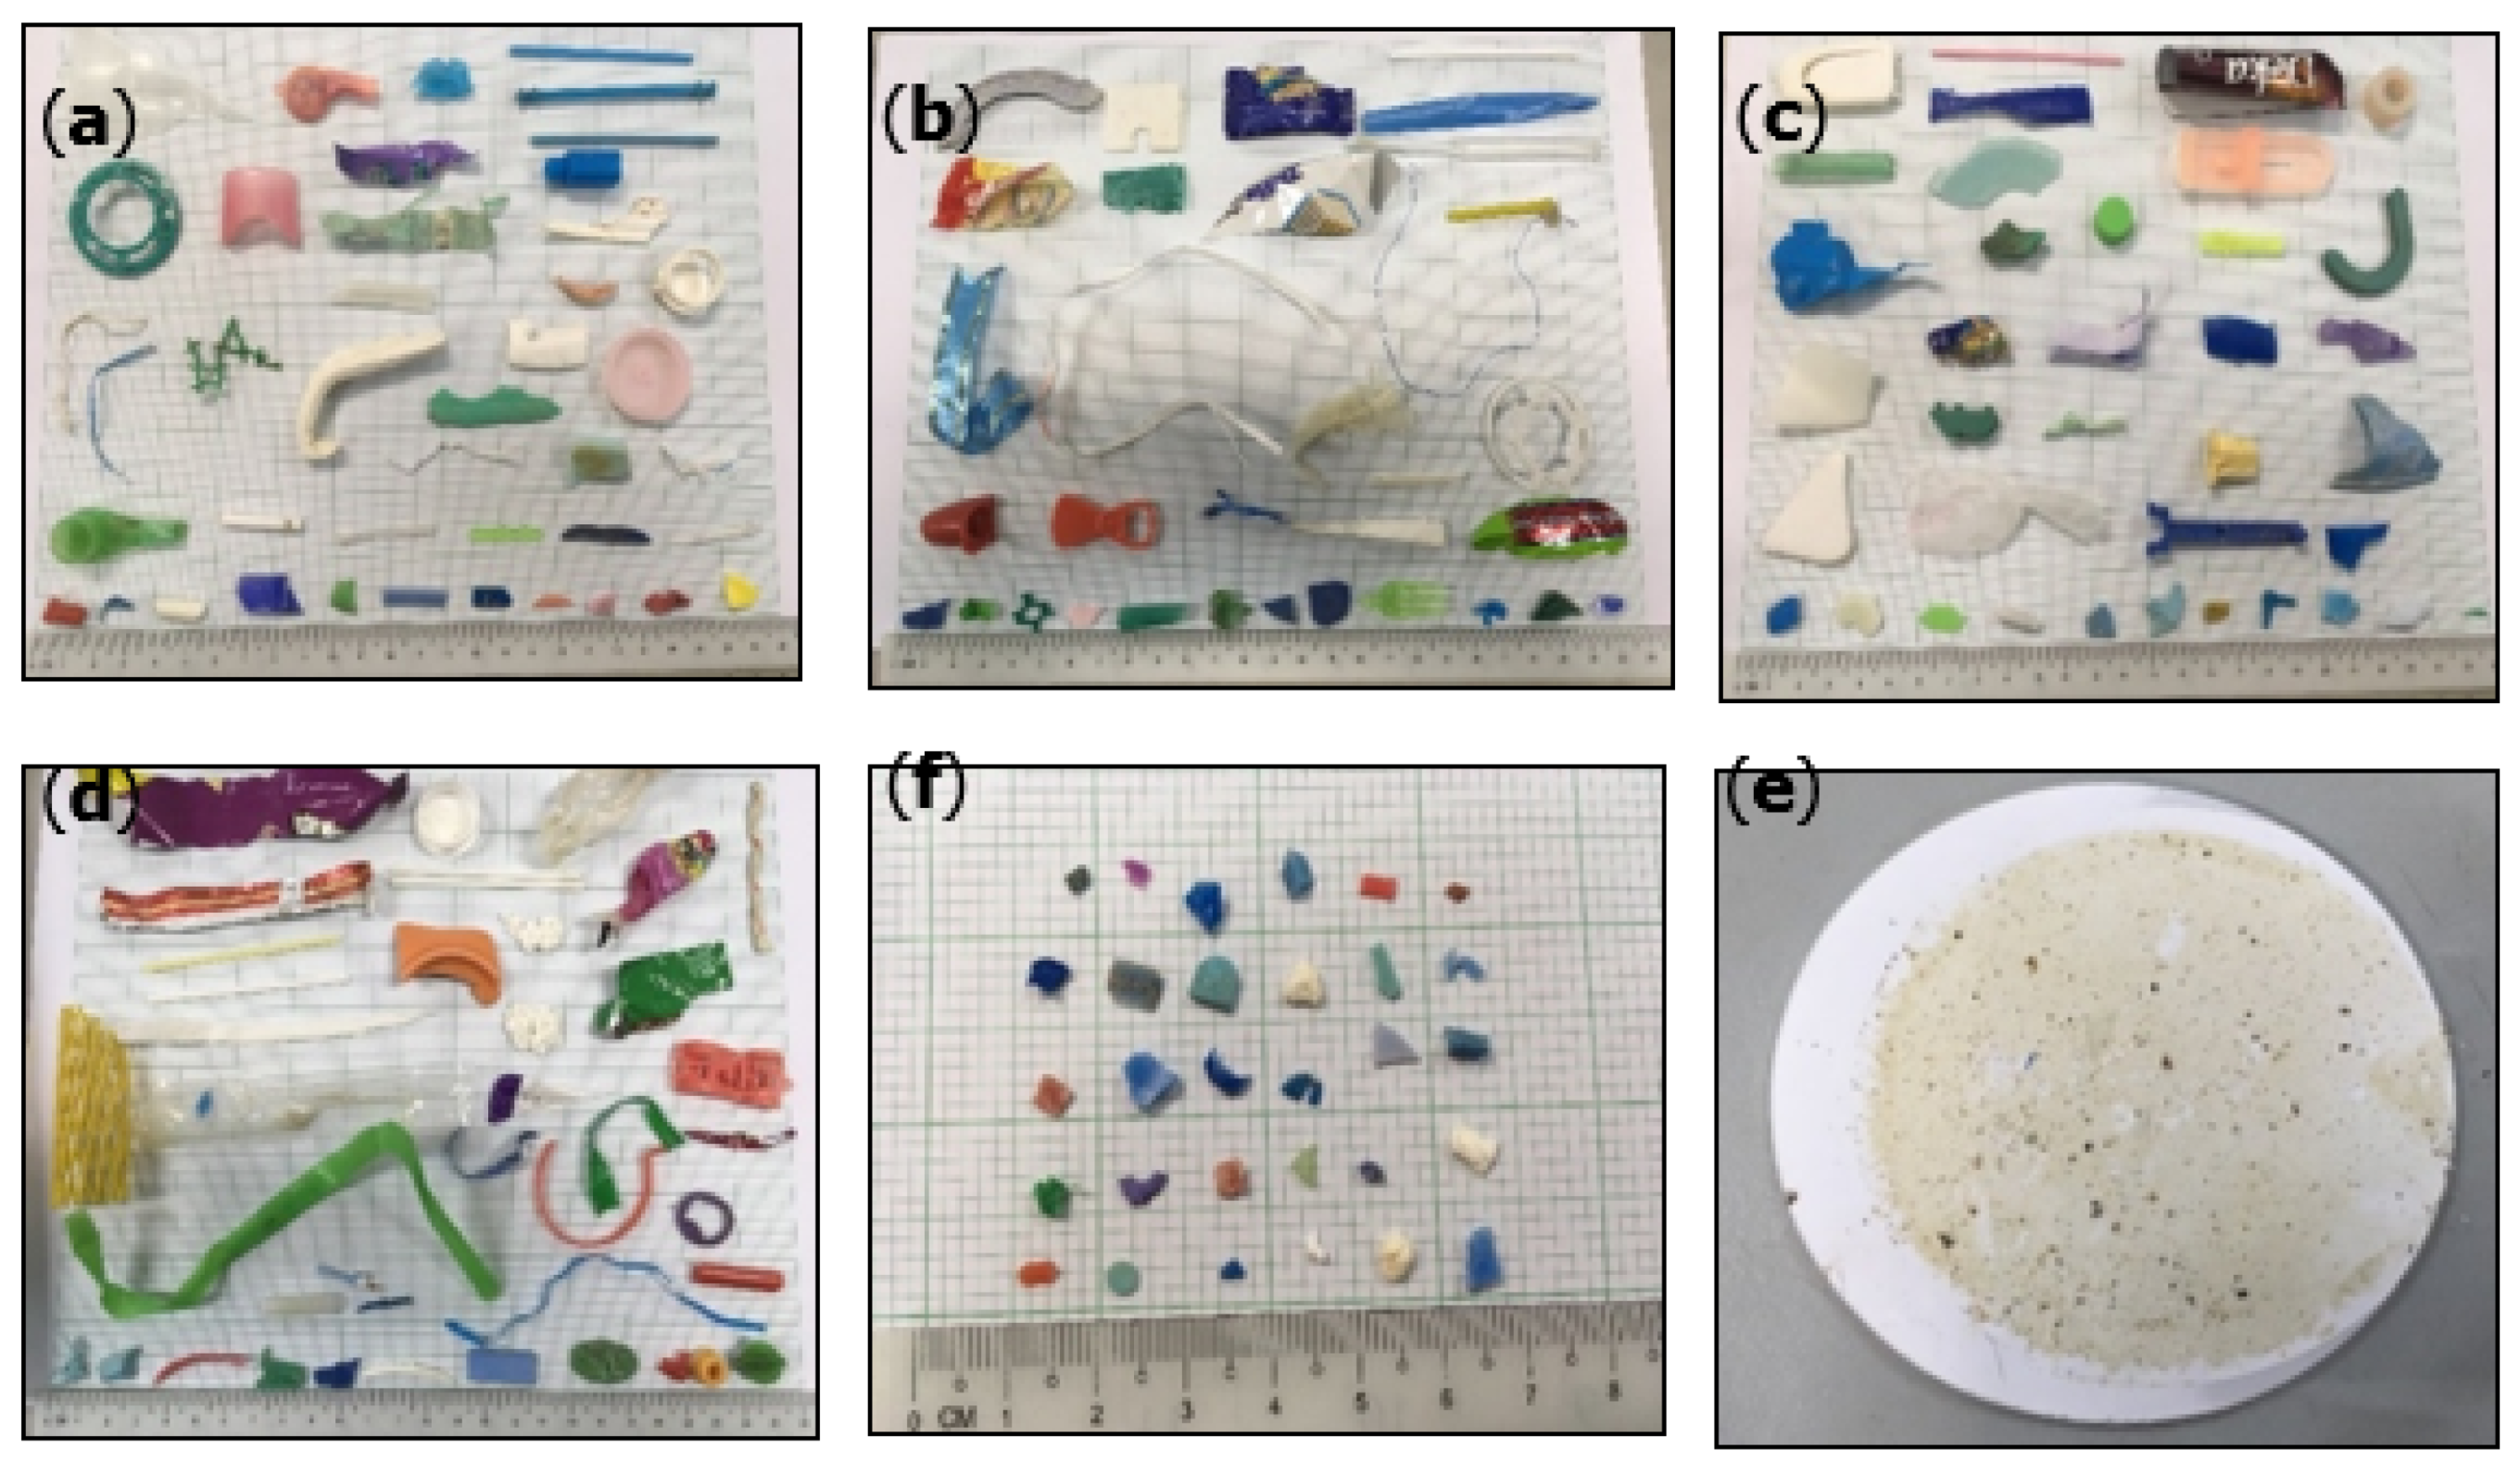
3.2. Size Classification of Plastic Fragments and Particles

Figure 3 shows the micro-, meso- and macroplastic quantities collected from ODEC and Kebagu stations. More mesoplastics and macroplastics of 6 mm in size were found at both beaches in the intertidal zones. Plastic fragments < 5 mm were less commonly found in the intertidal zones at both sampling stations. ODEC beach recorded 11 microplastic, 20 mesoplastic and 35 macroplastic fragments, while Kebagu beach recorded 20 microplastics, 38 mesoplastics and 73 macroplastics. Therefore, Kebagu beach had significantly more plastic fragments of all sizes compared to ODEC beach. The results showed that both beaches contained macro-, meso- and microplastics. This was due to the degradation and breakdown of plastics, which increased the quantity of fragments produced by natural processes [17]. Exposure to the dry and light conditions [3,18] and weathering events reduced the plastic debris into smaller particles. This highlights that the degradation of plastic debris by weathering events is more common on beaches compared to other natural environments [19]. The sizes of plastics resulting from the degradation can be measured in centimeters, leading to the microscopic forms prevalent in the global environment [20].
Abiotic factors such as land and water might further translocate those plastic fragments to other places. The plastic fragments revealed degraded forms including those that were irregular, flat, torn, elongated, spherical, shrunken, discolored, fragmented, flaky, powdery, or fragile. The long exposure to weathering on the beach affected the color of the plastic fragments, which appeared dull, whereas relatively new fragments still displayed strong, vibrant colors. According to previous studies, ingestion has been widely accepted as the primary way that marine organisms uptake microplastics because the particles are always mistaken for food [21]. This will significantly affect tissues at the cellular level in some sensitive organisms. Prolonged exposure to microplastics significantly inhibited the fertilization of marine organisms, resulting in a decrease in reproductive output [22].

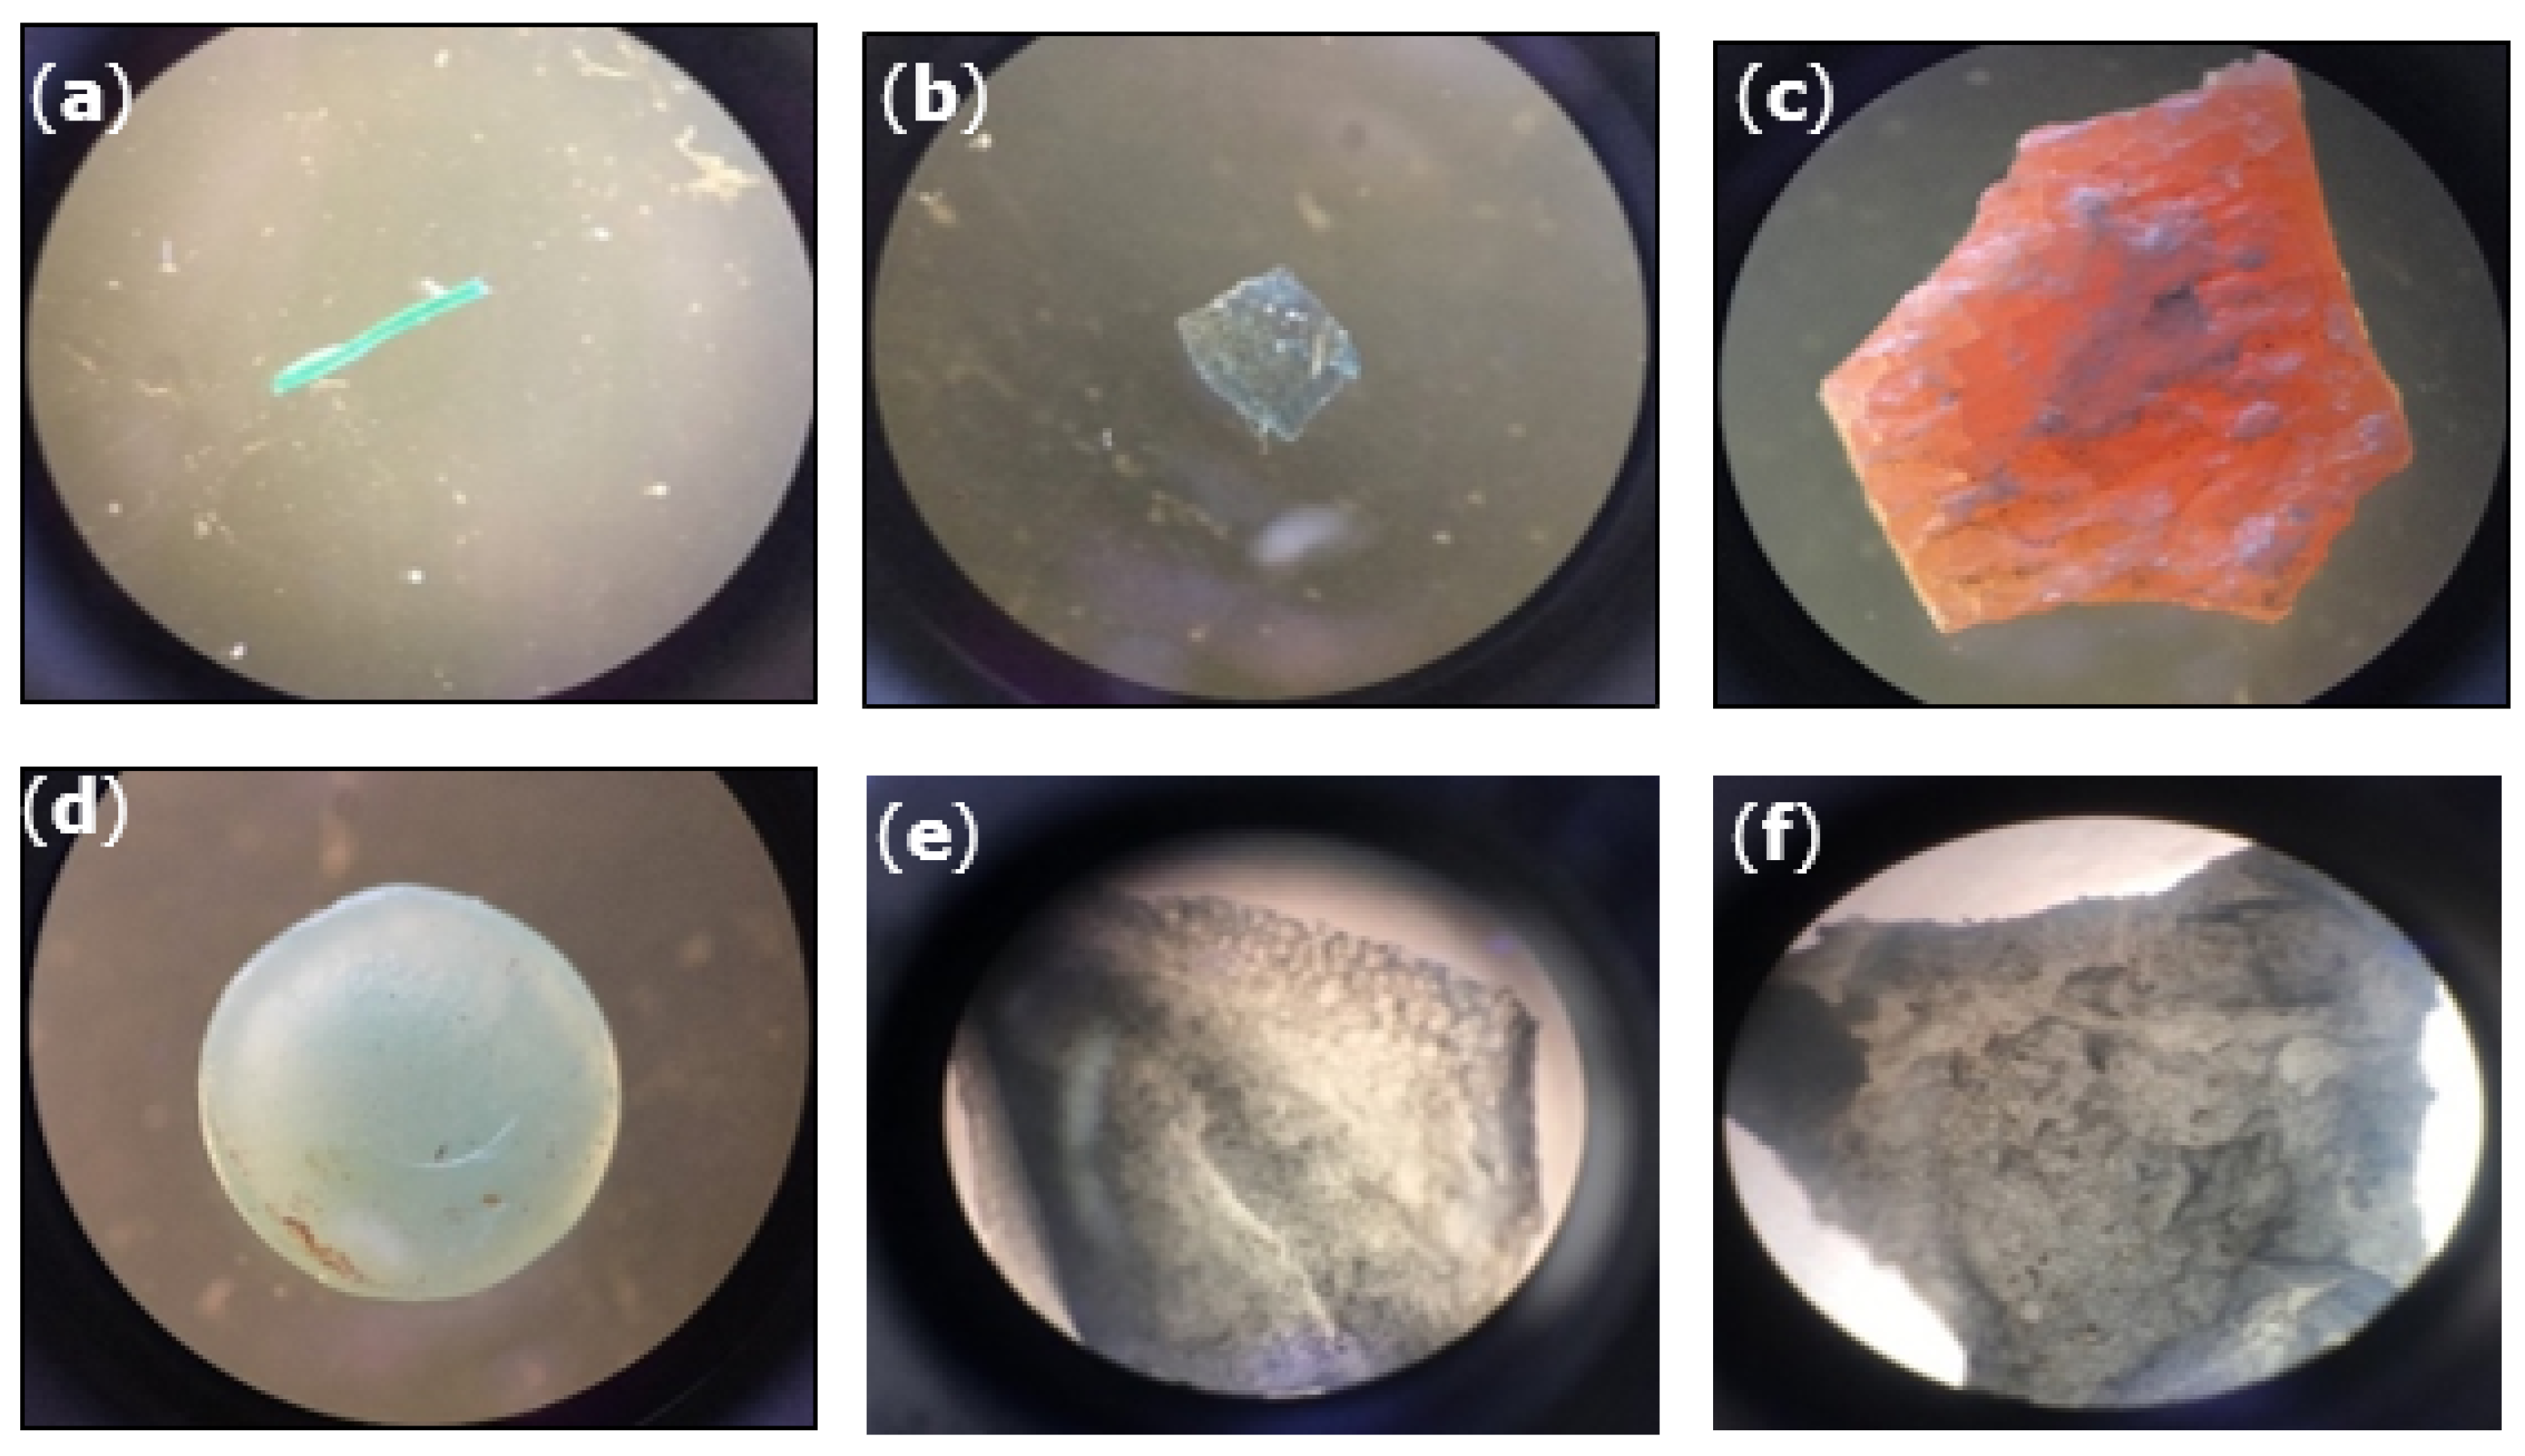
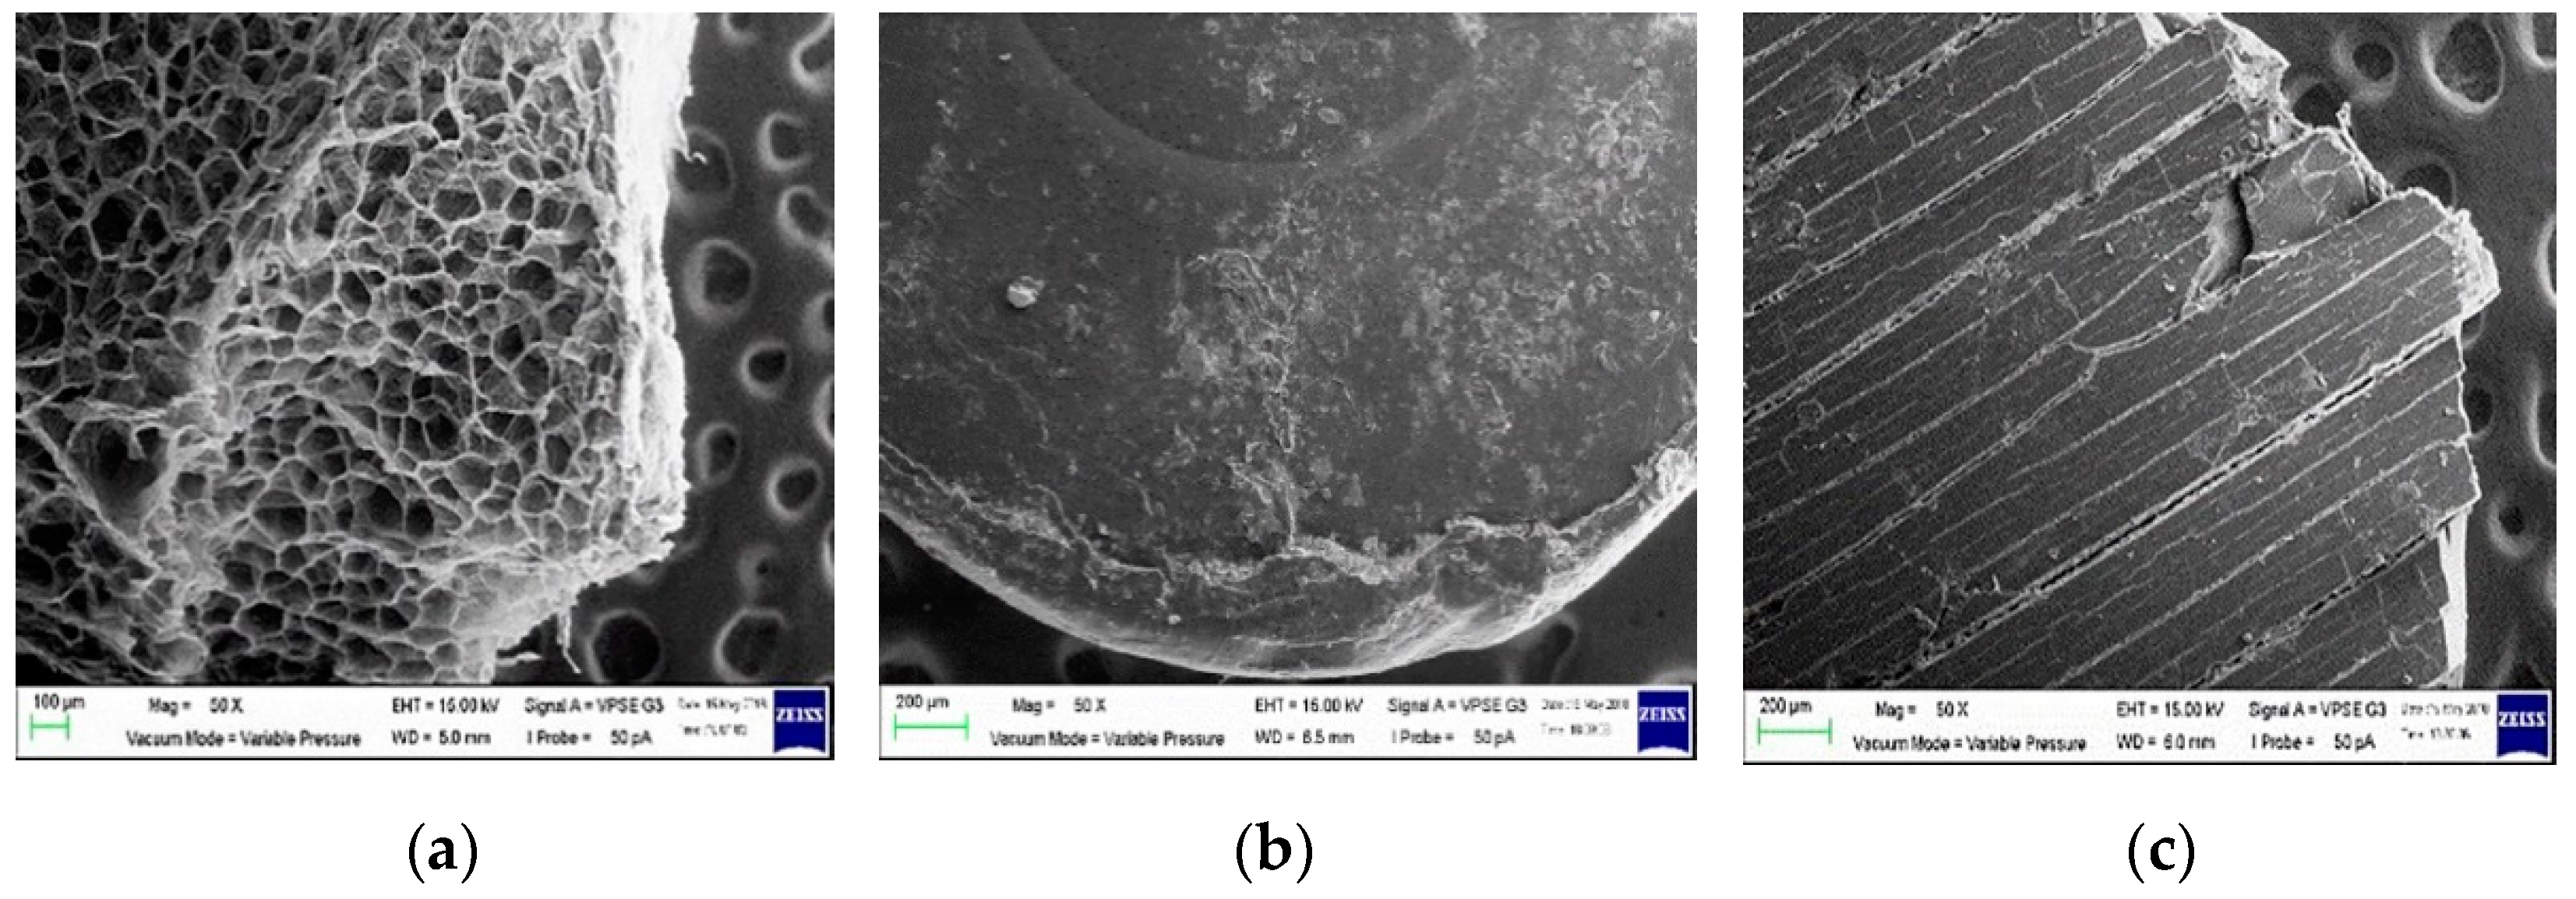
3.3. Observation of Plastic Fragments and Particles

Figure 4 shows plastic fragments in diverse shapes and sizes. The majority of plastic fragments revealed degradation into forms that were, for example, flat, irregular, cracked, discolored, fragile and fragmented. Observation under magnifying glass and compound stereoscope found diverse shapes: linear fiber strands, spheres, flakes, and bead forms. Surface morphology evaluations from microscopic observations showed that some plastics were cracked (Figure 5). Observations of the surface features of these microplastic fragments under SEM provided valuable insights into their potentially harmful roles. Most of the plastic debris was not industrially related, but household items and packaging were observed. The plastic debris included food packaging, children’s toys, bottle caps, plastics bags, drinking straws, packaging foam, personal care and toiletry products, ropes, strappings, and plastic sticks (cotton buds and lollipop sticks).
The microplastics exhibited their shapes and surface properties under microscopic observation. Discovery of various shapes and sizes of plastic debris showed that they were from larger, degraded particles; hence, a majority the plastic debris in this study was in degraded condition. Uneven surface sizes such as those of spherical fragments were of exception from microscopic observation. Figure 6 shows the surface features of microplastic particles, such as cracks, strands of linear fibre, flakes, and beads form. The cracked surface with depressions provides a higher surface area for biological and chemical interaction due to the exposed polarity of the surface [23]. Microscopic observation and SEM images (Figure 6) showed the foam and hollow properties of polystyrene microplastics, making them lightweight and less dense.

3.4. Identification of Plastic Polymers

All plastic fragments from both beaches were pooled together, with 66 items of plastic debris from ODEC beach (n = 66) and 131 items of plastic debris from Kebagu beach (n = 131). All collected particles were identified using FTIR. Figure 7 shows the spectra of plastic types identified using FTIR. Polypropylene (PP), polyethylene (PE), polyethylene terephthalate (PET) and polystyrene (PS) were the polymers recognized and present on both beaches. Figure 8 shows that PP and PE represented the highest percentages and abundances on both beaches: 54.55% and 22.73%, respectively on ODEC beach and 48.85% and 32.82%, respectively, on Kebagu beach. Based on FTIR analysis, PS and PET accounted for 18.18% and 4.55%, respectively, at ODEC station and 14.50% and 3.82%, respectively, at Kebagu station. PP, PE, PET and PS are present in a large variety of industrial and consumer products. Plastic debris commonly found on both beaches during sampling presented a diverse range of sizes and shapes, with plastic fragments from items such as containers (food and drink packaging, toiletries), bottle caps, plastic bottles, children’s toys, stationery parts, Styrofoam packaging, plastic bags, and plastic sticks (cotton buds and lollipop sticks), as well as ropes and strappings.
Analysis of the types of plastics that can be tracked back to their sources is important as it contributes useful information on individual items of plastic debris [24]. Results from Fourier-transform infrared (FTIR) spectrometer analysis showed that PP and PE were the more dominant types of plastics compared to other polymers. Overall, the collected plastic debris from ODEC and Kebagu beaches consisted mostly of polypropylene and polyethylene. PP and PE tend to be positively buoyant and easily deposited on beaches because of their specific gravity of less than one [25]. The results of analysis showed that PE and PP were the highest in abundance, which is not surprising, since PE, with an annual global production of around 80 million tonnes, is mainly used to manufacture packaging (plastic bags, plastic films, containers including bottles), and PP, with an annual global production of around 55 million tonnes, is mainly used for packaging, reusable containers, stationery, textiles, ropes, etc. [26]. In addition, the main source of the fragments was attributed to natural processes. Larger particles that undergo fragmentation were principally produced by photo-oxidative, thermal and biodegradation processes [24], but rates and mechanisms may differ among polymer types. PE, for example, is more readily fragmented by weathering events, whereas PP is more subject to mechanical degradation [20]. Additionally, it is characterized by higher impact strength but lower working temperatures and tensile strength than PP [27]. Disadvantages of PP include poor UV resistance and poor oxidative resistance [28,29]. Therefore, PP ages faster in the ocean environment and quickly breaks down into smaller fragments.

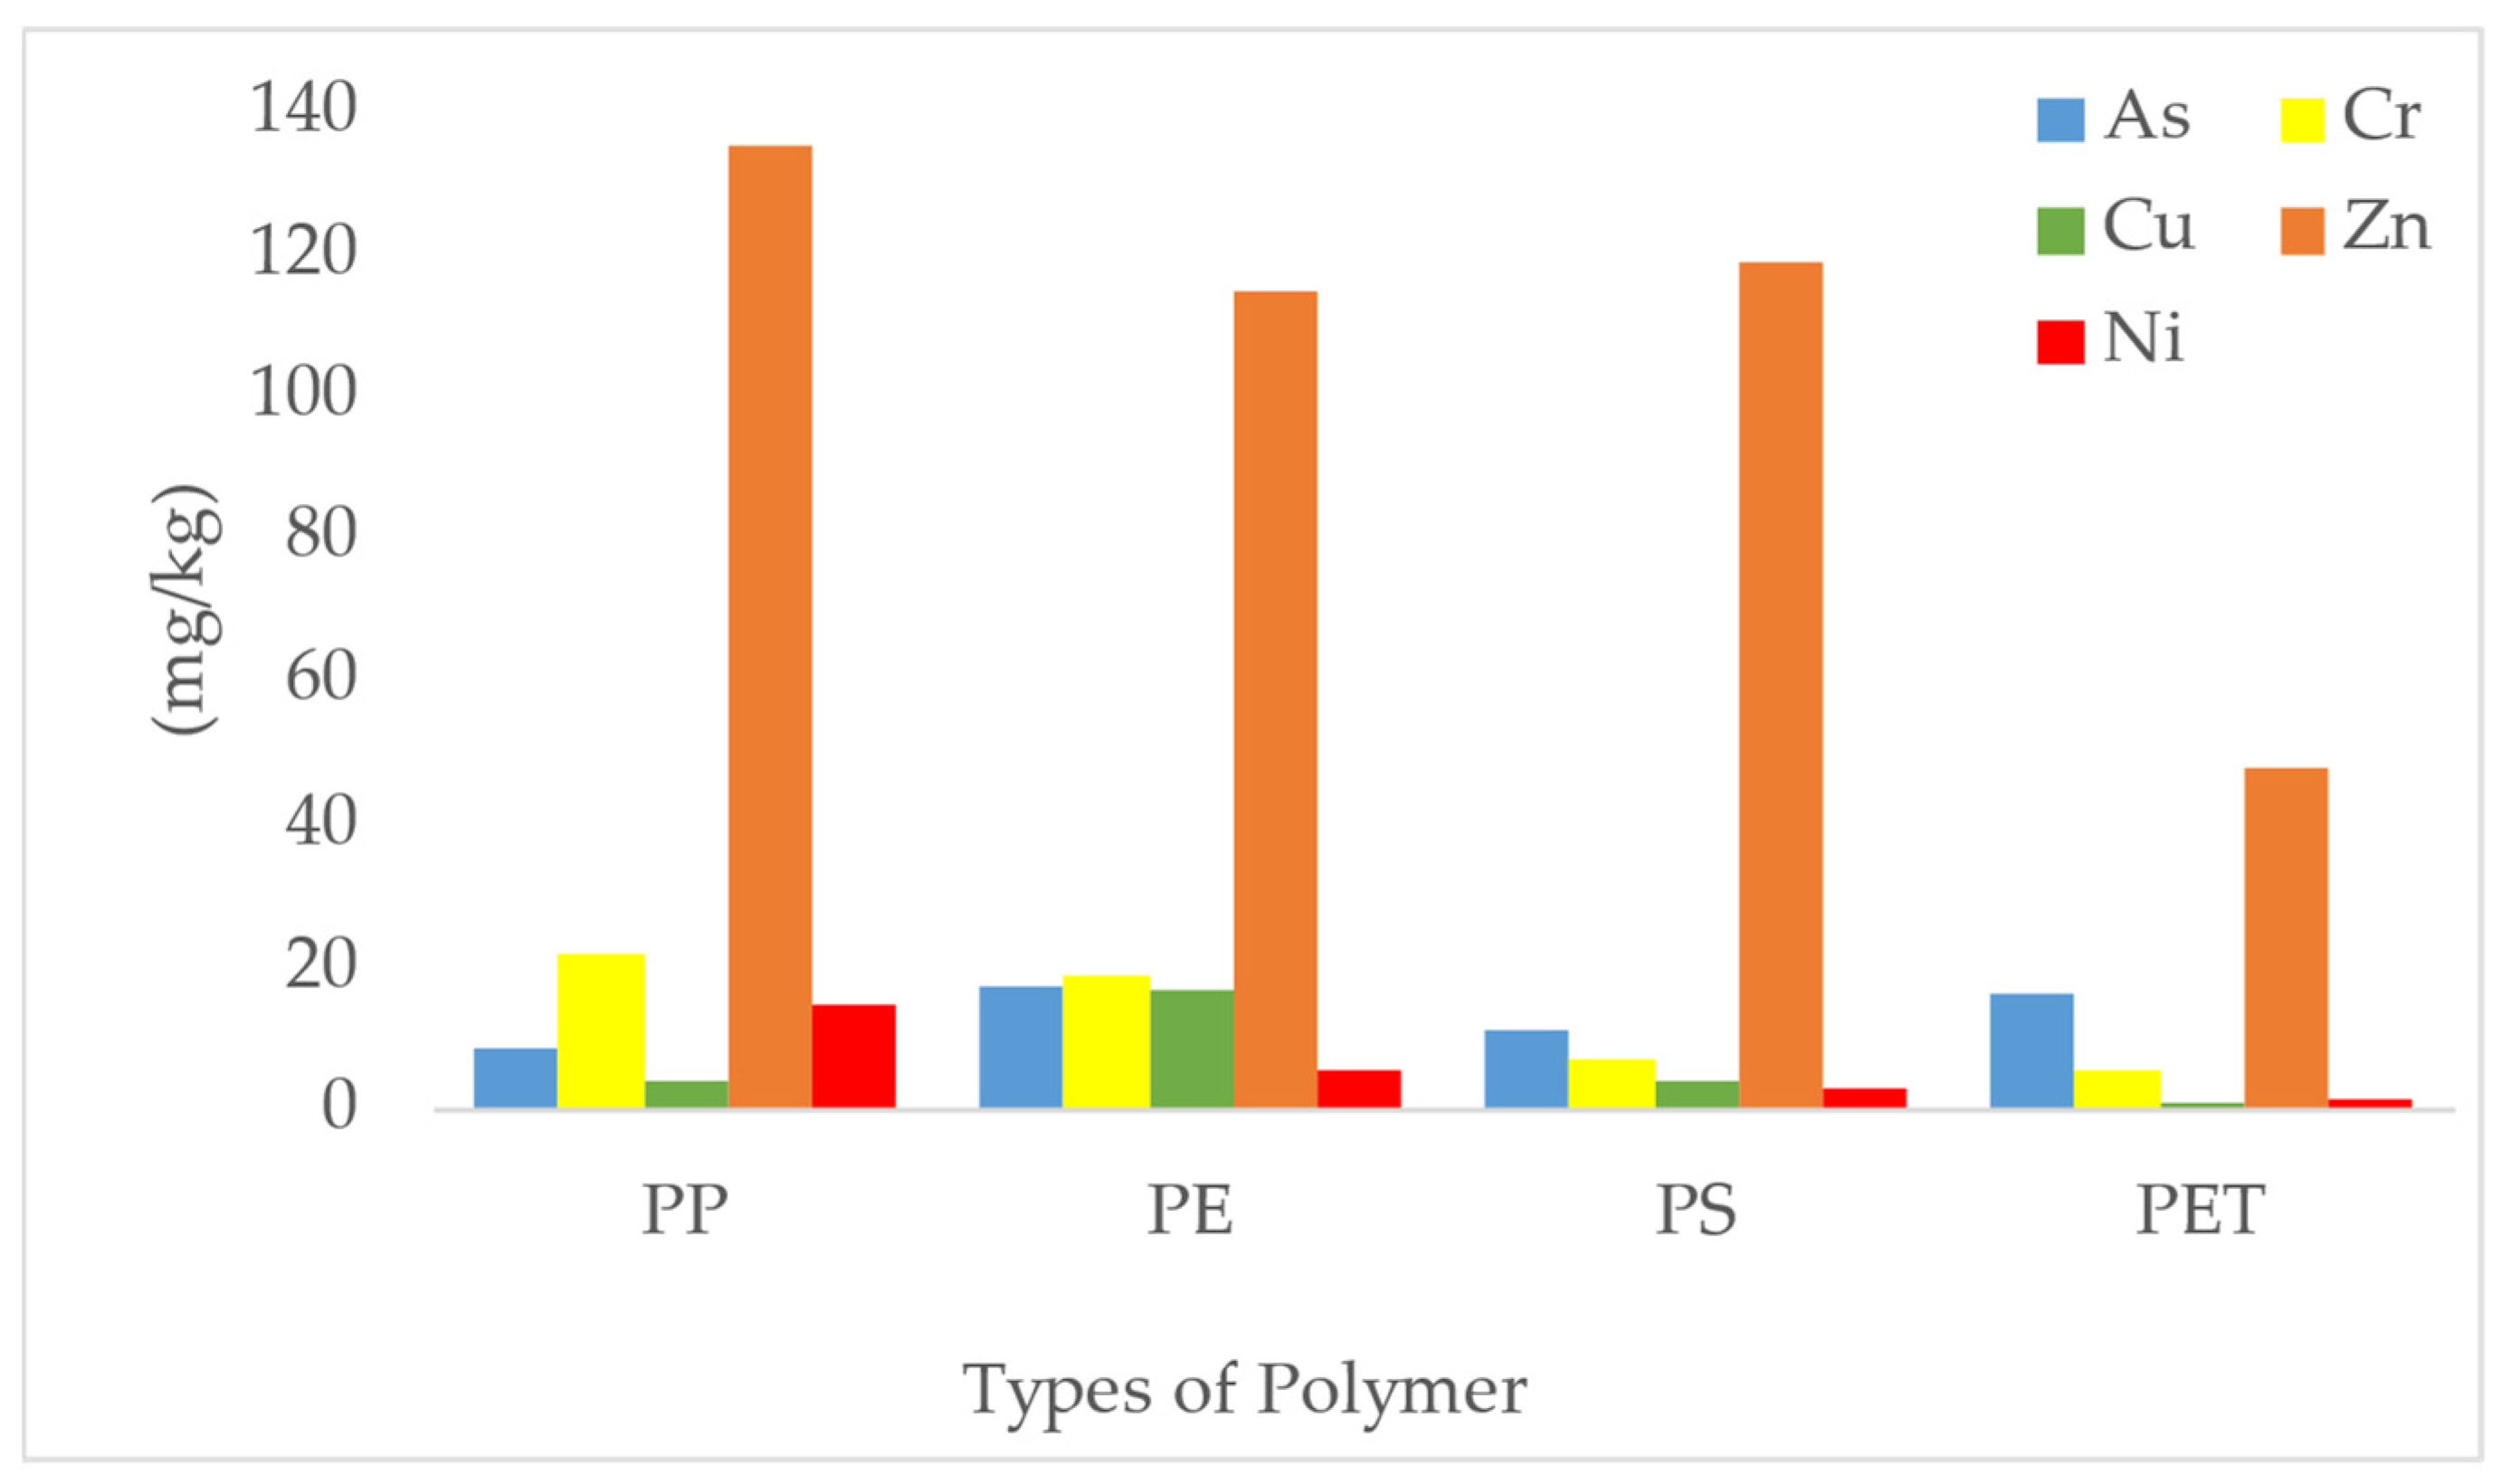
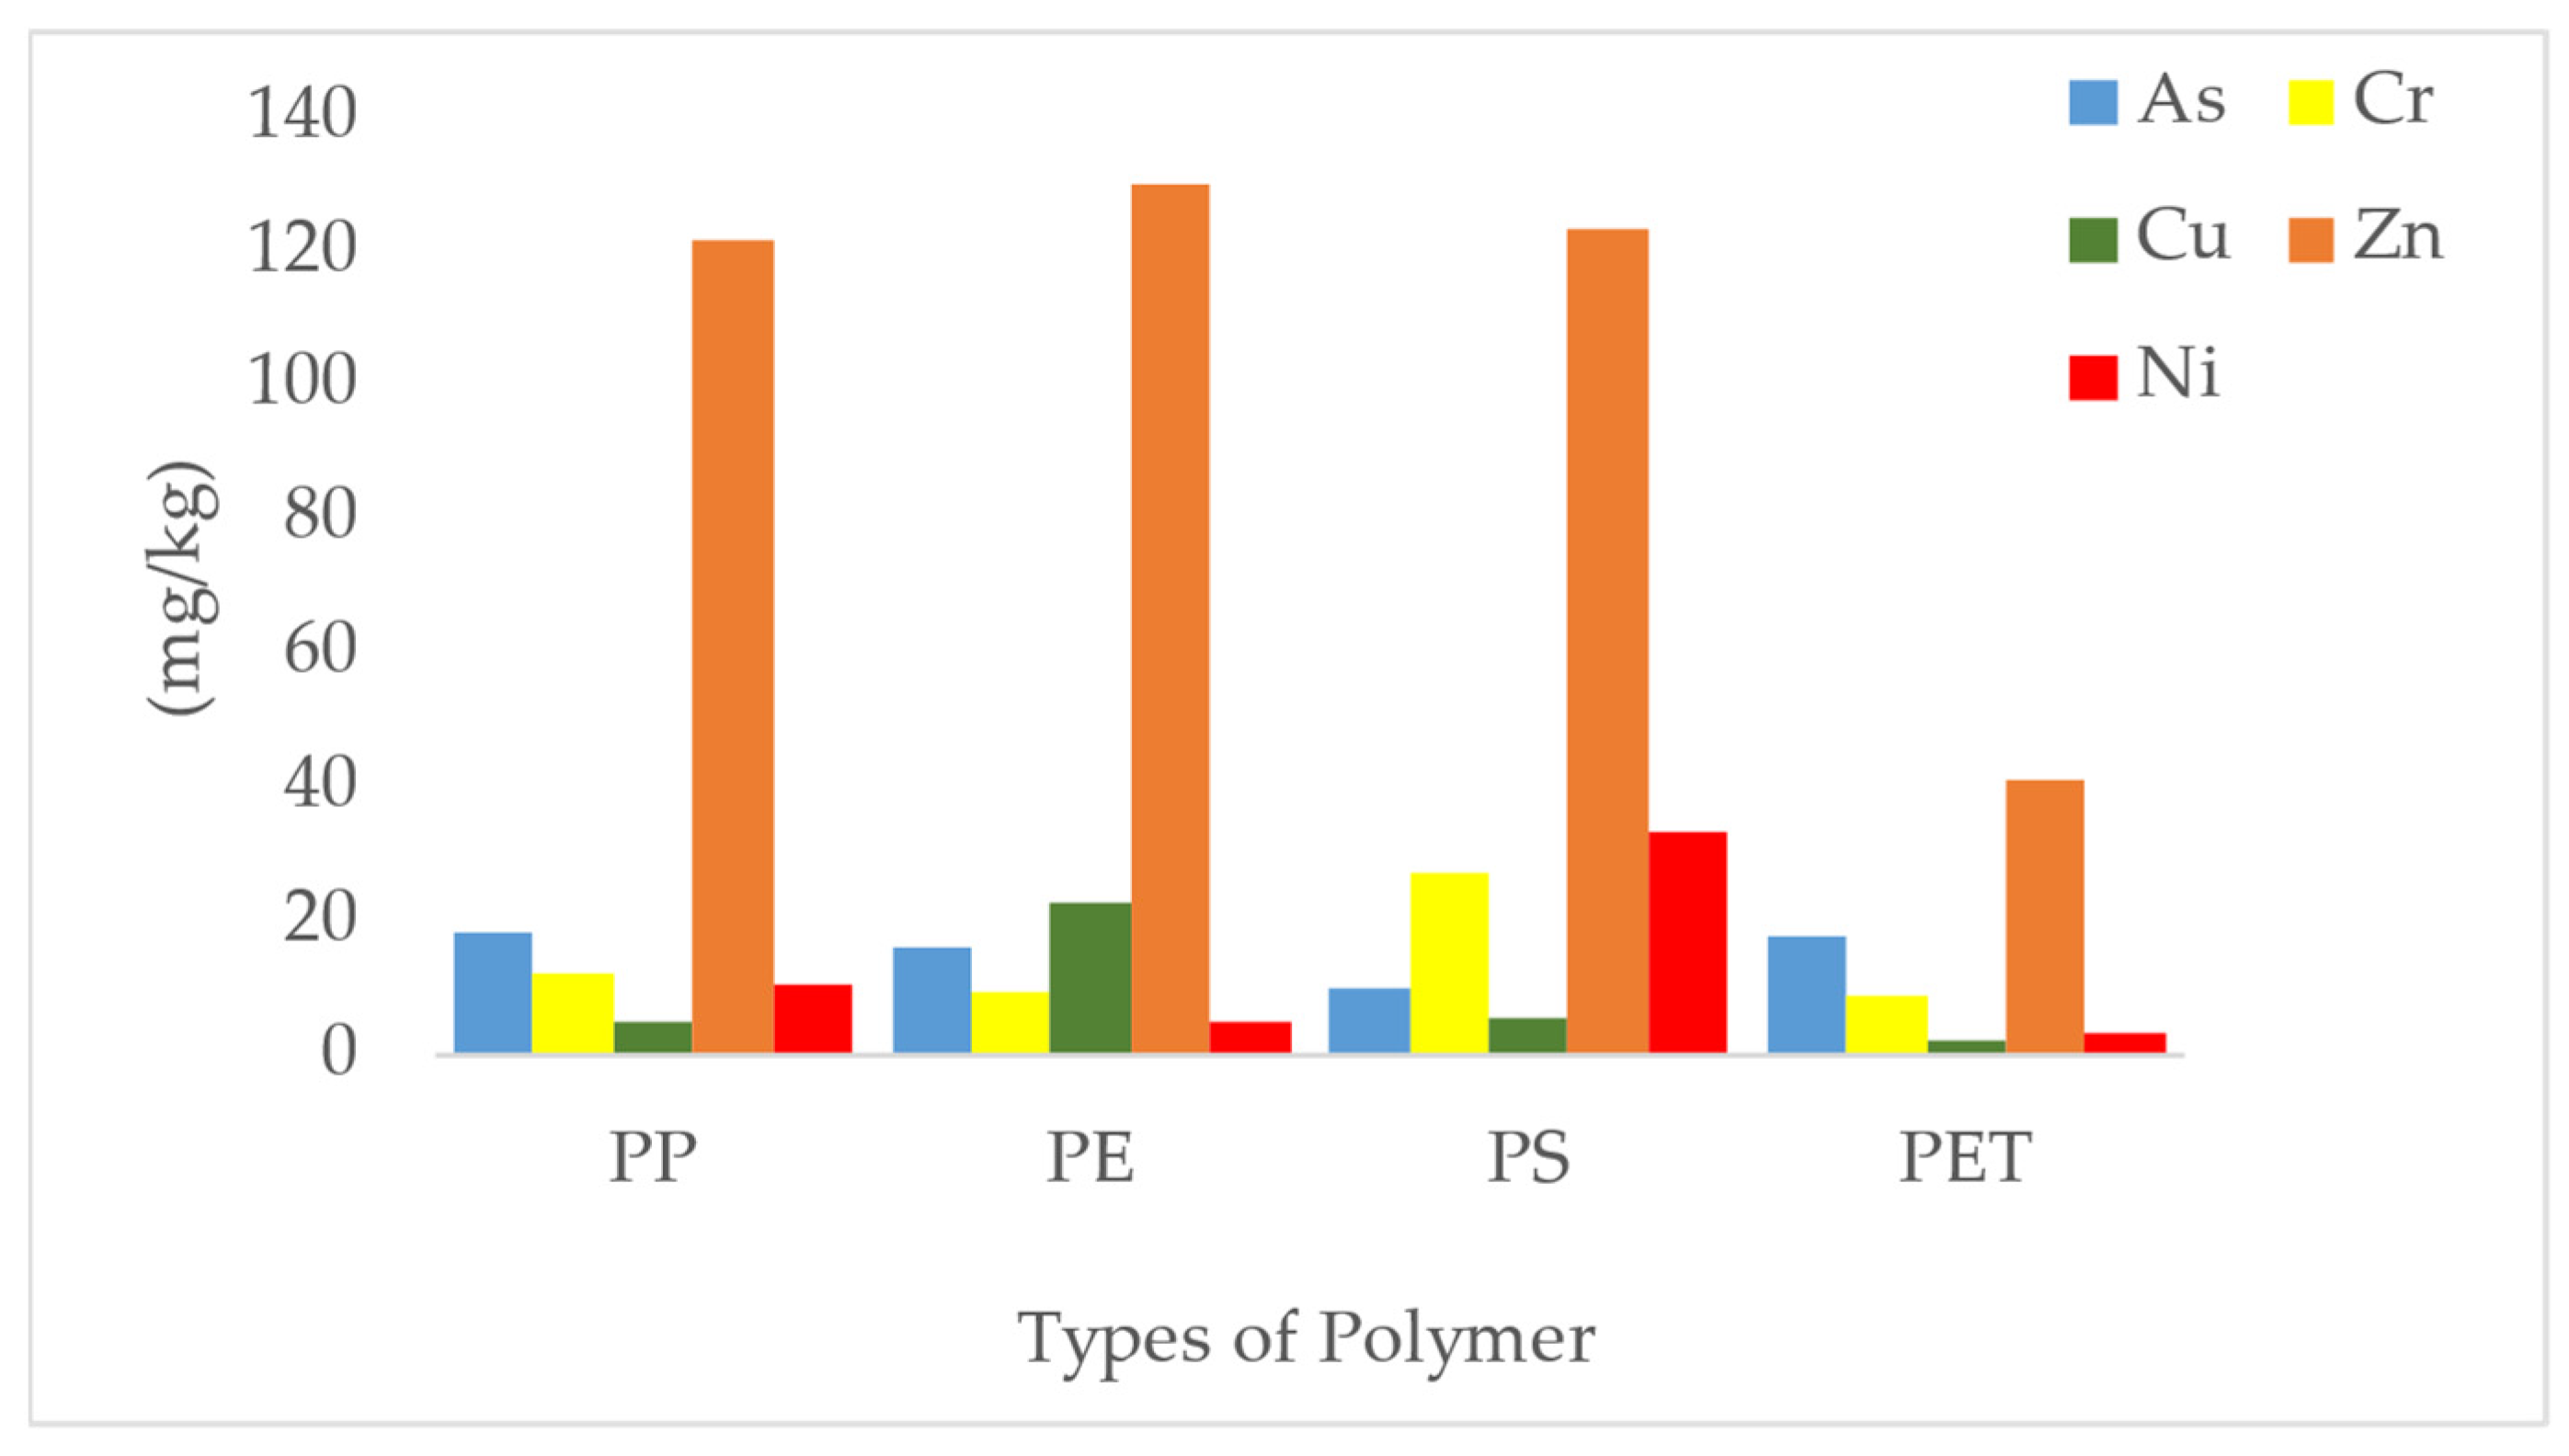
3.5. Heavy Metal Analysis

All five targeted heavy metals (arsenic, chromium, copper, zinc, and nickel) were detected in all polymer types: polypropylene (PP), polyethylene (PE), polystyrene (PS) and polyethylene terephthalate (PET). Figure 9 and Figure 10 show the concentrations of heavy metals in different types of polymer samples from ODEC station and Kebagu station. The results obtained from these two selected beaches showed different concentrations of heavy metals (mg/kg). Zn was the metal with the highest concentration in all types of polymers from both beaches. In samples from ODEC station, it measured 135.28 mg/kg in PP, 114.823 mg/kg in PE, 118.958 mg/kg in PS, and 47.786 mg/kg in PET. In samples from Kebagu station Zn concentrations measured 121.752 mg/kg in PP, 130.058 mg/kg in PE, 123.555 mg/kg PS, and 40.954 mg/kg in PET. After Zn, As was the heavy metal found in higher concentrations in PET on both beaches, at 16.334 mg/kg in samples from ODEC station and 17.851 mg/kg in samples from Kebagu station, whereas Cr was mostly detected in PP and PE plastic in samples from ODEC station at concentrations of 21.823 mg/kg and 19.099 mg/kg, respectively. Cu had the lowest concentrations in PP and PET plastic from both sampling stations: 3.953 mg/kg and 0.965 mg/kg, respectively, in ODEC station samples and 5.069 mg/kg and 1.895 mg/kg, respectively, in samples from Kebagu station. Ni represented the lowest heavy metal concentration in PE samples from both beaches: 5.602 mg/kg in ODEC samples and 5.124 mg/kg in Kebagu station samples. The results showed that the types of polymers and heavy metal accumulations in plastic debris might not differ as greatly as they do for organic chemical pollutants [30]. This showed the possibility that the heavy metals accumulated in plastic that may have been interposed by a biofilm. It also indicates that Zn, As, Cr, Cu and Ni have many important functions as plastic additives. Zn is widely used in the plastic industry as a soap, or technically, as a metal salt, in the form of zinc stearate (C36H70O4Zn) as a stabilizer. Because of its solubility in nonpolar solvents at room temperature and in most acids and common solvents when heated, zinc stearate is considered a versatile industrial chemical compound. The non-stick and water repelling properties of plastics were also attributed to the usage of zinc stearate [31].
Zn and Cu are both inorganic antimicrobial/biocidal agents in PAs in ionic form but due to environmental considerations, toxicity and discoloration tendencies in certain plastic formulations, its usage, however, was superseded by Ag [32]. Another antimicrobial/biocidal agent incorporated in plastics is the 10,10′-oxybisphenoxarsine (OBPA), an arsenic-based material (accounting for 70% of the demand for antimicrobials in plastics) [32]. That might possibly explain the presence of As in some of the plastics analyses. Analysis also detected chromium in plastics as a catalyst for plastic production (chromium trioxide) and as a component in color pigments such as yellow, red and green colors [33]. Copper phthalocyanine (CuPc) is commonly used in the plastic industry as a color pigment and surface lubricant [34]. The presence of Ni in the samples could be attributed to nickel quenchers, a UV stabilizer [35].
In addition, plastic particles observed as carriers of heavy metal pollutants are not a new thing. The surface properties and porosity of plastics contribute to their heavy metal absorption action when the plastic particles are disposed of or released into the water column. Therefore, greater surface and reactivity levels are related to the higher absorption of heavy metals [20,36]. In addition, lengthier weathering events, precipitates of hydrogenous compounds, and biofilm accumulations that arise in the ageing of plastic particles might increase their reactivity and induce a greater adsorption of heavy metal ions from the water column [37].
Possible mechanisms for this metal adsorption are probably connected to direct adsorption of cations or composites into charged sites or neutral regions of the plastic surface [38]. According to the previous studies, heavy metals have a strong affinity for microplastics that made of organic polymers [38,39]. However, each type of plastic with differences in chemical and physical properties such as surface area, polarity, and adsorption level would be predicted to differ in its concentrations of heavy metals [40,41]. Therefore, a higher ecological threat will continue to exist from plastic particles ingested by marine organisms due to the long weathering properties of microplastics and their different abilities to accumulate metals from nearby sources. The relationship of heavy metals with plastics has implications for transferring these contaminants into the food chain [42]. Thus, invertebrates, fish, birds, and mammals that mistake plastics for food [41] have the potential to mobilize metals in their acidic, enzyme-rich digestive systems. The ingestion of microplastics that accumulate metals can thus be toxic, posing a serious concern for marine animals.
The present data were compared with data from previous studies on the concentration of heavy metals in microplastics (Table 2).
Generally, meso- and microplastics collected from the Kebagu and UMS ODEC beaches presented higher trace metal contents (specifically Zn). This might be due to the inherent load of the plastic conferred by additives during production. However, the results are remarkable compared with data from Beijing River, which showed that the concentration of Zn in microplastics was greater than that in plastic bags due to, for example fragmentation of macroplastics or micro-size plastic production, which have different metal burdens added as additives. Based on the data obtained, we suggested that most heavy metals carried by microplastics were derived from the inherent load. This is due to the long-term sorption of metals by microplastics and the comparative metal burden between microplastics, macro litters and fresh plastic products in the marine environment.

4. Conclusions

This study revealed that plastic particles were found on both investigated beaches, with Kebagu beach having a more significant quantity of plastic waste than ODEC beach. It confirmed that macroplastics were detected in large quantities on both beaches. The forms, sizes, colors, and surface fatigue properties of plastic fragments indicated various morphological characteristics. Based on this finding, the most common plastics found were identified as polypropylene (PP) and polyethylene (PE). It is important to note that heavy metals such as arsenic, chromium, copper, zinc, and nickel were all discovered in meso- and microplastic samples from all polymer types, including polyethylene (PE), polypropylene (PP), polystyrene (PS), and polyethylene terephthalate (PET). Interestingly, heavy metal Zn was discovered in the highest concentration in all polymer forms. On the other hand, the heavy metal with the lowest concentration in PP and PET plastic from both beaches was Cu, while Ni was the heavy metal with the lowest concentration in PE, also from both beaches. Overall, further research is needed to quantitatively determine the contributions of diffuse sources to adjacent water bodies to understand the transport, fate and distributions of plastics in seawater.

Author Contributions

Conceptualization, P.M.T. and M.R.J.; methodology, P.M.T. and M.R.J.; validation, P.M.T. and N.Z.Z.; formal analysis, M.R.J.; writing—original draft preparation, P.M.T. and N.Z.Z.; writing—review and editing, N.Z.Z. and S.A.M.A.; visualization, M.R.J.; supervision, P.M.T. All authors have read and agreed to the published version of the manuscript.

Funding

The APC was funded by University Malaysia Sabah (UMS).

Institutional Review Board Statement

Not applicable.

Informed Consent Statement

Not applicable.

Data Availability Statement

Not applicable.

Acknowledgments

The authors would like to thank University Malaysia Sabah (UMS) for the technical and financial support.

Conflicts of Interest

The authors declare no conflict of interest.

References

  1. Nizetto, L.; Bussi, G.; Futter, M.N.; Butterfield, D.; Whitehead, P. A theoretical assessment of microplastic transport in river catchments and their retention by soils and river sediments. Environ. Sci. Processes Impacts 2016, 18, 1050–1059. [Google Scholar] [CrossRef] [PubMed]
  2. Kumar, R.; Sharma, P.; Verma, A.; Jha, P.K.; Singh, P.; Gupta, P.K.; Chandra, R.; Prasad, P.V.V. Effect of Physical Characteristics and Hydrodynamic Conditions on Transport and Deposition of Microplastics in Riverine Ecosystem. Water 2021, 13, 2710. [Google Scholar] [CrossRef]
  3. Andrady, A.L. Assessment of environmental biodegradation of synthetic polymers: A review. J. Macromol. Sci. Part C Polym. Rev. 1994, 34, 25–76. [Google Scholar] [CrossRef]
  4. Auta, H.S.; Emenike, C.U.; Fauziah, S.H. Distribution and importance of microplastics in the marine environment: A review of the sources, fate, effects, and potential solutions. Environ. Int. 2017, 102, 165–176. [Google Scholar] [CrossRef] [PubMed]
  5. Ernst, T.; Popp, R.; Van Eldik, R. Quantification of heavy metals for the recycling of waste plastics from elctrotechnical applications. Talanta 2000, 53, 347–357. [Google Scholar] [CrossRef]
  6. Gall, S.C.; Thompson, R.C. The impact of debris on marine life. Mar. Pollut.Bull. 2015, 92, 170–179. [Google Scholar] [CrossRef]
  7. Kang, H.; Kwon, O.Y.; Shim, W.J. Potential threat of microplastics to zooplanktivores in the surface waters of the southern sea of Korea. Arch. Environ. Contam. Toxicol. 2015, 69, 340–351. [Google Scholar] [CrossRef]
  8. Rosevelt, C.; Huertos, M.L.; Garza, C.; Nevins, H.M. Marine debris in central California: Quantifying type and abundance of beach litter in Monterey Bay, CA. Mar. Pollut. Bull. 2013, 71, 299–306. [Google Scholar] [CrossRef] [Green Version]
  9. Flint, S.; Markle, T.; Thompson, S.; Wallace, E. Bisphenol A exposure, effects, and policy: A wildlife perspective. J. Environ. Manag. 2012, 104, 19–34. [Google Scholar] [CrossRef]
  10. Ryan, P.G.; Moore, C.J.; Van Franeker, J.A.; Moloney, C.L. Monitoring the abundance of plastic debris in the marine environment. Philos. Trans. R. Soc. B 2009, 364, 1999–2012. [Google Scholar] [CrossRef] [Green Version]
  11. Frias, J.P.G.L.; Sobral, P.; Ferreira, A.M. Organic pollutants in microplastic from two beaches of the Portuguese coast. Mar. Pol. Bull. 2010, 60, 1988–1992. [Google Scholar] [CrossRef] [PubMed]
  12. Lee, J. Relationships among the abundances of plastic debris in different size classes on beaches in South Korea. Mar. Pol. Bull. 2013, 77, 349–354. [Google Scholar] [CrossRef] [PubMed]
  13. Sakurai, H.; Noro, J.; Kawase, A.; Fujinami, M.; Oguma, K. Digestion of plastic materials for the determination of toxic metals with a microwave oven for household use. Anal. Sci. 2006, 22, 225–228. [Google Scholar] [CrossRef] [PubMed] [Green Version]
  14. Fauziah, S.H.; Liyana, I.A.; Agamuthu, P. Plastic debris in the coastal environment: The invincible threat? Abundance of buried plastic debris on Malaysian beaches. Waste Manag. Res. 2015, 33, 812–821. [Google Scholar] [CrossRef] [Green Version]
  15. Xu, P.; Peng, G.; Su, L.; Gao, Y.; Gao, L.; Li, D. Microplastic risk assessment in surface waters: A case study in the Changjiang Estuary, China. Mar. Pollut. Bull. 2018, 133, 647–654. [Google Scholar] [CrossRef]
  16. Anh, T.T.; Sandhya, B. Microplastics pollution with heavy metals in the aquaculture zone of the Chao Phraya River Estuary, Thailand. Mar. Pollut. Bull. 2020, 161, 111747. [Google Scholar]
  17. Browne, M.A.; Galloway, T.S.; Thompson, R.C. Spatial patterns of plastic debris along estuarine shorelines. Environ. Sci. Technol. 2010, 44, 3404–3409. [Google Scholar] [CrossRef]
  18. Holmes, L.A.; Turner, A.; Thompson, R.C. Interactions between trace metals and plastic production pellets under estuarine conditions. Mar. Chem. 2014, 167, 25–32. [Google Scholar] [CrossRef]
  19. Andrady, A.L. Plastics and the Environment; John Wiley & Sons: Hoboken, NJ, USA, 2003. [Google Scholar]
  20. Cooper, D.A.; Corcoran, P.L. Effects of mechanical and chemical processes on the degradation of plastic beach debris on the island of Kauai, Hawaii. Mar. Pollut. Bull. 2010, 60, 650–654. [Google Scholar] [CrossRef]
  21. Thompson, R.C.; Olsen, Y.; Mitchell, R.P.; Davis, A.; Rowland, S.J.; John, A.W.G.; McGonigle, D.; Russell, A.E. Lost at sea: Where is all the plastic? Science 2004, 304, 838. [Google Scholar] [CrossRef]
  22. Watts, A.J.R.; Lewis, C.; Goodhead, R.M.; Beckett, S.J.; Moger, J.; Tyler, C.R.; Galloway, T.S. Uptake and retention of microplastics by the Shore Crab Carcinus maenas. Environ. Sci. Technol. 2014, 48, 8823–8830. [Google Scholar] [CrossRef] [PubMed]
  23. Fotopoulou, K.N.; Karapanagioti, K. Surface properties of beached plastic pellets. Mar. Environ. Res. 2012, 81, 70–77. [Google Scholar] [CrossRef] [PubMed]
  24. Galgani, F.; Hanke, G.; Maes, T. Global distribution, composition and abundance of marine litter. In Marine Anthropogenic Litter; Bergmann, M., Gutow, L., Klages, M., Eds.; Springer: Berlin, Germany, 2015; pp. 29–56. [Google Scholar]
  25. Andrady, A.L.M.; Bergmann, L.; Gutow, M.; Klages. Persistence of Plastic Litter in the Oceans, In Marine Anthropogenic Litter; Springer International Publishing: Berlin/Heidelberg, Germany, 2015; pp. 57–72. [Google Scholar]
  26. Thompson, R.C.; Swan, S.H.; Moore, C.J.; Vom saal, F.S. Our plastic age. Philos. Trans. R. Soc. B Biol. Sci. 2009, 364, 1973–1976. [Google Scholar] [CrossRef] [PubMed] [Green Version]
  27. Vasile, C.; Pascu, M. Practical Guide to Polyethylene; Rapra Technology Limited: Shrewsburg, UK, 2005. [Google Scholar]
  28. Anthony, A.L. The plastic in microplastics: A review. Mar. Pollut. Bull. 2017, 119, 12–22. [Google Scholar]
  29. Tripathi, D.; Ebrary, I. Practical Guide to Polypropylene; Rapra Technology Limited: Shrewsburg, UK, 2002. [Google Scholar]
  30. Rochman, C.M.; Hentschel, B.T.; Teh, S.J. Long-term sorption of metals is similar among plastic types: Implications for plastic debris in aquatic environments. PLoS ONE 2014, 9, e85433. [Google Scholar] [CrossRef] [Green Version]
  31. Rehbein, W.; Lange, I.; Pazdzior, D. Substitution of Zinc Stearate in Cold Extrusion Processes. J. Tribol. Lubr. Appl. Liq. Gaseous Fuels Combust. Eng. 2015, 54, 343–356. [Google Scholar]
  32. Jones, A. Choosing antimicrobial additives for plastics. Plast. Add. Com. 2009, 11, 26–28. [Google Scholar] [CrossRef]
  33. Hoffmann, L.; Grinderslev, M.; Helweg, C.; Rasmussen, J.O. Massestrømsanalyse af Chrom og Chromforbindelser; Miljøprojekt Nr. 738; Miljøstyrelsen: Copenhagen, Denmark, 2002. [Google Scholar]
  34. Hakeim, O.A.; Diab, H.A.; Adam, J. Preparation and characterization of UV curable encapsulated phthalocyanine blue pigment. Prog. Org. Coat. 2015, 84, 70–78. [Google Scholar] [CrossRef]
  35. Markarian, J. Plasticulture comes of age. Plast. Add. Com. 2005, 7, 16–19. [Google Scholar] [CrossRef]
  36. Cozar, A.; Echevarría, F.; González-Gordillo, J.I.; Irigoien, X.; Úbeda, B.; Hernández León, S.; Duarte, C.M. Plastic debris in the open ocean. Proc. Natl. Acad. Sci. USA 2014, 111, 10239–10244. [Google Scholar] [CrossRef] [Green Version]
  37. Dennis, B.; Bernardo, D.; Filipa, P.; Isabel, C.; Joan, C.C. Microplastics as vector for heavy metal contamination from the marine environment. Estuar. Coast. Shelf Sci. 2016, 178, 189–195. [Google Scholar]
  38. Ashton, K.; Holmes, L.; Turner, A. Association of metals with plastic production pellets in the marine environment. Mar. Pollut. Bull. 2010, 60, 2050–2055. [Google Scholar] [CrossRef] [PubMed]
  39. Rios, L.M.; Moore, C.; Jones, P.R. Persistent organic pollutants carried by synthetic polymers in the ocean environment. Mar. Pollut. Bull. 2007, 54, 1230–1237. [Google Scholar] [CrossRef] [PubMed]
  40. Karapanagioti, H.K.; Klontza, I. Testing phenanthrene distribution properties of virgin plastic pellets and plastic eroded pellets found on Lesvos island beaches (Greece). Mar. Environ. Res. 2008, 65, 283–290. [Google Scholar] [CrossRef] [PubMed] [Green Version]
  41. Teuten, E.L.; Rowland, S.J.; Galloway, T.S.; Thompson, R.C. Potential for plastics to transport hydrophobic contaminants. Environ. Sci. Technol. 2007, 41, 7759–7764. [Google Scholar] [CrossRef] [PubMed]
  42. Zahari, N.Z.; Fong, N.S.; Cleophas, F.N.; Rahim, S.A. The Potential of Pistia stratiotes in the Phytoremediation of Selected Heavy Metals from Simulated Wastewater. Int. J. Technol. 2021, 12, 613–624. [Google Scholar] [CrossRef]
  43. Jundong, W.; Jinping, P.; Zhi, T.; Yifan, G.; Zhiwei, Z.; Qiuqiang, C.; Liqi, C. Microplastics in the surface sediments from the Beijiang River littoral zone: Composition, abundance, surface textures and interaction with heavy metals. Chemosphere 2017, 171, 248–258. [Google Scholar]
Figure 1. Overview of sampling locations at UMS ODEC Beach and Kebagu Beach, Kota Kinabalu, Sabah, Malaysia.
Water 14 01600 g001
Figure 2. Weight of pooled plastic fragments collected from ODEC and Kebagu beaches.
Water 14 01600 g002
Figure 3. Size classification of plastic fragments recovered from intertidal zones of the two sampling stations.
Water 14 01600 g003
Figure 4. Some of the macro- and mesoplastics that were recovered with the 1 mm sieve, (ad); (e) microplastic particles recovered with 1 mm sieve; (f) colored microplastics indicated with arrowheads affixed to a filter paper after drying.
Water 14 01600 g004
Figure 5. Microplastics (1–5 mm) viewed under stereo and compound microscope. (a) Strain of polymer, (b) polyethylene fiber (50× mag.), (c) cracked surface of polyethylene plastic (50× mag.), (d) a cracked surface of polypropylene plastic (50× mag.), (e) a polyethylene microbead plastic (50× mag.) and (f) degraded polystyrene Styrofoam (40× mag.).
Water 14 01600 g005
Figure 6. Surface features of sampled microplastics through SEM. (a) Structure of a polystyrene, (b) polyethylene bead, and (c) cracked surface of polypropylene fragment.
Water 14 01600 g006
Figure 7. FTIR spectra of plastics found on both beaches.
Water 14 01600 g007
Figure 8. Percentages of plastic fragments pooled from ODEC and Kebagu beaches, from FTIR analysis.
Water 14 01600 g008
Figure 9. Concentrations of heavy metals in different types of polymers on ODEC beach.
Water 14 01600 g009
Figure 10. Concentrations of heavy metals in different types of polymers on Kebagu beach.
Water 14 01600 g010
Table 1. Comparison with the average quantity of plastic debris (items m−2) from other sampling sites.
Sampling SitesType of BeachItems
(m−2)
References
Kebagu beachFishing and recreational131Present work
UMS ODEC beachOutdoor activities66Present work
Tanjung Aru beachRecreational183[14]
Teluk Likas beachFishing and recreational239[14]
Changjiang estuaryEconomic value (industry and aquaculture)231[15]
Choa Phraya RiverEconomic value (aquaculture)48[16]
Table 2. Concentration of metals accumulated by microplastics, from previous studies.
Type of PolymerSampling AreaConcentrations of Metals (ug/g) Reference
NiCuZnPb
PPKebagu beach143120-Present work
PE320129-
PPUMS ODEC beach152135-
PE318115-
PEBeijing lake1.119.60.25 ± 0.1219.7[38]
PP + PEBeijing river sediment<0.180.9–500.62414–14,81538.2–131.1[43]
PPChao Phraya river estuary<0.1-1-10-[15]
Publisher’s Note: MDPI stays neutral with regard to jurisdictional claims in published maps and institutional affiliations.

