Article

Nutrient Control of Phytoplankton Abundance and Biomass, and Microplankton Assemblage Structure in the Lower Columbia River (Vancouver, Washington, USA)

by
Gretchen Rollwagen-Bollens
1,*,
Kristin A. Connelly
1,
Stephen M. Bollens
1,2,
Julie Zimmerman
1 and
Alixandra Coker
3
1
School of the Environment, Washington State University, Vancouver, WA 98686, USA
2
School of Biological Sciences, Washington State University, Vancouver, WA 98686, USA
3
Camas High School, Camas, WA 98607, USA
*
Author to whom correspondence should be addressed.
Water 2022, 14(10), 1599; https://doi.org/10.3390/w14101599
Submission received: 9 April 2022 / Revised: 10 May 2022 / Accepted: 12 May 2022 / Published: 17 May 2022
(This article belongs to the Topic Microorganisms in Aquatic Environments)

Abstract

:
Nutrient limitation of phytoplankton is common but by no means universal in large temperate rivers. Previous field studies in the Columbia River, USA, are suggestive of nutrient limitations of phytoplankton, especially during summer, but this has never been tested experimentally. We therefore undertook monthly 5-day nutrient amendment incubation experiments from May–September 2018 using Columbia River water collected at Vancouver, Washington, USA. We compared replicate treatment bottles containing natural microplankton assemblages and amended nutrients (NO3, PO4 and SiO4 in combination) with replicate control bottles containing natural microplankton assemblages and ambient nutrients. Phytoplankton abundance and biomass were compared between treatments and controls on each day of each experiment, and microplankton assemblage structure was evaluated using Permutational Multivariate Analysis of Variance and Non-Metric Multi-Dimensional Scaling ordination on Day 0 (ambient) and Day 5 of each experiment. Nutrient amendment significantly affected phytoplankton abundance and biomass, particularly in June–August, although this varied between taxa (e.g., cyanobacteria, dinoflagellates, flagellates and ciliates showed more frequent positive responses than chlorophytes and diatoms did). Abundance-based microplankton assemblage structure was significantly correlated with PO4, SiO4 and NO3 concentrations, and BIOENV procedure in R revealed that the best subset of explanatory variables included SiO4 and NO3 concentrations. Biomass-based assemblage structure was significantly correlated with SiO4 and NO3, although BIOENV explanatory variables included only SiO4. These results are suggestive of summertime nutrient control of phytoplankton abundance and biomass, as well as microplankton composition, in the lower Columbia River, at least during some months. Since eutrophication is increasing in the watershed, this could have important implications for higher level consumers (e.g., zooplankton and out-migrating juvenile salmon).

1. Introduction

The availability of inorganic nutrients such as nitrate (NO3), phosphate (PO4) and silicate (SiO4) have long been recognized as important factors regulating the abundance and biomass of phytoplankton in both freshwater [1,2,3,4] and marine systems [5,6,7]. Likewise, it is now well known that nutrient concentrations can also have profound effects on the composition of the total microplankton (defined here as phytoplankton and microzooplankton ~5–200 µm in size) assemblage in aquatic systems across the lentic freshwater-marine spectrum [8,9,10,11,12,13,14]. In large, high-flow temperate rivers, however, the role of inorganic nutrients in limiting phytoplankton biomass and microplankton assemblage composition is not clear.
For instance, one or more nutrients were found to limit phytoplankton growth, at least during some time(s) of the year, in the Neuse River, NC, USA [15], the River Murray in South Australia [16], and Xiangxi Bay/Yangtze River, China [17] (see also recent review by Dodds and Smith [18]). In contrast, no such nutrient limitation was found in the Berounka River, Czech Republic [19], nor the Rhine and Elbe Rivers, Germany [20]. With regard to phytoplankton community composition, several studies show nutrients to affect the phytoplankton community structure in large temperate rivers in Europe and China [21,22,23]. However, a lack of nutrient limitation on phytoplankton composition has been observed in the Czech Republic [19]. Overall, nutrient limitation of phytoplankton dynamics in large temperate rivers seems common but by no means universal.
Nutrient concentrations often vary seasonally within any given temperate river, although the exact pattern depends on the nutrient constituent and watershed of interest. For instance, NO3 [24,25,26,27,28] and PO4 [27,29,30,31] concentrations in temperate rivers are often lowest during the summer. On the other hand, SiO4 concentrations have been shown to be generally (although not always) lower in spring and early summer, and higher in late summer and fall [27,29,30,31,32,33], but see [24] for an exception.
In the Columbia River (CR), USA, there have been very few previous studies of interactions between nutrients and phytoplankton. Sullivan et al. [34] undertook a one-year field study in the lower CR and observed minima in both NO3 and PO4 concentrations from May to October 1996, with a diatom bloom occurring from April to June. Maier and Peterson [35] further examined late spring/early summer diatom blooms in the lower CR over a four-year period (2009–2013) and found orthophosphate concentrations were often very low, with a decreasing trend from winter to late spring. Most recently, Rose et al. [36] examined a 14-year dataset (2005–2018) of phytoplankton abundance, biomass and taxonomic composition, along with water quality variables, in the lower CR and found assemblage structure to be only weakly associated with nutrients (NO3, PO4 and SiO4). Collectively, this small body of previous work suggests a modest potential role for nutrient limitation of phytoplankton dynamics in the CR, and if present at all, such limitation would appear to be more likely to occur from late spring to early fall. However, this has never been tested experimentally.
In order to fill this knowledge gap, we undertook a series of controlled and replicated laboratory-based nutrient amendment experiments from May to September 2018 to address the overarching research question: Are inorganic nutrients (NO3, PO4 and SiO4) regulating the abundance (cells mL−1), biomass (µg C L−1) and taxonomic composition of the microplankton assemblage in the CR?

2. Materials and Methods

2.1. Study Site

The Columbia River (CR) is the largest river by discharge on the Pacific coast of North America, draining an area of 660,480 km2 that includes parts of seven U.S. states and two Canadian provinces [37]. The river’s discharge is moderated by its approximately 214 impoundments [38]. Discharge varies seasonally and ranges from 2000–16,000 m3s−1, with snowmelt-driven high discharge occurring from April–June, and low discharge from July–October [39,40]. The Cascade Mountain Range divides the Columbia River Basin into two sub-basins [37]. The coastal downstream sub-basin west of the Cascade Range has a wet climate and is primarily forested, while the eastern upstream sub-basin has an arid climate and extensive agricultural lands. Urban development along the river is concentrated in the lower CR near Portland, OR and Vancouver, WA, USA.
All field samples were collected from a public dock located at Vancouver, WA (45.6222° N, 122.6772° W), 171 river kilometers upstream from the mouth of the river at the Pacific coast. The site is downstream of the Bonneville Dam (river kilometer 234), the lowermost impoundment on the river, and is tidally influenced freshwater. The dock extends ~10 m from the shore and runs parallel to the flow of the river. The water column at this site is always well mixed and has an average depth of 9.5 m [36,41,42].

2.2. Nutrient Amendment Experiments

We conducted a series of 5-day laboratory-based nutrient amendment incubation experiments, once each month from May–September 2018, for a total of five experiments. Laboratory experiments were chosen over field deployments to allow for better control and maintenance of mixing (via a rotating plankton wheel, as described below) and to avoid possible vandalism and tampering at public docks (the only type of dock available to us in this region of the CR). Our experimental design included 500 mL initial control bottles filled with river water (May: 3 replicates; June–September: 4 replicates) which were sampled prior to commencing the experiment, and final control and final treatment (nutrient-amended) bottles which were sampled destructively every 24 h over the course of each 5-day incubation experiment (May: n = 5 days × 2 treatments × 3 replicates = 30 bottles; June–September: n = 5 days × 2 treatments × 4 replicates = 40 bottles in each experiment). The initial controls were used to establish ambient river nutrient levels, chlorophyll (chl) a concentration and microplankton assemblage structure and compared to final control and treatment samples to evaluate the effects of nutrient amendment on the entire microplankton assemblage during the incubations. Significant increases in chl a concentration, microplankton abundance or biomass, or altered microplankton assemblage structure, in the final nutrient-amended samples relative to final control samples were considered evidence of microplankton nutrient limitation during each monthly experiment.
The CR water used in the experiments was collected from the surface (0–0.5 m) at the Vancouver dock during the fourth week of each month and transported in acid-washed carboys within one hour to laboratory facilities at Washington State University Vancouver. Surface water temperature and dissolved oxygen concentration were measured at the dock using a YSI Pro2030 multimeter (YSI Inc., Yellow Springs, OH, USA), and pH was measured using a Hach Pocket Pro tester (Hach, Inc., Loveland, CO, USA).
Immediately upon return to the laboratory, the river water was reverse filtered using a 250 µm mesh sieve to remove mesozooplankton. We then gently siphoned 500 mL of filtered river water into each acid-washed incubation bottle. Prior to the onset of the incubation (Day 0), we sampled the initial control bottles for nutrient and chl a concentrations, and microplankton abundance and taxonomic composition (as described below). We then added sodium nitrate (NaNO3), potassium phosphate (KH2PO4) and sodium metasilicate (NaSiO3), in combination, to each treatment bottle to reach levels we expected would be replete. Our target concentrations were 0.5 mg L−1 of NO3, 0.06 mg L−1 of PO4 and 8.4 mg L−1 of SiO4, based on laboratory studies of freshwater phytoplankton growth rates under a wide range of PO4 concentrations (e.g., [43]) and the proportions of N, P, and Si in typical algal growth media (e.g., [44])—levels which also exceeded the maxima for each constituent previously observed in the freshwater reaches of the lower CR [34,35,36,45]. Although the amount of nutrients added inadvertently varied somewhat between our monthly experiments, and at times resulted in higher concentrations of SiO4 relative to NO3 and PO4, our overarching goal was to establish replete levels of all three nutrients in each experiment, not to establish any particular ratio of nutrients.
Each of the final control and treatment bottles was then sealed with parafilm to prevent bubbles (which can disrupt fragile planktonic taxa during mixing), lidded and placed on a rotating plankton wheel (0.5–1.0 rpm) in a temperature-controlled room set to match the ambient river temperature and light–dark (i.e., duration of daylight) conditions during the month of each experiment. We did not change the intensity (per unit time) nor the spectral quality of the light (i.e., Photosynthetically Active Radiation (PAR)) during or between monthly experiments. With respect to light intensity, our intent was to simulate shallow, near-subsurface conditions in the lower CR. The PAR intensity occurring at the surface of our experimental bottles, as measured with a SpotOn Quantum Light Meter (model #35650) (Innoquest, Inc., Woodstock, NY, USA), was 17.0 µmol m−2 s−1. This represented 36.7% of mean midday (10:30 a.m.–2:30 p.m. local time) outdoor incident surface radiation (quantum line measurement), averaged over May–September 2018, as measured at a nearby meteorological station (“Abby Road” https://data.neonscience.org/data-products/explore, accessed on 1 February 2022). We determined that this level simulated the PAR intensity at 1.1 m depth at our sampling site, based on (i) the known exponential decay of light with depth (Iz(m) = I0 ∗ e−kz(m); [46]), (ii) the known relationship between extinction coefficient (k) and Secchi disk depth (Zsd(m)) (k = 1.7/Zsd(m) [47,48], but see also [49]), and (iii) a mean Secchi disk depth (Zsd(m)) of 2.0 m during May–September at our collection site in the CR [36].
After 24 h, and on each subsequent 24 h period of each 5-day experiment, final control and final nutrient-amended bottles were removed from the plankton wheel without replacement and sampled for nutrients, chl a and microplankton in the same manner as the initial control bottles.

2.3. Sample Collection and Analyses

2.3.1. Nutrients

To measure nutrient concentrations within each incubation bottle, we extracted 50 mL sub-samples of experimental water from each bottle and filtered them through 0.45 µm Millipore syringe filters into plastic collection bottles. Samples were kept frozen before being transferred to the University of Washington’s Marine Chemistry Lab for analysis. Samples were analyzed for PO4, NO3, NO2 and SiO4 concentrations, following the protocols of the World Ocean Circulation Experiment (WOCE) Hydrographic Program [50] and using a Seal Analytical continuous-flow AutoAnalyzer 3.

2.3.2. Chlorophyll

To determine chl a concentration, we vacuum-filtered 100 mL of experimental water from each incubation bottle through a GF/F filter. Filters were stored in glass scintillation vials in a −20 °C freezer for at least 24 h but fewer than 6 days. We then added 20 mL of acetone to each vial to extract the pigments. After 24 h of acetone immersion in the freezer, samples were analyzed on a Turner Model 10-AU fluorometer [51]. Chl a was measured for all experiment months, days, treatments and replicates, with the exception of the Day 5 final nutrient-amended replicates from the May experiment, due to technician error. In addition, later nutrient analysis revealed that during the June experiment, two treatment bottles had insufficient SiO4 added, consequently the chl a samples from these bottles were discarded, resulting in n = 3 replicates for Day 3 and Day 5 final nutrient-amended treatments from that single experiment.

2.3.3. Microplankton

We transferred 200 mL subsamples from each incubation bottle into amber bottles with 5% Lugol’s solution to preserve microplankton for later taxonomic analysis. Due to logistical (time and money) constraints, we conducted microscopical analyses to identify and enumerate microplankton in incubation bottles from Day 0 initial control, Day 5 final control and Day 5 final nutrient-amended treatments for which there were corresponding chl a measurements.
We concentrated 24.5–50 mL from each subsample in Utermöhl settling chambers [52]. After 24 h, microplankton were identified using a Leica DMI 4000B inverted microscope at 400× magnification. We enumerated, sized and identified at least 300 microplankton cells between 5 and 200 µm in size along slide transects [53]. Most individual cyanobacteria cells were smaller than 5 µm; however, we enumerated individual cells if they were contained in a colony that was within the target size range. Organisms were identified to genus, or species when possible, using Patterson and Hedley [54] and Wehr et al. [55]. We converted subsample counts to biovolume according to geometric shape [56] and converted biovolume to carbon biomass using algorithms from Menden-Deuer and Lessard [57]. For statistical analyses, organisms were binned into seven taxonomic groups: chlorophytes, cyanobacteria, diatoms, dinoflagellates, flagellates, rhodophytes and ciliates.

2.4. Statistical Analyses

2.4.1. Monthly Variability of Chl a Concentration and Microplankton Assemblage Structure

We tested for significant differences in ambient chl a concentration in the CR between sampling months, as measured by the Day 0 initial control samples, using the Kruskal–Wallis rank sum test due to non-normality of model residuals [58]. We then used Dunn’s test [59] with Holm’s multiple comparisons p-value adjustment [60] to determine which pairs of months significantly differed. The Dunn’s test was implemented in the statistical program R [61] using the FSA package [62].
We evaluated monthly variability of ambient microplankton assemblage structure using the Day 0 initial control microplankton data and multivariate statistical approaches. We conducted analyses of microplankton abundance using a square-root transformation, and of microplankton biomass using a log(x + 1) transformation, in order to improve data normality and to decrease the relative contribution of dominant taxa. For both abundance and biomass data, we used the Bray–Curtis dissimilarity measure [63] to quantify the dissimilarity between samples.
To test for assemblage structure differences between months, we used permutational multivariate analysis of variance (PERMANOVA) [64]. We verified homogeneity of multivariate group dispersions using the ‘betadisper’ function in R. To determine which months differed in assemblage structure, we ran pairwise post hoc tests using the function ‘pairwise.perm.manova’ in the R package ‘RVAideMemoire’ [65].
We visualized the monthly variability of Day 0 initial control microplankton assemblage structure and relationships with environmental gradients using non-metric multidimensional scaling ordinations (NMDS) [66]. On an NMDS ordination, each point represents a sample, and samples that are closer to each other in space are more similar in composition. We evaluated NMDS goodness of fit using stress values, where values less than 0.2 are considered usable for inference [67] and, additionally, we used the Dexter et al. [68] stress test, which compares observed stress values to those obtained by null model simulations. We standardized the environmental data (temperature, pH, dissolved oxygen, PO4, NO3, NO2 and SiO4) by setting each variable to a mean of 0 and a standard deviation of 1 and plotted each significantly correlated variable as a vector on the NMDS using the ‘envfit’ function. Finally, we used the BIOENV correlation procedure to identify the best subset of environmental variables that had maximum Spearman rank correlation with the microplankton assemblage data [69].

2.4.2. Effects of Nutrient Amendment

For each monthly experiment and incubation day (1–5), we tested for significant differences in mean chl a between final control (ambient nutrient levels) and final nutrient-amended samples using Student’s t-tests. Data were first verified for normality using the Shapiro–Wilk test and for homogeneity of variance using Levene’s test. When data did not meet the assumption of normality, we instead used the non-parametric Mann–Whitney test, and when homogeneity of variance was violated, we used Welch’s t-test for unequal variances. For all significant hypothesis tests, we calculated effect size (standardized mean difference) using the bias corrected Hedge’s g statistic [70], which is less biased than Cohen’s d for small samples (n < 20) [71]. As a rule of thumb, effect sizes of 0.2 are generally considered small effects, 0.5 medium effects and >0.8 large effects [72]. Effect size tests were run using the R package ‘effectsize’ [73].
We compared Day 5 abundance and biomass between final control and final nutrient-amended treatments for each microplankton taxonomic group. Taxa abundance data were square-root transformed and biomass data log(x + 1) transformed to improve normality, then hypothesis testing and effect size calculations were conducted following the same methods as described above to determine the effect of nutrient amendment on chl a levels. We applied the same methods to determine nutrient amendment effects on assemblage structure as were used for our assessments of monthly assemblage variability. We first used PERMANOVA to test for significant differences between control and nutrient-amended samples for each monthly experiment. Then, we used NMDS ordinations paired with vectors of nutrient gradients (‘envfit’) and BIOENV to visualize and evaluate relationships between the microplankton assemblage and nutrient levels (PO4, NO3, NO2 and SiO4).
All PERMANOVA, ‘betadisper’, NMDS, null model simulations, ‘envfit’ and BIOENV tests were run using 1000 permutations in the ‘vegan’ package [74], except for the May Day 5 microplankton PERMANOVA and post hoc tests, which were run using the entire set of possible permutations (n = 719) because of low sample size.

3. Results

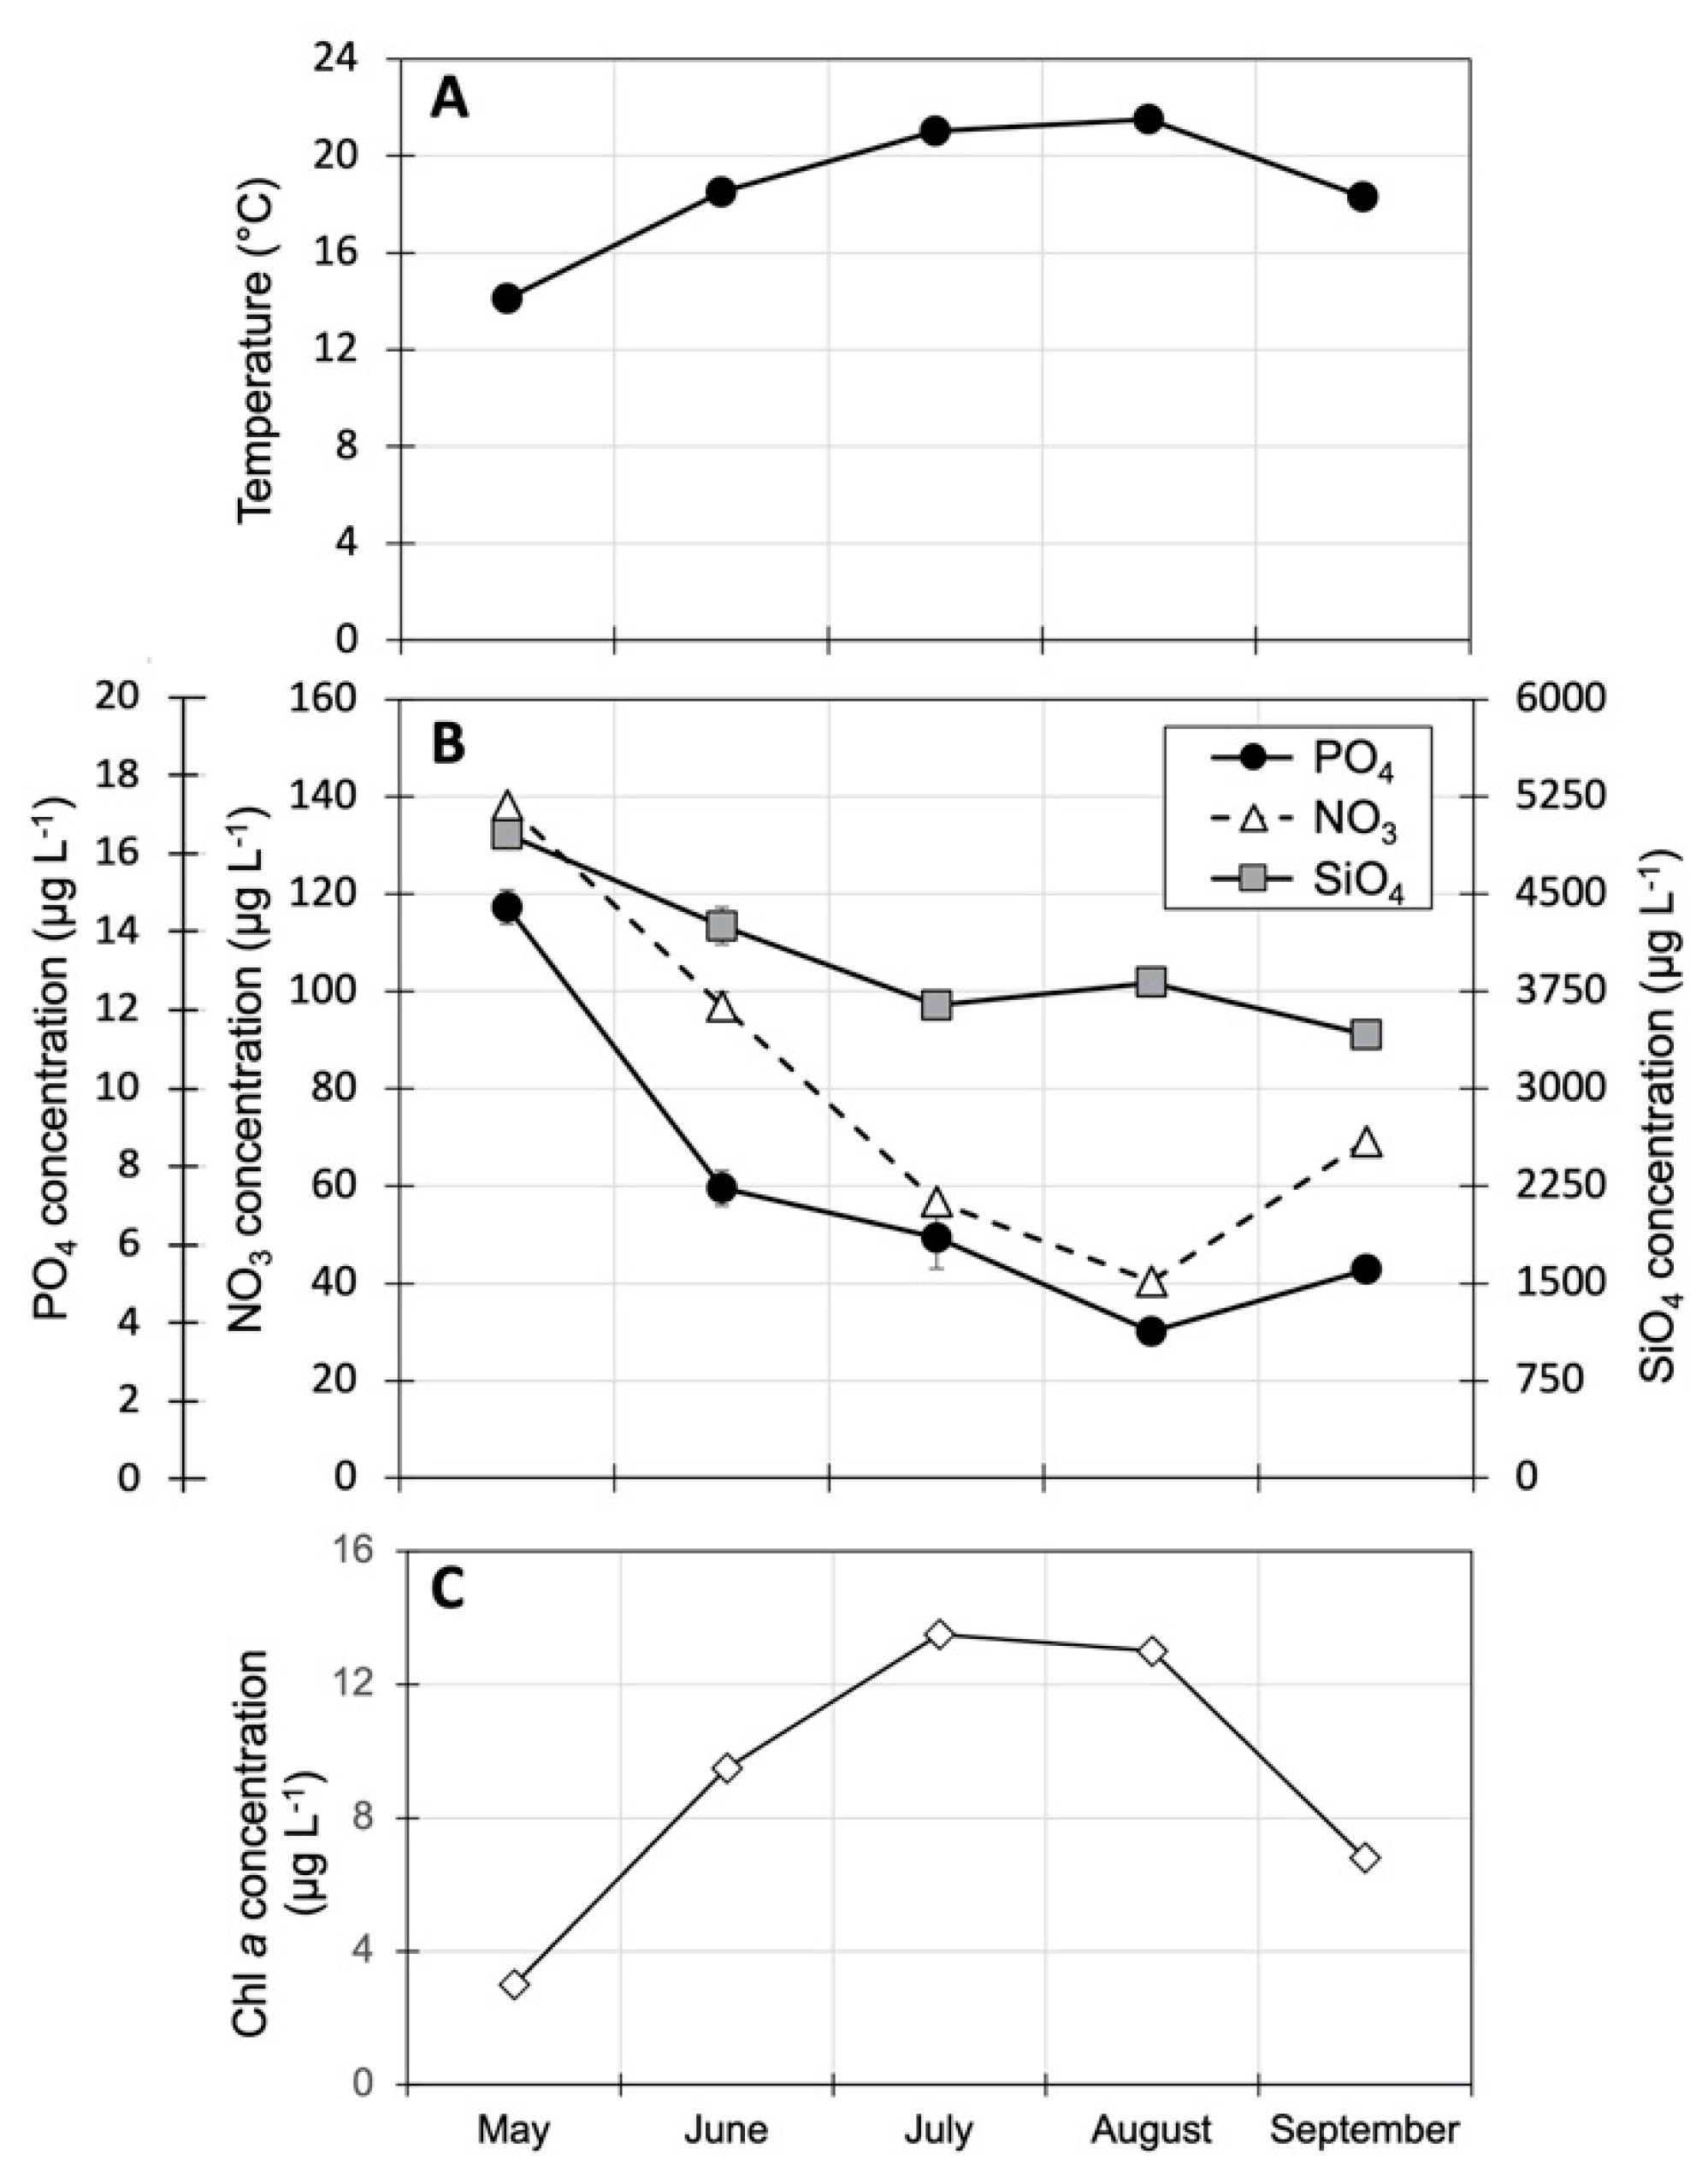
3.1. Ambient Columbia River Temperature, Nutrient and Chl a Concentrations

Surface temperature in the Columbia River (CR) at our Vancouver, WA, sampling location followed a pattern typical for this latitude, with maximum temperature (21.2 °C) observed in August and lowest temperatures over the sampling period in May and September (14.5 °C and 18.1 °C, respectively) (Figure 1A). Concentrations of all three nutrient constituents in the river, as measured using the Day 0 initial control samples, peaked in May and then decreased to their lowest levels in the period from July to September (Figure 1B). Specifically, NO3 concentrations steadily decreased from May (138 µg L−1) to August (40.4 µg L−1), with a modest increase in September (69.2 µg L−1). PO4 concentrations showed the same pattern of change as NO3, with highest concentration in May (5.9 µg L−1), lowest concentration in August (1.5 µg L−1), and a very slight increase in September (2.1 µg L−1). SiO4 was present in the river at highest concentrations in May (5.0 mg L−1) and decreased through June until reaching minimum concentrations ranging from 3.4–3.8 mg L−1 from July to September (Figure 1B).
Chl a concentration in the CR was lowest in May (mean: 6.4 µg L−1), coinciding with highest nutrient levels. Chl a then increased each month through August, when it reached its peak (13.1 µg L−1), before declining in September (Figure 1C). Chl a significantly differed by month (Kruskal–Wallis χ2 = 15.93, df = 4, p = 0.003), with August having significantly higher concentration than May (Dunn’s test: p = 0.024) and September (Dunn’s test: p = 0.025). No other pairwise comparisons were significantly different.

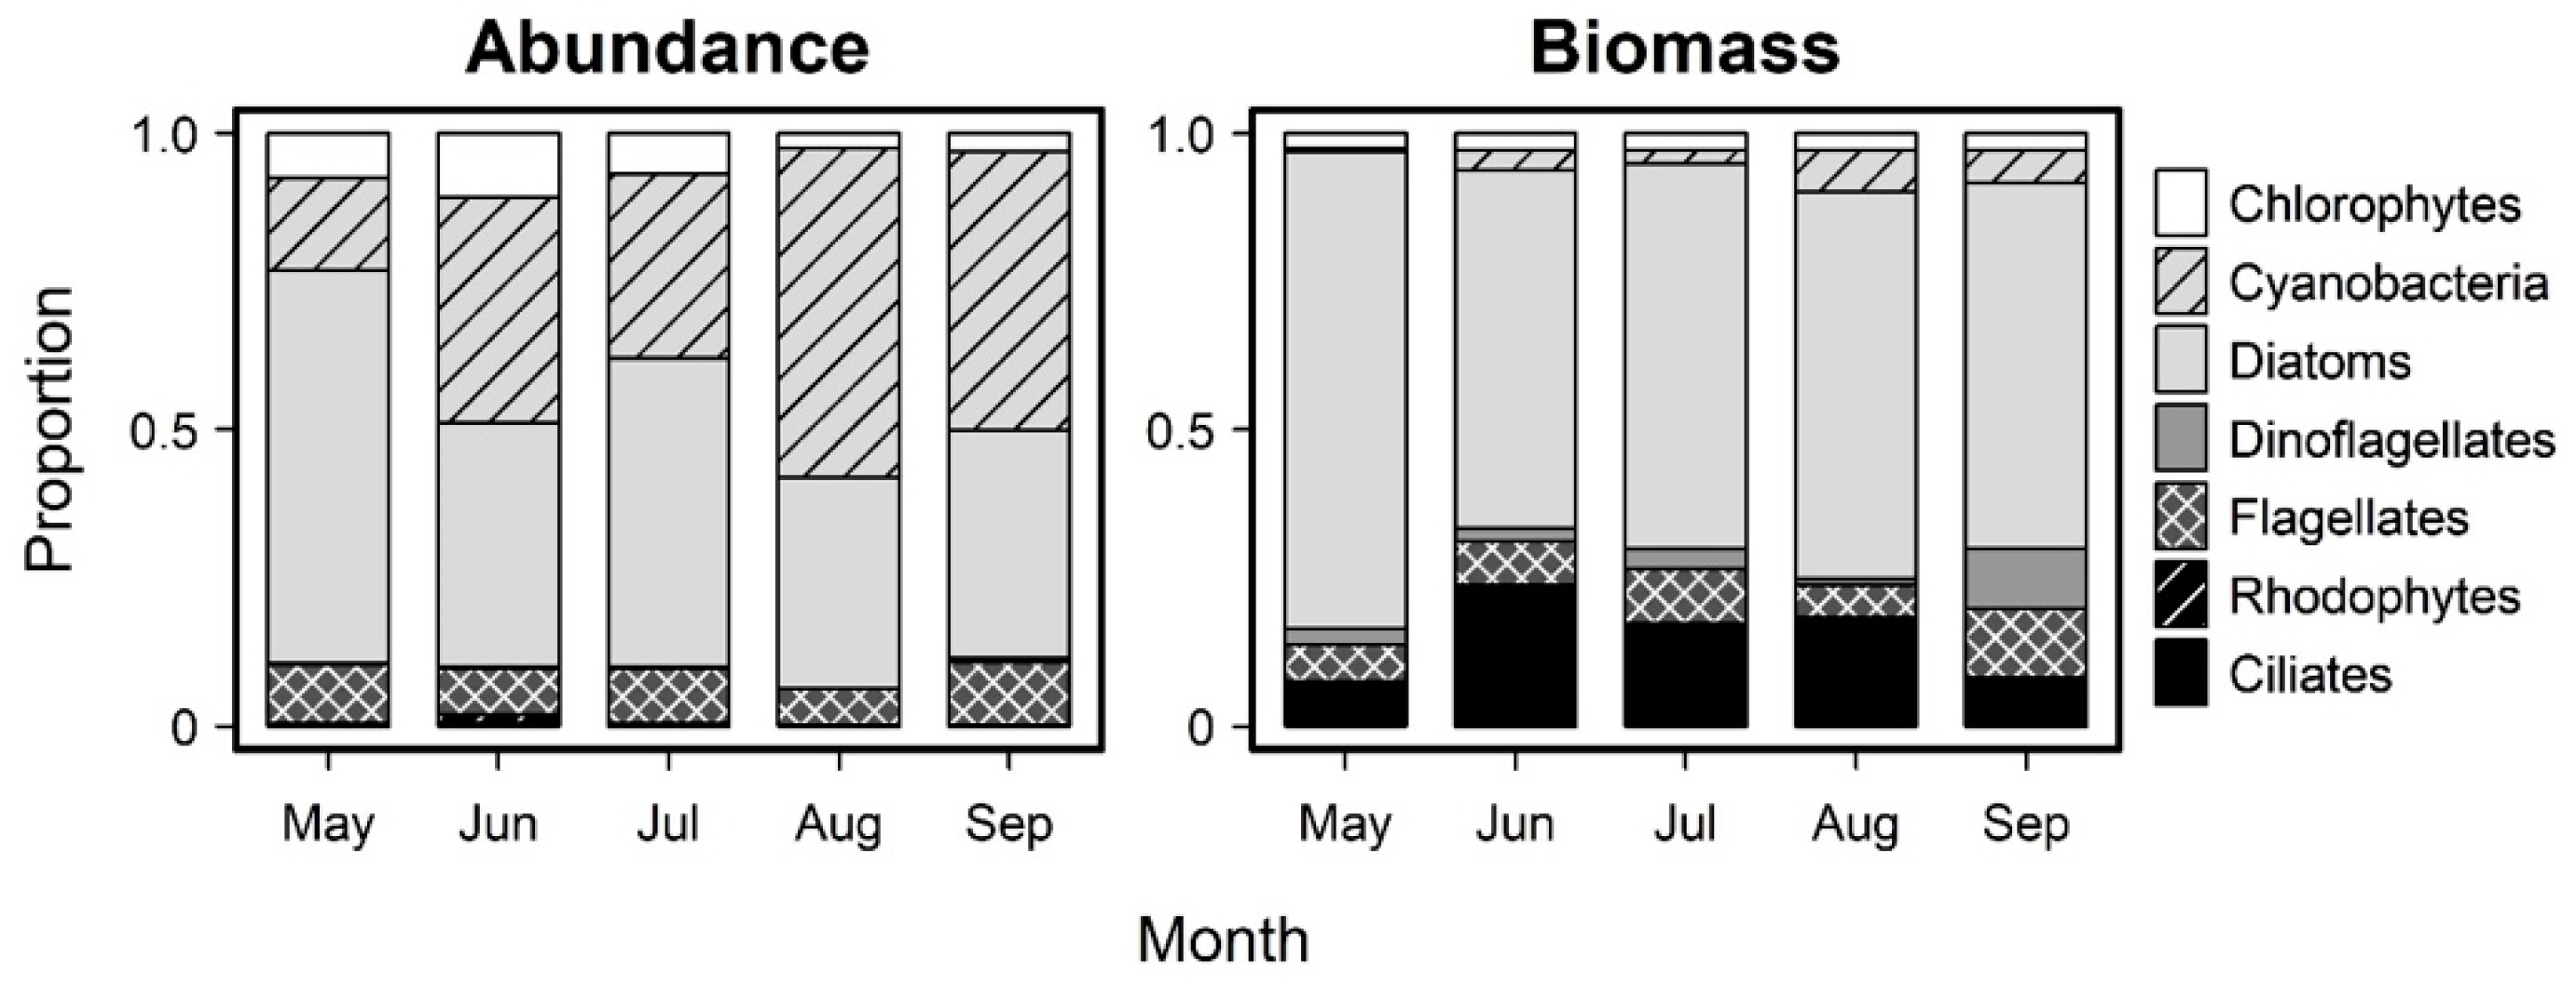
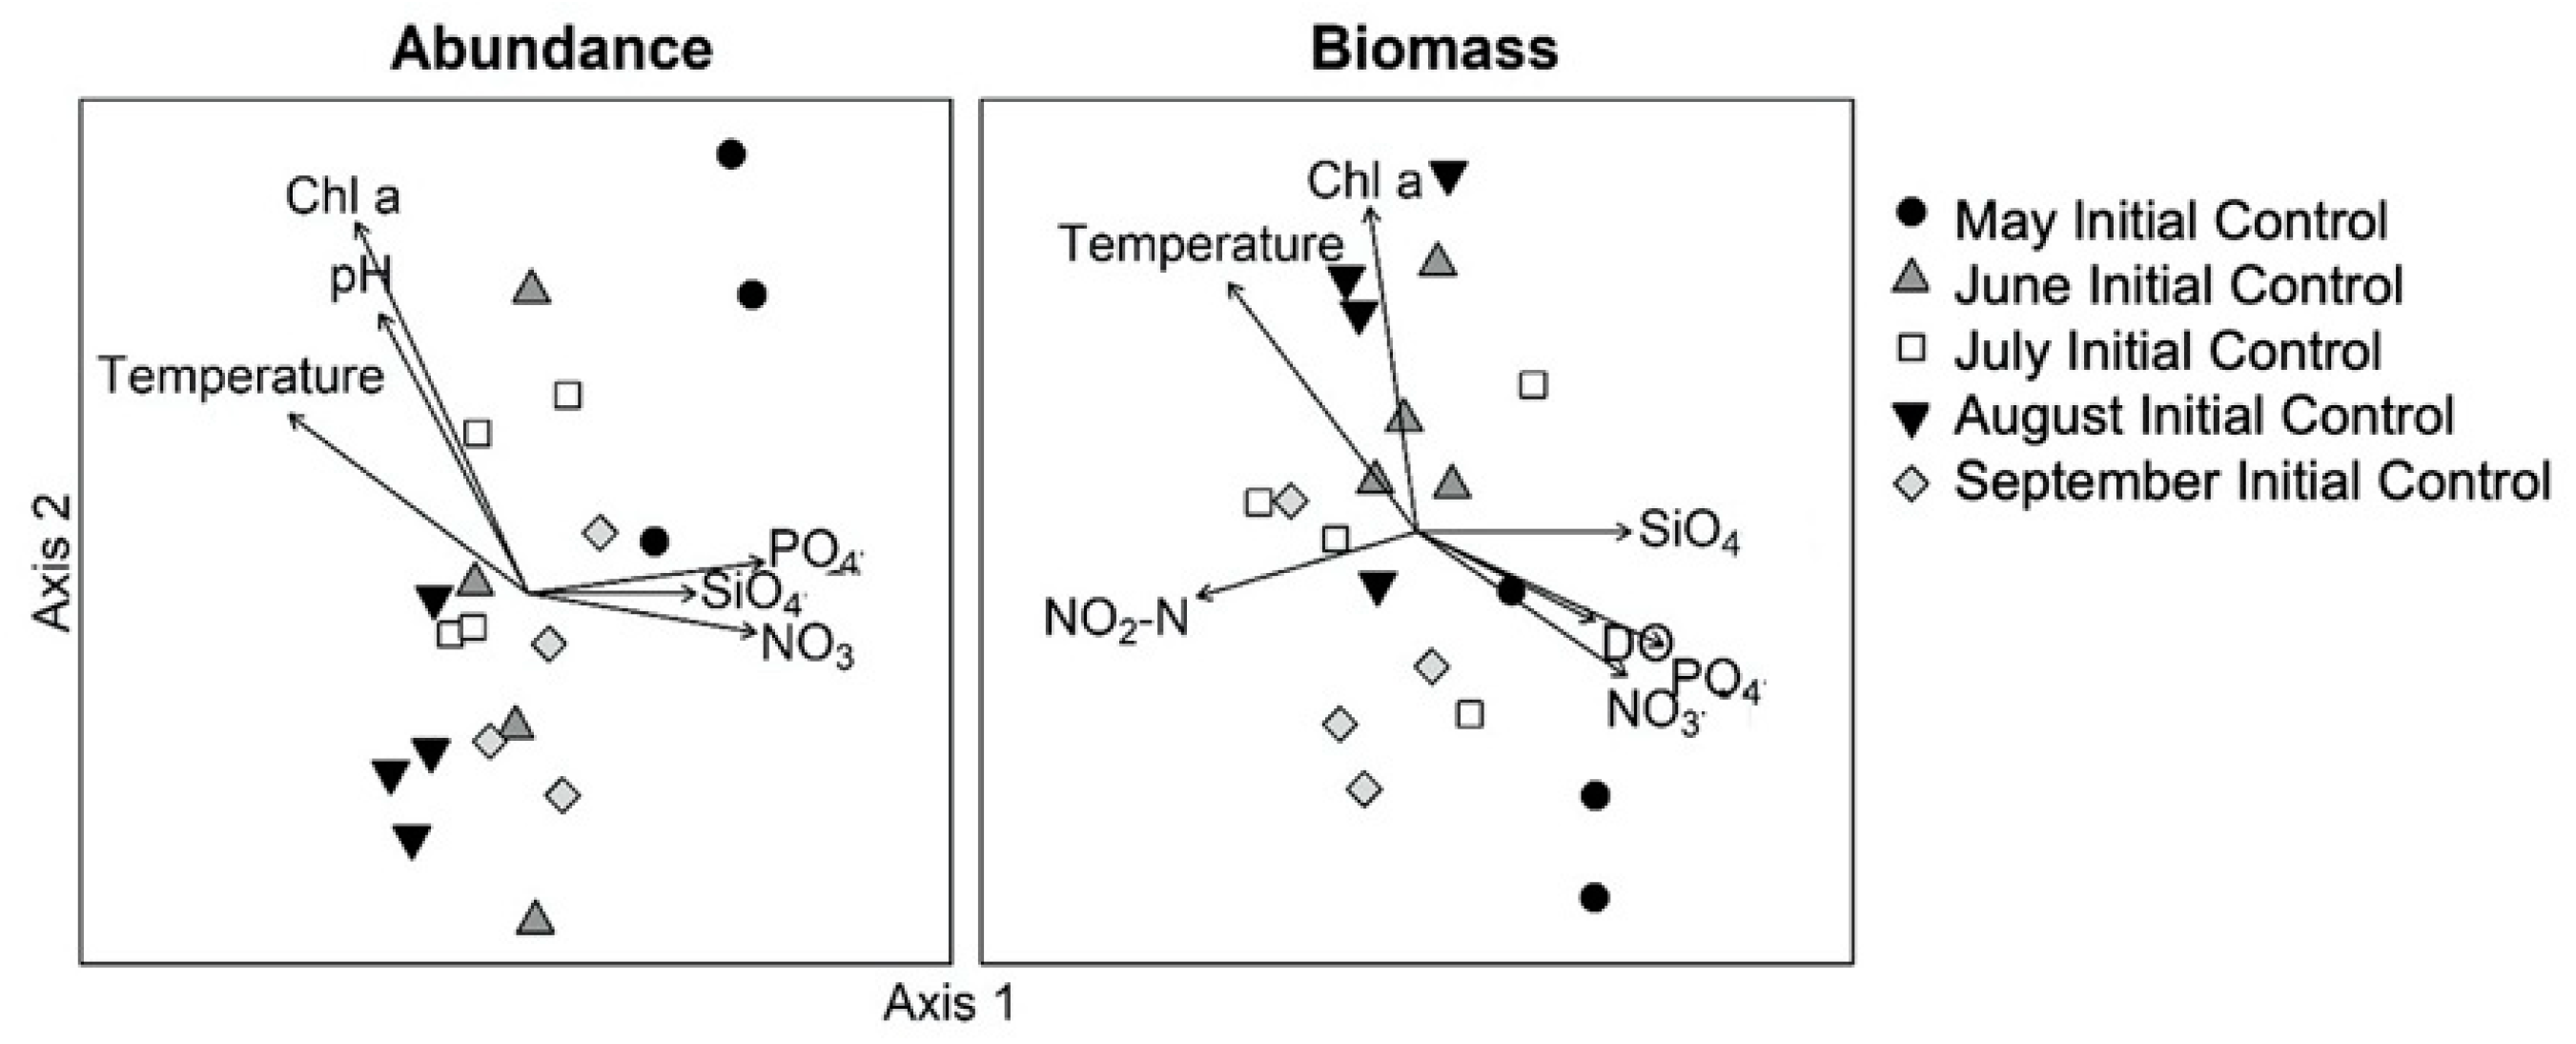
3.2. Monthly Variability of Ambient Microplankton Assemblage Structure

The ambient river microplankton assemblage from May–September was dominated by diatoms and cyanobacteria in terms of proportional abundance (Figure 2). Cyanobacteria were proportionally more abundant during the summer months and especially in August, when they comprised over 50% of the assemblage. In terms of carbon biomass, diatoms comprised well over 50% of the assemblage in all months. Cyanobacteria, though high in abundance, were a small proportion of the assemblage by biomass. In contrast, ciliates were in low abundance, but had the second highest relative biomass from May–August due to their comparatively large cell volume (Figure 2).
PERMANOVA revealed that microplankton assemblage structure, as measured by taxa abundances, varied strongly by month (R2 = 0.71, F4,14 = 8.54, p = 0.001) (Table 1). Subsequent pairwise comparisons showed that assemblage structure significantly differed for all pairwise comparisons except for June and July, and July and September (Table 1). Using taxa carbon biomasses, PERMANOVA again showed a strong month effect on assemblage structure (R2 = 0.54, F4,14 = 4.10, p = 0.002). May significantly differed from June, August and September, and both June and August differed from September (Table 1).
NMDS ordination of ambient (Day 0) microplankton assemblage structure using taxa abundances produced a two-dimensional solution (stress = 0.085) (Figure 3). Using the stress test [68], we verified that the observed stress value would have been unlikely to occur due to stochastic sampling effects alone (Z = −5.56, p = 0.001). We found significant correlations between microplankton assemblage structure (taxa abundances) and river temperature, pH, chl a, PO4, SiO4 and NO3 (Table 2), which are plotted as vectors on the NMDS ordination (Figure 3). BIOENV revealed that the subset of environmental variables that best explained the ambient microplankton assemblage abundance data were PO4, SiO4 and temperature (r = 0.708).
NMDS ordination of the ambient microplankton assemblage structure using taxa carbon biomasses also produced a two-dimensional solution (stress = 0.136) that was supported by the stress test [68] (Z = −2.46, p = 0.011) (Figure 3). Significant linear correlations were found between the microplankton assemblage matrix and temperature, chl a, PO4, SiO4, NO3 and NO2 (Table 2). The best subset of explanatory variables determined by BIOENV analysis were PO4, NO2 and temperature (r = 0.452).

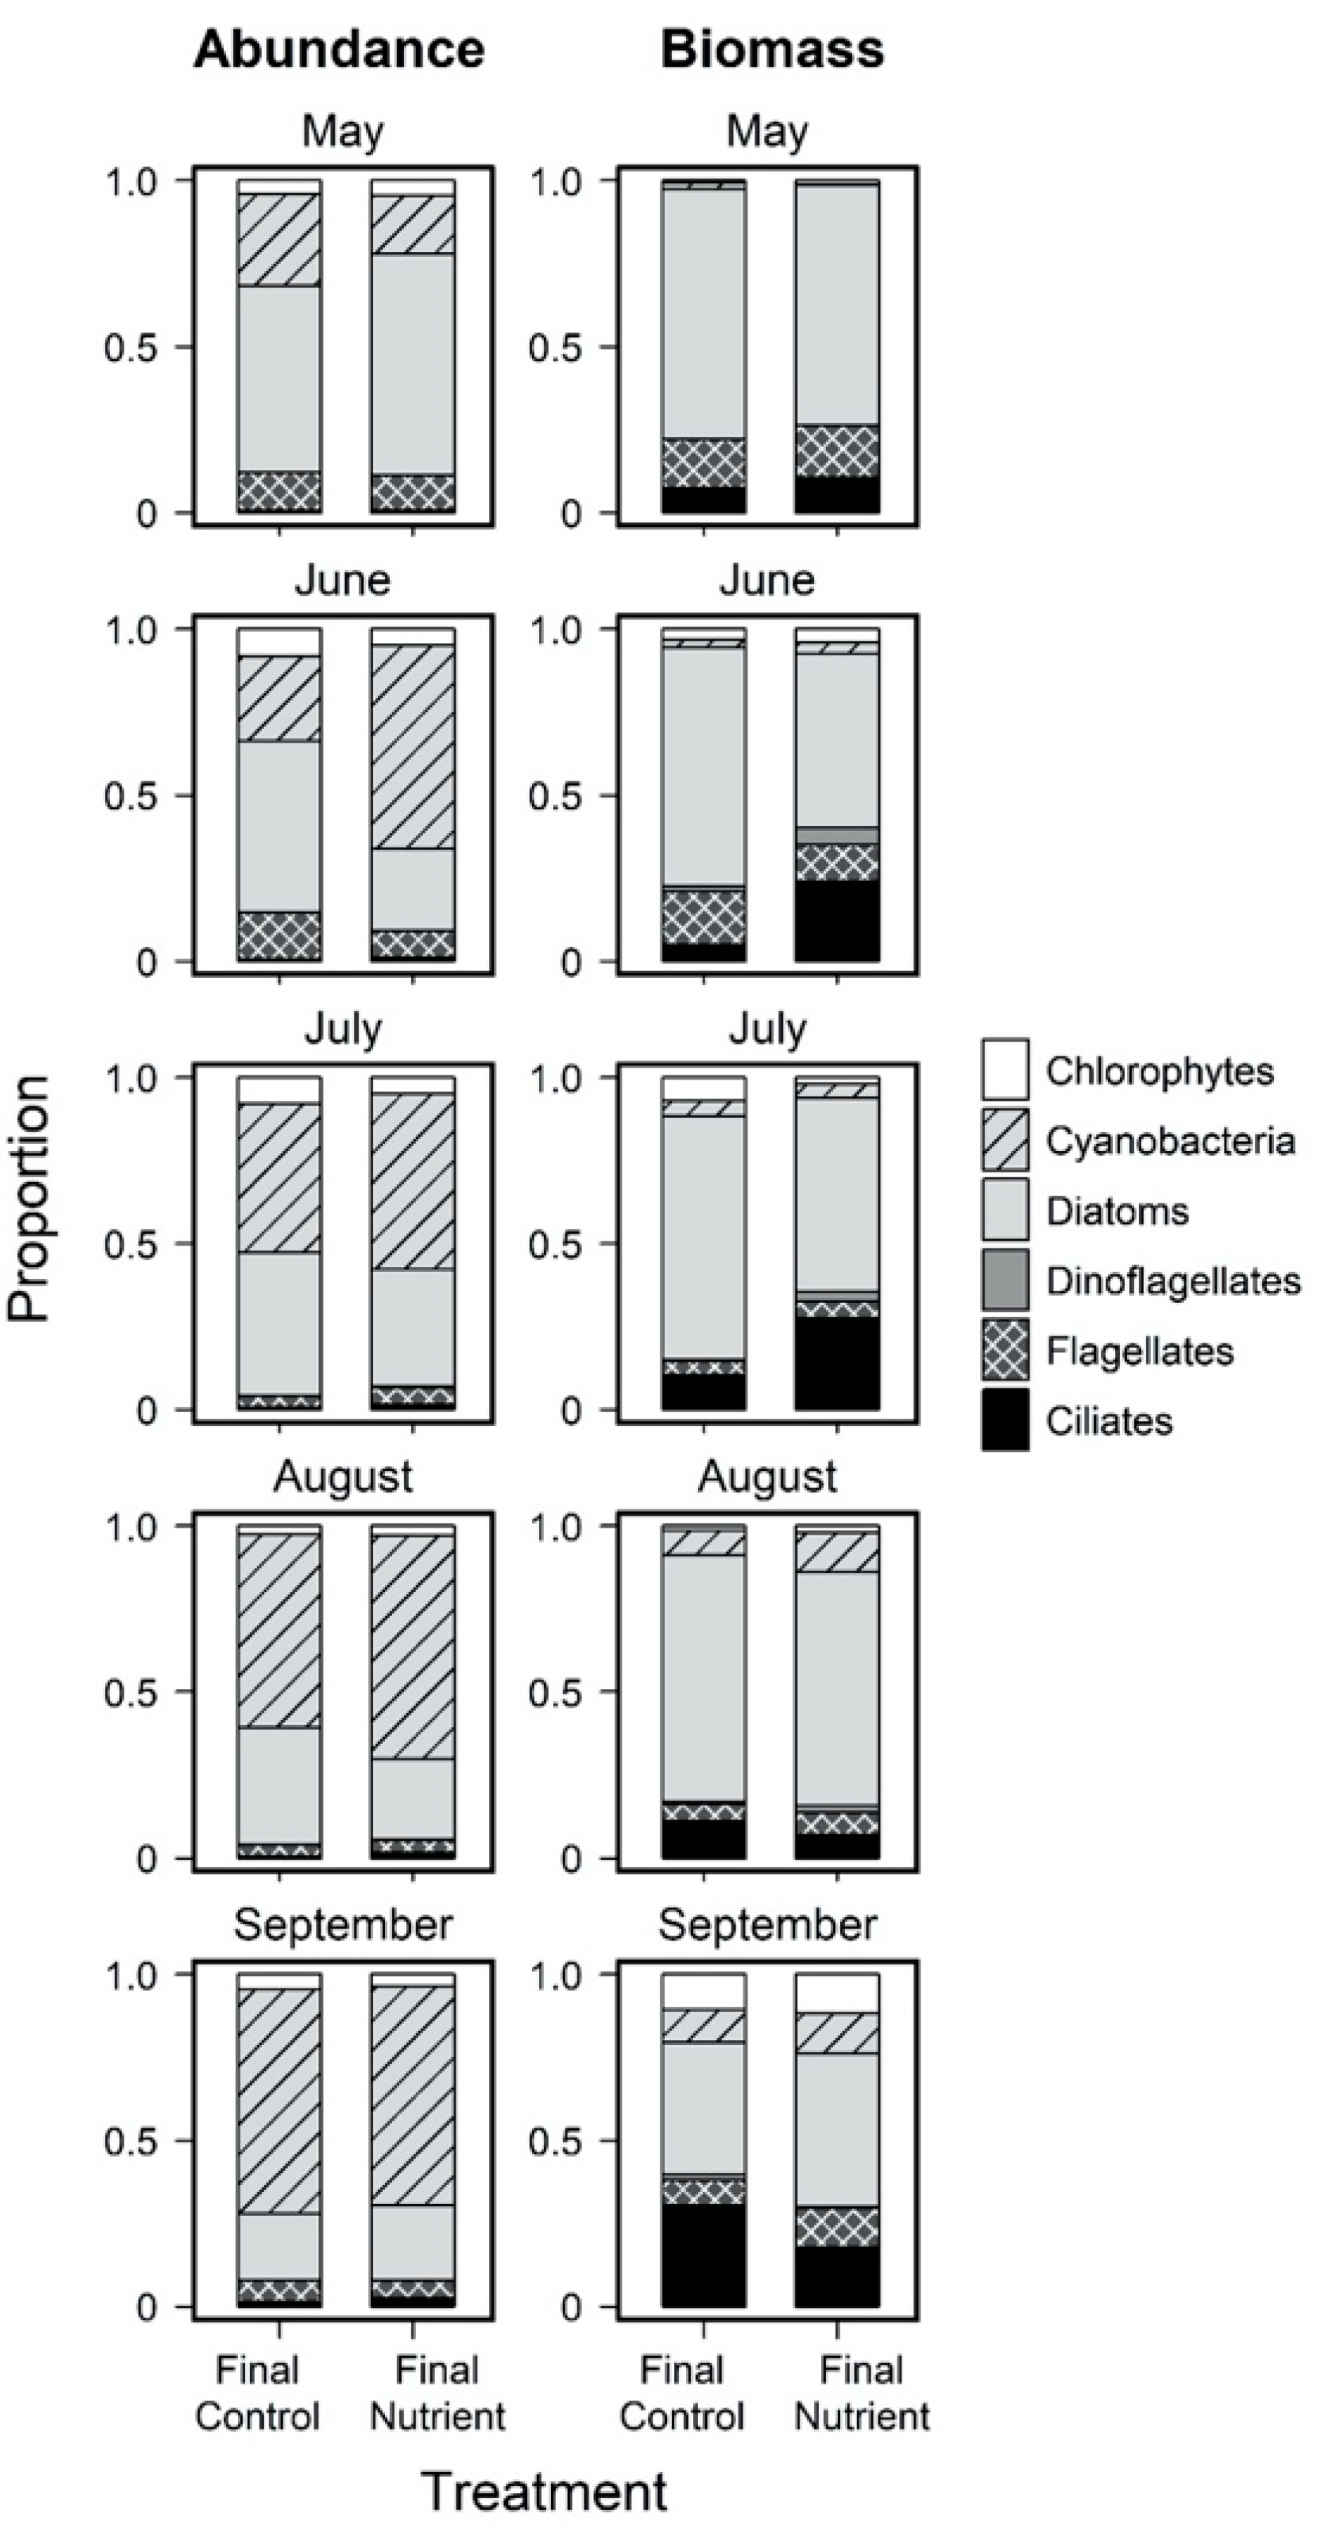
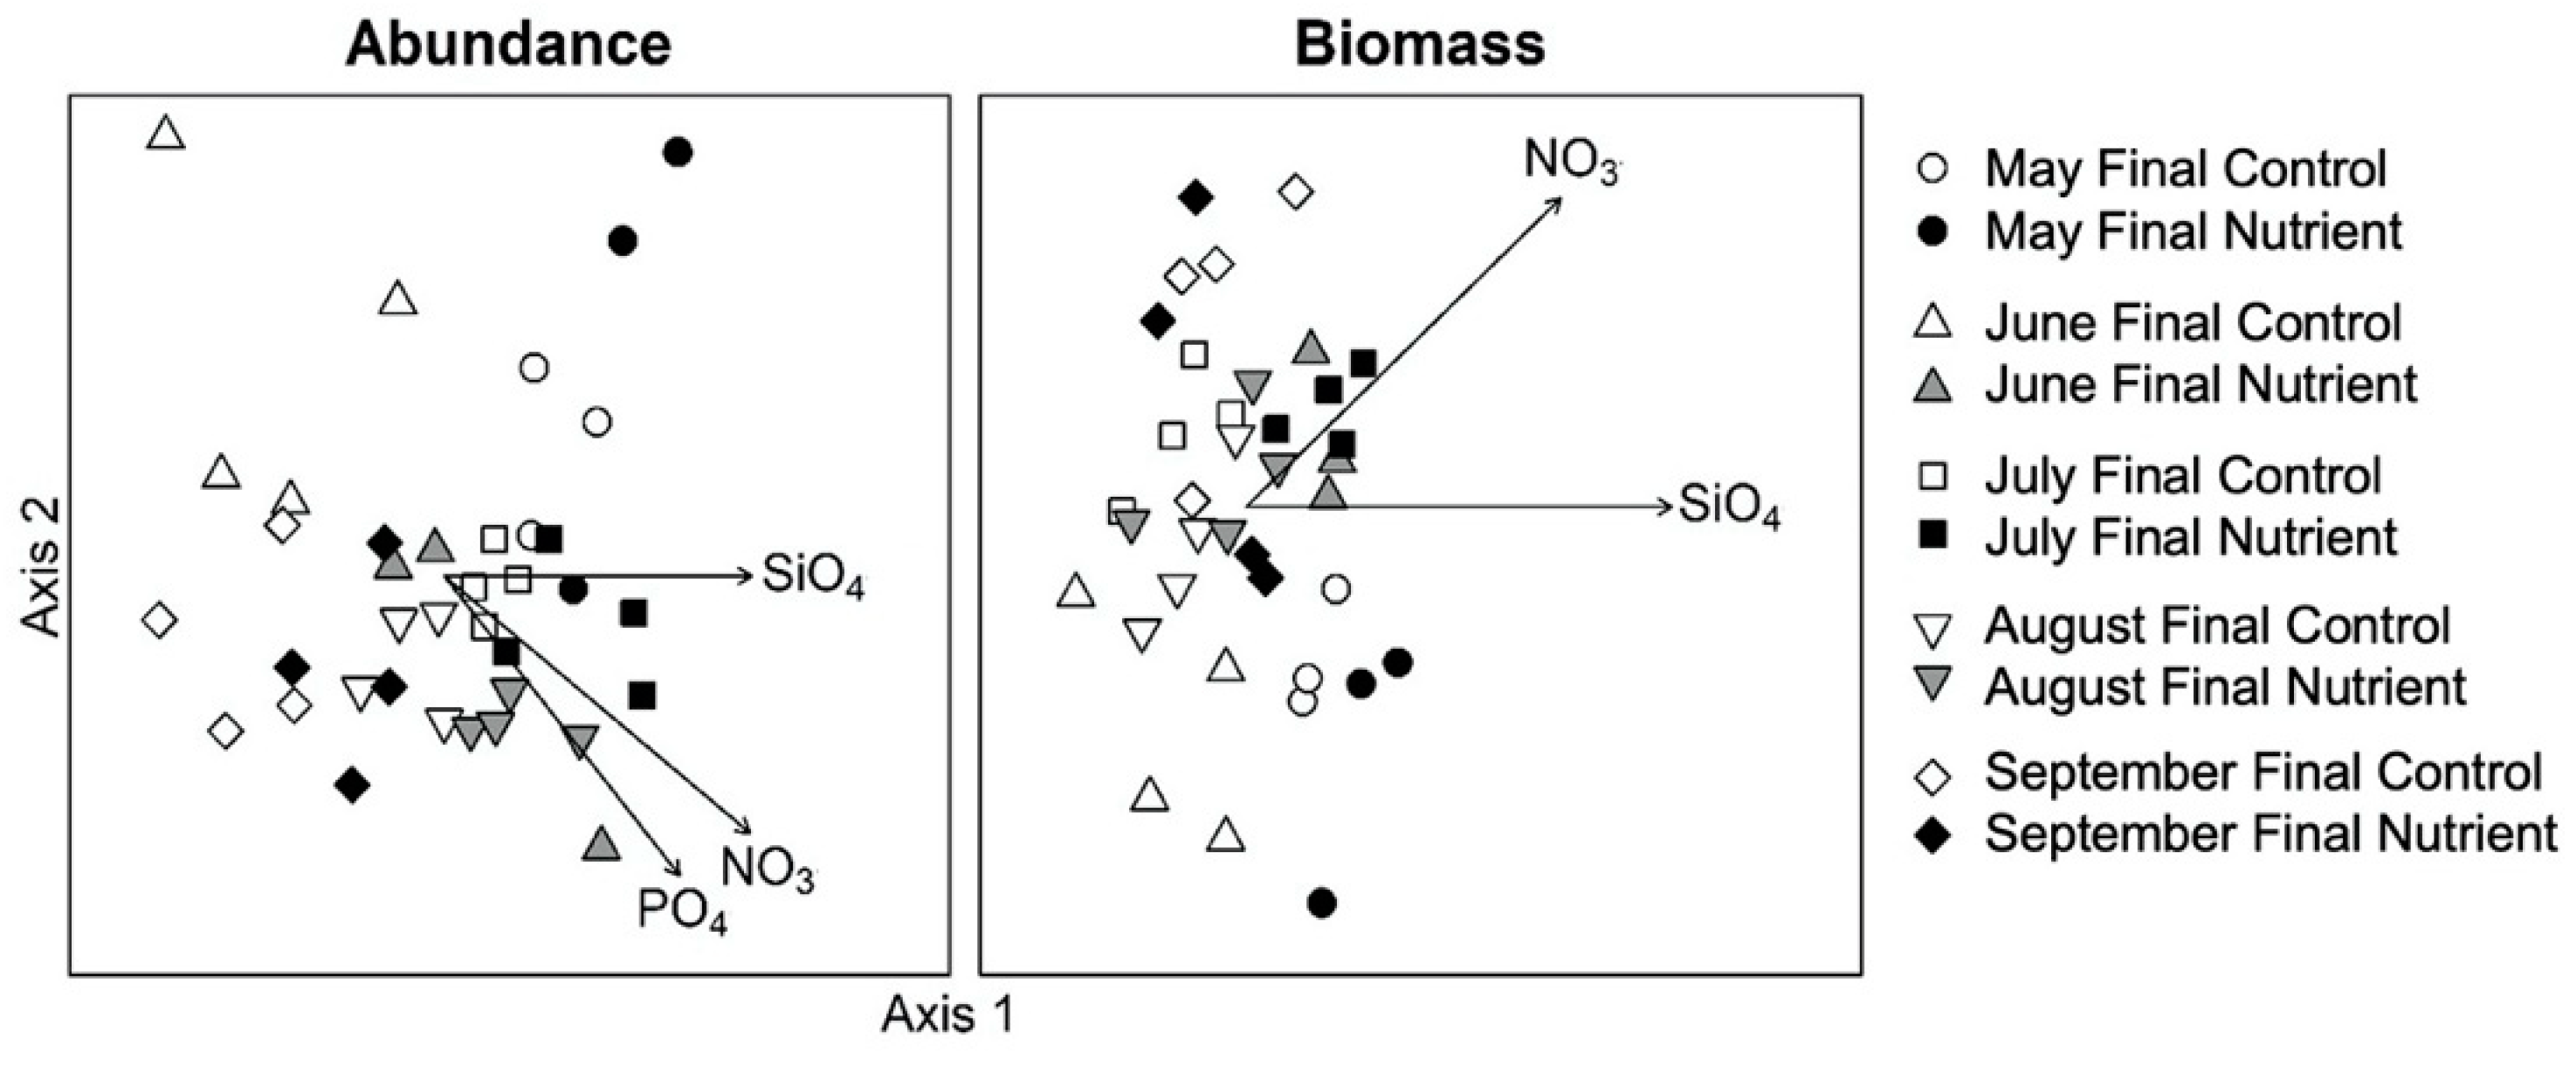
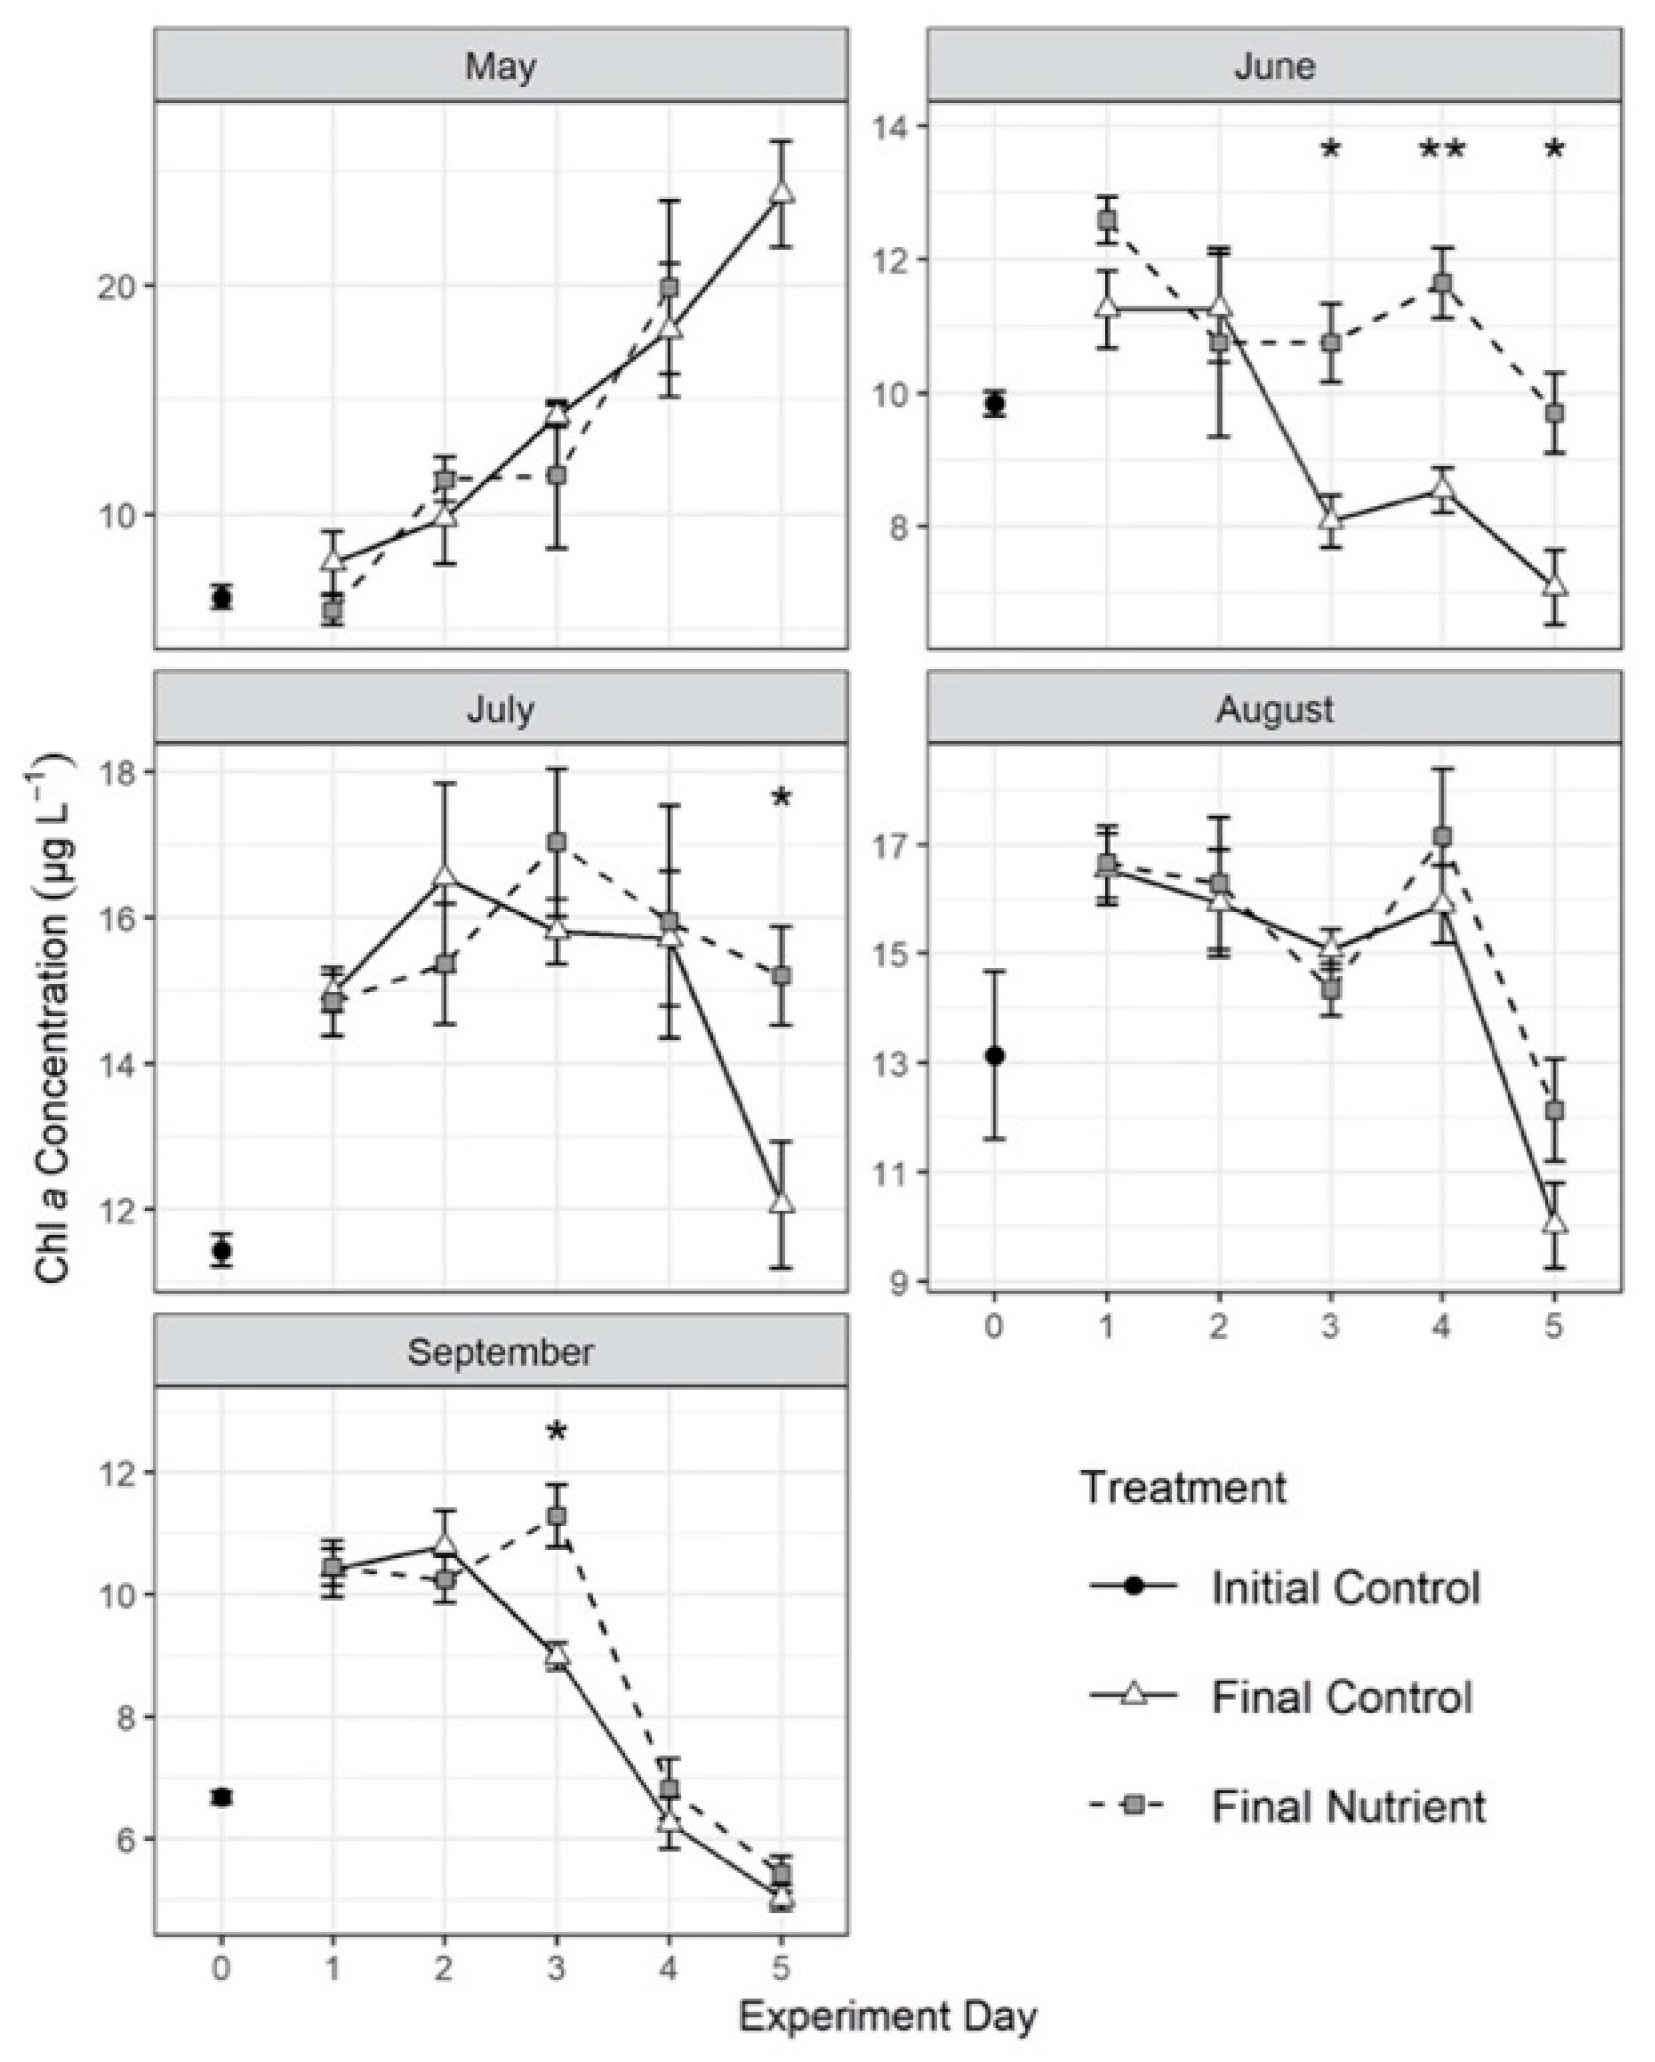
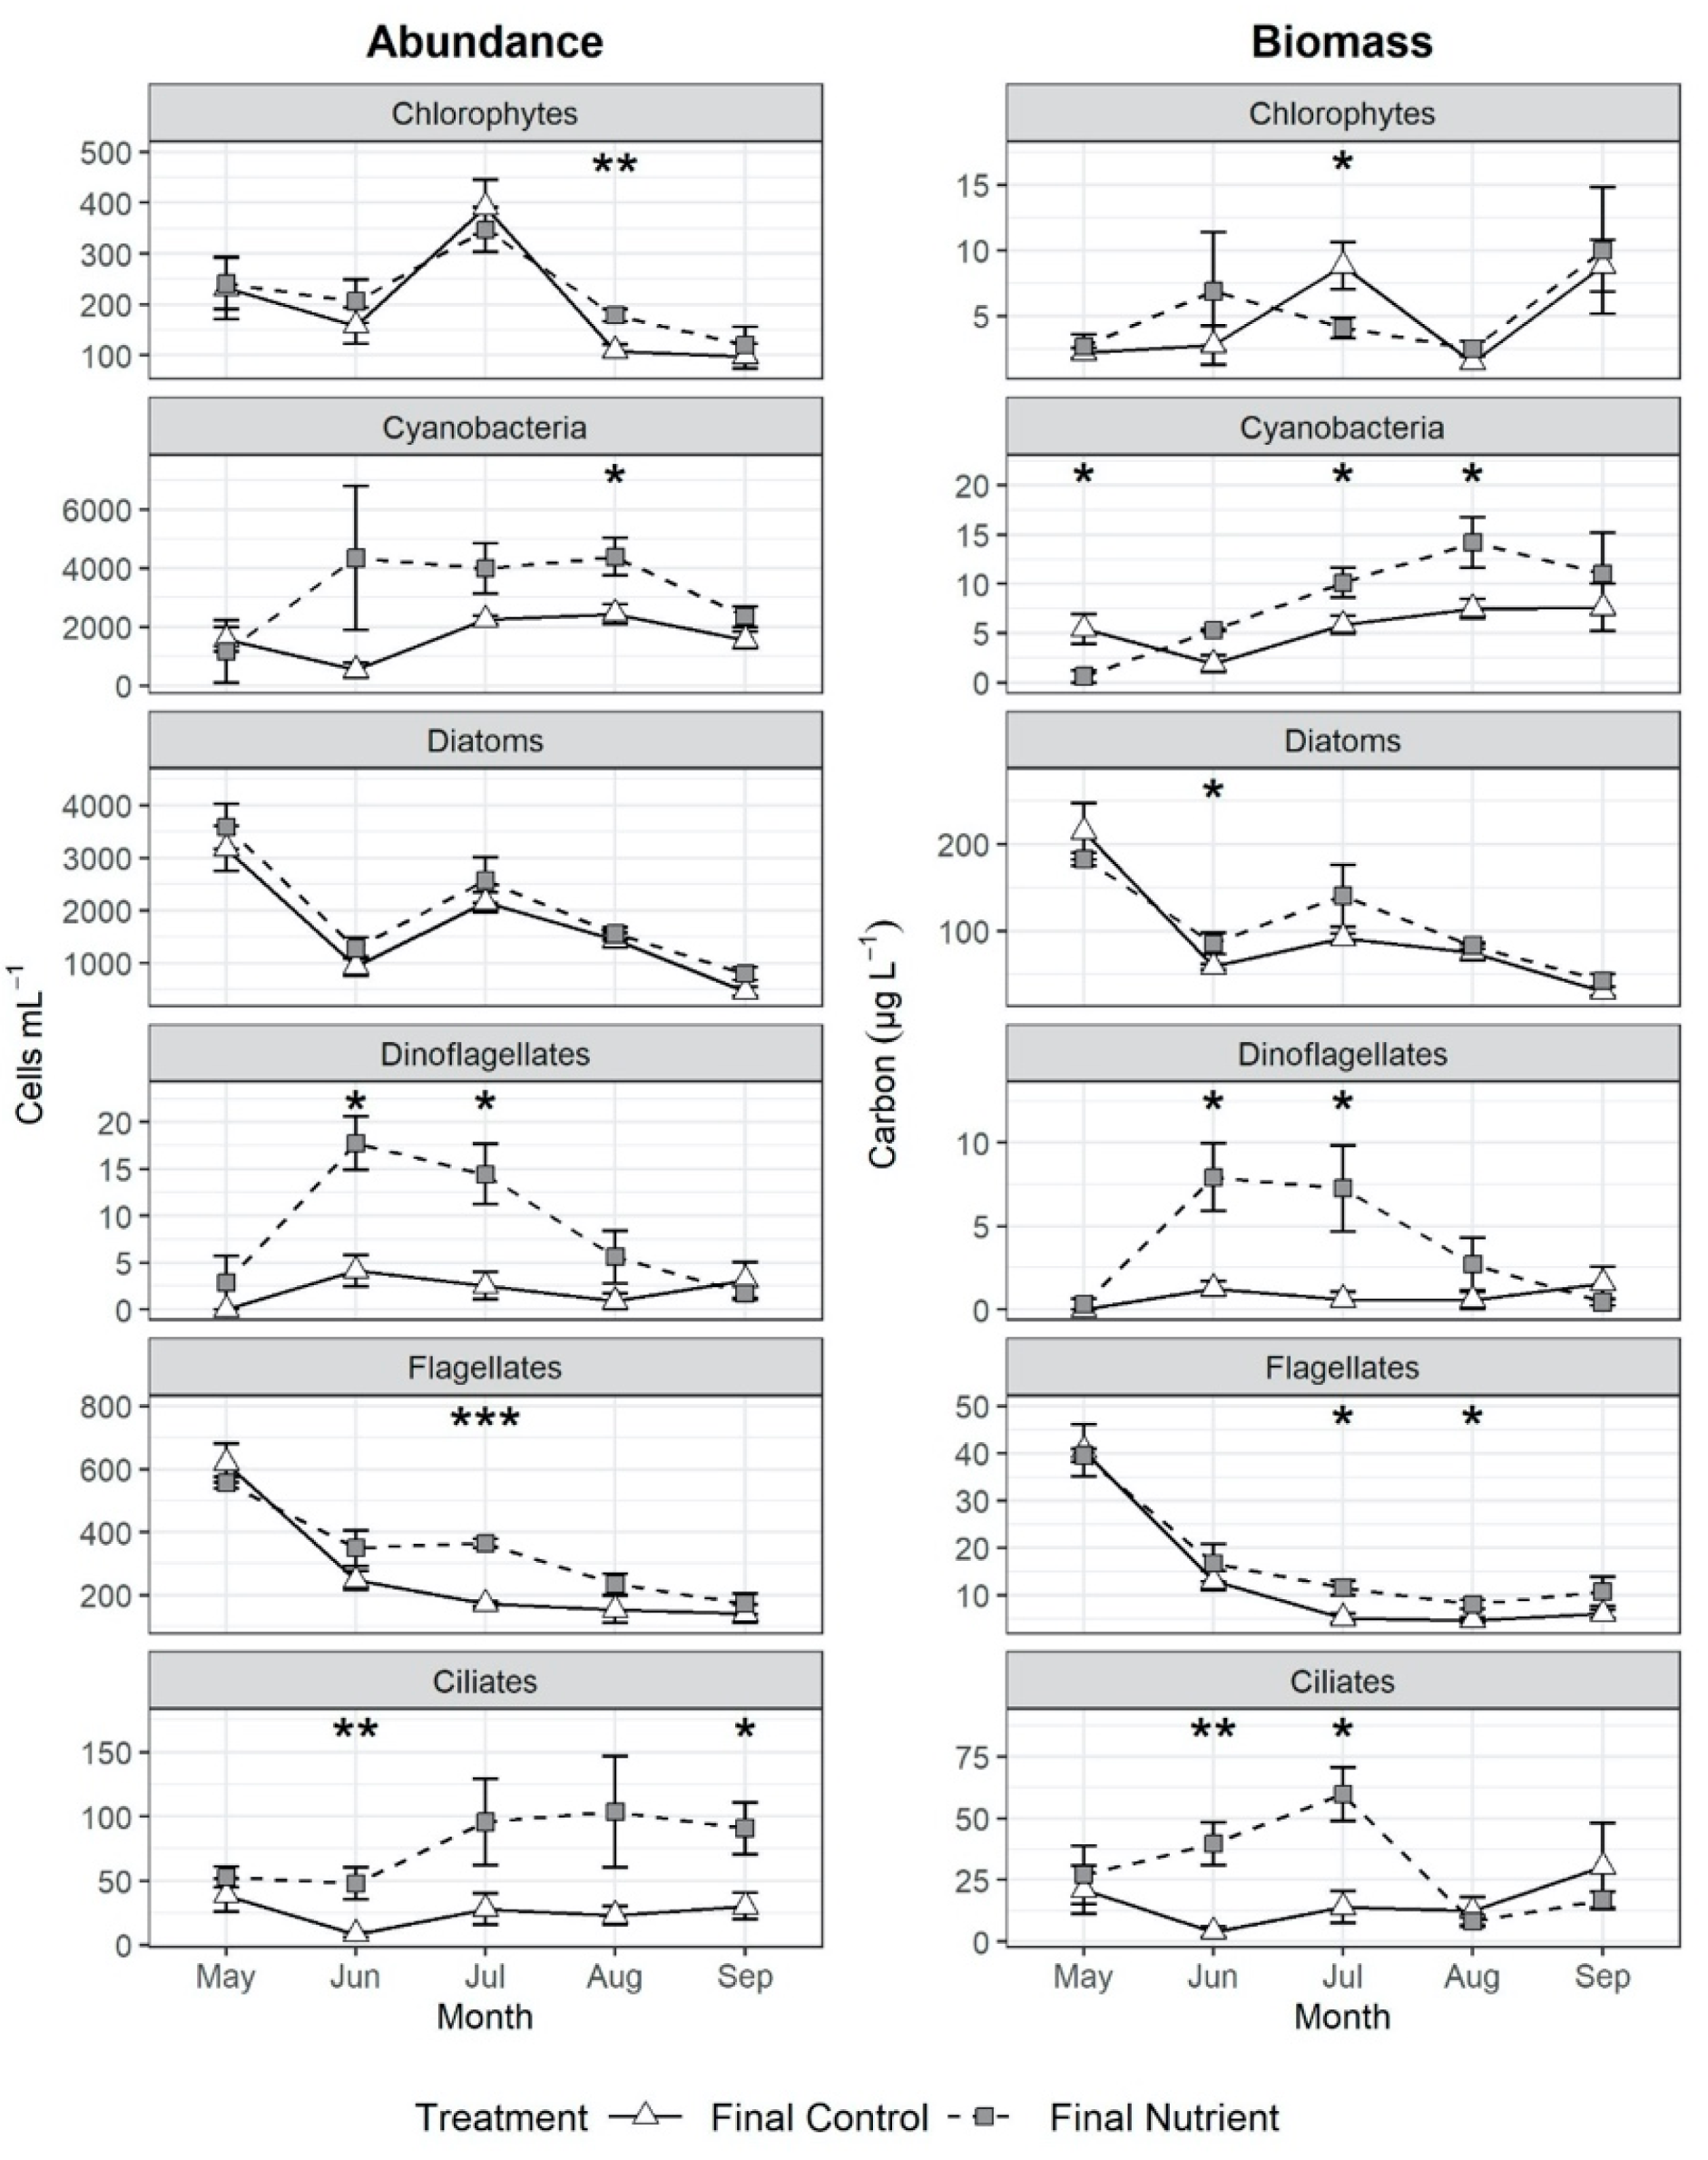
3.3. Effects of Nutrient Amendment on Chl a and Microplankton Assemblage Structure

We compared chl a concentrations between final control and final nutrient-amended samples for each day of the 5-day incubation experiments to evaluate the magnitude and timing of nutrient amendment effects on chl a. We observed significantly greater chl a in nutrient-amended samples collected on Days 3–5 of the June experiment, Day 5 of the July experiment and Day 3 of the September experiment (Figure 4; Table S1), providing evidence of nutrient limitation during these months. Nutrient amendment did not affect chl a concentrations during any day of the May and August experiments. While significant effects varied between days, all occurred at or after incubation Day 3, and in all of these cases chl a concentration was greater in the nutrient-amended treatment. Effect sizes (Hedge’s g) for each significant comparison were all greater than 0.8, indicating strong positive effects of the nutrient amendment treatment (Table S1).
Microplankton assemblage composition, evaluated as proportional abundance and proportional carbon biomass of taxonomic groups from samples collected on Day 5 of the incubation, varied visibly by month; however, treatment effects were less readily apparent (Figure 5). We only found statistically significant differences in abundance between final control and final nutrient-amended samples for a small set of taxa: dinoflagellates and ciliates in June, dinoflagellates and flagellates in July, chlorophytes and cyanobacteria in August, and ciliates in September (Figure 6; Table S2). In all of these cases, significantly greater abundances were observed in nutrient-amended samples, indicating nutrients were limiting the abundance of these taxa, and effect sizes were all strong (Hedge’s g > 0.8). When assessed using microplankton biomass, we found statistically significant differences between treatments for certain taxa in May (cyanobacteria), June (diatoms, dinoflagellates, ciliates), July (chlorophytes, cyanobacteria, dinoflagellates, flagellates, ciliates) and August (cyanobacteria, flagellates) (Figure 6). Effect sizes for significant biomass treatment differences were also all considered strong (Table S2). Notably, cyanobacteria biomass was higher in the May final control samples than in nutrient-amended samples, and chlorophyte biomass was likewise higher in July final control samples (Figure 6).
PERMANOVA results demonstrated significant effects of added nutrients on microplankton assemblage structure using the abundance dataset for the June (R2 = 0.482, F1,5 = 4.648, p = 0.023), July (R2 = 0.453, F1,6 = 4.96, p = 0.027) and August (R2 = 0.499, F1,6 = 5.974, p = 0.034) experiments, suggesting nutrient limitation; however, no significant assemblage structural differences were seen for the May and September experiments (Table 3). PERMANOVA analysis of the biomass assemblage dataset similarly showed significant treatment effects on assemblage structure for the June (R2 = 0.527, F1,5 = 5.579, p = 0.027) and July experiments (R2 = 0.573, F1,6 = 8.040, p = 0.033), and no effects during May and September, but unlike with abundance, no treatment effect was detected for the August experiment (Table 3).
NMDS ordinations of the Day 5 microplankton data resulted in two-dimensional solutions using the abundance (stress = 0.095; Z = −10.53, p = 0.001) and biomass datasets (stress = 0.190; Z = −3.13, p = 0.005) (Figure 7). Abundance-based microplankton assemblage structure was significantly correlated with PO4, SiO4 and NO3 concentrations (Table 4), and BIOENV revealed that the best subset of environmental variables included SiO4 and NO3 (r = 0.139). Biomass-based assemblage structure was significantly correlated with SiO4 and NO3, but was not significantly correlated with PO4, as was seen for abundance (Table 4). The best subset of explanatory variables for biomass-based assemblage structure as shown by BIOENV included only SiO4 (r = 0.228).

4. Discussion

4.1. Ambient Columbia River Nutrient Concentrations, Chl a and Microplankton Composition

The ambient nutrient concentrations that we observed in the lower Columbia River (CR), as measured using the Day 0 initial control samples, were within the range observed previously in the freshwater reaches of the lower CR [34,35,36,45] and were comparable to [29,30,75,76] or in some cases substantially lower than those observed in other large, temperate rivers in the midwestern USA [77,78,79].
Nutrient concentrations often vary seasonally within any given river, especially in temperate rivers, although the exact pattern depends on the specific nutrient of interest. Our results from the CR showed that all three nutrients (NO3, PO4 and SiO4) were at their highest concentrations during May, decreased somewhat during June, and were lowest from July–September. This pattern generally aligns with the seasonal variation of nutrients in other large, temperate rivers. For instance, NO3 concentrations in temperate rivers are often lowest during the summer [22,25,26,28], although Guo et al. [29] found no marked seasonality of NO3 in the somewhat higher latitude Yukon River, AK, USA. PO4 is also often lowest during the summer, but shows a less consistent pattern: PO4 was observed to decrease continuously from May to September in the Yukon River [29], St. Johns River, FL, USA [28] and the Ponjavica River, Serbia [22]; whereas, PO4 in the Neuse River, NC, USA was found to be greatest in summer [26]. SiO4 generally shows a somewhat different seasonal pattern than that of NO3 and PO4, being lower in spring and highest in late summer. For instance, in the Yukon River, SiO4 increased continuously from May to September [29] and in the Yangtze River, China, SiO4 was higher in the summer [30]. In the River Thames, UK, dissolved SiO4 is lowest around May and reaches a maximum in August–September [31]. This previous research indicates that, generally speaking, summer is when dissolved nutrients are least abundant in large, temperate rivers.
Interestingly, the monthly pattern of chl a concentration that we observed in our study of the lower CR was generally the opposite of the pattern of nutrient availability. Chl a concentrations were the lowest in May, and steadily increased to maxima in July and August, followed by a decline in September. This pattern is somewhat different than previous, long-term observations in the CR [36,41,42,80], which indicated that May generally had higher chl a concentrations than in the summer months. Nevertheless, our results indicate a two- to three-month lag between peak nutrient concentrations in late spring and subsequent peak chl a concentrations in early/mid-summer, possibly corresponding to nutrient drawdown by phytoplankton in summer.
With respect to the microplankton assemblage structure in the CR, our observations of late spring/early summer dominance by diatoms, with increasing proportional representation of cyanobacteria in late summer, is entirely consistent with previous long-term observations [36,80]. We related our observed monthly differences in microplankton assemblage structure, seen in terms of abundances and biomasses, to various environmental factors, and in both cases some combinations of N, P and Si concentrations were found to be significant correlates.
All of these field results suggest that insufficient nutrients in summer may be controlling the abundance, biomass and assemblage composition of phytoplankton in the CR. These types of correlative relationships in field data are not, of course, the same thing as causal relationships that can be discerned from controlled and replicated manipulation experiments (as described below).

4.2. Effects of Nutrient Amendment on Abundance, Biomass and Assemblage Structure

It has long been recognized that inorganic nutrients such as NO3, PO4 and SiO4 can regulate the abundance and biomass of phytoplankton [1,2,3,4,6], as well as the assemblage structure of phytoplankton [8,9,13,14]. In large temperate rivers, however, results are more mixed, with some findings supporting nutrient limitation [15,17,21,22,23], while other results have not supported nutrient limitation of phytoplankton abundance, biomass and assemblage composition [19,20].
Our results strongly suggest the occurrence of nutrient limitation on phytoplankton abundance and biomass, as well as on microplankton assemblage structure, at our sampling site in the lower CR, but only during summer months. However, the results of our nutrient amendment experiments varied by month, depending on which metric is considered to be indicative of an experimental effect. For instance, when considering the simplest metric of chl a concentration, our experiments yielded significant positive effects of nutrient amendment in only June, July and September. Similarly, we observed no effect of added nutrients on the abundance or biomass of any microplankton taxa groups in May, but did observe significant positive effects on the abundance or biomass of at least two microplankton taxa groups in each month from June to September. (Surprisingly, we had two instances of significant negative effects of nutrients on biomass: cyanobacteria in May and chlorophytes in July).
The taxon-specific responses of microplankton to nutrient amendments that we observed are both interesting and difficult to interpret. For instance, cyanobacteria, dinoflagellates, flagellates and ciliates showed more frequent positive responses to nutrient amendment than did chlorophytes and diatoms. Likewise, the magnitude of the response (i.e., the absolute difference in abundance between nutrient-amended treatments and controls) often varied between taxa, with cyanobacteria, dinoflagellates and ciliates generally showing larger responses than did chlorophytes, diatoms and flagellates. These taxon-specific responses to nutrient amendments were likely confounded to some degree by trophic cascades occurring among the microplankton within our experimental containers [81,82,83]. For instance, our observed increases in ciliates likely occurred because these larger heterotrophs consumed smaller phototrophs (e.g., chlorophytes, diatoms), who in turn would have shown a muted numerical response to nutrient amendments because of grazing mortality caused by their ciliate predators. We therefore advise caution in interpreting the absolute magnitude of any taxon-specific response to nutrient amendment when incubating whole assemblages of microplankton.
Finally, when considering the effects of nutrient amendment on microplankton assemblage structure, PERMANOVA indicated significant differences between Day 5 treatments and Day 5 controls in terms of both abundance (June, July and August) and biomass (June and July). Moreover, NMDS ordinations and subsequent BIOENV analyses of the Day 5 microplankton abundance and biomass datasets found microplankton assemblage structure was significantly correlated with some combination of N, P and Si. Overall, our experimental results indicate large monthly variation in the effects of nutrient amendment on abundance, biomass and composition of microplankton, but these effects are most consistent during summer (June–August).
Prior studies conducted in the CR have shown a late spring/early summer (April–June) diatom bloom [34], followed by summer/early autumn (May–October) minima in both NO3 and PO4 [34,35]. Rose et al. [36] found microplankton assemblage structure in the CR to be only weakly associated with nutrients (NO3, PO4 and SiO4), but was more strongly associated with temperature, discharge and zooplankton grazers (including and especially two invasive species—the Asian copepod Pseudodiaptomus forbesi [42,84] and early juveniles of the Asian clam Corbicula fluminea [85,86,87,88]).
The results of these previous field studies in the CR are consistent with our findings that ambient concentrations of NO3, PO4 and SiO4 were at their peak during May and lowest during July, August and September, and also lend support to our observations of nutrient control of phytoplankton biomass, abundance and assemblage composition occurring during those months of lowest ambient nutrient availability. Our results are crucially different from previous field studies, however, in that we provide the first experimental evidence of nutrient limitation of phytoplankton in the lower CR.
Which individual nutrients are driving the patterns of nutrient limitation in lower CR phytoplankton that we observed in this study? Although we did not experimentally manipulate individual nutrients separately, the results of our statistical analyses suggest possible independent roles for PO4, SiO4, NO2 and NO3. Specifically, monthly differences in the ambient abundances of the microplankton assemblage were significantly associated with PO4 and SiO4, and monthly differences in ambient microplankton assemblage biomass were significantly associated with PO4 and NO2. Similarly, experimental nutrient amendment effects on abundances were significantly associated with SiO4 and NO3 (PO4 was also significant, but not in the best model), and experimental effects on biomasses were associated with SiO4 (NO3 was also significant, but not in the best model). However, exactly which one (or more) specific nutrient constituents was responsible for our observed effects on lower CR phytoplankton was not discernable from our experiments. Previous studies of nutrient limitation of phytoplankton in other river systems suggest possible roles for each of these individual nutrients, including NO3 [18,22], PO4 [17,28] and SiO4 [23], as well as their ratios [1,89]. Thus, we strongly recommend that future experimental studies of nutrient limitation of phytoplankton in the CR focus on the role of each of these nutrients individually.
A cautionary note on possible “bottle effects” during our experiments is in order. In the broadest terms, Schindler [90] makes the point that “short-term experimental additions of nutrients to bottles … fail to account for the gradual changes in biogeochemical nutrient cycles and nutrient fluxes from sediments, and succession of communities that are important components of whole-ecosystem responses”, and thus, small-scale, short-term incubation experiments such as ours can never fully capture the complexity of natural aquatic ecosystems. More specifically, the size of bottles used in our incubation experiments is of interest here. For instance, although Weisse et al. [91] recently found that bottles as small as 100 mL may not impose significant effects on planktonic interactions, bottles of our size (500 mL) nevertheless possess considerable surface area relative to volume (i.e., potential “edge effects”) and perhaps other artifacts (e.g., unnatural mixing). Thus, the extrapolation of our laboratory incubation results to nature should be done with caution.
A second caveat concerns the duration of our laboratory incubation experiments. Although 5-day (or longer) incubation periods are not uncommon for such experiments (e.g., [16,17,92,93,94]), this length of time is comparable to, or in some cases even longer than, the transport time between our site in the lower CR (river kilometer 171) and the coastal ocean, which ranged from 2.0–6.5 days based on flow rates measured near our sampling station from May–September 2018 (https://nwis.waterdata.usgs.gov, accessed on 1 February 2022). That is, while our incubation bottles were not allowed to exchange water and nutrients with their surrounding environment, the same is not true for a highly advective system such as the lower Columbia River. Again, the extrapolation of our experimental laboratory results to nature should be done with caution.

5. Conclusions

In summary, we found considerable (if not always consistent) evidence—in both our field observations and our experimental results—of summertime nutrient control of phytoplankton abundance, biomass and assemblage composition in the lower CR at Vancouver, WA, USA. However, considerable monthly variation was observed, depending on the specific metric used to discern a statistically significant effect of nutrient limitation. Future work should include experimentally testing for the effects of individual nutrients (e.g., NO3, SiO4, PO4) on phytoplankton, versus the effects of these nutrients combined (as was done in this study). Our findings are generally in agreement with previous studies in other temperate river systems, but this is the first study to experimentally test for the effects of summertime nutrient limitation on phytoplankton in the lower CR.
Finally, with increasing eutrophication in the CR watershed [95,96], our experimental results indicate that changes in nutrient availability during summer months might have substantial impacts on primary productivity and food web dynamics in the river. This is especially important, since summer is the season when zooplankton [41,42,97] and out-migrating juvenile salmon [98,99]—a species of particular special concern in this region—typically reach peak abundances.

Supplementary Materials

The following supporting information can be downloaded at: https://www.mdpi.com/article/10.3390/w14101599/s1, Table S1: Results of hypothesis tests for differences in mean chl a between final control and final nutrient-amended samples; Table S2: Results of hypothesis tests for differences in abundance and biomass between Day 5 final control and final nutrient-amended samples for each month.

Author Contributions

Conceptualization, G.R.-B. and S.M.B.; methodology, K.A.C., J.Z. and A.C.; formal analysis, G.R.-B., K.A.C. and S.M.B.; investigation, J.Z. and A.C.; resources, G.R.-B. and S.M.B.; data curation, K.A.C., J.Z. and A.C.; writing—original draft preparation, G.R.-B., K.A.C. and S.M.B.; writing—review and editing, G.R.-B., K.A.C., S.M.B., J.Z. and A.C.; visualization, K.A.C., J.Z. and A.C.; funding acquisition, G.R.-B. and S.M.B. All authors have read and agreed to the published version of the manuscript.

Funding

This research was funded in part by a “Partners in Science” grant from the Murdock Charitable Trust (award #: 2016337:JAT).

Data Availability Statement

Data presented in the publication are available upon request to the corresponding author.

Acknowledgments

We thank Hanna Badger, Ben Bolam, Eric Dexter, Zach Groves, Summer Henriksen, Sean Nolan, Marcus Penza, Salvador Robb-Chavez, Vanessa Rose and Katie Sweeney for assistance in the field and laboratory.

Conflicts of Interest

The authors declare no conflict of interest.

References

  1. Elser, J.J.; Bracken, M.E.S.; Cleland, E.E.; Gruner, D.S.; Harpole, W.S.; Hillebrand, H.; Ngai, J.T.; Seabloom, E.W.; Shurin, J.B.; Smith, J.E. Global Analysis of Nitrogen and Phosphorus Limitation of Primary Producers in Freshwater, Marine and Terrestrial Ecosystems. Ecol. Lett. 2007, 10, 1135–1142. [Google Scholar] [CrossRef] [PubMed] [Green Version]
  2. Hecky, R.E.; Kilham, P. Nutrient Limitation of Phytoplankton in Freshwater and Marine Environments: A Review of Recent Evidence on the Effects of Enrichment. Limnol. Oceanogr. 1988, 33, 796–822. [Google Scholar] [CrossRef] [Green Version]
  3. Schindler, D.W. Evolution of Phosphorus Limitation in Lakes. Science 1977, 195, 260–262. [Google Scholar] [CrossRef] [PubMed] [Green Version]
  4. Vitousek, P.M.; Howarth, R.W. Nitrogen Limitation on Land and in the Sea: How Can It Occur? Biogeochemistry 1991, 13, 87–115. [Google Scholar] [CrossRef]
  5. Falkowski, P.G. Biogeochemical Controls and Feedbacks on Ocean Primary Production. Science 1998, 281, 200–206. [Google Scholar] [CrossRef] [PubMed] [Green Version]
  6. Ryther, J.H.; Dunstan, W.M. Nitrogen, Phosphorus, and Eutrophication in the Coastal Marine Environment. Science 1971, 171, 1008–1013. [Google Scholar] [CrossRef] [PubMed] [Green Version]
  7. Tyrrell, T. The Relative Influences of Nitrogen and Phosphorus on Oceanic Primary Production. Nature 1999, 400, 525–531. [Google Scholar] [CrossRef]
  8. Egge, J.; Aksnes, D. Silicate as Regulating Nutrient in Phytoplankton Competition. Mar. Ecol. Progr. Ser. 1992, 83, 281–289. [Google Scholar] [CrossRef]
  9. Eppley, R.W.; Rogers, J.N.; McCarthy, J.J. Half-Saturation Constants for Uptake of Nitrate and Ammonium by Marine Phytoplankton. Limnol. Oceanogr. 1969, 14, 912–920. [Google Scholar] [CrossRef]
  10. Jensen, J.P.; Jeppesen, E.; Olrik, K.; Kristensen, P. Impact of Nutrients and Physical Factors on the Shift from Cyanobacterial to Chlorophyte Dominance in Shallow Danish Lakes. Can. J. Fish. Aquat. Sci. 1994, 51, 1692–1699. [Google Scholar] [CrossRef]
  11. Officer, C.; Ryther, J. The Possible Importance of Silicon in Marine Eutrophication. Mar. Ecol. Progr. Ser. 1980, 3, 83–91. [Google Scholar] [CrossRef]
  12. Smith, V.H. Low Nitrogen to Phosphorus Ratios Favor Dominance by Blue-Green Algae in Lake Phytoplankton. Science 1983, 221, 669–671. [Google Scholar] [CrossRef] [PubMed] [Green Version]
  13. Sommer, U.; Gliwicz, Z.M.; Lampert, W.; Duncan, A. The PEG-Model of Seasonal Succession of Planktonic Events in Fresh Waters. Arch. Hydrobiol. 1986, 106, 433–471. [Google Scholar]
  14. Tilman, D.; Kilham, S.S.; Kilham, P. Phytoplankton Community Ecology: The Role of Limiting Nutrients. Ann. Rev. Ecol. Syst. 1982, 13, 349–372. [Google Scholar] [CrossRef]
  15. Cira, E.K.; Paerl, H.W.; Wetz, M.S. Effects of Nitrogen Availability and Form on Phytoplankton Growth in a Eutrophied Estuary (Neuse River Estuary, NC, USA). PLoS ONE 2016, 11, e0160663. [Google Scholar] [CrossRef]
  16. Baker, P.D.; Brookes, J.D.; Burch, M.D.; Maier, H.R.; Ganf, G.G. Advection, Growth and Nutrient Status of Phytoplankton Populations in the Lower River Murray, South Australia. Regul. Rivers Res. Manag. 2000, 16, 327–344. [Google Scholar] [CrossRef]
  17. Nwankwegu, A.S.; Li, Y.; Huang, Y.; Wei, J.; Norgbey, E.; Lai, Q.; Sarpong, L.; Wang, K.; Ji, D.; Yang, Z.; et al. Nutrient Addition Bioassay and Phytoplankton Community Structure Monitored during Autumn in Xiangxi Bay of Three Gorges Reservoir, China. Chemosphere 2020, 247, 125960. [Google Scholar] [CrossRef]
  18. Dodds, W.; Smith, V. Nitrogen, Phosphorus, and Eutrophication in Streams. Inland Waters 2016, 6, 155–164. [Google Scholar] [CrossRef]
  19. Desortová, B.; Punčochář, P. Variability of Phytoplankton Biomass in a Lowland River: Response to Climate Conditions. Limnologica 2011, 41, 160–166. [Google Scholar] [CrossRef] [Green Version]
  20. Hardenbicker, P.; Rolinski, S.; Weitere, M.; Fischer, H. Contrasting Long-Term Trends and Shifts in Phytoplankton Dynamics in Two Large Rivers: Long-Term Phytoplankton Dynamics. Int. Rev. Hydrobiol. 2014, 99, 287–299. [Google Scholar] [CrossRef]
  21. Friedrich, G.; Pohlmann, M. Long-Term Plankton Studies at the Lower Rhine/Germany. Limnologica 2009, 39, 14–39. [Google Scholar] [CrossRef] [Green Version]
  22. Karadžić, V.; Simić, G.S.; Natić, D.; Ržaničanin, A.; Ćirić, M.; Gačić, Z. Changes in the Phytoplankton Community and Dominance of Cylindrospermopsis raciborskii (Wolosz.) Subba Raju in a Temperate Lowland River (Ponjavica, Serbia). Hydrobiologia 2013, 711, 43–60. [Google Scholar] [CrossRef]
  23. Wang, C.; Li, X.; Wang, X.; Wu, N.; Yang, W.; Lai, Z.; Lek, S. Spatio-Temporal Patterns and Predictions of Phytoplankton Assemblages in a Subtropical River Delta System. Fundam. Appl. Limnol. 2016, 187, 335–349. [Google Scholar] [CrossRef]
  24. Peterson, C.G.; Stevenson, R.J. Seasonality in River Phytoplankton: Multivariate Analyses of Data from the Ohio River and Six Kentucky Tributaries. Hydrobiologia 1989, 182, 99–114. [Google Scholar] [CrossRef]
  25. Scott, D.; Harvey, J.; Alexander, R.; Schwarz, G. Dominance of Organic Nitrogen from Headwater Streams to Large Rivers across the Conterminous United States: Organic Nitrogen in U.S. Rivers. Glob. Biogeochem. Cycles 2007, 21, GB1003. [Google Scholar] [CrossRef] [Green Version]
  26. Gaulke, A.K.; Wetz, M.S.; Paerl, H.W. Picophytoplankton: A Major Contributor to Planktonic Biomass and Primary Production in a Eutrophic, River-Dominated Estuary. Estuar. Coast. Shelf Sci. 2010, 90, 45–54. [Google Scholar] [CrossRef]
  27. Tavernini, S.; Pierobon, E.; Viaroli, P. Physical Factors and Dissolved Reactive Silica Affect Phytoplankton Community Structure and Dynamics in a Lowland Eutrophic River (Po River, Italy). Hydrobiologia 2011, 669, 213–225. [Google Scholar] [CrossRef]
  28. Wang, J.; Zhang, Z. Phytoplankton, Dissolved Oxygen and Nutrient Patterns along a Eutrophic River-Estuary Continuum: Observation and Modeling. J. Environ. Manag. 2020, 261, 110233. [Google Scholar] [CrossRef]
  29. Guo, L.; Zhang, J.-Z.; Guéguen, C. Speciation and Fluxes of Nutrients (N, P, Si) from the Upper Yukon River. Glob. Biogeochem. Cycles 2004, 18, GB1038. [Google Scholar] [CrossRef]
  30. Li, M.; Xu, K.; Watanabe, M.; Chen, Z. Long-Term Variations in Dissolved Silicate, Nitrogen, and Phosphorus Flux from the Yangtze River into the East China Sea and Impacts on Estuarine Ecosystem. Estuar. Coast. Shelf Sci. 2007, 71, 3–12. [Google Scholar] [CrossRef]
  31. Bowes, M.J.; Loewenthal, M.; Read, D.S.; Hutchins, M.G.; Prudhomme, C.; Armstrong, L.K.; Harman, S.A.; Wickham, H.D.; Gozzard, E.; Carvalho, L. Identifying Multiple Stressor Controls on Phytoplankton Dynamics in the River Thames (UK) Using High-Frequency Water Quality Data. Sci. Total Environ. 2016, 569–570, 1489–1499. [Google Scholar] [CrossRef] [PubMed] [Green Version]
  32. Triplett, L.D.; Engstrom, D.R.; Conley, D.J.; Schellhaass, S.M. Silica Fluxes and Trapping in Two Contrasting Natural Impoundments of the Upper Mississippi River. Biogeochemistry 2008, 87, 217–230. [Google Scholar] [CrossRef]
  33. Hartmann, J.; Levy, J.; Kempe, S. Increasing Dissolved Silica Trends in the Rhine River: An Effect of Recovery from High P Loads? Limnology 2011, 12, 63–73. [Google Scholar] [CrossRef]
  34. Sullivan, B.E.; Prahl, F.G.; Small, L.F.; Covert, P.A. Seasonality of Phytoplankton Production in the Columbia River: A Natural or Anthropogenic Pattern? Geochim. Cosmochim. Acta 2001, 65, 1125–1139. [Google Scholar] [CrossRef]
  35. Maier, M.A.; Peterson, T.D. Prevalence of Chytrid Parasitism among Diatom Populations in the Lower Columbia River (2009–2013). Freshw. Biol. 2017, 62, 414–428. [Google Scholar] [CrossRef]
  36. Rose, V.; Rollwagen-Bollens, G.; Bollens, S.; Zimmerman, J. Seasonal and Interannual Variation in Lower Columbia River Phytoplankton (2005–2018): Environmental Variability and a Decline in Large Bloom-Forming Diatoms. Aquat. Microb. Ecol. 2021, 87, 29–46. [Google Scholar] [CrossRef]
  37. Simenstad, C.A.; Small, L.F.; David McIntire, C.; Jay, D.A.; Sherwood, C. Columbia River Estuary Studies: An Introduction to the Estuary, a Brief History, and Prior Studies. Progr. Oceanogr. 1990, 25, 1–13. [Google Scholar] [CrossRef]
  38. Payne, J.T.; Wood, A.W.; Hamlet, A.F.; Palmer, R.N.; Lettenmaier, D.P. Mitigating the Effects of Climate Change on the Water Resources of the Columbia River Basin. Clim. Chang. 2004, 62, 233–256. [Google Scholar] [CrossRef]
  39. Chawla, A.; Jay, D.A.; Baptista, A.M.; Wilkin, M.; Seaton, C. Seasonal Variability and Estuary–Shelf Interactions in Circulation Dynamics of a River-Dominated Estuary. Estuaries Coasts 2008, 31, 269–288. [Google Scholar] [CrossRef] [Green Version]
  40. Jay, D.A.; Leffler, K.; Diefenderfer, H.L.; Borde, A.B. Tidal-Fluvial and Estuarine Processes in the Lower Columbia River: I. Along-Channel Water Level Variations, Pacific Ocean to Bonneville Dam. Estuaries Coasts 2015, 38, 415–433. [Google Scholar] [CrossRef]
  41. Dexter, E.; Katz, S.L.; Bollens, S.M.; Rollwagen-Bollens, G.; Hampton, S.E. Modeling the Trophic Impacts of Invasive Zooplankton in a Highly Invaded River. PLoS ONE 2020, 15, e0243002. [Google Scholar] [CrossRef] [PubMed]
  42. Dexter, E.; Bollens, S.M.; Rollwagen-Bollens, G.; Emerson, J.; Zimmerman, J. Persistent vs. Ephemeral Invasions: 8.5 Years of Zooplankton Community Dynamics in the Columbia River. Limnol. Oceanogr. 2015, 60, 527–539. [Google Scholar] [CrossRef]
  43. Bestion, E.; García-Carreras, B.; Schaum, C.-E.; Pawar, S.; Yvon-Durocher, G. Metabolic Traits Predict the Effects of Warming on Phytoplankton Competition. Ecol. Lett. 2018, 21, 655–664. [Google Scholar] [CrossRef] [PubMed] [Green Version]
  44. Kilham, S.S.; Kreeger, D.A.; Lynn, S.G.; Goulden, C.E.; Herrera, L. COMBO: A Defined Freshwater Culture Medium for Algae and Zooplankton. Hydrobiologia 1998, 377, 147–159. [Google Scholar] [CrossRef]
  45. Prahl, F.G.; Small, L.F.; Sullivan, B.A.; Cordell, J.; Simenstad, C.A.; Crump, B.C.; Baross, J.A. Biogeochemical Gradients in the Lower Columbia River. Hydrobiologia 1998, 361, 37–52. [Google Scholar] [CrossRef]
  46. Moss, B. Ecology of Fresh Waters: Man and Medium, Past to Future, 3rd ed.; Blackwell Publishing: Malden, MA, USA, 1998; ISBN 978-0-632-03512-0. [Google Scholar]
  47. Wetzel, R.G. Limnology, 2nd ed.; Saunders College Publishing: Philadelphia, PA, USA, 1983; ISBN 978-0-03-033016-2. [Google Scholar]
  48. Kalff, J. Limnology: Inland Water Ecosystems, 2nd ed.; Prentice Hall Publishers: Hoboken, NJ, USA, 2001; ISBN 978-0-13-033775-7. [Google Scholar]
  49. Armengol, J. Sau Reservoir’s Light Climate: Relationships between Secchi Depth and Light Extinction Coefficient. Limnetica 2003, 22, 195–210. [Google Scholar] [CrossRef]
  50. Gordon, L.I.; Jennings, J.C.; Ross, A.A.; Krest, J.M. A Suggested Protocol for Continuous Flow Automated Analysis of Seawater Nutrients (Phosphate, Nitrate, Nitrite and Silicic Acid) in the WOCE Hydrographic Program and the Joint Global Ocean Fluxes Study; WOCE Hydrographic Program Office: Southampton, UK, 1993; p. 56. [Google Scholar]
  51. Arar, E.J.; Collins, G. In Vitro Determination of Chlorophyll a and Pheophytin a in Marine and Freshwater Algae by Fluorescence; US Environmental Protection Agency: Cincinnati, OH, USA, 1997; p. 22.
  52. Utermöhl, H. Zur Vervollkommnung der quantitativen Phytoplankton-Methodik: Mit 1 Tabelle und 15 abbildungen im Text und auf 1 Tafel. SIL Commun. 1958, 9, 1–38. [Google Scholar] [CrossRef]
  53. Kirchman, D. Statistical Analysis of Direct Counts of Microbial Abundance. In Handbook of Methods in Aquatic Microbial Ecology; Lewis Publishers: Boca Raton, FL, USA, 1993; ISBN 978-0-87371-564-5. [Google Scholar]
  54. Patterson, D.J.; Hedley, S. Free-Living Freshwater Protozoa: A Colour Guide; Wolfe Publishing: Prescott, AZ, USA, 1992; ISBN 978-0-7234-1683-8. [Google Scholar]
  55. Wehr, J.D.; Sheath, R.G.; Kociolek, J.P. Freshwater Algae of North America: Ecology and Classification, 2nd ed.; Academic Press: Amsterdam, The Netherlands; Boston, MA, USA, 2015; ISBN 978-0-12-385876-4. [Google Scholar]
  56. Hillebrand, H.; Dürselen, C.-D.; Kirschtel, D.; Pollingher, U.; Zohary, T. Biovolume Calculation for Pelagic and Benthic Microalgae. J. Phycol. 1999, 35, 403–424. [Google Scholar] [CrossRef]
  57. Menden-Deuer, S.; Lessard, E.J. Carbon to Volume Relationships for Dinoflagellates, Diatoms, and Other Protist Plankton. Limnol. Oceanogr. 2000, 45, 569–579. [Google Scholar] [CrossRef] [Green Version]
  58. Zar, J.H. Biostatistical Analysis, 5th ed.; Pearson Prentice Hall: Upper Saddle River, NJ, USA, 2010. [Google Scholar]
  59. Dunn, O.J. Multiple Comparisons Using Rank Sums. Technometrics 1964, 6, 241–252. [Google Scholar] [CrossRef]
  60. Holm, S. A Simple Sequentially Rejective Multiple Test Procedure. Scand. J. Statist. 1979, 6, 65–70. [Google Scholar]
  61. R Core Team. R: A Language and Environment for Statistical Computing; R Foundation for Statistical Computing: Vienna, Austria, 2018. [Google Scholar]
  62. Ogle, D.; Doll, J.; Wheeler, P.; Dinno, A. FSA: Fisheries Stock Analysis. 2020. Available online: https://cloud.r-project.org/web/packages/FSA/index.html (accessed on 1 May 2020).
  63. Bray, J.R.; Curtis, J.T. An Ordination of the Upland Forest Communities of Southern Wisconsin. Ecol. Monogr. 1957, 27, 326–349. [Google Scholar] [CrossRef]
  64. Anderson, M.J. A New Method for Non-Parametric Multivariate Analysis of Variance. Austral Ecol. 2001, 26, 32–46. [Google Scholar]
  65. Herv, M. RVAideMemoire: Testing and Plotting Procedures for Biostatistics. 2019. Available online: https://cran.r-project.org/web/packages/RVAideMemoire/index.html (accessed on 9 April 2022).
  66. Kruskal, J.B. Multidimensional Scaling by Optimizing Goodness of Fit to a Nonmetric Hypothesis. Psychometrika 1964, 29, 1–27. [Google Scholar] [CrossRef]
  67. Clarke, K.R. Non-Parametric Multivariate Analyses of Changes in Community Structure. Aust. J. Ecol. 1993, 18, 117–143. [Google Scholar] [CrossRef]
  68. Dexter, E.; Rollwagen-Bollens, G.; Bollens, S.M. The Trouble with Stress: A Flexible Method for the Evaluation of Nonmetric Multidimensional Scaling. Limnol. Oceanogr. Methods 2018, 16, 434–443. [Google Scholar] [CrossRef]
  69. Clarke, K.R.; Ainsworth, M. A Method of Linking Multivariate Community Structure to Environmental Variables. Mar. Ecol. Progr. Ser. 1993, 92, 205–219. [Google Scholar] [CrossRef]
  70. Hedges, L.; Olkin, I. Statistical Methods for Meta-Analysis; Academic Press: Cambridge, MA, USA, 1985; ISBN 978-0-08-057065-5. [Google Scholar]
  71. McGrath, R.E.; Meyer, G.J. When Effect Sizes Disagree: The Case of r and d. Psychol. Meth. 2006, 11, 386–401. [Google Scholar] [CrossRef] [Green Version]
  72. Cohen, J. Statistical Power Analysis for the Behavioral Sciences, 2nd ed.; L. Erlbaum Associates: Hillsdale, NJ, USA, 1988; ISBN 978-0-8058-0283-2. [Google Scholar]
  73. Makowski, D.; Ben-Shachar, M.S.; Chen, S.H.A.; Lüdecke, D. Indices of Effect Existence and Significance in the Bayesian Framework. Front. Psychol. 2019, 10, 2767. [Google Scholar] [CrossRef] [PubMed]
  74. Oksanen, J.; Blanchet, F.G.; Friendly, M.; Kindt, R.; Legendre, P.; McGlinn, D.; Minchin, P.R.; O’Hara, R.B.; Simpson, G.L.; Solymos, P.; et al. Vegan: Community Ecology Package. 2017. Available online: https://cran.r-project.org/web/packages/vegan/index.html (accessed on 9 April 2022).
  75. Humborg, C.; Conley, D.J.; Rahm, L.; Wulff, F.; Cociasu, A.; Ittekkot, V. Silicon Retention in River Basins: Far-Reaching Effects on Biogeochemistry and Aquatic Food Webs in Coastal Marine Environments. Ambio 2000, 29, 45–50. [Google Scholar] [CrossRef]
  76. US EPA. National Rivers and Streams Assessment 2008–2009: A Collaborative Survey; US EPA: Washington, DC, USA, 2016.
  77. Knowlton, M.F.; Jones, J.R. Seston, Light, Nutrients and Chlorophyll in the Lower Missouri River, 1994–1998. J. Freshw. Ecol. 2000, 15, 283–297. [Google Scholar] [CrossRef] [Green Version]
  78. Rubin, M.A.; Leff, L.G. Nutrients and Other Abiotic Factors Affecting Bacterial Communities in an Ohio River (USA). Microb. Ecol. 2007, 54, 374–383. [Google Scholar] [CrossRef]
  79. Houser, J.N.; Richardson, W.B. Nitrogen and Phosphorus in the Upper Mississippi River: Transport, Processing, and Effects on the River Ecosystem. Hydrobiologia 2010, 640, 71–88. [Google Scholar] [CrossRef]
  80. Rose, V.; Rollwagen-Bollens, G.; Bollens, S.M.; Zimmerman, J. The Effects of Run-of-river Dam Spill on Columbia River Microplankton. River Res. Appl. 2019, 35, 1478–1488. [Google Scholar] [CrossRef]
  81. Sommer, U. Trophic Cascades in Marine and Freshwater Plankton. Int. Rev. Hydrobiol. 2008, 93, 506–516. [Google Scholar] [CrossRef]
  82. Rollwagen-Bollens, G.; Bollens, S.; Gonzalez, A.; Zimmerman, J.; Lee, T.; Emerson, J. Feeding Dynamics of the Copepod Diacyclops thomasi before, during and Following Filamentous Cyanobacteria Blooms in a Large, Shallow Temperate Lake. Hydrobiologia 2013, 705, 101–118. [Google Scholar] [CrossRef]
  83. Rollwagen-Bollens, G.; Lee, T.; Rose, V.; Bollens, S. Beyond Eutrophication: Vancouver Lake, WA, USA as a Model System for Assessing Multiple, Interacting Biotic and Sbiotic Drivers of Harmful Cyanobacterial Blooms. Water 2018, 10, 757. [Google Scholar] [CrossRef] [Green Version]
  84. Dexter, E.; Bollens, S.M. Zooplankton Invasions in the Early 21st Century: A Global Survey of Recent Studies and Recommendations for Future Research. Hydrobiologia 2020, 847, 309–319. [Google Scholar] [CrossRef]
  85. Hassett, W.; Bollens, S.M.; Counihan, T.D.; Rollwagen-Bollens, G.; Zimmerman, J.; Katz, S.; Emerson, J. Veligers of the Invasive Asian Clam Corbicula fluminea in the Columbia River Basin: Broadscale Distribution, Abundance, and Ecological Associations. Lake Reserv. Manag. 2017, 33, 234–248. [Google Scholar] [CrossRef]
  86. Bolam, B.A.; Rollwagen-Bollens, G.; Bollens, S.M. Feeding Rates and Prey Selection of the Invasive Asian Clam, Corbicula fluminea, on Microplankton in the Columbia River, USA. Hydrobiologia 2019, 833, 107–123. [Google Scholar] [CrossRef]
  87. Rollwagen-Bollens, G.; Bolam, B.A.; Bollens, S.M.; Henricksen, S.; Sandison, C.; Zimmerman, J. Temperature-Dependent Functional Response of the Invasive Asian Clam, Corbicula fluminea, Feeding on Natural Phytoplankton. Inland Waters 2021, 11, 250–256. [Google Scholar] [CrossRef]
  88. Henricksen, S.; Bollens, S. Abundance and Growth of the Invasive Asian Clam, Corbicula fluminea, in the Lower Columbia River, USA. Aquat. Invasions 2022, 17, 36–56. [Google Scholar] [CrossRef]
  89. Elser, J.J.; Marzolf, E.R.; Goldman, C.R. Phosphorus and Nitrogen Limitation of Phytoplankton Growth in the Freshwaters of North America: A Review and Critique of Experimental Enrichments. Can. J. Fish. Aquat. Sci. 1990, 47, 1468–1477. [Google Scholar] [CrossRef]
  90. Schindler, D.W. The Dilemma of Controlling Cultural Eutrophication of Lakes. Proc. R. Soc. B 2012, 279, 4322–4333. [Google Scholar] [CrossRef] [Green Version]
  91. Weisse, T.; Lukić, D.; Lu, X. Container Volume May Affect Growth Rates of Ciliates and Clearance Rates of Their Microcrustacean Predators in Microcosm Experiments. J. Plankt. Res. 2021, 43, 288–299. [Google Scholar] [CrossRef] [PubMed]
  92. Ault, T.; Velzeboer, R.; Zammit, R. Influence of Nutrient Availability on Phytoplankton Growth and Community Structure in the Port Adelaide River, Australia: Bioassay Assessment of Potential Nutrient Limitation. Hydrobiologia 2000, 429, 89–103. [Google Scholar] [CrossRef]
  93. Mitrovic, S.M.; Bowling, L.C.; Buckney, R.T. Responses of Phytoplankton to In-Situ Nutrient Enrichment; Potential Influences on Species Dominance in a River. Int. Rev. Hydrobiol. 2001, 86, 285–298. [Google Scholar] [CrossRef]
  94. Domingues, R.B.; Anselmo, T.P.; Barbosa, A.B.; Sommer, U.; Galvão, H.M. Nutrient Limitation of Phytoplankton Growth in the Freshwater Tidal Zone of a Turbid, Mediterranean Estuary. Coast. Shelf Sci. 2011, 91, 282–297. [Google Scholar] [CrossRef]
  95. Wise, D.R.; Johnson, H.M. Surface-Water Nutrient Conditions and Sources in the United States Pacific Northwest. J. Am. Water Resour. Assoc. 2011, 47, 1110–1135. [Google Scholar] [CrossRef]
  96. Rose, V.J.; Forney, W.M.; Norton, R.A.; Harrison, J.A. Catchment Characteristics, Water Quality, and Cyanobacterial Blooms in Washington and Oregon Lakes. Lake Reserv. Manag. 2019, 35, 51–63. [Google Scholar] [CrossRef]
  97. Emerson, J.E.; Bollens, S.M.; Counihan, T.D. Seasonal Dynamics of Zooplankton in Columbia–Snake River Reservoirs, with Special Emphasis on the Invasive Copepod Pseudodiaptomus forbesi. Aquat. Invasions 2015, 10, 25–40. [Google Scholar] [CrossRef]
  98. Haskell, C.A.; Beauchamp, D.A.; Bollens, S.M. Trophic Interactions and Consumption Rates of Subyearling Chinook Salmon and Nonnative Juvenile American Shad in Columbia River Reservoirs. Trans. Am. Fish. Soc. 2017, 146, 291–298. [Google Scholar] [CrossRef]
  99. Haskell, C.A.; Beauchamp, D.A.; Bollens, S.M. Linking Functional Response and Bioenergetics to Estimate Juvenile Salmon Growth in a Reservoir Food Web. PLoS ONE 2017, 12, e0185933. [Google Scholar] [CrossRef]
Figure 1. Monthly mean values of surface temperature (A), nutrient concentrations (B) and chl a concentrations (C) measured in the Columbia River from the sampling site near Vancouver, WA, from May to September 2018. Error bars are 1 SE (most too small to be visible).
Water 14 01599 g001
Figure 2. Proportional abundance (left) and proportional biomass (right) of ambient microplankton taxa for Day 0 initial control samples.
Water 14 01599 g002
Figure 3. NMDS ordinations of microplankton and significant environmental correlates of taxa abundances (left) and biomasses (right) for Day 0 initial control samples. Panel A stress = 0.085. Panel B stress = 0.136.
Water 14 01599 g003
Figure 4. Mean chl a concentration by experiment day for Day 0 initial control, Day 1–5 final control, and Day 1–5 final nutrient-amended samples. Error bars are 1 SE. Asterisks indicate statistically significant p-values for t-tests comparing final control and final nutrient-amended samples. p < 0.05 = *, p < 0.01 = **.
Water 14 01599 g004
Figure 5. Proportional abundance (left) and proportional carbon biomass (right) of microplankton taxa for Day 5 final control and Day 5 final nutrient-amended samples. Rhodophytes were not present in any Day 5 final control or final nutrient-amended sample and are therefore not shown.
Water 14 01599 g005
Figure 6. Microplankton taxa total abundance (left) and carbon biomass (right) for Day 5 final control and final nutrient-amended samples. Rhodophytes were not present in any Day 5 sample and are therefore not shown. Asterisks indicate statistically significant p-values for t-tests comparing final control and final nutrient-amended samples. t-tests were performed on square-root transformed abundance and log(x + 1) transformed biomass. p < 0.05 = *, p < 0.01 = **, p < 0.001 = ***.
Water 14 01599 g006
Figure 7. NMDS ordinations of microplankton and significant environmental correlates of Day 5 taxa abundances (left) and biomasses (right) for final control and final nutrient-amended samples. Final control samples are hollow and final nutrient-amended samples are filled. Abundance stress = 0.095. Biomass stress = 0.190.
Water 14 01599 g007
Table 1. Results of PERMANOVA and pairwise post hoc comparison tests for monthly variability of microplankton assemblage structure. Tests were run using Day 0 initial control square-root transformed taxa abundances and log(x + 1) biomasses. Statistically significant p-values are in bold.
Day 0 Initial Control: Abundance Day 0 Initial Control: Carbon Biomass
dfSSMSFR2p dfSSMSFR2p
Month40.2660.0668.5370.7090.001Month40.1200.0304.1030.5400.002
Residuals140.1090.008 0.291 Residuals140.1030.007 0.460
Total180.375 1.000 Total180.223 1.000
p values for pairwise comparisons p values for pairwise comparisons
MayJuneJulyAugust MayJuneJulyAugust
Jun.0.032 Jun.0.027
Jul.0.0270.38 Jul.0.0940.738
Aug.0.0310.0310.024 Aug.0.0250.1460.067
Sep.0.0330.0340.0880.026 Sep.0.0310.0280.2430.029
Table 2. Spearman correlation values (r2) and permutation-based p-values between explanatory variables and microplankton assemblage square-root taxa abundances and log(x + 1) biomasses of Day 0 Initial Controls (ambient conditions) for all experiment months. Statistically significant p-values are in bold.
ExperimentParametersAbundanceCarbon Biomass
r2pr2p
Day 0
Initial Control
Temperature0.8330.0010.5450.002
Dissolved oxygen0.2720.0880.3240.055
pH0.4100.0150.2020.181
Chlorophyll a0.5970.0010.3750.029
PO40.7680.0010.6170.001
SiO40.3900.0240.4330.012
NO30.7190.0010.4860.010
NO20.2740.0950.4720.008
NH40.3210.0510.2860.066
Table 3. Results of PERMANOVA tests for the effect of nutrient amendment on Day 5 microplankton assemblage structure for each month using square-root transformed taxa abundances and log(x + 1) biomasses. Statistically significant p-values are in bold.
   May Day 5: Abundance    May Day 5: Carbon Biomass
dfSSMSFR2p dfSSMSFR2p
Treatment10.0140.0140.9720.1960.4 Treatment10.0120.0122.1970.3550.2
Residuals40.0570.014 0.804 Residuals40.2300.006 0.645
Total50.071 1.000 Total50.035 1.000
   June Day 5: Abundance    June Day 5: Carbon Biomass
dfSSMSFR2p dfSSMSFR2p
Treatment10.0990.0994.6480.4820.023 Treatment10.0670.0675.5790.5270.027
Residuals50.1060.021 0.518 Residuals50.0600.012 0.473
Total60.205 1.000 Total60.127 1.000
   July Day 5: Abundance    July Day 5: Carbon Biomass
dfSSMSFR2p dfSSMSFR2p
Treatment10.0220.0224.960.4530.027 Treatment10.0530.0538.0400.5730.033
Residuals60.0270.005 0.547 Residuals60.0400.007 0.427
Total70.049 1.000 Total70.093 1.000
   August Day 5: Abundance    August Day 5: Carbon Biomass
dfSSMSFR2p dfSSMSFR2p
Treatment10.0250.0255.9740.4990.034 Treatment10.0150.0151.9620.2460.222
Residuals60.0260.004 0.501 Residuals60.0470.008 0.754
Total70.051 1.000 Total70.062 1.000
   September Day 5: Abundance    September Day 5: Carbon Biomass
dfSSMSFR2p dfSSMSFR2p
Treatment10.0220.0222.6500.3060.125 Treatment10.0120.0120.8930.1300.423
Residuals60.0500.008 0.694 Residuals60.0810.013 0.870
Total70.072 1.000 Total70.093 1.000
Table 4. Spearman correlation values (r2) and permutation-based p-values between explanatory variables and microplankton assemblage square-root taxa abundances and log(x + 1) biomasses from Day 5 Final Treatments from all nutrient-amendment experiments. Statistically significant p-values are in bold.
ExperimentParametersAbundanceBiomass
r2pr2p
Day 5PO40.2660.0060.1430.080
SiO40.2220.0120.4020.001
NO30.3200.0020.2740.007
NO20.1380.0830.0120.848
Publisher’s Note: MDPI stays neutral with regard to jurisdictional claims in published maps and institutional affiliations.

