Article

Multi-Level Determinants of Acceptance in Centralized Pesticide Delivery among Farmers: Evidence from Huangshan City, China

China Eco-Compensation Policy Research Center, College of Humanities and Development Studies, China Agricultural University, Beijing 100193, China
*
Author to whom correspondence should be addressed.
Water 2022, 14(10), 1566; https://doi.org/10.3390/w14101566
Submission received: 29 April 2022 / Revised: 9 May 2022 / Accepted: 11 May 2022 / Published: 13 May 2022

Abstract

:
Highly toxic pesticides bring negative externalities to water pollution, which increase the demand for green pesticides that are low-toxic and high-efficiency. With the implementation of the unique the Centralized Pesticide Distribution (CPD) policy aiming to reduce the use of chemical pesticides in Huangshan, we try to explore the factors that affect farmers’ acceptance of CPD and thus change their pesticides selection. Based on the theory of farmers’ ecological rationality, we build a decision-making ecosystem on accepting CPD and assuming that farmers’ behavior is determined hierarchically by factors, then the Logistic-AISM model is used for empirical testing using data collected from 233 representative farmers. The results show that the proportion of agri-income and participation in cooperatives fundamentally affected choices for CPD acceptance through two middle-level indirect factor: government publicity and the availability of agri-information by changing farmers’ cognition on pesticides and production status. Thus, CPD may be improved by selling a richer variety of insecticides and implementing more publicity. Lessons from China inspire other intensive farming countries to promote green pesticides by: expanding the sales channel of green agri-products, playing the auxiliary role of cooperatives, and inventing more eco-friendly pesticides.

1. Introduction

Pesticides play a safeguarding role in agricultural production to protect crops and ensure productivity [1]; however, the intensive use of farmland asks for massive application of chemical products, including pesticides [2]. The level of pesticide use has been growing rapidly in both developing and developed countries [3]; the worldwide consumption of pesticide reached nearly 4.2 million tons in 2019, an increase of 34.54% compared with 20 years ago [4]. The overuse of pesticide brings enormous negative externalities that damage human well-being by threatening the water quality, causing agricultural non-point source pollution and impeding the sustainable development of agriculture [5,6,7]. To cater the demand for reducing agricultural sewage and the goal of global sustainable development, farmers need to gradually switch their selections to more suitable and eco-friendly pesticides, which is supported by domestic and international policies [8,9].
As the largest developing country and the second biggest agricultural trader, China faces the severe problem of massive use of chemical pesticides due to intensive farming. In response, the government of China has issued a series of policies and achieved the goal of zero growth in pesticides in 2020. However, the concern of overusing has not yet been fundamentally resolved, which can be seen according to the latest data that the unit of pesticide used in China in 2019 was 13.07 kg/ha, almost five times as high as the world level [10]. The hidden drives behind it are smallholder’s high reliance on chemical reagents and their bounded rationality of making decisions [11,12]. Considering that after traditional chemical pesticides are used in farmland, it is difficult for the residual organic compounds to be decomposed naturally, thus they will flow into groundwater through soil infiltration or into surface water through rainwater scouring, eventually causing water pollution, prompting farmers to use low-toxic, eco-friendly pesticides is of great significance to water pollution control.
Among various pesticide reduction policies and measures, an innovative policy called “Centralized Pesticide Delivery” (hereinafter called “CPD”) emerged in Huangshan City, Anhui Province, which was inspired by the idea of eco-compensation to guide farmers to use eco-friendly pesticides [13]. With the support of CPD policy, the large-scale family farm can order high-efficiency and low-toxic green pesticides at the ex-factory price from an agricultural material company selected by the government through bidding; smallholders can buy green pesticides at the same price from retail stores that cooperate with the company. The company and retail stores gain eco-compensation from government, accounting for 22% of the turnover. Types of pesticides that the company could sell are determined by agrotechnical experts based on the local planting circumstances annually. In the latest 2021, CPD provides a total of 354 pesticides in five categories. Table 1 shows the specific data and the representative products of each category. It can be seen that on the one hand, CPD provides various specifications of new low-toxicity and high-efficiency biological pesticides; on the other hand, it also ensures the supply of physical control tools such as live bees and insect traps.
Building a CPD system such as this one, the local governments try to drive farmers to switch their choice of pesticides to ensure food safety and control agricultural water pollution in origin. The incentives provided by CPD to farmers include, firstly, cheaper price (25% lower than the market price on average); secondly, more efficient and more complete range of eco-friendly pesticides; thirdly, the improvements in the quality and selling price of agricultural products through using these pesticides.
Facts have proved that CPD has indeed produced remarkable results in improving water quality. The Xin’an River, whose main stream is 373 km long and has a drainage area of more than 11,000 square kilometers, originates from X County, flows eastward into Zhejiang Province, and joins Qiandao Lake. Faced with the huge pressure of water quality protection, since the implementation of CPD, the annual average value of each monitoring index of water quality status in X County has reached or exceed the Class II surface water environmental quality standard. As for the downstream Qiandao Lake, it transports more than 6 billion cubic meters of clean water every year, which makes the water quality of Qiandao Lake reach Class I, and the nutritional status index changes from mesotrophic to oligotrophic. With such achievements, analyzing the determinants that affect farmers’ acceptance of CPD can provide new inspiration for the management of pesticide dosage and water pollution.
Whether a farmer adopts CPD and buys green pesticide from it is an individual’s pesticide selection behavior driven by his interests and influenced by his own characteristics and the surrounding objective environments (natural, economic, social). So far, a growing number of studies have explored the deciding factors that influence farmers’ pesticide selection behavior. The previous literature mainly focuses on the influence of internal determinants on the selection behavior of pesticides, such as individual and family characteristics [14,15,16], cognition and awareness [17], psychological determinants, and planting characteristics of farmers [18,19]. Some scholars have also started to conduct research in the external environment, from technical training, policy factors and other aspects [20,21]. The commonly used models include Logistic, Probit, Threshold regression, etc. However, their studies may be more reasonable if the hierarchical structure between the various determinants and their mechanism of action are taken into consideration.
In terms of research objects, due to the innovative nature of the CPD policy and its geographical restrictions (only implemented in Huangshan City), there has not been any research to analyze the determinants of farmers’ adoption of CPD. Therefore, it is imperative to have a fine-grained understanding of the mechanism of farmer’s adaption behavior to maximize the function of CPD, thereby ensuring food safety and controlling agricultural water pollution. Therefore, the objectives of the current study are as follows:
  • What factors affected farmers’ decision to adopt CPD?
  • What is the internal relationship and hierarchical structure between these factors?
  • How can the current CPD policy be improved? What lessons can CPD offers to other regions for pesticide reduction and water pollution management?
Inspired by the existing research, we first constructed a theoretical framework for the differences in farmers’ adoption of CPD based on the theory of bounded rationality, then use binary logistic model and AISM (Adversarial Interpretive Structure Modeling) method to identify determinants’ multi-level feature. The empirical analysis used survey data collected in July 2021 from 233 farmers from Huangshan. The findings are anticipated to obtain useful implications for improving the CPD and propose a paradigm to encourage farmers to use high-efficiency and low-toxic pesticides.
The remainder of this study is organized as follows: Section 2 presents the theoretical framework and methods, and Section 3 introduces the empirical results and their interpretation, which will be further discussed in Section 4.

2. Theoretical Analysis and Methods

2.1. Theoretical Framework

The acceptance of CPD by farmers is actually a question of decision-making. In the view of neoclassical economics, farmers tend to follow the principle of “economic rationality” and obtain the greatest income at the least cost, whereas relevant studies in behavioral economics have shown that under uncertainty, people’s decision-making not only contradicts the expected utility theory [22], but also leads to framing effect [23]. With limited cognitive ability, decision makers often display “bounded rationality” and prefer satisfactory choices rather than optimal ones. Further, Todd put forward the concept of “ecological rationality”; that is, people make their decisions relying on an “ecosystem” where internal cognition and external environmental information interact together [24].
Based on our field survey, we accept Todd’s view and consider that farmers are “ecological rational”. Whether or not to purchase pesticides through CPD is subject to the dual constraints of internal cognitive structure and external environment (including neighbors, cooperatives, government and so on). In this study, referring to the relevant literature on pesticide selection behavior [25,26,27], the determinants of acceptance CPD by farmers are roughly divided into four parts, including individual characteristics, household business, cognitive abilities, and external environmental information. We believe that under the restriction of this complex and changeable multi-level decision-making ecosystem, farmers may take different moves in adopting CPD due to the deviation of ecological rationality.
Individual characteristics. The features of farmers, containing factors such as age, education level, and cadre experience, influence their choice on adopting CPD. Generally, age is a related factor to distinguish the types of pesticides used by farmers [28]. Older farmers are more likely to choose high-toxic pesticide, while younger adults tend to try new green pesticide. Peasants with higher education level may be more willing to use low-toxic pesticides, based on richer knowledge accumulation [29]. Additionally, people with cadre experience have a wider understanding of policies, so they should be more motivated to respond to the CPD policy.
Household business. As a member of the family, when making productive decisions such as pesticide selection, household’s income risks and expected benefits should be considered. For instance, since many farmers blindly equate “low-toxic” with “low efficiency”, they believe that green pesticides require higher frequency of spraying and therefore cost more human capital [30]. In this case, the greater number of family members engaging in agri-production, the more capable they are of avoiding losses; therefore, they may try the green pesticides offered by CPD. Besides, for families who make a living mainly from agriculture, the improvement of crop quality caused by the application of biological and green pesticides can bring them higher expected benefits, which positively encourages them to adopt CPD [31]. Moreover, the family planting size and soil quality can also affect farmer’s selection. For those with large planting scale and fertile land, their expected income risks are smaller, and thus they are more open to choose low-toxic green pesticide [32].
Cognitive abilities. Bell thinks that the complex psychological factors such as “cognition” are pivotal in farmer’s decision-making behavior [33]. There are roughly two types of cognition that we focus on. The first is risk awareness, including the awareness of pest risk and disease risk. The farmers who believe that their own agricultural products will more easily get sick and attract pests will conservatively select high-toxic pesticides to ensure yield [34]. The second is the cognition of pesticide-related knowledge, such as the damage to health and environment pollution caused by pesticides. The high level of pesticide-related cognition means easier adoption to CPD. On the contrary, farmers who lack of cognition are likely to randomly choose high-toxic pesticide [35].
External environmental information. The prospect theory proposed by Tversky [23] believes that new information given to individuals by the external environment will shape a brand-new decision-making scenario and thus impact human behavior. Hence, we add five external environmental determinants, namely neighbors, cooperatives, information acquisition, agri-technical training, and government publicity, to analyze farmer’s pesticide selection after receiving information from them. Surprisingly, some studies agreed that, compared with economical rational people who want to collect as much information as possible, ecological rational decision makers prefer to gain less amount but more important information [24]. Under the behavioral principle of information-saving, the input of external environmental information may have an unexpected impact on farmer’s decision making.

2.2. Methods

2.2.1. Logistic Model

Logistic model is a generalized linear regression method, which has been widely used in psychology, sociology, economics, and so on. In our research, whether farmers adopt CPD policy is obviously a binary decision problem. Therefore, it is appropriate to use Logistic model to explore the determinants of farmers’ behavior. The general form of Logistic is as follows:
P K = F α + i = 1 n β i x i = 1 1 + exp α + i = 1 n β i x i
After converting Equation (1) into logarithmic transformation, the linear expression of the binary Logistic model is as follows:
Y = ln P k I P k = α + i = 1 n β i x i
In Equations (1) and (2), k is the number of observations. Pk represents the probability that the k-th sample accepted CPD, hence, 1 − Pk means the probability that it did not accept CPD. α is the intercept term. xi are factors that may affect farmer’s pesticide selection, βi is the corresponding regression coefficient. In combination with the variable selection mentioned above, the value of i is (1, 2, …, 16) respectively.

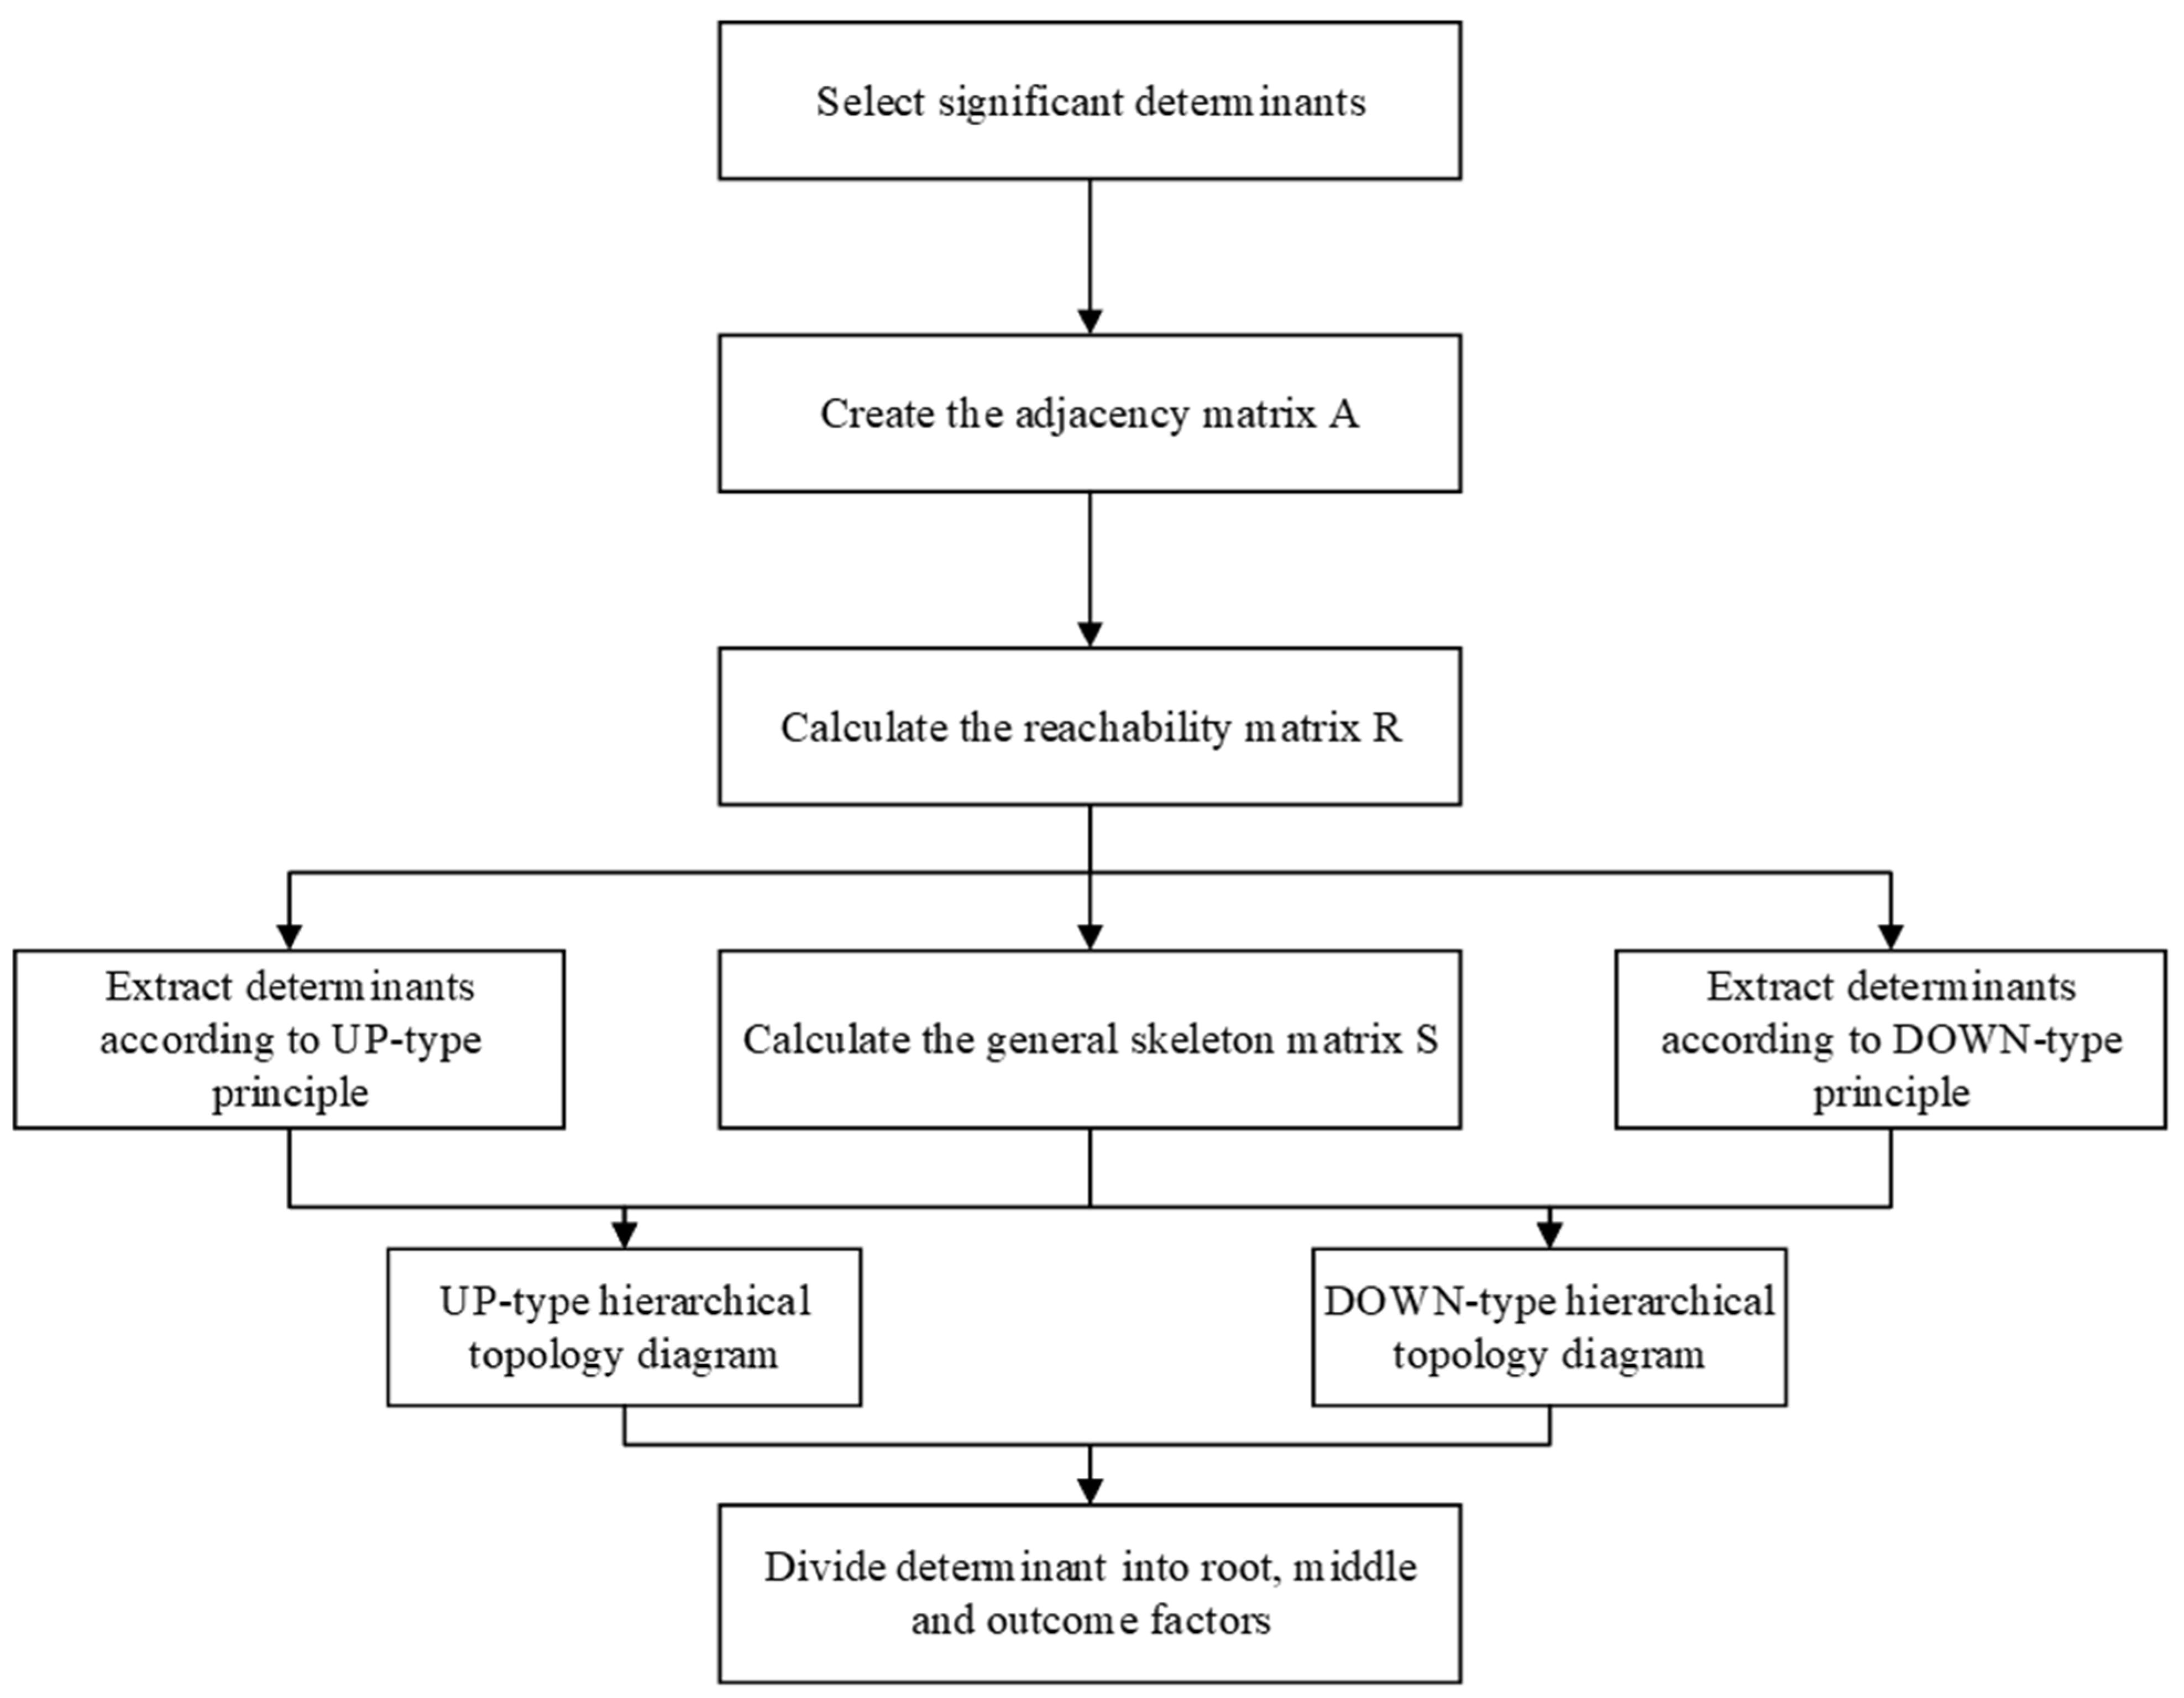
2.2.2. Adversarial Interpretive Structure Model

Despite of the ability of Logistic model to identify significant determinants, the hierarchical relationship between them cannot be presented. Therefore, it is necessary to use the AISM (Adversarial Interpretive Structure Model), a derivative of the ISM (Interpretive Structure Model), for further analysis.
ISM is a model that processes information based on the relationship between determinants and the principle of incidence matrix. It regards determinant factors as “nodes” and presents the causal relationships between factors by using directed lines, applying a “result-oriented” way (or so-called “UP-type”) to divide the levels of each factor, so as to intuitively display the internal relationships between factors. It is popular in the analysis of structural problems of complex socio-economic systems because of its clarity [36].
On this basis, AISM introduces the idea of adversarial in the generative adversarial network, which is the latest model proposed to explore the internal structure of determinants [37]. In a nutshell, on the purpose of comprehensively displaying the hierarchy kite between factor, AISM aims to obtain a pair of simplest multi-level topological diagrams through adding the rules “cause-oriented” (so-called “DOWN-type”) with UP-type together without losing system function. We accepted the AISM model to discuss in depth the hierarchical relationship between the determinants that affect the acceptance of CPD and build a multi-level topological diagram; the processing flow is outlined in Figure 1.

3. Results

3.1. Varibale and Data

3.1.1. Variable Selection

Based on the theoretical analysis in Section 2, we supposed the dependent variable = 1 if the farmer accepts CPD, otherwise = 0 and assumed the independent variables to be “factors influencing farmer’s acceptance behavior”, including 16 factors in 4 aspects. Specific variable definitions and descriptive statistics are present in Table 2.

3.1.2. Data

The CPD policy in Huangshan, Anhui Province, started in 2016, has contributed to the local water quality and food safety. In particular, CPD in Xiuning County has achieved eye-catching results. In 2020, the CPD in Xiuning sold 120.1 tons of green pesticides, accounting for 30% of the county’s total demand for pesticides. In April and July 2021, in order to summarize the local pesticide control experience, an Asian Development Bank technical assistance team from China Agricultural University went to Xiuning and collected research-related data from local farmers.
Stratified random sampling is used to select specific survey sites. After checking the 2020 Statistical Yearbook of Xiuning County and the relevant information provided by the local government, we selected 5 towns and randomly visited 2–3 villages in each town for face-to-face interviews (20 farmers per village). The questionnaire is valid only if the respondent is the decision maker for purchasing pesticides in his or her family. Based on this criterion, 7 out of 240 questionnaires were eliminated, and there were a total of 233 credible observations for the survey.
The basic characteristics of interviewers are present in Table 3. Firstly, 33 interviewers said they have never brought pesticides at CPD, accounting for 14.16%. Meanwhile the remaining 200 farmers have purchased pesticide from CPD at least once in 2020, indicating the coverage of CPD in Xiuning County is relatively wide. Secondly, our respondents are mainly 50–70 years old, with an average age of 59. Among them, 70.82% are males and 29.18% are females. Most of the interviewers have only finished their elementary or junior high schools. In addition, 81.12% of farmers have off-farm income. The items mentioned above partly confirm the current status quo of China’s rural areas, such as rural aging and the loss of young rural labor force. Therefore, the selected samples are representative. Thirdly, normally most families have 1–2 agricultural laborers (usually the elderly couple), and the smallholders with cultivated area of less than 2 ha account for 96.57%; according to international standards, the two facts jointly confirmed the feature of “smallholder farming” in China’s agriculture [38].

3.2. Estimation of the CPD Accpetance Function

This study used Stata16 for the Logistic regression analysis, with reference to previous research, Probit model is also used for robustness testing. The results from Logistic and Probit model are basically the same, the Wald test values are both significant, and the correct prediction percentages are 90.56% and 90.13%, respectively, indicating the model settings are relatively correct and robust. In addition, the value of VIF is less than 10 (7.87), verifying that there is no multi-collinearity among variables.
The estimation results are shown in Table 4. In the empirical strategy, agri-income, risk of health, risk of environment, cooperative, and government publicity all have significant positive impacts on farmers’ acceptance of CPD; meanwhile, risk of pest and information acquisition have a significant negative impact on their behavior. In fact, based on the theory of farmer’s ecological rationality, the above determinants not only function independently, but are also interrelated with others, which together constitute a hierarchical decision-making ecosystem for farmers to adopt CPD.

3.3. AISM Analysis of the Determinants of Accepting CPD

Through the regression analysis, seven determinants that significantly affected the acceptance of CPD by farmers were selected into the AISM model. They are: agri-income, risk of pest, risk of health, risk of environment, cooperative, information acquisition, and government publicity. Renaming them to X1-X7 respectively, according to Figure 1, the calculation process of AISM is presented as follows:
(1) Create the adjacency matrix A. Based on detailed investigations and consultation with experts from Xiuning County Agricultural Technology Station, the Delph method was used to define the logical relationship between the chosen significant determinants. Then, the adjacency matrix A (Table 5) was created according to Equation (3) where m and n = 1, 2, …, 7.
A m n = 1 , when X m affects X n 0 , when X m doesn t affect X n
(2) Calculate the reachability matrix R. In line with Equation (4), the reachability matrix R can be calculated.
R = ( A + I ) λ + 1 = ( A + I ) λ ( A + I ) λ 1 x
where 2 ≤ λ ≤ 7, I mean the unit matrix and the exponentiation of matrix adopts the Boolean algorithm.
For matrix R (Table 6), there are reachable set Re, prior set Qe, and common set Te, corresponding to the matrix R. Re represents a set of determinants that can be reached from Xm, whereas Qe represents a set of determinants that can reach Xm. The intersection of Re and Qe is called Te, and the mathematical expression is: Te = Re ∩ Qe.
(3) Extract determinants hierarchically. As stated in Section 2, there are two complementary hierarchical extraction rules in AISM, namely UP-type and DOWN-type, to obtain UP-type and DOWN-type topological hierarchy diagram, respectively. The detailed extraction steps are: the rule of Te = Re is followed in UP-type, the final result determinants are extracted and placed on the top layer, then others determinants are sequentially placed until the bottom tier. On the contrary, in the DOWN-type, the rule of Te = Qe is applied to cramp out the root cause determinants and place them at the bottom layer at first, then orderly extract others upward until the top tier. See Table 7 for the adversarial hierarchy extraction results.
(4) Calculate the general skeleton matrix S. At the same time, in order to eliminate the repetitive information, it is necessary to compress matrix R (shrink its nodes and lines) according to Equation (5) to obtain the skeleton matrix S′.
S = R R 1 2 1
Then, expand matrix S′ by adding the compressed nodes to obtain a general skeleton matrix S (Table 8).
(5) Draw topological hierarchy diagram. Combining the results (Table 7 and Table 8), the topological hierarchy diagrams are drawn as follows (Figure 2). The left side of Figure 2 is the UP-type topological hierarchical diagram, and the right side is the DOWN-type diagram. The reachability relationships between the significant determinants of farmers accepting CPD is represented by directed line segments. In the diagram, the determinants at the lower levels are more rooted, and the upper determinants are relatively superficial.

4. Discussion

4.1. Analysis for Ecological Rational Decision-Making System of Accepting CPD

As a micro-behavior engaged in agri-production, the transformation of farmer’s pesticide selection behavior is the key to ensuring food safety, controlling non-point source pollution and realizing sustainable development. Section 3 explores the multi-level determinants of farmers’ adoption of CPD. A decision-making ecosystem for farmers’ adoption of CPD was built based on ecological rationality at first. Then, the logistics-AISM model was used to verify the theoretical conjecture, and the independent role and hierarchical structure of each determinant in the system were analyzed.

4.1.1. The Whole Frame of CPD Decision-Making Ecosystem

According to Figure 2, the topological hierarchy diagrams showed a methodical decision-making ecosystem for accepting CPD by farmers from reason to result from bottom to top and divided the determinants into three levels.
Firstly, the union of the uppermost elements of the diagrams are the direct outcome factors, namely X2 (Risk of pest), X3 (Risk of health), and X4 (Risk of environment). They directly affect farmers’ adoption of CPD. Secondly, the intersection of the lowest-level elements of the diagrams are the root cause factors; that is, X1 (Agri-income) and X5 (Cooperative) are the deepest reasons for farmers to choose different pesticides. Finally, X6 (Information acquisition) and X7 (Government publicity) belong to the middle indirect factors, which connect the root factors and direct outcome factors together.

4.1.2. The Hierarchical Factor Analysis

(1) Direct outcome factors. Behavioral theory believes that cognition affects attitude, and attitude determines behavior. Our empirical results supported this view. Among the three significant cognitive ability variables, the regression coefficient of X2 equals to −0.5383, and its sig. < 0.01, indicating that X2 has a significant inhibitory effect on accepting CPD. For every unit increase in the risk of insect happened on crops, the probability of farmers rejecting the purchase of green pesticides in CPD will sharply increase by 58.37%. When farmers think that the risk of pests is particularly high, they tend to blindly use high-toxic pesticides to ensure crop safety, which is consistent with our theoretical expectations. Additionally, X2 is an active element, which means it is at different levels in UP-type and DOWN-type, indicating that the decision-making ecosystem is active, which can be easily changed by external efforts.
The regression coefficients of X3 and X4 are 0.5204 and 0.7682, which promote farmers to accept CPD at the significant level of 10% and 1%, respectively, and validate the expectations before. That is, farmers are more likely to choose green pesticides from CPD if they think pesticides are more harmful to their own health and their living environment. Not only that, since the origins of farmer’s cognition of X3 and X4 both come from the toxicity of pesticides, they influence each other and constitute a loop, which can be treated as a subsystem. Of course, as direct factors, X2 and the loop of X3-X4 are affected by middle indirect environmental factors: X6 and X7.
(2) Middle indirect factors. X7 with a regression coefficient of 3.4201 and sig. < 0.01 supposes that government publicity and its guidance have a significant positive impact on farmer’s acceptance of CPD. Farmers who have once received government publicity are 3.4 times more willing to accepting CPD, compared with those who have not received it. This verified the effective role of publicity in CPD. To be specific, the government’s efforts to promote CPD have directly affected farmers’ awareness of the negative externalities of pesticides on human health and rural environment. Besides, due to the relatively high price of green pesticides and demanding technical requirements, farmers expect to receive government support in the production chain. The emergence of CPD caters the policy need of farmers. Therefore, official publicity makes farmers better understand the policy orientation, and thus makes them more willing to join CPD.
X6, which has a regression coefficient of −0.4726, significantly affects X2 and X7 at a statistical level of 10%, suggesting that the easier it is for farmers to obtain agri-information, the more hesitant they will be to accept CPD. The possible explanation is that sufficient information is a mixed blessing. On the one hand, farmers can buy desirable pesticides easily, if they have access to adequate agri-information. It was found that a few well-informed farmers would go to agricultural material companies in other districts to purchase suitable pesticide at a cheaper price. On the other hand, according to the setting that farmers tend to like “effective information” rather than “full information” in the theory of farmers’ ecological rationality, convenient ways to obtain agri-information are sometimes redundant and ineffective, which will cause non-optimal decisions by farmers’ self-benefit. As the middle-level indirect factors influencing farmers’ adoption of CPD behavior, X6 and X7 are affected by two deep-rooted factors, X1 and X5.
(3) Root factors. The regression coefficients of X1 and X5 are 2.5987 and 1.4142, and their statistical probabilities are 0.048 and 0.073, correspondingly, indicating that farmers with a large share of agri-income and members of cooperative society are more willing to accept CPD. This may be due to the behavior of obtaining higher income through the production of green agri-products is more profitable for households with a large proportion of agri-income. Consequently, they are more willing to adopt CPD.
Besides, farmers participating in the cooperative organization are more disposed to join CPD. Among the 62 cooperative households, 60 of them have purchased pesticides from the CPD (occupying 96.77%), noticeably higher than the corresponding ratio of not cooperative ones (81.87%). Cooperative society plays an important role in green agri-production. It offers not only high-price incentives but also strict supervision for the farmer. During field research, it is found that cooperatives often bid more for products with green pesticide and thus are of better quality, thereby stimulating farmers to join CPD. Cooperative also imposes constraints on members’ agri-production to ensure food safety, and agri-products with excessive pesticide residues may face a worrying market. In addition, X1 and X5 also formed a subsystem; there is an interaction between the proportion of agri-income and whether to join a cooperative.
To sum up, the above seven determinants work individually and are also interrelated with each other, building a complete ecological rational decision-making system. As a root cause subsystem, X1 and X5 directly influence X6 and then affect the choices of farmers along the two forward transmission paths. Path 1: “X6 → X2 → behavior”; Path 2: “X6 → X3 & X4 → behavior”. It can be clearly seen that the cognitive ability of farmers directly affects the behavior of accepting CPD; that is, changing farmers’ pesticide purchase behavior must be based on correct cognition, which comes from two aspects: firstly, their own household business management (such as the proportion of agri-income), then the impact from external environments such as cooperatives and government.

4.1.3. The Insignificant Factors

Although the regression directions of age, education level, cadre experience, agri-laborer, farm size, soil fertility, and neighborhood are in line with expectation, local conditions lead them to the failure in the significance test in Logistic model. First of all, the surveyed area has obvious features such as aging, low level of education, and loss of young labors. A total of 81.12% of the interviewers are over 50 years old, and 80.69% have a junior high school education or below. Secondly, the local farm size is commonly small, with an average cultivated area of 0.55 ha, and the distance between farmlands is relatively close, resulting in little difference in soil fertility. Thirdly, field research found that farmers with cadre experience are mostly off-farmers and pay less attention to agriculture. The communication of agri-information among neighbors doesn’t focus on pesticides.
Interestingly, the regression directions of risk of plant disease are contrary to expectation. Farmers believe that the greater the probability of plant disease, the more likely they are to adopt CPD, which is opposite to the regression result of pest. Through communication with local peasants, we found that they think the incidence of plant disease is lower than pest, and the damage of plant disease is slightly minor in surveyed area. Additionally, after reading the CPD sales list 2020, it was found that the 103 pesticides aim for disease (96 fungicides, 3 fungicides and acaricides, 4 regulators) in the list can be divided into 52 categories according to the effective ingredients. However, the 122 insecticides in the list can only be divided into 44 types according to the ingredients. In other word, the pesticides sold in CPD for curing diseases are more variety and cheaper than those for killing pest, which causes the coefficients of the two factors to be opposite.

4.2. Policy Implications

Our findings have some important policy implications for improving the current CPD policy, and providing lessons for other intensive farming countries to reduce the application of chemical pesticides, promote green pesticides, and control water pollution:

4.2.1. Improve CPD

As a unique local green agri-production policy, CPD has achieved remarkable success, but there are still areas for improvement. It can work better through the following implications:
  • More varieties and cheaper insecticides. The negative effects of risk of pest on accepting CPD suggests that the government’s efforts to improve CPD should focus on insecticides. When determining the pesticides sold in CPD system, more varieties of cheaper green insecticides should be included to provide more options for pest management, so as to encourage farmers to participate in CPD.
  • Increase publicity. As a middle indirect factor that can change the cognition of farmers, the role of government publicity should not be underestimated. There seems to be a need to offer more knowledge about the CPD policy, agri-production safety and environment protection through TV, radio, media and village presentations. These appropriate external environmental interventions can influence farmers’ cognitions, then affect their CPD acceptance behavior.

4.2.2. Lessons for Intensive Farming Countries

CPD offers an innovative flatform to guide farmers to use green pesticide, and its essence is to change their agri-production behaviors. Based on the verified logic of accepting CPD, the following lessons in promoting green pesticides are provided to China and other intensive farming countries.
  • More support for the sales of green agri-products. Given that the proportion of agri-income is the root determinants that affects pesticide use, how to encourage farmers who make a living on agriculture to use more green pesticides is crucial. The government should ensure a stable and profitable sales channel of green agri-products and encourage these farmers to continue to use green pesticides. Then, establishing and improving the certification of green agri-products is also an incentive.
  • Play the auxiliary role of cooperatives. Pay more attention to the positive incentives that cooperatives play in the pesticide selecting system. The cooperatives should play a role in motivating members to learn more agri-knowledge and organizing green agri-production, thus further motivating them to use green pesticides, promoting the process of agri-industrialization.
  • Develop eco-friendly pesticide. At present, another reason hindering farmers from approving green pesticides is that the equation of “low toxicity = low efficiency” is deeply ingrained in farmers’ hearts. Therefore, the research and development of low-toxic and high-efficiency eco-friendly pesticides cannot be delayed. The excellent prevention and control effects of green pesticides should be used to dispel the doubts in the minds of farmers, and help them to increase both efficiency and income.

4.3. Limitations

Our study advanced the previous literature on farmers’ pesticide selection by analyzing a unique policy in Huangshan, China—Centralized Pesticide Delivery. Then, the Logistic-AISM model is introduced to examine the determinants of farmers’ acceptance of CPD. By doing this, our study enriched microeconomics application of AISM and deepened the understanding of farmers’ pesticide selection behavior.
However, this research has certain limitations. Due to the practical constraints, we only went to the representative Xiuning County to collect data. A comprehensive city-wide sample set cannot be provided there. Further studies in other counties, or other samples that carry out similar pesticide policies, should be investigated to test the validity of our findings.

Author Contributions

Conceptualization, C.L. and L.J.; Formal analysis, C.L.; Funding acquisition, L.J.; Methodology, C.L.; Project administration, L.J.; Software, C.L.; Supervision, L.J.; Visualization, C.L.; Writing—original draft, C.L. and L.J.; Writing—review & editing, C.L. and L.J. All authors have read and agreed to the published version of the manuscript.

Funding

This research was funded by the technical assistance project of the Asian Development Bank, ADB TA-9642 PRC.

Informed Consent Statement

Informed consent was obtained from all subjects involved in the study.

Data Availability Statement

The data used in this research can be obtained by contacting the corresponding author.

Acknowledgments

We thank local government of Xiuning County in Huangshan City, Anhui Province for providing valuable data and help in field work.

Conflicts of Interest

The authors declare no conflict of interest.

References

  1. Damalas, C.A.; Eleftherohorinos, I.G. Pesticide exposure, safety issues, and risk assessment indicators. Int. J. Environ. Res. Public Health 2011, 8, 1402–1419. [Google Scholar] [CrossRef] [PubMed]
  2. Migheli, M. Land ownership and use of pesticides. Evidence from the Mekong Delta. J. Clean. Prod. 2017, 145, 188–198. [Google Scholar] [CrossRef]
  3. Akter, M.; Fan, L.; Rahman, M.M.; Geissen, V.; Ritsema, C.J. Vegetable farmers’ behaviour and knowledge related to pesticide use and related health problems: A case study from Bangladesh. J. Clean. Prod. 2018, 200, 122–133. [Google Scholar] [CrossRef]
  4. Food and Agriculture Organization of the United Nations. World’s Pesticides Use. 1990–2019. Available online: https://www.fao.org/faostat/en/#data/RP (accessed on 25 April 2022).
  5. Cai, J.; Xiong, J.; Hong, Y.; Hu, R. Pesticide overuse in apple production and its socioeconomic determinants: Evidence from Shaanxi and Shandong provinces, China. J. Clean. Prod. 2021, 315, 128179. [Google Scholar] [CrossRef]
  6. Pan, D.; He, M.; Kong, F. Risk attitude, risk perception, and farmers’ pesticide application behavior in China: A moderation and mediation model. J. Clean. Prod. 2020, 276, 124241. [Google Scholar] [CrossRef]
  7. Verger, P.J.P.; Boobis, A.R. Reevaluate Pesticides for Food Security and Safety. Science 2013, 341, 717–718. [Google Scholar] [CrossRef]
  8. Steingrímsdóttir, M.M.; Petersen, A.; Fantke, P. A screening framework for pesticide substitution in agriculture. J. Clean. Prod. 2018, 192, 306–315. [Google Scholar] [CrossRef]
  9. Zanardi, O.Z.; Ribeiro, L.D.; Ansante, T.F.; Santos, M.S.; Bordini, G.P.; Yamamoto, P.T.; Vendramim, J.D. Bioactivity of a matrine-based biopesticide against four pest species of agricultural importance. Crop. Prot. 2015, 67, 160–167. [Google Scholar] [CrossRef]
  10. Food and Agriculture Organization of the United Nations. World’s Pesticide Indicators 1990–2019. Available online: https://www.fao.org/faostat/en/#data/EP (accessed on 25 April 2022).
  11. Huang, J.; Hu, R.; Rozelle, S.; Qiao, F.; Pray, C.E. Transgenic varieties and productivity of smallholder cotton farmers in China. Aust. J. Agric. Resour. Econ. 2002, 46, 367–387. [Google Scholar] [CrossRef] [Green Version]
  12. Pemsl, D.; Waibel, H.; Gutierrez, A. Why do some Bt-cotton farmers in China continue to use high levels of pesticides? Int. J. Agric. Sustain. 2005, 3, 44–56. [Google Scholar] [CrossRef]
  13. Wu, L.; Jin, L.S. How eco-compensation contribute to poverty reduction: A perspective from different income group of rural households in Guizhou, China. J. Clean. Prod. 2020, 275, 122962. [Google Scholar] [CrossRef]
  14. McPeak, J.G.; Doss, C.R. Are household production decisions cooperative? Evidence on pastoral migration and milk sales from northern Kenya. Am. J. Agric. Econ. 2006, 88, 525–541. [Google Scholar] [CrossRef] [Green Version]
  15. Roubík, H.; Mazancová, J.; Banout, J. Current approach to manure management for small-scale Southeast Asian farmers—Using Vietnamese biogas and non-biogas farms as an example. Renew. Energy 2018, 115, 362–370. [Google Scholar] [CrossRef]
  16. Tobin, D.; Thomson, J.; LaBorde, L.; Radhakrishna, R. Factors affecting growers’ on-farm food safety practices: Evaluation findings from Penn State Extension programming. Food. Contr. 2013, 33, 73–80. [Google Scholar] [CrossRef]
  17. Khan, M.; Damalas, C.A. Farmers’ knowledge about common pests and pesticide safety in conventional cotton production in Pakistan. Crop. Prot. 2015, 77, 45–51. [Google Scholar] [CrossRef]
  18. Liu, E.M.; Huang, J. Risk preferences and pesticide use by cotton farmers in China. J. Dev. Econ. 2013, 103, 202–215. [Google Scholar] [CrossRef] [Green Version]
  19. Zhao, L.; Wang, C.W.; Gu, H.Y.; Yue, C.Y. Market incentive, government regulation and the behavior of pesticide application of vegetable farmers in China. Food. Contr. 2018, 85, 308–317. [Google Scholar] [CrossRef]
  20. Hruska, A.J.; Corriols, M. The impact of training in integrated pest management among Nicaraguan maize farmers: Increased net returns and reduced health risk. Int. J. Occup. Environ. Health 2002, 8, 191–200. [Google Scholar] [CrossRef]
  21. Polidoro, B.A.; Dahlquist, R.M.; Castillo, L.E.; Morra, M.J.; Somarriba, E.; Bosque-Pérez, N.A. Pesticide application practices, pest knowledge, and cost-benefits of plantain production in the Bribri-Cabécar Indigenous Territories, Costa Rica. Environ. Res. 2008, 108, 98–106. [Google Scholar] [CrossRef]
  22. Ellsberg, D. Risk, ambiguity, and the Savage axioms. Q. J. Econ. 1961, 75, 643–669. [Google Scholar] [CrossRef] [Green Version]
  23. Tversky, A.; Kahneman, D. The framing of decisions and the psychology of choice. Science 1981, 211, 453–458. [Google Scholar] [CrossRef] [PubMed] [Green Version]
  24. Todd, P.M.; Gigerenzer, G.; Group, A.R. Ecological Rationality Intelligence in the World; Oxford University Press: London, UK, 2012. [Google Scholar]
  25. Abadi, B. The determinants of cucumber farmers’ pesticide use behavior in central Iran: Implications for the pesticide use management. J. Clean. Prod. 2018, 205, 1069–1081. [Google Scholar] [CrossRef]
  26. Al Zadjali, S.; Morse, S.; Chenoweth, J.; Deadman, M. Factors determining pesticide use practices by farmers in the Sultanate of Oman. Sci. Total. Environ. 2014, 476, 505–512. [Google Scholar] [CrossRef] [Green Version]
  27. Ntow, W.J.; Gijzen, H.J.; Kelderman, P.; Drechsel, P. Farmer perceptions and pesticide use practices in vegetable production in Ghana. Pest. Manag. Sci. 2006, 62, 356–365. [Google Scholar] [CrossRef]
  28. Isin, S.; Yildirim, I. Fruit-growers’ perceptions on the harmful effects of pesticides and their reflection on practices: The case of Kemalpasa, Turkey. Crop. Prot. 2007, 26, 917–922. [Google Scholar] [CrossRef]
  29. Abhilash, P.; Singh, N. Pesticide use and application: An Indian scenario. J. Hazard. Mater. 2009, 165, 1–12. [Google Scholar] [CrossRef] [PubMed]
  30. Noltze, M.; Schwarze, S.; Qaim, M. Understanding the adoption of system technologies in smallholder agriculture: The system of rice intensification (SRI) in Timor Leste. Agric. Syst. 2012, 108, 64–73. [Google Scholar] [CrossRef]
  31. Dorward, A. Markets and Pro-poor Agricultural Growth: Insights from Livelihood and Informal Rural Economy Models in Malawi. Agric. Econ. 2006, 35, 157–169. [Google Scholar] [CrossRef]
  32. Mariano, M.J.; Villano, R.; Fleming, E. Factors influencing farmers’ adoption of modern rice technologies and good management practices in the Philippines. Agric. Syst. 2012, 110, 41–53. [Google Scholar] [CrossRef]
  33. Bell, C. The acquisition of agricultural technology: Its determinants and effects. J. Dev. Stud. 1972, 9, 123–159. [Google Scholar] [CrossRef]
  34. Baša Česnik, H.; Gregorčič, A.; Čuš, F. Pesticide residues in grapes from vineyards included in integrated pest management in Slovenia. Food Addit. Contam. 2008, 25, 438–443. [Google Scholar] [CrossRef] [PubMed]
  35. Herath, C.S. Does intention lead to behaviour? A case study of the Czech Republic farmers. Agric. Econ. 2013, 59, 143–148. [Google Scholar] [CrossRef] [Green Version]
  36. Kumar, A.; Dixit, G. An analysis of barriers affecting the implementation of e-waste management practices in India: A novel ISM-DEMATEL approach. Sustain. Prod. Consum. 2018, 14, 36–52. [Google Scholar] [CrossRef]
  37. Zhang, Y.; Huang, Y.W.; Zhao, X.Y.; Li, J.X.; Yin, F.L.; Wang, L. Research on the Influencing Factors of Kite Culture Inheritance Based on an Adversarial Interpretive Structure Modeling Method. IEEE Access 2021, 9, 42140–42150. [Google Scholar] [CrossRef]
  38. Lowder, S.K.; Skoet, J.; Raney, T. The number, size, and distribution of farms, smallholder farms, and family farms worldwide. World Dev. 2016, 87, 16–29. [Google Scholar] [CrossRef] [Green Version]
Figure 1. Flowchart of AISM model. The figure shows in detail the five steps of the AISM model.
Water 14 01566 g001
Figure 2. Topological hierarchy diagrams. UP-type hierarchical topology diagram (left) and DOWN-type hierarchical topology diagram (right) are drawn, reflecting the multi-level system of farmers’ accepting CPD. X1–X7 are, respectively: agri-income, risk of pest, risk of health, risk of environment, cooperative, information acquisition, and government publicity.
Water 14 01566 g002
Table 1. Pesticides and representative products offered by CPD in X County in 2021.
CategoryTypesActive Ingredients of
Representative Products
Variety of Representative ProductsConcentration (%)
Insecticide122Emamectin Benzoate130.6–5.7
Fungicide99Benzoic Propiconazole630–50
Herbicide117Glyphosate4030–88.8
Glufosinate ammonium3610–88
Growth regulator4Brassinolide20.01
Plant protection products12Sex attractant4-
Live insect and mites2-
Insect trap6-
Table 2. Variable definitions and descriptive statistics.
VariableDescriptionMeanS.D.
AgeAge of decision makers for using pesticide (years)59.112.1
Education level1 = the decision maker has a primary school education or below; 2 = a junior high school education; 3 = a high school education; 4 = a bachelor degree or higher1.80.8
Carde experience1 = the decision maker has cadre experience,
0 = otherwise
0.30.4
Agri-incomePercentage of household agricultural income (%)0.20.3
Agri-laborersNumber of family members who are engaging in agri-production1.70.6
Soil fertilityEvaluation of soil fertility from 1 to 4, 1 = bad, 4 = good2.50.7
Farm sizeTotal cultivated area in 2020 (ha 1)0.616.7
Risk of pestPerception of the possibility of crop pest from 1 to 5,
1 = extremely small, 5 = extremely big
3.21.5
Risk of plant diseasePerception of the possibility of plant disease from 1 to 5, 1 = extremely small, 5 = extremely big2.31.4
Risk of healthDegree of the health damage by using pesticides from 1 to 5, 1 = extremely small, 5 = extremely big2.51.4
Risk of environmentDegree of the pollution by using pesticides from 1 to 5, 1 = extremely small, 5 = extremely big3.51.3
NeighborhoodThe frequency of communicating pesticides with villagers from 1 to 5, 1 = never, 5 = very frequently3.41.5
Cooperatives1 = the decision maker is a cooperative member,
0 = otherwise
0.30.4
Information acquisitionDifficulty of obtaining agri-information from 1 to 5, 1 = very difficult, 5 = very easy3.51.3
Technical training1 = the decision maker has received agri-technical training, 0 = otherwise0.30.5
Government publicity1 = the decision maker has received government publicity, 0 = otherwise0.90.4
1 ha: the abbreviation for hectare.
Table 3. Basic characteristics of interviewers.
VariableDescriptionRespondentsProportion (%)
Accept CPDBuy pesticides from CPD at least once20085.84
Never buy pesticides from CPD3314.16
AgeUnder 40 years old177.30
40 to 49 years old (including 40 years old)2711.59
50 to 59 years old7733.05
60 to 69 years old6327.04
70 years old or elder4921.03
GenderMale16570.82
Female6829.18
Education levelPrimary school or lower10243.78
Junior high school8636.91
Senior high school3615.45
Bachelor degree or higher93.86
Off-farmFamilies have off-farm income18981.12
Families do not have off-farm income4418.88
Farm sizeUnder 1 ha21592.27
1 to 2 ha (including 1 hectare)104.29
Above 2 ha83.43
Table 4. Estimation of the CPD acceptance function.
Explanatory VariablesLogistic ModelProbit Model
Coefficient ValueOdds RatioMarginal EffectCoefficient ValueMarginal Effect
Age−0.0194
(0.0225)
0.9808
(0.0221)
−0.0015
(0.0017)
−0.0115
(0.0117)
−0.0016
(0.0017)
Education level0.0627
(0.3594)
1.0647
(0.3826)
0.0048
(0.0275)
0.0598
(0.1719)
0.0085
(0.0244)
Cadre experience0.1649
(0.8128)
1.1793
(0.9585)
0.0126
(0.0615)
0.0055
(0.3703)
0.0008
(0.0523)
Agri-income2.5987 **
(1.3172)
13.4464 **
(17.7110)
0.1979 **
(0.0948)
1.2970 **
(0.6600)
0.1834 **
(0.0896)
Agri-laborers0.2085
(0.3644)
1.2318
(0.4489)
0.0159
(0.0279)
0.1397
(0.1870)
0.0198
(0.0266)
Soil fertility0.1073
(0.3094)
1.1132
(0.3445)
0.0082
(0.0235)
0.0388
(0.1609)
0.0055
(0.0227)
Farm size0.0083
(0.0286)
1.0084
(0.0288)
0.0006
(0.0022)
0.0069
(0.0146)
0.0010
(0.0021)
Risk of pest−0.5383 ***
(0.2074)
0.5837 ***
(0.1211)
−0.0410 ***
(0.0144)
−0.2687 ***
(0.0991)
−0.0380 ***
(0.0131)
Risk of plant disease0.1621
(0.1930)
1.1760
(0.2270)
0.0123
(0.0147)
0.0888
(0.0934)
0.0126
(0.0132)
Risk of health0.5204 *
(0.2877)
1.6827 *
(0.4841)
0.0396 *
(0.0208)
0.2682 *
(0.1374)
0.0379 **
(0.0187)
Risk of environment0.7682 ***
(0.2966)
2.1558 ***
(0.6395)
0.0585 ***
(0.0215)
0.4118 ***
(0.1445)
0.0582 ***
(0.0196)
Neighborhood−0.0917
(0.2389)
0.9124
(0.2180)
−0.0070
(0.0182)
−0.0420
(0.1095)
−0.0059
(0.0155)
Cooperative1.4142 *
(0.7884)
4.1133 *
(3.2430)
0.1077 *
(0.0605)
0.7134 *
(0.3870)
0.1009 *
(0.0543)
Information acquisition−0.4726 *
(0.2600)
0.6234 *
(0.1621)
−0.0360 *
(0.0201)
−0.2585 **
(0.1221)
−0.0365 **
(0.0176)
Technical training0.2591
(0.6851)
1.2958
(0.8878)
0.0197
(0.0517)
0.0622
(0.3310)
0.0088
(0.0466)
Government publicity3.4201 ***
(0.6479)
30.5744 ***
(19.8078)
0.2604 ***
(0.0409)
1.9087 ***
(0.3226)
0.2699 ***
(0.0388)
Constant−1.5288
(2.5673)
0.2168
(0.5565)
-−0.8117
(1.3491)
-
Observation233233233233233
Wald43.87 ***-52.68 ***-
Pseudo R20.3679-0.3675-
Correctly classified90.56%-90.13%-
Notes: ***, **, * indicate statistical significance at the 1%, 5% and 10% levels respectively. The value in brackets is the robust standard error.
Table 5. The adjacency matrix A.
A7×7X1X2X3X4X5X6X7
X10000100
X20000000
X30001000
X40010000
X51011011
X60111001
X70010000
Notes: X1–X7 are respectively: agri-income, risk of pest, risk of health, risk of environment, cooperative, information acquisition and government publicity. In the Table 6, Table 7 and Table 8 next, X1–X7 has the same meaning.
Table 6. The reachability matrix R.
R7×7X1X2X3X4X5X6X7
X11111111
X20100000
X30011000
X40011000
X51111111
X60111011
X70011001
Table 7. Adversarial hierarchy extraction results.
LevelsUP-Type (Result-Oriented)DOWN-Type (Reason-Oriented)
Level 1X2, X3, X4X3, X4
Level 2X7X2, X7
Level 3X6X6
Level 4X1, X5X1, X5
Table 8. The general skeleton matrix S.
S7×7X1X2X3X4X5X6X7
X10000100
X20000000
X30001000
X40010000
X51000010
X60100001
X70010000
Publisher’s Note: MDPI stays neutral with regard to jurisdictional claims in published maps and institutional affiliations.

