Article

Food Sources for Benthic Grazers in Trophic Networks of Macrophyte Habitats in a Transitional Baltic Ecosystem

1
Marine Research Institute, Klaipeda University, 92294 Klaipėda, Lithuania
2
Department of Earth and Marine Sciences, University of Palermo, 90123 Palermo, Italy
3
National Interuniversity Consortium for Marine Sciences, CoNISMa, 00196 Roma, Italy
4
Estonian Marine Institute, University of Tartu, 12618 Tallinn, Estonia
*
Author to whom correspondence should be addressed.
Water 2022, 14(10), 1565; https://doi.org/10.3390/w14101565
Submission received: 18 March 2022 / Revised: 22 April 2022 / Accepted: 10 May 2022 / Published: 13 May 2022
(This article belongs to the Section Biodiversity and Functionality of Aquatic Ecosystems)

Abstract

:
In this study, we provide insights into that characteristics of two sites representing different conditions of productivity and salinity impact on trophic network structures of macrophyte habitats and diet of benthic grazers at the active vegetation period in the Curonian Lagoon (southeastern Baltic Sea). Regarding the epiphytic growth, macrophytes were more overgrown in the relatively less productive (northern) site with a muddy bottom and more frequent marine water inflow than in the (southern) site with higher productivity and freshwater sandy habitat. Stable isotope analysis revealed that organisms’ samples from the northern site were more enriched with the heavier carbon isotopes, but depleted in the heavier nitrogen isotopes than those from the southern site. Gastropods and amphipods mainly consumed sedimentary organic matter in the southern site, while they grazed epiphytes together with sedimentary organic matter in the northern site. Although to a low extent, gastropods consumed more charophytes than pondweeds in the southern site. This study contributes to a better understanding of the functioning and structure of lagoonal systems, highlighting the importance, often overlooked, of the benthic compartment, which, however, may have a relevant influence on the productivity of the whole system.

1. Introduction

Submerged aquatic vegetation (macrophytes) macroalgae together with vascular plants contribute to the overall functioning of coastal ecosystems and, even when information on their distribution, species composition, and abundance are not monitored explicitly, their ecological role, as well as the provision of a number supporting and regulating ecosystem services, are considered as important in most coastal areas. They form temporally dynamic, fragmented subtidal landscapes [1], enhance biodiversity by delivering nursery and foraging areas for various organisms, maintain water quality by reducing particle loads and absorbing dissolved nutrients [2,3], protect the coastline by stabilizing sediments, and influence global carbon and nutrient cycling [4,5]. Moreover, macrophytes compete for the same nutrient pool with phytoplankton and might influence the appearance of eutrophication symptoms in shallow coastal systems [6,7].
Considering the direct role of macrophytes in a trophic network, they might be a food source for grazing herbivorous organisms from invertebrates to waterfowl [8], as well as fully or semi-detritivore organisms when they start decaying [9,10]. Experimental and observational studies reveal that macrophyte distribution depends on herbivorous vertebrates, while the invertebrate herbivory effect is more complex. Grazing invertebrates might use varying feeding strategies depending on season and abiotic and biotic factors, and they can switch their preference from one to another food source if a preferred one gets depleted. Therefore, trophic network studies include a number of food sources as macroalgae, macrophytes and associated microorganisms, benthic diatoms, phytoplankton, and others [10,11,12,13].
Consideration of trophic and non-trophic relationships allows us to understand how macrophyte-related networks are structured [14]. However, the macrophyte role in trophic networks is usually unevaluated due to challenges in quantifying the direct effects of herbivory (e.g., [5,15]). Stable isotopes (SI) of carbon (δ13C) and nitrogen (δ15N) have been used in studying trophic networks since SI values in consumer tissues are related to their food sources. δ15N of a consumer is typically enriched by 3–4‰ relative to its diet sources and reflects its trophic position in a food web. δ13C changes much less (0–1‰) between sources and consumers [16,17] but is useful for evaluating the possible sources of carbon for a consumer when the SI signatures of the sources differ from one another. SI analysis is powerful for differentiating phytoplankton versus attached macroalgae in littoral production, with the former showing more 13C-depleted values than the latter [17,18]. Similarly, SI discriminate between marine primary producers and freshwater primary producers, with the latter being more 13C-depleted than the former [19]. In transitional systems, due to gradients of productivity and salinity from freshwater to marine features, SI allow the following the fate of organic matter of different origins (e.g., freshwater, marine, pelagic, benthic) [9]. Overall information provided by SI encompasses identifying the trophic role of primary producers, main trophic pathways leading to top predators, resource utilization by different consumers, and trophic structure of aquatic food webs with implications on ecosystem stability and functioning [10,17].
The Curonian Lagoon, an interface basin between the Baltic Sea and riverine water masses, has a strong gradient of salinity and productivity. Riverine water inflow sustains freshwater conditions in the southern part, whereas brackish features characterize the northern part of the lagoon (Figure 1). This environmental gradient forms different littoral trophic networks [20,21] where consumers, adapted to the mix of the conditions, choose diverse food sources that are reflected in SI values of their tissues [17]. In this lagoon as well as in other highly eutrophic ecosystems, grazing, excretion, and assimilation loop, which involves macrofauna–macrophyte mutual facilitation, ease macroalgae competition for light under eutrophic conditions [22,23]. Consumers representing lower trophic levels (e.g., gastropods and amphipods) might be important in regulating overgrown epiphytes and contribute to macroalgae-related habitat characteristics in different lagoonal sites [23,24]. As trophic structures and characteristics of the littoral food webs might highly depend on macrophyte habitats in the lagoon, the evaluation of consumed organic material by grazers is an important question in the broader topic of the lagoon trophic network and elemental cycles.
The aim of this study is to analyze the food sources for benthic grazers (gastropods and amphipods) within charophyte meadows and other macrophyte habitats during the active vegetation period in the littoral area of the transitional Curonian Lagoon. According to the sampling scheme, which also included nekton feeders, omnivores, zoobenthos feeders, and predators living in the same habitats, the study represents trophic network structures.

2. Materials and Methods

2.1. Characteristics of the Sampling Sites

The study was performed in the Lithuanian part of the Curonian Lagoon, located in the southeastern Baltic Sea (Figure 1). The main water and nutrient input to the lagoon is the Nemunas River (17–23 km3 year−1), which enters the lagoon in the central-eastern part and then moves to the north towards the Baltic Sea. Such a northward current is strongly expressed in spring, but is less evident in other seasons due to low river discharge [21,25]. Riverine water brings a high amount of nutrients [25], sediments [26], and organic matter [27]. Moreover, in the lagoon, processes from functional microbial loop to upper trophic levels are influenced not only by riverine flow but also by the water exchange between the lagoon and the brackish Baltic Sea [23,28].
Samples for this study were collected at two selected sites, the northern (N 55.64046°, E 21.15075°; WGS84) and the southern (N 55.41742°, E 21.24762°; WGS84) (Figure 1). These sites represented different conditions within the northern and the southern lagoonal parts, mostly valid along the eastern coast. As strong gradients of salinity and productivity are present in the lagoon, annual salinity at the northern site was 2.0–3.0 (>0.5 for 150–250 days/year) and at the southern site it was 0.5–1.0 (>0.5 for 85–150 days/year [29,30]. Overall the two sites are also different in terms of other physical and chemical characteristics. As an example, values of dissolved oxygen (mg L−1), alkalinity, dissolved organic carbon (µg L−1), and total phosphorus (µg L−1) usually are lower in the northern site than in the southern site, while the opposite is true for dissolved nitrates and inorganic phosphorus which usually are higher in the northern site than in the southern site (based on August 2014) [30].
Three diverse macrophyte and plant habitats were identified at the two studied sites. The northern site was characterized by a mixed habitat of charophytes (mainly Chara contraria), narrow-leaved pondweeds (Stuckenia pectinata), and epiphytes (Cladophora glomerata), while the southern site was characterized by two different habitats of charophytes (mainly C. contraria) and broad-leaved pondweeds (Potamogeton perfoliatus).

2.2. Sample Collection

The samples of water and sediment, macroalgae, vascular plants, epiphytes, mollusks, worms, crustaceans, and fish were collected during the active vegetation period in July 2019 from the above-mentioned habitats in the northern (mixed habitat) and southern sites (charophytes habitat and P. perfoliatus habitat).
Water samples were collected for SI analysis of seston, as a mixture of autotrophic, heterotrophic and detrital material and prefiltered through 150 µm mesh size separating smaller and larger fractions of seston. Then, samples were filtered on Whatman glass microfiber GF/F filters (pore size 0.7 µm) to concentrate the material. The water prefiltered through Nuclepore filters (pore size 0.22 µm) was used to clean particles from the meshes.
Four intact sediment cores were collected by hand, gently pushing liners (internal diameter = 8 cm, height = 30 cm) within sediments. In the laboratory, cores were extruded and sliced at 0–0.5 and 0.5–2 cm intervals. Each layer was homogenized. Then, a 20 mL subsample of sediment aliquot was taken and transferred in a 50 mL centrifuge tube. After centrifugation in dark conditions (15 min at 2000 rpm) the supernatant and the lighter detritus fraction were collected with a syringe and filtered (Whatman glass microfiber GF/F filters, pore size 0.22 µm).
Once collected, macrophytes were immediately transported to the laboratory in an ice chest. They were gently rinsed with the lagoon water (previously filtered through 0.22 µm sterile membrane filters) to remove large debris, sediment, and vagile organisms (e.g., mollusks, amphipods), and placed into sterile 50 mL tubes with filtered lagoon water. Subsequently, the separation of epiphytic organisms from their host was performed in three steps: by 3 min of ultra-sonication, 30 min of shaking (225 r/min), and 3 min of additional ultra-sonication [31]. Then, water with disattached epiphyte was filtered onto glass fiber filters precombusted at 550 °C and pre-weighed (Whatman GF/F, pore size 0.7 µm, 47 mm diameter) [32]. The remaining epiphytes were removed by scraping with the tweezer under binoculars and were transferred on the same filter. Epiphytes were not separated into taxonomic groups, but they were analyzed as a pool for the different macroalgae or plant species. Epiphyte biomass was calculated per dry weight of macrophytes. Leaves or top thalli of macrophytes cleaned from epiphytes and other organisms were used in the SI analysis.
Fish (2.5–10 cm total length) and invertebrates were caught using 4–6 pop-nets [33]. The pop-nets were made of a square wall of fine mesh netting (1.0 mm diameter) attached to a bottom frame (2 × 2 m) of heavy steel and a floating top frame (sealed 40 mm diameter PVC pipes). The top and bottom of a pop-net were open (no netting). The pop-nets were placed at 0.5–1 m depth; the distance between the nets ranged between 2 and 50 m. The upper and lower frames of pop-nets were locked together and were left undisturbed for 1–2 h to allow for fish to return and to recolonize the site. Then, we pulled ropes on the shore that released fixators locking the frames and the top of the nets surfaced within 2 s. A semi-solid-framed collecting net of the same mesh was used to close the bottom of a pop-net. After placing a netted bottom, the whole pop net was raised to the surface and brought to a shore, where fish were collected.
Invertebrates were additionally collected using a hand-net (the area of opening 700 cm2), which was gently dredged near the bottom for 1 m distance in the pop-nets or in their vicinity.

2.3. Sample Preparation and Analysis

Samples of macrophytes, GF/F filters with seston, sedimentary organic matter, epiphytes, soft tissues of invertebrates, and muscle of fish were stored at −20 °C and then freeze-dried. When possible, animal individuals were analyzed as replicates. Only in the case of chironomids and small crustaceans were whole body and pooled individuals used per replicate because of their small individual weight.
Overall, δ13C and δ15N analysis was run on all untreated samples. For the analysis of whole-body invertebrates (i.e., crustaceans) and GF/F filters, δ13C and δ15N were analyzed separately and, prior to analysis, samples were acidified drop by drop with HCl (2N) to remove carbonates, then washed and oven-dried at 60 °C [34]. Moreover, when the C/N ratio was >3.5, δ13C and δ15N were analyzed separately and, prior to stable carbon isotope analysis, lipids were removed through a 2:1 methanol:chloroform solution and oven-dried at 60 °C ([35] modified). In cases in which both treatments were necessary, samples were first delipidized and then acidified.
All samples were then ground into a fine powder using a micro-mill (MM200, Retsch, Haan, Germany), weighed in tin capsules, and analyzed in an Isotope Ratio Mass Spectrometer (Delta Plus XP, Thermo Fisher Scientific, Waltham, MA, USA) connected to an Elemental Analyser (Flash EA 1112, Thermo Fisher Scientific, Waltham, MA, USA). Isotopic values were expressed in conventional δ unit notation (as parts per mil) in relation to international standards (Pee Dee Belemnite for δ13C and atmospheric N2 for δ15N), following the formula
δ13C or δ15N = [(Rsample/Rstandard) − 1] × 103,
where R is the 13C/12C or 15N/14N ratio. Analytical precision based on the standard deviation of replicates of internal standards (International Atomic Energy Agency IAEA-NO-3 for δ15N and IAEA-CH-6 for δ13C) was 0.2‰.
Statistical analysis was done using R [36]. Normality of SI values was checked using the Shapiro test. Differences among taxa and sampling sites were analyzed using Multivariate Analysis of Variance (MANOVA) and Turkey HSD. SI differences in selected consumers, which were sampled in both sampling sites, were estimated using t-test.
The boosted regression trees (BRT) method was used to assess the importance of variables (typology, type, site, and habitat) in explaining the variance of δ15N and δ13C. This method does not assume that an explanatory variable has the same relationship with a response across the entire range of the environmental factor, as BRT uses decision trees to classify explanatory variables and predict the response by minimizing a loss function [37]. Moreover, BRT addresses a multicollinearity issue because it considers interactions among explanatory variables—a response to an explanatory variable depends on the values of other explanatory variables at the higher levels of trees. BRT was performed using the package “dismo” [38] in R.
Mixing modeling was carried out with the package SIAR (Stable Isotope Analysis in R; [39]). We applied the trophic enrichment factor (TEF) of 3.4 ± 1.02‰ for δ15N and 0.8 ± 0.16‰ for δ13C when estimating the diet of invertebrates [40,41].
We aggregated SI values of particular sources when the matrix plots in SIAR suggested that it was difficult to distinguish between their contribution to the consumers as they overlapped one another in the isotopic space. Thus, the following groups of food sources were used:
-
Three food sources (macrophytes, their epiphytes, and sedimentary organic matter and seston < 150 µm (small)) to estimate the diet of four species of gastropods at both sites and habitats (Table S1);
-
Six food sources (epiphytes on C. contraria, epiphytes on S. pectinata, sedimentary organic matter, seston < 150 µm (small), epiphytes of C. glomerata and seston > 150 µm (large), macrophytes) to estimate the diet of amphipods at the northern site;
-
Six food sources (C. contraria, P. perfoliatus, epiphytes on different macrophyte species, seston > 150 µm (large), sedimentary organic matter and seston < 150 µm (small)) to estimate the diet of amphipods at the southern site.
The mean percentages with standard deviation (SD) were the outputs of isotopic mixing models. Trophic levels of consumers were calculated according to the following equation [17]:
TL = [δ15Nconsumer − δ15Nbaseline]/3.4 + TLbaseline,
where we used the averaged δ15N values of Bithynia tentaculata and Radix balthica as the baseline values (8.1‰ in the southern site and 7.9‰ in the northern site—obtained in this study).

3. Results

3.1. Trophic Networks in Macrophyte Habitats

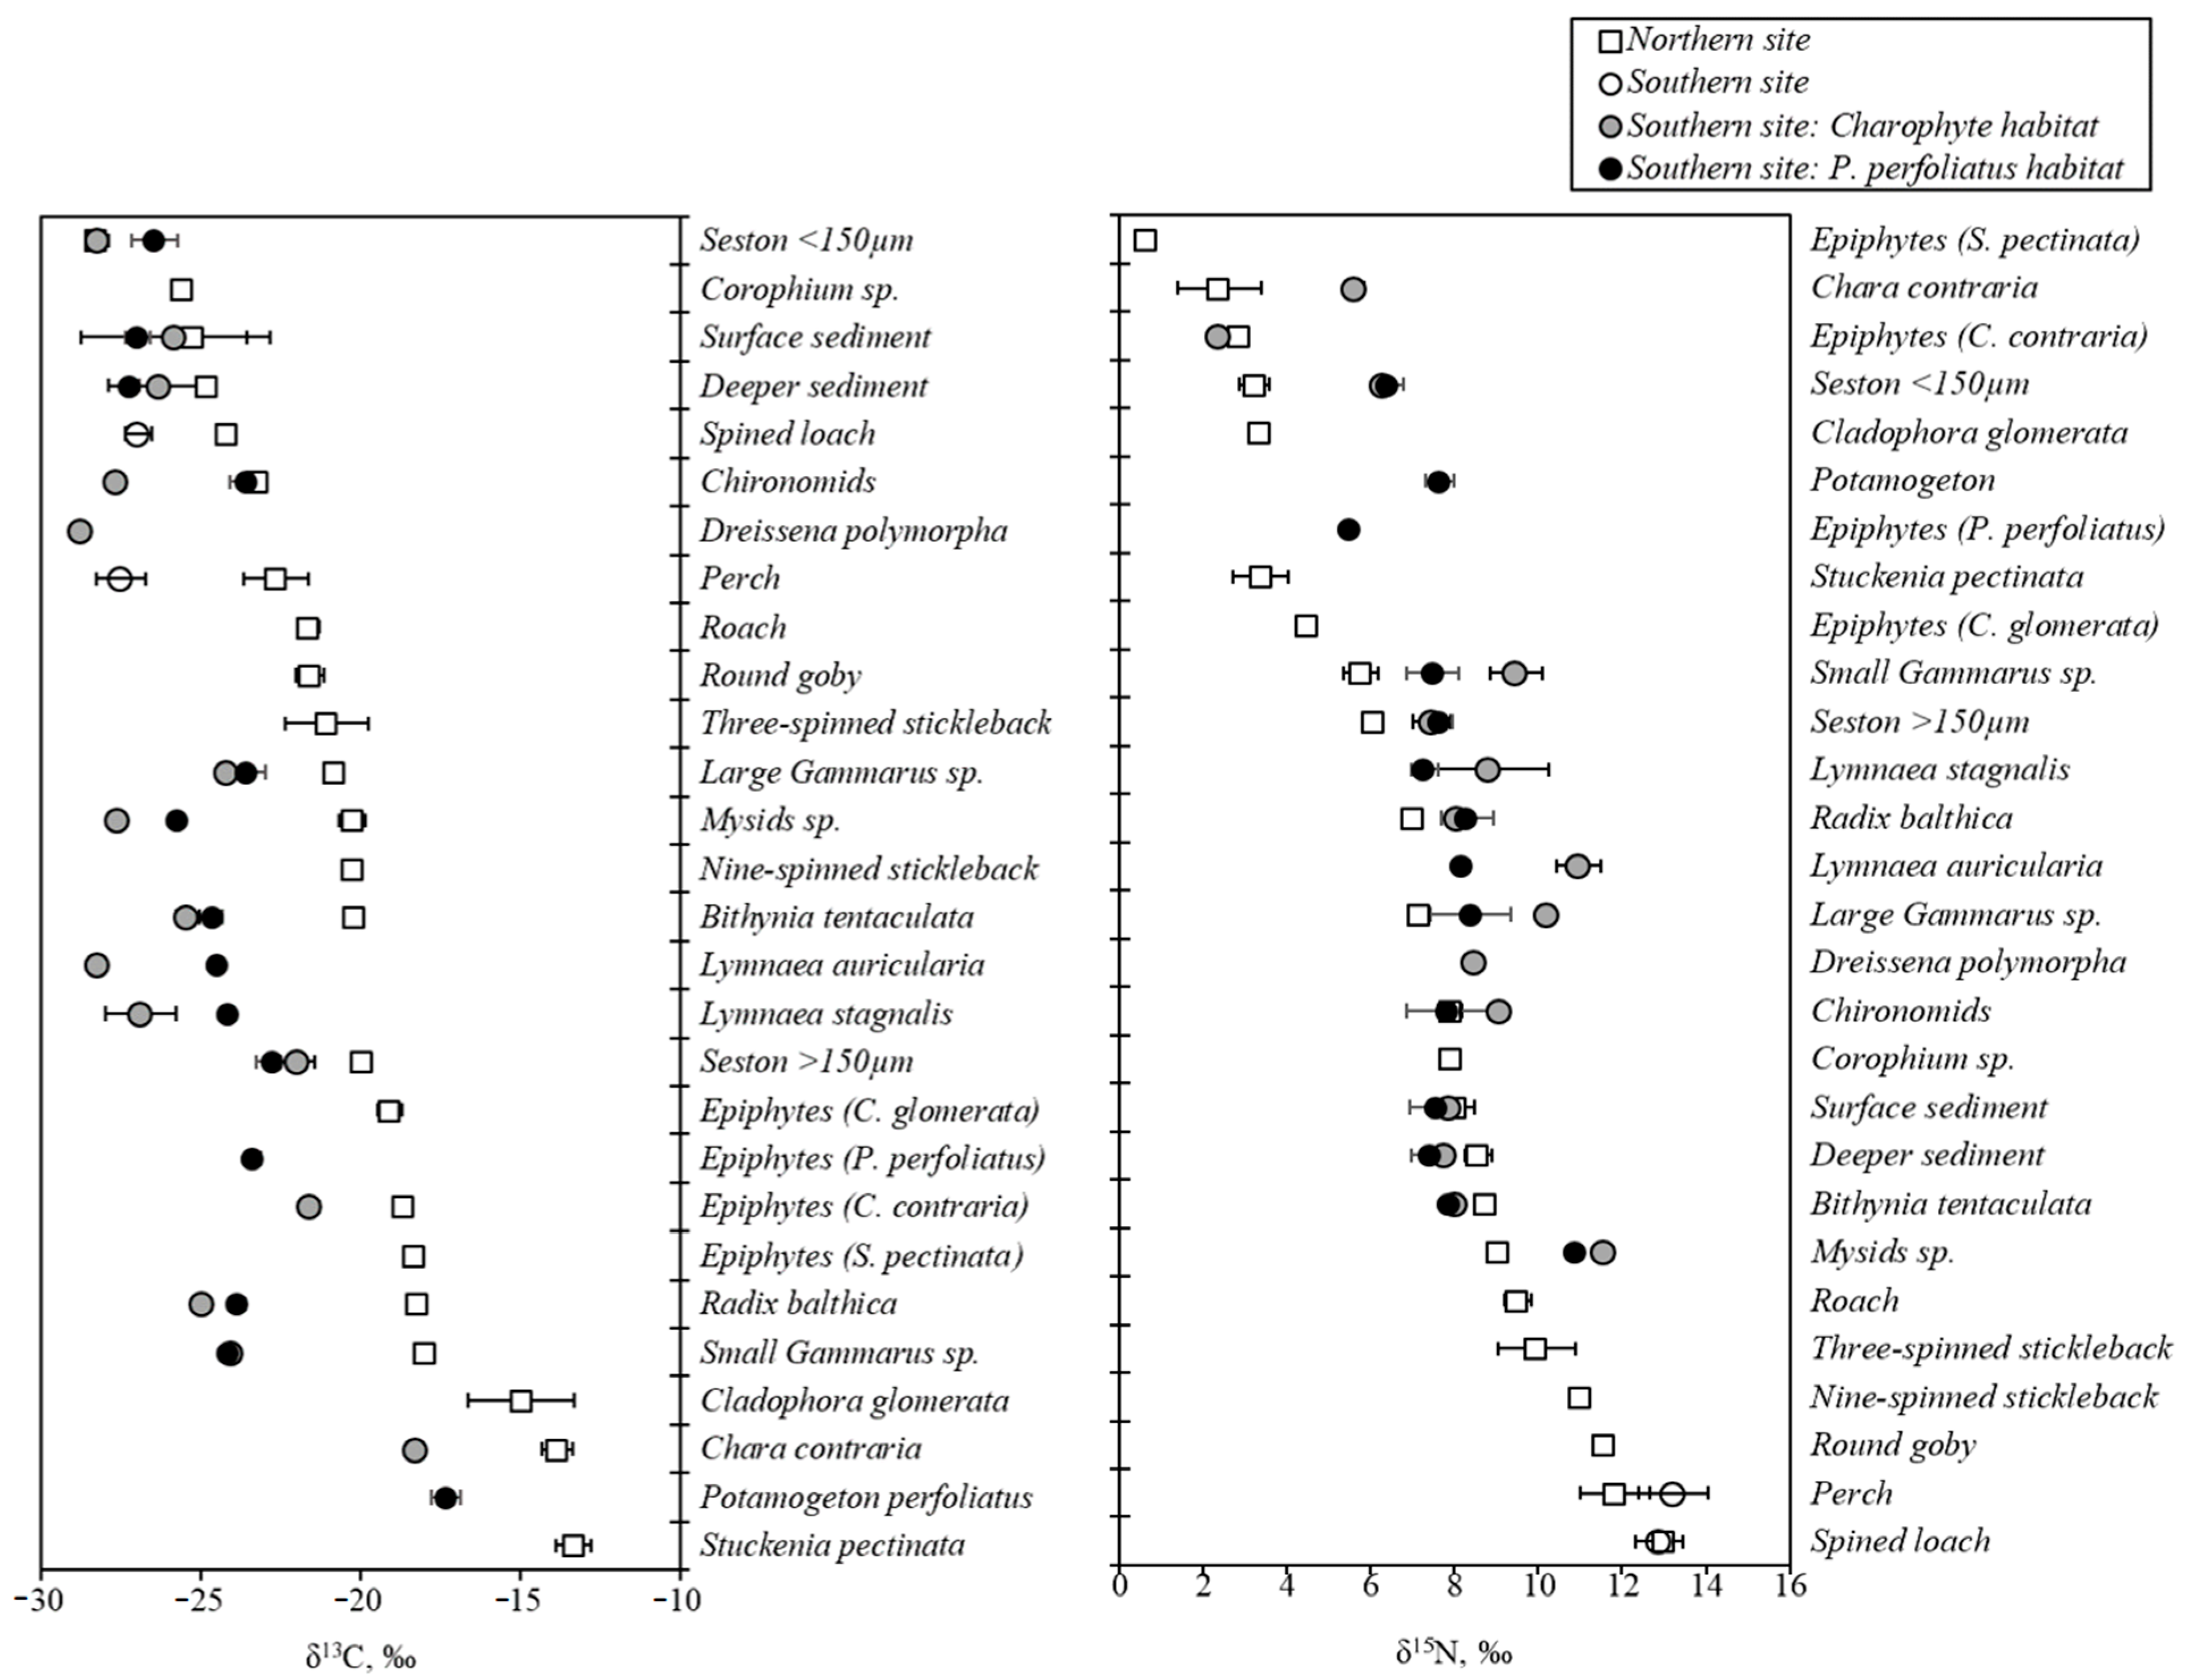
This study included six fish species, nine macrozoobenthos taxa, five macrophyte taxa, epiphytes from four different macrophytes, two sediment layers, two fractions of seston (Table 1) from two sites, and three different macrophyte habitats (Figure 2 and Figure 3) in the Lithuanian part of the Curonian Lagoon. Overall, δ15N varied between 0.4 and 14‰, while δ13C ranged from −29 to −13‰ (Figure 2). Estimated trophic levels (TLs) of consumers provided information about their role in the littoral food webs of the different sites and habitats (Table 1). Invertebrates occupied a TL up to 2.4, only mysids showed a TL equal to 2.9, perches and spined loaches occupied the highest TL of 3.2–3.5. In the northern site, the range of SI values was broader and organisms occupied lower TLs than in the southern site (Figure 2).
Results from boosted regression trees (BRT) suggested that typology (as organism taxonomy) contributed to variation of δ15N and δ13C (91.7% and 81%, respectively). Site and habitat information contributed 11.3% and 7.7% δ13C variation, while the same factors contributed, respectively, only 4.2% and 4.2% δ15N variation in this study.

3.2. Macrophytes and Epiphytes: Differences among Taxa, Habitats and Sites

SI of macroalgae and vascular plants significantly differed between sites (MANOVA, F(2, 8) = 33.11, p = 0.0014) and species (MANOVA, F(6, 16) = 5.28, p = 0.0036). Macroalgae were more 13C-depleted and more 15N-enriched in the southern than the northern site.
In the southern site, Chara contraria and Potamogeton perfoliatus did not differ significantly by δ13C values (HSD test, p = 0.98) and by δ15N values (HSD test, p = 0.41). In the northern site, δ13C and δ15N were homogeneous in three species of macrophytes (Stuckenia pectinata, C. contraria, and Cladophora glomerata) (HSD test, p-values varied from 0.74 to 0.99 for δ13C and 0.99 to 1.00 for δ15N) (Table 1, Figure 3).
In both study sites, δ13C values in epiphytes and macrophyte hosts differed (HSD test, p-values from 0.0002 to 0.0068). Regarding this aspect, δ15N was consistent in all vegetation samples (HSD test, p-values from 0.33 to 1.00), but exceptionally δ15N in charophytes differed from that of their epiphytes in the southern site (HSD test, p = 0.0002) (Table 1, Figure 3).
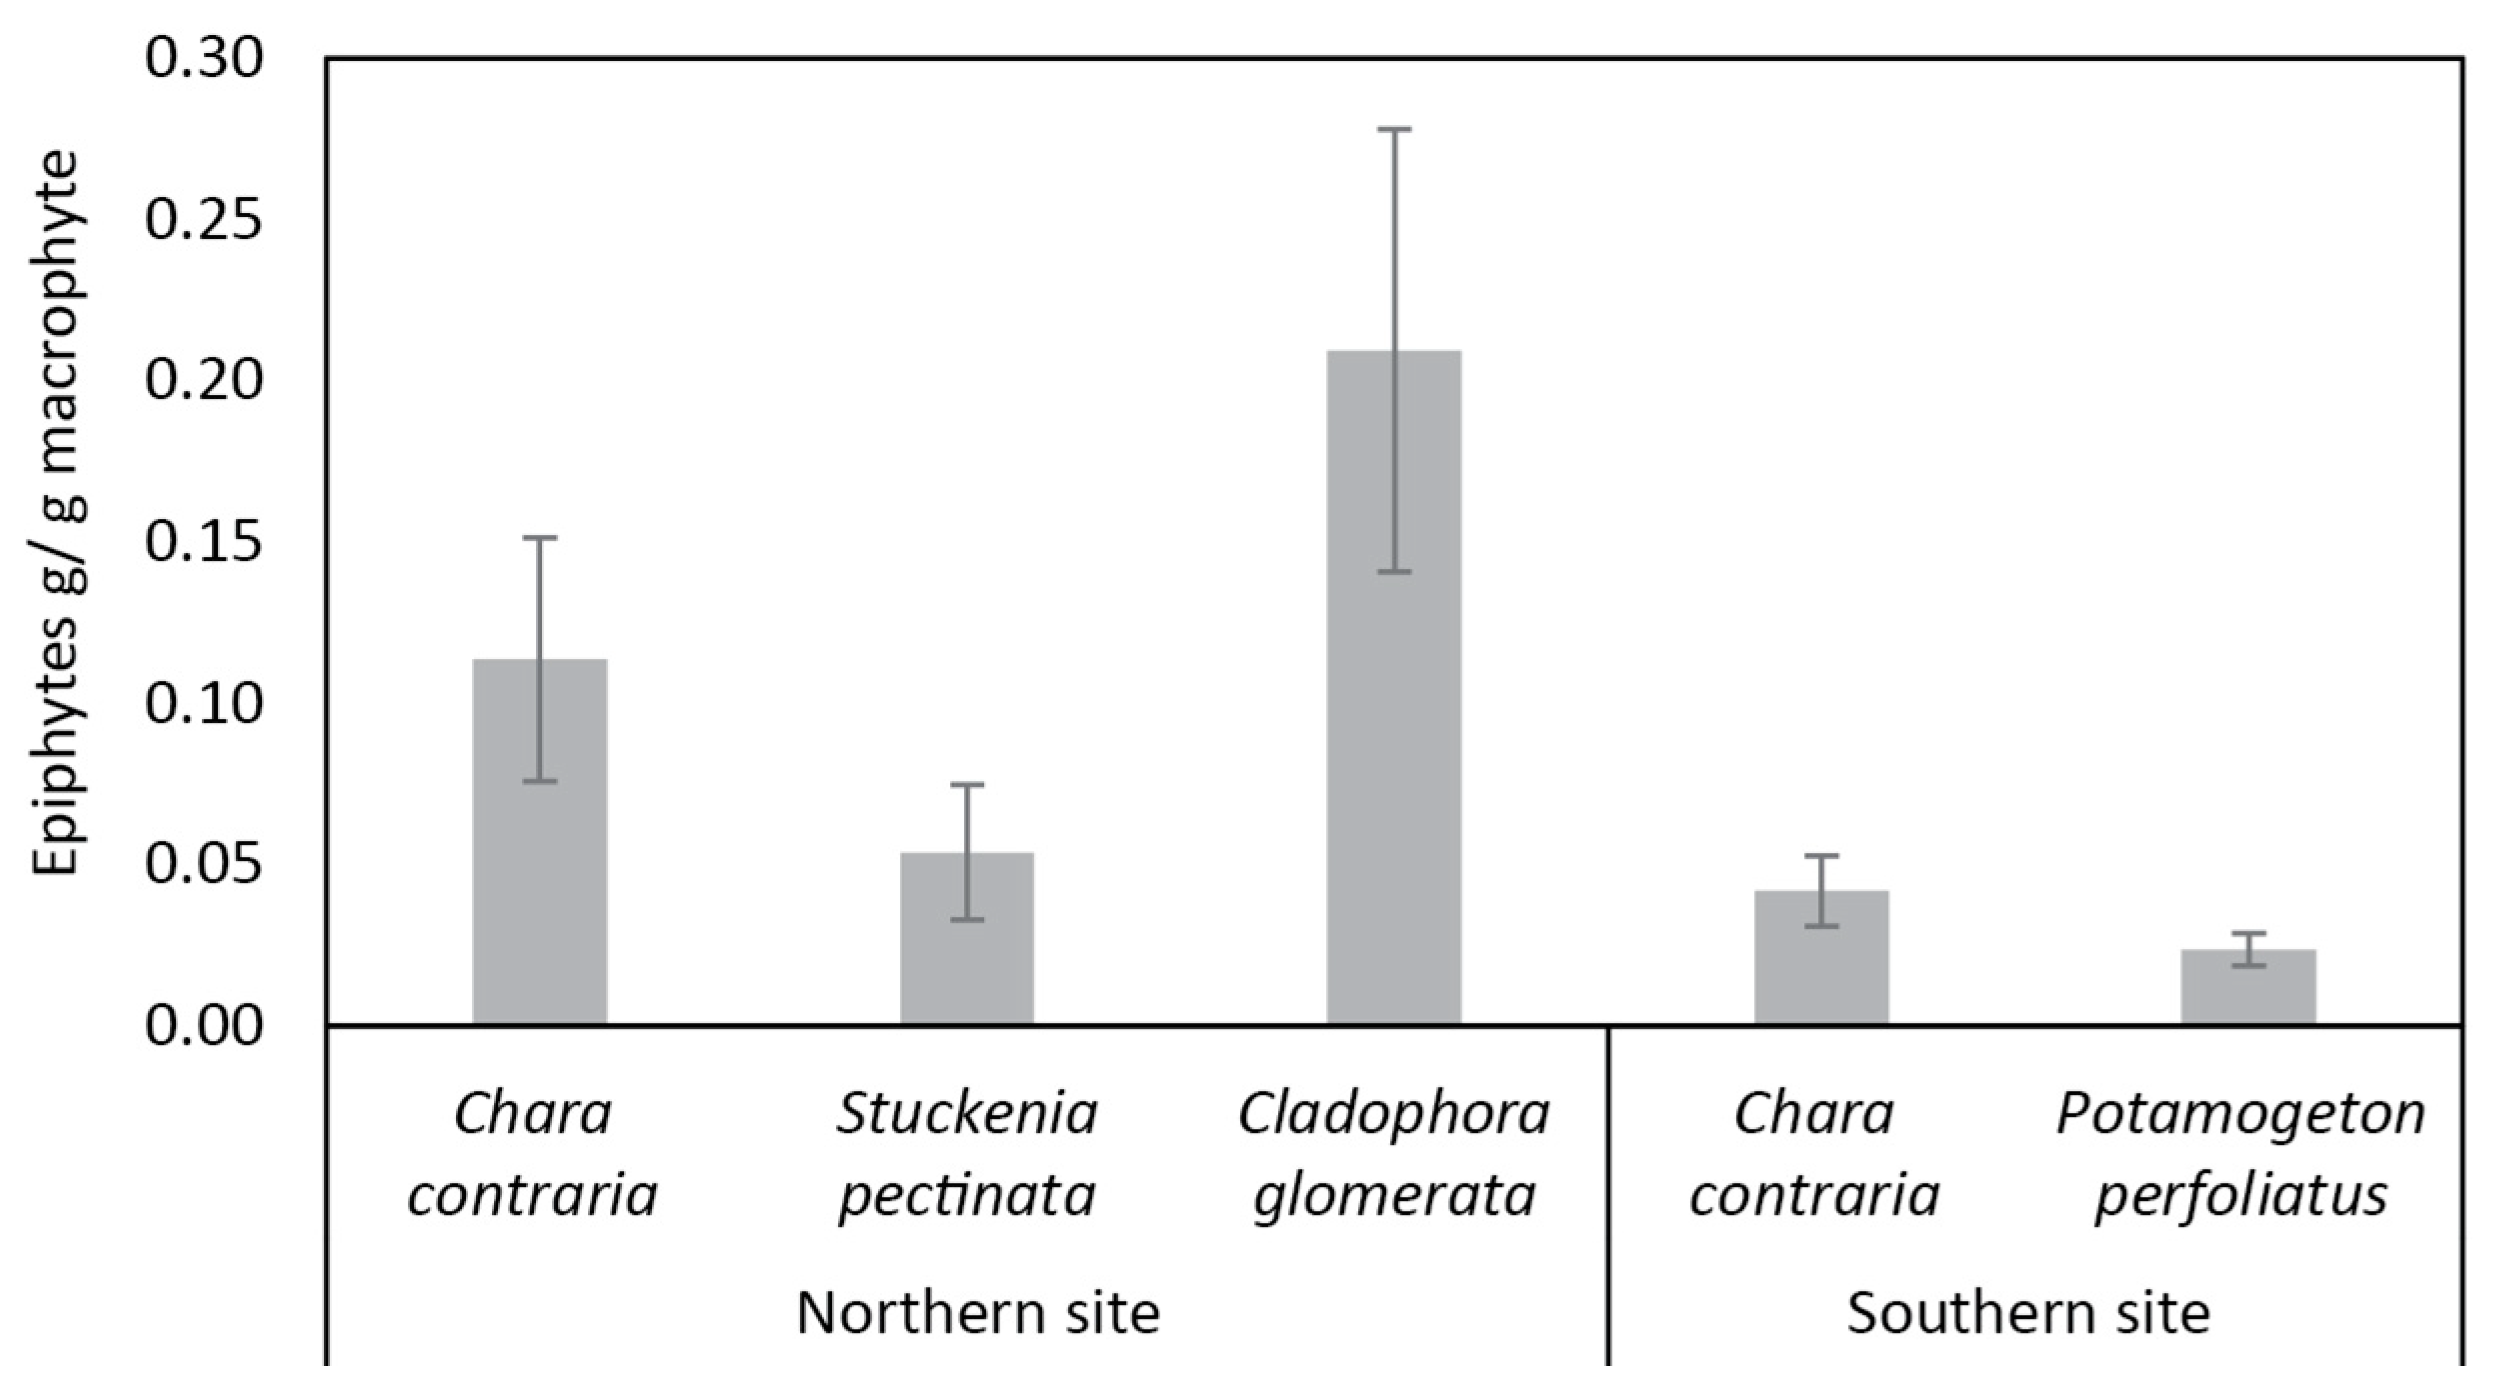
Regarding the epiphytic growth, overall macrophytes were more overgrown in the northern than the southern site (Figure 4). In particular, the only species present in the two sites, C. contraria, had more epiphytes in the northern than in the southern site.

3.3. Seston and Sediment: Comparisons among Size Fractions/Layers and Sites

Seston fractions, as well as sediment layers, were similar at two adjacent habitats at the southern site, but differed between the southern and northern sites.
SI in seston differed between size fractions and sampling sites (MANOVA, F(1,10) = 19.20, p = 0.0045). δ15N values of both seston fractions were significantly lower at the northern site than at the southern site (HSD test, p = 0.0002). δ13C of fractions >150 µm were higher than <150 µm-sized fractions in both sites.
Significant differences were found for both SI values of sedimentary organic matter from the northern and southern sites (HSD test, p = 0.0406 for δ13C and p = 0.0053 for δ15N). Although surface and deeper sediment layers were isotopically similar (HSD test, p = 0.71 for δ13C and p = 0.99 for δ15N), SI values of the deeper layer were less variable than the surface layers (0.5–1.2 vs. 0.9–1.8 for δ15N and 0.5–4.1 vs. 1.0–7.5 for δ13C, respectively).
δ13C values in both deeper and surface sedimentary organic matter were higher in the charophyte habitat (4.1 and 7.5 ‰, respectively) than in the P. perfoliatus habitat of the southern site (0.5 and 3.0 ‰) and the mixed habitat of the northern site (0.8 and 1.0 ‰). δ15N values were higher at the P. perfoliatus habitat, ranging from 1.2‰ to 1.8‰, while overlapping at the charophyte habitat of the southern site (0.6–1.0‰) and the mixed habitat of the northern site (0.6–0.9‰).
The comparison of δ15N values of seston and sedimentary organic matter revealed that all seston fractions and sediment layers differed significantly at the northern site (HSD tests, p-value varied from 0.0001 to 0.0003), except for mentioned isotopically similar sediment layers. At the southern site, seston <150 µm was isotopically different from sedimentary organic matter (HSD tests, p = 0.0001), while seston fraction >150 µm did not differ significantly from sedimentary organic matter (HSD test, p = 1.00). Regarding the δ13C values at both sites, the opposite situation was detected as seston >150 µm differed from sedimentary organic matter (HSD test, p-values varied from 0.0003 to 0.014), while values of seston <150 µm and sedimentary organic matter did not differ from each other (HSD tests, p-values were from 0.085 to 0.999).

3.4. Consumer Tissues Reflecting Isotopic Signals of Food Sources

The between-site comparison of SI in invertebrates and fish between sampling sites revealed a similar tendency with higher δ13C values at the northern site than at the southern site (Table 2, Figure 3).
δ15N in high-trophic level fishes (perch and spined loach) did not differ between sites. At the northern site, the two size groups of Gammarus sp., mysids and R. balthica, had more 15N-depleted values than at the southern site. However, δ15N in B. tentulata showed the opposite pattern (Table 2). Looking at the between-habitat differences at the southern site (Figure 3), higher δ15N values of invertebrates were assessed in the charophyte habitat than in P. perfoliatus habitat.

3.5. Food Sources for Gastropods and Amphipods

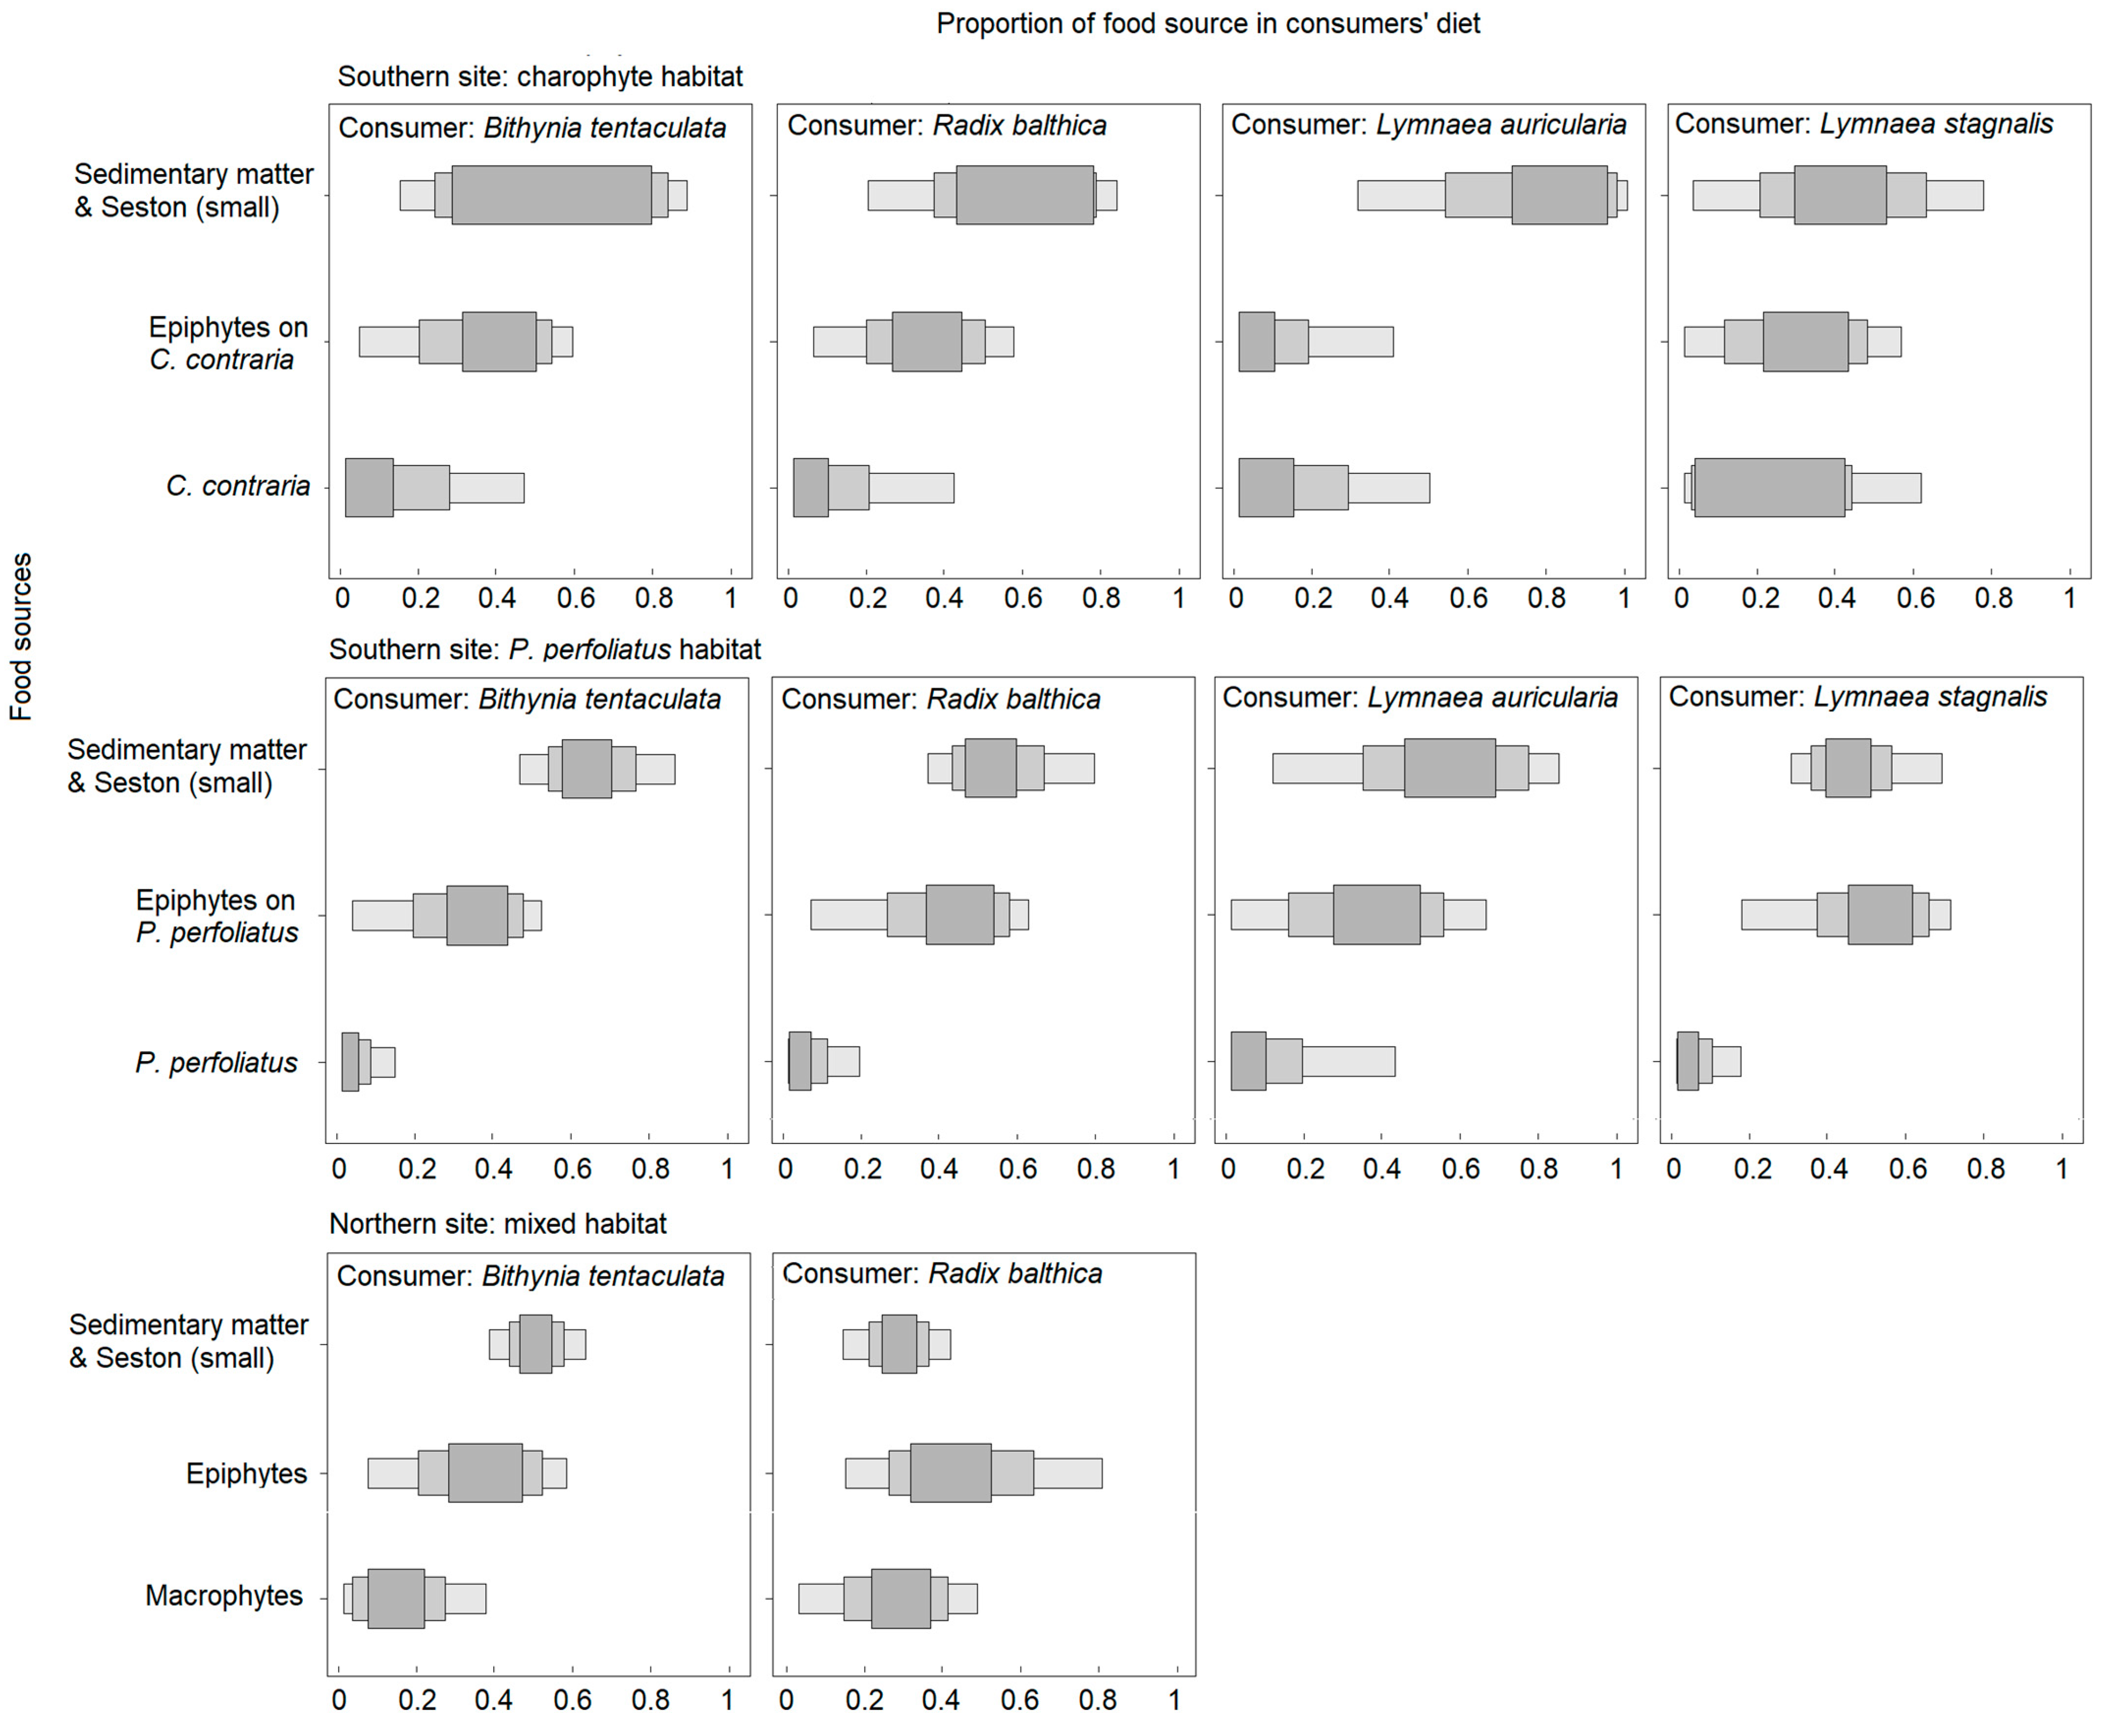
The SI mixing models revealed that all gastropod species consumed more sedimentary organic matter in the southern site (on average from 42 to 63% for different species), while epiphytes (range 33–44%) together with sedimentary organic matter (range 28–49%) were important food sources in the northern site (Figure 5; Table S2).
Diets of B. tentaculata and R. balthica were similar among the studied habitats, although R. balthica consumed a smaller proportion of sedimentary organic matter in the northern site in relation to the southern site. In the southern habitats, individuals of L. auriculata mainly consumed seston and sedimentary organic matter (68%) in the charophyte habitat, while in the neighboring P. perfoliatus habitat, they depended not only on sedimentary organic matter and seston (50%) but also on epiphytes. Different tendencies were assessed for the L. stagnalis, which diet was based on seston and sedimentary organic matter at both habitats in the southern site (42 and 54%), but greatly differed according to the proportion of habitat-forming macrophytes in the diet (on average 29% for C. contraria and 7% for P. perfoliatus).
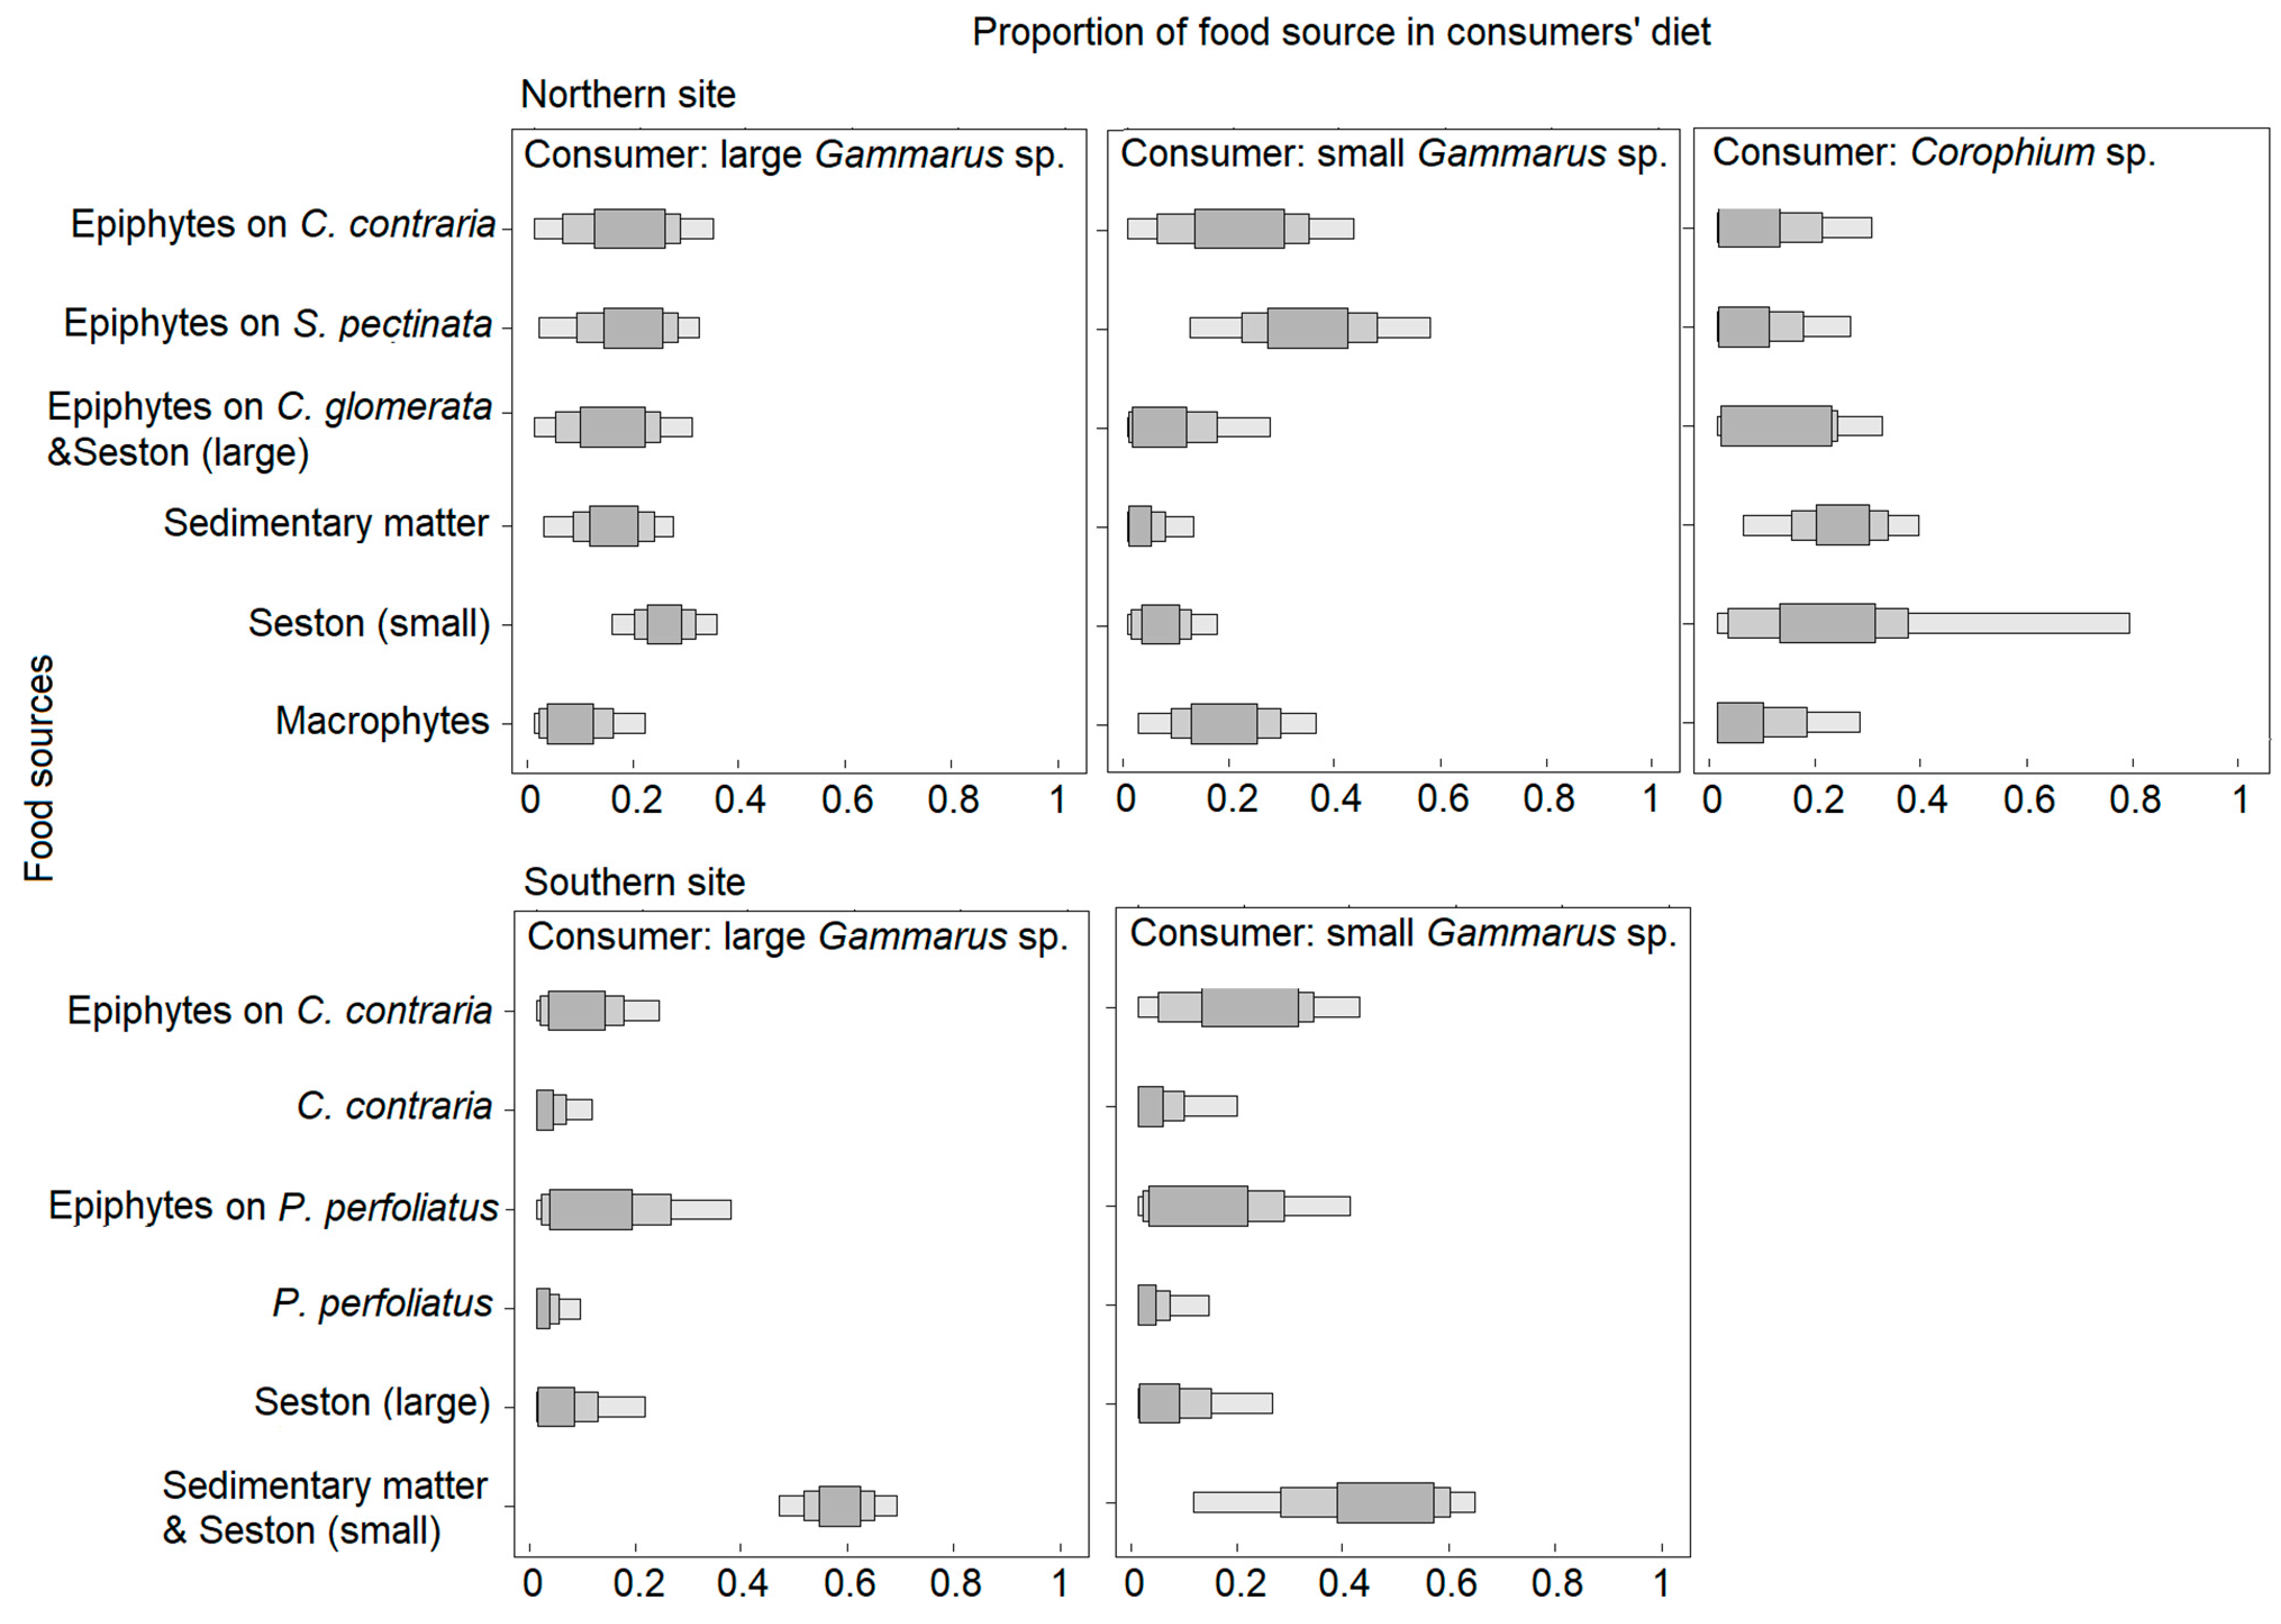
The six-source mixing models provided proportions of potentially consumed food sources for two size classes of Gammarus sp. at the northern and southern sites, and Corophium sp. at the northern sites (Figure 6; Table S2). Large individuals of Gammarus sp. mostly consumed seston (small, <150 µm) (25%) or an aggregated group of sedimentary organic matter and seston (small) (52%) and less other available sources (but not macrophytes). At both sites, small Gammarus sp. consumed epiphytes of charophytes and pondweeds; sedimentary organic matter was also important in the southern site. Macrophytes contributed to the diet in the northern site. The SI values of Corophium sp. were estimated only in the northern site, where they fed on a small fraction of seston (28%) and sedimentary organic matter (23%). The contribution of macrophytes to amphipod diet was negligible in the southern site (on average 7% for the group of C. contraria and P. perfoliatus) and also rather low in the northern site (10% for the group of C. contraria, C. glomerata, and S. pectinata); small Gammarus sp. seem to consume macrophytes in little amounts (10–19% in different sites) (Figure 6).

4. Discussion

This study was based on the analysis of SI values in aquatic organisms and organic matter within charophyte- or P. perfoliatus-dominated and mixed habitats in the northern and southern areas of the Curonian Lagoon. We compared the diet preferences of grazers at macrophyte habitats under different salinity and productivity conditions at the active vegetation growth snapshot. The design of the sampling scheme covers a broad range of organic matter (planktonic, sedimentary) and organisms (from epiphytes, vegetation, mollusks, crustaceans, fishes), and allows us to review the network structure and trophic relationships. Although the isotopic similarity of some food sources and consumers’ ability to feed on a variety of sources complicated the interpretation of mixing the model’s results, here we discuss the SI variability of macrophyte-related food web compartments and the estimated diet of gastropods and amphipods.
The variability of SI values of sedimentary organic matter and seston in selected sampling sites was expected to represent the lagoonal gradient associated with lower δ13C and higher δ15N values in the southern freshwater site than in the northern site where freshwater and marine water mix. However, δ13C in seston changed from −28.3 to −20.0‰ between fractions and sites without expected consistency. At the northern site, δ13C of the larger seston fraction (>150 µm; ~−20.0‰) suggested the influence of marine water from the Baltic Sea, which varies from −23.5 to −18.6‰ [44,45]. At the southern site, δ13C of the same seston fraction varied from −23.1‰ to −21.6‰, which was also indicative of marine water inflow. It is interesting to note that δ13C of the smaller seston fraction (<150 µm) varied from −28.5‰ up to −25.7‰ at both sites, matching values of riverine or lagoonal POM (from −32.3 to −23.4‰ in [9]). Therefore, as the water column compartment is rather variable in this ecosystem and isotopically did not follow a generalized pattern, these data should be used with caution for the trophic network analysis.
Our results revealed that the δ13C of the surface sediment layer was more variable than that of the deeper layer. In this case, seston and the upper layer of sediment were the ones whose compositions tended to change quickly and the different structural composition may induce variation in SI values. Comparing SI values among seston fractions and sediment layers, we found that δ15N differed much less in the southern site than in the northern site, possibly due to irregular marine water inflow. Indeed, variability of SI values within and among seston fractions and sediment layers is affected by particle sizes, chemical characteristics, and origins of supporting sources [46]. Moreover, aquatic vegetation and macrofauna directly affect sedimentary organic matter; thus, SI values of sediment might differ either from freshly settled or already decayed matter [47]. Both study sites were located in the so-called transitional area of the Curonian Lagoon, where, due to the shallower water column and higher light availability, surface sediment can be colonized by an active layer of benthic microalgae, resulting in organic matter of high nutritional quality [48].
At the vegetation period, the SI values of macroalgae, plants, epiphytes, and other samples of aquatic fauna followed the lagoonal gradient, showing lower δ13C and higher δ15N values in the southern site than in the northern site. In the southern site with higher productivity, δ15N values in charophytes were significantly lower than in P. perfoliatus, while in the northern site, which receives marine water inflow, δ15N in C. contraria, C. glomerata, and S. pectinata did not differ. Chappuis et al. [49] proved the large plasticity of aquatic vegetation in isotopic signatures associated with environmental factors rather than taxonomic differences. Accordingly, δ15N in macrophytes vary between environments with different productivity conditions [50]. Therefore, in our case, differences in δ15N among primary producers reflected variation of environmental factors between sampling sites in the different lagoon parts. In this study site, as well as in other locations, the studied dominant macrophytes tended to be more enriched in 13C at sites of higher productivity than in nutrient-poorer sites (e.g., [51]).
In the southern site of the eutrophic Curonian Lagoon, the amounts of epiphytes on the different macrophytes were similar among the different vegetation taxa, but two- to three-fold smaller than in the northern site, where amounts of epiphytes produced highly varied vegetation taxa (Figure 3). The biomass of macro-colonies with filaments of nitrogen-fixing cyanobacteria dominated on C. contraria. The same cyanobacteria were also found on other macrophytes, but to a lesser extent. Cyanobacteria, diatoms, and other bacteria usually prevail in the epiphyte communities [30,52,53] and their biomass responses to nutrient availability and vegetation photosynthetic activity [22,52]; moreover, epiphytic cyanobacteria might attract grazers of certain ciliate taxa [53]. Grazers are known to control the proliferation of epiphytic algae [54] and have the potential to limit macrophyte (charophyte) abundance in severely eutrophic systems, while under moderately eutrophic conditions, they are not likely to control charophyte populations [12].
Considering the SI mixing modeling, larger proportions of sedimentary organic matter and seston dominated the diet of amphipods and gastropods in the southern part, while epiphytes together with sedimentary organic matter were the primary food sources for the studied invertebrates in the northern site. This more intensive consumption of epiphytes by grazers in the northern site might be induced by the higher availability of the epiphytes in the mixed habitat and also by the variable sedimentary organic matter and seston source due to marine water inflow. Previous studies revealed that in summer at the northern site, epipelic (residing at the interface of water and sediments) diatoms together with the benthic cyanobacteria Merismopedia sp. co-dominated the sediment algal assemblages, while at the vicinity of the southern site, epipsammic (attached to sand grains) diatoms were more abundant [48]. According to previous studies, marine water increases visibility in the northern part [29,30] and decreases the eutrophication effect for the aquatic vegetation and epiphytes [55,56]—this improves conditions for epiphyte growth, which are more available for grazers than varying planktonic sources at the northern site (this study). Charophytes can mitigate the harmful effects of ultraviolet radiation in sediment communities through different mechanisms: They may favour the periphytic biofilm and increase sub-superficial carbon and nitrogen amounts by promoting bacteria involved in their cycles [57].
The results of this study showed not only the ultimate diet preferences of consumers at lower trophic levels, but also provided information about the movements and trophic positions of different species among habitats or sites. The SI values in slowly moving mollusks were different even at neighboring habitats of charophytes and P. perfoliatus in the southern site of the lagoon, which proves, as expected, that they feed only in these specific habitats. Bithynia tentaculata feeds by grazing, scraping algae and vegetation, or trapping particles. This capability may give it an advantage in eutrophic environments such as the Curonian Lagoon. This snail feeds mainly on phytoplankton, periphyton, bacteria, and detritus [58,59,60]. In contrast, homogeneous SI values of mobile crustaceans from two close habitats in the southern site indicated their movements among the macrophyte habitats. In the case of gammarids, the trophic level occupied by these organisms may vary significantly within species and their life stage. Berenzina et al. [61] used an SI approach combined with stomach content analysis of the grazers, which suggested that changes in gammarids’ diets may be related to changing from being typically detritivores/planktivorous at juvenile stages to omnivores and carnivores as adults [58,62]. These results are in line with our finding (Figure 6) that small and potentially young individuals feed, by preference, on sedimentary particles and epiphytes, whereas adults and larger organisms have a more diversified diet.
Regarding the distinct SI in highly mobile organisms, we provide evidence that fish forage in preferred locations or certain habitats and associated prey types (as the δ15N values are homogeneous between sites), and might not move between the northern and southern parts of the lagoon (as the δ13C values are different). This makes sense for non-migratory spined loaches and for small individuals of migratory perches that do not perform large movements. Larger individuals of perches as well other fish are migratory or perform seasonal feeding movements to and from the Baltic Sea coastal zone [63,64]. Regarding the trophic positions, sampled fish individuals of 2.5 to 10 cm length were at the higher position of the studied food web due to having the highest δ15N values (Figure 4; Table 1).
Despite having experienced methodological limitations, the study reveals that estimation of network structure and trophic relationships in macroalgae-related habitats using SI analysis broadens understanding and possibilities of evaluating regulations and maintaining ecosystem services in the transitional aquatic ecosystem.

5. Conclusions

Studied organisms reflected the productivity and salinity conditions during an active vegetation period in the Curonian Lagoon, i.e., more depleted δ13C values and enriched δ15N values in the freshwater and productive southern site than in the northern site with marine water inflows. Gastropods and amphipods consumed mainly sedimentary organic matter in the southern site, while they grazed on epiphytes and sedimentary organic matter in the northern site. This study contributes to a better understanding of the functioning and structure of lagoonal systems, reflecting the benthic compartment, which is often overlooked and which, however, may have a relevant influence on the productivity of the whole system.

Supplementary Materials

The following supporting information can be downloaded at: https://www.mdpi.com/article/10.3390/w14101565/s1; Table S1: Contributions of food sources (mean ± SD and CI95, %) to the diet of gastropods, calculated by three sources mixing models. Table S2: Contributions of food sources (mean ± SD and CI95, %) to the diet of amphipods, calculated by six sources mixing models.

Author Contributions

Conceptualization, R.M. and M.B.; methodology, R.M., M.B., M.K., D.V., T.P. and S.V.; investigation, R.M., M.B., M.K., D.V., T.P. and S.V.; writing—original draft preparation, R.M.; writing—review and editing, R.M., M.B., M.K., D.V., T.P., S.V. and G.M.; visualization, R.M. All authors have read and agreed to the published version of the manuscript.

Funding

This research was funded by the Research Council of Lithuania (No S-MIP-19-29).

Institutional Review Board Statement

Regarding the Rules for the use of wild animals, approved by a director of State food and veterinary services and the Minister of the Environment of the Republic of Lithuania (30 June 2011, No. D1-533/B1-310), no permission is needed to take invertebrates for non-commercial science purposes (Paragraph No 50.2). Fishes can be taken from the species’ habitats under recreational fishing and other rules (Paragraph No 50.3). According to the rules for recreational fishing in inland waters, approved by the Minister of Environment of the Republic of Lithuania (4 January 2013, No. D1-14), fishermen are allowed to take up to 30 juveniles of crucian carp, roach, perch, and other species, except predators, per fishery without any special permission (Paragraph No 7). In this study, we sampled only 22 fish individuals. We did not use any species which are listed on the list of protected species of fish and crustaceans (31 March 1999, No. 84 by Minister of Environment), therefore, any approval was not needed for this study.

Informed Consent Statement

Not applicable.

Data Availability Statement

The data presented in this study are available on request from the corresponding author.

Acknowledgments

We thank Vaiva Stragauskaitė and other colleagues from Klaipeda University for their help collecting samples. Adele E. Aleo from University of Palermo helped with isotopic analysis.

Conflicts of Interest

The authors declare no conflict of interest.

References

  1. Gopal, B. Should ‘Wetlands’ Cover All Aquatic Ecosystems and Do Macrophytes Make a Difference to Their Ecosystem Services? Folia Geobot. 2016, 51, 209–226. [Google Scholar] [CrossRef]
  2. Savage, C.; Thrush, S.F.; Lohrer, A.M.; Hewitt, J.E. Ecosystem Services Transcend Boundaries: Estuaries Provide Resource Subsidies and Influence Functional Diversity in Coastal Benthic Communities. PLoS ONE 2012, 7, e42708. [Google Scholar] [CrossRef] [PubMed]
  3. Brown, C.J.; Broadley, A.; Adame, M.F.; Branch, T.A.; Turschwell, M.P.; Connolly, R.M. The Assessment of Fishery Status Depends on Fish Habitats. Fish 2019, 20, 1–14. [Google Scholar] [CrossRef] [Green Version]
  4. Macreadie, P.; Jarvis, J.; Trevathan-Tackett, S.M.; Bellgrove, A. Seagrasses and Macroalgae: Importance, Vulnerability and Impacts Identifying Victorian Coastal Areas with High Ecosystem Rehabilitation Potential View Project The Role of Z. Marina Seed Physiology on Viability and Resilience View Project. In Climate Change Impacts on Fisheries and Aquaculture: A Global Analysis; Delve Publishing: Burlington, ON, Canada, 2017; pp. 729–770. [Google Scholar]
  5. Horn, S.; Coll, M.; Asmus, H.; Dolch, T. Food Web Models Reveal Potential Ecosystem Effects of Seagrass Recovery in the Northern Wadden Sea. Restor. Ecol. 2020, 29, e13328. [Google Scholar] [CrossRef]
  6. Mulderij, G.; Mau, B.; van Donk, E.; Gross, E.M. Allelopathic Activity of Stratiotes Aloides on Phytoplankton—towards Identification of Allelopathic Substances. In Shallow Lakes in a Changing World; Springer: Berlin/Heidelberg, Germany, 2007; pp. 89–100. [Google Scholar] [CrossRef] [Green Version]
  7. Krause-Jensen, D.; Sagert, S.; Schubert, H.; Boström, C. Empirical Relationships Linking Distribution and Abundance of Marine Vegetation to Eutrophication. Ecol. Indic. 2008, 8, 515–529. [Google Scholar] [CrossRef]
  8. Hidding, B.; Bakker, E.S.; Keuper, F.; de Boer, T.; de Vries, P.P.; Nolet, B.A. Differences in Tolerance of Pondweeds and Charophytes to Vertebrate Herbivores in a Shallow Baltic Estuary. Aquat. Bot. 2010, 93, 123–128. [Google Scholar] [CrossRef]
  9. Lesutienė, J. Food Web of the Curonian Lagoon: Organic Matter Sources and Feeding of Mysids. Ph.D. Thesis, Klaipeda University, Klaipeda, Lithuania, 2009. [Google Scholar]
  10. Kahma, T.I.; Karlson, A.M.L.; Sun, X.; Mörth, C.M.; Humborg, C.; Norkko, A.; Rodil, I.F. Macroalgae Fuels Coastal Soft-Sediment Macrofauna: A Triple-Isotope Approach across Spatial Scales. Mar. Environ. Res. 2020, 162, 105163. [Google Scholar] [CrossRef]
  11. Haines, E.B.; Montague, C.L. Food Sources of Estuarine Invertebrates Analyzed Using 13C/12C Ratios. Ecology 1979, 60, 48–56. [Google Scholar] [CrossRef]
  12. Kotta, J.; Torn, K.; Martin, G.; Orav-Kotta, H.; Paalme, T. Seasonal Variation in Invertebrate Grazing on Chara Connivens and C. Tomentosa in Kõiguste Bay, NE Baltic Sea. Helgol. Mar. Res. 2004, 58, 71–76. [Google Scholar] [CrossRef] [Green Version]
  13. Vizzini, S.; Sarà, G.; Michener, R.H.; Mazzola, A. The Role and Contribution of the Seagrass posidonia Oceanica (L.) Delile Organic Matter for Secondary Consumers as Revealed by Carbon and Nitrogen Stable Isotope Analysis. Acta Oecol. 2002, 23, 277–285. [Google Scholar] [CrossRef]
  14. Puche, E.; Rojo, C.; Ramos-Jiliberto, R.; Rodrigo, M.A.; Puche, E.; Rojo, C.; Rodrigo, M.A. Structure and Vulnerability of the Multi-Interaction Network in Macrophyte-Dominated Lakes. OIKOS 2020, 129, 35–48. [Google Scholar] [CrossRef]
  15. Papastergiadou, E.; Kagalou, I.; Stefanidis, K.; Retalis, A.; Leonardos, I. Effects of Anthropogenic Influences on the Trophic State, Land Uses and Aquatic Vegetation in a Shallow Mediterranean Lake: Implications for Restoration. Water Resour. Manag. 2009, 24, 415–435. [Google Scholar] [CrossRef]
  16. Peterson, B.J.; Fry, B. Stable Isotopes in Ecosystem Studies. Ann. Rev. Ecol. Syst. 1987, 18, 293–320. [Google Scholar] [CrossRef]
  17. Post, D.M. Using stable isotopes to estimate trophic position: Models, methods, and assumptions. Ecology 2002, 83, 703–718. [Google Scholar] [CrossRef]
  18. France, R.L. Carbon-13 Enrichment in Benthic Compared to Planktonic Algae: Foodweb Implications. Mar. Ecol. Prog. Ser. 1995, 124, 307–312. [Google Scholar] [CrossRef]
  19. Fry, B.; Sherr, E.B. Δ13C Measurements as Indicators of Carbon Flow in Marine and Freshwater Ecosystems. In Stable Isotopes in Ecological Research; Springer: New York, NY, USA, 1989; pp. 196–229. [Google Scholar] [CrossRef]
  20. Gasiūnaitė, Z.R.; Daunys, D.; Olenin, S.; Razinkovas, A. The Curonian Lagoon. In Ecology of Baltic Coastal Waters; Springer: Berlin/Heidelberg, Germany, 2008; pp. 197–215. [Google Scholar] [CrossRef]
  21. Razinkovas-Baziukas, A.; Barisevičiūtė, R.; Baziukė, D.; Pilkaitytė, R.; Ruginis, T. The Distribution of Carbon Stable Isotopes as an Indicator of Temporal and Spatial Dynamic and Distribution of Autochtonic and Allochtonic Organic Matter in a Shallow Estuarine Lagoon. Comput. Sci. Tech. 2015, 3, 413–432. [Google Scholar] [CrossRef] [Green Version]
  22. Nelson, W.G. Development of an Epiphyte Indicator of Nutrient Enrichment: A Critical Evaluation of Observational and Experimental Studies. Ecol. Indic. 2017, 79, 207–227. [Google Scholar] [CrossRef] [PubMed]
  23. Politi, T.; Zilius, M.; Bartoli, M.; Bučas, M. Amphipods’ Grazing and Excretion Loop Facilitates Chara Contraria Persistence in a Eutrophic Lagoon. Aquat. Bot. 2021, 171, 103378. [Google Scholar] [CrossRef]
  24. Orth, R.J.; van Montfrans, J. Epiphyte-Seagrass Relationships with an Emphasis on the Role of Micrograzing: A Review. Aquat. Bot. 1984, 18, 43–69. [Google Scholar] [CrossRef]
  25. Vybernaite-Lubiene, I.; Zilius, M.; Saltyte-Vaisiauske, L.; Bartoli, M. Recent Trends (2012–2016) of N, Si, and P Export from the Nemunas River Watershed: Loads, Unbalanced Stoichiometry, and Threats for Downstream Aquatic Ecosystems. Water 2018, 10, 1178. [Google Scholar] [CrossRef] [Green Version]
  26. Mežine, J.; Ferrarin, C.; Vaičiute, D.; Idzelyte, R.; Zemlys, P.; Umgiesser, G. Sediment Transport Mechanisms in a Lagoon with High River Discharge and Sediment Loading. Water 2019, 11, 1970. [Google Scholar] [CrossRef] [Green Version]
  27. Voss, M.; Asmala, E.; Bartl, I.; Carstensen, J.; Conley, D.J.; Dippner, J.W.; Humborg, C.; Lukkari, K.; Petkuviene, J.; Reader, H.; et al. Origin and Fate of Dissolved Organic Matter in Four Shallow Baltic Sea Estuaries. Biogeochemistry 2021, 154, 385–403. [Google Scholar] [CrossRef]
  28. Morkune, R.; Petkuviene, J.; Bružas, M.; Morkunas, J.; Bartoli, M. Monthly Abundance Patterns and the Potential Role of Waterbirds as Phosphorus Sources to a Hypertrophic Baltic Lagoon. Water 2020, 12, 1392. [Google Scholar] [CrossRef]
  29. Zemlys, P.; Ferrarin, C.; Umgiesser, G.; Gulbinskas, S.; Bellafiore, D. Investigation of Saline Water Intrusions into the Curonian Lagoon (Lithuania) and Two-Layer Flow in the Klaipeda Strait Using Finite Element Hydrodynamic Model. Ocean Sci. 2013, 9, 573–584. [Google Scholar] [CrossRef] [Green Version]
  30. Kataržytė, M.; Vaičiūtė, D.; Bučas, M.; Gyraitė, G.; Petkuvienė, J. Microorganisms Associated with Charophytes under Different Salinity Conditions. Oceanologia 2017, 59, 177–186. [Google Scholar] [CrossRef] [Green Version]
  31. He, D.; Ren, L.; Wu, Q. Epiphytic Bacterial Communities on Two Common Submerged Macrophytes in Taihu Lake: Diversity and Host-Specificity. Chin. J. Oceanol. Limnol. 2012, 30, 237–247. [Google Scholar] [CrossRef]
  32. Marcelina, Z.; Adam, S.; Pierre, R. Spatial and Temporal Variability of Organic Matter Sources and Food Web Structure across Benthic Habitats in a Low Diversity System (Southern Baltic Sea). J. Sea Res. 2018, 141, 47–60. [Google Scholar] [CrossRef]
  33. Pidgeon, B.; Buckle, D.; Humphrey, C.; Boyden, J.; Luxon, R. Monitoring of Impacts of Ranger Uranium Mine on Fish Communities in Shallow Lowland Billabongs in 2002. 2003. Available online: https://www.awe.gov.au/sites/default/files/documents/ir443.pdf (accessed on 1 February 2022).
  34. Signa, G.; Mazzola, A.; Kairo, J.; Vizzini, S. Small-Scale Variability in Geomorphological Settings Influences Mangrove-Derived Organic Matter Export in a Tropical Bay. Biogeosciences 2017, 14, 617–629. [Google Scholar] [CrossRef] [Green Version]
  35. Beaudoin, C.P.; Prepas, E.E.; Tonn, W.M.; Wassenaar, L.I.; Kotak, B.G. A Stable Carbon and Nitrogen Isotope Study of Lake Food Webs in Canada’s Boreal Plain. Freshw. Biol. 2001, 46, 465–477. [Google Scholar] [CrossRef]
  36. R Core Development Team. R: A Language and Environment for Statistical Computing. 2013. Available online: http://www.R-project.org/ (accessed on 5 February 2021).
  37. Elith, J.; Leathwick, J.R.; Hastie, T. A working guide to boosted regression trees. J. Anim. Ecol. 2008, 77, 802–813. [Google Scholar] [CrossRef]
  38. Hijmans, R.J.; Phillips, S.; Leathwick, J.; Elith, J. Dismo: Species Distribution Modeling. R Package Version 1.3-5. 2021. Available online: https://cran.r-project.org/package=dismo (accessed on 1 February 2022).
  39. Parnell, A.C.; Inger, R.; Bearhop, S.; Jackson, A.L. Source Partitioning Using Stable Isotopes: Coping with Too Much Variation. PLoS ONE 2010, 5, e9672. [Google Scholar] [CrossRef] [PubMed]
  40. DeNiro, M.J.; Epstein, S. Influence of Diet on the Distribution of Carbon Isotopes in Animals. Geochim. Cosmochim. Acta 1978, 42, 495–506. [Google Scholar] [CrossRef]
  41. Fry, B. Stable Isotope Ecology; Springer: New York, NY, USA, 2006. [Google Scholar]
  42. Olenin, S. Benthic Zonation of the Eastern Gotland Basin, Baltic Sea. Neth. J. Aquat. Ecol. 1997, 30, 265–282. [Google Scholar] [CrossRef]
  43. Froese, R.; Pauly, D. (Eds.) FishBase 2000: Concepts Designs and Data Sources—Google Knygos; ICLARM: Los Banos, Laguna, 2000. [Google Scholar]
  44. Rolff, C.; Elmgren, R. Use of Riverine Organic Matter in Plankton Food Webs of the Baltic Sea. Mar. Ecol. Prog. Ser. 2000, 197, 81–101. [Google Scholar] [CrossRef]
  45. Morkune, R. Food Web of the Lithuanian Baltic Sea Coastal Zone: Structure and Organic Matter Flows. Ph.D. Thesis, Klaipeda University, Klaipėda, Lithuania, 2017. [Google Scholar]
  46. Megens, L.; van der Plicht, J.; de Leeuw, J.W.; Smedes, F. Stable Carbon and Radiocarbon Isotope Compositions of Particle Size Fractions to Determine Origins of Sedimentary Organic Matter in an Estuary. Org. Geochem. 2002, 33, 945–952. [Google Scholar] [CrossRef] [Green Version]
  47. Haines, E.B. The Origins of Detritus in Georgia Salt Marsh Estuaries. Oikos 1977, 29, 254. [Google Scholar] [CrossRef]
  48. Bartoli, M.; Nizzoli, D.; Zilius, M.; Bresciani, M.; Pusceddu, A.; Bianchelli, S.; Sundbäck, K.; Razinkovas-Baziukas, A.; Viaroli, P. Denitrification, Nitrogen Uptake, and Organic Matter Quality Undergo Different Seasonality in Sandy and Muddy Sediments of a Turbid Estuary. Front. Microbiol. 2021, 11, 3524. [Google Scholar] [CrossRef]
  49. Chappuis, E.; Seriñá, V.; Martí, E.; Ballesteros, E.; Gacia, E. Decrypting Stable-Isotope (Δ13C and Δ15N) Variability in Aquatic Plants. Freshw. Biol. 2017, 62, 1807–1818. [Google Scholar] [CrossRef] [Green Version]
  50. Sebastian-Gonzalez, E.; Navarro, J.; Sánchez-Zapata, J.A.; Botella, F.; Delgado Huertas, A. Water Quality and Avian Inputs as Sources of Isotopic Variability in Aquatic Macrophytes and Macroinvertebrates. J. Limnol. 2011, 71, 191–199. [Google Scholar] [CrossRef] [Green Version]
  51. Matuszak, A.; Voigt, C.C.; Storch, I.; Bauer, H.G.; Quillfeldt, P. Depth-Specific and Spatiotemporal Variation of Δ13C and Δ15N in Charophytes of Lake Constance: Implications for Food Web Studies. Rapid Commun. Mass Spectrom. 2011, 25, 2089–2094. [Google Scholar] [CrossRef]
  52. Karosiene, J.; Paskauskas, R. Spatial Variability of Epiphyton Communities Structure in a Temperate Estuarine Lagoon. Estuar. Coast. Shelf. Sci. 2012, 114, 100–104. [Google Scholar] [CrossRef]
  53. Bengtsson, M.M.; Bühler, A.; Brauer, A.; Dahlke, S.; Schubert, H.; Blindow, I. Eelgrass Leaf Surface Microbiomes Are Locally Variable and Highly Correlated with Epibiotic Eukaryotes. Front. Microbiol. 2017, 8, 1312. [Google Scholar] [CrossRef] [PubMed] [Green Version]
  54. Whalen, M.A.; Duffy, J.E.; Grace, J.B. Temporal Shifts in Top-down vs. Bottom-up Control of Epiphytic Algae in a Seagrass Ecosystem. Ecology 2013, 94, 510–520. [Google Scholar] [CrossRef] [PubMed]
  55. Ardón, M.; Morse, J.L.; Colman, B.P.; Bernhardt, E.S. Drought-Induced Saltwater Incursion Leads to Increased Wetland Nitrogen Export. Glob. Chang. Biol. 2013, 19, 2976–2985. [Google Scholar] [CrossRef] [PubMed]
  56. Williams, A.A.; Lauer, N.T.; Hackney, C.T. Soil Phosphorus Dynamics and Saltwater Intrusion in a Florida Estuary. Wetlands 2014, 34, 535–544. [Google Scholar] [CrossRef]
  57. Puche, E.; Rojo, C.; Segura, M.; Rodrigo, M.A. Macrophyte Meadows Mediate the Response of the Sediment Microbial Community to Ultraviolet Radiation. Hydrobiologia 2021, 848, 4569–4583. [Google Scholar] [CrossRef]
  58. Brendelberger, H.; Jurgens, S. Suspension feeding in Bithynia tentaculata (Prosobranchia, Bithyniidae), as affected by body size, food and temperature. Oecologia 1993, 94, 36–42. [Google Scholar] [CrossRef]
  59. Zettler Michael, L.; Darius, D. Long-term macrozoobenthos changes in a shallow boreal lagoon: Comparison of a recent biodiversity inventory with historical data. Limnologica 2007, 37, 170–185. [Google Scholar] [CrossRef] [Green Version]
  60. Trebitz, A.; Shepard, G.; Brady, V.; Schmude, K. The non-native faucet snail (Bithynia tentaculata) makes the leap to Lake Superior. J. Great Lakes Res. 2015, 41, 1197–1200. [Google Scholar] [CrossRef]
  61. Berezina, N.A.; Maximov, A.A. Abundance and food preferences of amphipods (Crustacea: Amphipoda) in the Eastern Gulf of Finland, Baltic Sea. Journal of Siberian Federal University. Biology 2016, 9, 409. [Google Scholar]
  62. Berthold, M.; Porsche, C.; Hofmann, A.; Nowak, P. Combined effects of salinity and temperature on grazing activity of invasive Gammarus tigrinus on charophytes. Repr. Serv. Biol. 2021, 1–44. [Google Scholar] [CrossRef]
  63. Repečka, R. The Species Composition of the Ichthyofauna in the Lithuanian Economic Zone of the Baltic Sea and the Curonian Lagoon and Its Changes in Recent Years. Acta Zool. Litu. 2012, 13, 149–157. [Google Scholar] [CrossRef]
  64. Ložys, L. The Growth of Pikeperch (Sander lucioperca L.) and Perch (Perca fluviatilis L.) under Different Water Temperature and Salinity Conditions in the Curonian Lagoon and Lithuanian Coastal Waters of the Baltic Sea. In Proceedings of the Biology of the Baltic Sea; Springer: Dordrecht, The Netherlands, 2004; pp. 105–113. [Google Scholar]
Figure 1. Location of study sites in the Curonian Lagoon at the southeastern Baltic Sea. Dashed lines mark isolines, numbers (1–5) represent annual salinity.
Water 14 01565 g001
Figure 2. δ13C and δ15N values (‰, mean ± SD) at the two sampling sites in the Curonian Lagoon. The values of the southern site are the average of two habitats.
Water 14 01565 g002
Figure 3. Comparison of δ13C (left) and δ15N (right) values (‰, mean ± SD) between sites and habitats. Values are sorted by increasing order based on the results of the northern site.
Water 14 01565 g003
Figure 4. Biomass (g/g macrophyte, mean ± SD) of epiphytes on different macrophyte species in the northern and southern sites of the Curonian Lagoon.
Water 14 01565 g004
Figure 5. Proportions of different food sources in gastropod diet at the different sites (probabilities of 95%, 75%, 50%). Note that sources are different for the sites and habitats.
Water 14 01565 g005
Figure 6. Proportions of different food sources to amphipod diet at the northern and southern sites (probabilities of 95%, 75%, 50%). Note that sources are different in the two sites.
Water 14 01565 g006
Table 1. List of sampled organisms, their feeding strategies, sample size (n), stable carbon (δ13C), and nitrogen (δ15N) isotope ratios, and estimated trophic levels (TL) by sampling site and habitat. Feeding strategy (according to [42,43]): Herbiv.—herbivores; Mix—diverse organisms with various feeding habits (from bacteria, fungi, producents to zooplankton feeders); Nect.—nekton feeders; Omniv.—omnivores; Pred.—predators; Prod.—primary producers; Subs. dep.—subsurface deposit feeders; Susp. filt.—suspension filter feeders; Zoobenth.—zoobenthos feeders; Zooplank.—zooplankton feeders.
Taxon/GroupFeeding StrategyNorthern SiteSouthern Site
Mixed Habitat of Chara contraria, Cladophora glomerata and Stuckenia pectinataSeparate Habitats of Chara contraria/Potamogeton perfoliatus/not Assigned to Any Habitat
nδ13C, ‰δ15N, ‰, TLnδ13C, ‰δ15N, ‰,TL
Algae
Chara contrariaProd.3−13.82 ± 0.492.39 ± 0.99 3/-/-−18.28 ± 0.195.62 ± 0.22
Cladophora glomerataProd.2−14.96 ± 1.653.37 ± 0.16 0
Plants
Potamogeton perfoliatusProd.0 -/3/-−17.32 ± 0.467.65 ± 0.34
Stuckenia pectinataProd.3−13.32 ± 0.553.37 ± 0.66 0
Epiphytes
Epiphytes on C. contrariaProd.3−18.65 ± 0.272.88 ± 0.14 3/-/-−21.57 ± 0.282.35 ± 0.11
Epiphytes on C. glomerataProd.2−19.09 ± 0.384.49 ± 0.06 0
Epiphytes on P. perfoliatusProd.0 -/3/-−23.35 ± 0.225.51 ± 0.02
Epiphytes on S. pectinataProd.2−18.30 ± 0.010.64 ± 0.16 0
Seston fractions
Seston < 150 µmMix3−28.28 ± 0.073.22 ± 0.35 3/3/-−28.24 ± 0.33/−26.44 ± 0.736.27 ± 0.03/6.42 ± 0.35
Seston > 150 µmMix2−19.96 ± 0.106.08 ± 0.05 2/3/-−21.98 ± 0.52/−22.75 ± 0.537.46 ± 0.45/7.64 ± 0.33
Sediment layers
0.5–2 cmMix3−24.8 ± 0.278.57 ± 0.32 6/6/-−26.32 ± 1.59/−27.21 ± 0.277.76 ± 0.23/7.41 ± 0.45
0–0.5 cmMix3−25.25 ± 1.698.01 ± 0.48 6/6/-−25.8 ± 2.96/−26.98 ± 0.407.86 ± 0.37/7.58 ± 0.67
Mollusca
Bithynia tentaculataSurf. dep.3−20.21 ± 0.038.75 ± 0.132.33/4/-−25.42 ± 0.37/−24.61 ± 0.268.04 ± 0.18/7.89 ± 0.142.0
Dreissena polymorphaSusp. filt.0 3/-/-−28.79 ± 0.088.48 ± 0.112.1
Lymnaea auriculariaSurf. dep.0 3/2/-−28.23 ± 0.25/−24.47 ± 0.0910.97 ± 0.52/8.16 ± 0.222.5
Lymnaea stagnalisSurf. dep.0 2/3/-−26.88 ± 1.09/−24.16 ± 0.078.82 ± 1.43/7.29 ± 0.311.9
Radix balthicaSurf. dep.3−18.21 ± 0.196.99 ± 0.261.73/4/-−24.95 ± 0.17/−23.83 ± 0.218.08 ± 0.06/8.29 ± 0.622.0
Worms
ChironomidsSubs. dep.3−23.25 ± 0.157.9 ± 0.282.03/5/-−27.68 ± 0.33/−23.56 ± 0.519.1 ± 0.14/7.85 ± 1.002.1
Crustaceans
Corophium sp.Susp. filt., Surf. dep.3−25.57 ± 0.117.9 ± 0.242.00
Gammarus sp. (large)Omniv.4 −20.8 ± 0.017.17 ± 0.071.83/3/-−24.2 ± 0.08/−23.59 ± 0.6110.2 ± 0.12/8.39 ± 0.972.4
Gammarus sp. (small)Omniv.4−18.0 ± 0.215.75 ± 0.421.42/3/-−24.04 ± 0.01/−24.14 ± 0.119.47 ± 0.62/7.48 ± 0.642.1
MysidaeSusp. filt., Surf. dep., Omniv.3−20.25 ± 0.409.03 ± 0.092.33/3/-−27.62 ± 0.25/−25.73 ± 0.0511.57 ± 0.23/10.9 ± 0.082.9
Fish
Nine-spined stickleback (Pungitius pungitius)Zoobenth., Zooplank.4−20.22 ± 0.2910.98 ± 0.082.9 0
European perch (Perca fluviatilis)Zoobenth., Nect., Pred.3−22.65 ± 1.0111.83 ± 0.843.2-/2/1/−27.95 ± 0.05/−26.63/13.56 ± 0.80/12.533.5
Roach (Rutilus rutilus)Herbiv., Zoobenth., Zooplank.4−21.61 ± 0.349.51 ± 0.322.50
Round goby (Neogobius melanostomus)Zoobenth.4−21.59 ± 0.4411.56 ± 0.153.10
Spined loach (Cobitis taenia)Zoobenth., Zooplank., Herb.3−24.18 ± 0.2313 ± 0.093.51/2/-−26.65/−27.13 ± 0.4013.48/12.60 ± 0.293.4
Three-spined stickleback (Gasterosteus aculeatus)Zoobenth., Zooplank.4−21.05 ± 1.319.95 ± 0.932.60
Table 2. Differences in δ13C and δ15N of selected consumers between the northern (N) and southern (S) sampling sites in the Curonian Lagoon. * = p < 0.05, ** = p < 0.01, *** = p < 0.001; ns = non-significant.
Consumer Taxaδ13Cδ15N
t-TestpSite Comparisont-TestpSite Comparison
Fish
Cobitis taeniat = 10.50, df = 3.23***N > St = 0.32, df = 2.08nsN = S
Perca fluviatilist = 6.66, df = 3.73**N > St = −2.03, df = 3.99nsN = S
Mollusca
Bithynia tentaculatat = 24.15, df = 6.09***N > St = 8.09, df = 4.78***N > S
Radix balthicat = 23.43, df = 7.77***N > St = −5.31, df = 6.88**N < S
Crustaceans
Gammarus sp. (small)U-test*N > St = −4.33, df = 5.10**N < S
Gammarus sp. (large)U-test**N > SU-test, W = 24**N < S
MysidsU-test*N > SU-test, W = 18*N < S
Publisher’s Note: MDPI stays neutral with regard to jurisdictional claims in published maps and institutional affiliations.